Exploring Exploration Orientation and its Determinants: Some Empirical Evidence*
Upload
khangminh22Category
view
3download
0
Tourism & Management Studies
ISSN: 2182-8458
Universidade do Algarve
Portugal
Stoilova, Desislava; Patonov, Nikolay
AN EMPIRICAL EVIDENCE FOR THE IMPACT OF TAXATION ON ECONOMY
GROWTH IN THE EUROPEAN UNION
Tourism & Management Studies, vol. 3, 2013, pp. 1031-1039
Universidade do Algarve
Faro, Portugal
Available in: http://www.redalyc.org/articulo.oa?id=388743876026
How to cite
Complete issue
More information about this article
Journal's homepage in redalyc.org
Scientific Information System
Network of Scientific Journals from Latin America, the Caribbean, Spain and Portugal
Non-profit academic project, developed under the open access initiative
Book of Proceedings – Tourism and Management Studies International Conference Algarve 2012 vol.3 ISBN 978-989-8472-25-0 © ESGHT-University of the Algarve, Portugal
AN EMPIRICAL EVIDENCE FOR THE IMPACT OF TAXATION ON ECONOMY
GROWTH IN THE EUROPEAN UNION
Desislava Stoilova
Faculty of Economics, South-West University-Bulgaria
Nikolay Patonov
Faculty of Economics, South-West University-Bulgaria
ABSTRACT
The paper is intended to study the basic trends in the distribution of the total tax burden in the EU (27)
member states during the period 1995-2010. The comparative analysis is focused on the cross-country
differences in terms of total tax burden, measured by the tax-to-GDP ratio and design of tax structure,
presented by the breakdown of the total tax revenues into standard components such as direct taxes,
indirect taxes and social contributions. Special emphasis is placed upon the impact of taxation on the
economic growth. The relationship is investigated by the means of the regression analysis. The
conclusion is that tax structure based on direct taxes is more efficient in terms of supporting the
economic growth in the EU countries.
KEYWORDS
Taxation, Economy growth, European Union
1. INTRODUCTION
Contemporary tax policies pursue many policy objectives. Taxation is intended to raise the necessary
funds for public expenditure, to redistribute income, to stabilize the economy, to overcome externalities,
to influence the allocation of resources, while at the same time should be supportive to the economic
growth. The purpose of the efficiently designed taxation is to achieve desired fiscal policy objectives
(allocation, redistribution, and stabilization) in the most efficient way, namely by limiting undesired
distortions, minimizing the cost of tax collection and promoting economic growth. The efficiency of
taxation and particularly the tax structure plays important role in achieving economic growth and fiscal
consolidation.
According to the economic theory taxation (except for the lump sum taxes) creates distortions and
in turn impact negatively on economic growth. Considering a simple production function it is
obvious that taxation can affect growth through its impact on (1) physical capital, (2) human capital
and (3) through its effect on the total factor productivity. According to some researches corporate
and personal income taxes are the most detrimental to growth, while consumption, environment
and property taxes are less harmful (OECD, 2008).
Having in mind these observations this paper is intended to study the basic trends in the
distribution of the total tax burden in the EU (27) member states during the period 1995-2010 and
its impact on the economy growth. The paper is structured in five sections. Section two presents
the literature review. Section three provides a comparative analysis, focused on the cross-country
differences in terms of total tax burden, measured by the tax-to-GDP ratio and design of tax
D. Stoilova & N. Patonov
1032
structure, presented by the breakdown of the total tax revenues into standard components such as
direct taxes, indirect taxes and social contributions. Section four investigates the impact of taxation
on the economy growth. The adopted methodology is regression analysis. Section five concludes.
2. LITERATURE REVIEW
A good approach for literature analysis of the empirical studies on the relationship between taxation
and economy growth is applied by Jens Arnold (2008). He uses the review done by Myles (2006),
but focuses on the most important analyses. The literature sources are differentiated in evidence on
the tax level and growth and evidence on tax structure and growth. Arnold notes that the findings
of the studies, analyzing the link between growth and tax structures provide somewhat more
conclusive answers than the studies focused on the level of taxation. The results from the empirical
analyses of Kneller et al. (1999), Gemell et al. (2006), Widmalm (2001), Schwellnus and Arnold
(2008), Vartia (2008), Lee and Gordon (2005) are considered as sufficiently reliable evidence for the
nature of the studied relationship. The collective of Kneller et al. (1999) contribute to empirical
analysis on this topic by identifying a depressing effect of ‘distortionary taxes’, which include taxes
on income and property. They also find that productive government expenditure stimulate
economy growth. In the comments of Arnold (2008) is emphasized that the results from the
analysis of Gemell et al. (2006) confirm the findings of Kneller et al. (1999).
Experience of the OECD countries is analyzed by Widmalm (2001), Schwellnus and Arnold (2008)
and Vartia (2008). Widmalm (2001) estimates a negative relationship between budget revenue
accumulated by income taxes and economic activity growth. According to her conclusions, the
predictions of conventional wisdom for negative effect of indirect taxes on economy are not
confirmed. The empirical results from analyses of Schwellnus and Arnold (2008) and Vartia (2008)
indicate a negative effect of corporate taxes on the productivity of firms and industries, based on
large data sets of firms and industries across OECD countries. The significant negative correlation
between statutory corporate tax rates and growth for 70 countries during 1970-1997, found by Lee
and Gordon (2005), is noted as a similar result.
Romer Ch. D and D. H. Romer (2007) review other papers presenting evidence for various aspects
of the relationship between taxation and economy growth. There are different kinds of econometric
approaches applied. Some of studies link the GDP growth rate and public spending and receipts
(Andersen and Jordan, 1968). The studies of Blanchard and Perotti (2002) and Perotti (1999) are
considered as more sophisticated, because these researches assume that once one corrects for the
impact of economic activity on revenues and controls for the behavior of government spending,
changes in revenues are uncorrelated with other determinants of output growth. A different
approach is applied in studies, which are reviewed by Gale and Orszag (2004) and investigate the
impact of tax changes on consumption. Such types of studies are made by Roger Kormendi (1983)
and Emanuela Cardia (1997). The estimated impact of tax increases on consumption in these
studies ranges from roughly no effect to a substantial negative effect.
3. TAXATION TRENDS IN THE EU MEMBER STATES (1995 - 2010)
The revenues from taxes and social security contributions account for over 91% of total general
government revenue in the European Union. During the last three years total tax burden in the EU
has declined, due to the worldwide economic and financial crisis. The drop was most marked
between 2008 and 2009. In 2010 total tax revenues in terms of GDP reached its lowest point in the
Book of Proceedings – TMS Algarve 2012 vol. 3
1033
period from 1995 onwards. According to the Eurostat database in 2010 tax revenue stayed at 39.6
% of GDP in the European Union (27) and 40.2 % of GDP in the euro area (17).
There are many reasons for the significant variations in the total revenue from taxes and social
contributions during the analyzed period. Moreover, the causes of these fluctuations in each
particular country are different. In general, amongst the basic preconditions are changes in the
economic activity, affecting the employment levels and sales of goods and services, changes in the
tax legislation, affecting the tax anatomy, as well as changes in the level of GDP.
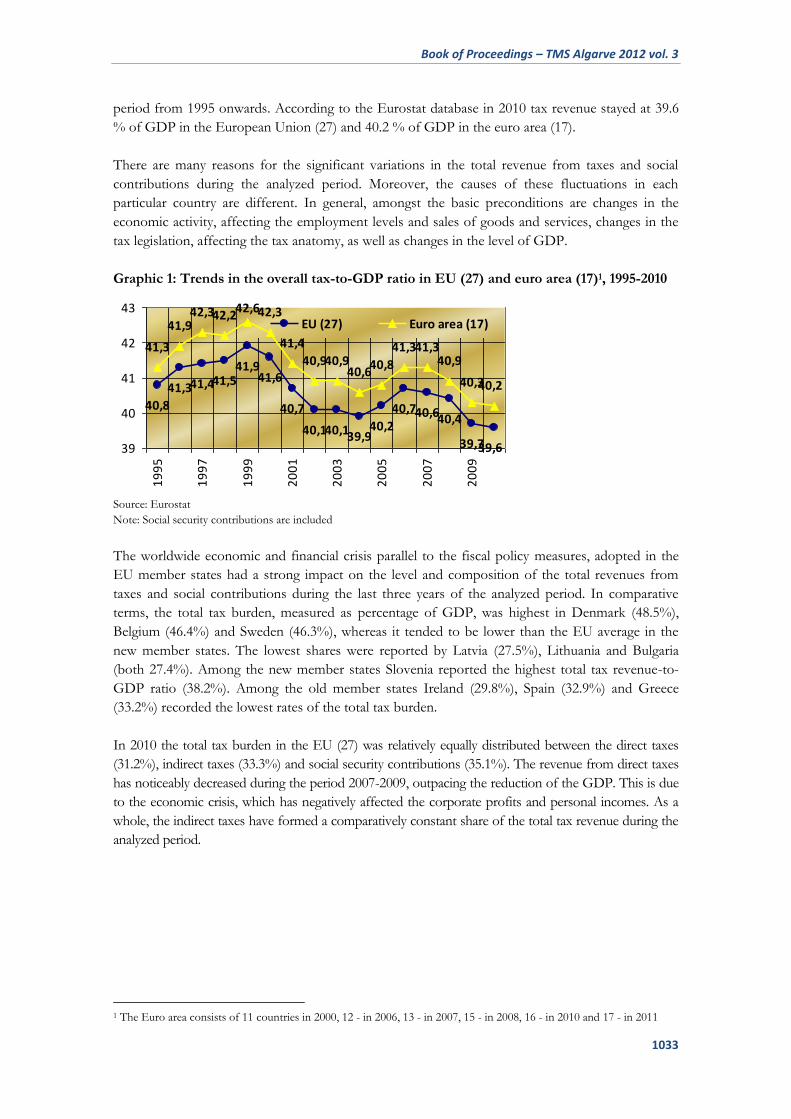
Graphic 1: Trends in the overall tax-to-GDP ratio in EU (27) and euro area (17)1, 1995-2010
40,8
41,341,441,541,9
41,6
40,7
40,140,139,940,2
40,740,640,4
39,739,6
41,3
41,942,342,2
42,642,3
41,4
40,940,940,6
40,8
41,341,340,9
40,340,2
39
40
41
42
43
19
95
19
97
19
99
20
01
20
03
20
05
20
07
20
09
EU (27) Euro area (17)
Source: Eurostat
Note: Social security contributions are included
The worldwide economic and financial crisis parallel to the fiscal policy measures, adopted in the
EU member states had a strong impact on the level and composition of the total revenues from
taxes and social contributions during the last three years of the analyzed period. In comparative
terms, the total tax burden, measured as percentage of GDP, was highest in Denmark (48.5%),
Belgium (46.4%) and Sweden (46.3%), whereas it tended to be lower than the EU average in the
new member states. The lowest shares were reported by Latvia (27.5%), Lithuania and Bulgaria
(both 27.4%). Among the new member states Slovenia reported the highest total tax revenue-to-
GDP ratio (38.2%). Among the old member states Ireland (29.8%), Spain (32.9%) and Greece
(33.2%) recorded the lowest rates of the total tax burden.
In 2010 the total tax burden in the EU (27) was relatively equally distributed between the direct taxes
(31.2%), indirect taxes (33.3%) and social security contributions (35.1%). The revenue from direct taxes
has noticeably decreased during the period 2007-2009, outpacing the reduction of the GDP. This is due
to the economic crisis, which has negatively affected the corporate profits and personal incomes. As a
whole, the indirect taxes have formed a comparatively constant share of the total tax revenue during the
analyzed period.
1 The Euro area consists of 11 countries in 2000, 12 - in 2006, 13 - in 2007, 15 - in 2008, 16 - in 2010 and 17 - in 2011
D. Stoilova & N. Patonov
1034
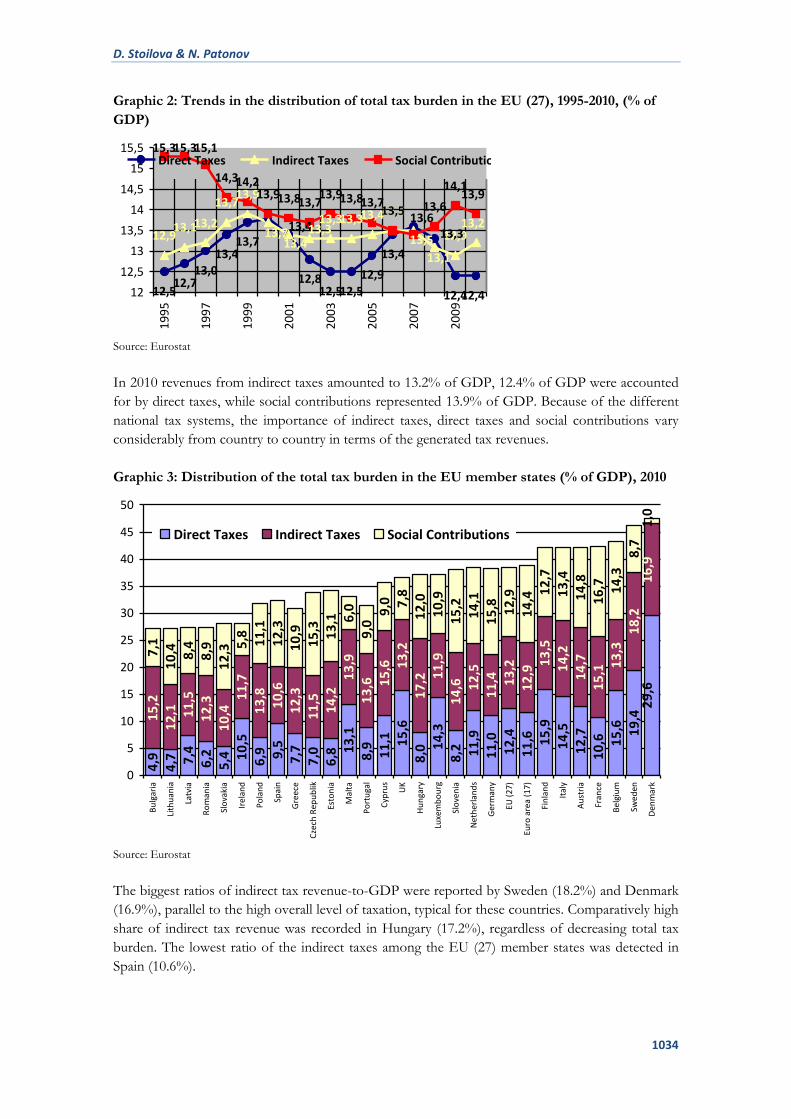
Graphic 2: Trends in the distribution of total tax burden in the EU (27), 1995-2010, (% of
GDP)
12,512,7
13,013,4
13,7
12,812,512,5
12,9
13,4
12,412,4
12,913,113,2
13,713,9
13,313,313,413,5
12,913,2
15,315,315,1
14,314,213,913,813,7
13,913,813,713,5 13,6
14,113,9
13,313,6
13,4
13,1
13,513,3
13,413,7
12
12,5
13
13,5
14
14,5
15
15,51
99
5
19
97
19
99
20
01
20
03
20
05
20
07
20
09
Direct Taxes Indirect Taxes Social Contributions
Source: Eurostat
In 2010 revenues from indirect taxes amounted to 13.2% of GDP, 12.4% of GDP were accounted
for by direct taxes, while social contributions represented 13.9% of GDP. Because of the different
national tax systems, the importance of indirect taxes, direct taxes and social contributions vary
considerably from country to country in terms of the generated tax revenues.
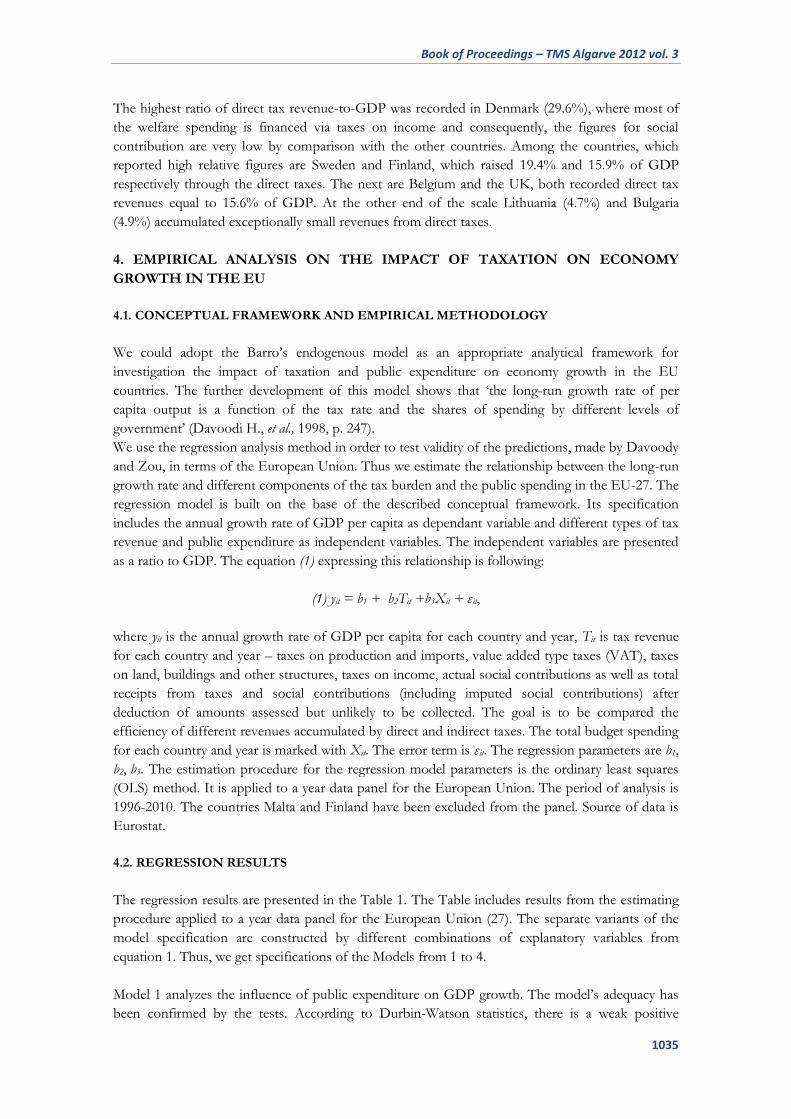
Graphic 3: Distribution of the total tax burden in the EU member states (% of GDP), 2010
4,9
4,7 7
,46
,25
,4 10
,56
,9 9,5
7,7
7,0
6,8 1
3,1
8,9 11
,1 15
,68
,0 14
,38
,2 11
,91
1,0
12
,41
1,6 15
,91
4,5
12
,71
0,6 15
,6 19
,42
9,6
15
,21
2,1 11
,51
2,3
10
,41
1,7
13
,81
0,6
12
,31
1,5
14
,21
3,9
13
,6 15
,6 13
,21
7,2 1
1,9
14
,6 12
,51
1,4 13
,21
2,9
13
,51
4,2
14
,71
5,1 1
3,3
18
,21
6,9
7,1
10
,4 8,4
8,9
12
,3 5,8 11
,11
2,3
10
,91
5,3 13
,1 6,0
9,0
9,0 7
,81
2,0
10
,91
5,2
14
,11
5,8 12
,91
4,4 1
2,7
13
,41
4,8
16
,7 14
,38
,71
,0
0
5
10
15
20
25
30
35
40
45
50
Bu
lgar
ia
Lith
uan
ia
Latv
ia
Ro
man
ia
Slo
vaki
a
Irel
and
Po
lan
d
Spai
n
Gre
ece
Cze
ch R
epu
blik
Esto
nia
Mal
ta
Po
rtu
gal
Cyp
rus
UK
Hu
nga
ry
Luxe
mb
ou
rg
Slo
ven
ia
Net
her
lan
ds
Ger
man
y
EU (
27)
Euro
are
a (1
7)
Fin
lan
d
Ital
y
Au
stri
a
Fran
ce
Bel
giu
m
Swed
en
Den
mar
k
Direct Taxes Indirect Taxes Social Contributions
Source: Eurostat
The biggest ratios of indirect tax revenue-to-GDP were reported by Sweden (18.2%) and Denmark
(16.9%), parallel to the high overall level of taxation, typical for these countries. Comparatively high
share of indirect tax revenue was recorded in Hungary (17.2%), regardless of decreasing total tax
burden. The lowest ratio of the indirect taxes among the EU (27) member states was detected in
Spain (10.6%).
Book of Proceedings – TMS Algarve 2012 vol. 3
1035
The highest ratio of direct tax revenue-to-GDP was recorded in Denmark (29.6%), where most of
the welfare spending is financed via taxes on income and consequently, the figures for social
contribution are very low by comparison with the other countries. Among the countries, which
reported high relative figures are Sweden and Finland, which raised 19.4% and 15.9% of GDP
respectively through the direct taxes. The next are Belgium and the UK, both recorded direct tax
revenues equal to 15.6% of GDP. At the other end of the scale Lithuania (4.7%) and Bulgaria
(4.9%) accumulated exceptionally small revenues from direct taxes.
4. EMPIRICAL ANALYSIS ON THE IMPACT OF TAXATION ON ECONOMY
GROWTH IN THE EU
4.1. CONCEPTUAL FRAMEWORK AND EMPIRICAL METHODOLOGY
We could adopt the Barro’s endogenous model as an appropriate analytical framework for
investigation the impact of taxation and public expenditure on economy growth in the EU
countries. The further development of this model shows that ‘the long-run growth rate of per
capita output is a function of the tax rate and the shares of spending by different levels of
government’ (Davoodi H., et al., 1998, p. 247).
We use the regression analysis method in order to test validity of the predictions, made by Davoody
and Zou, in terms of the European Union. Thus we estimate the relationship between the long-run
growth rate and different components of the tax burden and the public spending in the EU-27. The
regression model is built on the base of the described conceptual framework. Its specification
includes the annual growth rate of GDP per capita as dependant variable and different types of tax
revenue and public expenditure as independent variables. The independent variables are presented
as a ratio to GDP. The equation (1) expressing this relationship is following:
(1) yit = b1 + b2Тit +b3Xit + εit,
where yit is the annual growth rate of GDP per capita for each country and year, Тit is tax revenue
for each country and year – taxes on production and imports, value added type taxes (VAT), taxes
on land, buildings and other structures, taxes on income, actual social contributions as well as total
receipts from taxes and social contributions (including imputed social contributions) after
deduction of amounts assessed but unlikely to be collected. The goal is to be compared the
efficiency of different revenues accumulated by direct and indirect taxes. The total budget spending
for each country and year is marked with Xit. The error term is εit. The regression parameters are b1,
b2, b3. The estimation procedure for the regression model parameters is the ordinary least squares
(OLS) method. It is applied to a year data panel for the European Union. The period of analysis is
1996-2010. The countries Malta and Finland have been excluded from the panel. Source of data is
Eurostat.
4.2. REGRESSION RESULTS
The regression results are presented in the Table 1. The Table includes results from the estimating
procedure applied to a year data panel for the European Union (27). The separate variants of the
model specification are constructed by different combinations of explanatory variables from
equation 1. Thus, we get specifications of the Models from 1 to 4.
Model 1 analyzes the influence of public expenditure on GDP growth. The model’s adequacy has
been confirmed by the tests. According to Durbin-Watson statistics, there is a weak positive
D. Stoilova & N. Patonov
1036
autocorrelation. Regression coefficient expresses the impact of public expenditure on GDP growth.
It has a negative sign and statistical significance at 1% level. Consequently, this result is a reliable
empirical evidence for the negative influence of budgetary spending on economy growth. This fact
shows that the efficiency of public expenditure in the EU (27) is not very high. A non-linear
relation hypothesis is tested and it is empirically confirmed. The form of relationship is quadratic.
The negative sign means the parabola is concave down and has a maximum turning point. This
means that an increase in the size of budgetary spending would decrease the negative effect to a
point. After this point, each new increase in the spending size would lead to an increase in the
negative effect on economy growth. Other analyzers have found similar to present empirical results.
The regressions of L. Andersen and J. Jordan indicate that an increase in government expenditures
is mildly stimulative in the quarters in which spending is increased, but in the other quarters this
increase in expenditures causes offsetting negative influences. They explain that the results are
consistent with modern quantity theories which hold that government spending, taxing, and
borrowing policies would have, through interest rate and wealth effects, different impacts on
economic activity under vaiying circumstances. (Andersen, L. and J. Jordan, 1968, p. 37)
Model 2 analyzes the influence of main direct taxes and social contributions on the GDP growth
rate in the EU (27) countries. The presence of a weak positive serial correlation is confirmed.
Hypothesis of non-linear relationship for each variable has been tested but it is not empirically
confirmed. Tax revenue derived by taxes on land, buildings and other structures has a positive
impact on economy growth due to the increase in efficiency of total taxation. The regression
coefficient is not statistically significant. This result could not be accepted as a reliable empirical
evidence for the kind of influence. The regression coefficients for revenue of income taxes and
social contributions have positive signs. That means a significant positive effect of the revenue
from taxes and social contribution on the long-term
economic growth. Their statistical significance respectively is at 1% and 5% level, respectively.
These results support the admission for effective income taxation in the EU (27) countries, but they
are not consistent with the results of most of the empirical studies.
The authors’ collective of Kneller, Bleaney and Gemmell examine the experience of OECD
countries and find the impact of tax structure on economy growth (Kneller et al., 1999). They use
the terms ‘distortionary taxes’ and ‘non-distortionary taxes’. The first type of taxes includes these
ones on income and property. The consumption taxes are defined as non-distortionary. They found
a depressing effect of direct taxes on the growth of economy. Such type of effect is not registered
for consumption taxes. Similar results are found by Widmalm (2001). According to her study the
revenues from income taxes negatively affect the economic growth in the developed OECD
countries. More complex results about the impact of taxation on growth have been found by Jens
Arnold (2008). The results of his analysis suggest ‘that income taxes are generally associated with
lower economic growth than taxes on consumption and property. Property taxes, and particularly
recurrent taxes on immovable property, seem to be the most growthfriendly, followed immediately
by consumption taxes. Personal income taxes seem to be significantly inferior, and corporate
income taxes have the most negative effects on GDP per capita.’ (Arnold, 2008, p.18)
Book of Proceedings – TMS Algarve 2012 vol. 3
1037
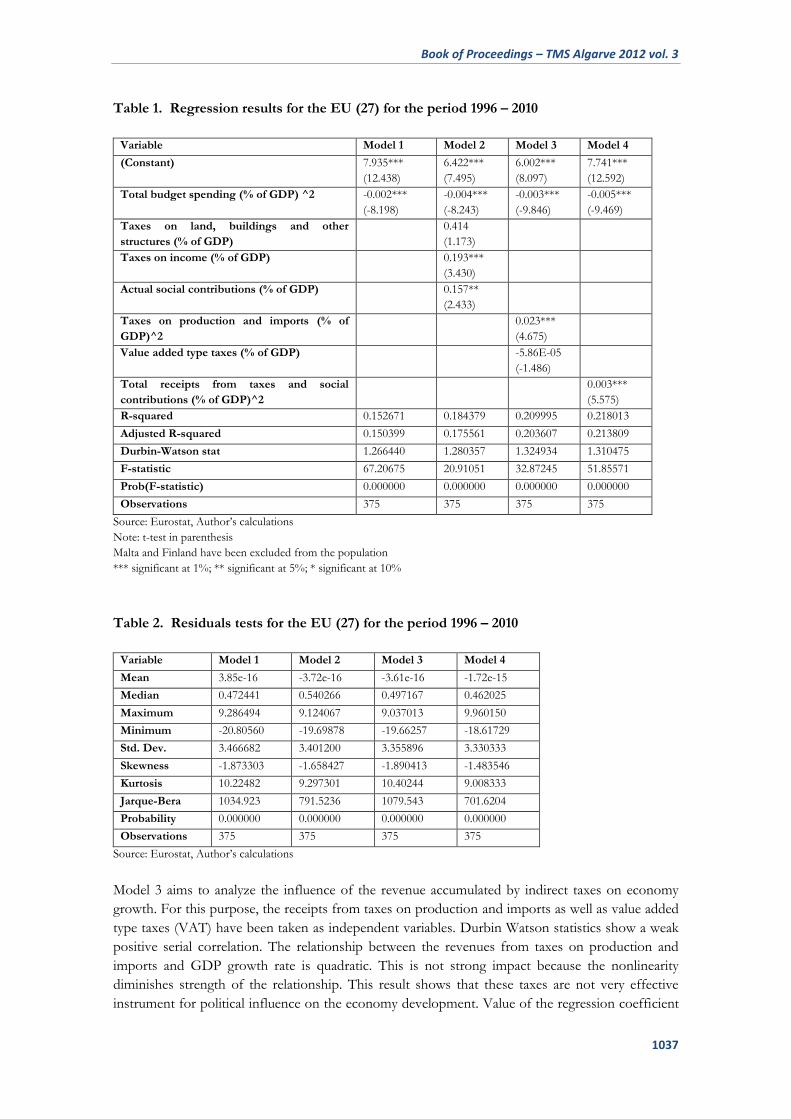
Table 1. Regression results for the EU (27) for the period 1996 – 2010
Variable Model 1 Model 2 Model 3 Model 4
(Constant) 7.935***
(12.438)
6.422***
(7.495)
6.002***
(8.097)
7.741***
(12.592)
Total budget spending (% of GDP) ^2 -0.002***
(-8.198)
-0.004***
(-8.243)
-0.003***
(-9.846)
-0.005***
(-9.469)
Taxes on land, buildings and other
structures (% of GDP)
0.414
(1.173)
Taxes on income (% of GDP) 0.193***
(3.430)
Actual social contributions (% of GDP) 0.157**
(2.433)
Taxes on production and imports (% of
GDP)^2
0.023***
(4.675)
Value added type taxes (% of GDP) -5.86E-05
(-1.486)
Total receipts from taxes and social
contributions (% of GDP)^2
0.003***
(5.575)
R-squared 0.152671 0.184379 0.209995 0.218013
Adjusted R-squared 0.150399 0.175561 0.203607 0.213809
Durbin-Watson stat 1.266440 1.280357 1.324934 1.310475
F-statistic 67.20675 20.91051 32.87245 51.85571
Prob(F-statistic) 0.000000 0.000000 0.000000 0.000000
Observations 375 375 375 375
Source: Eurostat, Author’s calculations
Note: t-test in parenthesis
Malta and Finland have been excluded from the population
*** significant at 1%; ** significant at 5%; * significant at 10%
Table 2. Residuals tests for the EU (27) for the period 1996 – 2010
Variable Model 1 Model 2 Model 3 Model 4
Mean 3.85e-16 -3.72e-16 -3.61e-16 -1.72e-15
Median 0.472441 0.540266 0.497167 0.462025
Maximum 9.286494 9.124067 9.037013 9.960150
Minimum -20.80560 -19.69878 -19.66257 -18.61729
Std. Dev. 3.466682 3.401200 3.355896 3.330333
Skewness -1.873303 -1.658427 -1.890413 -1.483546
Kurtosis 10.22482 9.297301 10.40244 9.008333
Jarque-Bera 1034.923 791.5236 1079.543 701.6204
Probability 0.000000 0.000000 0.000000 0.000000
Observations 375 375 375 375
Source: Eurostat, Author’s calculations
Model 3 aims to analyze the influence of the revenue accumulated by indirect taxes on economy
growth. For this purpose, the receipts from taxes on production and imports as well as value added
type taxes (VAT) have been taken as independent variables. Durbin Watson statistics show a weak
positive serial correlation. The relationship between the revenues from taxes on production and
imports and GDP growth rate is quadratic. This is not strong impact because the nonlinearity
diminishes strength of the relationship. This result shows that these taxes are not very effective
instrument for political influence on the economy development. Value of the regression coefficient
D. Stoilova & N. Patonov
1038
is very low, which is due to the low share of these taxes as a source of revenue for budget. The
positive sign means a catalyzing effect of taxes on production and imports on the national economy
growth. This type of relationship is due to the intensifying of national production of goods as the
imports are restrained because of taxes. The regression coefficient expressing the impact of tax
revenue accumulated by value added type taxes (VAT) on economy growth is "consistent with light
of the conventional wisdom" (Samimi A., et al., 2010, p. 5492). Negative sign of the coefficient
means a negative relationship. It is not statistically significant and could not be accept as reliable
empirical evidence. The results from empirical analyses on the relationship between indirect taxes
and economy growth are not necessarily characterized by negative signs. Such type of example is
shown by analysis of the authors’ collective of Kneller, Bleaney and Gemmell (Kneller et al., 1999).
According to analysis of Widmalm (2001), the revenue from consumption taxes has a weak positive
effect on economy growth in developed countries.
Total receipts from taxes and social contributions (including imputed social contributions) after
deduction of amounts assessed but unlikely to be collected have been put into Model 4. The model
has a weak positive serial correlation. The small amount of the coefficient confirms assumptions of
the catalyzing effect on economic growth of the increase in total receipts from taxes and social
contributions in terms of fixed budgetary spending size. The empirical result for the EU countries
could be explained by the financial strengthening of public authority. A hypothesis for nonlinearity
has been tested. The form of relationship is quadratic. This kind of link suggests a weak influence
of total tax burden on economy growth. The level of statistical significance of the regression
coefficient is 1%, which makes this result reliable empirical evidence. The sign of the regression
coefficient is not consistent with estimated results in other studies. Ch. Romer and D. Romer have
found that tax changes have very large effects on output and an exogenous tax increase of one
percent of GDP lowers real GDP by roughly three percent (Romer Ch. D. and D. H. Romer, 2007,
p.42). Their research is based on the US experience since World War II. L. Andersen and J. Jordan
do not find a support of the theory predictions for an ambiguous negative effect of the receipts on
economy growth. They estimate both positive and negative coefficients for the receipts (Andersen,
Leonall C., and Jerry L. Jordan. 1968, p. 37).
5. CONCLUSIONS
The empirical results showed a clear and strongly expressed impact of the direct taxes on economy
growth. This is due to efficiency gains of revenue accumulation through taxation of wealth. The
comparison between the impacts of tax revenue accumulated by the two types of taxation confirms
the assumptions for a lower efficiency of the indirect taxes as a method of budgetary revenue
accumulation. This fact is due to the considerable extent of inequity of the indirect taxes and
shrinking effects on production and sales. Consequently, the tax structure based on direct taxes is
more efficient in terms of supporting the economy growth in the EU countries. However, analysis
on the tax system is always a topical problem and it is difficult to draw definitive conclusions from
these empirical results.
Book of Proceedings – TMS Algarve 2012 vol. 3
1039
BIBLIOGRAPHY
Andersen, L. & Jordan, J. (1968). Monetary and Fiscal Actions: A Test of Their Relative Importance in
Economic Stabilization. Federal Reserve Bank of St. Louis Review, 50 (November): 24-44.
Arnold, J. (2008). Do Tax Structure Affect Aggregate Economic Growth? Empirical Evidence from a Panel
of
Barro, R. (1990). Government Spending in a Simple Model of Endogenous Growth. Journal of Political
Economy, 98, 103- 125
Cardia, E. (1997). Replicating Ricardian Equivalence Tests with Simulated Series. American Economic Review,
(March), 87 65-79.
Davoodi. H & Zou. H. (1998). Fiscal decentralization and economic growth: A cross-country study. Journal of
Urban Economics, 43, 244–257.
European Commission. (2011). Taxation and Customs Union, Taxation Trends in the European Union.
Eurostat. Data Explorer. Retrieved from http://appsso.eurostat.ec.europa.eu/.
GemmelL, N., Kneller, R. & Sanz, I. (2006). Fiscal Policy Impacts on Growth in the OECD: Are They Long-
or Short-Term? University of Nottingham: Mimeo.
Kneller, R., Bleaney, M. & Gemmell N. (1999). Fiscal Policy and Growth: Evidence from OECD Countries.
Journal of Public Economics, 74, 171-190.
Kormendi, R. (1983). Government Debt, Government Spending, and Private Sector Behavior. American
Economic Review, (December), 73 994-1010.
Lee Y. & Gordon, R. (2005).Tax Structure and Economic Growth. Journal of Public Economics, 89, 1027–1043.
Myles, G. (2008). Economic Growth and the Role of Taxation. Report for the OECD. Retrieved from
http://www.people.ex.ac.uk/gdmyles/papers/pdfs/OECDfin.pdf.
OECD Countries. (2008). Economics Department Working Papers, No. 643, ECO/WKP,51.
OECD. (2008). Taxing Wages. 2006-2007.
OECD. (2008). Revenue Statistics.
Romer, CH. & Romer, D. (2007). The Macroeconomic Effects of Tax Changes: Estimates Based on a New
Measure of Fiscal Shocks. NBER Working Paper Series, Working Paper 13264.
Samimi A., Lar, S., Haddad G. & Alizadeh M. (2010). Fiscal Decentralization and Economic Growth in Iran.
Australian Journal of Basic and Applied Sciences, 4(11), 5490-5495.
Schwellnus, C. & Arnold, J. (2008). Do Corporate Taxes Reduce Productivity and Investment at the Firm
Level? Cross-country Evidence from the Amadeus Dataset. OECD Economics Department Working Papers.
Vartia, L. (2008). How Do Taxes Affect Investment and Productivity? Industry Level Analysis of OECD
Countries. OECD Economics Department Working Papers.
Wahrig, L. (2012). Tax Revenues in the European Union, Eurostat. Statistics in Focus, No 2/2012
Widmalm, F. (2001). Tax Structure and Growth: Are Some Taxes Better than Others? Public Choice, 107, 199-
219.
Copyright © 2022 FDOKUMEN