Are There Goodwin Employment-Distribution Cycles? Theoretical and Empirical Evidence
29
ARE THERE GOODWIN EMPLOYMENT-DISTRIBUTION CYCLES? INTERNATIONAL EMPIRICAL EVIDENCE Mario García Molina 1 Eleonora Herrera Medina 2 Richard Goodwin’s (1967, 1972) model of the growth cycle attempted to show how accumulation takes a cyclical form due to the interaction of cap- italists and workers in a Marxian way. This simple theoretical model of endogenous cycles has been further explored in several directions includ- ing the realism of its assumptions, its stability and possible generalizations (Goodwin et al, 1984); there has been less interest in performing empir- ical studies, with the exception of Atkinson (1969), Desai (1984) Solow (1990), Harvie (2000) and Moreno (2002). This literature has provided ev- idence on single countries or on a small number of them, the largest sample so far being 10 OECD countries in the case of Harvie (2000). 1 Economics Ph.D. currently occupies the position of professor of the Economic Sciences Faculty of the Universidad Nacional de Colombia. and the Economy Faculty of the Universidad Externado de Colombia. Mailing address: Cra 30 N. 45-03. Facultad de Ciencias Económicas, edificio 311, oficina 306, Universidad Nacional de Colombia, (Bogotá, Colombia). E-mail: [email protected]. 2 Masters degree in Economics. Currently occupies the position of director of the Cen- tre of Economic Studies and Analyses of the Universidad Antonio Nariño. Mailing address: Kra 3 este N. 47 A - 15, bloque 4, cuarto piso (Bogotá, Colombia). E-mail: [email protected]. We are grateful to Heinz Kurz and Alvaro Moreno for comments. This article was received on October 28, 2009 and his publication approved on April 23, 2010. 1
-
Upload
independent -
Category
Documents
-
view
2 -
download
0
Transcript of Are There Goodwin Employment-Distribution Cycles? Theoretical and Empirical Evidence
ARE THERE GOODWINEMPLOYMENT-DISTRIBUTION CYCLES?INTERNATIONAL EMPIRICAL EVIDENCE
Mario García Molina1
Eleonora Herrera Medina2
Richard Goodwin’s (1967, 1972) model of the growth cycle attempted toshow how accumulation takes a cyclical form due to the interaction of cap-italists and workers in a Marxian way. This simple theoretical model ofendogenous cycles has been further explored in several directions includ-ing the realism of its assumptions, its stability and possible generalizations(Goodwin et al, 1984); there has been less interest in performing empir-ical studies, with the exception of Atkinson (1969), Desai (1984) Solow(1990), Harvie (2000) and Moreno (2002). This literature has provided ev-idence on single countries or on a small number of them, the largest sampleso far being 10 OECD countries in the case of Harvie (2000).
1Economics Ph.D. currently occupies the position of professor of the Economic SciencesFaculty of the Universidad Nacional de Colombia. and the Economy Faculty of theUniversidad Externado de Colombia. Mailing address: Cra 30 N. 45-03. Facultad deCiencias Económicas, edificio 311, oficina 306, Universidad Nacional de Colombia,(Bogotá, Colombia). E-mail: [email protected].
2Masters degree in Economics. Currently occupies the position of director of the Cen-tre of Economic Studies and Analyses of the Universidad Antonio Nariño. Mailingaddress: Kra 3 este N. 47 A - 15, bloque 4, cuarto piso (Bogotá, Colombia). E-mail:[email protected] are grateful to Heinz Kurz and Alvaro Moreno for comments.This article was received on October 28, 2009 and his publication approved onApril 23, 2010.
1
2 Cuadernos de Economía, 29(53), 2010
The aim of the article is to provide evidence about employment distributioncycles à la Goodwin for a larger number of countries at several levels ofdevelopment.
The model’s central dynamics is a cyclical relationship between incomeshares and employment. This behaviour should underlie the dynamics ofdeveloped capitalist economies, but it should also at least partially explainthe behaviour of developing capitalist countries. If this relationship holds,it should appear as a cycle in the scatterplots of the workers’ share againstthe employment rate. Furthermore, on a quantitative level, the model’s esti-mation of the cycle’s centre can be compared with the position of the actualcentre of the cycle found for a country. Finally, Goodwin’s assumptionscan be tested to check for their validity. The procedure of looking for quali-tative and quantitative evidence and testing the assumptions was performedby Harvie (2000), who found not exactly a cycle but what looked like partof a cycle (around a quarter) for 10 OECD countries during the period be-tween the late 1960’s and the mid 1990’s, which qualitatively supportedthe idea of a cycle. However, he also found that the estimated centres layoutside the actual cycles, while the assumptions were not justified, whichmeant that at a quantitative level the model was not adequate. Harvie’smethodology is used here for a larger number of countries at different lev-els of economic development in order to provide a better grasp of the extentto which the model holds empirically and to offer possible directions for fu-ture developments.
Section 1 presents the model. Section 2 provides evidence on whether thereare cycles in the employment-distribution space from a sample of 67 coun-tries with different levels of development. Section 3 discusses the evidenceand concludes with suggestions for future study.
GOODWIN’S MODEL
Goodwin (1967, 1972) models the cyclical behaviour in the workers’ shareof national income and the employment rate by means of the Lotka-Volterrapredator-prey model (Lotka, 1956; Volterra, 1931a, 1931b, 1937). Themodel attempts to formally present Marx’s idea that the interaction be-tween distribution and employment was at the root of capitalism’s boomsand slumps.
Assuming a constant relation of “constant” (the value of the means of pro-duction) to “variable” (wages) capital, both constant and variable capital
Are There Goodwin Employment-Distribution Cycles? M. García y E. Herrera 3
will grow until full employment of labour is reached. In the neighbourhoodof full employment, real wages will rise (i.e. a real Phillips curve), butrising real wages reduce the rate of profits and thus dampen accumulation.
The lower rate of accumulation will engender unemployment, removing thedisproportion between capital and exploitable labour-power. Real wagesfall and accumulation picks up again.
Goodwin assumes two factors of production: capital and labour. All quan-tities are real and net. Labour productivity (α) and the labour force (n)grow at constant rates (equations 1 and 2). σ is the fixed capital output ratio(equation 3), which determines the employment level l (equation 4). k isthe total stock of capital, q is real output, l is employment, w is the realwage, and u the workers’ share of national income (equation 5); υ is theemployment rate (equation 6).
a = a0eαt;α > 0 (1)
n = n0eβt;β > 0 (2)
σ =k
q(3)
l =q
a(4)
u =wl
q=
w
a(5)
v =l
n(6)
k = (1− u)q (7)
w
w= −γ + ρυ; γ > 0, ρ > 0 (8)

4 Cuadernos de Economía, 29(53), 2010
Capitalists are assumed to save and invest all their profits and workers toconsume all their wages (equation 7). Finally, a linear real Phillips curve isassumed, i.e. real wages rise as employment increases (equation 8).
From equations (1)-(8) a pair of differential equations in the state variablesu and ν can be obtained:
u = [−(α+ γ) + ρν]u (9)
ν =
[1− u
σ− (α+ β)
]ν (10)
The solution of the model is a family of closed cycles around a centre, i.e.,the economy comes back to the initial point and starts the cycle again.
Because this is a highly stylized model, it leaves out several aspects, whichwill be of importance in the empirical testing.
First, the length and the amplitude of the cycles are not clear. Scholarswho have studied cycles and waves have identified superimposed cycles ofdifferent lengths. As regards to the short run, there are 1, 2, 3 and 5 yearcycles (Zarnovitz, 1985); in the long run, there are (or may be) Juglar (7-11years), Kuznetz (15-25 years) or Kondratiev (45-60 years) cycles (Schum-peter, 1954; Kondratieff and Stolper, 1935; Solomou, 1987). It is true thatthe length and amplitude of Goodwin cycles can be numerically determinedfrom the equations, but there still remains a theoretical problem, for whichGoodwin does not provide an explicit answer, as the assumptions of themodel do not point in a definite direction.
On the one hand, the model assumes exogenous technical progress, whichcould be taken in favour of a short run interpretation, although at the timethe model was built this was a standard assumption among many (neoclas-sical) growth theorists. On the other hand, the assumption of Say’s lawpoints to a long run interpretation, as used in other growth models. Giventhese assumptions, it is no surprise that Goodwin cycles have been inter-preted in different ways: Veneziani and Mohul (2006) see them as “short”cycles; while Harvey (2001), and Flaschel and Groh (1995) take them as“long” cycles.
Another point worth remembering is that the cycles discussed in the lit-erature refer mainly to variables such as price and output. This is hardlysurprising as long series were available for said variables. Kondratieff cy-cles, for instance, were originally developed mainly for prices and only
Are There Goodwin Employment-Distribution Cycles? M. García y E. Herrera 5
later emphasized other variables. However, Goodwin’s model refers to theshare of wages in the national income, and to the employment rate. Neitherof these variables corresponds exactly to the ones in the other cycles al-ready mentioned. Hence, there is a possibility for Goodwin cycles to haveamplitudes or lengths that are not exactly those of other known cycles.
Finally, if a Goodwin model predicts clockwise cycles as a result of invest-ment being led by profits, the economy may also be considered as being ledby wages with counter clockwise cycles. The former are classical cycles,while the latter are Keynesian cycles. It is also possible to mix both, butthe outcome will depend on the exact way they are combined. Dumenil andLevy (1999), for example, combined short-term Keynesian dynamics witha long-term classical model; another case was that of Canry (2005), who in-corporated a Bhaduri-Marglin (1990) model within a Goodwin framework.The results of these models depend on the specificities of the equations,which in turn could be interpreted as reflecting the institutional environ-ment of the model.
Another factor that has an effect on joint classical-Keynesian models is theway of dealing with Say’s law. Goodwin’s model assumes Say’s law, in theclassical way, i.e. in the sense that capital always finds employment, not solabour. This means that there are no effective-demand problems, but at thesame time the Keynesian part would imply a rejection of Say’s law. Thisproblem will not be dealt with here, but should be kept in mind by studiesdealing with mixed models.
¿ARE THERE DISTRIBUTION-EMPLOYMENTCYCLES?
Data were collected for 67 countries from different sources, including UN,IMF, the World Bank, central banks, national statistics offices, regional or-ganizations, and databases from local universities. As the building of thecycles for single countries included local sources, there may be countriesfor which figures are not expressed in PPP exchange rates. As a result, com-parisons among countries cannot be made in quantitative terms, althoughqualitative behaviour within a country can be established. This means, forinstance, that with the data set it is not possible to say that a country’s cycleis twice wider than another’s, but it is possible to say that both are clockwisecycles.
6 Cuadernos de Economía, 29(53), 2010
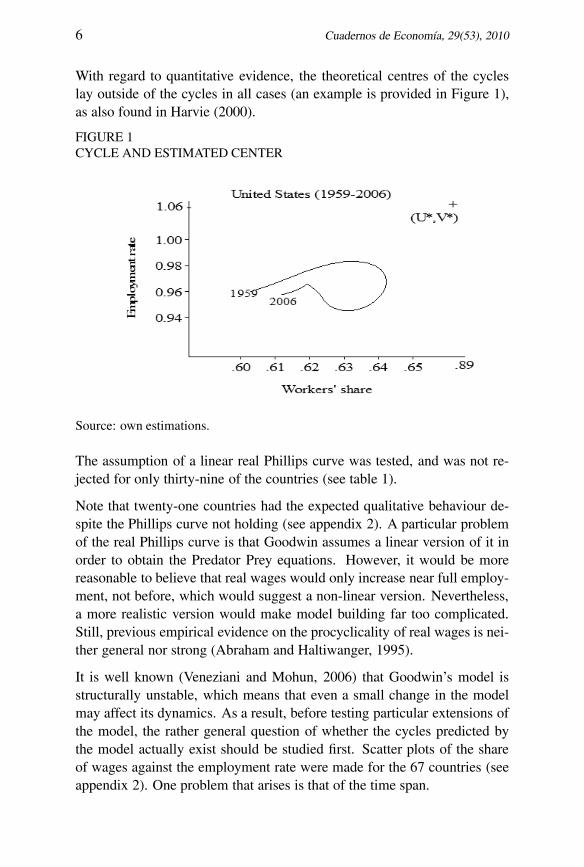
With regard to quantitative evidence, the theoretical centres of the cycleslay outside of the cycles in all cases (an example is provided in Figure 1),as also found in Harvie (2000).
FIGURE 1CYCLE AND ESTIMATED CENTER
Source: own estimations.
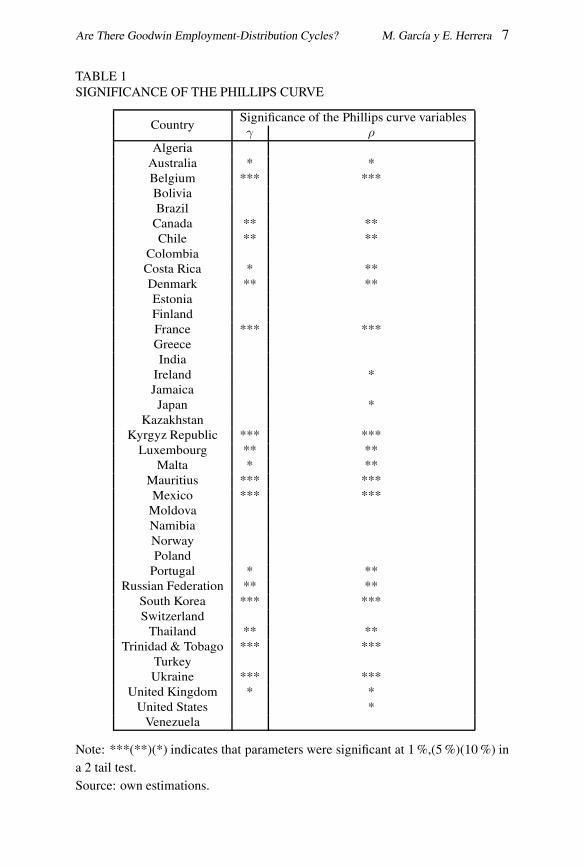
The assumption of a linear real Phillips curve was tested, and was not re-jected for only thirty-nine of the countries (see table 1).
Note that twenty-one countries had the expected qualitative behaviour de-spite the Phillips curve not holding (see appendix 2). A particular problemof the real Phillips curve is that Goodwin assumes a linear version of it inorder to obtain the Predator Prey equations. However, it would be morereasonable to believe that real wages would only increase near full employ-ment, not before, which would suggest a non-linear version. Nevertheless,a more realistic version would make model building far too complicated.Still, previous empirical evidence on the procyclicality of real wages is nei-ther general nor strong (Abraham and Haltiwanger, 1995).
It is well known (Veneziani and Mohun, 2006) that Goodwin’s model isstructurally unstable, which means that even a small change in the modelmay affect its dynamics. As a result, before testing particular extensions ofthe model, the rather general question of whether the cycles predicted bythe model actually exist should be studied first. Scatter plots of the shareof wages against the employment rate were made for the 67 countries (seeappendix 2). One problem that arises is that of the time span.
Are There Goodwin Employment-Distribution Cycles? M. García y E. Herrera 7
TABLE 1SIGNIFICANCE OF THE PHILLIPS CURVE
CountrySignificance of the Phillips curve variablesγ ρ
AlgeriaAustralia * *Belgium *** ***BoliviaBrazilCanada ** **Chile ** **
ColombiaCosta Rica * **Denmark ** **EstoniaFinlandFrance *** ***GreeceIndia
Ireland *JamaicaJapan *
KazakhstanKyrgyz Republic *** ***
Luxembourg ** **Malta * **
Mauritius *** ***Mexico *** ***MoldovaNamibiaNorwayPolandPortugal * **
Russian Federation ** **South Korea *** ***SwitzerlandThailand ** **
Trinidad & Tobago *** ***TurkeyUkraine *** ***
United Kingdom * *United States *Venezuela
Note: ***(**)(*) indicates that parameters were significant at 1 %,(5 %)(10 %) ina 2 tail test.Source: own estimations.
8 Cuadernos de Economía, 29(53), 2010
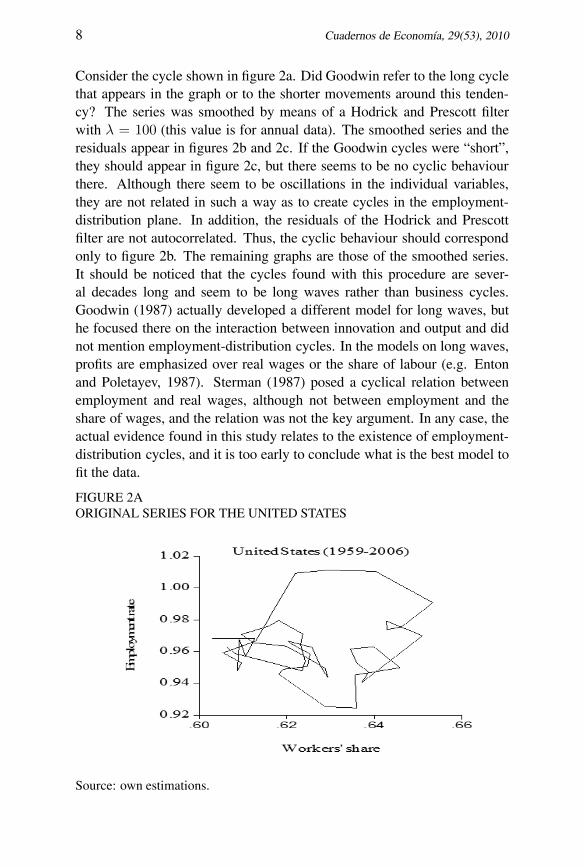
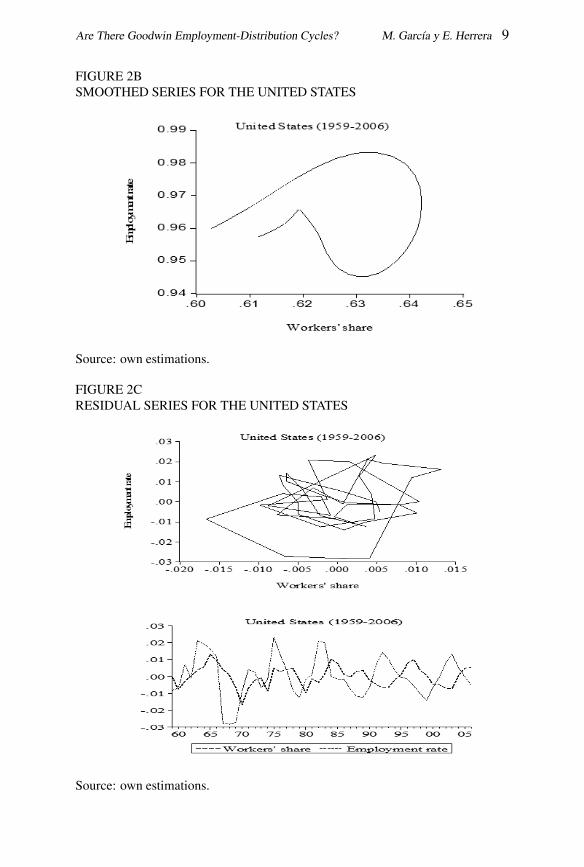
Consider the cycle shown in figure 2a. Did Goodwin refer to the long cyclethat appears in the graph or to the shorter movements around this tenden-cy? The series was smoothed by means of a Hodrick and Prescott filterwith λ = 100 (this value is for annual data). The smoothed series and theresiduals appear in figures 2b and 2c. If the Goodwin cycles were “short”,they should appear in figure 2c, but there seems to be no cyclic behaviourthere. Although there seem to be oscillations in the individual variables,they are not related in such a way as to create cycles in the employment-distribution plane. In addition, the residuals of the Hodrick and Prescottfilter are not autocorrelated. Thus, the cyclic behaviour should correspondonly to figure 2b. The remaining graphs are those of the smoothed series.It should be noticed that the cycles found with this procedure are sever-al decades long and seem to be long waves rather than business cycles.Goodwin (1987) actually developed a different model for long waves, buthe focused there on the interaction between innovation and output and didnot mention employment-distribution cycles. In the models on long waves,profits are emphasized over real wages or the share of labour (e.g. Entonand Poletayev, 1987). Sterman (1987) posed a cyclical relation betweenemployment and real wages, although not between employment and theshare of wages, and the relation was not the key argument. In any case, theactual evidence found in this study relates to the existence of employment-distribution cycles, and it is too early to conclude what is the best model tofit the data.
FIGURE 2AORIGINAL SERIES FOR THE UNITED STATES
Source: own estimations.
Are There Goodwin Employment-Distribution Cycles? M. García y E. Herrera 9
FIGURE 2BSMOOTHED SERIES FOR THE UNITED STATES
Source: own estimations.
FIGURE 2CRESIDUAL SERIES FOR THE UNITED STATES
Source: own estimations.
10 Cuadernos de Economía, 29(53), 2010
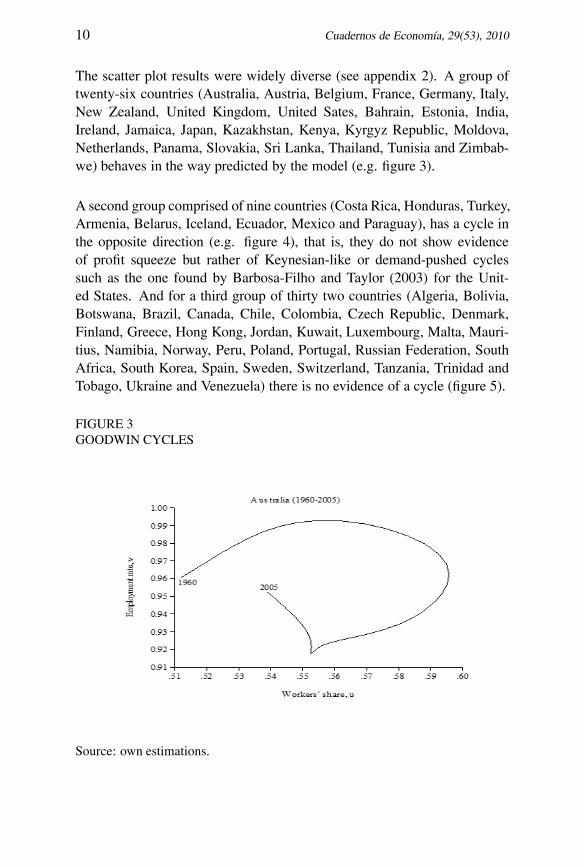
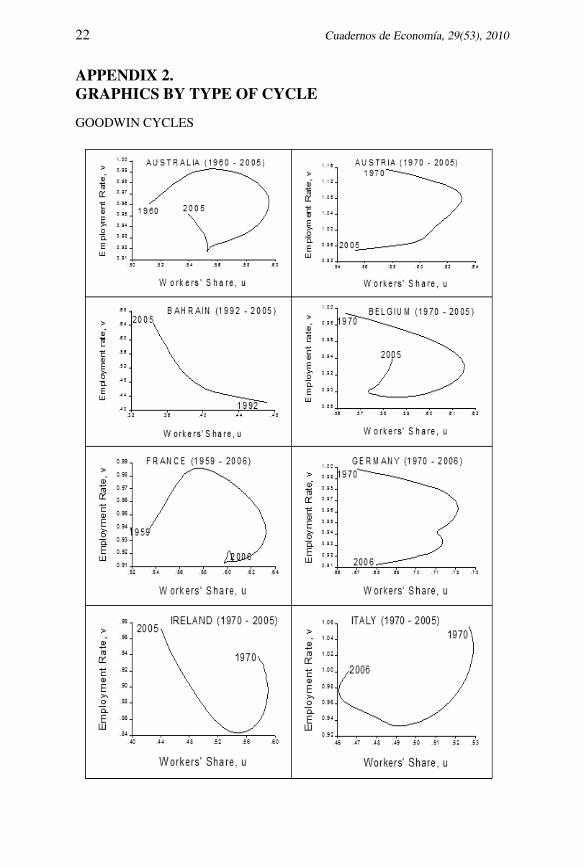
The scatter plot results were widely diverse (see appendix 2). A group oftwenty-six countries (Australia, Austria, Belgium, France, Germany, Italy,New Zealand, United Kingdom, United Sates, Bahrain, Estonia, India,Ireland, Jamaica, Japan, Kazakhstan, Kenya, Kyrgyz Republic, Moldova,Netherlands, Panama, Slovakia, Sri Lanka, Thailand, Tunisia and Zimbab-we) behaves in the way predicted by the model (e.g. figure 3).
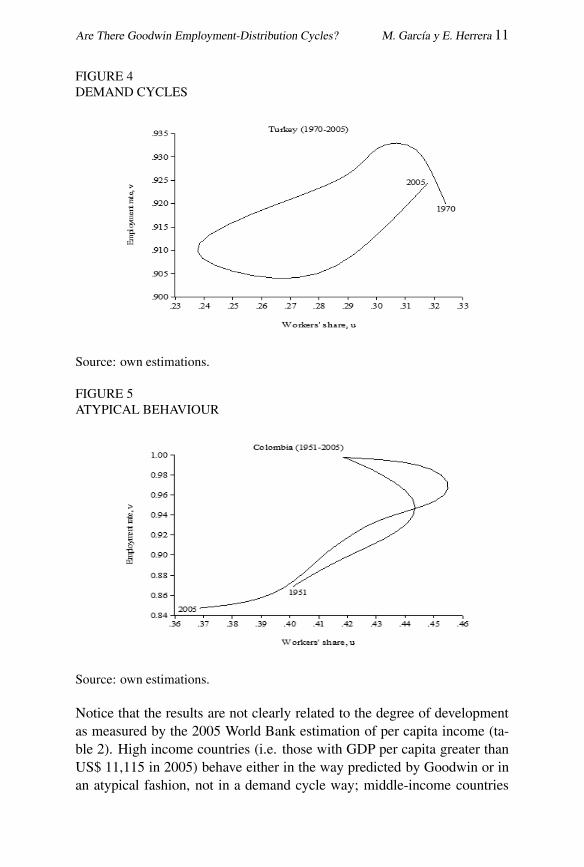
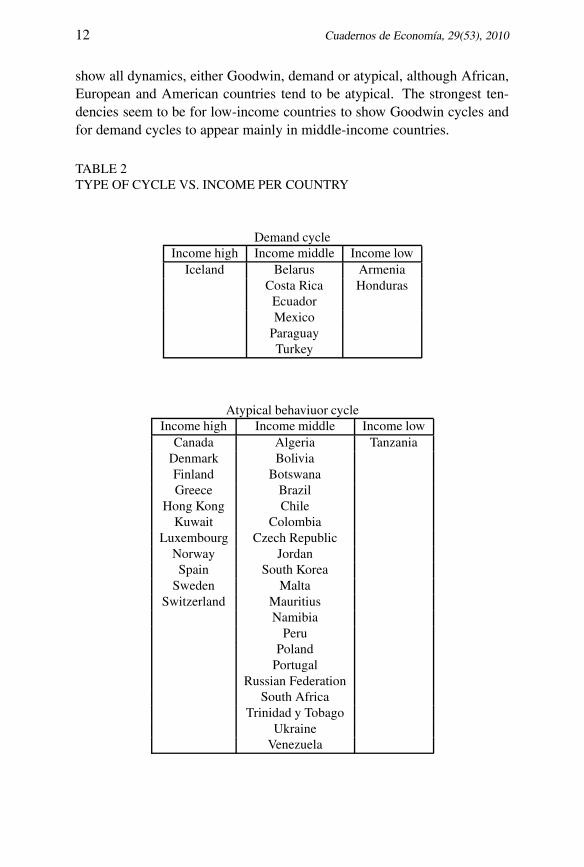
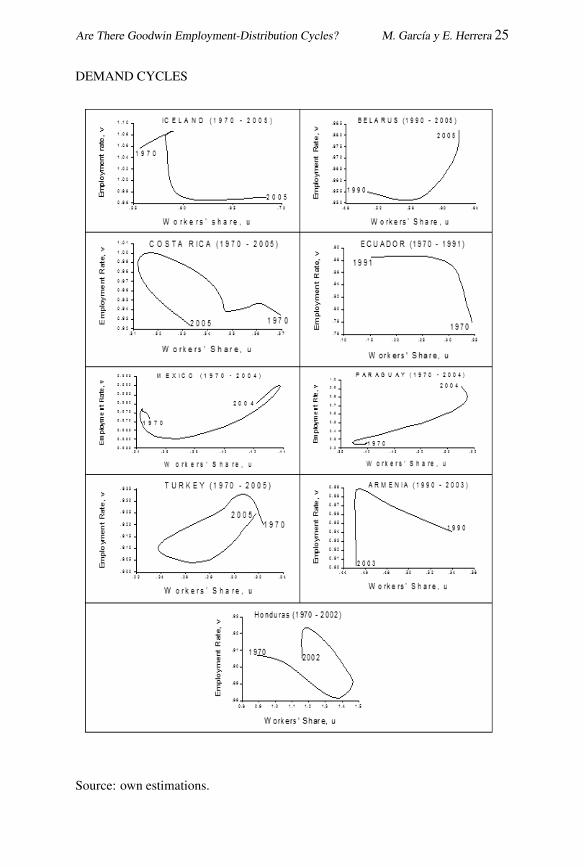
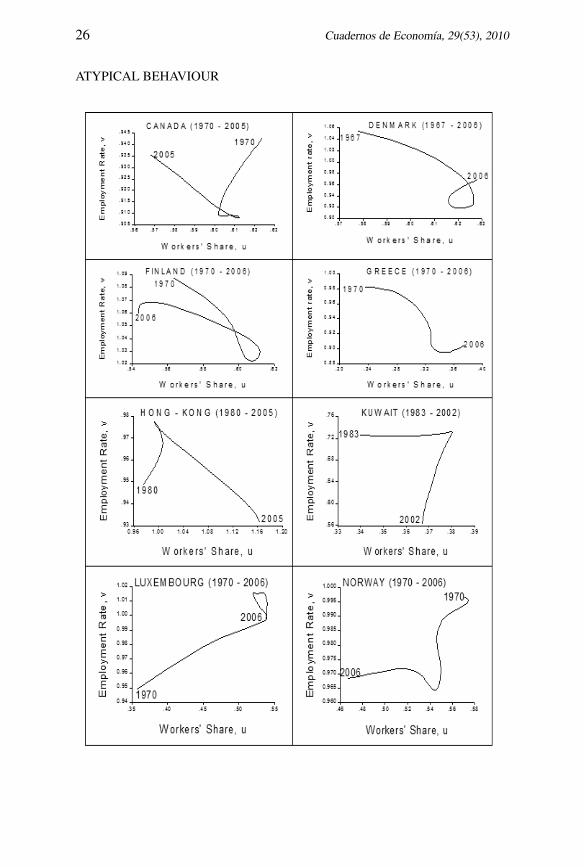
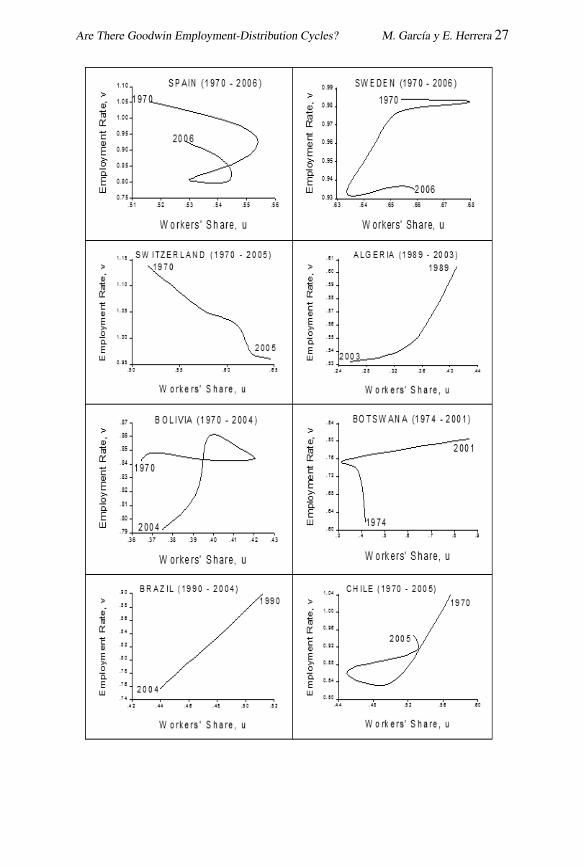
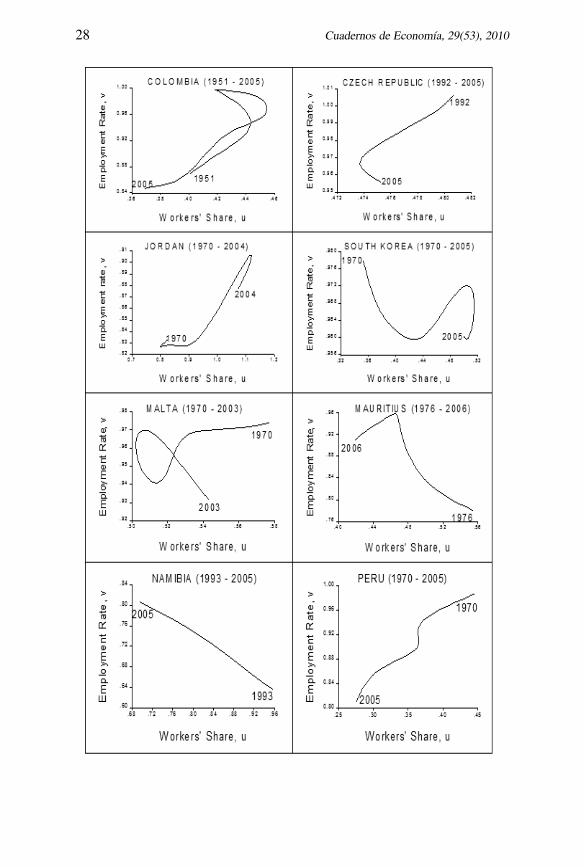
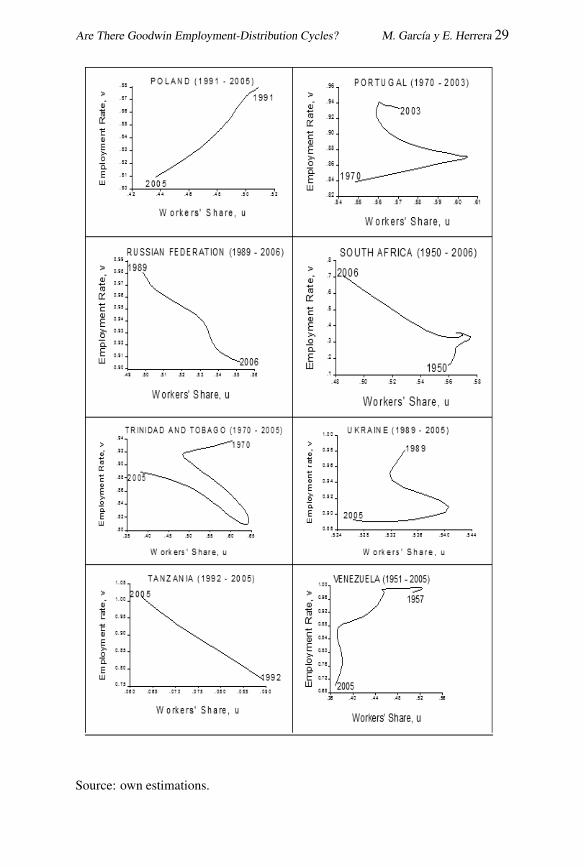
A second group comprised of nine countries (Costa Rica, Honduras, Turkey,Armenia, Belarus, Iceland, Ecuador, Mexico and Paraguay), has a cycle inthe opposite direction (e.g. figure 4), that is, they do not show evidenceof profit squeeze but rather of Keynesian-like or demand-pushed cyclessuch as the one found by Barbosa-Filho and Taylor (2003) for the Unit-ed States. And for a third group of thirty two countries (Algeria, Bolivia,Botswana, Brazil, Canada, Chile, Colombia, Czech Republic, Denmark,Finland, Greece, Hong Kong, Jordan, Kuwait, Luxembourg, Malta, Mauri-tius, Namibia, Norway, Peru, Poland, Portugal, Russian Federation, SouthAfrica, South Korea, Spain, Sweden, Switzerland, Tanzania, Trinidad andTobago, Ukraine and Venezuela) there is no evidence of a cycle (figure 5).
FIGURE 3GOODWIN CYCLES
Source: own estimations.
Are There Goodwin Employment-Distribution Cycles? M. García y E. Herrera 11
FIGURE 4DEMAND CYCLES
Source: own estimations.
FIGURE 5ATYPICAL BEHAVIOUR
Source: own estimations.
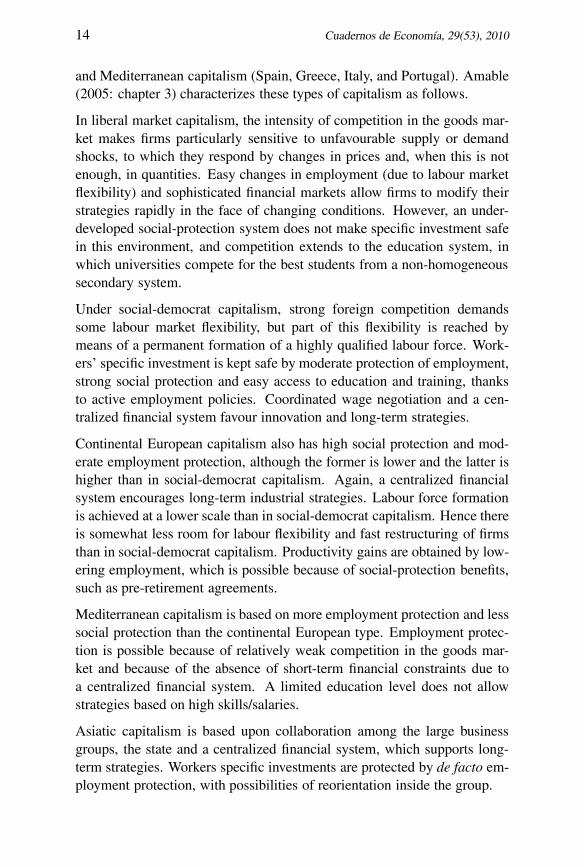
Notice that the results are not clearly related to the degree of developmentas measured by the 2005 World Bank estimation of per capita income (ta-ble 2). High income countries (i.e. those with GDP per capita greater thanUS$ 11,115 in 2005) behave either in the way predicted by Goodwin or inan atypical fashion, not in a demand cycle way; middle-income countries
12 Cuadernos de Economía, 29(53), 2010
show all dynamics, either Goodwin, demand or atypical, although African,European and American countries tend to be atypical. The strongest ten-dencies seem to be for low-income countries to show Goodwin cycles andfor demand cycles to appear mainly in middle-income countries.
TABLE 2TYPE OF CYCLE VS. INCOME PER COUNTRY
Demand cycleIncome high Income middle Income low
Iceland Belarus ArmeniaCosta Rica HondurasEcuadorMexico
ParaguayTurkey
Atypical behaviuor cycleIncome high Income middle Income low
Canada Algeria TanzaniaDenmark BoliviaFinland BotswanaGreece Brazil
Hong Kong ChileKuwait Colombia
Luxembourg Czech RepublicNorway JordanSpain South Korea
Sweden MaltaSwitzerland Mauritius
NamibiaPeru
PolandPortugal
Russian FederationSouth Africa
Trinidad y TobagoUkraine
Venezuela

Are There Goodwin Employment-Distribution Cycles? M. García y E. Herrera 13
Goodwin cycleIncome high Income middle Income low
Australia Estonia IndiaAustria Jamaica KenyaBahrain Kazakhstan Kyrgys RepublicBelgium New Zealand MoldovaFrance Panama Zimbabwe
Germany Slovak RepublicIreland Sri LankaItaly ThailandJapan Tunez
NetherlandsUnited Kingdom
Unites States
Source: The information for this table was obtained based on the estimation onGDP per capita made by the World Bank for 2005.
A possible explanation for this diversity is that capitalism has evolved inseveral ways in different countries according to different kinds of insti-tutions that affect capital accumulation, particularly but not exclusively,labour market institutions. As noted by Arrighi (1978) and more recent-ly by Acemoglu et al (2001), institutional development may be linked tothe pattern of population and migration. Another example of institutionaldiversity refers to the institutions regulating capital. A few countries (main-ly Anglo-Saxon ones) rely on more atomistic shareholders and individualfirms. In contrast, most other countries have business groups with control-ling shareholders playing a much more important role than that suggestedin typical textbooks (La Porta et al, 1999). In general, the characteristicsof institutions might help to classify the different kinds of capitalism andhelp to understand diversity in the relationship between distribution andemployment.
In order to take institutional diversity into account, the classification em-ployed by Amable (2005) was used. This author suggests that there are fivedifferent kinds of capitalism, according to the institutional complementar-ities in five domains: product markets, labour relations, financial systems,social protection and education. Consequently, capitalism takes one of thefollowing five forms: liberal market capitalism (United States, UK, Cana-da, and Australia), Asian capitalism (Japan and Korea), continental Euro-pean capitalism (Germany, France, Switzerland, Belgium, Ireland, Norway,and Austria), social-democrat capitalism (Denmark, Finland and Sweden)
14 Cuadernos de Economía, 29(53), 2010
and Mediterranean capitalism (Spain, Greece, Italy, and Portugal). Amable(2005: chapter 3) characterizes these types of capitalism as follows.
In liberal market capitalism, the intensity of competition in the goods mar-ket makes firms particularly sensitive to unfavourable supply or demandshocks, to which they respond by changes in prices and, when this is notenough, in quantities. Easy changes in employment (due to labour marketflexibility) and sophisticated financial markets allow firms to modify theirstrategies rapidly in the face of changing conditions. However, an under-developed social-protection system does not make specific investment safein this environment, and competition extends to the education system, inwhich universities compete for the best students from a non-homogeneoussecondary system.
Under social-democrat capitalism, strong foreign competition demandssome labour market flexibility, but part of this flexibility is reached bymeans of a permanent formation of a highly qualified labour force. Work-ers’ specific investment is kept safe by moderate protection of employment,strong social protection and easy access to education and training, thanksto active employment policies. Coordinated wage negotiation and a cen-tralized financial system favour innovation and long-term strategies.
Continental European capitalism also has high social protection and mod-erate employment protection, although the former is lower and the latter ishigher than in social-democrat capitalism. Again, a centralized financialsystem encourages long-term industrial strategies. Labour force formationis achieved at a lower scale than in social-democrat capitalism. Hence thereis somewhat less room for labour flexibility and fast restructuring of firmsthan in social-democrat capitalism. Productivity gains are obtained by low-ering employment, which is possible because of social-protection benefits,such as pre-retirement agreements.
Mediterranean capitalism is based on more employment protection and lesssocial protection than the continental European type. Employment protec-tion is possible because of relatively weak competition in the goods mar-ket and because of the absence of short-term financial constraints due toa centralized financial system. A limited education level does not allowstrategies based on high skills/salaries.
Asiatic capitalism is based upon collaboration among the large businessgroups, the state and a centralized financial system, which supports long-term strategies. Workers specific investments are protected by de facto em-ployment protection, with possibilities of reorientation inside the group.
Are There Goodwin Employment-Distribution Cycles? M. García y E. Herrera 15
Developed countries in our sample were thus classified in this way. AsAmable’s (2005) classification relates only to developed countries, it is in-sufficient for developing countries. However, taking colonialism into ac-count, it may be assumed that the institutions of a former colony weremoulded before independence. Hence developing countries were classi-fied according to the European language that is most used in the country.Language is taken as a proxy for the European country that most influenceda country’s institutions, as several countries were colonies of European em-pires. In other cases, the decision was based upon the country’s sharedpermanence under the same empire, e.g. Turkey and Greece.
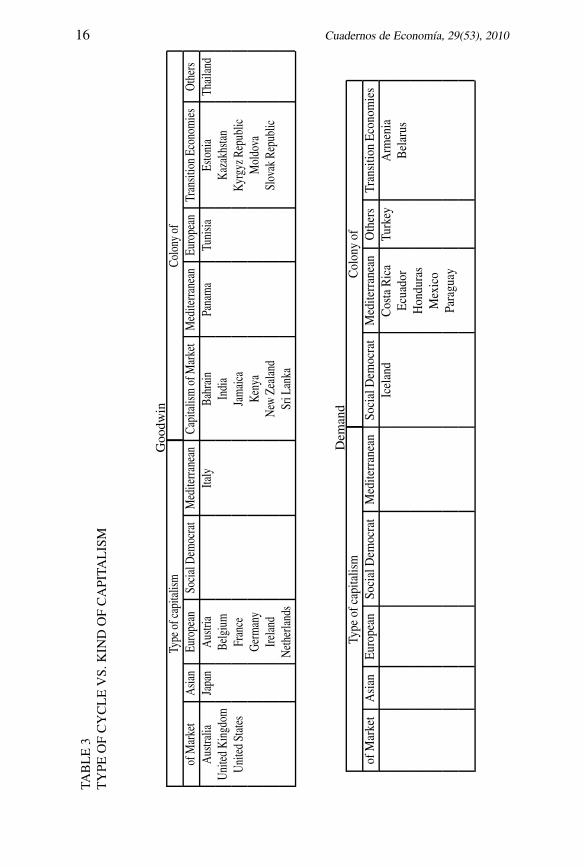
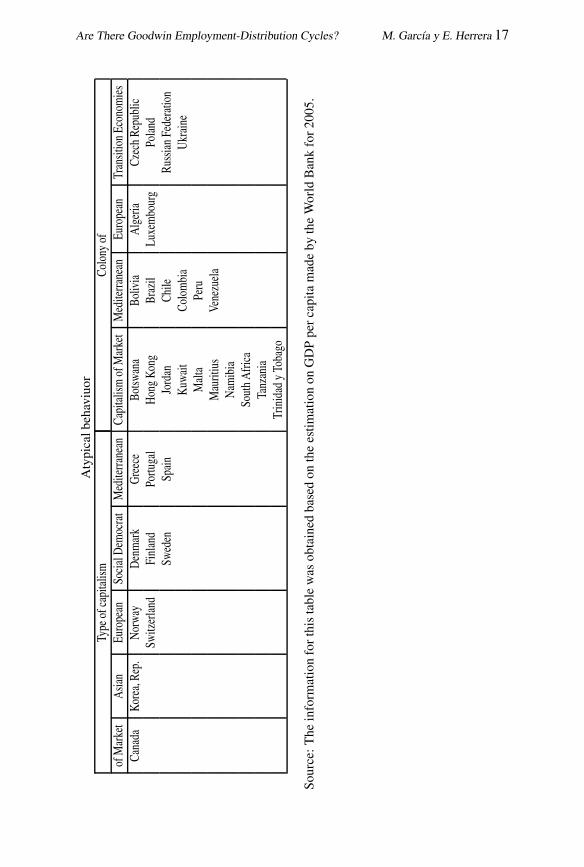
Still, developed and developing countries were separated, as there are sever-al institutional differences. Finally, former socialist countries were groupedas transition economies. This leads to a classification of eleven groups (seetable 3 and appendix 2).
Note that, regardless of their degree of development, countries with mar-ket or European capitalism, as well as transition economies, do not tendto have demand cycles: they are either Goodwin or atypical. In contrast,developing countries with a Mediterranean capitalism do not tend to haveGoodwin cycles: they are either demand or atypical. In other cases, such asSocial Democrat, Asian, others, and developed Mediterranean capitalism(see appendix 2), there is no clear tendency.
CONCLUSIONS
Quantitative evidence does not strongly support Goodwin’s model, as thepredicted centres lie outside the actual circles. This may be caused by theparticular specification of the model, e.g. linear instead of non-linear realPhillips curve. Qualitative evidence is mixed. For the sample of 67 coun-tries, 26 have evidence of cycles similar to those predicted by Goodwin,9 have evidence of demand cycles and 32 were atypical. The diversity isnot readily related to the degree of development, and it was suggested thatexplaining this would require a better understanding of the different formsof capitalism in which countries evolved around the world.
16 Cuadernos de Economía, 29(53), 2010
TAB
LE
3TY
PEO
FC
YC
LE
VS.
KIN
DO
FC
API
TALIS
M
Goo
dwin
Type
ofca
pita
lism
Colo
nyof
ofM
arke
tA
sian
Euro
pean
Soci
alD
emoc
rat
Med
iterra
nean
Capi
talis
mof
Mar
ket
Med
iterra
nean
Euro
pean
Tran
sitio
nEc
onom
ies
Oth
ers
Aus
tralia
Japa
nA
ustri
aIta
lyBa
hrai
nPa
nam
aTu
nisia
Esto
nia
Thai
land
Uni
ted
Kin
gdom
Belg
ium
Indi
aK
azak
hsta
nU
nite
dSt
ates
Fran
ceJa
mai
caK
yrgy
zRep
ublic
Ger
man
yK
enya
Mol
dova
Irela
ndN
ewZe
alan
dSl
ovak
Repu
blic
Net
herla
nds
SriL
anka
Dem
and
Type
ofca
pita
lism
Col
ony
ofof
Mar
ket
Asi
anEu
rope
anSo
cial
Dem
ocra
tM
edite
rran
ean
Soci
alD
emoc
rat
Med
iterr
anea
nO
ther
sTr
ansi
tion
Econ
omie
sIc
elan
dC
osta
Ric
aTu
rkey
Arm
enia
Ecua
dor
Bel
arus
Hon
dura
sM
exic
oPa
ragu
ay
Are There Goodwin Employment-Distribution Cycles? M. García y E. Herrera 17
Aty
pica
lbeh
aviu
orTy
peof
capi
talis
mCo
lony
ofof
Mar
ket
Asia
nEu
rope
anSo
cial
Dem
ocra
tM
edite
rrane
anCa
pita
lism
ofM
arke
tM
edite
rrane
anEu
rope
anTr
ansit
ion
Econ
omie
sCa
nada
Kore
a,Re
p.N
orw
ayD
enm
ark
Gre
ece
Botsw
ana
Boliv
iaA
lger
iaCz
ech
Repu
blic
Switz
erla
ndFi
nlan
dPo
rtuga
lH
ong
Kong
Braz
ilLu
xem
bour
gPo
land
Swed
enSp
ain
Jord
anCh
ileRu
ssia
nFe
dera
tion
Kuw
ait
Colo
mbi
aU
krai
neM
alta
Peru
Mau
ritiu
sVe
nezu
ela
Nam
ibia
Sout
hA
frica
Tanz
ania
Trin
idad
yTo
bago
Sour
ce:The
info
rmat
ion
forth
ista
ble
was
obta
ined
base
don
the
estim
atio
non
GD
Ppe
rca
pita
mad
eby
the
Wor
ldB
ank
for20
05.
18 Cuadernos de Economía, 29(53), 2010
Goodwin cycles seem to be more a feature of countries with market or Eu-ropean capitalism, as well as of transition economies, while demand cyclestend to appear more in developing countries with a Mediterranean capital-ism. Further studies should delve more into how the institutions typical ofeach kind of economy affect its dynamics. This would allow the buildingof more specific models that explain cycles in each kind of country. It ishighly plausible that, once these factors are taken into account, Goodwin’smodel will prove to be an important part of the explanation, at least forsome of the countries.
Finally, it should be noted that looking for evidence in the case of a highlystylised model such as that of Goodwin should not be interpreted in thestandard Popperian way. Not finding a cycle in a particular case is notnecessarily a proof that the model does not hold. Rather, the objectiveof collecting the evidence is to provide stylised facts that can feed or beexplained by further developments of a still abstract model. In this sense,looking at the actual data helps to suggest questions and avenues for futureresearch and development.
REFERENCES
[1] Abraham, K. and Haltiwanger, J. (1995). Real wages and the business cycle.Journal of Economic Literature, 33(3), 1215-1265.
[2] Acemoglu, D., Johnson, S. and Robinson, J. A. (2001). The colonial originsof comparative development: an empirical investigation. American Economic Re-view, 91(5), 1369-1401.
[3] Amable, B. (2005). Le cinq capitalismes: diversité des systèmes économiqueset sociaux dans la mondialisation. Paris: Editions du Seuil.
[4] Arrighi, G. (1978). La geometría dell’imperialismo. Milano: GiangiacomoFeltrinelli Editore.
[5] Atkinson, A.B. (1969). The timescale of economic models: how long is thelong run? The Review of Economic Studies, 36(2), 137-152.
[6] Barbosa-Filho, Nelson H. and Taylor, L. (2006). Distributive and demandcycles in the US economy-a structuralist Goodwin model. Metroeconomica, 57(3),389-411.
[7] Bhaduri, A. (1969). On the significance of recent controversies on capitaltheory: A Marxian view. Economic Journal, 79(315), 532-539.
[8] Bhaduri A. and Marglin S. (1990), Unemployment and the real wage : the eco-nomic bases for contesting political ideologies. Cambridge Journal of Economics,14(4), 375-393.
[9] Canry, N. (2005) Wage-led regime, profit-led regime and cycles: a model.Economie Appliquée, 8(1), 143-163.
Are There Goodwin Employment-Distribution Cycles? M. García y E. Herrera 19
[10] Desai, M., Goodwin, R.M., Kruger, M. and Vercelli, A. (1984). NonlinearModels of Fluctuations and Growth, an international symposium, Siena, Italy, 24-27, March 1983. Berlin, New York: Springer-Verlag.
[11] Desai, M., Henry, B., Mosley, A. and Pemberton, M. (2004). A Clarificationof the Goodwin Model of The Growth Cycle. Journal of Economic Dynamics andControl, 30(12), 2661-2670.
[12] Dibeh, G., Luchinsky, D. G., Luchinskaya, D.D. and Smeliansky, V.N. (2007).A Bayesian estimation of a stochastic predator-prey model of economic fluctua-tions. In Kertész, J. Bornholdt, S. Mantegna, R.N. (eds) Noise and Stochastics inComplex Systems and Finance. Proceedings of SPIE, paper 6601-41.
[13] Duménil G. and Lévy D. (1999). Being Keynesian in the Short Term andClassical in the Long Term: The Traverse to Classical Long-Term Equilibrium.The Manchester School, 67(6), 684-716.
[14] Entov, R.M. and Poletayev, A.V. (1987). On the long-term dynamics of therate of return. In Vasko, T (ed). The Long-Wave Debate (pp. 105-118). New York:Springer Verlag.
[15] Flaschel, P. and Groh, G. (1995). The classical growth cycle: reformulation,simulation and some facts. Economic Notes, 24, 293-326.
[16] Garegnani, P. (1970). Heterogeneous capital, the production function and thetheory of distribution. Review of Economic Studies, 37(3), 407-436.
[17] Goodwin, R.M. (1967). A growth cycle. In Feinstein, C.H. (ed.) Socialism,Capitalism and Economic Growth (pp. 54-58). Cambridge: Cambridge UniversityPress.
[18] Goodwin, R.M. (1972). A growth cycle. In Hunt, E.K. and Schwartz, J.G.(eds.) A Critique of Economic Theory (pp. 442-449). Harmondsworth: Penguin.
[19] Goodwin, R.M. (1984). Disaggregating models of fluctuating growth. InGoodwin, R.M., Krüger, M. and Vercelli, A. (eds.) Nonlinear models of fluctuatinggrowth (pp. 67-72). Berlin: Springer.
[20] Goodwin, R.M. (1987). The economy as an evolutionary pulsator. In Vasko,T (ed.) The Long-Wave Debate (pp. 27-34). New York: Springer Verlag.
[21] Harcourt, G.C. (1972). Some Cambridge Controversies in the Theory of Cap-ital. Cambridge: Cambridge University Press.
[22] Harvie, D. (2000). Testing Goodwin: growth cycles in ten OECD countries.Cambridge Journal of Economics, 24(3), 349-376.
[23] Kondratieff, N.D. and Stolper, W.F. (1935). The long waves in economic life.Review of Economic and Statistics, 17(6), 105-115.
[24] La Porta, R., Lopez de Silanes, F., Shleifer, A. and Vishny, R. (1999). Corpo-rate ownership around the world. Journal of Political Economy, 54(2), 471-518.
[25] Moreno, A. M. (2002). El Modelo de Ciclo y Crecimiento de Richard Good-win. Una evaluación empírica para Colombia. Cuadernos de Economía, 21(37),1-20.
20 Cuadernos de Economía, 29(53), 2010
[26] Schumpeter, J.A. (1954). History of Economic Analysis. London, GeorgeAllen & Unwin.
[27] Solomou, S. (1987). Phases of Economic Growth, 1850-1973; KondratieffWaves and Kuznets Swings. Cambridge: Cambridge University Press.
[28] Solow, R. (1990). Goodwin’s Growth Cycle: Reminiscence and Rumination,publicado. In Velupillai, K. (ed). Nonlinear Multisectoral Macrodynamics (pp.31-41). London: McMillan.
[29] Sterman, J. D. (1987). The economic long wave: theory and evidence. InVasko, T (ed). The Long-Wave Debate (pp. 127-161). London: Springer Verlag.
[30] Velupillai, K. V. (1998). Richard Goodwin (1919-1996). The Economic Jour-nal, 108(450), 1436-1449.
[31] Veneziani, R. and Mohun, S. (2006). Structural stability and Goodwin’sgrowth cycle. Structural Change and Economic Dynamics, 17(4), 437-451.
[32] World Bank (2008). Global Purchasing Power Parities and Real Expendi-tures. 2005 International Comparison Program. Washington: International Bankof Reconstruction and Development / The World Bank.
[33] Zarnowitz, V. (1985). Recent work on business cycles in historical perspec-tive: A review of theories and evidence. Journal of Economic Literature, 23(2),523-580.
APPENDIX 1.ECONOMETRIC ESTIMATION
For the econometric estimation we follow Harvie’s methodology for all variablesof the model. In addition the state variables, i.e. u, v were passed trough theHodrick - Prescott Filter in order to release the tendency. For the productivitygrowth, labor force growth and the Phillips curve estimation the parameters wereestimate using ordinary least square (OLS) regressions. For countries with morethan 17 data observations, we ran a unit root test and a cointegration test
Parameter estimation
Productivity growth α
An exponential productivity growth function a = a0eαt is assumed, where α is the
constant growth rate. The value of α is estimated for each country using OrdinaryLeast Squares (OLS) from the following equation
lnat = lna0 + at + ε1t
Are There Goodwin Employment-Distribution Cycles? M. García y E. Herrera 21
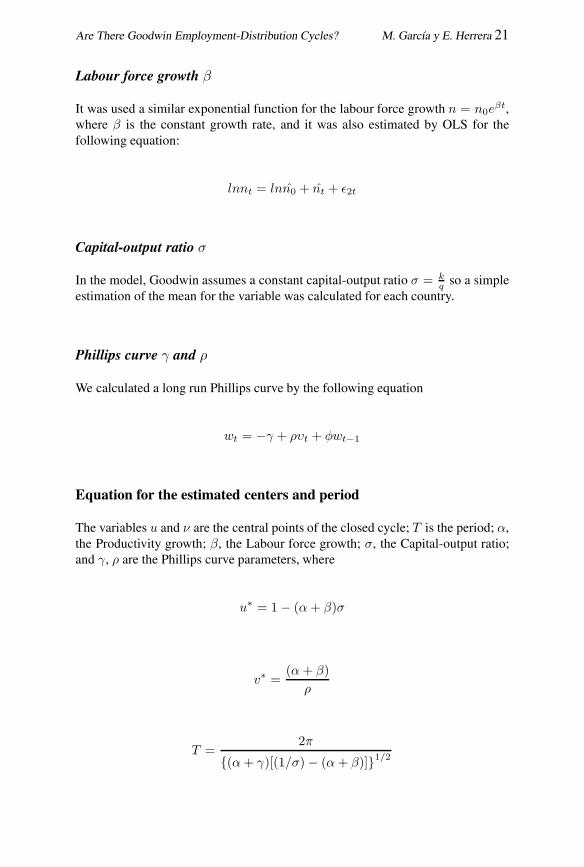
Labour force growth β
It was used a similar exponential function for the labour force growth n = n0eβt,
where β is the constant growth rate, and it was also estimated by OLS for thefollowing equation:
lnnt = lnn0 + nt + ε2t
Capital-output ratio σ
In the model, Goodwin assumes a constant capital-output ratio σ = kq so a simple
estimation of the mean for the variable was calculated for each country.
Phillips curve γ and ρ
We calculated a long run Phillips curve by the following equation
wt = −γ + ρυt + φwt−1
Equation for the estimated centers and period
The variables u and ν are the central points of the closed cycle; T is the period; α,the Productivity growth; β, the Labour force growth; σ, the Capital-output ratio;and γ, ρ are the Phillips curve parameters, where
u∗ = 1− (α+ β)σ
v∗ =(α + β)
ρ
T =2π
{(α+ γ)[(1/σ)− (α+ β)]}1/2
22 Cuadernos de Economía, 29(53), 2010
APPENDIX 2.GRAPHICS BY TYPE OF CYCLE
GOODWIN CYCLES
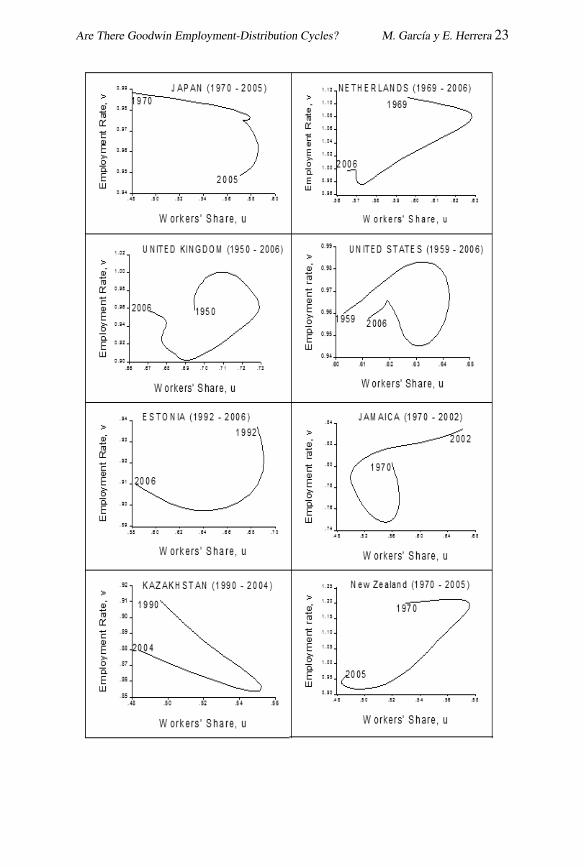
Are There Goodwin Employment-Distribution Cycles? M. García y E. Herrera 23

24 Cuadernos de Economía, 29(53), 2010
Source: own estimations.
Are There Goodwin Employment-Distribution Cycles? M. García y E. Herrera 25
DEMAND CYCLES
Source: own estimations.
26 Cuadernos de Economía, 29(53), 2010
ATYPICAL BEHAVIOUR
Are There Goodwin Employment-Distribution Cycles? M. García y E. Herrera 27
28 Cuadernos de Economía, 29(53), 2010
Are There Goodwin Employment-Distribution Cycles? M. García y E. Herrera 29
Source: own estimations.