
Bank service quality: empirical evidence from Greek and Bulgarian retail customers
91
International Journal of Quality & Reliability Management Volume 24 , Issue 6 , pp. 568-657 , 2007 Articles Bank service quality: empirical evidence from Greek and Bulgarian retail customers Eugenia Petridou, Charalambos Spathis, Niki Glaveli, Chris Liassides (pp. 568-585) Keywords: Banks , Bulgaria , Customers , Greece , Quality management , Service quality assurance A study of measures to improve constructability Franky W.H. Wong, Patrick T.I. Lam, Edwin H.W. Chan, L.Y. Shen (pp. 586-601) Keywords: Construction industry , Design , Project evaluation , Quality improvement Dynamic robust design with missing data Hsu-Hwa Chang (pp. 602-616) Keywords: Data analysis , Design for quality Total quality management and performance: The role of organization support and co-worker support Therese A. Joiner (pp. 617-627) Keywords: Organizational performance , Performance management , Total quality management Simulation based reliability evaluation of AC power supply system of Indian Nuclear Power Plant K. Durga Rao, H.S. Kushwaha, A.K. Verma, A. Srividya (pp. 628-642) Keywords: India , Markov processes , Monte Carlo simulation , Nuclear energy industry , Probabilistic analysis Availability allocation through importance measures Javad Barabady, Uday Kumar (pp. 643-657) Keywords: Mean time between failures , Mean time to repair
-
Upload
independent -
Category
Documents
-
view
1 -
download
0
Transcript of Bank service quality: empirical evidence from Greek and Bulgarian retail customers

International Journal of Quality & Reliability Management
Volume 24 , Issue 6 , pp. 568-657 , 2007
Articles Bank service quality: empirical evidence from Greek and Bulgarian retail customers Eugenia Petridou, Charalambos Spathis, Niki Glaveli, Chris Liassides (pp. 568-585) Keywords: Banks, Bulgaria, Customers, Greece, Quality management, Service quality assurance A study of measures to improve constructability Franky W.H. Wong, Patrick T.I. Lam, Edwin H.W. Chan, L.Y. Shen (pp. 586-601) Keywords: Construction industry, Design, Project evaluation, Quality improvement Dynamic robust design with missing data Hsu-Hwa Chang (pp. 602-616) Keywords: Data analysis, Design for quality Total quality management and performance: The role of organization support and co-worker support Therese A. Joiner (pp. 617-627) Keywords: Organizational performance, Performance management, Total quality management Simulation based reliability evaluation of AC power supply system of Indian Nuclear Power Plant K. Durga Rao, H.S. Kushwaha, A.K. Verma, A. Srividya (pp. 628-642) Keywords: India, Markov processes, Monte Carlo simulation, Nuclear energy industry, Probabilistic analysis Availability allocation through importance measures Javad Barabady, Uday Kumar (pp. 643-657) Keywords: Mean time between failures, Mean time to repair

Bank service quality: empiricalevidence from Greek andBulgarian retail customers
Eugenia Petridou, Charalambos Spathis and Niki GlaveliDepartment of Economics, Division of Business Administration,Aristotle University of Thessaloniki, Thessaloniki, Greece, and
Chris LiassidesCity Liberal Studies, Thessaloniki, Greece
(Affiliated Institution of the University of Sheffield, UK)
Abstract
Purpose – Despite the rapid growth and internationalisation of the services sector, particularlyfinancial services, managers today realize that to successfully leverage service quality as a globalcompetitive tool, they first need to correctly identify the antecedents of what the internationalconsumer perceives as service quality. This paper aims to assess and compare the level of bank servicequality provided in Greece and Bulgaria and to identify the dimensions of quality service in the twocountries.
Design/methodology/approach – In 2000 Bahia and Nantel proposed a specific scale, the BSQ,(Bank Service Quality) for measuring perceived service quality in retail banking consisting of sixdimensions: effectiveness and assurance; access; price; tangibles; service portfolio; and reliability. Thistool was used for the collection of data related to the banking services provided in the two countries(Greece and Bulgaria). Statistical methods, such as the t-test, chi-square, Cronbach’s-alpha and factoranalysis, were then employed to answer the research questions.
Findings – The results suggest that the Greek customers’ perception was that they received higherquality services compared to the perception of the Bulgarian clients. Differences between the countrieswere also reported regarding the dimensionality of quality service.
Practical implications – The results have significant implications for banks in developingoperational, marketing and human resource strategies in the two countries.
Originality/value – Greece and Bulgaria – two countries with different economic, political andsocio-cultural backgrounds – give the opportunity for cross-country research in the area of servicequality, an area where research is not very mature.
Keywords Service quality assurance, Banks, Customers, Quality management, Greece, Bulgaria
Paper type Research paper
IntroductionDomestic or international service firm managers are aware that service quality inbanking is a route to competitive advantage and corporate profitability. Moreprecisely, quality superiority has been found to provide significant performancerelated advantages such as customer loyalty, responsiveness to demand, market sharegrowth and productivity (Berry et al., 1985; Capon et al., 1990; Berry and Parasuraman,
The current issue and full text archive of this journal is available at
www.emeraldinsight.com/0265-671X.htm
The authors wish to thank the Editor and the anonymous reviewers of the International Journalof Quality & Reliability Management for their constructive and insightful comments.
IJQRM24,6
568
Received September 2005Revised February 2006Accepted May 2006
International Journal of Quality &Reliability ManagementVol. 24 No. 6, 2007pp. 568-585q Emerald Group Publishing Limited0265-671XDOI 10.1108/02656710710757772
1991; Anderson et al., 1994; Rust et al., 1994; Barnes and Cumby, 1995; Lassar et al.,2000; Roberts et al., 2003; Jabnoun and Al-Tamimi, 2003). Bank service quality iscommonly noted as a critical prerequisite for satisfying and retaining valuedcustomers (Taylor and Baker, 1994). Thus, service managers realise that tosuccessfully leverage service quality as a competitive edge, they first need to correctlyidentify the antecedents of what the consumer perceives as service “quality”.
Service encounters are first and foremast social encounters, thus rules andexpectation related to them vary considerably across countries (Malhotra et al., 2005).Consumers of services in different countries are expected to have different perceptionsof what service quality is, due to diversities that exist in terms of economicdevelopment level and political and socio-cultural system (Furrer et al., 2000;Witkowski and Wolfinbarger, 2000).
Despite the rapidly growing activity of trading and investment in services it isacknowledged that the area is relative new in terms of research especially in theinternational context (Axinn and Matthyssens, 2002). Greece and Bulgaria are twocountries with different economic, political and socio-cultural backgrounds, thus givethe opportunity for cross – country research particularly in the area of service quality.Indeed, cross-country research in the service quality literature, would be of interest toacademics, researchers and practitioners, since due to the historical emphasis that hasbeen placed on domestic issues, it is not very mature (Malhotra et al., 2005).
Cross-country research between Greece and Bulgaria, particularly in the area ofbank service quality would be of even greater interest. Bulgaria is a future full memberstate of the EU and a fast growing market that has attracted the interest of manyforeign investors. That is particularly true for Greek investors who due to marketproximity, the close economic relationships between the two countries and the intenseactivity in the internal banking market during the last few years, have seen Bulgaria asan opportunity for market development. The Bulgarian market has provided boththem and other foreign banks with numerous development opportunities. In addition,the increasing competition, as in the case of Greece and other countries in Europe andAmerica, is expected to enhance emphasis on service quality in the Bulgarian bankingsector.
Based on the above it is quite obvious that, understanding customers perceptions ofthe level of bank service quality provided, as well as and nature (dimensionality) ofservice quality in the two counties, is vital to local and international bank managers.Taking into account the impact of environmental diversity they would be able tosuccessfully develop operational, marketing and Human Resource Managementstrategies and build sustainable competitive advantage through quality and improvedcustomer relationship, in Greece and Bulgaria. To the best of our knowledge noresearch comparing two Balkan countries or analysing service quality in the Bulgarianbank context has been reported or published yet.
The purpose of the present paper is twofold. First, to assess and compare the level ofthe bank service quality provided in Greece and Bulgaria based on the qualityperceptions of retail bank customers. Second, to identify the dimensions of qualityservice in the two countries. The BSQ instrument (Bank Service Quality scale,developed by Bahia and Nantel in, 2000) was used for measuring quality perceptions inthe two Balkan countries. This is intended to help banks assess and improve theirservice quality.
Bank servicequality
569

The paper is structured as follows. First, a literature review of service qualitymodels is presented. Second, the Greek and Bulgarian macro- environments and thespecific bank sectors are analysed. Third, the research questions and methodology arestated. Finally, the results are presented and discussed and conclusions are drawn.
Service qualityVarious models have been developed for measuring perceptions of service quality(Gronroos, 1983; 1990; Parasuraman et al., 1985; 1988;, 1991; Stafford, 1996; Bahia andNantel, 2000; Aldlaigan and Buttle, 2002). The SERVQUAL model of Parasuraman et al.(1988) proposes a five-dimensional construct of perceived service quality: tangibles;reliability; responsiveness; assurance; and empathy – with items reflecting bothexpectations and perceived performance. The SERVQUAL approach has not goneuncriticized however. There has been concern about the central role of expectationsand the significance of a subtractive “gap” as a measure of quality (Asubonteg et al.,1996; Buttle, 1996). More importantly, the universality of the SERVQUAL dimensionsacross different types of services has been questioned (Babakus and Mangold, 1989;Carman, 1990; Bresinger and Lambert, 1990; Finn and Lamb, 1991; Babakus andBoller, 1992). Carman (1990) for instance, found that it is often necessary to incorporateadditional items in certain dimensions because they are particularly important forsome service categories. A further critique of SERVQUAL concerns its emphasis onservice and product dimensions, and its neglect of other dimensions of the marketingmix – especially price (Gilmore and Carson, 1992).
Bahia and Nantel (2000) consequently developed a specific new scale for perceivedservice quality in retail banking. This Bank Service Quality (BSQ) model is anextension of the original 10 dimensions of the model of Parasuraman et al.(1985). Inaddition, Bahia and Nantel (2000) incorporated additional items such as courtesy andaccess, as proposed by Carman (1990), and items representing the marketing mix of the“7Ps” (product/service, place, process, participants, physical surroundings, price andpromotion) from the Boom and Bitner (1981) framework. After purification, the BSQwas left with 31 items of service quality relevant to the banking sector. These 31 itemswere distributed across six dimensions:
(1) Effectiveness and assurance: effectiveness refers to the effective delivery ofservice (particularly the friendliness and courtesy of employees) and the abilityof staff to inspire a feeling of security. Assurance concerns the staff’s ability toexhibit their communication skills and to deal confidentially with clients’requests.
(2) Access: assesses the speed of service delivery.
(3) Price: measures the cost of service delivery.
(4) Tangibles: assess the appearance and cleanliness of a bank’s physicalinfrastructure.
(5) Service portfolio: assesses the range, consistency, and innovation of the bank’sproducts.
(6) Reliability: measures the bank’s ability to deliver the service you have beenpromised accurately and without error.
IJQRM24,6
570

The resultant BSQ model was tested for its convergent, nomological, and discriminant(SERVQUAL vs BSQ) validity. Aldlaigan and Buttle (2002) have developed andvalidated a new 21-item scale that describes customers’ service quality perceptionscomprising four dimensions: service system quality, behavioural service quality,service transactional accuracy, and machine service quality.
In comparing BSQ with SERVQUAL, Bahia and Nantel (2000) argued that the mainadvantage of BSQ for banks is related to its content validity. For example, the servicesportfolio dimension and the price dimension of BSQ are absent from SERVQUAL. It isfor this reason (content validity) that the BSQ was chosen for use in the present study.Any concerns about using BSQ cross-culturally were eliminated, since otherresearchers have tested the BSQ in Greece in order to investigate the effect of thecustomers’ gender and of the bank’s status on quality perceptions (Spathis et al., 2001;2004) and the specific tool has proven to be valid and reliable.
The Greek and Bulgarian macro-environmentsDespite their proximity, the two countries in which the surveys were conductedportray a different political, economic and socio-cultural reality, which is believed toinfluence consumers’ expectations and perceptions concerning service quality. In thefollowing sections, a presentation of the external macro-environments of Greece andBulgaria is provided.
Political background and economic developmentGreece is a developed country with a mixed capitalist economy. The public sectoraccounts for about 40 per cent of the GDP and the GDP per capita ($21.529 in 2004) isapproximately 20 per cent below the EU25 average. The services sector ispredominant, accounting for an estimated 71.6 per cent of the GDP. During the last twoyears, the Greek economy has grown by about 4.0 per cent, largely due to theinvestment boom and infrastructure upgrading caused by the 2004 Athens OlympicGames.
Bulgaria is an ex-communist, lower middle-income (developing) country (its GDPper capita was $8,200 in 2004, around 70 per cent below the EU25 average) that wasdeclared a fully functioning market economy by the EU in 2003. In the same year, theGDP’s real growth averaged about 4-5 per cent a year, inflation was kept low (4.2 percent) and direct foreign investments amounted to 7 per cent of the GDP.
The socio-cultural environmentAlthough Hofstede’s cultural dimensions model has been criticised by relevantliterature (Baskerville, 2003; Hofstede, 2001), it is still extensively used. More precisely,Hofstede (1980) initially highlighted four criteria:
(1) Power distance: (the extent to which society honours the unequal distribution ofpower between institutions and organisations).
(2) Uncertainty avoidance: (the extent to which the members of a culture feelthreatened by ambiguous and unknown situations).
(3) Individualism/collectivism: (the extent to which society members have loose orclose connections, and whether they focus on taking care of themselves or of theextended family or group to which they belong).
Bank servicequality
571

(4) Masculinity/femininity: (refers to the way in which emotions may differaccording to gender: i.e. in a masculine society, men are supposed to beassertive, tough and focused on material success, while women are expected tovalue quality of life).
Latterly, (Hofstede and Bond, 1988) time (Confucian dynamism: short/long-termorientation: the extent to which people favour a pragmatic, future-oriented perspective– fostering virtues like perseverance and thrift – over short-term planning) was addedon as a fifth criterion.
According to the scores calculated for Greece and Bulgaria using Hofstede’s model(1991, 2001), Greece is characterized by strong uncertainty avoidance (ranked 1st out ofthe 52 countries included in the 1991 sample), extensive power distance, and is acollectivist and masculine society. Bulgaria obtained quite a high score in terms ofuncertainty avoidance and can be considered as being a collectivist and femininesociety, with a medium power distance.
Banking sector’s developmentBoth the Greek and Bulgarian banking systems went through a transitional phaseduring different time periods (ten-year difference). However, the pace, extent and styleof their development paths differ, due to diversities that exist between the twocountries as far as their political, economic and socio-cultural backgrounds (capitalismvs communism) are concerned.
More precisely, until the mid 1980s, the Greek banking system was heavilyregulated in all areas of activity. The price regulation and various credit controlsimposed by the government created a system in which competition was virtuallyunknown. A more competitive banking environment has gradually been achievedthrough the deregulation of interest rates, the abolition of various credit controls, thedevelopment of the capital market, the competition from other financial institutions,the free movement of capital flows, and the entry of banking institutions from otherEuropean countries into the Greek market (Noulas and Glaveli, 2002; Spathis et al.,2002; Petridou and Glaveli, 2003).
In addition, the introduction of the Euro resulted in a decrease of margins andrevenues for banks (Kosmidou and Spathis, 2000). Takeovers, mergers andacquisitions have been the response to these developments, in an attempt tocounterbalance competition and traditional revenue loss through: consolidation of theirmarket position, diversification on the basis of customer characteristics, increase ofcapital base and economies of scale and scope, which have resulted in benefits for boththe organizations and customers (Davies, 1995; Moshos and Fraggetis, 1997).
The compression of profits stimulated a positive outlook towards managing risksand returns, tracing new profit centres, offering more customized services andproducts and re-orientating the banking strategy towards quality service provision(Noulas and Glaveli, 2002). The sector’s current status is the result of theabove-mentioned wave of mergers and acquisitions. The new environment hasattracted a large number of foreign banks into this dynamic sector. Currently, there are24 domestic banks operating in Greece and about the same number of foreignbranches, 15 cooperative banks, and 2 credit institutions, i.e. the Postal Savings Bank
IJQRM24,6
572
and the Deposits and Loan Foundation. The market is highly competitive, despite therelatively high concentration of the banking sector.
In the case of Bulgaria, the changes to the economic system in 1989/90 led to thedisappearance of the monopolistic banking set-up that had existed until that time.However, unlike other central European States, this initial turnaround in Bulgaria wasrather half-hearted. The power brokers of the old regime retained their clout even in thenew scenario, while the subsidies required for the reform resulted in a steadily growingbudget deficit and caused problems for both the state-owned and private banks.Privatisation and liberalisation made only slow progress and the emerging newbanking system was extremely inefficient (Stubos and Tsikripis, 2004).
After 1997 however, the situation changed. According to the EBRD (2003)(European Bank for Regional Development) Index of Banking System Reform,Bulgaria was classified at 3.3/4 in 2003. A classification of around 3 means that “therehas been progress in the establishment of bank solvency and of a framework forprudential supervision and regulation, while there is significant lending to privateenterprises and a significant presence of private banks”. In 2003, profitability in termsof ROA (2.0 per cent) and ROE (18.4 per cent) had increased compared to 1998 (whenROA was 1.7 per cent and ROE 15.8 per cent) and had exceeded the correspondingfigures for the average large EU banks (0.4 per cent and 11.4 per cent accordingly) in2004 (EBRD, 2003). In addition, the privatisation process has also proceeded quitesuccessfully (in 2002 the asset share owned by state banks was 14.1 per cent, comparedto 56.4 per cent in 1998) (EBRD, 2003).
This successful turn in events was the result of the reforms that followed the 1997financial crisis, and involved the implementation of economic adjustment, surveillanceand stability programs. It was a crisis that triggered the collapse of the banking systemand led to a broader economic and social upheaval. The above-mentioned reforms, incombination with the involvement of foreign banks, led to the creation of theappropriate climate for the efficient and effective operation of banks, which hasaccelerated the process of maturity of the Bulgarian banking industry and increaseddepositors’ confidence (Hackethal et al., 2003). The improved economic indicators,rising trust in the banking system, expected EU accession, potential adoption of theEuro and increasing level of competition are also expected to place additional emphasison service quality in the Bulgarian banking system. According to the internationalpicture, the next step Bulgarian banks should take must be in the direction of servicequality.
In 2003, 35 banks were operating in Bulgaria. Of these, 27 were foreign banks,which owned 85.9 per cent of the total banking assets. Foreign banks usually enter themarket either by acquiring local banks or by establishing subsidiaries and branches.Their declared strategic objectives are, virtually in every case, to transfer the parentbank’s know-how into the new country with the purpose of profitably expanding anddiversifying their business portfolio. Most foreign banks so far, have been primarilycatering for the needs of large domestic and foreign companies and for a still limitedsegment of wealthy local private clients (Stubos and Tsikripis, 2004). The entry offoreign banks into Bulgaria has played an important role. On the one hand, they haveintroduced modern risk management techniques and financial management know-howand, on the other hand, they have ensured a high level of competition in banking,
Bank servicequality
573

despite the relatively high concentration of the banking sector (3 banks own 43 per centof the total banking assets) (Hackethal et al., 2003).
MethodologyResearch questionsThis paper assesses and compares the perceived level of bank service quality in Greeceand Bulgaria and investigates the dimensions of quality banking service in the twocountries. This will help banks in the two countries to assess and improve their servicequality provided to retail bank customers. This study intends to answer the followingresearch questions (RQs):
RQ1. What is the perceived level of service quality provided to retail bankcustomers in Greece and Bulgaria?
RQ2. Are there differences between the quality perceptions of Greek and Bulgarianretail bank customers?
RQ2. What are the dimensions of quality banking service in Greece and Bulgaria?
To answer the first two research questions the means of the BSQ items were calculatedand t-tested, in order to analyse the significance of the means of each item of the BSQinstrument by country. To answer the third question factor analysis was applied (onefor the Greek sample and another for the Bulgarian sample) to test and evaluate thescale of measurement for quality perspectives and to group the characteristics into asmaller number of principal factors. Reliability for each dimension was tested using theCronbach coefficient alpha (Hair et al., 1992; Zikmund, 1994).
Data collection and research instrumentIn order to obtain the relevant answers to the RQs, two surveys were conducted(country-based research), one in Greece and one in Bulgaria. Using the same tool (BSQ),which was translated into Greek and Bulgarian, questionnaires were collected from 153Greek and 70 Bulgarian retail customers of both private and public banks. Due to thedifferent population size (around 11 million people living in Greece and 8 million inBulgaria), the interviewers were asked to randomly approach 350 customers in Greeceand 200 in Bulgaria at a bank where they had just completed a transaction (the responserate was 43.7 per cent and 35.0 per cent respectively). “Intercept interviews” were initiallyconducted. The interviewers and respondents were native speakers in both the pilot andthe actual study. A pre-tested prompt was used to ensure consistency in the enquiry. Allquestions were closed (rather than being open-ended). After a pilot study with aconvenience sample of 15 Greek and 8 Bulgarian respondents, the tool was slightlyamended. The corrections mainly concerned the phrasing of the questions in Bulgarian.The data collection was carried out over a period of 30 days at different times andlocations, with a view to sampling a wide range of customers.
The questionnaires consisted of two parts. The first part contained the 30 itemsfrom the original BSQ model (Bahia and Nantel, 2000). In measuring perceptions ofquality service received, respondents were asked to indicate the degree to which theirbank satisfied the described requirement. Survey respondents were asked to rate eachitem on a Likert-type scale by assigning a value of 1 ( ¼ “strongly disagree”) to7 ( ¼ “strongly agree”), as proposed by Bahia and Nantel (2000). The second part
IJQRM24,6
574

aimed at building a demographic profile of the customer sample in terms of gender,age, profession, income, and the duration of their relation with the bank. Chi-squareanalysis was applied to demographic characteristics of the two samples to investigatethe relationship between country and customer characteristics.
Results and analysisDemographicsTable I presents the sample distribution for the Greek and Bulgarian clients, in relationto the ownership status of the bank, the customers’ gender, age, income and
All(n ¼ 223)
Greece(n ¼ 153)
Bulgaria(n ¼ 70) Chi-square d.f.
Sig.(2-sided)
1. Bank status 27.322 1 0.000Private 162 95 67Public 61 58 3
2. Gender 1.865 1 0.172Male 117 85 32Female 106 68 38
3. Customer’s age 0.944 5 0.96718-24 years 38 27 1125-34 45 32 1335-44 56 37 1945-54 49 33 1655-65 19 14 5. 65 16 10 6
4. Customer’s income (monthly in Euro) 63.787 4 0.000No income 34 30 4, 300 31 5 26301-1000 82 50 321001-1500 47 40 7. 1501 28 27 1
5. Customer’s occupation 29.876 8 0.000Employee 77 45 32Self-employed 44 36 8Retired 23 16 7Student 28 20 8Housewife 12 12 0Sole trader 14 13 1SME owner 15 5 10Civil servant 8 6 2Other 2 0 2
6. Duration of relationship with bank 10.369 5 0.065. 5 years 71 58 133-5 years 65 42 232 years 53 32 211 year 30 19 116 months 1 1 03 months 3 1 2
Table I.Bank customers’
characteristics accordingto country
Bank servicequality
575

occupation, and the duration of their relation with the bank. From the chi-square test, itis obvious that not all customer characteristics are related to their country of origin at astatistically significant level (p , 0:05).
Differences in the sample existed related to the occupational, income and bankstatus profile. These differences were expected, since as analysed in previous sectionthe economic, political and socio-cultural environments as well as the bank sectorspecific environment differ between the two countries. As a result the demographicprofiles of Greek and Bulgarians in terms of income, occupation and the status of thebank they choose to deal with, are expected to differ too.
More precisely, Greeks appear (on average) to earn a much higher income thanBulgarians (this is verified by the fact that Greek GDP per capita was almost threetimes higher than the Bulgarian one in 2004). Furthermore, more Greeks areself-employed/sole traders or SME owners (35.8 per cent of Greeks compared to 27.35per cent of Bulgarians). This might be due to the political system backgrounds. Inaddition, the fact that only 4.2 per cent of the Bulgarian respondents are customers ofpublic banks – while the corresponding percentage for Greeks is 37.9 per cent fits tothe industry profiles of the two countries (private banks in 2002 owned 86 per cent ofasset shares, while in Greece the 51 per cent).
The sample characteristics, which mirror the macro-environment and sectordiversity that exists between the two countries, could be used during the analysis ofthe results as possible causes of the differences that have been identified. Occupations,income, bank status per se, are significant factors in perceptions of service quality(Stafford, 1996).
Perceptions of quality service (RQ1 and RQ2)As seen in Table II, all items, for the Greek sample, had means higher than four (out ofseven). This indicates that Greek bank customers perceived receiving a high level ofservice quality. This is not the case for Bulgarians, since 22 (out of 30) items had meanslower than three (out of seven).
According to Table II again, it seems that Greeks and Bulgarians had differentperception of receiving service quality (the level of significance was 0.000 for 26 of the30 questions). More precisely, Greek clients perceived receiving a higher level ofquality than did Bulgarians.
Several reasons could be advanced to explain the above findings. In general, Greekbanks are engaged in non-price competition and have emphasised and invested inservice quality, due to deregulation and market liberalisation, longer ago thanBulgarian Banks. As described in details before, in Greece the compression of profits(due to the EU imposed liberalisation) stimulated a positive outlook towards offeringmore customised services and products and re-orientated the banking strategytowards quality service provision. In Bulgaria on the other hand, the monopolisticbanking set-up that existed until 1990, was re-placed by an inefficient system with alow competition and high corruption system, which collapsed (in 1997) resulting in lowdepositors’ confidence and poor service quality.
Furthermore, the Greek financial system is due to economic and political reasonsmore developed and mature, than the Bulgarian one. Due to these situation customersof Greek banks are more familiar with the latest developments in banking (IT, new andinnovative products) and due to the increased competition, more demanding. Thus, the
IJQRM24,6
576

level of quality provided by Greek banks is expected to be higher. Of course during thelast couple of years, the entrance of many foreign banks in Bulgaria is rapidlychanging the picture in the Bulgarian banking sector.
Another possible explanation that could be given is found in the differentoccupational and income characteristics of Greeks and Bulgarians (which reflectthe different macro environments in the two countries), factors that are expected toaffect the perceptions of bank service quality (Stafford, 1996; Spathis et al., 2001).
The four items for which statistically significant differences (p , 0:10) in qualityperceptions between Greeks and Bulgarians were lower, refer to the effectiveness ofinterpersonal relations with the bank employees (recognition of a regular client
ItemsGreece
(n ¼ 153)Bulgaria(n ¼ 70) t-test p-value
Confidence 5.48 2.00 2 21.671 0.000Recognition of a regular client 5.05 4.33 -2.922 0.004Confidentiality 5.64 1.89 2 23.528 0.000Valorisation of the client by personnel 5.38 2.30 2 14.260 0.000Interruption of the service 5.36 3.70 2 7.530 0.000Well-trained personnel 5.41 2.06 2 18.912 0.000Knowledge of the client on a personal basis 5.00 4.49 -2.081 0.039No contradictions in decisions between personneland management
4.93 3.47 2 6.425 0.000
Delivering when promised 5.40 2.20 2 16.831 0.000Good reputation 5.70 2.06 2 17.931 0.000Feeling of security 5.74 1.81 2 24.130 0.000No delays due to bureaucratic factors and procedures 4.76 5.17 1.811 0.072Indications (communication) of quality 5.26 2.39 2 14.848 0.000Sufficient number of ATMs per branch 4.67 2.76 2 8.490 0.000Modern equipment 5.34 2.63 2 14.279 0.000Sufficient number of open tellers 4.45 3.09 2 5.237 0.000Waiting is not too long 4.36 4.84 1.848 0.066Queues that move rapidly 4.58 3.47 2 4.499 0.000The bank contacts me every time it is useful 4.88 2.53 2 9.415 0.000Good explanations of service fees 4.69 2.30 2 11.320 0.000Balance amount from which service charges begin 4.20 2.86 2 6.725 0.000Reasonable fees for administration of accounts 4.01 2.77 2 5.674 0.000Keeping the client informed every time that a bettersolution appears for a problem
4.70 2.54 2 9.089 0.000
Precision of account statements 5.97 1.83 2 24.187 0.000Cleanliness of facilities 6.23 2.37 2 24.489 0.000Decoration of facilities 5.65 2.57 2 15.107 0.000Complete range of services 5.35 2.57 2 15.144 0.000Range of services consistent with the latestinnovations in banking services
5.14 2.63 2 12.905 0.000
Absence of errors in service delivery 5.28 2.11 2 17.007 0.000Precision of filing systems 5.70 2.27 2 20.188 0.000
Notes: Scale: 1 ( ¼ “strongly disagree”) to 7 ( ¼ “strongly agree”); results in italic indicatesignificant at p , 0.000
Table II.Bank service quality
means score and t-tests ofcustomers’ country
Bank servicequality
577

p ¼ 0:004, knowledge of the client on a personal basis p ¼ 0:039) and to waiting time(waiting is not too long p ¼ 0:066 and no delays due to bureaucratic factors p ¼ 0:072).
The lower statistically significant differences referring to interpersonal relations areprobably resulting by the common cultural characteristics of Greece and Bulgariarelating to both being collectivist societies resulting to close connections and warmrelationships between society members (Hofstede, 1980; 2001). Moreover, regarding theitems “waiting is not too long” and “no delays due to bureaucratic factors”, Bulgariansconsider that the level of quality received is higher (see Table II). On the one hand, thismight be the case because previous research has identified bureaucracy and queuing,as the most problematic issues in the Greek banking industry (Spathis et al., 2001). Onthe other hand, someone might suggest that due to the former political situation,Bulgarians are more patients as far as waiting time is concerned (people used to queueon a daily basis to buy even the basics, like milk and bread).
Service quality dimensions (RQ3)To test the dimensionality of the BSQ instrument, all 30 items for each country werefactor analysed, separately, using principal component analysis with varimax rotation.The number of factors was unconstrained. The factor analysis of the Greek sample(Table III) identified six dimensions that explain 69.2 per cent of the total variance.This percentage considers quite sufficient (Hair et al., 1992). The six dimensions werethe following:
(1) effectiveness;
(2) assurance and service portfolio;
(3) reliability;
(4) access;
(5) price; and
(6) tangibles.
They were identified, by noting the items that had the higher loading.In the effectiveness factor (dimension 1) are included items that are connected to the
communication skills of the employees’ abilities that are important to provide thedesired customer service (Parasuraman et al., 1988; 1991). The assurance and serviceportfolio factor (dimension 2) consists of items related to indications of confidentiality.The reliability factor (dimension 3) includes six items mainly related to the ability todeliver the promised service accurately and without error. Items in the third dimension– reliability – were included items referring to personnel training, interruption ofservice, absence of errors and punctuality. For the fourth dimension (access) and thefifth dimension (price), the speed of service delivery and its cost were the principalitems. The sixth dimension was: tangibles. In this factor, two items cleanliness offacilities and no delays due to bureaucratic factors and procedures were included.
A point that must be stressed here is that many of the items found originally (Bahiaand Nantel, 2000) in the dimensions of “reliability and effectiveness” and “assurance”are combined in the “reliability” dimension. This combination appears to be naturalgiven the conceptual similarities between these dimensions and the fact that they areall affected by human skills and the ability of the human resources to perform acrossthese dimensions.
IJQRM24,6
578

With regard to the reliability of the scale measurements in relation to the variablescomposing each factor, the Cronbach alpha coefficients were calculated and were judged tobe satisfactory (between 0.915 and 0.769 besides the 6th dimension were alpha ¼ 0.471).The loading of the majority of most of the items was deemed satisfactory ( . 0.5).Coefficient alpha higher than 0.7 is considered to be good (Nunnaly, 1978).
Items LoadingPercentageof variance
Cronbachalpha
Dimension 1: effectiveness 14.540 0.915Knowledge of the client on a personnel basis 0.784Recognition of a regular client 0.783Keeping the client informed every time that a better solutionappears for a problem
0.682
The bank contacts me every time it is useful 0.669Valorisation of the client by personnel 0.627Good explanations of service fees 0.446
Dimension 2: assurance and service portfolio 13.475 0.847Confidentiality 0.653Modern equipment 0.634Range of services consistent with the latest innovations in bankingservices
0.632
Precision of account statements 0.608Good reputation 0.605Confidence 0.598Feeling of security 0.516No contradictions in decisions between personnel and management 0.421
Dimension 3: reliability 12.902 0.857Well-trained personnel 0.719Interruption of the service 0.687Absence of errors in service delivery 0.622Delivering when promised 0.581Complete range of services 0.495Precision of filing systems 0.452
Dimension 4: access 11.975 0.867Queues that move rapidly 0.808Sufficient number of open tellers 0.779Waiting is not too long 0.777Sufficient number of ATMs per branch 0.522Indications (communication) of quality 0.477
Dimension 5: price 9.152 0.769Balance amount from which service charges begin 0.781Reasonable fees for administration of accounts 0.781Decoration of facilities 0.548
Dimension 6: tangibles 7.150 0.471Cleanliness of facilities 0.650No delays due to bureaucratic factors and procedures 0.589
Notes: Extraction method: Principal Component Analysis; Rotation method: Varimax with KaiserNormalisation
Table III.Greek customers: factor
analysis of perceivedservice quality
Bank servicequality
579

The factor analysis of the Bulgarian sample (Table IV) identified five dimensionsthat explain 76.3 per cent of the total variance; this percentage appears to be high forqualitative research (Hair et al., 1992). The five dimensions were the following:
(1) tangibles, reliability and service portfolio;
(2) price and assurance;
Items LoadingPercentageof variance
Cronbach’salpha
Dimension 1: tangibles, reliability and service portfolio 31.176 0.964Cleanliness of facilities 0.848Decoration of facilities 0.845Modern equipment 0.832Absence of errors in service delivery 0.823Precision of account statements 0.819Feeling of security 0.763Range of services consistent with the latest innovations inbanking services
0.754
Complete range of services 0.751Well-trained personnel 0.740Good reputation 0.735Precision of filing systems 0.681Delivering when promised 0.644Confidence 0.626Indications (communication) of quality 0.618Sufficient number of ATMs per branch 0.539
Dimension 2: price and assurance 21.805 0.934The bank contacts me every time it is useful 0.863Reasonable fees for administration of accounts 0.849Balance amount from which service charges begin 0.814Keeping the client informed every time that a better solutionappears for a problem
0.797
Good explanations of service fees 0.753Confidentiality 0.657Valorisation of the client by personnel 0.652
Dimension 3: effectiveness 9.777 0.826Recognition of a regular client 0.886Knowledge of the client on a personnel basis 0.881Interruption of the service 0.727No delays due to bureaucratic factors and procedures 0.707
Dimension 4: access 8.384 0.692Queues that move rapidly 0.854Waiting is not too long 20.804Sufficient number of open tellers 0.546
Dimension 5: effectiveness (contradictions in decisions) 5.063 –No contradictions in decisions between personnel andmanagement
0.707
Notes: Extraction method: Principal Component Analysis; Rotation method: Varimax with KaiserNormalisation
Table IV.Bulgarian customers:factor analysis ofperceived service quality
IJQRM24,6
580

(3) effectiveness;
(4) access; and
(5) effectiveness (contradictions in decisions).
The five dimensions were again identified by the items that had the higher loadings.In the first factor tangibles, reliability and service portfolio (dimension 1) are
included items that are connected to the tangible elements of service quality, to theability to deliver the service accurately as well as to the range of products. Theprice and assurance factor (dimension 2) consists of seven items related to cost ofservice delivery and to indications of confidentiality. The third factor effectiveness(dimension 3) includes four items mainly related to the ability to deliver thepromised service accurately and without error. For the fourth dimension (access)and the fifth dimension (reliability), the speed of service delivery and the lack ofcontradictions between personnel and management respectively, were the items withthe higher loading.
It is interesting to note that the first factor consists of items from the “tangibles”,“reliability” and “service portfolio” dimensions of the original BSQ. This findingimplies that the tangible element of service and the offering of a complete andinnovative range of products are for Bulgarians indications of reliability. Probably aclean and well-decorated environment creates a positive image about the company thatinspires reliability, security and confidence.
With regard to the reliability of the scale measurements in relation to the variablescomposing each factor, the Cronbach alpha coefficients were calculated and werejudged to be satisfactory (between 0.964 and 0.692). The loading for all items wasdeemed satisfactory ( . 0.5). The value of alpha coefficients and the total percentage ofthe variance explained support, as in the case of Greeks customers, the validity andreliability of the instrument when used cross-nationally.
The fact that the quality dimensions found, were different across the two countriesand different from those of the original BSQ, adds to the dimensionality problems ofservice quality instruments across countries, as also suggested and in the case ofSERVQUAL by i.e. Babakus and Boller(1992), Cronin and Taylor (1992) and Jabnounand Al-Tamimi(2003). Despite the different dimension resulting by factor analysis, theinstrument itself (BSQ) appears to be a valid and reliable measure of bank servicequality in both countries.
ConclusionThis paper measured and compared the level of service quality received by retail bankcustomers in Greece and Bulgaria. Further, it identified the dimensions of qualityservice in the two countries by testing the BSQ instrument in each country.
The results suggest that Greek bank customers perceived receiving a high level ofservice quality. More precisely, customers of Greek banks perceived receiving a higherlevel of quality than did the Bulgarian bank customers (the level of significance was0.000 for 26 of the 30 questions). Based on the banks sector developments related to thelevel of liberalisation and competition and on the differences in sample characteristics,in terms of occupation, income and bank status (which mirror the macro-environmentand sector diversity) these results were expected.
Bank servicequality
581

BSQ was proved to be a valid and reliable measure of bank service quality in bothcountries. The fact that the dimensions of service quality were found to be differentthan the original BSQ ones and different between the two countries adds to thedimensionality problems of service quality instruments.
The combination of reliability and effectiveness and assurance items in the revealedby factor analysis dimensions of bank service quality in the two countries can beexplained by the conceptual similarities between them.
The results have significant implications for banks in developing operational,marketing and human resource strategies in Greece and Bulgaria. Greece and Bulgariatwo countries with different economic, political and socio-cultural backgrounds givethe opportunity for cross-country research in the area of service quality, whereresearch is not very mature.
An additional strength of this study is that it has utilised a research instrumentconstructed especially for the banking sector. It is also the first study of these mattersin Bulgaria. While the insights in the Greek and Bulgarian customers’ perceptions offera reliable analysis of country-related differences in the service quality perceptions ofbank customers.
Two limitations must also be acknowledged. Firstly, service quality was measuredusing the BSQ scale construction, which, as Bahia and Nantel (2000) have noted, isentirely based on “expert” opinions and published literature. Secondly, service qualitywas measured using only customers’ perceptions, rather than the difference (or “gap”)between expectations and perceptions as some researchers have suggested.
It would be of particular interest to investigate the difference in significancebetween the dimensions of perceived service quality. This would allow the ranking ofthe dimensions and would permit managers to emphasise the various dimensions ofservice quality differently. This will affect the extent to which banks carry out theiractivities efficiently and effectively and help to the establishment of a viable and soundfinancial system in the two countries.
References
Aldlaigan, A.H. and Buttle, F.A. (2002), “SYSTRA-SQ: a new measure of bank service quality”,International Journal of Service Industry Management, Vol. 13 No. 4, pp. 362-81.
Anderson, E.W., Fornell, C. and Lehmann, D.R. (1994), “Customer satisfaction, market share andprofitability”, Journal of Marketing, Vol. 58, pp. 53-66.
Asubonteg, P., McCleary, K.G. and Swan, J.E. (1996), “SERVQUAL revisited: a critical review ofservice quality”, Journal of Services Marketing, Vol. 10 No. 6, pp. 62-81.
Axinn, C.N. and Matthyssens, P. (2002), “Limits of internationalization theories in an unlimitedworld”, International Marketing Review, Vol. 19 No. 5, pp. 436-49.
Babakus, E. and Boller, G.W. (1992), “An empirical assessment of the SERVQUAL scale”, Journalof Business Research, Vol. 24 No. 3, pp. 253-68.
Babakus, E. and Mangold, W.G. (1989), “Adapting the SERVQUAL scale to health careenvironment: an empirical assessment”, in Bloom, P., Winer, R., Kassarjian, H., Scammon,D., Weitz, B., Speckman, R., Mahajan, V. and Levy, M. (Eds), Enhancing KnowledgeDevelopment in Marketing, American Marketing Association, Chicago, IL.
Bahia, K. and Nantel, J. (2000), “A reliable and valid measurement scale for perceived servicequality of bank”, International Journal of Bank Marketing, Vol. 18 No. 2, pp. 84-91.
IJQRM24,6
582

Barnes, J.G. and Cumby, J.A. (1995), “The cost of service quality: extending the boundaries ofaccounting systems to enhance customer value”, in Glyn, W.J. and Barnes, J.G. (Eds),Understanding Service Management, Wiley, Chichester, pp. 178-202.
Baskerville, R.F. (2003), “Hofstede never studied culture”, Accounting, Organizations and Society,Vol. 28 No. 1, pp. 1-14.
Berry, L.L. and Parasuraman, A. (1991), Marketing Services – Competing through Quality,Free Press, New York, NY.
Berry, L.L., Zeithaml, V.A. and Parasuraman, A. (1985), “Quality counts in services too”,Business Horizons, Vol. 31 No. 5, p. 46.
Boom, B.H. and Bitner, M.J. (1981), “Marketing strategies and organisation structures for servicefirms”, in Donnelly, J. and George, J.R. (Eds), Marketing of Services, American MarketingAssociation, Chicago, IL, pp. 50-67.
Bresinger, R.P. and Lambert, D.M. (1990), “Can the SERVQUAL scale be generalized tobusiness-to-business services”, Knowledge Development in Marketing, AMA’s SummerEducator’s Conference Proceedings, American Marketing Association, Chicago, IL, p. 289.
Buttle, F. (1996), “SERVQUAL: review, critique, research agenda”, European Journal ofMarketing, Vol. 30 No. 1, pp. 8-32.
Capon, N., Farley, J.U. and Hoening, S. (1990), “Determinants of financial performance:a meta-analysis”, Management Science, Vol. 31, pp. 1143-59.
Carman, J.M. (1990), “Consumer perceptions of service quality: an assessment of the SERVQUALdimensions”, Journal of Retailing, Vol. 66 No. 1, pp. 35-55.
Cronin, J. Jr and Taylor, S.A. (1992), “Measuring service quality: a re-examination and extension”,Journal of Marketing, Vol. 56, July, pp. 55-68.
Davies, S. (1995), “Mergers and acquisitions in European financial services”, Financial Times,Financial Reports.
European Bank for Regional Development (EBRD) (2003), Transition Report, EBRD, London.
Finn, D.W. and Lamb, C.W. (1991), “An evaluation of the SERVQUAL scale in a retail setting”, inHolman, R.H. and Soloman, M.G. (Eds), Advances in Consumer Research, Association forConsumer Research, Provo, UT, pp. 483-9.
Furrer, O., Liu, B.S. and Sudharshan, D. (2000), “The relationships between culture and servicequality perception: basis for cross-cultural market segmentation and resource allocation”,Journal of Service Research, Vol. 2 No. 4, pp. 355-71.
Gilmore, A. and Carson, D. (1992), “Research in service quality: have the horizons become toonarrow?”, Marketing Intelligence & Planning, Vol. 10 No. 7, pp. 5-7.
Gronroos, C. (1983), Strategic Management and Marketing in the Service Sector, Report, No. 83:104, Marketing Science Institute, Cambridge, MA.
Gronroos, C. (1990), Service Management and Marketing – Managing the Moments of Truth inService Competition, Lexington Books, Lexington, MA.
Hackethal, A., Marinov, V. and Schmidt, R.H. (2003), “Banking markets in central and EasternEurope (VI): Bulgaria – emerging stronger from a crisis”, Die Bank, available at: www.die-bank.de
Hair, J.F., Anderson, R.E., Tatham, R.L. and Black, W.C. (1992), Multivariate Data Analysis, withReadings, 3rd ed., Macmillan Publishing Company, New York, NY.
Hofstede, G. (1980), Organizational Dynamics, AMACOM, New York, NY.
Hofstede, G. (1991), Culture and Organizations, McGraw-Hill, London/ New York, NY.
Bank servicequality
583

Hofstede, G. (2001), Culture’s Consequences: Comparing Values, Behaviours, Institutions andOrganizations Across Nations, 2nd ed., Sage Publications, London.
Hofstede, G. and Bond, M.H. (1988), “The Confucian connection: from cultural roots to economicgrowth”, Organizational Dynamics, Vol. 16 No. 4, pp. 4-21.
Jabnoun, M. and Al-Tamimi, H.A.H. (2003), “Measuring perceived service quality at UAEcommercial banks”, International Journal of Quality and Reliability Management, Vol. 20No. 4, pp. 458-72.
Kosmidou, K. and Spathis, C. (2000), “Euro and profitability of Greek banks”, European ResearchStudies Journal, Vol. 3 Nos 3-4, pp. 43-56.
Lassar, M.W., Manolis, C. and Winsor, R. (2000), “Service quality and satisfaction in privatebanking”, International Journal of Bank Marketing, Vol. 18 No. 4, pp. 181-99.
Malhotra, N.K., Ulgado, F.M., Agarwal, J.G. and Wu, L. (2005), “Dimensions of service quality indeveloped and developing economies: multi-country cross cultural comparisons”,International Marketing Review, Vol. 22 No. 3, pp. 256-78.
Moshos, D. and Fraggetis, D. (1997), “The present and future of Greek banks”, Epikaira Themata,IOVE, Athens.
Noulas, A. and Glaveli, N. (2002), “Bank branch efficiency: an application of DEA analysis”,paper presented at the Annual Meeting of EFMA, London, June.
Nunnaly, C.J. (1978), Psychometric Theory, McGraw-Hill, New York, NY.
Parasuraman, A., Zeithaml, V.A. and Berry, L.L. (1985), “A conceptual model of service qualityand its implications for future research”, Journal of Marketing, Vol. 49, pp. 41-50.
Parasuraman, A., Zeithaml, V.A. and Berry, L.L. (1988), “SERVQUAL: a multiple-item scale formeasuring consumer perceptions of service quality”, Journal of Retailing, Vol. 64, Spring,pp. 12-40.
Parasuraman, A., Zeithaml, V.A. and Berry, L.L. (1991), “Refinement and reassessment of theSERVQUAL scale”, Journal of Retailing, Vol. 67 No. 4, pp. 420-50.
Petridou, E. and Glaveli, N. (2003), “A Greek bank’s training and development effort in thechallenging financial environment”, Human Resource Development International, Vol. 6No. 4, pp. 547-58.
Roberts, K., Varki, S. and Brodie, R. (2003), “Measuring quality of relationships in consumerservices: an empirical study”, European Journal of Marketing, Vol. 37 Nos 1-2, pp. 169-96.
Rust, R.T., Zahoric, A.J. and Keiningham, T.L. (1994), “Return on Quality (ROQ), making servicequality financially accountable”, Journal of Marketing, Vol. 59, pp. 58-70.
Spathis, C., Kosmidou, K. and Doumpos, M. (2002), “Assessing profitability factors in the Greekbanking system: a multicriteria methodology”, International Transactions in OperationalResearch, Vol. 9 No. 5, pp. 517-30.
Spathis, C., Petridou, E. and Glaveli, N. (2001), “An empirical study of service qualityperspectives in public and private banks”, in Zopounidis, C. (Ed.), New Trends in BankingManagement, Springer Physica Verlag, New York, NY, pp. 3-19.
Spathis, C., Petridou, E. and Glaveli, N. (2004), “Managing service quality in banks: customers’gender effects”, Managing Service Quality, Vol. 14 No. 1, pp. 90-102.
Stafford, M.R. (1996), “Demographic discriminators of service quality in banking”, The Journal ofServices Marketing, Vol. 10 No. 4, pp. 6-22.
Stubos, G. and Tsikripis, I. (2004), “Banking sector development in South-Eastern Europe”,Working Paper No. 44, ELIAMEP, WP4, Regional Cooperation, ELIAMEP, Athens.
IJQRM24,6
584

Taylor, S.A. and Baker, T.L. (1994), “An assessment of the relationship between service qualityand customer satisfaction in the formation of customers’ purchase intentions”, Journal ofRetailing, Vol. 70 No. 2, pp. 163-78.
Witkowski, T.H. and Wolfinbarger, M.F. (2000), “The formality dimension of service quality inThailand and Japan”, paper presented at the 2000 Annual Conference of the Associationfor Consumer Research, Salt Lake City, UT, October.
Zikmund, G.W. (1994), Business Research Methods, 4th ed., The Dryden Press, New York, NY.
Corresponding authorCharalambos Spathis can be contacted at: [email protected]
Bank servicequality
585
To purchase reprints of this article please e-mail: [email protected] visit our web site for further details: www.emeraldinsight.com/reprints

A study of measures to improveconstructability
Franky W.H. Wong, Patrick T.I. Lam,Edwin H.W. Chan and L.Y. Shen
Department of Building and Real Estate, The Hong Kong Polytechnic University,Hung Hom, Kowloon, Hong Kong
Abstract
Purpose – This paper is aimed at identifying the common approaches for improving constructabilityand evaluating their effectiveness of implementation.
Design/methodology/approach – A comprehensive survey has been carried out on contemporaryliterature, i.e. from 1990 onwards, to trace the development of the buildability and constructabilityconcepts and the common approaches of improvement.
Findings – Results show that buildability is mainly concerned with design, quality of built products,ease of construction, as well as efficient and economical construction. Constructability emphasisesintegration of construction knowledge and experience at various project stages; optimisation ofdifferent project requirements to achieve overall goals; and ease of construction. Therefore,“constructability” embraces the concept of “buildability”. The implementation of QuantifiedAssessment, Constructability Review and Constructability Programmes are the three commonlyadopted approaches.
Practical implications – Improvement measures should be implemented at the design stage,whereas improved constructability would eventually bring about tangible benefits in terms of time,cost, quality and safety. The Quantified Assessment approach appears to be the most practicable wayof improving constructability.
Originality/value – Up till now, there have been very limited studies providing an evaluation ofdifferent approaches for improving constructability. The study has offered an insight into thecommonly adopted improvement measures, highlighting proven success cases, hence enablingeffective strategies to be developed for enhancing constructability.
Keywords Design, Construction industry, Project evaluation, Quality improvement
Paper type Literature review
IntroductionConstructability, because of its abstract nature, requires tacit understandings beforeimprovements can be realised. Decades have elapsed since problems arising from theseparation of design and construction came to light in the 1960s. Notwithstandingnumerous studies which have looked at the subject from different perspective and withdifferent approaches, the problems associated with constructability have notdiminished (Egan, 1998; CIRC, 2001). Moreover, there is still no overall consensus onthe definition and at which project stage improvement measures should beimplemented. Without this consensus, constructability could mean different things
The current issue and full text archive of this journal is available at
www.emeraldinsight.com/0265-671X.htm
The work described in this paper was fully supported by a grant from the Research GrantsCouncil of the Hong Kong Special Administrative Region, China (RGC Project No.PolyU5155/04E).
IJQRM24,6
586
Received August 2005Revised January 2006Accepted February 2006
International Journal of Quality &Reliability ManagementVol. 24 No. 6, 2007pp. 586-601q Emerald Group Publishing Limited0265-671XDOI 10.1108/02656710710757781

across different studies. Thus, this paper aims to identify the common approaches forimproving constructability and evaluate their effectiveness for implementation.
Interpretations of buildability and constructabilitySimilar to constructability, buildability is another concept which is related to theinfluence of designers on the construction process (Chen and McGeorge, 1994). Sincetheir “infancies”, the terms “buildability” and “constructability” had been defined byvarious researchers. With regard to “buildability”, the three common definitions haveshown differences from one another. These definitions refer to buildability as “theextent to which the design of a building facilitates ease of construction, subject to theoverall requirements for the completed building” (CIRIA, 1983); “the ability toconstruct a building efficiently, economically and to agreed quality levels from itsconstituent materials, components and sub-assemblies” (Ferguson, 1989); and “theextent to which decisions made during the whole building procurement process, inresponse to factors influencing the project and other project goals, ultimately facilitatethe ease of construction and the quality of the completed project” (McGeorge et al.,1992). As for “constructability”, dissimilarities are also exhibited between twocommonly used definitions: “the optimum use of construction knowledge andexperience in planning, design, procurement and field operations to achieve overallproject objectives” (CII, 1986); and “the integration of construction knowledge in theproject delivery process and balancing the various project and environmentalconstraints to achieve project goals and building performance at an optimal level” (CIIAustralia, 1996).
Stages of implementationRegarding the stages of implementation, “buildability”, as per CIRIA’s definition(1983), focuses itself at the design stage. On the contrary, the term “constructability”, asthe CII (1986) defined it, encompasses all project stages and thus overcomes theperceived narrowness in scope of “buildability” (CII Australia, 1992). Although someconstructability improvement measures do take place at particular stages of a project,e.g. the carrying out of constructability analysis at tender stage (Phair, 2005), it iscommonly recognized that “constructability” is concerned with the whole process ofproject development to facilitate construction efficiency and achieve project goals. Bycontrast, “Buildability” deals with only the design stage for construction efficiency.Hence, for the sake of clarity, since “constructability” embraces the concept of“buildability”, the former term will be used instead of “buildability” in this paper,except when the historical development of “buildability” and the “buildability”definitions are referred to.
Despite the disparities in methods to improve constructability, an understanding ofthe commonalities that may exist among different approaches would help in realizingthe potential benefits of constructability and identifying its attributes. Eventually, aneffective strategy for improving constructability can be formulated. As there are verylimited existing studies evaluating the success or otherwise of different approaches forimproving constructability, this study is aimed at closing the knowledge gap byidentifying the common approaches adopted in enhancing constructability andevaluating their effectiveness. A comprehensive review has been carried out oncontemporary literature from 1990 onwards, including articles published in academic
Measures toimprove
constructability
587

journals and construction periodicals. The review covers various definitions ofbuildability and constructability, the improvement measures, the stages ofimplementation as well as the benefits realized by such enhancement efforts.
Methodology of literature reviewThe methodology of carrying out the literature review on constructability issummarized in Figure 1. First, the objective of the literature review, which is to identifyvarious approaches for enhancing constructability, was clearly defined. The scope ofthe review was confined to the literature published from 1990 onwards in academicjournals and construction periodicals. Next, available sources providing the requiredmaterials were identified. These sources include hard copies available in local andoverseas libraries, web-pages of professional institutions as well as online databases,e.g. EBSCO, IngentaConnect, MetaPress, Emerald and Scitation. A triangulatedapproach, for searching the theories, the leading authors and the topical keywords(Fellows and Liu, 2003) was adopted to discover the information. Details of theidentified literature, comprising sources of the documents, years of publication,abstracts, definitions of buildability/constructability adopted, approaches forimprovement, stages of implementing, and implications on project performance interm of time, cost, quality, safety and others, were then extracted for analysis.
Figure 1.Methodology of theliterature review
IJQRM24,6
588

Overview of buildability and constructability developmentBuildability in the United Kingdom and SingaporeThe term “buildability” was invented after a number of studies in the UK on thedetrimental effects brought about by the dis-integration of design and construction inthe 1960s and 1970s (Emmerson, 1962; Banwell, 1964; EDC, 1967; NEDO, 1975).Thereafter, the CIRIA (1983)published its definition of buildability (as stated earlier).This definition was criticised for its narrowness in scope, in that it essentially confinedbuildability to the design process. Subsequently, further studies on buildability in theUK were carried out by Gray (1983), Griffith (1984), Adams (1989) and, Ferguson(1989). However, after so many years, too much time and effort were still spent tryingto make designs work in practice (Egan, 1998; Love et al., 2000), and there was littleemphasis placed on buildability of designs (CIRC, 2001).
In Asia, the Singapore Government has enacted legislation to require minimumbuildability scores of designs before approvals of building plans in 2001. Thebuildability scores are calculated based on the Buildable Design Appraisal System(BDAS), which was devised to measure buildability performance of designs inSingapore. The “3S” principles of Standardisation, Simplicity and Single IntegratedElements form the cornerstones of the BDAS. These represent the considerations thatdesigners should take in developing designs, including determination of the mostappropriate building systems to be used (BCA, 2005a).
Constructability in the United States and AustraliaIn the 1980s, the term “constructability” evolved in the USA. The proponents of thisconcept believe that constructability, which embraces both design and managementfunctions, is more comprehensive in facilitating construction operations and solvingproblems on site. In particular, the Construction Industry Institute (CII) wasinstrumental in providing guidelines for implementing constructability at variousproject stages (CII, 1986, 1987a, b; 1993).
Almost concurrently, Australian researchers, e.g. Ireland (1985), were also aware ofsimilar problems being caused by the lack of integrated design and construction.Through studies on constructability, McGeorge et al. (1992), Hon et al. (1988) and CIIAustralia (1996) strived to encourage contractors’ involvement in design and efficientcommunication, thereby enhancing the quality of project management during thewhole building process, with the aims to facilitate ease of construction and achievebetter project performance. Similar to the CII in the USA, the CII Australia publishedthe Constructability Principles File in 1992, comprising a system which involves thewhole project team (including contractors) from the very beginning of the project forimproving constructability, and the Constructability Manual in 1996, providingguidelines for implementing the constructability system, in the form of 12constructability principles, implementation strategies and case studies.
More recently, studies are being conducted in Malaysia (Nima et al., 1999; Nima et al.,2001a; Nima et al., 2001b; Nima et al., 2004; Zin et al., 2004), Indonesia (Trigunarsyah,2004a, b, c), and Nigeria (Mbamali et al., 2005), all aiming at the betterment ofbuildability and constructability through various methodologies.
Measures toimprove
constructability
589

Raising the awareness of buildability and constructabilityA variety of interpretations of buildability and constructability are listed below. First,here are the quotations regarding buildability:
The extent to which the design of a building facilitates ease of construction, subject to theoverall requirements for the completed building. (CIRIA, 1983)
Practical buildability requires a compromise between consciously making the design morebuildable and accommodating the many factors imparting the influence upon design,including quality, aesthetics, time and cost. (Griffith, 1987)
The ability to construct a building efficiently, economically and to agreed levels from itsconstituent materials, components and sub-assemblies. (Ferguson, 1989)
The extent to which decisions, are made during the whole building procurement process, inresponse to factors influencing the project and other project goals, ultimately facilitating theease of construction and the quality of the completed project. (McGeorge et al., 1992)
The end-result when designs and plans are translated on-site into a building with minimumdifficulty to give the best possible results. (SEAB, 1993)
. . . buildable designs will lead to improvements in quality . . . due to the relative ease ofconstruction and the need for fewer skilled tradesmen . . . the 3S principles of Standardisation,Simplicity and Single Integrated elements to achieve a buildable design. (BCA, 2005a, b, c)
Buildability is related to all aspects of a project which enable the optimum utilisation ofconstruction resources. It ensures that there is continuity of work by managing labour, plantand equipment in such a manner that the flow of materials, components and sub-assembliesinto the growing building is maintained and optimised to achieve efficient and economicproduction. It is concerned with activities on site and specifically with the logical sequence ofoperations and construction methods. (Low and Abeyegoonasekera, 2001)
Here are the quotations regarding constructability:
The optimum use of construction knowledge and experience in conceptual planning /planning, design / engineering / detail engineering, procurement, and field operations /operations phases to achieve overall project objectives. (CII, 1986)
Constructability was defined as a measure of the ease or expediency with which a facility canbe constructed. (Hugo et al., 1990)
The application of a disciplined and systematic optimization of construction-relatedknowledge during the planning, design, procurement and construction stages byknowledgeable, experienced construction personnel who were part of a project team. (CMC,1991)
The process of doing everything possible to make construction easy, to improve quality,safety, and productivity, to shorten construction schedules and to reduce rejection andrework. (Kerridge, 1993)
Constructability involved construction-oriented input into the planning, design and fieldoperations of a construction project. (Pepper, 1994)
Constructability programs was defined as the application of a disciplined, systematicoptimization of the procurement, construction, test, and start-up phases by knowledgeable,experienced construction personnel who are part of a project team. (Russell et al., 1994)
IJQRM24,6
590

Constructability was often portrayed as integrating construction knowledge, resources,technology, and experience into the engineering and design of a project. (Anderson et al.,1995)
Constructability of a design referred to the ease with which the raw materials of theconstruction process (labor, production equipment and tools, and materials and installedequipment) can be brought together by a builder to complete the project in a timely andeconomic manner. (Glavinich, 1995)
The integration of construction knowledge in the project delivery process and balancing thevarious project and environmental constraints to achieve the project goals and buildingperformance at an optimum level. (CII Australia, 1996)
The stretch version was a planning process that required customer input in every phase ofthe capital project planning: front-end engineering; detailed design, procurement, contracting,construction, check-out, start-up, operation, maintenance, and business management, andcommunication among all project participants. (Geile, 1996)
The optimum use of construction knowledge and experience by the owner, engineer,contractor and construction manager in the conceptual planning, detailed engineering,procurement and field operations phases to achieve the overall project objectives. (Nima et al.,1999)
The feasibility (or complexity) of a considered project to be performed by a specifictechnology based on the construction knowledge learned from past projects. (Yu andSkibniewski, 1999)
Constructability programs aimed at integrating engineering, construction, and operationknowledge and experience to better achieve project objectives. (Arditi et al., 2002)
As for “buildability”, the mostly publicized notion is the one developed by the CIRIA(1983) as “the extent to which the design of a building facilitates ease of construction,subject to the overall requirements for the completed building”, as quoted by Chen andMcGeorge (1994), Low and Abeyegoonasekera (2001), Low (2001) and Lam (2002).Other attributes of buildability are concerned with building quality (Griffith, 1987;Ferguson, 1989; McGeorge et al., 1992; BCA, 2005a), design (Griffith, 1987; SEAB, 1993;BCA, 2005a), ease of construction (McGeorge et al., 1992; SEAB, 1993; BCA, 2005a), aswell as efficient and economical construction (Ferguson, 1989; BCA, 2005a; Low andAbeyegoonasekera, 2001). As for “constructability”, the most commonly quoted notion(Harbuck, 1991; Vardhan et al., 1992; Russell et al., 1994; Anderson et al., 1995; Gibsonet al., 1996; Uhlik and Lores, 1998; Young III, 1998; Nima et al., 1999; Anderson et al.,2000; Chasey and Schexnayder, 2000; Jergeas and Put, 2001; Nima et al., 2001a, b; Nimaet al., 2004; Trigunarsyah, 2004b, c; Ugwu et al., 2004) is that of “the optimum use ofconstruction knowledge and experience in conceptual planning/planning,design/engineering/detail engineering, procurement, and field operations/operationsphases to achieve overall project objectives” (CII, 1986). Apart from this,constructability has also been given a diverse range of interpretations, relating tointegration of construction knowledge and experience (CMC, 1991; Pepper, 1994;Russell et al., 1994; Anderson et al., 1995; CII Australia, 1996; Nima et al., 1999; Yu andSkibniewski, 1999; Arditi et al., 2002), applications at various project stages (CMC,1991; Pepper, 1994; Russell et al., 1994; Anderson et al., 1995; Geile, 1996; CII Australia,1996; Nima et al., 1999; Arditi et al., 2002), optimisation (CMC, 1991; Russell et al., 1994;
Measures toimprove
constructability
591

CII Australia, 1996; Nima et al., 1999), achieving project goals or objectives (CIIAustralia, 1996; Nima et al., 1999; Arditi et al., 2002), as well as ease of construction(Kerridge, 1993; Glavinich, 1995; Geile, 1996). The notions of buildability andconstructability will be better understood as more dissemination takes place in variousforms but the common theme of construction expertise must be adhered to.
Performance improvement based on enhanced constructabilityInitially, the benefits of improved constructability are usually manifested in terms ofcost saving. As a corollary, good constructability was expected to generate benefits of10 to 20 times the cost of achieving it (BR, 1982). Extrapolating from isolated examplesof incorporating construction advice into the design, the savings were estimated to bewithin the range of 1 percent to 14 percent of the capital cost (Gray, 1983). Furtherstudies have substantiated improved constructability resulting in savings of totalproject cost (Boyce, 1991; Pepper, 1994; Geile, 1996; Griffith and Sidwell, 1997; Eldin,1999; Francis et al., 1999; Jergeas and Put, 2001; Elgohary et al., 2003; Trigunarsyah,2004a). In particular, lower cost of bidding (Gibson et al., 1996), reduced site labour(Lam, 2002), increased cost effectiveness (Low and Abeyegoonasekera, 2001), andbetter resource utilisation (Eldin, 1999) have been reported.
As more studies have been carried out, more benefits were identified in terms oftime, quality and safety as well as intangible bonuses. Benefits in relation to time werereferred to as early completion (Griffith and Sidwell, 1997; Eldin, 1999; Francis et al.,1999; Low and Abeyegoonasekera, 2001; Elgohary et al., 2003; Trigunarsyah, 2004a, b),increased productivity (Poh and Chen, 1998; Low, 2001) and reduced outage duration(Eldin, 1999). Higher quality of the built products was also achieved (Eldin, 1999;Francis et al., 1999; Low, 2001; Low and Abeyegoonasekera, 2001; Elgohary et al., 2003;Trigunarsyah, 2004c). Regarding safety aspect, a safer environment on site and bettersafety performance would result (Francis et al., 1999; Low and Abeyegoonasekera,2001; Trigunarsyah, 2004a, c). Apart from these, intangible bonuses were noticeable,such as a reduction in unforeseen problems (Francis et al., 1999; Elgohary et al., 2003;Trigunarsyah, 2004b), improvements in industrial relations, team work,communication as well as enhancement of client’s satisfaction (Francis et al., 1999),employees’ satisfaction and loyalty (Eldin, 1999), alongside the creation of goodworking relationships among stakeholders (Geile, 1996; Eldin, 1999).
Approaches adopted in enhancing constructabilityMeasures for improving constructabilityIn respect of constructability improvement, it is found that: quantified assessment ofdesigns; constructability review; and implementation of constructability programmesare the three approaches most commonly employed. The approach of quantifyingassessment is adopted through the Buildable Design Appraisal System in Singapore,which requires minimum constructability performance being achieved as aprerequisite for building plan approval (Poh and Chen, 1998; Low, 2001; Lam, 2002).Others have adopted the Fuzzy Quality Function Deployment system (Yang et al.,2003), the knowledge models for automated constructability assessment (Ugwu et al.,2004), and the assessment framework of constructability in Malaysia (Zin et al., 2004).Another common approach of improvement is through reviewing constructability withdifferent methodologies, such as using formalised constructability reviews at design
IJQRM24,6
592

and construction stages (Ford et al., 2004), early implementation of the review in theconceptual planning stage (Arditi et al., 2002), integration of constructabilityimprovements into project development (Anderson et al., 2000), integration ofanalytical review tools into the constructability review process (Fisher et al., 2000),implementation of the constructability review process at different project stages(Young III, 1998), the in-house design-phase constructability review (Glavinich, 1995),and the carrying out of constructability review by an independent team with hands-onexperience in similar projects (Pepper, 1994). Thirdly, improvement can be realized byimplementing constructability programmes at various project stages (Harbuck, 1991;Vardhan et al., 1992; Opfer, 1994; Russell et al., 1994; Anderson et al., 1995; Geile, 1996;Griffith and Sidwell, 1997; Uhlik and Lores, 1998; Kog et al., 1999; Chasey andSchexnayder, 2000; Jergeas and Put, 2001; Nima et al., 2004, 2001a; Trigunarsyah,2004a, b).
Stages of implementationFor improving constructability, an overwhelmingly majority of researchers proposedmeasures to be taken at the design stage (Boyce, 1991; Vardhan et al., 1992; Pepper,1994; Anderson et al., 1995; Glavinich, 1995; Gibson et al., 1996; Poh and Chen, 1998;Young III, 1998; Denman, 2001; Low, 2001; Arditi et al., 2002; Fox et al., 2002; Lam,2002; Acker, 2003; Ballal and Sher, 2003; Yang et al., 2003; Ugwu et al., 2004; Zin et al.,2004). For some, improvement measures were to be carried out throughout the wholebuilding process (Chen and McGeorge, 1994; Opfer, 1994; Geile, 1996; Griffith andSidwell, 1997; Francis et al., 1999; Chasey and Schexnayder, 2000; Dulaimi et al., 2004),whilst others applied their measures to the various stages of briefing, conceptualplanning, design, procurement, construction, contract review and tendering, etc.(Harbuck, 1991; Uhlik and Lores, 1998; Anderson et al., 2000; Jergeas and Put, 2001;Low and Abeyegoonasekera, 2001; Nima et al., 1999, 2001a, b, 2004; Ford et al., 2004;Trigunarsyah, 2004a, b, c; Phair, 2005).
Evaluation of survey findingsBased on the literature relating to constructability as identified in academic journalsand construction periodicals published from 1990 onwards, an evaluation of thecommon approach towards improving constructability has been carried out as thefollowings.
Owing to the abstract nature of buildability and constructability, a clearunderstanding of the concepts is required before any strategies for improvement can beformulated. Regarding buildability, improvement measures should address the designprocess and the quality of the completed products. Buildability is also manifested inthe ease of construction as well as the efficiency and economy of construction. Figure 2summarizes the commonalities of different perceptual attributes of buildability.
As for constructability, its enhancement can be accomplished through theintegration of construction knowledge at various project stages. Most studies recognizethat constructability should be optimized among other project requirements, in order toachieve the overall project goals or objectives. Apart from these, constructabilityshould facilitate ease of construction. Different perceptual attributes of constructabilityand their common features are portrayed in Figure 3.
Measures toimprove
constructability
593

Figure 2.Commonalities amongdifferent perceptualattributes of buildability
IJQRM24,6
594

Figure 3.Commonalities among
different perceptualattributes of
constructability
Measures toimprove
constructability
595

The benefits of improved constructability have long been associated with the time,cost, quality and safety performance of a project, together with other intangiblebenefits. It is obvious that concomitant with the improvement, construction becomeseasier and project periods can be shortened. It is also reasonable to expect that thebuilding process can be more efficient and economical, which eventually results in costsaving, due to the incorporation of construction expertise and experience at the earlyproject stages. Building projects for which constructability is consciously taken care ofwill ultimately undergo smooth construction, thereby facilitating quality of the builtproducts and minimizing potential disputes and avoidable accidents on site.Eventually, it induces improvement in aspects such as labor relations,communication among project participants, client’s and employees’ satisfaction aswell as loyalty.
To improve constructability, different approaches have been proposed. The threecommon approaches are:
(1) quantified assessment of designs;
(2) constructability review; and
(3) implementation of constructability programs.
Quantifying assessment enables an objective evaluation of constructability attributeswhile results are comparable. On the subject of quantifying assessment, two issueshave emerged. On one hand, it is more practicable and manageable for assessment andimprovement by focusing at the finished design rather than the design process. On theother hand, it is difficult to comprehensively take account of all relevant factorsaffecting constructability into the assessment system. It is inevitable that moreimportant aspects are taken into consideration for assessment purpose. This has beenthe strategy being adopted by a research study aimed at developing a prototypeassessment model for use in Hong Kong (Wong et al., 2003). The second approach ofConstructability Review refers to evaluating design documents at an early stage toensure smooth project delivery. It helps to guard against any discrepancies or errorsand ensure coordination of design documents including drawings and specifications.The Review is also aimed at ironing out any possible problems that may arise duringconstruction, prior to commencing actual site works. Nevertheless, carrying outconstructability review incurs additional time and resources, not to mention the need toovercome potential resistance from design consultants, who may regard contractors asthe party primarily responsible for constructability. As for the third approach, it entailsthe incorporation of constructability programs comprising a set of rules and guidelinesinto the management process. The measure embodies all factors affectingconstructability and involves interaction with different project stakeholders atvarious project stages. As any constructability program would involve process factors,this would make assessment of performance appear subjective and complicated.Monitoring the whole process of implementing constructability programs is notpractical whereas snap shots observed during parts of the process may not berepresentative. As a result, of the three approaches, Quantified Assessment of Designsappears to be the most practical and achievable way for improving constructability. Infact, the approach was adopted by the Singapore Government which has successfullyenforced the BDAS (BCA, 2005a) across the city state since 2001.
IJQRM24,6
596

ConclusionBy reviewing current literature published in academic journals and constructionperiodicals, the paper has identified the common approaches for improvingconstructability and evaluated their effectiveness for implementation. The study hasprovided an insight into the commonalities of proven improvement measures, therebyenabling effective strategies to be developed for enhancing constructability. Throughtheir interpretations, predecessors’ studies have expressed the abstract concept in amore comprehensible form. Empirically, there has been evidence that it would worththe effort to promote “constructability”, which was found positively correlated withenhanced project performance in a variety of aspects, especially if the improvementmeasures were implemented at the design stage. To improve constructability, thecommon measures are:
. quantified assessment of designs;
. constructability review; and
. implementation of constructability programs at different project stages.
Of them, Quantified Assessment of Designs has demonstrated its practicality andsuccessfulness in improving constructability. A good example is the Buildable DesignAppraisal System (BCA, 2005a) which has been enforced in Singapore as a nation-widemeasure for assessment of design constructability.
Recommended further studiesThe recent successful implementation of Singapore’s Buildable Designs AppraisalSystem (BDAS) (BCA, 2005a) has demonstrated the practicality of formulating asystematic assessment system to objectively measure constructability of designs.Follow-up studies have established the correlations between better constructabilityperformance and the improvements of site productivity, construction quality andmanpower consumption at the project level (Poh and Chen, 1998; Low, 2001; Lam, 2002;BCA, 2005b, c). Since Singapore was the first to formulate official guidelines forquantifying constructability and make it a mandatory prerequisite for approvingbuilding developments, the effects of enforcement need to be monitored on a long termbasis. Similar assessment systems should also be established elsewhere such that thevalidity of the approach in enhancing project performance can be tested out incountries with different contextual backgrounds. In the long run, if suchconstructability assessment systems are proven to be effective, they can be used toestablish benchmarks for incentive or punitive purposes, all geared towards enhancingthe time, cost, quality and safety performance of construction.
References
Acker, D.E. (2003), “Integrating constructability into cleanroom design”, ASHRAE Transactions,Vol. 109, pp. 715-21.
Adams, S. (1989), Practical Buildability, Butterworths, London.
Anderson, S.D., Fisher, D.J. and Rahman, S.P. (2000), “Integrating constructability into projectdevelopment: a process approach”, Journal of Construction Engineering and Management,Vol. 126 No. 2, pp. 81-8.
Measures toimprove
constructability
597

Anderson, S.D., Fisher, D.J.G. and Vipul, K. (1995), “Total constructability management:a process-oriented framework”, Project Management Journal, Vol. 26 No. 3, pp. 3-11.
Arditi, D., Elhassan, A. and Toklu, Y.C. (2002), “Constructability analysis in the design firm”,Journal of Construction Engineering and Management, Vol. 128 No. 2, pp. 117-26.
Ballal, T.M.A. and Sher, W.D. (2003), “Artificial neural network for the selection of buildablestructural systems”, Engineering, Construction and Architectural Management, Vol. 10No. 4, pp. 263-71.
Banwell, H. (1964), The Placing and Management of Contracts for Building and Civil EngineeringWork, HMSO, London.
Boyce, W.J. (1991), “Designing for constructability”, American Association of Cost Engineers,pp. B.1.1-B.1.7.
Building and Construction Authority (BCA) (2005a), Code of Practice on Buildable Design,Building and Construction Authority, Singapore.
Building and Construction Authority (BCA) (2005b), “Buildable designs”, available at: www.bca.gov.sg/BuildableDesign/buildable_design_buildability_score.html (accessed December2005).
Building and Construction Authority (BCA) (2005c), “Site productivity”, available at: www.bca.gov.sg/productivity/site_productivity_statistics.html (accessed December 2005).
Business Roundtable (BR) (1982), Integrating Construction Resources and Technology intoEngineering, report of a construction industry cost effectiveness project, The BusinessRoundtable, New York, NY.
Chasey, A.D. and Schexnayder, A.M. (2000), “Constructability: the key to reducing investmentrisk”, AACE International Transactions, pp. Risk.03.1-Risk.03.10.
Chen, S.E. and McGeorge, W.D. (1994), “A systems approach to managing buildability”,Australian Institute of Building Papers, Vol. 5, pp. 75-86.
Construction Industry Institute (CII) (1986), Constructability: A Primer, CII, University of Texas,Austin, TX.
Construction Industry Institute (CII) (1987a), Constructability Concept File, CII, Austin, TX.
Construction Industry Institute (CII) (1987b), Guidelines for Implementing a ConstructabilityProgram, CII, Austin, TX.
Construction Industry Institute Australia (CII Australia) (1992), Constructability Principles File,CII Australia, Brisbane.
Construction Industry Institute (CII) (1993), Preview of Constructability Implementation, CII,Austin, TX.
Construction Industry Institute Australia (CII Australia) (1996), Constructability Manual, CIIAustralia, Brisbane.
Construction Industry Research and Information Association (CIRIA) (1983), Buildability:An Assessment, CIRIA, London.
Construction Industry Review Committee (CIRC) (2001), Construct for Excellence: Report of theConstruction Industry Review Committee, CIRC, Hong Kong.
Construction Management Committee (CMC) of the ASCE Construction Division (1991),“Constructability and constructability programs: white paper”, Journal of ConstructionEngineering and Management, Vol. 117 No. 1, pp. 67-89.
Denman, C. (2001), “Design and buildability”, Building Design, March 30, p. 8.
IJQRM24,6
598

Dulaimi, M.F., Florence, Y.Y.L. and Ofori, G. (2004), “Engines for change in Singapore’sconstruction industry: an industry view of Singapore’s construction 21 report”, Buildingand Environment, Vol. 39 No. 6, pp. 699-711.
Economic Development Council (EDC) (1967), Action on the Banwell Report: A Survey of theImplementation of the Recommendations of the Committee Under the Chairmanship ofSir Harold Banwell on the Placing and Management of Contracts, HMSO, London.
Egan, J. (1998), Rethinking Construction: The Report of the Construction Task Force to the DeputyPrime Minister, John Prescott, on the Scope for Improving the Quality and Efficiency of UKConstruction, Department of the Environment, Transport and the Regions, London.
Eldin, N.N. (1999), “Impact of employee, management and process issues on constructabilityimplementation”, Construction Management and Economics, Vol. 17 No. 6, pp. 711-20.
Elgohary, M., Fairclough, N. and Ricciuti, R. (2003), “Constructability – from Qinshan to theACR”, Nuclear Plant Journal, Vol. 21 No. 5, pp. 31-5.
Emmerson, H. (1962), Survey of Problems Before the Construction Industry, Ministry of Works,London.
Fellows, R. and Liu, A. (2003), Research Methods for Construction, Blackwell Science, Oxford.
Ferguson, I. (1989), Buildability in Practice, Mitchell Publishing, London.
Fisher, D.J., Anderson, S.D. and Rahman, S.P. (2000), “Integrating constructability tools intoconstructability review process”, Journal of Construction Engineering and Management,Vol. 126 No. 2, pp. 89-96.
Ford, D.N., Anderson, S.D., Damron, A.J., Casas, R.D.L., Gokmen, N. and Kuennen, S.T. (2004),“Managing constructability reviews to reduce highway project durations”, Journal ofConstruction Engineering and Management, Vol. 130 No. 1, pp. 33-42.
Fox, S., Marsh, L. and Cockerham, G. (2002), “Constructability rules: guidelines for successfulapplication to bespoke buildings”, Construction Management Economics, Vol. 20 No. 8,pp. 689-96.
Francis, V.E., Mehrtens, V.M., Sidwell, A.C. and McGeorge, W.D. (1999), “Constructabilitystrategy for improved project performance”, Architectural Science Review, Vol. 42,pp. 133-8.
Geile, R.J. (1996), “Constructability, ‘the stretch version’”, Transactions of AACE International,pp. VE&C.6.1-VE&C.6.5.
Gibson, G.E., McGinnis, C.I. and Flanigan, W.S. (1996), “Constructability in public sector”,Journal of Construction Engineering and Management, Vol. 122 No. 3, pp. 274-80.
Glavinich, T.E. (1995), “Improving constructability during design phase”, Journal ofArchitectural Engineering, Vol. 1 No. 2, pp. 73-6.
Gray, C. (1983), Buildability: the Construction Contribution, The Chartered Institute of Building,Ascot.
Griffith, A. (1984), Buildability – The Effect of Design and Management on Construction (a CaseStudy), Department of Building, Heriot-Watt University, Edinburgh.
Griffith, A. (1987), An Investigation into Factors Influencing Buildability and Levels of Productivityfor Application to Selecting Alternative Design Solutions – A Preliminary Report, TheChartered Institute of Building, London.
Griffith, A. and Sidwell, A.C. (1997), “Development of constructability concepts, principles andpractices”, Engineering, Construction and Architectural Management, Vol. 4 No. 4,pp. 295-310.
Measures toimprove
constructability
599

Harbuck, R.H. (1991), “Constructability and the cost engineer”, American Association of CostEngineers, pp. B.5.1-B.5.3.
Hon, S.L., Gairns, D.A. and Wilson, O.D. (1988), “Buildability: a review of research and practice”,Australian Institute of Building Papers, Vol. 3, pp. 101-18.
Hugo, F., O’Connor, J.T. and Ward, W.V. (1990), Highway Construct *Ability Guide, ResearchProject, 3-6-88-1149, Center for Transportation Research, University of Texas, Austin, TX.
Ireland, V. (1985), “The role of managerial actions in the cost, time and quality performance ofhigh-rise commercial building projects”, Construction Management and Economics, Vol. 3No. 1, pp. 59-87.
Jergeas, G. and Put, J.V.D. (2001), “Benefits of constructability on construction projects”, Journalof Construction Engineering and Management, Vol. 127 No. 4, pp. 281-90.
Kerridge, A.E. (1993), “Plan for constructability”, Hydrocarbon Processing, Vol. 72 No. 1, p. 35.
Kog, Y.C., Chua, D.K.H., Loh, P.K. and Jaselskis, E.J. (1999), “Key determinants for constructionschedule performance”, International Journal of Project Management, Vol. 17 No. 6,pp. 351-9.
Lam, P.T.I. (2002), “Buildability assessment: the Singapore approach”, Journal of Building andConstruction Management, Vol. 7 No. 1, pp. 21-7.
Love, P.E.D., Mandal, P., Smith, J. and Li, H. (2000), “Modelling the dynamics of design errorinduced rework in construction”, Construction Management and Economics, Vol. 18 No. 5,pp. 567-74.
Low, S.P. (2001), “Quantifying the relationships between buildability, structural quality andproductivity in construction”, Structural Survey, Vol. 19 No. 2, pp. 106-12.
Low, S.P. and Abeyegoonasekera, B. (2001), “Integrating buildability in ISO 9000 qualitymanagement systems: case study of a condominium project”, Building and Environment,Vol. 36 No. 3, pp. 299-312.
McGeorge, D., Chen, S.E. and Ostwald, M.J. (1992), “The development of a conceptual model ofbuildability which identifies user satisfaction as a major objective”, paper presented at theCIB Conference, Rotterdam.
Mbamali, I., Aiyetan, O.A. and Kehinde, J.O. (2005), “Building design for buildability: aninvestigation of the current practice in Nigeria”, Building and Environment, Vol. 40 No. 9,pp. 1267-74.
National Economic Development Office (NEDO) (1975), The Wood Report: The Public Client andthe Construction Industry, HMSO, London.
Nima, M.A., Abdul-Kadir, M.R. and Jaafar, M.S. (1999), “Evaluation of the engineer’s personnel’srole in enhancing the project constructability”, Facilities, Vol. 17 No. 11, pp. 423-30.
Nima, M.A., Abdul-Kadir, M.R., Jaafar, M.S. and Alghulami, R.G. (2001a), “Constructabilityimplementation: a survey in the Malaysian construction industry”, ConstructionManagement and Economics, Vol. 19 No. 8, pp. 819-29.
Nima, M.A., Abdul-Kadir, M.R. and Jaafar, M.S. (2001b), “Evaluation of the role of thecontractor’s personnel in enhancing the project constructability”, Structural Survey, Vol. 19No. 4, pp. 193-200.
Nima, M.A., Abdul-Kadir, M.R., Jaafar, M.S. and Aighulami, R.G. (2004), “Constructabilityconcepts in Kuala Selangor Cable-Stayed bridge in Malaysia”, Journal of ConstructionEngineering and Management, Vol. 130 No. 3, pp. 315-21.
Opfer, N.D. (1994), “Improving constructability in concrete construction”, Transactions of AACEInternational, pp. MAT.3.1-MAT.3.5.
IJQRM24,6
600

Pepper, H.C. (1994), “The benefits of constructability reviews during the design of environmentalcapital projects”, Cost Engineering, Vol. 36 No. 2, pp. 19-21.
Phair, M. (2005), “Software enables ‘virtual constructability’”, Building Design & Construction,Vol. 46 1, January, p. 12.
Poh, P.S.H. and Chen, J. (1998), “The Singapore buildable design appraisal system: a preliminaryreview of the relationship between buildability, site productivity and cost”, ConstructionManagement and Economics, Vol. 16 No. 6, pp. 681-92.
Russell, J.S., Swiggum, K.E., Shapiro, J.M. and Alaydrus, A.F. (1994), “Constructability related toTQM, value engineering, and cost/benefits”, Journal of Performance of ConstructedFacilities, Vol. 8 No. 1, pp. 31-45.
Southeast Asia Building (SEAB) (1993), “Interviews: are we ready for buildability?”, SEAB,March.
Trigunarsyah, B. (2004a), “A review of current practice in constructability improvement: casestudies on construction projects in Indonesia”, Construction Management and Economics,Vol. 22 No. 6, pp. 567-80.
Trigunarsyah, B. (2004b), “Constructability practices among construction contractors inIndonesia”, Journal of Construction Engineering andManagement, Vol. 130 No. 5, pp. 656-69.
Trigunarsyah, B. (2004c), “Project owners’ role in improving constructability of constructionprojects: an example analysis for Indonesia”, Construction Management and Economics,Vol. 22 No. 8, pp. 861-76.
Ugwu, O.O., Anumba, C.J. and Thorpe, A. (2004), “The development of cognitive models forconstructability assessment in steel frame structures”, Advances in Engineering Software,Vol. 35 Nos 3-4, pp. 191-203.
Uhlik, F.T. and Lores, G.V. (1998), “Assessment of constructability practices among generalcontractors”, Journal of Architectural Engineering, Vol. 4 No. 3, pp. 113-23.
Vardhan, C.H., Chandrika, H. and Yates, J.K. (1992), “Implementation of constructabilityconcepts”, Project Management Journal, Vol. 23 No. 4, pp. 29-38.
Wong, F.W.H., Lam, P.T.I., Chan, E.H.W. and Shen, L.Y. (2003), “An empirical system for scoringbuildability of design in the Hong Kong construction industry”, in Leung, B.Y.P., Kong,S.C.W. and Chan, A.P.L. (Eds), The CIB Student Chapters International Symposium,Hong Kong Polytechnic University, Hong Kong, pp. 45-56.
Yang, Y.Q., Wang, S.Q., Dulaimi, M. and Low, S.P. (2003), “A fuzzy quality function deploymentsystem for buildable design decision-makings”, Automation in Construction, Vol. 12 No. 4,pp. 381-93.
Young, J.A. III (1998), “Constructability in the design firm”, Cost Engineering, Vol. 40 No. 2,pp. 33-5.
Yu, W.D. and Skibniewski, M.J. (1999), “Quantitative constructability analysis with aneuro-fuzzy knowledge-based multi-criterion decision support system”, Automation inConstruction, Vol. 8 No. 5, pp. 553-65.
Zin, R.M., Nesan, L.J. and Mohammed, A.H. (2004), “Constructability assessment framework”,Journal of Building and Construction Management, Vol. 9 No. 1, pp. 44-58.
Corresponding authorFranky W.H. Wong can be contacted at: [email protected]
Measures toimprove
constructability
601
To purchase reprints of this article please e-mail: [email protected] visit our web site for further details: www.emeraldinsight.com/reprints

Dynamic robust design withmissing data
Hsu-Hwa ChangDepartment of Business Administration, National Taipei College of Business,
Taipei, Taiwan
Abstract
Purpose – Robust parameter design is conventionally analyzed by means of statistical techniques.However, the statistical-based approach is inefficient when optimizing a dynamic system in regards toquantitative control factors and missing observations. The aim of this paper is to propose analternative approach based on data mining tools to model and optimize dynamic robust design withmissing data.
Design/methodology/approach – A three-phase approach based on data mining techniques isproposed. First, a back-propagation network is trained to construct the response model of a dynamicsystem. Second, three formulas of performance measures are developed to evaluate the predictedresponses of the response model. Finally, a genetic algorithm is then performed to obtain the optimalparameter combination via the response model.
Findings – The proposed approach is capable of dealing with both qualitative and quantitativecontrol factors for dynamic systems as well as static systems. In addition, the proposed approach canefficiently treat parameter experiments with missing data. The proposed approach is demonstratedwith a numerical example. Results show that this three-phase data mining approach outperforms theconventional statistic-based approaches.
Originality/value – This work provides a relatively effective approach to optimize the three types ofdynamic robust parameter design. Performing the approach, practitioners do not require muchbackground in statistics but instead rely on their knowledge of engineering.
Keywords Data analysis, Design for quality
Paper type Research paper
IntroductionThe shorter time-to-market requirement motivates manufacturers to promptly developnew products of high quality in order to meet consumers’ needs and retain acompetitive edge. Therefore manufacturers have to focus on optimizing the qualitydesign system of products and processes. The quality design system consists of threephases: system design, parameter design, and tolerance design. Particularly, parameterdesign is the most addressed phase in practical applications, it involves determiningthe best parameter settings for the control factors so that system has high performanceand is insensitive to uncontrollable (noise) factors. Parameter design can be dividedinto two classes: static and dynamic characteristics. A system with static characteristicobtains the value of the quality characteristic of interest as close as possible to aspecified target value. Whereas with dynamic systems the aim is to make the outputsapproach the floating target values (which depend on the input signal values assignedby the system operator). Since dynamic systems are frequently encountered in practiceand are more difficult to analyze, they have received increasing attention. There hasbeen some literature discussing the parameter design of dynamic systems (seeWasserman, 1996; Lunani et al., 1997; McCaskey and Tsui, 1997; Tsui, 1999;
The current issue and full text archive of this journal is available at
www.emeraldinsight.com/0265-671X.htm
IJQRM24,6
602
Received September 2005Revised December 2005Accepted February 2006
International Journal of Quality &Reliability ManagementVol. 24 No. 6, 2007pp. 602-616q Emerald Group Publishing Limited0265-671XDOI 10.1108/02656710710757790

Lesperance and Park, 2003). Besides, Zang et al. (2005) recently presented a review ofthe applications of dynamic parameter design.
A dynamic system ideally assumes that a linear form exists between the responseand the signal factors. The ideal function can be expressed as: Y ¼ bM þ 1, where Ydenotes the response of a dynamic system, M stands for the signal factor, b is the slopeor system’s sensitivity, and 1 represents a random error. Taguchi (1987) introduced therobust design methodology to optimize parameter design which employs thesignal-to-noise (SN) ratio to measure the performance of each experimental run. Theaim of Taguchi’s robust design is to find the combination of control factors so that theeffect of noise factors on the response of the system is as small as possible. Thedynamic SN ratio defined by Taguchi is logðb 2=S 2Þ, where b is the predicted slope ofthe linear relationship between the response and signal, and S 2 is the sample errorvariance. The larger SN ratio means the responses have less deviation from theirtargets. After calculating the SN ratio and the slope, a two-step optimization procedureis used to obtain the best parameter settings. First, the levels of the significant factorsare selected in order to maximize the dynamic SN ratios. A significant factor is acontrol factor that has an effect on variation. Then, the levels of the adjustment factorsare selected to bring the slope on target (according to the characteristics of theresponses, i.e. BLB, DNB, and DSB). An adjustment factor is a control factor that hasan effect on slope but not on variation. Alternatively, Taguchi method uses theorthogonal array to arrange the factor allocations of an experiment. The strength of theorthogonal array experimental design is to study many effects with relatively fewexperimental runs stemming from a balanced design. The orthogonality within thearray means that there are an equal number of data points for each level of each factoras for each level of all of the other factors under consideration. For parameter design,this means that there are an equal number of data points for each column of the outerarray as well as a consistent quantity of readings or measurements for each row of theinner array. If a dynamic characteristic is involved, there are also an equal number ofdata points for each signal factor value. In the real world, however, it is not alwayspossible to obtain data for each of the experimental settings. The experimental datamay become lost or were never available. Perhaps a specific sample was lost, or maybea data sheet has been misplaced. Perhaps the study involved specially built prototypes,and an insufficient quantity was produced. This incomplete data is referred to asmissing data. Missing data results in an unbalanced experiment, thus, it makes theTaguchi method inefficient (Peace, 1993). Other limitations of the Taguchi method canbe found in Robinson et al. (2004), Maghsoodloo et al. (2004), and Zang et al. (2005).
In contrast to Taguchi’s SN ratio and two-step procedure, Welch et al. (1990) proposedthe response modeling approach which first models the observed response and thendetermines the best factor settings from the fitted response model. Miller and Wu (1996)applied the response modeling approach based on statistical tools to analyze dynamicrobust design problems. Tsui (1999) further investigated the response modelingapproach for the dynamic robust problems and derived the relationships between theeffect estimates of the loss model approach and those of the response model approach. Inthis study, we propose an alternative approach to modeling and optimizing dynamicsystems, which is based on data mining tools and the concept of the response modeling.The proposed approach extends Su et al.’s (2000) method that employed aback-propagation network (BPN) and a genetic algorithm (GA) and is capable ofresolving dynamic systems with missing data, and obtaining the optimal parametervalues that are no longer restricted to the solution points composed of discrete
Dynamic robustdesign
603

experimental levels. For applying the approach, the dynamic characteristics can befurther classified into dynamic larger-the-better (DLB), dynamic nominal-the-better(DNB) and dynamic smaller-the-better (DSB) according to the desired target slope. Hence,the ideal target function is replaced as: Y ¼ btM þ 1, where bt is the desired targetslope. The value bt is set as bt ¼ 1, 0 , bt , 1, and bt ¼ 0 for DLB, DNB, and DSB,respectively. Park and Yum (2003) derived the performance measures (PM) for the threecases based on the quality loss and the costs related to the chosen value of the signalfactor. In this study, alternative formulas of PMs based on robustness of responses aredeveloped to evaluate how good a specific parameter setting is, and are used to obtain asuperior parameter setting while performing the GA.
BPN and GABack-propagation network (BPN) is a multi-layer network with learning ability, and isusually employed to approximate any continuous mapping from the input patterns tothe output patterns. Thus, a BPN is suitable to apply to construct the relationshipfunction between the parameters and responses of a system. A nonlinear transformationfunction of sigmoid function f ¼ 1=ð1 þ e2xÞ is used between the connections of inputlayer, hidden layer and output layer (Funahashi, 1989). BPN learning employs agradient-descent algorithm to adjust weights on the connections and to minimize themean-square error between the target data and the predictions of the neural network.The training data set is initially collected to develop a BPN model. Through a supervisedlearning rule the data set is comprised of an input and an actual output (target). Thegradient-descent learning algorithm enables a network to enhance its performance byself-learning. While training the network model, the performance of the model issensitive to various network structure choices, the parameter settings of learning rate,and momentum coefficient (Haykin, 1999). A common approach to obtain a well-trainednetwork structure is to use the trial and error method, i.e. we can train several candidatenetworks that have a different number of hidden layers and nodes in each hidden layer,and then select the one with the best performance. BPNs have been successfully appliedto optimization of parameter design, see Rowlands et al. (1996), Anjum et al. (1997), Chiuet al. (1997), and Su and Miao (1998) for further details in industrial applications.Particularly, Su and Miao (1998) developed a neural network-based procedure foranalyzing experiments with missing data. This procedure involves training a neuralnetwork by reading the fractional factors combinations and experimental data to predictthe responses of all possible factor level combinations, and then determining the optimalfactor combination with the best response. The above literature shows that the neuralnetwork approach is capable of treating continuous parameter values and missing data.
Genetic algorithm (GA) is a probabilistic optimization algorithm based on the modelof natural evolution and the algorithm has clearly demonstrated its capability to creategood approximate solutions in complex optimization problems. GA starts with an initialset of random solutions called a population. Each individual in the population is called achromosome, representing a solution to the problem at hand. A chromosome isrepresented by a vector, which is organized by a sequence of the parameter values for theproblem. The individual sites on the chromosome where the parameter values are storedare called genes. The chromosomes evolve through successive iterations, calledgenerations. During each generation, the chromosomes are evaluated by a fitnessfunction. To create the next generation (called offspring), GA applies a selection operatorto select the candidate chromosomes from the present generation. By imitating theprocess of Darwinian evolution, survival of the fittest, the fitter chromosomes have a
IJQRM24,6
604

higher probability of being selected. Then, GA uses a crossover operator and a mutationoperator to create the offspring. The crossover operator proceeds in two steps. First,several pairs of chromosomes are randomly selected by applying a predeterminedcrossover rate. Second, for each pair, it creates a random cut-point and then generates theoffspring by swapping the genes from the cut-point to the end of the chromosomes. Themutation operator performs random changes in various chromosomes by applying apredetermined mutation rate. The crossover rate and mutation rate are both between 0and 1; they control the expected number of chromosomes to mate and the number ofgenes to mutate, respectively. The process continues until a desirable solution is obtainedor a predetermined generation size is reached (Goldberg, 1989; Gen and Cheng, 1997a).
In recent years, some literature has presented the hybrid approach that combines aBPN with a GA to optimize the design of products or processes. The implemented resultsverified that this hybrid approach is effective and efficient. Sette et al. (1996) used aneural network to simulate a spinning production process; the subsequent optimizationis done by means of a GA. Coit and Smith (1996) used the hybrid approach to optimize acombinatorial engineering design problem with consideration to a system reliabilityconstraint. Also, Suh et al. (2000) trained a BPN to learn the input (the location and depthof a crack) – output (the structural Eigenfrequencies) relationship of a structural system.With the trained network, a GA is used to identify the crack location and depthminimizing the difference from the measured frequencies. In addition, Cook et al. (2000)employed the hybrid approach to optimize a particleboard manufacturing process. Chowet al. (2002) introduced the hybrid approach in the optimal control of absorption chillersystem. Aijun et al. (2004) presented the hybrid approach for the analysis and predictionof the correlation between processing parameters and physical properties incarbon/carbon composites. Particularly, Su et al. (2000) applied a BPN and a GA tooptimize static parameter design problems. The hybrid approach trained a neuralnetwork to construct the relationship function between the parameters and the responsesof a system, a GA is then used to obtain the best parameter combination through thetrained network. Our study extends Su et al.’s (2000) method to resolve dynamic robustdesigns with missing data. To apply GA to our optimization problems, theimplementation criteria of GA are: real number coding, arithmetic crossover,non-uniform mutation, and top pop size selection (Gen and Cheng, 1997b).
Proposed approachFor robust design, suppose response yijk is determined by a set of signal levelsMi ¼ ðM 1; :::;MsÞ, a set of control factor vectors X j ¼ ðx1; :::; xpÞ, and a set of noisefactors Nk ¼ ðN 1; :::;NnÞ: The dynamic robust design problems can be defined as:yijk ¼ f ðMi;X j;NkÞ þ 1ijk, where f ðMi;X j;NkÞ denotes the response functionbetween the ijkth response and the corresponding setting at the ith level of signalfactor, the jth control factor vector, and the kth level of noise factor.
The proposed approach for resolving dynamic robust design consists of threephases. The first phase involves training a BPN to build the response model of adynamic system by incorporating the experimental data. The response model is thenused to predict responses of any parameter settings within their parameter bounds.The second phase develops PMs for the three types of dynamic systems to evaluate thepredicted responses. The third and final phase involves converting PMs into fitnessvalues and providing the optimization process, which minimizes the fitness values byperforming GA. The schematic diagram of the proposed hybrid approach is shown inFigure 1. The details of the three phases are described as follows.
Dynamic robustdesign
605

Response modelingThe response model f ðMi;X j;NkÞ of a dynamic system is built by a well-trainedBPN. Through the network we can accurately predict the corresponding responseby giving a set of any values within the ranges of the parameters. Therefore thenetwork is capable of treating continuous values of control factors. The schematicdiagram of the network is shown in Figure 2. The processes of response modelingare as follows:
Figure 1.The schematic diagram ofthe proposed approach
IJQRM24,6
606

. Step 1: Obtain the training and testing patterns by randomly selecting the datafrom the experimental data.
. Step 2: Build several candidates of network structures including input nodes,hidden layers, hidden nodes and output nodes.
. Step 3: Set the learning schedule including learning rate, momentum coefficientand execution iterations.
. Step 4: Do Step 5-6 for each network structure.
. Step 5: Randomly initialize weights between layers.
. Step 6: Repeat Steps 7-10 until the number of learning iterations has arrived.
. Step 7: Obtain the training and testing patterns by randomly selecting the data.
. Step 8: Apply the transfer function to predict the outputs.
. Step 9: Calculate the error between the predicted output and the target output.
. Step 10: Adjust the weights of the network.
. Step 11: Choose the best one from the candidate of networks as the system’sresponse model, i.e. yijk ¼ f ðMi;X j;NkÞ. The performance evaluation criterionfor the BPN training is herein the root of mean-square error (RMSE).
Evaluating PMsTo apply a GA to minimization problems, the PM can be generated by averaging themean-square error (MSE) over a specified range for the signal factor at control factor vectorX j. The purpose of calculating the value of PM is to evaluate how good a parametersetting is, and to provide the fitness function while performing a GA. The idea ofconstructing the formulas of PMs is quite intuitive, which is based on the theories of robustdesign. According to the definition of DSB problems, the predicted response yi is expectedto be as close to zero as possible at each signal level, i.e. the target slope bt equals zero forall levels of signal factors. In order to reduce the influence from the magnitude of the signalvalue, the predicted responses are divided by the corresponding signal value. The square
Figure 2.Three-layer BPN for a
dynamic robust design
Dynamic robustdesign
607

error of bi away from the target slope zero can be written as bi 2 0� �2
or yi=Mi 2 0� �2
.With considering noise levels the PM of DSB can be expressed as:
PMDSB ¼1
sn2 1
Xsi¼1
Xnk¼1
yijkMi
� �2
; ð1Þ
where:
yijk ¼ the predicted response value at the ith signal factor, jth control factor vector,and the kth noise factor.
s ¼ number of signal factor levels.
n ¼ number of noise factor levels.
According to the definition of DLB problems, the larger the predicted response yi ateach signal level the better performance the system has, i.e. the target slope bt equalsinfinity. For measuring the square error of bi , we employ a sufficiently large value ofthe desired slope bmax to represent the target slope. Thus, DLB types are transferred tomake the slope bi as close to bmax as possible. Accordingly, the PM of DLB can beexpressed as:
PMDLB ¼1
sn2 1
Xsi¼1
Xnk¼1
yijk 2 bmax Mi
Mi
� �2
; ð2Þ
According to the definition of DNB problems, the target slope bt is a specific value. Thegoal is to simultaneously manipulate the predicted response yi as close to the targetslope bt as possible, and to minimize the variance of the predicted responses. FollowingTaguchi’s theories, we employ the dynamic SN ratio (i.e. logðb 2=s2Þ) to the PM ofDNB. Because a larger value of the SN ratio means a smaller amount of variations, wetake the reciprocal of the SN ratio to measure the PM. Thus, the PM of DNB can beexpressed as:
PMDNB ¼ logS 2
b 2
� �; ð3Þ
where
S 2 ¼1
sn2 1
Xsi¼1
Xnk¼1
yijk 2 bMi
� �2;
and
b ¼
Xsi¼1
Xnk¼1
Miyijk
nXsi¼1
M2i
IJQRM24,6
608

Obtaining the optimal parameter combinationGA is directly used to obtain the optimal responses and the corresponding values of thecontrol factors from the possible solution spaces. Herein, the possible solution isrepresented by a chromosome. Each gene in the chromosome represents the value ofthe control factor. The parameter bounds are determined according to thecharacteristics of the problems. The operational steps are given as follows:
. Step 1: Select an appropriate formula of PM from Equations (1)-(3) according tothe type of systems. For our problems, GA is used here to optimize aminimization problem. The selected formula is then represented as a fitnessfunction for GA.
. Step 2: Determine the upper and lower bounds of each of the control factors. Forqualitative control factors, the values are set as discrete numbers. Forquantitative control factors, the values are set as continuous numbers.
. Step 3: Set population size, crossover rate, mutation rate, maximum number ofgenerations
. Step 4: Create an initial population by randomly selecting the values of thecontrol factors within their bounds.
. Step 5: Repeat steps 6-10 until the maximum number of generations is reached.
. Step 6: Obtain predicted responses of factor combination via the response model.
. Step 7: Evaluate the fitness value of the predicted responses from PM formulas.
. Step 8: Select generation towards an optimal solution according to fitness values.
. Step 9: Determine the crossover pairs from the current generation.
. Step 8: Perform crossover on the pair of chromosomes with a crossover rate.
. Step 9: Mutate the chromosomes to yield a next generation with a mutation rate.
. Step 10: Call the current factor combination the optimal solution.
. Step 11: Obtain the predicted response value by inputting the values of theoptimal factor combination to the response model.
Illustrative exampleAn example of a dynamic vacuum testing unit study (Dick, 1989) is adopted in thisstudy, which is a DLB problem. The objective of this experiment is to make themanufactured vacuum testing units more sensitive to the extruded inside tubingdiameter of the assembled vacuum harnesses while simultaneously reducing theexperienced flow variation. One main concern encountered when testing a vacuumharness is the ability for each individual harness circuit to pass the minimumallowance for air flow. Air flow directly relates to the speed at which the environmentalmodes within the car; especially heater control, air conditioning, and the switching ofan automotive transmission. The testing units designed to examine the functionalcriteria of the vacuum harness must be able to test harnesses that are dimensionallydifferent. These dimensional differences pertain to the inside diameter of the extrudedtubing that makes up the finished product. As inside diameter increases, flow rates willincrease. Figure 3 shows the linear relationship between tubing inside diameter and airflow rate. What this experiment is attempting to avoid is the design of a productionvacuum testing unit that would exhibit nonlinear performance in air flow rates astubing inside diameter varies. The dynamic analysis method used here attempts toincrease the slope of the line shown on the graph. To further state this, a line that
Dynamic robustdesign
609

approaches no slope or a vertical line is the desired intent of this experiment.Conversely, a resulting relationship that approaches a slope of zero or a horizontal lineis not desired. The response of this experiment is airflow rate; the signal factor istubing inside diameter. This experiment aims to make the response as large as possibleby determining the values of the factor set. Table I lists the related factors and theirlevels. The Taguchi L27 orthogonal array was used to allocate the factor combinations.Table II lists the allocation of the parameter levels and the experimental data. Theoptimal combination of control factor levels determined by Taguchi method is
Values of levelsControl factors 1 2 3
Aa Valve configuration 1 2 3B Filter micron rating 3 7 11Ca Internal tubing connections 1 2 3D Internal buffer tank volume (in3) 4 8 12Ea Internal tubing length 1 2 3F Valve manifold temperature (degrees Fahrenheit) 70 100 130G External buffer tank volume (in3) 30 60 90H Stabilization time (second) 1 2 3J Atmospheric restrictor pulse (second) 0 0.25 0.50K Internal tubing bend radius (degree) 0 45 90Qa Filter surface area 1 2 3
Response (quality characteristic)Air flow rate (in3/min)
Signal factorTubing inside diameter (inch)M1 ¼ 0.05M2 ¼ 0.06M3 ¼ 0.07
Noise factorN1 ¼ Tester 1N2 ¼ Tester 2
Note: adenotes the control factor is qualitative dataTable I.Factors and their levels
Figure 3.Relationship betweentubing inside diameter andair flow rate
IJQRM24,6
610

Res
pon
ses
Con
trol
fact
ors
M1
¼0.
05M
2¼
0.06
M3
¼0.
07N
o.A
aB
Ca
DE
aF
GH
JK
Qa
N1
N2
N1
N2
N1
N2
11
31
41
7030
10
01
3,21
03,
200
4,31
54,
325
5,60
0c5,
380
21
31
42
100
602
0.25
452
3,32
03,
400
4,21
04,
310
5,27
55,
290
31
31
43
130
903
.50
903
3,22
53,
425
4,290c
4,33
55,
265
5,41
04
17
28
170
302
0.25
903
3,19
52,
995
4,10
04,
245
5,08
55,
315
51
72
82
100
603
0.50
451
3,325b,c
3,39
04,
245
4,39
55,
254
5,235c
61
72
83
130
901
00
23,
245
3,10
04,
135
4,14
05,
250
5,12
57
111
312
170
303
0.50
452
3,40
03,
510
4,32
54,
410
5,46
05,
380
81
113
122
100
601
090
33,
525
3,19
04,
145
4,21
05,
275
5,16
09
111
312
313
090
20.
250
13,
250
3,19
04,
380
4,33
5c5,
350
5,44
510
23
212
110
090
10.
500
33,
190
3,37
04,
290
4,33
55,
105
5,20
011
23
212
213
030
20
451
3,41
03,275b,c
4,15
04,
195
5,28
05,
245
122
32
123
7060
30.
2590
23,
180
3,32
04,
385
4,34
55,
210
5,30
513
27
34
110
090
20
902
3,23
53,
180
4,35
04,
320
5,320c
5,22
514
27
34
213
030
30.
2545
33,
260
3,39
04,
305
4,41
55,
360
5,41
015
27
34
370
601
0.50
01
3,09
03,
120
4,13
0c4,
225
5,14
05,
245
162
111
81
100
903
0.25
451
3,45
53,
290
4,14
04,
250
5,23
05,
130c
172
111
82
130
301
0.50
902
3,34
53,
250
4,26
54,
320
5,19
05,
285
182
111
83
7060
20
03
3,45
53,
395
4,23
54,
335
5,16
55,
245
193
33
81
130
601
0.25
02
3,32
53,
450
4,32
04,250b,c
5,32
55,
260
203
33
82
7090
20.
5045
33,255c
3,29
04,
220
4,25
05,
120
5,19
521
33
38
310
030
30
901
3,41
03,
320
4,21
04,
395
5,01
05,
320
223
71
121
130
602
0.50
901
3,32
53,
330c
4,23
54,
240
5,23
55,
225
233
71
122
7090
30
452
3,35
53,
365
4,35
04,
365
5,32
05,
330
243
71
123
100
301
0.25
03
3,31
53,
320
4,36
04,
365
5,25
05,245b,c
253
112
41
130
603
045
33,
345
3,21
04,235c
4,36
55,
245
5,32
526
311
24
270
901
0.25
901
3,32
53,
290
4,35
54,
390
5,34
55,
390
273
112
43
100
302
0.50
02
3,42
03,
445
4,42
54,
455
5,525b,c
5,50
0
Note:
ad
enot
esth
efa
ctor
val
ue
isq
ual
itat
ive;
ital
icd
enot
es6%
dat
am
issi
ng
;bd
enot
es3%
dat
am
issi
ng
;an
dc d
enot
es9%
dat
am
issi
ng
Table II.Control factor allocation
and the responses
Dynamic robustdesign
611

A3B3C1D2E2F2G2H3J3K2Q3. To demonstrate the effectiveness of our approach fortreating missing data, ten observations of the experimental data (i.e. 6 percent of totalobservations) are assumed missing, which are shown in Table II. The incomplete datais analyzed by the three-phase approach to obtain the best combination of controlfactors, which are presented as follows.
Phase 1: Response modelingUsing our approach, the response model of the system is first constructed by a BPN. ABPN is trained by assigning the (control factor values, signal value, noise level)/response as the input/output of the network. To construct a BPN, we randomly select128 training patterns and 24 testing patterns from Table II. Table III lists severaloptions of the network architecture. In addition, the structure 13-21-1 is selected toobtain a better performance. This study makes use of the BPN software packageQnetw (www.qnetv2k.com). In this case, the control factors (i.e. possible solutionvector X in performing GA) are X ¼ ðA;B;C;D;E;F;G;H ; J ;K;QÞ.
Phase 2: Evaluating the PM valueThe predicted response value yijk can be obtained by incorporating the ith signal value,the jth possible solution vector, and the kth noise level into the response model. For thiscase, PMDLB is selected to measure the performance of each possible solution vectorX j; moreover, bmax is set at a reasonable value of 83,000. The formula PMDLB for thiscase is as follows:
PMDLB ¼ 1=5� �X3
i¼1
X2
k¼1
yijk 2 83000Mi
� �=Mi
� �2ð4Þ
where:
M1 ¼ 0.05.
M2 ¼ 0.06.
M3 ¼ 0.07.
RMSEArchitecture Training Testing
13-16-1 0.0145 0.027713-17-1 0.0132 0.024013-18-1 0.0127 0.027513-19-1 0.0136 0.024213-20-1 0.0134 0.028213-21-1 0.0130 0.023413-22-1 0.0141 0.026713-23-1 0.0131 0.027713-24-1 0.0129 0.025513-25-1 0.0128 0.025413-26-1 0.0122 0.0283
Notes: Learning rate is set as auto-adjusting between 0.01 and 0.3; momentum coefficient is 0.80;number of iterations is 30,000
Table III.The candidate BPNmodels (6 percent missingdata)
IJQRM24,6
612

Phase 3: Searching for the optimal parameter combinationFor performing the GA, Equation (4) is used to represent the fitness function of this case.The operational conditions of GA are given in Table IV. The GA program is executedover 20 runs to obtain the optimal combination (1, 3, 1, 4, 1, 130, 30, 3, 0.46, 0, 1). Table Vlists the results of the implementation. Figure 4 provides a graphical comparison of theproposed approach and the Taguchi method. The results show that the proposedapproach improves the slope by 4254 and the SN ratio by 1.63 dB.
To further investigate the influence from the number of missing data, 3 percent (5observations) and 9 percent (15 observations) missing data are also analyzed by theproposed approach. The assumed missing observations are also given in Table II. Thewell-trained BPNs for the case of 3 percent missing and the case of 6 percent missingare 13-18-1 with 0.0231 of testing RMSE and 13-23-1 with 0.0271 of testing RMSE,respectively. The implemented results are in Table V and are compared with otherapproaches. The comparison indicates the proposed approach is effective in treatingdynamic robust design even when the system has 9 percent missing data.
ConclusionsDynamic robust designs have received increasing attention recently because they arefrequently encountered in practice and are more difficult to analyze. Taguchi method is
Item Operational conditions Values
1 Number of generations 2,0002 Population size 1003 Crossover rate 0.754 Mutation rate 0.0855 Ranges of eleven parameters (Aa, B, Ca, D, Ea,
F, G, H, J, K, Qa)(1, 3), (3, 11), (1, 3), (4, 12), (1, 3), (70, 130), (30,90), (1, 3), (0, 0.5), (0, 90) and (1, 3)
Note: adenotes the control factor is qualitative data
Table IV.The operational
conditions of GA
MethodsValues of the optimal factor settings(A, B, C, D, E, F, G, H, J, K, Q) Predicted responses b
SN(dB)
Taguchi method (3, 11, 1, 8, 2, 100, 60, 3, 0.5, 45, 3) M1: 3491, 3445M2: 4480, 4471M3: 5371, 5487
74,720 50.78
Proposed approach(with 6% missing)
(1, 3, 1, 4, 1, 130, 30, 3, 0.46, 0, 1) M1: 3627, 3812M2: 4704, 4915M3: 5594, 5669
78,974 52.41
Proposed approach(with 3% missing)
(1, 3, 1, 4, 1, 130, 30, 3, 0.47, 0, 1) M1: 3677, 3725M2: 4807, 4812M3: 5610, 5674
78,978 52.38
Proposed approach(with 9% missing)
(3, 9, 1, 4, 1, 121, 30, 3, 0.46, 0, 1) M1: 3511, 3537M2: 4522, 4655M3: 5437, 5621
76,231 50.38Table V.
A comparison of theTaguchi method and the
proposed approach
Dynamic robustdesign
613

commonly used to optimize the parameter design of a dynamic system. Taguchimethod uses adjustment factors to bring the slope on target; however, the adjustmentfactors cannot be guaranteed to exist in practice. Furthermore, even if the adjustmentfactors exist, interactions among adjustment factors and significant factors may occur,thereby increasing the trade-off judgment of designers. Alternatively, the process ofanalysis may become complicated if there is experimental data missing. The iterativeapproach suggested by Peace (1993) is usually used to estimate the missing data;however, the procedure is laborious to execute. In this study, the hybrid approachwhich combines a BPN with a GA is presented to overcome those drawbacks.
The proposed approach tackles three types of dynamic systems, which consists ofthe response modeling, the evaluation of PM values, and the process of obtaining theoptimal parameter combination. Particularly, a BPN is used to model the responsefunction, which is quite different form statistical approach. The continuous mapping ofa BPN expands the possible combinations into a continuous design space, i.e. thesolutions space are not restricted to the full combinations of factor levels. Thus, a GAcan be performed to search within the continuous design space to obtain the optimalparameter combination. So, the greater number of quantity factors, the more designspace the proposed approach can get. The illustrative example of DLB shows that theproposed approach outperforms the Taguchi method even if the system has missingdata. However, as the number of missing data increases, the effectiveness of theapproach decreases. It is worth note that there is no significant difference if the systemhas less than 6 percent missing data. The proposed approach can be applied to robustdesign of products or processes with dynamic systems as well as static systems.Implementing the proposed approach, a BPN and a GA should be integrated together,which can be easily achieved by a programmer. The limitation of the proposedapproach is that the obtained solutions are sensitive to the parameter settings of theBPN and GA. An exploration of the sensitivities of parameter settings is worth furtherinvestigation.
Figure 4.A graphical comparison
IJQRM24,6
614
References
Aijun, L.A., Hejun, L., Kezhi, L. and Zhengbing, G. (2004), “Applications of neural network andgenetic algorithms to CVI processes in carbon/carbon composites”, Acta Materialia,Vol. 52, pp. 299-305.
Anjum, M.F., Tasaddug, I. and Ahaled, A.S. (1997), “Response surface methodology: a neuralnetwork approach”, European Journal of Operational Research, Vol. 101, pp. 65-73.
Chiu, C.C., Su, C.T., Yang, G.H., Huang, J.S., Chen, S.C. and Cheng, N.T. (1997), “Selection ofoptimal parameters in gas-assisted injection molding using a neural network model andthe Taguchi method”, International Journal of Quality Science, Vol. 2, pp. 106-20.
Chow, T.T., Zhang, G.Q., Lin, Z. and Song, C.L. (2002), “Global optimization of absorption chillersystem by genetic algorithm and neural network”, Energy and Building, Vol. 34, pp. 103-9.
Coit, D.W. and Smith, A.E. (1996), “Solving the redundancy allocation problem using a combinedneural network/genetic algorithm approach”, Computers and Operations Research, Vol. 23No. 6, pp. 515-26.
Cook, D.F., Ragsdale, C.T. and Major, R.L. (2000), “Combining a neural network with a geneticalgorithm for process parameter optimization”, Engineering Application of ArtificialIntelligence, Vol. 13, pp. 391-6.
Dick, J.F. (1989), “Dynamic vacuum testing unit study”, paper presented at Case Studies &Tutorials: 7th Taguchi Symposium, ASI, pp. 27-39.
Funahashi, K. (1989), On the approximate realization of continuous mapping by neural network,Neural Networks, 2, pp. 183-192.
Gen, M. and Cheng, R. (1997a), “Foundations of genetic algorithms”, Genetic Algorithms andEngineering Design, John Wiley & Sons, New York, NY, pp. 1-41.
Gen, M. and Cheng, R. (1997b), “Constrained optimization problems”, Genetic Algorithms andEngineering Design, John Wiley & Sons, New York, NY, pp. 42-96.
Goldberg, D.E. (1989), “Computer implementation of a genetic algorithms”, Genetic Algorithms inSearch, Optimization, and Machining, Addison-Wesley, Reading, MA, pp. 59-88.
Haykin, S. (1999), “Multilayer perceptions”, Neural Networks, Prentice Hall International,Englewood Cliffs, NJ, pp. 156-255.
Lesperance, M.L. and Park, S.M. (2003), “GLMs for the analysis of robust design with dynamiccharacteristics”, Journal and Quality Technology, Vol. 35 No. 3, pp. 253-63.
Lunani, M., Nair, V.N. and Wasserman, G.S. (1997), “Graphical methods for robust design withdynamic characteristics”, Journal of Quality Technology, Vol. 29, pp. 327-38.
McCaskey, S.D. and Tsui, K.L. (1997), “Analysis dynamic robust design experiments”,International Journal of Production Research, Vol. 35 No. 6, pp. 1561-74.
Maghsoodloo, S., Ozdemir, G., Jordan, V. and Huang, C.H. (2004), “Strengths and limitations ofTaguchi’s contributions to quality, manufacturing, and process engineering”, Journal ofManufacturing Systems, Vol. 23 No. 2, pp. 73-126.
Miller, A. and Wu, C.F.J. (1996), “Parameter design for signal-response systems: a different lookat Taguchi’s dynamic parameter design”, Statistical Science, Vol. 11 No. 2, pp. 122-36.
Park, Y.G. and Yum, B.J. (2003), “Development of performance measures for dynamic parameterdesign problems”, International Journal of Manufacturing Technology and Management,Vol. 5 Nos 1/2, pp. 91-104.
Peace, G.S. (1993), “Missing and infeasible data”, Taguchi Methods: A Hands-On Approach,Addison-Wesley, Reading, MA, pp. 423-37.
Dynamic robustdesign
615

Robinson, T.J., Borror, C.M. and Myers, R.H. (2004), “Robust parameter design: a review”, Qualityand Reliability Engineering International, Vol. 20, pp. 81-101.
Rowlands, H., Packianather, M.S. and Oztemel, E. (1996), “Using artificial neural networks forexperimental design in off-line quality”, Journal of Systems Engineering, Vol. 6, pp. 46-59.
Sette, S., Boullart, L. and Langenhove, L.V. (1996), “Optimising a production process by a neuralnetwork/genetic algorithm approach”, Engineering Applications of Artificial Intelligence,Vol. 9 No. 6, pp. 681-9.
Su, C.T. and Miao, C.L. (1998), “Neural network procedures for experimental analysis withcensored data”, International Journal of Quality Science, Vol. 3, pp. 239-53.
Su, C.T., Chiu, C.C. and Chang, H.H. (2000), “Parameter design optimization via neural networkand genetic algorithm”, International Journal of Industrial Engineering, Vol. 7 No. 3,pp. 224-31.
Suh, M.W., Shim, M.B. and Kim, M.Y. (2000), “Crack identification using hybrid neuro-genetictechnique”, Journal of Sound and Vibration, Vol. 238 No. 4, pp. 617-35.
Taguchi, G. (1987), System of Experimental Design, Unipub/Kraus International, White Plains,NY.
Tsui, K.L. (1999), “Modeling and analysis of dynamic robust design experiments”,IIE Transactions, Vol. 31, pp. 1113-22.
Wasserman, G.S. (1996), “Parameter design with dynamic characteristics: a regressionperspective”, Quality and Reliability Engineering International, Vol. 12, pp. 113-7.
Welch, W.J., Yu, T.K., Kang, S.M. and Sacks, J. (1990), “Computer experiments for quality controlby parameter design”, Journal of Quality Technology, Vol. 22, pp. 15-22.
Zang, C., Friswell, M.I. and Mottershead, J.E. (2005), “A review of robust optimal design and itsapplication in dynamics”, Computers and Structures, Vol. 83, pp. 315-26.
About the authorHsu-Hwa Chang is Associate Professor in the Department of Business Administration atNational Taipei College of Business, Taiwan. He obtained a Master degree in IndustrialManagement from National Taiwan University of Science and Technology, and received a PhDdegree in Industrial Engineering and Management, National Chiao-Tung University, Taiwan.His current research interest includes advanced quality engineering and data mining inindustrial applications. He has published many papers in International Journal of SystemsScience, Expert Systems with Applications, International Journal of Industrial Engineering,Journal of the Chinese Institute of Industrial Engineers, International Journal of Innovation andTechnology Management, International Journal of Electronic Business Management, Journal ofQuality, etc. He can be contacted at: [email protected]
IJQRM24,6
616
To purchase reprints of this article please e-mail: [email protected] visit our web site for further details: www.emeraldinsight.com/reprints

Total quality management andperformance
The role of organization support andco-worker support
Therese A. JoinerSchool of Business, La Trobe University, Bundoora, Australia
AbstractPurpose – The purpose of this paper is to explore the relationship between the extent of total qualitymanagement (TQM) implementation and organization performance, and the moderating effect ofco-worker support and organization support on the TQM/performance relationship.
Design/methodology/approach – A questionnaire survey was developed and distributed to asample of firms selected from the motor vehicle parts and accessories industry.
Findings – Analysis of the data supports a strong positive relationship between the extent ofimplementation of TQM practices and organization performance. This study also found thatco-worker support and organization support moderated the relationship between TQMimplementation and organization performance
Research implications – This study has important implications for managers. First, it motivatesmanagers (and provides a justification) to invest in the time and resources to implement TQMprograms. Based on the results of this study, the implementation of TQM practices is associated withenhanced organization performance. Second, evidence from this study signals the importance ofdeveloping an environment or “culture” of support to further enhance the performance outcomes ofTQM implementation. If employees do not feel there is acknowledgement and support from theorganization and from work colleagues, then the implementation of TQM programs may besub-optimal.
Originality/value – There is increasing recognition of the importance of human factors in successfulTQM implementation. Within this context, no previous research has empirically examined thesynergistic moderating effect of co-worker support and organization support on the relationshipbetween TQM and performance.
Keywords Total quality management, Performance management, Organizational performance
Paper type Research paper
IntroductionThe core ideas of total quality management (TQM) were introduced in the mid-1980s by,most notably, W. Edwards Deming, Joseph Juran and Kaoru Ishikawa (Hackman andWageman, 1995). Whilst it is acknowledged that TQM is not a clear-cut concept(Hackman and Wageman, 1995), TQM is generally understood as an integratedorganization strategy for improving product and service quality (Waldman, 1994). Sincethe mid-eighties TQM has been (over) sold as a near-universal remedy for a range oforganizational problems, including improved organization performance. This isremarkable considering academics have acknowledged for many years that universalprincipals cannot be successfully applied to organizations. Contingency theory with its“no one best way” dictum, asserts that high performance is a function of the alignmentbetween organization systems/processes and various context factors. Indeed, empiricalresearch addressing successful TQM implementation is “crying out” for a contingencytheory approach: while most studies report a positive relationship between TQM and
The current issue and full text archive of this journal is available at
www.emeraldinsight.com/0265-671X.htm
TQM andperformance
617
Received September 2005Revised December 2005Accepted January 2006
International Journal of Quality &Reliability Management
Vol. 24 No. 6, 2007pp. 617-627
q Emerald Group Publishing Limited0265-671X
DOI 10.1108/02656710710757808

performance (e.g. Brah et al., 2002; Hendricks and Singhal, 2001; Kaynak, 2003; Terziovskiand Samson, 1999), some studies report a negative relationship between the two variables(e.g. McCabe and Wilkinson, 1998; Yeung and Chan, 1998). The identification ofcontextual factors effecting the successful TQM implementation has thus recentlyemerged as an important research agenda (Douglas and Judge, 2001; Sadikoglu, 2004).
Within the context of successful TQM implementation, there is increasing recognitionof the importance of human factors in quality management (Brah et al., 2002; Chen, 1997;Fok et al., 2000; Golhar et al., 1997; Montes et al., 2003). Many of the basic elements ofTQM involve people, such as teamwork, participative management, creativity, effectivecommunication, customer feedback, employee involvement and empowerment, employeeand management trust and support (Guimaraes, 1994). For an organization to realize thebenefits of TQM, the consideration of human factors is critical for the successfulimplementation of TQM. Human factors previously identified in the TQM literatureinclude management (leadership) style, type of employees, departmental interaction,management commitment, employee’s attitude toward change, authority to empoweremployees, rewards/recognition for innovation and citizenship behaviours (Mann andKehoe, 1995; Montes et al., 2003) This study examines two human (or behavioural)factors: co-worker support and organization support These two support variables areconsistent with the view that employees’ perception of tolerance, support, cohesion andthe intrinsic acknowledgement of employees organizational contributions are importantfactors in the successful implementation of TQM (Montes et al., 2003). TQM implementedwithin a supportive organization environment is more likely to motivate employees towork harder and smarter in achieving quality outcomes for the organization (Hackmanand Wageman, 1995) The purpose of this study is, therefore, to firstly examine theassociation between the implementation of TQM practices and organizationperformance, given past equivocal results; and secondly, to examine the moderatingeffect of co-worker support and organization support on the TQM/performancerelationship, consistent with a contingency theory approach.
Theoretical development and hypothesesTQM and performancePreliminary evidence seems to indicate that TQM-adopting firms obtain a competitiveadvantage over firms that do not adopt TQM (Brah et al., 2002; Powell, 1995). Firms thatfocus on continuous improvement, involve and motivate employees to achieve qualityoutput and focus on satisfying customers’ needs are more likely to outperform firms thatdo not have this focus. Thus, we can expect that to the extent an organization implementsTQM practices, performance should be enhanced. The first hypothesis summarizes thisexpectation and provides a benchmark in which to examine the moderating effects ofco-worker support and organization support on the TQM/performance relationship.
H1. The degree of implementation of TQM practices will be positively associatedwith organization performance.
Co-worker supportCo-worker support refers to co-workers assisting one another in their tasks whenneeded by sharing knowledge and expertise as well as providing encouragement andsupport (Zhou and George, 2001). For example, colleagues may share their knowledgeand expertise when an employee is faced with a difficult and novel task for which asolution is not readily available (Scott and Bruce, 1994). Employees may also acquiretask-relevant knowledge and expertise from supportive co-workers, which may make
IJQRM24,6
618

new ways of doing things possible (Woodman et al., 1993). In this context, workingwith helpful, supportive colleagues promotes an environment where new ideas can bediscussed more openly and freely. According to Hackman and Wageman (1995) andBeer (2003), implicit in the TQM philosophy are values of teamwork and collaborationin the pursuit of quality and continuous improvement. It appears evident that workingwith supportive co-workers who readily share task-relevant information and expertiseis more likely to be associated with successful TQM implementation. That is, for firmsimplementing TQM practices, higher co-worker support is likely to be associated withenhanced organizational performance.
Referring to the TQM literature, some studies have highlighted the importance ofco-worker support without empirically testing their assertions (e.g. Montes et al., 2003).Lam’s (1995) survey of front-line supervisors working in organizations that hadimplemented a TQM program for at least two years found that 71 per cent ofrespondents reported an improved relationship with co-workers. This providesempirical evidence for the importance of the association between TQM implementationand co-worker support; however, the links to performance were not tested. Brah et al.’s(2002) research also provides some empirical support for the importance of co-workersupport in TQM firms compared to non-TQM firms. They surveyed Singaporeancompanies to show that TQM firms reported higher means on “human resource focus”(which includes peer support) compared to non-TQM firms. The link to performance(again) was not part of their research design.
Based on the foregoing the following hypothesis is proposed:
H2. In organizations characterized by a greater focus on co-worker support,greater implementation of TQM practices will be positively associated withorganization performance.
Perceived organization supportPerceived organization support refers to employees’ perception of being valued andcared about by their organization (Eisenberger et al., 1986). This concept istheoretically based on reciprocity in the social exchange relationship. In situations ofperceived support, employees’ trust that their increased effort toward reachingorganization goals will be noticed and rewarded (Allen and Brady, 1997; Eisenbergeret al., 1986). Although an organization may encourage support in a number of areas,this study focuses specifically on organization support for creativity, which refers tothe extent to which an employee perceives that the organization encourages, respects,rewards and recognizes employees who exhibit creativity (Zhou and George, 2001).Indeed, the organizational creativity literature has demonstrated that organizationalcontexts can play a significant role in encouraging or impeding employee creativity(Scott and Bruce, 1994). For example organization contexts may facilitate creativeperformance by directing employees’ attention and cognitive energy toward thegeneration of new and useful ideas (Scott and Bruce, 1994; Zhou and George, 2001). Asstated above, one of the central tenets of effective TQM implementation is employees’commitment to continuous improvement of processes. Organizations implementingTQM practices that also acknowledge and reward employees’ new and useful ideas aremore likely to experience a favourable effect on performance.
Turning to the TQM literature, in a comparative study of non-TQM and TQMorganizations, Allen and Brady (1997) found that perceived organization support washigher in TQM organizations than non-TQM organizations. Further, anothercomparative TQM/non-TQM study focussing on firms in the motor vehicle parts
TQM andperformance
619

and accessories industry, demonstrated that respondents (supervisors) in TQM firmswere more satisfied with top management support, commitment and encouragement(important elements of overall organization support) compared to non-TQM firms(Golhar et al., 1997). Both these studies provide empirical evidence of the significantrole of organization support in firms implementing TQM practices. The effect onperformance of high organization support in TQM adopting firms, however, was notexamined in either of these cases.
Based on the foregoing the following hypothesis is proposed:
H3. In organizations characterized by greater focus on organization support,greater implementation of TQM practices will be positively associated withorganization performance.
Research methodsSample and data collectionThis study focussed on the motor vehicle parts and accessories manufacturing firms inAustralia. This selection was made because there is evidence that the automotiveindustry in Australia has embraced the role of quality in productivity improvements(Terziovski and Samson, 1999). Although we examine one industry, a wide range offirms is represented in the sample. For example, the motor vehicle parts andaccessories industry represents a wide range of production technologies includinglabour-intensive as well as capital-intensive operations. Firms would also adoptdifferent manufacturing strategies, such as low cost standard products, differentiatedmake-to-order products, and a combination of the two strategies. Thus we can expectfirms to be at various stages of TQM implementation.
Phone calls were made to all 187 firms classified as motor vehicle parts andaccessories manufacturers in Melbourne, Australia (as classified by www.yellowpages.com.au) inviting them to participate in the study. From this process, 160 firms agreedto participate. Questionnaires were distributed to the owner or plant manager, whoeverwas deemed appropriate following a telephone conversation. Each participant wasprovided a questionnaire together with a covering letter explaining the purpose of thestudy and assuring anonymity. A reply-paid envelope was included for the return ofthe completed questionnaire. A prize competition entry form and a separate reply-paidenvelope for the prize competition entry form were also included in an attempt toincrease the response rate. Of the 160 distributed questionnaires, 84 were returned,representing a response rate of 53 per cent. The final sample consisted of 80 responsessince 4 questionnaires were incomplete. The average length of tenure for respondentswas 6-10 years, the average age was 30-44 years old, 36 per cent of respondents hadonly completed secondary school while 60 per cent had completed a university diplomaor degree, the size of firms ranged from 10 to greater than 200 employees and all firmshad implemented TQM practices at least to some degree.
Variables and measuresTQM. TQM was measured using Chenhall’s (1997) seven-item instrument. Similar toother TQM measures (e.g. Douglas and Judge, 2001), the Chenhall measure seeks togauge the extent to which firms/production divisions have progressed in theirimplementation of TQM practices. Respondents are asked to rate the degree ofimplementation of each TQM practice using a seven-point Likert scale with anchors“no action” and “achieving outstanding progress”. The items comprising theinstrument focus on well accepted TQM practices such as reduction in non value-added
IJQRM24,6
620

activities, involvement of employees in quality improvement programs and a focus onreliable delivery. Chenhall’s measure is more relevant for manufacturing firms thus itwas considered the instrument of choice in this study of manufacturing organizations.Following a principal component factor analysis with Varimax rotation, one factor wasextracted (using an Eigenvalue of .1 as the criterion for extraction). Cronbach’s alphafor this scale was 0.88.
Organizational performance. This study uses Govindarajan and Gupta’s (1985)self-rated performance measure. While subjective self-rating performance measureshave been criticized in the management literature (Thornton, 1968), there is empiricalevidence to suggest that the associated halo effect is over-rated and that self-ratingprovides a more accurate measure of performance than objective upper management(“superior”) ratings (Heneman, 1974; Viswesvaran Schmidt and Ones, 2005). Dunk(1993) argues that upper managers may only have fragmented knowledge of the jobbehaviours of their subordinates because managers have limited personal contact withsubordinates, and that limited personal contact is restricted to particular situations.Given that there are many precedents in organization research for using subjectiveself-rated performance measures (e.g. Douglas and Judge, 2001, Powell, 1995), we feelthe use of the Govindarajan and Gupta’s (1985) performance instrument is justified.This instrument measures performance along a multiplicity of dimensions rather thanon any single dimension and utilizes the degrees of importance of each dimension asweights to calculate the overall performance measure. The six dimensions include bothfinancial and non-financial criteria, for example, achievement of budget targets, qualityof output, new product development and cost reduction. One factor was extractedfollowing a principal component factor analysis with Varimax rotation and theCronbach’s alpha for this scale was 0.83.
Co-worker support. To measure this construct we adopted Zhou and George’s (2001)four-item scale that requires respondents to consider the extent to which they believe theyreceive help and support from their co-workers in their work unit. A sample question is“The workers in this unit are willing to share their expertise with each other”. Againfollowing a factor analysis, one factor was extracted and the Cronbach’s alpha was 0.87.
Organization support. To measure organization support we used the four-item scaledeveloped by Zhou and George (2001). Sample questions are “Creativity is encouragedat [company]” and “Our ability to function creatively is respected by the leadership”.The Cronbach alpha for this scale was 0.95.
ResultsMeans, standard deviations and correlations are reported in Table I. There aresignificant positive correlations between performance and each of the independentvariables, providing preliminary support for the research model. In particular one
Mean SD 1 2 3 4
1. Performance 34.31 9.32. TQM practices 34.80 6.69 0.63 * *
3. Co-worker support 20.38 4.63 0.48 * * 0.49 * *
4. Organization support 17.92 6.01 0.67 * * 0.56 * * 0.48 * *
5. Organization size 48.25 22.10 0.02 0.13 0.07 20.06
Note: * *p , 0.01
Table I.Descriptive statistics and
correlations
TQM andperformance
621

should note the high correlation between TQM practices and organizationalperformance (r ¼ 0.63, p , 0.01). Organization size (number of employees) wasincluded as a control variable (see Douglas and Judge, 2001; Sadikoglu, 2004); however,size was not significantly correlated with performance or any of the independentvariables thus size was not included in the regression models to follow.
Moderated regression analysis using ordinary least squares was employed to testthe studies hypotheses. Tests on the adequacy of the regression models employedindicate that the assumptions of the models were satisfied by the data. We haveassumed that, consistent with the practice of prior management researchers,Likert-type scale data closely approximates interval-level data (Berry and Feldman,1985). All regression results are reported in Table II. H1 was tested by comparing theincrease in variance (increase in R2) explained between Model 1 and Model 2, whereModel 1 represents the regression of the independent variables (co-worker support andorganization support) on the performance variable and Model 2 adds TQM practices.The results indicate that the degree of TQM practices implemented is positivelyassociated with organization performance ( p , 0.01), and indeed the addition of theTQM variable increases the R2 by 0.09. Therefore the data supports H1.
To explore the moderating influence of co-worker support and organization supportpostulated in H2 and H3, Models 3 through 6 were created. Firstly, Models 3 and 4 areused to test H2 by showing the increase in explained variance after adding thefirst-order interaction between co-worker support and TQM practices. The results inTable II show that the interaction term (TQM £ co-worker support) was statisticallysignificant ( p, 0.01) and adds 0.06 to the explanatory power of the model. This resultprovides empirical support for the moderating impact of co-worker support on therelationship between TQM practices and organization performance (H2). Similarly,Models 5 and 6 are used to test H3 by showing the increase in explained variance afteradding the first-order interaction between organization support and TQM practices.The results indicate that the interaction term (TQM £ organization support) isstatistically significant ( p , 0.01) and further this term adds 0.05 to the explanatorypower of the model. This result provides empirical support for the moderating effect oforganization support on the relationship between TQM practices and performance.
To further understand the exact nature of these moderating relationships identifiedin Table II, additional interpretive analysis was conducted. Using standard graphicaltechniques, we found that organizations characterized by an environment of relativelyhigh support (from both co-workers and the organization) exhibited a strongerrelationship between TQM practices implemented and organization performance;whereas organizations characterized by an environment of low support did notdemonstrate a significant relationship between TQM and performance. Figure 1displays the graphs for these contingent effects. These findings offer new and practicalinsights into the role of supportive organizational environments and the effectivenessof TQM implementation, as discussed in the next section.
Discussion and conclusionsTheoretical implicationsThis study examined, firstly, the TQM-performance relationship and secondly, theeffective implementation of TQM with respect to support afforded by the organizationand support among co-workers. Evidence from this study supports a strong positiverelationship between the extent of implementation of TQM practices and organizationperformance. Previous research on the TQM/performance relationship has beenequivocal, however consistent with Douglas and Judge (2001) and Brah et al.(2002), we
IJQRM24,6
622

Var
iab
leM
odel
1M
odel
2M
odel
3M
odel
4M
odel
5M
odel
6
Con
stan
t10
.70
(25.
31)
226
.09
(26.
38)
0.37
(28.
41)
327.
67*
*(1
12.7
5)2
17.2
2(2
5.44
)26
7.51
**
(98.
02)
Co-
wor
ker
sup
por
t2.
57*
(1.1
8)1.
41(1
.16)
2.78
*(1
.24)
212
.98
*(5
.40)
Org
aniz
atio
nsu
pp
ort
3.14
**
(0.5
4)2.
36*
*(0
.56)
2.55
**
(0.5
4)2
3.77
(2.1
7)T
QM
pra
ctic
es2.
75*
*(0
.85)
4.27
**
(0.8
5)2
5.84
(3.4
7)3.
07*
*(0
.81)
25.
94(3
.10)
TQ
M£
co-w
ork
ersu
pp
ort
0.48
**
(0.1
6)T
QM
£or
gan
izat
ion
sup
por
t0.
20*
*(0
.06)
Ad
just
edR
20.
460.
550.
420.
480.
520.
57F
32.5
8*
*28
.05
**
27.1
3*
*23
.09
**
41.0
6*
*33
.45
**
Ch
ang
eR
20.
090.
060.
05
Notes
:* p
,0.
05;** p
,0.
01
Table II.Results of regression
analysis
TQM andperformance
623

found that the degree of implementation of TQM practices was positively related toorganization performance. Our research reinforces Douglas and Judge’s (2001)assertion that mere rhetoric about concern for quality will not guarantee success; it isthe extent of implementation of TQM practices that is related to favourable outcomes.
This study also found that an environment of support within the organizationenhances the effectiveness of TQM implementation, confirming the appropriateness of acontingency theory approach to the successful implementation of TQM. Morespecifically, organization support that encourages a positive reciprocal relationshipbetween employees and their organizations, and strong collegial support that promotessharing knowledge in an encouraging, supportive manner produce a synergistic effect onthe TQM/performance relationship. That is, although our results demonstrate that theimplementation of TQM practices is associated with improved performance, anenvironment of support (derived from the organization and co-workers) provides asynergistic “boost” to organizational performance. This finding is novel to the TQM
Figure 1.Conditional effects on therelationship between TQMpractices and performance
IJQRM24,6
624

literature. It is consistent, however, with the more recent TQM literature that highlightsthe value of integrating human resources management into the TQM process (Fok et al.,2000; Lam, 1995; Montes et al., 2003). Human resource management practices (whichinclude the provision of a supportive organization environment) can be used to reinforceemployees’ commitment and dedication to improving the quality of products andservices. Future research could consider a number of other human resource relatedpractices (within a contingency theory framework) to explore the interactive effect of thatpractice on the TQM/performance relationship. Within this context, human resourcepractices of potential consideration could include: useful feedback from co-workers (seeZhou and George, 2001), reward systems (particularly bonus reward systems related tonew ideas) and employee training and development for creativity and lateral thinking.
Managerial implicationsThis study has important implications for managers. First, it motivates managers (andprovides a justification) to invest in the time and resources to implement TQMprograms. Based of the results of this study, the implementation of TQM practices isassociated with enhanced organization performance.
Second, this study signals the importance of ensuring a supportive organizationalenvironment for the effective implementation of TQM. Evidence from this studysuggests that organizations should develop an environment or “culture” of support,which includes fostering support among co-workers, for the effective implementationof TQM. If employees do not feel there is sufficient acknowledgement and support fromthe organization and from colleagues with whom they work, then firms may not reapthe benefits of TQM programs.
Limitations and conclusionsThe contributions of this study must be considered in light of the limitations. The firmsin this study were drawn from the motor vehicle parts and accessories industry andtherefore may only be generalizable to that industry. In addition, even though a samplesize of 84 is adequate for statistical analysis, caution must be exercised in generalizingthe findings beyond the associated hypothesis tests. The use of a self-rating scale tomeasure performance is likely to have higher mean values (higher leniency error) and arestricted range (lower variability error) in the score (Thornton, 1968). Finally, thesurvey research methodology allows for examination of statistical association at onepoint in time, and statements about the direction of relationships can only be made interms of consistency of results with the effects proposed in the theoretical development.Future research could employ longitudinal research methods to systematicallyinvestigate the theoretical links proposed in our study.
Notwithstanding the limitations discussed above, the study provides importantcontributions to the literature and for managers. In particular, the study emphasizes theimportance of implementing a comprehensive TQM program comprising the keypractices of TQM, rather than implementing a few selected practices. Further, consistentwith Powell’s (1995) assertion that complementary organization structures/processesmay enhance the TQM/performance relationship, we found that an environment ofsupport derived from the organization and colleagues was associated with a synergisticeffect on this relationship. Within a context of ever increasing competition among firms,these results may provide managers with the means of sustaining a competitiveadvantage within the motor vehicle part and accessories industry.
TQM andperformance
625

References
Allen, E. and Brady, R. (1997), “Total quality management, organisational commitment,perceived organisational support and intraorganisational communication”, ManagementCommunication Quarterly, Vol. 10 No. 3, pp. 316-41.
Beer, M. (2003), “Why total quality management programs do not persist: the role ofmanagement quality and implications for leading a TQM transformation”, DecisionSciences, Vol. 34 No. 4, pp. 623-43.
Berry, W.D. and Feldman, S. (1985), Multiple Regression in Practice, Sage University PaperSeries: Quantitative Applications in the Social Sciences, 070-050, Sage Publications,Newbury Park, CA.
Brah, S.A., Lee, S.L. and Rao, B.M. (2002), “Relationship between TQM and performance ofSingapore companies”, International Journal of Quality & Reliability Management, Vol. 19No. 4, pp. 356-79.
Chen, W.H. (1997), “The human side of total quality management in Taiwan: leadership andhuman resource management”, International Journal of Quality & Reliability Management,Vol. 14 No. 1, pp. 24-45.
Chenhall, R. (1997), “Reliance on manufacturing performance measures, total qualitymanagement and organisational performance”, Management Accounting Research, Vol. 8No. 2, pp. 187-206.
Douglas, T.J. and Judge, W.Q. (2001), “Total quality management implementation andcompetitive advantage: the role of structural control and exploration”, Academy ofManagement Journal, Vol. 44 No. 1, pp. 158-69.
Dunk, A.S. (1993), “The effects of job-related tensions on managerial performance in participativebudgetary settings”, Accounting, Organizations and Society, Vol. 18 No. 7/8, pp. 575-85.
Eisenberger, R., Huntington, R., Hutchison, S. and Sowa, D. (1986), “Perceived organizationalsupport”, Journal of Applied Psychology, Vol. 71, pp. 500-7.
Fok, L., Hartman, S., Patti, A. and Razek, J. (2000), “Human factors affecting the acceptance oftotal quality management”, International Journal of Quality & Reliability Management,Vol. 17 No. 7, pp. 714-29.
Golhar, D., Deshpande, S. and Ahire, S. (1997), “Supervisors’ role in TQM and non-TQM firms”,International Journal of Quality & Reliability Management, Vol. 14 No. 6, pp. 555-68.
Govindarajan, V. and Gupta, S. (1985), “Linking control systems to business unit strategy:impact on performance”, Accounting, Organisations and Society, Vol. 10 No. 1, pp. 51-66.
Guimaraes, T. (1994), “Assessing employee turnover intentions before/after TQM”, InternationalJournal of Quality & Reliability Management, Vol. 14 No. 1, pp. 46-63.
Hackman, J. and Wageman, R. (1995), “Total quality management: empirical, conceptual andpractical issues”, Administrative Science Quarterly, Vol. 40, pp. 309-42.
Hendricks, K.B. and Singhal, V.R. (2001), “Firm characteristics, total quality management andfinancial performance”, Journal of Operations Management, Vol. 19, pp. 269-85.
Heneman, H. (1974), “Comparison of self and superior ratings of managerial performance”,Journal of Applied Psychology, Vol. 59, pp. 638-42.
Kaynak, H. (2003), “The relationship between total quality management and their effects on firmperformance”, Journal of Operations Management, Vol. 21, pp. 405-35.
Lam, S. (1995), “Quality management and job satisfaction”, International Journal of Quality andReliability Management, Vol. 12 No. 4, pp. 72-8.
McCabe, D. and Wilkinson, A. (1998), “The rise and fall of TQM: the vision, meaning andoperation of change”, Industrial Relations Journal, Vol. 29, pp. 18-29.
IJQRM24,6
626

Mann, R. and Kehoe, D. (1995), “Factors affecting the implementation and success of TQM”, TheInternational Journal of Quality & Reliability & Management, Vol. 12 No. 1, pp. 11-24.
Montes, F., Jover, A. and Fernandez, L. (2003), “Factors affecting the relationship between totalquality management and organisational performance”, International Journal of Quality &Reliability Management, Vol. 20 No. 2, pp. 189-209.
Powell, T.C. (1995), “Total quality management as competitive advantage: a review andempirical study”, Strategic Management Journal, Vol. 16, pp. 15-37.
Sadikoglu, E. (2004), “Total quality management: context and performance”, Journal of AmericanAcademy of Business, Vol. 5 No. 1, pp. 364-8.
Scott, S. and Bruce, R. (1994), “Determinants of innovative behaviour: a path model of individualinnovation in the workplace”, Academy of Management Journal, Vol. 37, pp. 580-607.
Terziovski, M. and Samson, D. (1999), “The link between total quality management practice andorganisational performance”, International Journal of Quality & Reliability Management,Vol. 16 No. 3, pp. 226-37.
Thornton, G.C. III (1968), “The relationship between supervisor- and self-appraisals of executiveperformance”, Personnel Psychology, pp. 441-55.
Viswesvaran, C., Ones, D.S. and Schmidt, F.L. (2005), “Is there a general factor in ratings of jobperformance? A meta-analytic framework for disentangling substantive and errorinfluences”, Journal of Applied Psychology, Vol. 90 No. 1, pp. 108-21.
Waldman, D.A. (1994), “The contributions of total quality management to a theory of workperformance”, Academy of Management Review, Vol. 19, No. 3, pp. 510-37.
Woodman, R., Sawyer, J. and Griffin, R. (1993), “Toward a theory of organizational creativity”,Academy of Management Review, Vol. 18, pp. 293-321.
Yeung, C.L. and Chan, L.Y. (1998), “Quality management system development: Someimplications from case studies”, Computers and Industrial Engineering, Vol. 35, pp. 221-4.
Zhou, J. and George, J.M. (2001), “When job dissatisfaction leads to creativity: encouraging theexpression of voice”, Academy of Management Journal, Vol. 44 No. 4, pp. 683-96.
About the authorTherese A. Joiner lectures in international management, organization theory, and organizationchange and development in the School of Business at Latrobe University, Australia. She receivedher PhD degree from La Trobe University in the area of management control systems. She haspublished in such journals as Journal of Managerial Psychology, the Australian Journal ofManagement and the International Journal of Management and Decision Making. ThereseA. Joiner can be contacted at: [email protected]
TQM andperformance
627
To purchase reprints of this article please e-mail: [email protected] visit our web site for further details: www.emeraldinsight.com/reprints

Simulation based reliabilityevaluation of AC power supply
system of Indian NuclearPower Plant
K. Durga Rao and H.S. KushwahaBhabha Atomic Research Centre, Mumbai, India, and
A.K. Verma and A. SrividyaIndian Institute of Technology Bombay, Mumbai, India
Abstract
Purpose – The purpose of this paper is to demonstrate the potential of simulation approach forperformance evaluation in a complex environment with a case of application from Indian NuclearPower Plant.
Design/methodology/approach – In this work, stochastic simulation approach is applied toavailability evaluation of AC Power supply system of Indian Nuclear Power Plant (INPP). In thepresently followed test, maintenance policies on diesel generators and circuit breakers are consideredto exactly model the practical scenario. System success logic incorporates the functional dependenciesand dynamics in the sequence of operations and maintenance policies. In each iteration (randomexperiment), from simulated random behaviour of the system, uptime and down time are calculatedbased on system success logic. After sufficient number of iterations, unavailability and other requiredreliability measures are estimated from the results.
Findings – The subsystems of AC Power Supply System of NPP are having multi-states due tosurveillance tests and scheduled maintenance activities. In addition, the operation of DG involvesstarting and running (till its mission time) which is a sequential (or conditional) event. Furthermore,the redundancies and dependencies are adding to the complexity.
Originality/value – This paper emphasizes the importance of realistic reliability modelling incomplex operational scenario with Monte-Carlo simulation approach. Simulation procedure forevaluating the availability/reliability of repairable complex engineering systems having stand-bytested components is presented. The same simulation model finds application in importance measurescalculation, technical specification optimization and uncertainty quantification.
Keywords Probabilistic analysis, Monte Carlo simulation, Markov processes, Nuclear energy industry,India
Paper type Research paper
IntroductionReliability management programs ensure safe, economical, and efficient design andoperation of engineering systems. The reliability indices such as Availability, MeanTime Between Failure (MTBF), Failure frequency, etc. provide measures of systemeffectiveness (Misra, 1992; Modarres et al., 1999). Reliability indices evaluation can bedone by direct analytical techniques or stochastic simulation approaches (Billinton andAllan, 1992; Marquez et al., 2005). Reliability Block Diagram (RBD), Fault Tree Analysis(FTA), and Markov models fall under analytical techniques. Analytical techniquesrepresent the system by a mathematical model and evaluate the reliability indices from
The current issue and full text archive of this journal is available at
www.emeraldinsight.com/0265-671X.htm
IJQRM24,6
628
Received April 2006Revised October 2006Accepted November 2006
International Journal of Quality &Reliability ManagementVol. 24 No. 6, 2007pp. 628-642q Emerald Group Publishing Limited0265-671XDOI 10.1108/02656710710757817

this model using direct mathematical solutions. The disadvantage with the analyticalapproach is that the model used in the analysis is usually a simplification of the system;sometimes to an extent it becomes totally unrealistic. In addition, the output of theanalytical methods is usually limited to expected values only. The complexity of themodern engineering systems besides the need for realistic considerations whenmodelling their availability/reliability renders analytical methods very difficult to beused. Analyses that involve repairable systems with multiple additional events and/orother maintainability information are very difficult (if not impossible) to solveanalytically. Modern engineering systems are having complex environment as depictedin Figure 1. In these cases, analysis through simulation becomes necessary.
Simulation technique estimates the reliability indices by simulating the actual processand random behaviour of the system in a computer model in order to create a realisticlifetime scenario of the system. This method treats the problem as a series of realexperiments conducted in a simulated time. It estimates the probability and other indicesby counting the number of times an event occurs in simulated time. Simulation is a veryvaluable method which is widely used in the solution of real engineering problems(ReliaSoft, 2003). Lately the utilization of this method is growing for the assessment ofavailability of complex systems and the monetary value of plant operations andmaintenances (Zio, 2006; Yanez et al., 1997; Taylor et al., 2000; Marseguerra and Zio, 2000).
The simulation approach overcomes the disadvantages of the former method byincorporating and simulating any system characteristic that can be recognised. It canprovide a wide range of output parameters including all moments and completeprobability density functions. It can handle very complex scenarios like inconstanttransition rate, multi state systems and time dependent reliability problems. However,the solution time is usually large and there is uncertainty from one simulation toanother. But the recent studies show the demerits of simulation can be easily overcomewith few modifications in the simulation (Yanez et al., 1997). It is to be noted that theexperimentation required is different for different types of problems and it is notpossible to precisely define a general procedure that is applicable in all circumstances.However, the simulation technique provides considerable flexibility in solving anytype of complex problem.
Figure 1.Complex environments for
system modelling
Reliabilityevaluation
629

In this work, stochastic simulation approach is applied to availability evaluation of ACPower supply system of Indian Nuclear Power Plant (INPP). The AC power supplyconsists of grid supply and emergency AC supply (1 out 3: success diesel generators).The presently followed test, maintenance policies on diesel generators and circuitbreakers are considered to exactly model the practical scenario. System success logicincorporates the functional dependencies and dynamics in the sequence of operationsand maintenance policies. Steady state unavailability is chosen as the requiredreliability index. In each iteration (random experiment), from simulated randombehaviour of the system, uptime and down time are calculated based on system successlogic. After sufficient number of iterations, unavailability is estimated from the results.In addition to calculation of unavailability of the system, probability density function(PDF), cumulative distribution function of time between failure and time to repairrandom variables are obtained from the analysis. Section 2 introduces the Monte-Carlosimulation approach and highlights the benefits, limitations and various otherapplications. Section 3 is devoted to the modelling of case of application giving systemdescription, maintenance policies and system failure logic development. The obtainedresults and discussion are given in the following section.
Reliability evaluation in complex environmentIn the analytical (or algebraic analysis) approach, the system’s PDF/other reliabilityindices are obtained analytically from each component’s failure distribution usingprobability theory. In other words, the analytical approach involves the determinationof a mathematical expression that describes the reliability of the system in terms thereliabilities of its components. When considering only the failure characteristics of thecomponents, the analytical approach is generally used. However, when both the failureand maintenance characteristics need to be considered, the simulation method must beutilized to take into account the additional events. This is due to the fact that theuncertainties that arise due to simplification by the analytical mathematical modelscan be eliminated with simulation. Nevertheless, the experimentation required insimulation is different for different types of problems and it is not possible to preciselydefine a general procedure that is applicable in all circumstances. Due to this reasonand simplicity that are offered by Fault tree approach and Markov Models, they areoften used in the reliability evaluation of reactor systems in Level-1 ProbabilisticSafety Assessment (PSA) of Nuclear Power Plant. However, the uncertainty inmodelling is always there with these analytical approaches. The models are onlyapplicable with exponential failure/repair probability density functions. They areinvalid for components having non-exponential failure/repair PDFs.
In simulation, random failure/repair times from each components failure/repairdistribution are generated. These failure/repair times are then combined in accordancewith the way the components are reliability-wise arranged within the system. Theoverall results are analysed in order to determine the behaviour of the entire system.Sound understanding of the system behaviour is the prerequisite for systemsuccess/failure logic. It is assumed that the reliability values for the components havebeen determined using standard (or accelerated) life data analysis techniques, so thatthe reliability function for each component is known. With this component-levelreliability information available, simulation can then be performed to determine thereliability of the entire system. The random failure/repair times of components isobtained using uniform random numbers and converting these into required densityfunction as per the component PDF.
IJQRM24,6
630

Simulation procedureThe simulation procedure is explained below for systems having complex operatingenvironments (Durga Rao et al., 2005):
(1) System failure logic is obtained from qualitative FTA or RBD in the form ofminimal cut-sets (combination of minimum number of component failuresleading to system failures).
(2) Probability density functions for time to failure/repair of all basic componentsare obtained from the past experience or lab testing. Maintenance policies of allcomponents have to be collected from the system technical specificationsrecord. Information such as interval and duration of tests and preventivemaintenance are obtained in this step.
(3) Generation of Component State Profiles: components are simulated for aspecified mission time for depicting the duration of available (up) andunavailable (down) states. If component is repairable as is the case for most ofpractical systems, up and down states will come alternatively. Down state canbe due to failure or scheduled maintenance activity. Duration of the state israndom for up state and also for down state if it is unscheduled repair, where asscheduled maintenance activity may be a fixed value.. Active Components: active component is the one which is in working condition
during normal operation of the system. Active components can be either insuccess state or failure state. Based on the PDF of failure of component, time tofailure is obtained from the random variant calculations. The failure isfollowed by repair whose time depends on the PDF of repair time. Thissequence is continued until it reaches the predetermined system mission time.
. Standby/Dormant Components: these components are required on demanddue to the failure of active components. When there is no demand, it will bein standby state or may be in failed state due to on-shelf failure. It can also beunavailable due to test or maintenance state as per the scheduled activitywhen there is a demand for it. This makes the component to have multistates and such stochastic behaviour need to be modelled to exactly suit thepractical scenario. Down times due to the scheduled test and maintenancepolicies are first accommodated in the component state profiles. In certaincases test override probability has to be taken to account for its availabilityduring testing. As the failures occurred during standby period cannot berevealed till its testing, time from failure till identification has to be taken asdown time. It is followed by imposing the standby down times obtained fromthe standby time to failure PDF and time to repair PDF. Apart from theavailability on demand, it is also required to check whether the standbycomponent is successfully meeting its mission. This is incorporated byobtaining the time to failure based on the operating failure PDF and ischecked with the mission time, which is the down time of active component.
(4) Generation of system state profile: system state profile is developed byintegrating components state profiles with the system failure logic. Failure logicof complex systems is generally derived from fault tree analysis, which islogical and graphical description of various combinations of failure events.Fault tree analysis represents failure logic of the system with the sum ofminimal cut-sets. In other words, system logic is denoted with series
Reliabilityevaluation
631

configuration of parallel subsystems. Each minimal cut-set represents thissubsystem which will have certain basic components in parallel.. State profile for each minimal cut-set is generated based on component state
profiles obtained from those two bulleted items in step 3. Down state isidentified by calculating the duration that all the components in the cut-setunder consideration are simultaneously unavailable as it is equivalent to aparallel configuration. MCS state is in up state in the remaining duration ofthe mission. Thus, state profile for MCS is also in up and down statesalternatively through out its mission.
. System states are generated from state profiles of MCS which are obtainedfrom the bulleted step above. As system is in series configuration of all MCS,down state of every MCS imposes the same down state on the system. Thusall down states of all MCS are reflected in system state profile and theremaining time of the mission is in the up state.
(5) Steps 3 and 4 are repeated for sufficient number of simulations and requiredmeasures of reliability are obtained from the simulation results.
Benefits/applications of simulations based reliability evaluation. Realistic Modelling of System behaviour in complex environment.. The number of assumptions can be reduced significantly.. Handling of inconstant hazard rate models at component level.. Wide range of out put parameters at the system level like failure frequency,
MTBF, MTTR, unavailability, failure rate, etc.. Dynamics in sequence of operations and complex maintenance policies can be
adopted in system modelling.. Simulation model can be used for optimizing inspection interval or the
replacement time of components in the system (Alfares, 1999).. Quantification of aleatory uncertainty associated with the random variable time
to failure of overall system.. Importance measures can be obtained from the analysis which is helpful in
identifying the critical components and ranking them (Marseguerra and Zio,2004; Zio et al., 2004).
Case of application to AC power supply system of Indian NPPReliability Analysis for a practical system by adopting procedure mentioned in theprevious section is presented here. AC power supply system is chosen as the case ofapplication as it is very important system in the safe operation of Nuclear Power plant.This system is having redundant components having multi state systems withdifferent maintenance policies. The dynamics of system motivated to look for alternateto presently followed analytical methods. System specific information to the extentpossible is used in the modelling.
Description of the systemElectrical Power supply is essential in the operation of process as well as safetysystems of any NPP (Saraf et al., 1997). To ensure high reliability of power supplysystems, high redundancy and diversity are provided in the design. Loss of off-site
IJQRM24,6
632

power supply coupled with loss of on-site AC power is called station blackout. In manyPSA studies (IAEA, 1991), severe accident sequences resulting from station blackoutconditions have been recognized to be significant contributors to the risk of coredamage. For this reason the reliability/availability modelling of AC Power supplysystem is of special interest in PSA of NPP.
The electrical power supply system of Indian NPP consists of four classes. In thestation blackout criteria, Class IV and Class III systems are only there. Class IV poweris supplied from two sources: grid supply; and station alternator supply. Class III canbe termed as redundant to Class IV supply. Whenever Class IV is unavailable, twoClass III buses are fed from dedicated standby Diesel Generators (DGs) of 100 per centcapacity each. There are three standby DGs. These DGs start automatically on failureof Class IV power supply through emergency transfer scheme. Two of the DGs supplypower to the buses to which they are connected. In case of failure/unavailability of anyof these two DGs, the third DG can be connected automatically to any of the two ClassIII buses. In case only one DG is available the tie breaker between the buses closesautomatically. The class III loads are connected to the buses in such a way that failureof any bus will not affect the performance of systems needed to ensure safety of theplant. Thus one DG is sufficient for all the emergency loads and this gives aredundancy of one out of three. The line diagram of AC Power supply system in IndianNPP is shown in Figure 2.
System modellingFailure/Success logic of system can be obtained from developing Reliability BlockDiagram (RBD) or Qualitative Fault Tree Analysis. The interaction between failure ofcomponents and their impact on system success state is depicted with RBD or FTA. Thelater method is suitable when there is complex configuration. However, both theapproaches are adopted here to give the list of minimal cut-sets. RBD and Fault Tree(ISOGRAPH Inc., 2004) for the system are shown in Figure 3 and Figure 7 respectively.There can be dependency between the cut-sets and this is properly accounted in theanalysis. The list of minimal cut-sets is presented in Appendix Table AI. Parameters ofdistribution for all the components in the systems are shown in the Table I. Time tofailure and time to repair are observed to follow exponential distribution from theoperating experience (IAEA, 1988). However, by changing the random variant in thesimulation one can do simulation for any kind of PDF for time to failure or time to repair.
System specific test and maintenance information is obtained from the operatingexperience. All DGs are tested with no-load once in a week and tested with load once intwo months. Scheduled maintenance is carried out once in three months on all the DGs.However, maintenance is not simultaneously carried out for more than one DG. Duringno-load or full load test, DGs can take the demand which makes override probability asone and test duration will not come under down time. Schedule maintenance is carriedout on all CBs once in a year during the reactor shut-down. Test and maintenancepolicy for standby components of the system is given in Table II.
Results and discussionFault tree analysis approach with suitable assumptions is being used at present forunavailability assessment as a part of Level-1 Probabilistic Safety Assessment of NPP. Itis assumed that the unavailability of a standby system can be reasonably approximatedby the use of fault trees (or some other logic models) in which the component timeaveraged unavailabilities are used as the probabilities of basic events (IAEA, 1992). To
Reliabilityevaluation
633

Figure 2.Schematic diagram of ACelectrical power supply
IJQRM24,6
634

reduce the burden of calculations, the time dependent unavailabilitites of the componentsare substituted in some logic models by their average values over the period of analysis.In addition to these assumptions and approximations (rare event), actual processes(complex interaction and dependencies between components) and random behaviour ofthe systems are depicted with simplified logic models. The output results from thisapproach are limited to point estimates only. Using this fault tree (cut-set) approach,unavailability thus obtained is 5.87e-7.
An alternative approach could be based on Markov models. These models can takeinto account wide range of dependencies; however, they are restrictive in terms ofnumber of components, preventive maintenance and failure/repair time distributions.Furthermore it is not possible to take into account any trends or seasonal effects.Another alternative could be the use of semi-Markov models. The scalability in termsof number of possible states of the system, and number of maintenance actions, is an
S. No. Component DescriptionFailure Rate (/hr)
(Operating)Failure Rate (/hr)
(Standby) Repair Rate (/hr)
1. CLIV Class IV Supply 2.34E-04 – 2.592. DG1 Diesel Generator 1 9.00E-05 5.33E-04 8.69E-023. CB351 Circuit Breaker 351 3.60E-07 2.14E-05 0.254. CB353 Circuit Breaker 353 3.60E-07 2.14E-05 0.255. BUSD Bus D 3.20E-07 – 0.1256. DG3 Diesel Generator 3 9.00E-05 5.33E-04 8.69E-027. CB370 Circuit Breaker 370 3.60E-07 2.14E-05 0.258. CB357 Circuit Breaker 357 3.60E-07 2.14E-05 0.259. CB368 Circuit Breaker 368 3.60E-07 2.14E-05 0.25
10. BUSE Bus E 3.20E-07 – 0.12511. DG2 Diesel Generator 2 9.00E-05 5.33E-04 8.69E-0212. CB361 Circuit Breaker 361 3.60E-07 2.14E-05 0.2513. CB364 Circuit Breaker 364 3.60E-07 2.14E-05 0.2514. DG-CCF Common Cause Failure 1.00E-05 5.92E-05 4.166E-02
Table I.Failure rate and repair
rate of components
Figure 3.Reliability block diagram
of AC power supplysystem
Reliabilityevaluation
635

important advantage of this models, however they are also complex and therefore verydifficult to handle when the number of system possible states increases.
The subsystems of AC Power Supply System are having multi-states due tosurveillance tests and scheduled maintenance activities. In addition, the operation ofDG involves starting and running (till its mission time) which is a sequential (orconditional) event. Furthermore, the redundancies and dependencies are adding to thecomplexity. Thus, this complexity or dynamic environment of the chosen problem ismaking Monte-Carlo simulation approach obvious choice as this method allowsconsidering various relevant aspects of system operations which can not be easilycaptured by analytical methods.
In-House computer code has been developed for carrying out time dependentsimulation for repairable systems having periodically tested standby components.Number of iterations is kept as the convergence criteria for simulation. Crude samplingapproach is adopted in the present problem, however, variance reduction methods suchas Latin hypercube sampling or importance sampling also can be used to improve theperformance of simulation. Table III gives the summary of results obtained fromsimulation of 10,000 iterations and mission time of 106 hours of operation. Averageunavailability calculated from simulation approach is 7.14e-7 where as from analyticalapproach (fault tree-cut set approach) is 5.87e-7. The under estimation of unavailabilityin case of analytical approach is due to its inability to incorporate down time due toscheduled maintenance and surveillance test activities in the model. The output resultsfrom analytical approach are limited to point estimates of unavailability only. Butsimulation approach in addition to the parameters such as average unavailability,expected number of failures, failure frequency, Mean time between failures and meantime to repair, it can give Cumulative Distribution Function (CDF) of random variablestime between failures and time to repair for the system under consideration (Figure 4
S. No. Parameter Value
1 Average unavailability 7.14e-72 Failure frequency(/hr) 2.77e-63 Mean time between failure (hrs) 3.62e54 Mean time to repair (hrs) 0.673
Table III.Summary of results
No-Load test (Hrs) Load Test (Hrs)Preventive
Maintenance (Hrs)S. No. Component Interval Duration Interval Duration Interval Duration
1. DG1 168 0.0833 1,440 2 2,160 82. CB351 168 0.0833 1,440 2 8,760 23. CB353 168 0.0833 1,440 2 8,760 24. DG3 168 0.0833 – – 2,184 85. CB370 168 0.0833 – – 8,760 26. CB357 – – – – 8,760 27. CB368 – – – – 8,760 28. DG2 168 0.0833 1,440 2 2,208 89. CB361 168 0.0833 1,440 2 8,760 2
10. CB364 168 0.0833 1,440 2 8,760 2
Table II.Test and MaintenancePolicy for StandbyComponents
IJQRM24,6
636

and Figure 5). The generated failure times of the system can be used to see how thehazard rate is varying with time. Furthermore, average unavailability with respect totime is plotted against mission time (Figure 6). The results of the analysis have beenused in level-1 PSA modelling of Indian NPP to quantify core damage frequency. It hasbeen found that the target reliability figure is achieved with the current design of thepower supply system. The results of the analysis are very important as severe accident
Figure 5.Cumulative DistributionFunction for the time to
repair
Figure 4.Cumulative DistributionFunction for the time to
failure
Reliabilityevaluation
637

resulting from loss of power supply is a significant event to the risk of core damage ofNPP. This Simulation model can also be used for optimising inspection interval or thereplacement time of components in the system, for example, surveillance intervalstandby power supply can be optimised based on this model.
The Monte-Carlo simulation approach is having flexibility in solving any kind ofcomplex reliability problem. It can solve problems of dynamic in terms of sequenceoccurrences, time dependent, having any kind of component PDF and it can give therequired system attribute. However, the solution time is usually large and there isuncertainty from one simulation to another. It is to be noted that the experimentationrequired is different for different types of problems and it is not possible to preciselydefine a general procedure that is applicable in all circumstances. However, the simulationtechnique provides considerable flexibility in solving any type of complex problem.
The incredible development in the computer technology for data processing atunprecedented speed levels are further emphasizing the use of simulation approachesto solve reliability problems. Use of simulation approach eliminates many of theassumptions that are inevitable with analytical approaches. In order to simplify thecomplex reliability problems, analytical approaches make lot of assumption to make itto a simple mathematical model. On the contrary, Monte-Carlo simulation basedreliability approach, due to its inherent capability in simulating the actual process andrandom behaviour of the system, can eliminate the uncertainty in system reliabilitymodelling. One shall not forget the Einstein’s quotation in this regard, “A theoryshould be as simple as possible, but no simpler.”
References
Alfares, H. (1999), “A simulation model for determining inspection frequency”, Computers andIndustrial Engineering, Vol. 36, pp. 685-96.
Figure 6.Unavailability vs time
IJQRM24,6
638

Billinton, R. and Allan, R.N. (1992), Reliability Evaluation of Engineering Systems, Plenum Press,New York, NY.
Durga Rao, K., Kushwaha, H.S., Verma, A.K. and Srividya, A. (2005), “Studies on simulationbased system reliability evaluation”, International Conference on Reliability, Safety andHazard ’05, Narosa Publishers, New Delhi, pp. 30-35.
IAEA (1992), Procedure for Conducting Probabilistic Safety Assessment of Nuclear Power Plants(Level 1), Safety Series No. 50-P-4, IAEA, Vienna.
IAEA TECDOC 478 (1988), “Component reliability data for use in probabilistic safetyassessment”, International Atomic Energy Agency, Vienna.
IAEA-TECDOC-593 (1991), “Case study on the use of PSA methods: station blackout risk atMillstone unit 3”, International Atomic Energy Agency, Vienna.
ISOGRAPH (2004), Faulttree þ 10.1- Software for Fault Tree Analysis, ISOGRAPH Inc., UK,Warrington.
Marquez, A.C., Heguedas, A.S. and Iung, B. (2005), “Monte Carlo-based assessment of systemavailability”, Reliability Engineering and System Safety, Vol. 88, pp. 273-89.
Marseguerra, M. and Zio, E. (2000), “Optimizing maintenance and repair policies via combinationof genetic algorithms and Monte Carlo simulation”, Reliability Engineering and SystemSafety, Vol. 68, pp. 69-83.
Marseguerra, M. and Zio, E. (2004), “Monte Carlo estimation of the differential importancemeasure: application to the protection system of a nuclear reactor”, Reliability Engineeringand System Safety, Vol. 86, pp. 11-24.
Misra, K.B. (1992), Reliability Analysis and Prediction, Elsevier, Amsterdam.
Modarres, M., Kaminskiy, M. and Krivtsov, V. (1999), Reliability Engineering and Risk Analysis,Marcel Dekker, New York, NY.
ReliaSoft (2003), System Analysis Reference, ReliaSoft Publishing, Tucson, AZ.
Saraf, R.K., Babar, A.K. and Rao, V.V.S.S. (1997), Reliability Analysis of Electrical Power SupplySystem of Indian Pressurized Heavy Water Reactors, Bhabha Atomic Research Centre,Mumbai, BARC/1997/E/001.
Taylor, N.P., Knight, P.J. and Ward, D.J. (2000), “A model of the availability of a fusion powerplant”, Fusion Engineering Design, Vol. 52, pp. 363-9.
Yanez, J., Ormfio, T. and Vitoriano, B. (1997), “A simulation approach to reliability analysis ofweapon systems”, European Journal of Operational Research, Vol. 100, pp. 216-24.
Zio, E., Podofillinia, L. and Levitin, G. (2004), “Estimation of the importance measures ofmulti-state elements by Monte Carlo simulation”, Reliability Engineering and SystemSafety, Vol. 86, pp. 191-204.
Zio, E., Podofillinia, L. and Zille, V. (2006), “A combination of Monte Carlo simulation and cellularautomata for computing the availability of complex network systems”, ReliabilityEngineering and System Safety, Vol. 91, pp. 181-90.
Further reading
Marseguerra, M., Zio, E., Devooght, J. and Labeau, P.E. (1998), “A concept paper on dynamicreliability via Monte-Carlo Simulation”, Mathematics and Computers in Simulation, Vol. 47,pp. 371-82.
Reliabilityevaluation
639

Appendix
Figure A1.Fault Tree for AC powersupply system failure
IJQRM24,6
640

S. No Cut-set
1 CLIV. DGCCF2 CLIV. BUSD. BUSE3 CLIV. DG3. DG1. CB3644 CLIV. DG3. CB351. DG25 CLIV. DG3. CB351. CB3616 CLIV. DG3. CB351. CB3647 CLIV. DG3. CB353. DG28 CLIV. DG3. CB353. CB3619 CLIV. DG3. CB353. CB364
10 CLIV. BUSD. DG3. DG211 CLIV. BUSD. DG3. CB36112 CLIV. BUSD. DG3. CB36413 CLIV. CB370. DG1. DG214 CLIV. CB370. DG1. CB36115 CLIV. CB370. DG1. CB36416 CLIV. CB370. CB351. DG217 CLIV. CB370. CB351. CB36118 CLIV. CB370. CB351. CB36419 CLIV. CB370. CB353. DG220 CLIV. CB370. CB353. CB36121 CLIV. CB370. CB353. CB36422 CLIV. BUSD. CB370. DG223 CLIV. BUSD. CB370. CB36124 CLIV. BUSD. CB370. CB36425 CLIV. BUSD. CB368. DG226 CLIV. BUSD. CB368. CB36127 CLIV. BUSD. CB368. CB36428 CLIV. DG3. BUSE. DG129 CLIV. DG3. BUSE. CB35130 CLIV. DG3. BUSE. CB35331 CLIV. CB370. BUSE. DG132 CLIV. CB370. BUSE. CB35133 CLIV. CB370. BUSE. CB35334 CLIV. CB357. BUSE. DG135 CLIV. CB357. BUSE. CB35136 CLIV. CB357. BUSE. CB35337 CLIV. DG3. DG1. DG238 CLIV. DG3. DG1. CB36139 CLIV. CB357. CB368. CB351. CB36440 CLIV. CB357. CB368. CB353. DG241 CLIV. CB357. CB368. CB353. CB36142 CLIV. CB357. CB368. CB353. CB36443 CLIV. CB357. CB368. DG1. DG244 CLIV. CB357. CB368. DG1. CB36145 CLIV. CB357. CB368. DG1. CB36446 CLIV. CB357. CB368. CB351. DG247 CLIV. CB357. CB368. CB351. CB361
Table AI.List of Minimal Cut-Sets
Reliabilityevaluation
641

About the authorsK. Durga Rao obtained his B. Tech (2000) in Electrical and Electronics Engineering fromNagarjuna University, India and M. Tech (2002) in Reliability Engineering from Indian Instituteof Technology Kharagpur, India. After post graduation, he joined Bhabha Atomic ResearchCentre as Scientific Officer in Reactor Safety division. He is also part-time research scholar inreliability engineering of Indian Institute of Technology Bombay, Mumbai. He has been activelyinvolved in Level-1 Probabilistic Safety Assessment (PSA) of Nuclear reactors and RiskInformed decision making and its implementation in chemical and nuclear facilities. He haspublished a number of papers in leading journals and national/international conferences.K. Durga Rao is the corresponding author and can be contacted at: [email protected]/[email protected]
H. S. Kushwaha is Director of the Health, Safety and Environment Group of Bhabha AtomicResearch Centre. He received an M. Tech in Mechanical Engineering from the Indian Institute ofTechnology Kanpur in 1977. He has been associated with Bhabha Atomic Research Centre since1970. He is a member of various safety committees of Atomic Energy Regulatory Board of India.He is chairman of BARC Safety Council. He has published more than 300 technical papers inleading International/National journals and conferences.
A. K. Verma joined IIT Bombay in 1988 and is currently a Professor in ReliabilityEngineering, Department of Electrical Engineering. He has supervised 15 PhD’s and 66 Masterstheses in the area of Software Reliability, Reliable Computing, PSR, RCM and PSA. He hasexecuted various research projects to promote industry interface and has been courseco-ordinator for industry CEPs like Six Sigma, Software Inspections and Competency TrackingSystem for IT industries. He has jointly edited books on “Reliability Engineering and QualityManagement” and “Quality, Reliability and Information Technology”; and is also an author ofFuzzy Reliability Engineering-Concepts and Applications. He has over 100 publications in variousjournals and conferences. He is on the editorial board of international journals like QualityAssurance, International Journal of Automation & Computing and DQM Communications.
A. Srividya joined IIT Bombay in 1988 and is currently Associate Professor in ReliabilityEngineering, Department of Electrical Engineering. She has supervised/co supervised 6 PhDsand 34 Masters theses in the area of Quality and Reliability engineering. She has been coursecoordinator for industry CEPs like Reliability Engineering, Quality Management and Six Sigmafor IT industries. She has jointly edited books on “Reliability Engineering and QualityManagement”, “Reliability Safety and Hazard” and is also an author of a book titled FuzzyReliability Engineering-Concepts and Applications (in progress). She has over 28 publications invarious international and national journals and has published over 60 papers in conferences. Sheis a recipient of Leadership in Reliability Engineering Education & Research award by Society ofReliability Engineering, Quality & Operations Management.
IJQRM24,6
642
To purchase reprints of this article please e-mail: [email protected] visit our web site for further details: www.emeraldinsight.com/reprints

Availability allocation throughimportance measures
Javad Barabady and Uday KumarDivision of Operation and Maintenance Engineering,
Lulea University of Technology, Lulea, Sweden
Abstract
Purpose – To define availability importance measures in order to calculate the criticality of eachcomponent or subsystem from the availability point of view and also to demonstrate the application ofsuch importance measures for achieving optimal resource allocation to arrive at the best possibleavailability.
Design/methodology/approach – In this study the availability importance measures of acomponent are defined as a partial derivative of the system availability with respect to the componentavailability, failure rate, and repair rate. Analyses of these measures for a crushing plant areperformed and the results are presented. Furthermore, a methodology aimed at improving theavailability of a system using the concept of importance measures is identified and demonstrated byuse of a numerical example.
Findings – The availability importance measure of a component/subsystem is an index which showshow far an individual component contributes to the overall system availability. The research studyindicates that the availability importance measures could be applied in developing a strategy foravailability improvement. The subsystem/component with the largest value of importance measurehas the greatest effect on the system availability.
Research limitations/implications – The result of availability improvement strategy isdemonstrated using only a hypothetical example.
Practical implications – Using availability importance measures will help managers and engineersto identify weaknesses and indicate modifications which will improve the system availability.
Originality/value – This paper presents the concept of availability importance measure for acomponent/subsystem. It also introduces some availability importance measures based on failure rate,mean time between failures (MTBF), and repair rate/mean time to repair (MTTR) of a component/subsystem. The concept of importance measures is used to prioritise the components or subsystemsfor the availability improvement process.
Keywords Mean time between failures, Mean time to repair
Paper type Research paper
IntroductionThe most important performance measures for repairable system designers andoperators are system reliability and availability. Improvement of system availability hasbeen the subject of a large volume of research and articles in the area of reliability.Availability and reliability are good evaluations of a system’s performance. Their valuesdepend on the system structure as well as the component availability and reliability.These values decrease as the component ages increase; i.e. their serving times areinfluenced by their interactions with each other, the applied maintenance policy and theirenvironments (Samrout et al., 2005). The main requirements for the operation of complexsystems are usually specified in terms of cost and availability and/or reliability, orequivalently in terms of mean time between failure (MTBF) and/or mean time to repair
The current issue and full text archive of this journal is available at
www.emeraldinsight.com/0265-671X.htm
Availabilityallocation
643
Received November 2005Revised October 2006,
November 2006Accepted November 2006
International Journal of Quality &Reliability Management
Vol. 24 No. 6, 2007pp. 643-657
q Emerald Group Publishing Limited0265-671X
DOI 10.1108/02656710710757826

(MTTR) under a cost constraint. These requirements have to be taken into considerationin the system design stage in order to determine the appropriate reliability andavailability of each of the system’s components (Elegbede and Adjallah, 2003). In asimplistic sense, there are some issues to be resolved during the development of anavailability improvement or optimization process in design and operation phases, suchas: where it is best to attempt improvements in availability; and how to affectimprovements in availability when the areas which merit attention have been identified.Finding appropriate answers to these questions can be quite difficult and the solutions tothe many problems which result in loss of availability are frequently not obvious.
A number of researchers have investigated the theoretical problem of availabilityallocation and optimisation using different techniques and methods, e.g. Painton andCampbell (1995); Castro and Cavalca (2002; 2003); Elegbede and Adjallah (2003);Chiang and Chen (2006). The availability allocation problems are mainly dealt withconsidering the criticality of reliability and maintainability characteristics of thesystem at component level. Therefore, it is useful to consider reliability andmaintainability importance measures for improving the existing availabilitycharacteristics. The concept of importance measures came from the perception thatin any orderly arrangement of components in a system, some of the components aremore important than others in providing certain system characteristics. Componentimportance analysis is a key part of the system reliability quantification process. Itenables the weakest areas of a system to be identified and indicates modificationswhich will improve the system reliability and maintainability (Beeson and Andrews,2003). Several component importance measures have been developed in the reliabilityarea, e.g. Aven (1986), Boland and El-Neweihi (1995), Andrews and Beeson (2003), Zioand Podofillini (2003), Cassady et al. (2004); as Birnbaum (1969) first introducedmathematical concept of the importance measures. The main objectives of this studyare to define some availability importance measures in order to find the criticality ofeach component or subsystem form availability point of view, and identify amethodology which aims to allocate resources for the availability optimisationapplying the concept of availability importance measures.
This paper is organized as follows. Part 2 introduces availability importancemeasures and application of those importance measures for different types ofconfigurations and a real case study of a crushing plant is presented. Part 3 defines theavailability improvement strategy by use of the concept of importance measures forresource allocation and a numerical example of a parallel-series system is applied todemonstrate the proposed approach. In part 4, the conclusions of this paper areprovided. In this study we assumed the following:
. The system is composed of n s-independent components.
. Failure rate and repair rate of components and subsystems are known.
. All the components are repairable. The repair of components makes them asgood as new.
. Each component, subsystem, and system has two states: working or failed.
Availability importance measuresWhen assessing a system, its performance depends upon its components. Somecomponents have major influences on system reliability and availability than others. In
IJQRM24,6
644

order to evaluate the importance of different aspects of a system, a set of importancemeasurements including Structure Importance, Birnbaum Component Importance,Reliability Criticality Importance, Upgrading Function, Operational CriticalityImportance, and Restore Criticality Index (Leemis, 1995, Frickes and Trivedi, 2003,Wang et al. 2004) are widely used in engineering practices. According to Beeson andAndrews (2003), component reliability importance measure is defined as theprobability that component i is critical to system failure. One of the most widelyused reliability importance indices is Birnbaum’s component importance (Frickes andTrivedi, 2003). The reliability importance of a component can be determined based onthe failure characteristics of the component and its corresponding positioning in thesystem. The reliability importance of component i,I iR , in a system of n components isgiven by:
I iR ¼›Rs tð Þ
›Ri tð Þð1Þ
where RS(t) is the system reliability and Ri (t) is the component reliability.By using the same concept in the case of system availability performance, some
availability importance measures are defined by Barabady (2005) and can be used as aguideline in developing an improvement strategy. Availability importance measureenables the weakest areas of a system to be identified and indicates modificationswhich will improve the system availability. Efforts to improve availability can beconcentrated on those components whose contributions indicate that by upgradingthem, the maximum improvement in system availability can be achieved. Availabilityimportance measure is a function of time, the failure and repair characteristics orMTBF and MTTR parameters, and the system structure. Availability importancemeasure (I iA) assigns a numerical value between 0 and 1 to each subsystem orcomponent, with the value 1 signifying the highest level of importance. Theavailability importance of component i in a system of n components is given as follows:
I iA ¼›As
›Ai
ð2Þ
where AS is the system availability and Ai is the component availability.Availability importance measure shows the effect of the availability of subsystem
or component i on the availability of the whole system. The subsystem or componentwith the largest value has the greatest effect on the availability of the whole system. Itis useful to obtain the value of the availability importance measure of each componentin the system prior to deploying resources toward improving the specific components.This is carried out to determine which component needs to be improved in order toachieve the maximum effect from the improvement effort. If the availability of thesystem needs to improve, then efforts should first be concentrated on improving thesubsystem that has the largest effect on the availability of the system. The availabilityof a system is a function of failure rate and repair rate characteristics or Mean MTBFand MTTR parameters, which mean other sets of importance measures can be definedas:
. availability importance measure based on the failure rate or MTBF; and
. availability importance measure based on the repair rate or MTTR.
Availabilityallocation
645

Availability importance measure based on the failure rate/MTBF shows the effect ofthe failure rate/MTTR of component i on the availability of the whole system, and thefailure rate/MTBF of the component with the largest value has the greatest effect onthe availability of the whole system. It can be calculated by equation (3) or (4).
I iA;li ¼ 2›As
›li¼ 2
›As
›Ai
£›Ai
›lið3Þ
where li represents the failure rate of component i.
I iA;MTBFi¼
›As
›MTBFi
¼›As
›Ai
£›Ai
›MTBFi
ð4Þ
Availability importance measure based on the repair rate/MTBF shows the effect ofthe repair rate/MTTR of component i on the availability of the whole system, and therepair rate of the component with the largest value has the greatest effect on theavailability of the whole system. It can be calculated by equation (5) or (6).
I iA;mi¼
›As
›mi
¼›As
›Ai
£›Ai
›mi
ð5Þ
where mi represents the repair rate of component i.
I iA;MTTRi¼ 2
›As
›MTTRi
¼ 2›As
›Ai
£›Ai
›MTTRi
ð6Þ
Application of availability importance measures to a series systemConsider a system which consists of n s-independent subsystems connected in seriesand which fails when at least one of its components fails. The steady-state availabilityfor a series-system is the product of the component availabilities (Ebeling, 1997; Pham,2003).
As ¼Yni¼1
Ai ¼Yni¼1
MTBFi
MTBFi þMTTRi
¼Yni¼1
mi
mi þ lið7Þ
Availability importance measures for component i of a series system is given by:
I iA ¼›As
›Ai
¼Yn
k ¼ 1
k – i
Ak ð8Þ
Equation 8 shows that the availability of a component doesn’t affect on the availabilityimportance measure of that component. The priority in terms of increased availabilityof the system should be assigned to component i which is the component with theminimum availability estimate. Different types of availability importance measuresbased on availability characteristics for such system can be calculated by followingequations.
IJQRM24,6
646

I iA;MTBFi¼
›As
›Ai
›Ai
›MTBFi
¼ As £MTTRi
MTBFiðMTTRi þMTBFiÞð9Þ
I iA;MTTFi¼ 2
›As
›Ai
›Ai
›MTTRi
¼ As £1
ðMTTRi þMTBFiÞð10Þ
I iA;li ¼ 2›As
›Ai
›Ai
›li¼ As £
1
ðli þ miÞð11Þ
I iA;mi¼
›As
›Ai
›Ai
›mi
¼ As £li
miðli þ miÞð12Þ
Application of availability importance measures to a parallel systemConsider a system which consists of n independent subsystems connected in paralleland which works when at least one of its components works. The steady-stateavailability of a parallel-system is given by (Ebeling, 1997):
As ¼ani¼1
Ai ¼ani¼1
MTBFi
MTBFi þMTTRi
¼ani¼1
mi
mi þ li¼ 1 2
Yni¼1
1 2mi
mi þ li
� �ð13Þ
Availability importance measure for component i of the system is given as follows:
I iA ¼›As
›Ai
¼ 1 2Yn
k ¼ 1
k – i
ð1 2 AkÞ ð14Þ
Equation 14 shows that the availability of a component doesn’t affect on theavailability importance measure of that component. The priority in term of increaseavailability of the system should be assigned to component i which is the componentwith the maximum availability estimate. Different types of availability importancemeasures based on availability characteristics for such system can be calculated byfollowing equations.
I iA;MTBFi¼
›As
›Ai
›Ai
›MTBFi
¼ 1 2Yn
k ¼ 1
k – i
ð1 2 AkÞ £MTTRi
MTBFiðMTBFi þMTTRiÞ£ Ai ð15Þ
Availabilityallocation
647

I iA;MTTRi¼ 2
›As
›Ai
›Ai
›MTTRi
¼ 1 2Yn
k ¼ 1
k – i
ð1 2 AkÞ £1
ðMTBFi þMTTRiÞ£ Ai ð16Þ
I iA;li ¼ 2›As
›Ai
›Ai
›li¼ 1 2
Ynk ¼ 1
k – i
ð1 2 AkÞ £1
ðli þ miÞ£ Ai ð17Þ
I iA;mi¼
›As
›Ai
›Ai
›mi
¼ 1 2Yn
k ¼ 1
k – i
ð1 2 AkÞ £li
miðli þ miÞ£ Ai ð18Þ
Application of availability importance measures to a Series-parallel systemConsider a system which consists of n independent subsystems connected in series,and each subsystem consists of m component in parallel, the steady-state availabilityfor a series-parallel system is given by equation (19).
As ¼YnK¼1
1 2Yml¼1
ð1 2 AklÞ
!¼YnK¼1
1 2Ymi¼1
ð1 2MTBFkl
MTBFkl þMTTRkl
!ð19Þ
Availability importance measure for component ij of the system is given by:
I ijA ¼›As
›Ai;j¼
Ynk ¼ 1
k – i
1 2Yml¼1
1 2 Aklð Þ
!£ 1 2
Yml ¼ 1
l – j
Ail
0BBBBBBB@
1CCCCCCCA
ð20Þ
Equation 20 shows that the availability of a component doesn’t affect on theavailability importance measure of that component. The priority in term of increaseavailability of the system should be assigned to component ij, which is the componentwith the maximum availability importance measure. Different types of availabilityimportance measures based on availability characteristics for such system can becalculated by following equations.
IJQRM24,6
648

I ijA;MTBFij¼ I ijA £
MTTRij
MTBFijðMTBFij þMTTRijÞ£ Aij ð21Þ
I ijA;MTTRij¼ I ijA £
1
ðMTBFij þMTTRijÞ£ Aij ð22Þ
I ijA;lij ¼ I ijA £1
ðlij þ mijÞ£ Aij ð23Þ
I ijA;mij¼ I ijA £
lij
mijðlij þ mijÞ£ Aij ð24Þ
An illustrative case studyTo illustrate the concept of importance measures, we use a case study of a crushingplant in Jajarm Bauxite mine of Iran. The crushing plant is divided into six subsystemsthat work in series system which means the crushing plant is in working state if allsubsystems work. The best-fit distributions for all subsystem of the crushing plant arecalculated using Weibull þþ6 software based on historical data form the period of oneyear. Table I shows the best-fit distributions for time between failures data and time torepair data for all subsystems of the crushing plant.
The availability importance measures for all subsystems are calculated andtabulated in Table II by use of equations 2, 4, and 6. The availability importancemeasure I iA shows that the SCRCS and COCS subsystems have more influence on theavailability of the whole system. As a result, improvement in the availability of theSCRCS and COCS will cause the greatest increase in the system availability.
Comparing I iA;MTBFiand I iA;MTTRi
can determine whether the MTBF or MTTR ofcomponent i has more influence on the availability of the crushing plant. In this casestudy, if the availability of the crushing plant needs to be improved, the efforts shouldbe primarily concentrated on increasing the availability of the SCRCS and COCS. Inaddition, it is better to pay more attention to the MTTR of SCRCS and also MTTR ofCOCS subsystem; because the effect of MTTR of them on the availability of the wholesystem is about 13 and 16 times respectively greater than the corresponding effect ofthe MTBF of both subsystem which is indicated by a comparison of I iA;MTBFi
andI iA;MTTRi. However, the investment requirements to decrease the MTTR may be
much grater than those requirements to increase the MTBF. Cost trade-off is essentialfor making final decision.
Availability improvement process using importance measuresAvailability is an important characteristic of a repairable system. When theavailability of a system is low, efforts are needed to improve it. The question of how tomeet an availability goal for a system arises when the estimated availability isinadequate. This then becomes a reliability and availability allocation problem at thecomponent level. Reliability and availability engineers are often called upon to makedecisions as to whether to improve a certain component or components in order to
Availabilityallocation
649

Tim
eb
etw
een
fail
ure
sT
ime
tore
pai
rd
ata
Su
b-s
yst
emB
est-
Fit
Par
amet
ers
Bes
t-F
itP
aram
eter
s
PC
RC
S(P
rim
ary
Cru
sher
)W
eib
ull
3P
Bet
a¼
1:34
,E
ta¼
78:6
,G
amm
a¼
3:87
3L
ogn
orm
alM
ean¼
0:46
38,
Std
¼0:
922
SC
RC
S(S
econ
dar
yC
rush
er)
Wei
bu
ll3
PB
eta¼
1:11
5,E
ta¼
78:9
6,G
amm
a¼
8:93
1L
ogn
orm
alM
ean¼
0:72
0,S
td¼
1:51
5P
SC
CS
(Pri
mar
yS
cree
n)
Log
nor
mal
Mea
n¼
3:37
,S
td¼
1:14
2W
eib
ull
2P
Bet
a¼
1:49
98,
Eta
¼1:
5843
SS
CC
S(S
econ
dar
yS
cree
n)
Log
nor
mal
Mea
n¼
3:86
8,S
td¼
1:10
1L
ogn
orm
alM
ean¼
0:10
,S
td¼
1:02
1C
OC
S(C
onv
eyer
Su
bsy
stem
)L
ogn
orm
alM
ean¼
3:18
,S
td¼
0:84
1L
ogn
orm
alM
ean¼
0:15
4,S
td¼
1:11
57F
EC
S(F
eed
erS
ub
syst
em)
Ex
pon
enti
al2P
Lam
bd
a¼
0:00
57,
Gam
ma¼
24:8
0E
xp
onen
tial
2PL
amb
da¼
1:03
9,G
amm
a¼
0:15
9
Table I.Best-fit distribution andtheir parameters for TBFand TTR data sets
IJQRM24,6
650
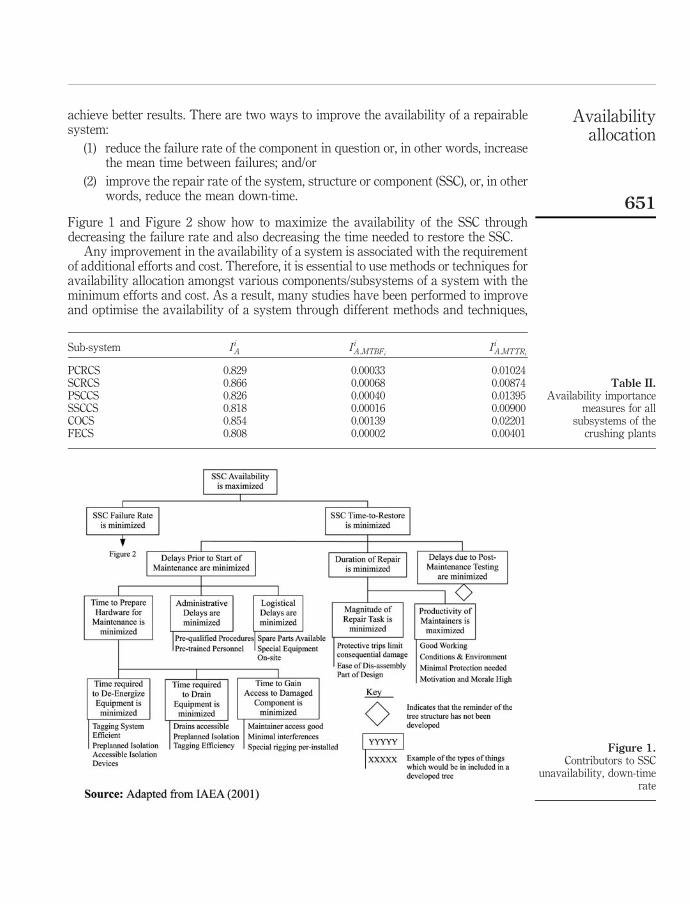
achieve better results. There are two ways to improve the availability of a repairablesystem:
(1) reduce the failure rate of the component in question or, in other words, increasethe mean time between failures; and/or
(2) improve the repair rate of the system, structure or component (SSC), or, in otherwords, reduce the mean down-time.
Figure 1 and Figure 2 show how to maximize the availability of the SSC throughdecreasing the failure rate and also decreasing the time needed to restore the SSC.
Any improvement in the availability of a system is associated with the requirementof additional efforts and cost. Therefore, it is essential to use methods or techniques foravailability allocation amongst various components/subsystems of a system with theminimum efforts and cost. As a result, many studies have been performed to improveand optimise the availability of a system through different methods and techniques,
Sub-system I iA I iA;MTBFiI iA;MTTRi
PCRCS 0.829 0.00033 0.01024SCRCS 0.866 0.00068 0.00874PSCCS 0.826 0.00040 0.01395SSCCS 0.818 0.00016 0.00900COCS 0.854 0.00139 0.02201FECS 0.808 0.00002 0.00401
Table II.Availability importance
measures for allsubsystems of the
crushing plants
Figure 1.Contributors to SSC
unavailability, down-timerate
Availabilityallocation
651

e.g. Murty and Naikan (1995), Owens et al. (2006), and Chiang and Chen (2006). Someoptimisation methods to redundancy allocation problems are applied by Castro andCavalca (2002). The genetic algorithm (Holland, 1975) is a search method which isanalogous to biological evolution and reproduction that have selected by Painton andCampbell (1995), Castro and Cavalca (2003), Elegbede and Adjallah (2003) to solveavailability allocation problems and other reliability optimisation problems. In mostcases, the problem of availability allocation and optimisation can be defined as amulti-objective optimisation problem which aims to maximize system availability andminimize system cost. In these studies, specifically in genetic algorithm, complexmathematic expressions for modelling are used. Generally, the availability importancemeasures of components should be used during the design or evaluation of systems todetermine which components or subsystems have the greatest importance for theavailability of the system. This part suggests an approach for the allocation ofresources and availability optimisation using the concept of importance measureswhich are mentioned in part 2 and the approach suitability is demonstrated usingnumerical example. The main motivation for applying the concept of availabilityimportance measures is due to its easiness to understand as it uses the criticality ofcomponents for resource allocation and availability optimisation purposes.Furthermore, the model is quantitative approach. With the assistance of importancemeasures, the components that merit additional research and development to improvetheir availabilities can be identified; therefore, the greatest gain is achieved in thesystem availability. Those components with high importance could prove to becandidates for further improvements. In the present research, it is found that theavailability improvement process could be implemented by following three steps:
Figure 2.Contributors to SSCunavailability, failure rate
IJQRM24,6
652

(1) identification of an ordered list of candidates for the availability improvementprocess.
(2) identification of effective changes or remedial actions for each candidate, whichwill either reduce its failure frequency or reduce its time required to restore acomponent.
(3) justification and prioritization of the actions for each candidate on the basis ofcost-benefit comparisons.
In step one an ordered list of candidates for availability improvement can be identifiedby using of the availability importance measure, but this measure does not providemore information about those candidates. Therefore, in step two the availabilityimportance measure based on failure rate and the availability importance measuresbased of repair rate for each component must be calculated. Comparing these twoimportance measures shows which of the two factors, the failure rate or the repair rateof each component, has more influence on the availability of the whole system. In otherwords, this comparison will show whether the availability improvement should bebased on reducing the failure rate or increasing the repair rate of critical components orsubsystems.
To find the final strategy for the availability improvement process (step 3) the costtrade-off is essential. When the availability of the system is less, it needs to beimproved using the special budget C. The question is how to manage improvementefforts and which component or components, if improved, will give better results. Thisquestion can be answered through the following procedure. The cost needed to reducethe failure rate which denoted byDCli and the cost needed to improve the repair ratethat denoted byDCmi can be calculated by equations (25) and (26).
DCli ¼›C
›li£ Dli ð25Þ
DCmi¼
›C
›mi
£ Dmi ð26Þ
›C›li
and ›C›mi
explain the variation of the availability improvement cost with respect tothe failure rate and the repair rate of component i, respectively.
If budget C is spent on improving the repair rate for the critical components therepair rate will increase asDmi :
Dmi ¼DCmi
›C›mi
¼C›C›mi
ð27Þ
Therefore, the availability will increase asDAs;miwhich can be calculated by:
DAs;mi¼ I iA;mi
£ Dmi ¼›As
›mi
£C›C›mi
ð28Þ
If the budget is spent on reducing the failure rate of the critical component, the failurerate will be decreased asDli :
Availabilityallocation
653

Dli ¼DCli
›C›li
¼C›C›li
ð29Þ
Therefore, the availability will be increased asDAs;liwhich can be calculated by:
DAs;li ¼ I iA;li £ Dli ¼›As
›li£C›C›li
ð30Þ
By comparing DAs;liand DAs;mithe strategy can be identified. If there are some
restrictions, the budget can be spent on both increasing the repair rate and decreasingthe failure rate. We then allocate a fraction f of the budget for decreasing the failurerate and the remaining fraction 1-f for increasing the repair rate. And hence theavailability improvement can be calculated by:
DAs;li ;mi¼
›As
›li£fC›C›li
þ›As
›mi
£ð1 2 f ÞC
›C›mi
ð31Þ
Illustrative numerical exampleTo illustrate the model, we made the simple example system which is illustrated inFigure 3 with the same assumptions as those given in Part 2. Table III shows thefailure rate and repair rate of all the components. It also shows the cost needed tochange the failure rate and repair rate of each component based on the failure rate ofcomponent 1. For example, the cost needed to change the failure rate of component 2and 3 is about 30 per cent and 90 per cent of the cost which is needed to decrease thefailure rate of component 1, respectively.
Figure 3.A simple system
Component Failure rate Repair rate ›C›li
= ›C›l1
›C›mi
= ›C›l1
1 0.007 0.018 1 0.32 0.0214 0.05 0.26 0.53 0.0175 0.03 0.8 0.6
Table III.Failure and repair rates ofall the components
Component I iA I iA;li I iA;mi
DAs;li
DAs;l1
DAs;li
DAs;l1
DAs;mi
DAs;m1
1 0.258 7.430 2.890 1.000 1.2962 0.265 2.602 1.114 1.347 0.3003 0.496 6.592 3.846 1.109 0.863
Table IV.Availability importancemeasures for all thecomponents
IJQRM24,6
654

Based on equation 2, 3, and 5 the availability importance measures for all componentsare calculated and tabulated in Table IV. The availability importance measure (I iA)indicates that component 3 has more influence on the availability of the whole systemand therefore, improvement in the availability of component 3 will cause the greatestincrease in the system availability. By comparing I iA;liand I iA;mi
can determine whetherthe repair rate or the failure rate has more influence on the availability of the system. Inthe example studied, if the availability of the system needs to be improved, the effortshould first be concentrated on increasing the availability of component 3. In addition,it is better to pay more attention to the failure rate of component 1, because the effect ofthis failure rate on the availability of the whole system is about 2 times greater than thecorresponding effect of the repair rate, which is indicated by a comparison of I iA;liandI iA;mi
.By using equations 28 and 30, the final decision in the availability improvement
process can be identified. From Table II it is found that it is better to focus one’s effortsand finances on reducing the failure rate of component 2 and increasing the repair rateof component 1. In this way the availability of the system will increase more than byusing other strategies with the same effort and cost.
ConclusionsIn this research study some availability importance measures are defined and a methodfor availability allocation and optimisation of system’s availability using the concept ofavailability importance measures is proposed. In the case of a system’s availabilityperformance, availability importance measures could be used as a guideline indeveloping a strategy for availability improvement. It is useful to obtain the value ofthe availability importance measure for each component in the system prior todeploying resources toward improving the specific components.
References
Andrews, J.D. and Beeson, S. (2003), “Birnbaum’s measures of component importance fornoncoherent systems analysis”, IEEE Transactions on Reliability, Vol. 52 No. 2, pp. 213-9.
Aven, T. (1986), “On the computation of certain measures of importance of system components”,Microelectron Reliab, Vol. 26 No. 2, pp. 279-81.
Barabady, J. (2005), “Improvement of system availability using reliability and maintainabilityanalysis”, Licentiate thesis, Lulea University of Technology, Lulea, available at: http://epubl.ltu.se/1402-1757/2005/92/LTU-LIC-0592-SE.pdf.
Beeson, S. and Andrews, J.D. (2003), “Importance measures for non-coherent-system analysis”,IEEE Transactions on Reliability, Vol. 52 No. 3, pp. 301-10.
Birnbaum, Z.W. (1969), “On the importance of different component in a multi-componentsystem”, in Krishaniah, P.R. (Ed.), Multivariate Analysis, Vol. 11, Academic Press,New York, NY.
Boland, P.J. and El-Neweihi, E. (1995), “Measures of component importance in reliability theory”,Computers & Operations Research, Vol. 22 No. 4, pp. 455-63.
Cassady, R.C., Pohl, E.A. and Song, J. (2004), “Managing availability improvement efforts withimportance measures and optimization”, IMA Journal of Management Mathematics,Vol. 15 No. 2, pp. 161-74.
Castro, H.F. and Cavalca, K.L. (2002), “Reliability optimization of redundant system”,SAE Technical Papers, Vol. 1 No. 1, pp. 1-9.
Availabilityallocation
655

Castro, H.F. and Cavalca, K.L. (2003), “Availability optimization with genetic algorithm”,International Journal of Quality and Reliability Management, Vol. 20 No. 7, pp. 847-63.
Chiang, C-H. and Chen, L-H. (2006), “Availability allocation and multi-objective optimization forparallel-series systems”, Reliability Engineering and System Safety, available at: www.scincedirect.com (in press).
Ebeling, C.E. (1997), An Introduction to Reliability and Maintainability Engineering, McGraw-Hill,New York, NY.
Elegbede, C. and Adjallah, K. (2003), “Availability allocation to repairable systems with geneticalgorithms: a multi-objective formulation”, Reliability Engineering and System Safety,Vol. 82 No. 3, pp. 319-30.
Frickes, M.F. and Trivedi, K.S. (2003), “Importance analysis with Markov chains”, Proceedings ofthe 49th Annual Reliability and Maintainability Symposium, Tampa, FL, 27-30 January,pp. 89-95.
Holland, J.H. (1975), Adaptation in Natural and Artificial System: An Introduction withApplication to Biology, Control and Artificial Intelligence, University of Michigan Press,Ann Arbor, MI.
Leemis, L.M. (1995), Reliability: Probabilistic Models and Statistical Methods, Prentice Hall,Englewood Cliffs, NJ.
Murty, A.S.R. and Naikan, V.N.A. (1995), “Availability and maintenance cost optimization of aproduction plant”, International Journal of Quality & Reliability Management, Vol. 12 No. 2,pp. 28-35.
Owens, J., Miller, S. and Deans, D. (2006), “Availability optimization using spares modeling andthe six sigma process”, Annual Reliability and Maintainability Symposium, pp. 636-40.
Painton, L. and Campbell, J. (1995), “Genetic algorithms in optimization of system reliability”,IEEE Transaction on Reliability, Vol. 44 No. 2, pp. 172-8.
Pham, H. (2003), “Steady-state series-system availability”, IEEE Transactions on Reliability,Vol. 52 No. 2, pp. 146-7.
Samrout, M., Yalaoui, F., Chatelet, E. and Chebbo, N. (2005), “New methods to minimize thepreventive maintenance cost of series-parallel systems using ant colony optimization”,Reliability Engineering and System Safety, Vol. 89 No. 3, pp. 346-54.
Wang, W., Loman, J. and Vassiliou, P. (2004), “Reliability importance of components in a complexsystem”, Proceedings of the Annual Reliability and Maintainability Symposium,International Symposium on Product Quality and Integrity, pp. 6-11.
Zio, E. and Podofillini, L. (2003), “Importance measures of multi-state components in multi-statesystems”, International Journal of Reliability, Quality and Safety Engineering, Vol. 10 No. 3,pp. 289-310.
Further reading
International Atomic Energy Agency (IAEA) (2001), Reliability Assurance ProgrammeGuidebook for Advanced Light Water Reactors, IAEA, Vienna.
About the authorsJavad Barabady is PhD student at the Division of Operation and Maintenance Engineering;Lulea University of Technology. His research topic is related to production availability analysisof repairable system. He received licentiate degree in the field of operation and maintenanceengineering from Lulea University of Technology. He also received his MSc degree in 1998 in the
IJQRM24,6
656

field of mining engineering from Tehran University. Javad Barabady is the corresponding authorand can be contacted at: [email protected]
Uday Kumar is head of the division of Operation and Maintenance engineering, LuleaUniversity of Technology. He obtained his B. Tech from BHU, India during the year 1979. Heobtained his PhD degree in the field of Reliability and Maintenance from Lulea University ofTechnology, Sweden in 1990. In 1997, he was appointed as a Professor of MechanicalEngineering (Maintenance) at Stavanger University College, Stavanger, Norway. Since July 2001,he has taken up the position as a Professor of Mechanical Engineering (Operation andMaintenance) at Lulea University of Technology, Lulea, Sweden. He is Director of Lulea RailwayResearch Center at Lulea University. He has published more than 100 reports and papers inInternational Journals and Conference proceedings.
Availabilityallocation
657
To purchase reprints of this article please e-mail: [email protected] visit our web site for further details: www.emeraldinsight.com/reprints