Survey of online retail customers for a merger inquiry - GOV.UK
51
-
Upload
khangminh22 -
Category
Documents
-
view
2 -
download
0
Transcript of Survey of online retail customers for a merger inquiry - GOV.UK


Contents
1 Introduction .................................................................................................................... 1
Background ................................................................................................................... 1
Research methodology .................................................................................................. 1
Fieldwork ....................................................................................................................... 2
Response rates ............................................................................................................. 3
Notes about the survey .................................................................................................. 3
Assessment of possible non-response bias .................................................................. 5
Analysis and interpretation ............................................................................................ 7
Cognitive interviews....................................................................................................... 8
2 Summary of key findings ............................................................................................... 9
Respondent profile ........................................................................................................ 9
Behaviour ...................................................................................................................... 9
Choice ........................................................................................................................... 9
Diversion ..................................................................................................................... 10
Response to a hypothetical price increase .................................................................. 11
Response to specific items not being available ........................................................... 11
3 Respondent profile ...................................................................................................... 12
4 Behaviour questions .................................................................................................... 15
5 Choice questions ......................................................................................................... 17
6 Diversion questions ..................................................................................................... 24
Diversion results – Footwear ....................................................................................... 24
Diversion results – Apparel .......................................................................................... 29
Subsequent diversion amongst own party diverters .................................................... 33
Response to a hypothetical 5% price increase ............................................................ 34
Response to specific items not being available ........................................................... 35
7 Appendix ..................................................................................................................... 36
Questionnaire .............................................................................................................. 36
Survey invitation .......................................................................................................... 47

Page 1
1 Introduction
Background
The CMA is conducting an inquiry into the completed acquisition by JD Sports Fashion PLC (JD Sports) of Footasylum PLC (Footasylum), together ‘the Parties’/’the Merger Parties’. The CMA commissioned research with customers of the Parties’ UK-based online retail businesses for the supply of footwear and apparel.
An online survey was conducted with customers who had shopped online with JD Sports and/or Footasylum based on customer lists provided by the Parties. The survey focussed on a recent online shop with the Party in question.
This report summarises the findings of this research.
Research methodology
In terms of sampling, the CMA requested customer data from the Parties covering orders dispatched for delivery in the UK over a two-week period in April-May 2021.
Various steps were taken to prepare the sample, including:
• Removing orders dispatched outside the required date range: 18th April – 1st May 2021.
• Removing records that didn’t contain all the information required for the survey design and conduct.
• Each Party’s sample was de-duplicated on unique reference number (excluding multiple dispatches within the same order number) and customer email address; where there were duplicate orders within the same Party, the most recent order was retained.
• Customer email addresses were also compared against the other Party and, where the same e-mail address appeared in both Parties’ lists, the most recent order was retained in the sample. Where a purchase was made by the same customer from both Parties on the same day, a random selection was made as to which one to retain.
The JD Sports sample for the reference period was larger than the Footasylum sample for the same period. Therefore, a similar sized, randomly selected subsample was selected from the JD Sports sample.
Page 2
Fieldwork
A pilot survey was issued to 4,000 customers of each Party on 29th April, followed by a small number of cognitive interviews to assess survey comprehension. Results from these interviews are shown in Section 1.8.
Email invitations were dispatched in batches throughout 10th May for the full fieldwork.
The email gave a detailed explanation about the need for the research, provided links to the survey, and gave everyone the opportunity to unsubscribe from future mailings. It also addressed aspects around data protection and GDPR.
SMS reminders were sent on the day after invitation and reminder emails were sent every 2 to 3 days. The final reminder email was sent on the 23rd May and fieldwork closed at 9.00am on Monday 24th May. Where possible, key marketing campaigns of the Parties were taken into consideration and reminders adjusted to avoid emailing on the same day.
Half of the sample base were incentivised and half weren’t. Due to extremely low response rates amongst the non-incentivised respondents, a decision was made to exclude these from the final dataset – more information can be found in the Response rates section.
The first few reminders were identical to the original invitation and labelled “Please help the Competition and Markets Authority (CMA) with some important consumer research (and receive a £5 voucher)”. Towards the end of the fieldwork period, to encourage participation, the subject line was changed to “Last chance” on the final day of fieldwork.
Daily updates were sent to the CMA detailing the number of interviews for each Party.

Page 3
Response rates
DJS Research emailed a total of 42,000 customers (following the sample cleaning detailed within section 1.2).
A small proportion of emails ‘bounced’ and those who started the survey but said they were under the age of 16 were screened out from going on to complete it (in order to adhere to Market Research Society guidelines). It was assumed that a similar, small proportion of customers in the total issued sample would also be under the age of 16 and adjusting for this, along with the bounce-backs, removed a total of 2,331 from the total population – this equates to 39,669 qualifying respondents.
A total of 1,708 customers completed the survey – an overall response rate of 4.3% (JD Sports 4.47%, Footasylum 4.03%).
Half of the sample base was incentivised with a £5 Giftpay voucher and half wasn’t. Response rates were so low for the non-incentivised sample, a decision was made to exclude them from the final dataset. It was assumed that a similar proportion of incentivised and non-incentivised respondents bounced back, and the following table shows response rates for each party included in the results:
Table 1: Survey response rates for each Party
JD Sports Footasylum
Total qualifying population 9,890 9,907
Number of completed surveys 691 634
Response rate 6.99% 6.40%
Notes about the survey
The average interview length was 4.75 minutes. The survey consisted mainly of closed questions, asking for single or multiple answers, as appropriate. An ‘other – please specify’ option was provided where necessary, giving respondents the opportunity to record something that was not in a pre-coded list. Where another response was provided that related to something already in the list, it was ‘back-coded’ into the relevant response code. New codes were created for responses that different substantially from any pre-codes.

Page 4
Fascia owned by the Parties are referred to within the report as Same Party other fascia, or Merger Party other fascia, as appropriate. A list of the main other fascia owned by each Party is provided below.
Table 2: Main other fascia owned by each Party
JD Sports Footasylum
Size? Seven
Footpatrol
Tessuti
Scotts
Choice
Xile
Infinities
Hip Store
Competitor lists were provided to the CMA by each Party for each product type and for the online and in-store channels. A particular competitor may, therefore, be listed as a competitor for apparel only, footwear only (or both product types); for online, physical stores or both; and for either JD Sports, Footasylum or both1.
1 The Parties were each asked to provide their ‘Top 12 competitors’ for each combination of footwear and apparel and online and in-store channels.

Page 5
Assessment of possible non-response bias
Age and gender are not available for the entire sample, only for the respondent group.
Representativeness of the respondent group was, therefore, assessed on the following variables:
1. Number of items ordered
2. Spend on footwear
3. Spend on apparel
Data is analysed for response/non-response within Parties as a greater number of baskets at JD Sports included apparel purchases.
In terms of purchase behaviour within the responder/non-responder samples, there is little difference in the average number of items, footwear spend or apparel spend in responder vs non responder baskets, as outlined in the analysis below:
A greater proportion of JD Sports respondents bought both footwear and apparel compared to Footasylum respondents. There is little difference between the type of shoppers who responded and those who did not respond to the online survey.
Table 3: Responder vs non-responder sample by product category purchased
Product category purchased
Footasylum JD Sports
Non-responder Responder Non-responder Responder
Apparel only 37.9% 39.3% 52.8% 54.8%
Footwear only 56.8% 53.2% 38.4% 36.1%
Both 5.3% 7.5% 8.9% 9.2%

Page 6
The number of items dispatched is recorded for each responder and non-responder. The average number of items per basket is higher for JD Sports responders and non-responders than for Footasylum responders and non-responders. There is no difference in the number of items in the responder vs the non-responder online baskets.
Table 4: Responder vs non-responder sample by number of items purchased
Average number of items
95% Confidence Interval
Footasylum Non-responder 1.61 (1.58, 1.64)
Responder 1.73 (1.63, 1.84)
JD Sports Non-responder 1.94 (1.91, 1.97)
Responder 2.00 (1.90, 2.10)
The footwear spend (total for dispatched items excluding delivery) is recorded for each responder and non-responder. JD Sports responders and non-responders have a slightly higher average footwear spend than Footasylum responders and non-responders. There is no difference in the average footwear spend in the responder vs the non-responder online baskets.
Table 5: Responder vs non-responder sample by average footwear spend
Average footwear spend
95% Confidence Interval
Footasylum Non-responder £52.81 (£52.09, £53.53)
Responder £49.96 (£45.93, £54.00)
JD Sports Non-responder £34.01 (£33.38, £34.64)
Responder £33.81 (£27.83, £33.82)

Page 7
The apparel spend (total for dispatched items excluding delivery) is recorded for each responder and non-responder. JD Sports responders and non-responders have a slightly higher average apparel spend than Footasylum responders and non-responders. There is no difference in the average apparel spend in the responder vs the non-responder online baskets.
Table 6: Responder vs non-responder sample by average apparel spend
Average apparel spend
95% Confidence Interval
Footasylum Non-responder £29.77 (£29.10, £30.43)
Responder £32.35 (£28.99, £35.71)
JD Sports Non-responder £38.53 (£37.82, £39.28)
Responder £39.59 (£36.29, £42.90)
In conclusion, there is no statistically significant difference in the type of customer, the average number of items in the basket, the average apparel spend or the average footwear spend between the online responders and non-responders at either JD Sports or Footasylum.
In light of these findings, it was decided that incorporation of non-response weights was unnecessary.
Analysis and interpretation
Statistical analysis was conducted to assess the need for spend weighting. It was found that there is little difference in diversion behaviour by levels of spend; including diversion to the Merger Party, between the groups categorised according to spend on footwear and spend on apparel.
As a consequence, no spend weighting has been applied to the data in this report.
Where significant differences are referred to throughout the report, this means statistically significant, where the significance testing used is a t-test reported at the 0.05 level.

Page 8
Cognitive interviews
We completed 21 cognitive interviews in total (10 JD Sports, 11 Footasylum) and overall the online survey was seen as easy to complete with little confusion.
We had a mix of ages and slightly more women.
There were different views on preferred shopping mode. Online was seen as easy and preferred by those who were busy and didn’t like “going shopping”, as well as offering a wider range. Whereas for others in-store was seen as more effective for making the right choice (particularly sizing) and avoiding delivery problems and would have preferred to go in store during the pandemic if they could.
Quite a few said they had got used to online shopping during the pandemic and that this might impact on future decisions, but there were some who had had problems with online shopping and preferred going to store if they can.
There was hardly any fear going into shops due to the pandemic, all appeared that they would if they wanted to, but there were one or two comments relating to stores being very busy and others not respecting social distancing and a very small number did not know shops had reopened.
Some comments relating to specific questions:
• At the beginning at QA1, most understood non-essential shops, but a few felt footwear and clothing would be clearer as views on non-essential differ slightly, although there were others who felt non-essential was clearer. This was changed for the main survey.
• At QC6, “fully over” is seen as the complete end to the COVID pandemic, which many felt was unrealistic and “over” is progressing towards to the end of the pandemic with social distancing restrictions still in place. This did not really appear to make any difference to their answers as most were clear on how they preferred to shop if the shops were open and were not put off by social distancing measures, although by stating fully over we are more likely to eliminate all impact from the pandemic from others in the survey (that said, “over” may be a more realistic assessment of the future). This was changed for the main survey.
• At QD1B, when asked about “specific” item, they understand this to be the exact item, brand and model. Some would have looked elsewhere for that item, and some would have just found the next best thing. No change was necessary as a result of this comment.

Page 9
2 Summary of key findings
Respondent profile
Footasylum respondents are more likely to be younger than JD Sports respondents, although both groups are more likely to be younger than the population as a whole. Both respondent groups were also slightly more likely to be female.
There was a fairly even split between those purchasing footwear and those purchasing apparel with a small minority buying both. The majority had purchased just one item.
Behaviour
Before placing an order, Footasylum respondents are more likely to have looked on other retailers’ websites than JD Sports respondents - to see whether the item is available and to check the price. Virtually the same proportion of JD Sports respondents look for the item on one or more retailers’ websites as compare prices of the items.
Footasylum footwear respondents are much more likely than JD Sports respondents to state that ‘I intended to buy the specific item I ordered’ as the main reason for visiting the Party website/app.
Intending to buy the specific item/s ordered is also the main purpose for JD Sports respondents, with a large proportion of respondents also stating that they intended to buy item/s, but not necessarily the one/s they ended up ordering.
Choice
Price and ‘having a specific item’ are the main reasons why respondents choose JD Sports or Footasylum for their purchase over another online brand. Fast/reliable/convenient delivery is ranked third for Footasylum respondents, whereas Good/wide range of products/brands ranked third for JD Sports respondents.
Asked about spending behaviour prior to the pandemic, the majority of respondents had bought their items online rather than in a physical store.

Page 10
During the pandemic online shopping increased by approximately 30%.
Following the pandemic, findings suggest that the proportion of customers shopping mainly online will remain the same, with more customers buying about the same online and in store.
Diversion
Respondents were asked a series of questions to understand what they would do in a range of scenarios. These were presented as hypothetical scenarios:
• Respondents were asked what they would do if before starting their shop they knew the Party had stopped selling online
o Those who said they would buy online using another website/app were asked which retailer’s website they would purchase from
o Those who said they would visit a physical store were asked which store they would have been most likely to shop at instead
• Respondents who stated that they would purchase from the Party’s own physical store were also asked what they would do if both the Party’s website and all its stores had closed
o These respondents were then also asked which alternative website/store they would visit instead, depending on their answer
When asked what they would do if they knew before they started their shop that the Party had stopped selling online, approximately six out of ten respondents would divert to another website/app rather than to a physical store.
When asked which website/app they would divert to, a higher proportion of Footasylum respondents would divert to JD Sports than vice versa, irrespective of whether buying footwear or apparel.
More JD Sports respondents would divert to a named 3rd party rather than to Footasylum fascia; again, irrespective of the type of item/s purchased.
Of the JD Sports respondents who said they would divert to a physical store, had the Party stopped selling online, more would divert to JD Sports stores rather than to Footasylum or named

Page 11
3rd party stores for footwear; whereas for apparel, they would divert to a named 3rd party.
Footasylum footwear respondents were broadly split between JD Sports fascia (40%) and 3rd party competitors (36%). Whereas apparel respondents would divert to JD Sports fascia (37%) over Footasylum fascia (29%), or named 3rd party (28%).
In the scenario that the respective Party stopped selling online and closed all their stores (presented only to those respondents who had initially said that they would go to a Same Party store, so base sizes are low), the majority of Footasylum respondents state that they would divert to JD Sports fascia, whereas the majority of JD Sports respondents who had initially said that they would go to a Same Party store, would divert to 3rd party competitors if JD Sports had stopped selling online and closed all their stores; this was the case both for footwear (83%) and apparel (73%).
Response to a hypothetical price increase
Respondents were asked what they would have done if, hypothetically, prices both online and in-store had increased by 5%.
Around half of respondents indicated that they would have still made the purchase(s) if the Party had increased its prices.
Response to specific items not being available
Respondents were then asked if they would still purchase equivalent types of products, if the exact items they had purchased were no longer stocked by the Party (either online or in-store). Footasylum apparel respondents were more likely to have still ordered apparel if the exact items no longer available from Footasylum; those buying footwear were less likely to say they would still buy footwear items than not.
JD Sports footwear and apparel respondents were fairly evenly split between whether they would have still ordered equivalent types of products or not, if the exact items they had purchased were no longer available from JD Sports.

Page 12
3 Respondent profile
Footasylum respondents are significantly younger than JD Sports respondents with two-fifths of them falling into the 16-24 year age category (38%), compared with a quarter of JD Sports respondents (25%).
Two-thirds of JD Sports respondents are female (66%), compared with three-fifths of Footasylum respondents (61%).
Figure 1: Age and gender

Page 13
JD Sports respondents were more likely to have bought apparel only (55%), followed by footwear only (35%); whereas Footasylum respondents were more likely to have bought the reverse (53% footwear only, 39% apparel only). A small number of respondents bought both footwear and apparel rather than one or the other product category (JD Sports 9%, Footasylum 7%). The average number of purchases for JD Sports is 2.0 items and 1.7 for Footasylum:
Figure 2: Items purchased

Page 14
All results in the sections that follow are presented separately for ‘footwear’ and for ‘apparel’, within Party. To enable analysis for each of these categories of purchase separately, where respondents had bought both footwear and apparel, their responses were added to the data for the footwear only purchasers and the apparel only purchasers, meaning that 63 JD Sports purchasers’, and 47 Footasylum purchasers’ responses were attributed to both footwear and apparel base sizes.
JD Sports
• 308 bought footwear only + 63 bought footwear and apparel = 371 respondents • 446 bought apparel only + 63 bought both footwear and apparel = 509 respondents
Footasylum
• 385 bought footwear only + 47 bought footwear and apparel = 432 respondents • 296 bought apparel only + 47 bought both footwear and apparel = 343 respondents
Figure 3: Breakdown of base sizes

Page 15
4 Behaviour questions
Before placing an order, Footasylum respondents are significantly more likely to look on other retailers’ websites to see whether the item was available (58% footwear and 48% apparel) than JD Sports respondents (footwear 38% and apparel 37%), and also to compare the price of the item/s (47% footwear and 38% apparel for Footasylum, compared with 39% footwear and 33% apparel for JD Sports).
Figure 4: Action taken before placing online order

Page 16
Shopping for specific item/s is the main purpose for both JD Sports (54% footwear and 47% apparel) and Footasylum respondents (59% footwear and 47% apparel), however, significantly more JD Sports footwear respondents said they intended to buy [clothing and/or footwear] but not necessarily the item/s they ended up ordering than Footasylum footwear respondents.
Figure 5: Main purpose for visiting website/app

Page 17
5 Choice questions
Respondents were first asked for all their reasons for choosing JD Sports or Footasylum website/app rather than another online retailer. Good prices/special offers is selected as the top reason by Footasylum respondents for apparel (46%), whereas footwear respondents said they had what they specifically wanted (48%). Fast/reliable/convenient delivery was also mentioned by a third of Footasylum respondents (34% for both footwear and apparel).
JD Sports respondents also say that good prices/special offers is one of the reasons (39% for both footwear and apparel), but this is closely followed by the website/app had what they specifically wanted (38% for both footwear and apparel).
Figure 6: Reasons for choosing [brand] rather than another online retailer

Page 18
The following figure combines all the attributes listed under the Price, Quality, Range, Service and Other categories, highlighted in brackets in figure 6. As well as Price (JD Sports footwear 66%, apparel 67%; Footasylum footwear 69%, apparel 68%) and Range (JD Sports footwear 56%, apparel 58%; Footasylum footwear 61%, apparel 62%) being the overriding factors for shopping at a particular online brand over another, Service is selected by over two-fifths of Footasylum respondents and one third of JD Sports respondents as well (JD Sports footwear 32%, apparel 36%; Footasylum footwear 45%, apparel 46%).
Figure 7: Reason for choosing [brand] rather than another online retailer (net scores)

Page 19
Respondents were then asked for their main reason for choosing JD Sports or Footasylum over another online brand. Good prices/special offers is the main reason for JD Sports respondents, purchasing both footwear (22%) and apparel (20%) and for Footasylum apparel respondents (23%); whereas for Footasylum footwear respondents, having what they specifically wanted is top for footwear (29%).
Figure 8: Main reason for choosing [brand] rather than another online retailers

Page 20
When combining the scores into the four key areas of Price, Quality, Range and Service, Price is the key driver for JD Sports and Footasylum respondents for both footwear (50% and 42%) and apparel (45% and 44%).
Range is selected by around one third of respondents for both Parties and across the different product types (JD Sports footwear 27%, apparel 30%; Footasylum footwear 36%, apparel 30%), whereas more Footasylum respondents mention Service than JD Sports respondents for the two product types (Footasylum footwear 9%, apparel 10%; JD Sports footwear 5%, apparel 6%).
Figure 9: Main reason for choosing [brand] rather than another online retailer (net scores)

Page 21
Nearly half of respondents bought most of their items online pre-pandemic. Over four in ten respondents say they bought all/nearly all or most of their items online across both Parties and product types (net scores: JD Sports footwear 44%, apparel 45%; Footasylum footwear 48%, apparel 43%).
Around one quarter bought most or all or their items in physical stores (net scores: JD Sports footwear 28%, apparel 26%; Footasylum footwear 27%, apparel 26%) and a similar proportion bought about the same online and in physical stores (JD Sports footwear 25%, apparel 26%; Footasylum footwear 22%, apparel 26%).
Figure 10: Spending behaviour before pandemic

Page 22
Customers were asked how much they had spent during the Covid-19 pandemic. Nearly four in ten customers said they had spent about the same on footwear as they used to before the pandemic (JD Sports 39%, Footasylum 38%); and three in ten said the same for apparel (JD Sports 30%, Footasylum 30%).
Around three in ten said they had spent more than they used to during the pandemic (JD Sports footwear 26%, apparel 32%; Footasylum footwear 30%, apparel 29%) with the same proportion saying less than they used to (JD Sports footwear 29%, apparel 33%; Footasylum footwear 26%, apparel 32%).
Figure 11: Spending behaviour during pandemic

Page 23
Over two-fifths of customers will continue to buy most of their items online once the pandemic is fully over (net scores: JD Sports footwear 43%, apparel 43%; Footasylum footwear 47%, apparel 40%).
Around one third will buy about the same online and in physical stores (scores: JD Sports footwear 36%, apparel 34%; Footasylum footwear 32%, apparel 41%) whereas fewer customers plan to buy in physical stores (net scores: JD Sports footwear 17%, apparel 18%; Footasylum footwear 17%, apparel 14%).
Figure 12: Spending behaviour after pandemic

Page 24
6 Diversion questions
Respondents were asked a series of questions to understand what they would do in a range of scenarios. These were presented as hypothetical scenarios:
Response to Party having stopped selling online
• Respondents were asked what they would be most likely to do if before starting their shop they knew the Party had stopped selling online
o Those who said they would buy online using another website/app were asked which retailer’s website they would purchase from
o Those who said they would visit a physical store were asked which store they would have been most likely to shop at instead
• Respondents who stated that they would purchase from the Party’s own physical store were also asked what they would do if both the Party’s website and all its stores had closed
o These respondents were then also asked which alternative website/store they would visit instead, depending on their answer
Response to a hypothetical price increase
• Respondents were asked what they would have done if, hypothetically, prices both online and in-store had increased by 5%
Response to specific items not being available
• Respondents were then asked if they would still purchase equivalent types of products, if the exact items they had purchased were no longer stocked by the Party (either online or in-store).
Diversion results – Footwear
In the scenario that the Party had stopped selling online, three-fifths of footwear purchasers would most likely have shopped online using another app/website (JD Sports 59%, Footasylum 63%); a smaller proportion would have shopped at a physical store or stores (JD Sports 25%, Footasylum 24%).

Page 25
While respondents who said they would have shopped online were not given the option of selecting the same fascia2, respondents who said that they would have shopped at a physical store were, at this stage of the survey, allowed to select the same fascia3. This response, where a customer selects the same fascia as that where they had originally made the online purchase in the sample is referred to as ‘same party’ or ‘own party’ diversion.
Over half of JD Sports respondents opting to go to a physical store to purchase their item/s (in the scenario where the Party had stopped selling online) selected the same Party (53% of JD Sports respondents would divert to a JD Sports physical store).
The proportion is lower for Footasylum respondents, 21% of those diverting to a physical store would have chosen the same Party, i.e. Footasylum. A slightly higher proportion would have chosen JD Sports or another fascia owned by JD Sports (36% and 2% respectively).
Figure 13: What would have done if [brand] stopped selling online – footwear
2 JD Sports respondents were not given the option to select that they would have shopped at the JD Sports website/ app and Footasylum respondents were not given the option to select that they would have shopped at the Footasylum website/app – because the hypothetical scenario presented is that the Party in question had stopped selling online. 3 Respondents who stated that they would have shopped at a physical store were given the option to select that they would have shopped at the Party’s physical store.
Page 26
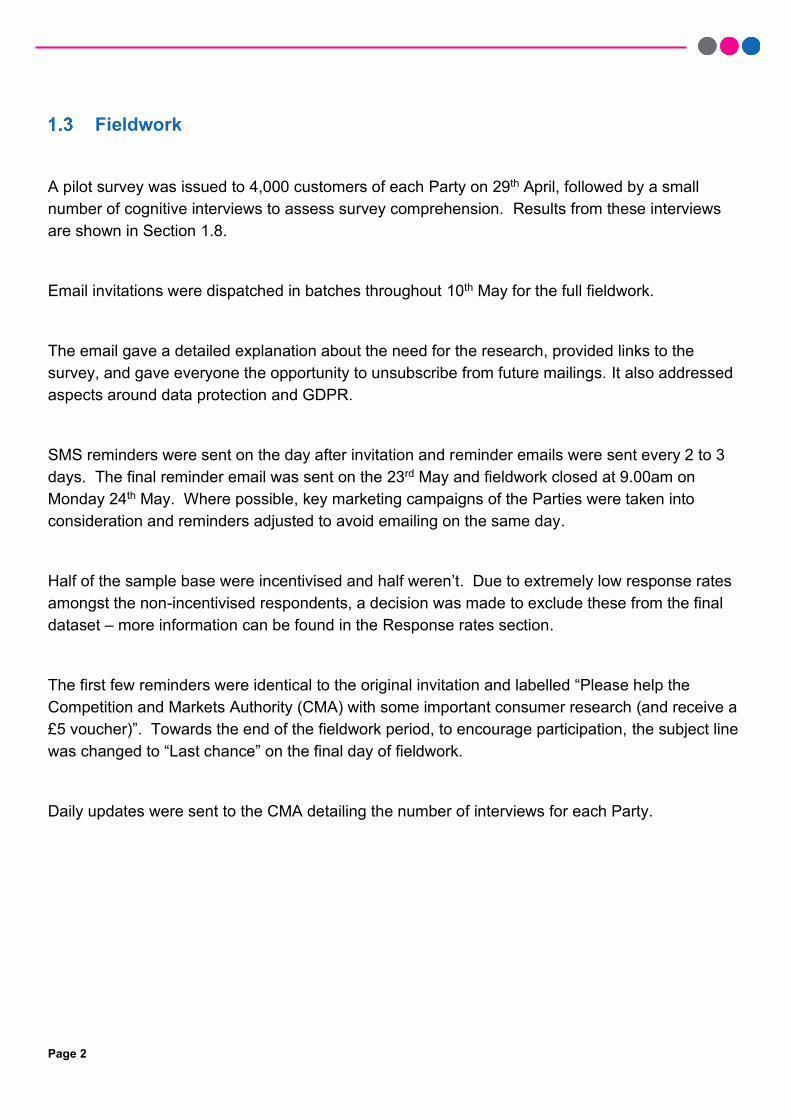
When asked which other retailer’s website or app they would have been most likely to shop with instead, about two-fifths of Footasylum respondents say they would have been most likely to shop with JD Sports (42%). Other third parties are some distance behind JD Sports, with Nike being the next most cited for those shopping online at 13%.
In comparison, over a quarter of JD Sports respondents who would have shopped online using another website or app, state that they would have been most likely to shop with Nike (28%).
Footasylum respondents who would divert to a physical store, are more likely to select JD Sports (36%) than any other party. Footasylum (21%) and Nike (16%) are the next most frequently mentioned parties for Footasylum respondents diverting to a physical store.
JD Sports respondents choosing to shop in a physical store would divert to a JD Sports store (50%) significantly more than a range of other parties, including Footasylum (10%) and Footlocker (8%).
Figure 14: Who would have bought from if [brand] stopped selling online – footwear
Page 27
Figure 14 shows the most frequently cited competitors for the two ensuing questions for the scenario that the Party had stopped selling online. Other competitors were selected by lower proportions of respondents, including:
• Shopped online using another website/app: o JD Sports respondents – Office 4 (2%), Offspring 3 (1%), Size? 3 (1%), Puma 2
(1%), Scotts 1 (0%), Zalando 1 (0%), Flannels 1 (0%), Clarks 1 (0%). o Footasylum respondents – Amazon 11 (5%), Schuh 8 (3%), Sports Direct 7 (3%),
Office 4 (2%), Offspring 3 (1%), Size? 3 (1%), Puma 2 (1%), Boohoo/Boohoo Man 1 (0%), Scotts 1 (0%), Zalando 1 (0%), Flannels 1 (0%), Clarks 1 (%).
• Shopped at a physical store or stores: o JD Sports respondents – Nike 3 (4%), Flannels 3 (4%), Schuh 2 (3%), Size? 2 (3%),
Next 1 (1%), Office 1 (1%), The North Face 1 (1%), Deichmann 1 (1%). o Footasylum respondents – Selfridges 3 (3%), END 3 (3%), Size? 2 (2%), Zara 2
(2%), Choice 1 (1%), Office 1 (1%), Offspring 1 (1%), Sports Direct 1 (1%), Urban Outfitters 1 (1%).
For a full list of the pre-coded competitors, please refer to the questionnaire appended at the end of this document.

Page 28
Figure 15 below shows diversion to the Merger Party broken down into sub-groups according to age, gender and the main reason for visiting the website.
The proportion of female customers diverting from Footasylum online to JD Sports physical store are significantly higher (50%) than male customers (18%). All Footasylum customers aged >55 would divert to a JD Sports physical store, significantly higher than the younger age groups (range 35%-40%) and those whose main purpose was to browse but not buy are significantly less likely than those whose main purpose was to visit and buy the specific item or buy but not necessarily the item/s ordered (31% compared with 40% and 41% respectively) to divert from Footasylum online to JD Sports physical store.
Other significant differences not shown on the chart below include: JD Sports customers with higher total order value (£200-£249.99) significantly more likely to divert to Footasylum than JD Sports customers with low order value (<£50) (17% compared to 0%) and Footasylum customers buying a single item are significantly less likely to divert to JD Sports than those buying 2-5 items (40% vs 58%).
Figure 15: What would have done if [brand] stopped selling online – footwear (key sub-segments)

Page 29
Diversion results – Apparel
In the scenario that the Party had stopped selling online, over half of apparel purchasers would most likely have shopped online using another app/website (JD Sports 55%, Footasylum 56%); a smaller proportion would have shopped at a physical store or stores (JD Sports 28%, Footasylum 25%).
Half of Footasylum respondents who would have shopped online, would have been most likely to choose JD Sports (49%) or a JD Sports other fascia (2%), compared to just 8% of JD Sports respondents who would have shopped online choosing Footasylum.
Amongst respondents opting to go to a physical store, over one third of JD Sports respondents (35%) said they would divert to a physical store of the same Party. The proportion is lower for Footasylum respondents, where 29% of those diverting to a physical store would have chosen the same Party, i.e. Footasylum. A higher proportion of Footasylum respondents choosing to shop at a physical store or stores would have actually chosen JD Sports (37%).
Figure 16: What would have done if [brand] stopped selling online – apparel

Page 30
When asked which other retailer’s website or app they would have been most likely to shop with instead, half of Footasylum respondents say they would have been most likely to shop with JD Sports (49%). Other third parties are some distance behind JD Sports, with Nike being the next most cited for those shopping online at 11%.
In comparison, fewer than one in ten JD Sports respondents who would have shopped online using another website or app, state that they would have been most likely to shop with Footasylum (8%). JD Sports respondents are more likely to shop with Nike (19%), ASOS (18%), adidas (12%) or Sports Direct (9%) than with Footasylum.
JD Sports respondents who would divert to a physical store, are more likely to select JD Sports (34%) than any other party. Nike (16%) and Sports Direct (8%) are the next most frequently mentioned parties for Footasylum respondents diverting to a physical store.
Footasylum respondents choosing to shop in a physical store are more likely to select JD Sports (37%) than any other party, followed by Footasylum (29%). Other third-party competitors include Nike (7%), Sports Direct (7%) and Flannels (5%).
Figure 17: Who would have bought from if [brand] stopped selling online – apparel

Page 31
The figure above shows the most frequently cited competitors for the two ensuing questions for the scenario that the Party had stopped selling online; Other competitors are cited by smaller proportions of respondents, including:
• Shopped online using another website/app: o JD Sports respondents – Next 17 (7%), Amazon 15 (6%), Foot Locker 8 (3%), The
North Face 6 (2%), M&M Direct 5 (2%), Flannels 5 (2%), Very 4 (2%), Scotts 2 (1%), Tessuti 2 (1%), Under Armour 2 (1%), Gymshark 2 (1%), Footpatrol 1 (0%), Pretty Little Thing 1 (0%), Size? 1 (0%), Puma 1 (0%), H&M 1 (0%).
o Footasylum respondents – Next 5 (3%), The North Face 4 (2%), Sports Direct 3 (2%), Tessuti 2 (1%), Zara 2 (1%), Scotts 1 (1%), Flannels 1 (1%), Under Armour 1 (1%), Puma 1 (1%).
• Shopped at a physical store or stores: o JD Sports respondents – River Island 5 (4%), The North Face 5 (4%), Foot Locker 4
(3%), H&M 4 (3%), Primark 4 (3%), Next 2 (2%), Tessuti 2 (2%), Flannels 2 (2%), Choice 1 (1%).
o Footasylum respondents – Zara 3 (4%), adidas 1 (1%), Foot Locker 1 (1%), Size? 1 (1%), END 1 (1%), Under Armour 1 (1%).
For a full list of the pre-coded competitors, please refer to the questionnaire appended at the end of this document.

Page 32
Figure 18 shows diversion to the Merger Party broken down into sub-groups according to age, gender and the main reason for visiting the website. There are no significant differences but that are some differences that are worthy of note.
Amongst Footasylum respondents opting to divert online, diversion to JD Sports online is lower amongst men (33%) than amongst female respondents (45%).
Amongst Footasylum respondents, diversion to JD Sports online is lower (29%) for those that ‘Intended to buy specific item/s ordered’ than for customers who ‘Intended to buy but not necessarily what ended up ordering’ (52%) or those who ‘Intended to browse but not necessarily buy the specific item/s ordered’ (50%).
Figure 18: What would have done if [brand] stopped selling online – apparel (key sub-segments)

Page 33
Subsequent diversion amongst own party diverters
In the scenario that the website/app had stopped selling online, respondents who stated that they would divert to their own Party’s physical store were given a further scenario where all the Party’s physical stores had also closed. Base sizes are lower here, and therefore results must be treated with caution.
Diversion to JD Sports accounts for approximately three fifths of all Footasylum respondents who divert online (footwear 57%, apparel 64%) or to a physical store (footwear 64%) in the scenario that Footasylum had stopped selling online and had closed all its physical stores. The proportion is slightly lower for Footasylum respondents buying apparel in physical stores (50%).
In contrast, at most one fifth of JD Sports respondents would choose to divert to Footasylum online (footwear 17%, apparel 15%), or a physical store (footwear 6%, apparel 20%) if JD Sports had stopped selling online and had closed down its physical stores.
Figure 19: What would have done if [brand] stopped selling online and closed all its stores

Page 34
Response to a hypothetical 5% price increase
Respondents were asked what they would have done if prices both online and in-store had increased by 5% and around half of respondents indicate that they would have still made the purchase if the Party had increased its prices (JD Sports: footwear 47%, apparel 49%; Footasylum: footwear 47%, apparel 52%).
Although over three in ten say they would not have placed their order if prices had increased (JD Sports: footwear 34%, apparel 33%; Footasylum: footwear 32%, apparel 29%), one fifth state that they didn’t know whether they would or would not have placed their order (JD Sports: footwear 19%, apparel 18%; Footasylum: footwear 22%, apparel 19%).
Figure 20: What would you have done if [brand] increased their prices by 5%

Page 35
Response to specific items not being available Respondents were asked if they would still purchase footwear and/or apparel, as applicable, if the exact items they had purchased were no longer stocked by the Party (either online or in-store).
Footasylum respondents who had bought apparel were more likely to have still placed an order for apparel in the event that the specific items they had bought were no longer available from Footasylum (43%) than those saying they wouldn’t (33%). The same is true for respondents who had bought footwear – they were less likely to say they would still buy footwear than not in that scenario (32% yes, 48% no).
JD Sports respondents who had bought footwear and apparel were fairly evenly split between whether they would have still placed an order or not, in the event that the specific items they had bought were no longer available from JD Sports (yes: 39% footwear, 38% apparel; no: 42% footwear, 43% apparel).
As for the hypothetical price increase, one fifth stated here that they didn’t know whether they would have still placed an order or not (JD Sports: footwear 19%, apparel 19%; Footasylum: footwear 20%, apparel 24%).
Figure 21: Whether would have still ordered if specific item no longer available from [brand]

Page 36
7 Appendix
Questionnaire
Questionnaire:
Client name: CMA
Project name: JD Sports / Footasylum – Online Survey
Job number: 7889
Methodology: Online
Version 5
Introduction
S00.
Sample information to pull through for text replacements
JD Sports
Column Ref
Footasylum
Column Ref 1_1 Brand 1 = JD Sports 2 = Footasylum
1_2 Online brand 1 = jdsports.co.uk 2 = footasylum.com
2 Order placed date
3 Complete order value (including
delivery charges)
4 Type of item purchased - full
4_1 footwear
4_2 clothing
4_3 footwear and clothing
4_4 footwear and other items
4_5 clothing and other items
4_6 footwear, clothing and other items
Type of item purchased – partial
5_1 footwear
5_2 clothing
5_3 footwear and clothing
6 No. of items purchased Single
Column OR Column
Multiple
Column AND
Column OR Column
6_1 Item(s) item items
6_2 Price(s) price prices
6_3 Website/app , or websites/apps
6_4 Store , or stores

Page 37
6_5 This item/these items this item these items
6_6 Was/were was were
7 Sample Group
7_1 Email reminder, £5 incentive
7_2 Email reminder, SMS reminder
7_3 Email reminder, SMS reminder, £5
incentive
7_4 Email reminder
Screening Questions
S01. Base: All respondents
According to our records, you placed an order costing [Complete order value] (including any delivery charges) for [Type of item – full] with the [Brand] website or app on [Order placed date] soon after non-essential shops (this includes footwear and clothing) had re-opened. Do
you remember making this order?
Code Answer list Scripting notes Routing 1 Yes CONTINUE
2 No CLOSE
85 Don’t know/Not sure CLOSE
Continue: That’s great, now onto the main survey…
Thank and Close Text Close: Unfortunately, you don’t fit the required criteria for this survey.
S02.
Base: All Respondents First of all, we have a couple of quick questions about you. Which of these age bands do you fall into?
SINGLE RESPONSE
Code Answer list Scripting notes Routing 1 Younger than 16 CLOSE
2 16-24
3 25-34
4 35-55
5 Older than 55
6 Prefer not to say CLOSE
S03.
Base: All respondents Are you…?
SINGLE RESPONSE
Code Answer list Scripting notes Routing 1 Male
2 Female
80 Other (please specify) OPEN
87 Prefer not to say

Page 38
Behaviour Questions
Q01. Base: All respondents
Which, if any of these did you do before you placed your online order with [Brand]? Please tick all that apply. MULTI RESPONSE, RANDOMISE
Code Answer list Scripting notes Routing 1 Looked for the [6_1] in a physical
store or stores
2 Compared the [6_2] of the [6_1] with
those in a physical store or stores
3 Tried on [6_1] in a physical store or
stores
4 Looked for the [6_1] on one or more
other retailer’s website/app
5 Compared the [6_2] of the [6_1] with
those on one or more other retailer’s
website/app
87 None of these EXCLUSIVE
85 Don’t know/Not sure EXCLUSIVE
Q1a
Base: All respondents not-selecting physical stores (Q1/1,2,3) Were you aware that non-essential shops (this includes footwear and clothing) had re-opened
when you made your order?
Code Answer list Scripting notes Routing 1 Yes
2 No
85 Don’t know/Not sure
Q02. Base: All respondents
And when you visited the [Brand] website/app at the time you placed the order, what was your main purpose? Please tick one only.
SINGLE RESPONSE, ORDERED
Code Answer list Scripting notes Routing 1 I intended to browse, but not
necessarily buy anything
2 I intended to buy [Type of item(s)
purchased - partial], but not
necessarily the [6_1] I ended up
ordering
3 I intended to buy the specific [6_1] I
ordered
80 Something else (please write in) OPEN
85 Don’t know/Not sure

Page 39
Choice Questions
Q03. Base: All Respondents
Thinking again about the online order you placed on [Order placed date] from [Brand], why did you choose to use [Brand] rather than another online retailer or app? Please tick all that apply.
MULTIPLE RESPONSE. RANDOMISE.
Code Answer list Scripting notes Routing 1 Good prices/special offers
2 Can use voucher/loyalty card
3 I can get a student discount
4 ‘Pay later’ options
5 Reasonable delivery charges
6 Reputation of [Brand] brand
7 Online search/advert/social media led
me here
8 Website/app easy to use
9 Good/wide range of products/brands
10 Had what I specifically wanted
11 Fast/reliable/convenient delivery
80 Other (please write in) ANCHOR, OPEN
85 Don’t know/Not sure ANCHOR, EXCLUSIVE
Q04. Base: All Respondents giving more than one reason at Q03
What was the one main reason you chose to use [Online Brand] rather than another online retailer or app? Please tick one only. SINGLE RESPONSE. ONLY INCLUDE THOSE SELECTED AT Q03.
Code Answer list Scripting notes Routing 1 Good prices/special offers
2 Can use voucher/loyalty card
3 I can get a student discount
4 ‘Pay later’ options
5 Reasonable delivery charges
6 Reputation of [Brand] brand
7 Online search/advert/social media led
me here
8 Website easy to use
9 Good/wide range of products/brands
10 Had what I specifically wanted
11 Fast/reliable/convenient delivery
80 Other (please write in) ANCHOR, OPEN
85 Don’t know/Not sure ANCHOR
Q05.
Base: All Respondents Now we would like you to think back to before the covid-19 pandemic and think about your
spending on [Type of item purchased – partial] at that time. Which of the following best describes your spending on [Type of item purchased - partial]? Please tick one only.
SINGLE RESPONSE. ALTERNATE START 1-5 AND 5-1

Page 40
Code Answer list Scripting notes Routing 1 I bought all/nearly all my [Type of
item purchased - partial] online
2 I bought most of my [Type of item
purchased - partial] online
3 I bought about the same online and in
physical stores
4 I bought most of my [Type of item
purchased - partial] in physical stores
5 I bought all/nearly all my [Type of
item purchased - partial] in physical
stores
85 Don’t know/Not sure ANCHOR
Q05A. Base: All Respondents
During the covid-19 pandemic, how much have you spent on [Type of item purchased - partial]? SINGLE RESPONSE. RANDOMISE CODES
Code Answer list Scripting notes Routing 1 More than I used to before the
pandemic
2 Less than I used to before the
pandemic
3 About the same as I used to before
the pandemic
85 Don’t know/Not sure ANCHOR
Q05b. Base: All Respondents
Once the covid-19 pandemic is [PILOT TEXT INSERTION FOR HALF SAMPLE: fully] over, what do you think your preference for shopping for [Type of item purchased - partial] will be?
Please tick one only. SINGLE RESPONSE. ALTERNATE START 1-5 AND 5-1
Code Answer list Scripting notes Routing 1 I think that I will buy all/nearly all my
[Type of item purchased - partial]
online
2 I think that I will buy most of my
[Type of item purchased - partial]
online
3 I think that I will buy about the same
online and in physical stores
4 I think that I will buy most of my
[Type of item purchased - partial] in
physical stores
5 I think that I will buy all/nearly all my
[Type of item purchased - partial] in
physical stores
85 Don’t know/Not sure ANCHOR

Page 41
Diversion
Q06. Base: All respondents
Imagine that before starting your shop on [Order placed date] you knew that [Brand] had stopped selling online and via app. Thinking of all the options open to you, what would you be most likely to have done instead? Please tick one only.
SINGLE RESPONSE. RANDOMISE.
Code Answer list Scripting notes Routing 1 Shopped online using another
website/app
2 Shopped at a physical store
3 Not have bought [6_5] at all
anywhere
80 Other (please write in) ANCHOR, OPEN
85 Don’t know ANCHOR
Q07. Base: All respondents who would buy online (Q06/1) Which other retailer’s online website or app would you have been most likely to shop with
instead? Please tick one only. SINGLE RESPONSE
COLUMNS X 2 IN ALPHABETICAL ORDER (DOWN THEN ACROSS) DP NOTE: JD Sports excluded from JD Sports sample and Footasylum from Footasylum sample for Q07.
Code Answer List Footwear
S00/5_1
Clothing
S00/5_2
Footwear and Clothing
S00/5_3 JD
Sports
Foot
asylum
JD
Sports
Foot
asylum
JD
Sports
Foot
asylum
2 adidas ✓ ✓ ✓ ✓ ✓ ✓
3 Amazon ✓ ✓ ✓ X ✓ ✓
4 ASOS ✓ ✓ ✓ ✓ ✓ ✓
5 Boohoo / Boohoo Man X X X ✓ X ✓
9 Foot Locker [/ Foot Locker
Kids - JDS only] ✓ ✓ ✓ ✓ ✓ ✓
10 Footasylum ✓ X ✓ X ✓ X
11 Footpatrol ✓ ✓ ✓ ✓ ✓ ✓
12 Hip Store ✓ ✓ ✓ ✓ ✓ ✓
14 JD Sports X ✓ X ✓ X ✓
15 M&M Direct ✓ X ✓ X ✓ X
16 Next ✓ ✓ ✓ ✓ ✓ ✓
17 Nike ✓ ✓ ✓ ✓ ✓ ✓
18 Office ✓ ✓ X X X X
19 Offspring X ✓ X X X X
20 Pretty Little Thing X X ✓ X X X
21 Schuh [/ Schuh Kids - JDS
only] ✓ ✓ X X X X
22 Scotts ✓ ✓ ✓ ✓ ✓ ✓
24 Size? ✓ ✓ ✓ ✓ ✓ ✓
26 Sports Direct ✓ ✓ ✓ ✓ ✓ X
27 Tessuti ✓ ✓ ✓ ✓ ✓ ✓
28 Topman [/ Topshop - JDS
only] X X ✓ ✓ ✓ ✓

Page 42
29 USC X X X ✓ X ✓
30 Very ✓ ✓ ✓ ✓ ✓ ✓
32 Zalando ✓ ✓ ✓ ✓ ✓ ✓
33 Zara X X X ✓ X X
34 END ✓ ✓ ✓ ✓ ✓ ✓
35 Flannels ✓ ✓ ✓ ✓ ✓ ✓
36 Under Armour ✓ ✓ ✓ ✓ ✓ ✓
37 The North Face X X ✓ ✓ ✓ ✓
38 Puma ✓ ✓ ✓ ✓ ✓ ✓
39 Clarks ✓ ✓ X X X X
40 H&M X X X X ✓ ✓
41 Gymshark X X ✓ ✓ ✓ ✓
42 Deichmann ✓ ✓ X X X X
80 Other (please write in) ✓ ✓ ✓ ✓ ✓ ✓
85 Don’t know ✓ ✓ ✓ ✓ ✓ ✓
Q08.
Base: All respondents who would go to a physical store (Q06/2) Which retailer’s physical store would you have been most likely to shop in instead? Please tick
one only. SINGLE RESPONSE COLUMNS X 2 IN ALPHABETICAL ORDER (DOWN THEN ACROSS)
DP NOTE: JD Sports and Footasylum included for both brands at Q08.
Code Answer List Footwear
S00/5_1
Clothing
S00/5_2
Footwear and
Clothing S00/5_3
JD
Sports
Foot
asylum
JD
Sports
Foot
asylum
JD
Sports
Foot
asylum
1 adidas ✓ ✓ ✓ ✓ ✓ ✓
2 Choice ✓ ✓ ✓ ✓ ✓ ✓
3 Clarks ✓ X X X X X
6 Foot Locker [/ Foot Locker
Kids – JDS only] ✓ ✓ ✓ ✓ ✓ ✓
7 Footasylum ✓ ✓ ✓ ✓ ✓ ✓
8 Footpatrol ✓ ✓ ✓ ✓ ✓ ✓
9 H&M X X ✓ ✓ ✓ X
10 Hip Store ✓ ✓ ✓ ✓ ✓ ✓
11 House of Fraser X X X X ✓ X
13 JD Sports ✓ ✓ ✓ ✓ ✓ ✓
14 John Lewis X X X ✓ X ✓
15 Next ✓ X ✓ ✓ ✓ ✓
16 Nike ✓ ✓ ✓ ✓ ✓ ✓
17 Office ✓ ✓ X X X X
18 Offspring X ✓ X X X X
19 Primark X X ✓ X ✓ X
20 River Island X X ✓ ✓ ✓ ✓
21 Schuh [/ Schuh Kids – JDS
only] ✓ ✓ X X X X
22 Scotts ✓ ✓ ✓ ✓ ✓ ✓
23 Selfridges X ✓ X X X ✓
25 Size? ✓ ✓ ✓ ✓ ✓ ✓
26 Skechers ✓ X X X X X
27 Sole Trader ✓ ✓ X X X X
28 Sports Direct ✓ ✓ ✓ ✓ ✓ ✓
29 Tessuti ✓ ✓ ✓ ✓ ✓ ✓

Page 43
30 Topman [/ Topshop - JDS
only] X X ✓ ✓ ✓ ✓
31 Urban Outfitters X ✓ X ✓ X ✓
32 USC ✓ ✓ ✓ ✓ ✓ ✓
34 Zara X X ✓ ✓ X ✓
35 END ✓ ✓ ✓ ✓ ✓ ✓
36 Flannels ✓ ✓ ✓ ✓ ✓ ✓
37 Under Armour ✓ ✓ ✓ ✓ ✓ ✓
38 The North Face X X ✓ ✓ ✓ ✓
39 Puma ✓ ✓ ✓ X ✓ X
40 Deichmann ✓ ✓ X X X X
80 Other (please write in) ✓ ✓ ✓ ✓ ✓ ✓
85 Don’t know ✓ ✓ ✓ ✓ ✓ ✓
Q09. Base: All JD Sports customers who selected JD Sports or all Footasylum customers who selected Footasylum at Q08
Now imagine that [Brand] had stopped selling online and via app and had closed all its physical stores. What would you be most likely to have done instead? Please tick one only.
SINGLE RESPONSE
Code Answer list Scripting notes Routing 1 Shopped online using another
website/app
2 Shopped at a physical store
3 Not have bought [6_5] at all
anywhere
80 Other (please write in) OPEN
85 Don’t know
Q10.
Base: All respondents who would buy online Q09/1 Which other retailer’s online website or app would you have been most likely to shop with
instead? Please tick one only. SINGLE RESPONSE COLUMNS X 2 IN ALPHABETICAL ORDER (DOWN THEN ACROSS)
DP NOTE: JD Sports excluded from JD Sports sample and Footasylum from Footasylum sample for Q10.
Code Answer List Footwear
S00/5_1
Clothing
S00/5_2
Footwear and Clothing
S00/5_3 JD
Sports
Foot
asylum
JD
Sports
Foot
asylum
JD
Sports
Foot
asylum
2 adidas ✓ ✓ ✓ ✓ ✓ ✓
3 Amazon ✓ ✓ ✓ X ✓ ✓
4 ASOS ✓ ✓ ✓ ✓ ✓ ✓
5 Boohoo / Boohoo Man X X X ✓ X ✓
9 Foot Locker [/ Foot Locker
Kids - JDS only] ✓ ✓ ✓ ✓ ✓ ✓
10 Footasylum ✓ X ✓ X ✓ X
11 Footpatrol ✓ ✓ ✓ ✓ ✓ ✓
12 Hip Store ✓ ✓ ✓ ✓ ✓ ✓
13 Infinities X X X X X X
14 JD Sports X ✓ X ✓ X ✓
15 M&M Direct ✓ X ✓ X ✓ X

Page 44
16 Next ✓ ✓ ✓ ✓ ✓ ✓
17 Nike ✓ ✓ ✓ ✓ ✓ ✓
18 Office ✓ ✓ X X X X
19 Offspring X ✓ X X X X
20 Pretty Little Thing X X ✓ X X X
21 Schuh [/ Schuh Kids - JDS
only] ✓ ✓ X X X X
22 Scotts ✓ ✓ ✓ ✓ ✓ ✓
24 Size? ✓ ✓ ✓ ✓ ✓ ✓
25 Shop Direct X X X X X X
26 Sports Direct ✓ ✓ ✓ ✓ ✓ X
27 Tessuti ✓ ✓ ✓ ✓ ✓ ✓
28 Topman [/ Topshop - JDS
only] X X ✓ ✓ ✓ ✓
29 USC X X X ✓ X ✓
30 Very ✓ ✓ ✓ ✓ ✓ ✓
32 Zalando ✓ ✓ ✓ ✓ ✓ ✓
33 Zara X X X ✓ X X
34 END ✓ ✓ ✓ ✓ ✓ ✓
35 Flannels ✓ ✓ ✓ ✓ ✓ ✓
36 Under Armour ✓ ✓ ✓ ✓ ✓ ✓
37 The North Face X X ✓ ✓ ✓ ✓
38 Puma ✓ ✓ ✓ ✓ ✓ ✓
39 Clarks ✓ ✓ X X X X
40 H&M X X X X ✓ ✓
41 Gymshark X X ✓ ✓ ✓ ✓
42 Deichmann ✓ ✓ X X X X
80 Other (please write in) ✓ ✓ ✓ ✓ ✓ ✓
85 Don’t know ✓ ✓ ✓ ✓ ✓ ✓
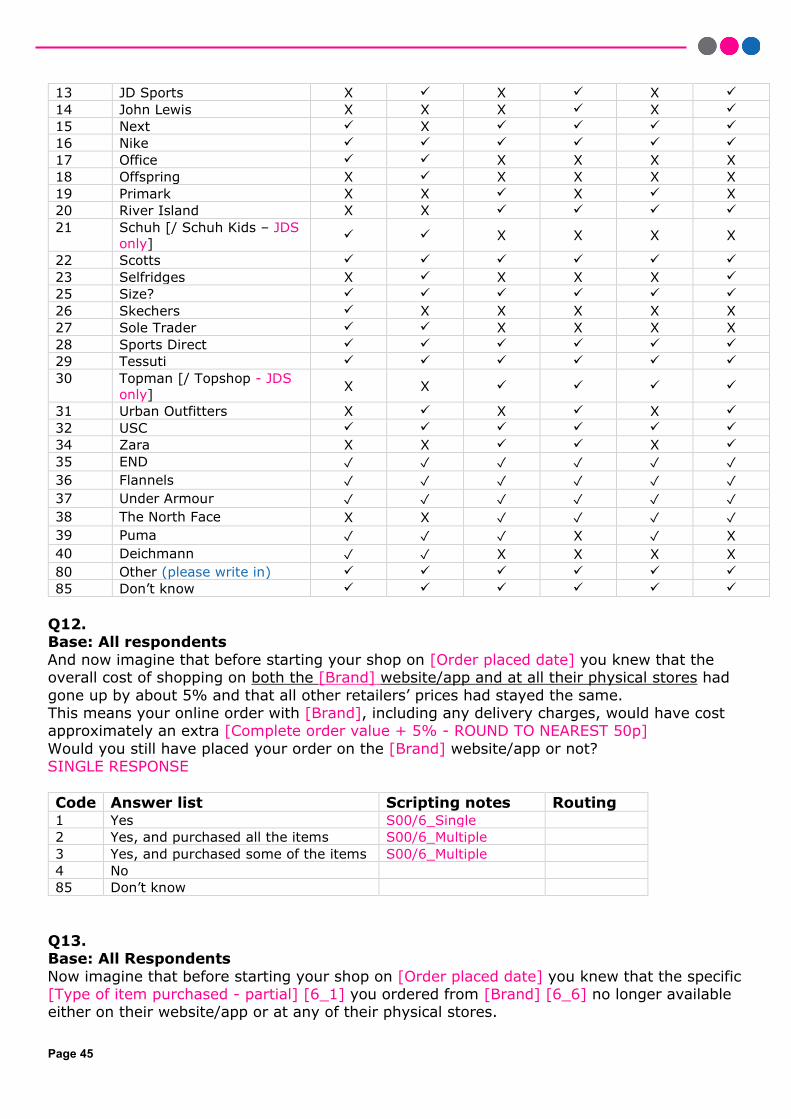
Q11.
Base: All respondents who would go to a physical store (Q09/2) Which retailer’s physical store would you have been most likely to shop at instead? Please tick one only.
SINGLE RESPONSE COLUMNS X 2 IN ALPHABETICAL ORDER (DOWN THEN ACROSS)
DP NOTE: JD Sports excluded from JD Sports sample and Footasylum from Footasylum sample for Q11.
Code Answer List Footwear
S00/5_1
Clothing
S00/5_2
Footwear and Clothing
S00/5_3 JD
Sports
Foot
asylum
JD
Sports
Foot
asylum
JD
Sports
Foot
asylum
1 adidas ✓ ✓ ✓ ✓ ✓ ✓
2 Choice ✓ ✓ ✓ ✓ ✓ ✓
3 Clarks ✓ X X X X X
6 Foot Locker [/ Foot Locker
Kids – JDS only] ✓ ✓ ✓ ✓ ✓ ✓
7 Footasylum ✓ X ✓ X ✓ X
8 Footpatrol ✓ ✓ ✓ ✓ ✓ ✓
9 H&M X X ✓ ✓ ✓ X
10 Hip Store ✓ ✓ ✓ ✓ ✓ ✓
11 House of Fraser X X X X ✓ X
12 Infinities X X X X X X
Page 45
13 JD Sports X ✓ X ✓ X ✓
14 John Lewis X X X ✓ X ✓
15 Next ✓ X ✓ ✓ ✓ ✓
16 Nike ✓ ✓ ✓ ✓ ✓ ✓
17 Office ✓ ✓ X X X X
18 Offspring X ✓ X X X X
19 Primark X X ✓ X ✓ X
20 River Island X X ✓ ✓ ✓ ✓
21 Schuh [/ Schuh Kids – JDS
only] ✓ ✓ X X X X
22 Scotts ✓ ✓ ✓ ✓ ✓ ✓
23 Selfridges X ✓ X X X ✓
25 Size? ✓ ✓ ✓ ✓ ✓ ✓
26 Skechers ✓ X X X X X
27 Sole Trader ✓ ✓ X X X X
28 Sports Direct ✓ ✓ ✓ ✓ ✓ ✓
29 Tessuti ✓ ✓ ✓ ✓ ✓ ✓
30 Topman [/ Topshop - JDS
only] X X ✓ ✓ ✓ ✓
31 Urban Outfitters X ✓ X ✓ X ✓
32 USC ✓ ✓ ✓ ✓ ✓ ✓
34 Zara X X ✓ ✓ X ✓
35 END ✓ ✓ ✓ ✓ ✓ ✓
36 Flannels ✓ ✓ ✓ ✓ ✓ ✓
37 Under Armour ✓ ✓ ✓ ✓ ✓ ✓
38 The North Face X X ✓ ✓ ✓ ✓
39 Puma ✓ ✓ ✓ X ✓ X
40 Deichmann ✓ ✓ X X X X
80 Other (please write in) ✓ ✓ ✓ ✓ ✓ ✓
85 Don’t know ✓ ✓ ✓ ✓ ✓ ✓
Q12. Base: All respondents
And now imagine that before starting your shop on [Order placed date] you knew that the overall cost of shopping on both the [Brand] website/app and at all their physical stores had
gone up by about 5% and that all other retailers’ prices had stayed the same. This means your online order with [Brand], including any delivery charges, would have cost approximately an extra [Complete order value + 5% - ROUND TO NEAREST 50p]
Would you still have placed your order on the [Brand] website/app or not? SINGLE RESPONSE
Code Answer list Scripting notes Routing 1 Yes S00/6_Single
2 Yes, and purchased all the items S00/6_Multiple
3 Yes, and purchased some of the items S00/6_Multiple
4 No
85 Don’t know
Q13. Base: All Respondents
Now imagine that before starting your shop on [Order placed date] you knew that the specific [Type of item purchased - partial] [6_1] you ordered from [Brand] [6_6] no longer available either on their website/app or at any of their physical stores.

Page 46
Would you still have placed an order for [Type of item purchased – partial] on the [Brand] website/app or not?
SINGLE RESPONSE
Code Answer list Scripting notes Routing 1 Yes
2 No
85 Don’t know
INFO.1
Base: All respondents Please be reassured that the last few questions were all hypothetical. [Brand] do not have
any plans to raise their prices by 5%, reduce their range of products, stop selling on their website/app or close their physical stores.
That is the end of the survey. Thank you very much for your time.

Page 47
Survey invitation
Hi [NAME] This email has been sent to you by DJS Research, an independent market research company, on behalf of the Competition and Markets Authority (CMA), a UK government body. The CMA has asked DJS Research to contact a sample of around 20,000 recent users of the [ONLINE BRAND] site and ask them to answer a short survey on its behalf. We are contacting you because we understand that you recently purchased [TYPE OF ITEM – PARTIAL] from the [BRAND] website or app. It should take no more than about five minutes to complete the survey. [IF INCENTIVE SAMPLE GROUP (7_1 OR 7_3): If you qualify for the survey, as a thank you for taking part, you will receive a £5 GiftPay voucher (an electronic voucher redeemable in a range of high street and online stores).] The CMA will be very grateful if you are able to answer its questions (but taking part is completely optional). You can use a PC, laptop, tablet or smartphone to answer the survey, which will be available until 23rd May 2021.
Click here to go to the survey.
If you have any queries about the survey, please contact Lyn Allen at DJS Research ([email protected], or on 01663 767857) or the CMA (its Public Enquiries line on 020 3738 6000, or at [email protected]). Thank you
The CMA is conducting a merger inquiry in relation to [BRAND]. As part of this, the CMA has engaged DJS Research to contact recent customers of [BRAND] to complete a survey to assist with the inquiry. [BRAND] has provided the CMA with the personal information of customers who placed an online order between Sunday 18 April and Saturday 1 May 2021. As a customer [BRAND] during this period, we would be grateful if could assist by completing the survey linked below. Taking part in the survey is completely optional. You can read more about how we use and process your personal information below: Thank you very much for your help. Your Personal Information The CMA has used its legal powers under section 109 of the Enterprise Act to compel [BRAND] to share certain items of personal data for around [IF BRAND = JD SPORTS: 500,000; IF BRAND = FOOTASYLUM: 60,000] of its customers, including you. The items of personal data are: your name, email address and telephone number(s); order reference number, the dates and times the order
Page 48
was placed and dispatched, along with the delivery postcode; whether the order was placed on an app or website, the value of your order, payment method, number and type of items bought and the delivery cost. The data was requested for customers who had placed an order on [ONLINE BRAND] between Sunday 18 April and Saturday 1 May 2021. This is the only personal data that has been shared with the CMA. PRIVACY NOTICE This notice sets out how the CMA (as a controller) will use your personal information, and your rights in relation to any personal data we process as part of the inquiry into [BRAND]. More about us The Competition and Markets Authority (CMA), the UK's competition regulator, is responsible for ensuring that consumers, like you, get a good deal when buying goods and services and that businesses operate within the law. As part of this work, it often asks existing customers of specific companies to participate in important consumer research. You can find out more about the CMA's work here or, if you prefer, by going to GOV.UK and typing 'CMA' into the search bar. Your personal information We’ve been provided with your personal information by [BRAND] under a legal obligation (specifically section 109 of the Enterprise Act 2002) as you were a customer between Sunday 18 April and Saturday 1 May 2021. This includes:
• Your name • Email address and telephone number • Order details including order reference number, dates and times of the order and dispatch, delivery details, medium
order was placed on, value of order, payment method and items purchased.
If you access the survey link, we will automatically process your IP address. If you do take part, your answers will be combined with answers from everyone else who completes the survey to provide statistical results. It will not be possible to identify you in any results that are published. Why we are processing your personal information and our legal basis? We process the personal information to assist with our inquiry and investigation of the merger under our statutory powers. Our legal basis for processing your personal information is because:
• it is necessary for the performance of a task carried out in the public interest or in the exercise of official authority vested in the data controller.
Although the survey is voluntary, it is based on our statutory powers and therefore we do not require consent to process your personal information under data protection laws. Who do we share your personal information with? Only a small number of CMA staff have access to the personal information. We share your personal information with DJS Research as a processor to assist with this survey. CMA may share data with advisers of the companies that the research relates to. This dataset will not include your name or contact details. Retention of your personal information While the merger investigation is ongoing, the CMA and DJS Research will continue to process your personal information securely at all times. Your personal information will be securely deleted on conclusion of the case. Other information including your rights You can read more about how the CMA, as a controller, processes personal data (including the contact details for the CMA's Data Protection Officer, information about your rights in relation to your personal data, and details of how to exercise those rights, including how to complain to the Information Commissioner's Officer) in the CMA's Privacy Notice. You can find a link to this document (titled 'Personal information charter') here (or, if you prefer, you can go to the CMA's homepage via GOV.UK and follow the links to the 'About us' page). How to contact us The data controller for your personal information is the CMA. You can contact us at [email protected] or our DPO at [email protected]. Information on DJS Research DJS Research abides by the Market Research Society Code of Conduct, which means that all of your personal data will be kept secure and, should you participate in the research, they will only share your survey responses with the CMA. You can find further details on DJS Research's privacy policy at https://www.djsresearch.co.uk/about/terms. If you have any queries about the survey, or anything else you’ve read here, you can contact Lyn Allen at DJS Research ([email protected], or on 01663 767857). If you would like to confirm DJS Research’s credentials, please call the Market Research Society’s verification service for free on 0800 975 9596. Alternatively, you can get in touch with the CMA (its Public Enquiries line on 020 3738 6000, or at [email protected]).