
Empirical Evidence from Spanish Municipalities
22
The Effectiveness of Institutional Borrowing Restrictions: Empirical Evidence from Spanish Municipalities Author(s): Fermín Cabasés, Pedro Pascual and Jaime Vallés Source: Public Choice, Vol. 131, No. 3/4 (Jun., 2007), pp. 293-313 Published by: Springer Stable URL: http://www.jstor.org/stable/27698103 . Accessed: 25/02/2014 14:22 Your use of the JSTOR archive indicates your acceptance of the Terms & Conditions of Use, available at . http://www.jstor.org/page/info/about/policies/terms.jsp . JSTOR is a not-for-profit service that helps scholars, researchers, and students discover, use, and build upon a wide range of content in a trusted digital archive. We use information technology and tools to increase productivity and facilitate new forms of scholarship. For more information about JSTOR, please contact [email protected]. . Springer is collaborating with JSTOR to digitize, preserve and extend access to Public Choice. http://www.jstor.org This content downloaded from 198.91.32.137 on Tue, 25 Feb 2014 14:22:29 PM All use subject to JSTOR Terms and Conditions
-
Upload
khangminh22 -
Category
Documents
-
view
0 -
download
0
Transcript of Empirical Evidence from Spanish Municipalities

The Effectiveness of Institutional Borrowing Restrictions: Empirical Evidence from SpanishMunicipalitiesAuthor(s): Fermín Cabasés, Pedro Pascual and Jaime VallésSource: Public Choice, Vol. 131, No. 3/4 (Jun., 2007), pp. 293-313Published by: SpringerStable URL: http://www.jstor.org/stable/27698103 .
Accessed: 25/02/2014 14:22
Your use of the JSTOR archive indicates your acceptance of the Terms & Conditions of Use, available at .http://www.jstor.org/page/info/about/policies/terms.jsp
.JSTOR is a not-for-profit service that helps scholars, researchers, and students discover, use, and build upon a wide range ofcontent in a trusted digital archive. We use information technology and tools to increase productivity and facilitate new formsof scholarship. For more information about JSTOR, please contact [email protected].
.
Springer is collaborating with JSTOR to digitize, preserve and extend access to Public Choice.
http://www.jstor.org
This content downloaded from 198.91.32.137 on Tue, 25 Feb 2014 14:22:29 PMAll use subject to JSTOR Terms and Conditions

Public Choice (2007) 131.293-313
DOI 10 1007/sll 127-006-9116-y
ORIGINAL ARTICLE
The effectiveness of institutional borrowing restrictions:
Empirical evidence from Spanish municipalities
Ferm n Cabases . Pedro Pascual . Jaime Valles
Received: 8 June 2006 / Accepted: 19 September 2006 / Published online: 15 December 2006
? Springer Science + Business Media B.V. 2006
Abstract The need for restrictions on borrowing by subnational governments is a generally
accepted notion that is justified both by public choice theory and by the fact that such restric
tions are in force in the majority of decentralized countries. Furthermore, recent breaches of
the Stability and Growth Pact of the European Union have led to the introduction of legislative tools aimed at balancing the budget at all levels of government have come to the forefront
of interest in European public finance research. This paper is concerned with the financial
situation and debt level of Spanish municipalities from 1988 to 2000. We have two main
objectives: the first is to assess the value of mandatory limitations on municipal borrowing
and past trends in the borrowing policies adopted by Spanish local authorities. The second is to develop an econometric model using panel data stratified by population size to mea
sure indebtedness in Spanish municipalities. These measures enable us to formulate a series
of hypotheses to explain municipal borrowing practices, which are then tested empirically. The evidence thus obtained appears to support the effectiveness of institutional borrowing restrictions to introduce some financial discipline in the borrowing policies adopted by local
governments in Spain.
Keywords Municipal indebtedness . Institutional restrictions . Net savings . Debt service
JEL classification: H7
1 Introduction
Subnational borrowing is a financial mechanism that enables local governments to pass un
sustainable short term tax burdens on to future generations. Within the context of Public
F. Cabases P. Pascual (ED
Departamento de Econom a, Universidad P blica de Navarra, Campus Arrosadia s/n. 31006 Pamplona,
Spain e-mail: ppascual@unavarraes
J Valles
Departamento de Econom a P blica, Universidad de Zaragoza, 50005, Zaragoza, Spain
ta Springer
This content downloaded from 198.91.32.137 on Tue, 25 Feb 2014 14:22:29 PMAll use subject to JSTOR Terms and Conditions

294 Public Choice (2007) 131 293-313
Choice, the theory of fiscal illusion -debt illusion-, some authors argue that local govern
ment borrowing and spending may be more than optimal if the decisions of politicians and
bureaucrats are aimed exclusively at political gain (see for example Abrams & Dougan,
1986, Misiolek & Elder, 1988, Oates, 1988) In other words, if their intention is to extend
their sphere of influence as far as possible and maximize the number of votes captured If
this is their aim, they increase the provision of goods and services without raising the taxes
needed to finance them, leaving the burden to future governments As a consequence, voters
systematically overestimate the benefits of deficit-financed government expenditures today
while underestimating the future tax liabilities due to public debt
The relative political weakness of subnational governments, in which party fragmentation
and coalitions are more prevalent, may also lead to overborrowing The so-called Weak
Government Hypothesis, put forward in the seminal work by Roubini and Sachs (1989), has
been examined in numerous studies, such as Ashworth, Geys, and Heyndels (2005) in which
it is empirically tested for lower level governments
The literature on fiscal federalism also presents various arguments in favour of the en
forcement of subnational government borrowing restrictions intergenerational equity, the
preservation of long-term financial equilibrium and the coordination of fiscal policy by central governments As a result, decentralization may be associated with disarray in lo
cal government finances, growing indebtedness, and costlier borrowing at the central and
subnational levels (see Poterba & Reuben, 1999)
Changes are taking place in the institutional framework for local government management in Spain as a result of The Stability and Growth Pact (SGP) in the European Monetary Union
(EMU) The Pact requires member states, Spain among them, to aim for a "close to balance
or in surplus" budget so that the introduction of automatic stabilisers will not jeopardise
the country's ability to meet the requirements of the Maastricht Treaty The SGP, like the
Maastricht agreement, is a commitment by the member states of the EMU to (a) maintain a
ratio of government deficit to GDP below the reference value of 3% in the short term and the
public spending budget close to balance or surplus in the medium to long term, (b) not exceed
the benchmark value of 60% m the ratio of government debt to GDP In addition, the SGP has in place a monitoring and sanctioning mechanism to deal with cases of non-compliance The
preventive aspect of the SGP was incorporated by the requirement of the Eurozone countries
to present a budget stability plan (see, among others, Dafflon & Rossi (1999) and Strauch
and von Hagen (2001)) As a consequence, concern has shifted from issues relating to intergenerational equity
and the financial health of public administrations towards guaranteeing the fulfilment of the
macroeconomic goals set at national level In a decentralised country such as Spain, the
budgeting efforts of the central government would be of little avail if they were not backed
by regional administrations Therefore, the framework for budgetary stability in Spain has
materialised into the Law for Budgetary Stability (Law, 18/2001, General de Estabilidad
Presupuestaria, adopted December 12, 2001) which makes it incumbent upon all layers of
government (central, regional and municipal) to draw up and return zero deficits This law
imposes stricter restrictions than those Spain is required to observe under the SGP
The innovations brought in by this law with respect to municipal borrowing suggest that,
though strict, it is well designed to involve all layers of government, and obeys the criteria
proposed, among others, by Bunch (1991), Poterba (1995), Dafflon (1996), Poterba (1997), and Rossi and Dafflon (2002), for evaluating balanced budget rules and debt control
As well as the introduction of the SGP, reform in municipal funding and the process of
redistribution of powers among the decentralised Spanish authorities create a new institutional
scenario for municipal authorities which calls for an assessment of the financial situation of
ta Springer
This content downloaded from 198.91.32.137 on Tue, 25 Feb 2014 14:22:29 PMAll use subject to JSTOR Terms and Conditions

Public Choice (2007) 131:293-313 295
Spain's municipal treasuries. Two issues motivate our research on municipal borrowing.
First, we propose a new approach to the subject, since no Spanish researchers have as yet
presented empirical models for analysing municipal debt. Second, the model we use varies
in specification from those described in the existing literature.
Are borrowing restrictions effective? What types of restrictions are most effective? Does
fiscal behaviour change significantly as a result of borrowing restrictions? Does it reduce the
fiscal illusion effect? The purpose of this paper is to examine the financial and borrowing situation of Spanish municipalities for the period 1988-2000. The analysis was stratified by population size, in order to identify any relevant across strata differences in borrowing habits
that might be related to the different revenue sources or different degrees of power resulting from the allocation of competencies to sub-national authorities.
The first of our two aims is to analyse municipal debt processes and the effectiveness of
mandatory borrowing constraints, while checking to see whether current legislation takes
into account the theoretical arguments in favour of borrowing under certain constraints. The
second is to apply an econometric approach to analyse municipal borrowing in Spain, by
constructing a model using panel data for different strata of population. We present our
hypotheses on municipal borrowing and then test them empirically, in this case limiting the
study period to years for which we have data on budget outcomes. We specifically aim to
discover whether the legal constraints on municipal borrowing introduced over the study
period were effective in imposing some degree of financial discipline on borrowing policies. The remainder of the paper is organized as follows. In Section 2 we begin by describing
the situation with regard to municipal borrowing in the Spanish public sector as a whole and
then based on an analysis stratified by population size. We then evaluate the design of the
legal constraints for their relevance to the various reasons involved in the use and control of
sub-national debt. In Section 3, we examine the effectiveness of the restrictions introduced
throughout the period of interest. In Section 4 we give the specification of the econometric
model, and explain how the data are standardised in order to obtain time series data for
comparison across the population strata. We begin this section with a brief presentation of
the various hypotheses to be tested in the empirical study; we then give the specifications of the model and discuss the results obtained in our empirical study. Section 5 contains our
main conclusions.
2 An evaluation of municipal borrowing restrictions within the general context
of public sector indebtedness in Spain
The trend in total accrued public authority debt expressed as a percentage of GDP can be seen in Table 1. These figures show that, after a marked increase in the first few years of the
economic crisis of the nineties, from 1994 onwards, municipal debt began a slight downward
trend relative to GDP. The effects of the decentralisation of Spanish government are to be
seen in the change in the sub-national borrowing pattern. Regional indebtedness grew from
1.1 % to 6.3% of GDP between 1988 and 2000, while municipal indebtedness showed a much smaller increase from 1.7% to 2.4% of GDP. In spite of this, between 1988 and 2000, at 15% of the total public debt, sub-national debt is relatively low, with local debt ranging between
4% and 5.5% of total public debt.1
1 Local administration in Spain is divided into Provinces, Municipalities, Comarcas (municipal groupings), Mancomunidades (municipal commonwealths) and Metropolitan Areas This paper refers only to Municipal
ities.
t Springer
This content downloaded from 198.91.32.137 on Tue, 25 Feb 2014 14:22:29 PMAll use subject to JSTOR Terms and Conditions

Table 1 Distribution of indebtedness relative to GDP (%)
1988 1989 1990 1991 1992 1993 1994 1995 1996 1997 1998 1999 2000 Average
Central government 37 3 36 8 38 9 37 3 39 2 49 7 513 53 3 57 1 55 7 54 0 52 9 513 47 3
Social security adm 06 05 05 06 05 05 05 06 06 05 03 03 03 05 Regional governments 11 14 19 27 36 45 53 59 64 67 66 64 63 45
Local councils 32 49 42 41 39 43 42 41 41 37 36 35 33 39 Municipalities 17 l8 21 24 26 28 29 27 27 27 27 26 24 25
Total 419 43 6 45 1 44 6 47 1 59 0 613 63 9 68 1 66 7 64 7 63 4 611 56 2
Sowce Calculations by the authors, from data supplied by the Banco de Espa a and the Studies Department of the Banco de Cr dito Local
This content downloaded from 198.91.32.137 on Tue, 25 Feb 2014 14:22:29 PMAll use subject to JSTOR Terms and Conditions

Public Choice (2007) 131:293-313 297
Moreover, as Table 2 shows, debt is concentrated in larger municipalities. Local councils
with populations of over 100,000, that is, less than 1% of the total, account for between 53
64% of all municipal debt, in contrast to those with populations of less than 20,000 which, while representing over 91 % of the national total, account for only 15-23% of total municipal debt.
Having completed a brief overview of Spanish municipal borrowing patterns, we must
now make a deeper, theoretical, analysis of the mechanisms available for conditioning the
borrowing policy of sub-national governments, in order to evaluate existing institutional
restrictions in Spanish municipal regulations.
2.1 The main strategies for controlling subnational debt
The main developments in the research on the impact of institutional restrictions on municipal
borrowing is to be found in the works of Heins (1963), Mitchell (1967), Pogue (1970), McEachern (1978), Farnham (1985), Epple and Spatt (1986), Bayoumi and Eichengreen (1994, 1995), Dafflon (1996), and Kiewiet and Szakaly (1996), Ter-Minassian and Craig (1997), Poterba and Reuben (1999), Kopits (2001), Kennedy and Robbins (2001), and Rossi and Dafflon (2002), to name only a few
The control mechanisms placed on municipal borrowing are assessed for their potential to
influence and modify sub-national borrowing policies. We will, therefore, begin by defining the control strategies involved in budgetary restrictions affecting any government:
CE + KE + FE - CR + KR + FR (1)
where the second initial stands for either expenditure (E) or revenue (R), and the first denotes
the type of expenditure or revenue, i.e., current (C), capital (K) or financial (F).
Expression (1) can be broken down as follows: CE = IE + PCE, where IE is interest
charges and PCE is primary current expenditure; FR = D + OFR, where D is debt revenue
and OFR other financial revenue; FE = AD + OFE, where AD is repayment charges and OFE is other financial expenditures.
When OFE are OFR are omitted as being barely relevant, and the terms are reorganized, we have:
D = (IE + AD) -
(CR -
PCE) + (KE -
KR). (2)
In short, this shows that debt revenue is a function of the debt load (IE + AD), primary current savings (CR
- PCE), and the co-funding effort (KE
- KR) for the investment
required of sub-national governments. Therefore, the main potential strategies for controlling sub-national borrowing policies can be summed up in three categories:
. Policies affecting the debt load. There are two strategies in this category. Those that limit
borrowing in order to reduce the debt load in subsequent years, and those that place direct
control on the current financial load. . Policies affecting current primary savings. These may exert their effect on the current
expenditure side, by restricting borrowing exclusively to finance capital expenditure,2 or
2 It should be noted that the strategies cited in Poterba (1995b), which is an analysis of how the capital budget isolated from current expenditure, and constitutional borrowing restraints, can alter the optimum level of
capital and current spending There are also reports in the literature of how this type of legislation is affected
ti Springer
This content downloaded from 198.91.32.137 on Tue, 25 Feb 2014 14:22:29 PMAll use subject to JSTOR Terms and Conditions

|[5> Table 2 Distribution of
municipal
indebtedness by population size (%)
1988 1989 1990 1991 1992 1993 1994 1995 1996 1997 1998 1999 2000 Average
Pop < 5,000 42 43 46 50 51 52 56 58 59 59 60 63 66 54
5,001 < Pop < 10,000 40 44 47 53 55 55 57 58 58 57 59 60 63 54
10,001< Pop < 20,000 72 78 82 90 92 91 92 94 96 96 100 102 106 92
20,001< Pop < 50,000 106 113 112 117 117 118 120 12 1 12 1 125 129 129 134 120
50,001 < Pop < 100,000 91 91 94 94 94 97 99 97 97 99 99 10 0 10 2 97
100,001 < Pop < 500,000 26 8 26 8 24 7 24 0 23 6 23 9 24 8 24 9 25 6 27 0 27 5 27 5 27 5 25 7 500,001 < Pop < 1,000,000 101 113 119 106 10 1 104 99 102 102 103 104 105 10 8 105
Pop > 1,000,001 28 1 25 0 25 2 25 1 25 4 24 5 23 0 22 0 212 19 1 17 3 16 6 14 8 22 1
Total 100 0 100 0 100 0 100 0 100 0 100 0 100 0 100 0 100 0 100 0 100 0 100 0 100 0 100 0
Source Calculations by the authors, from data
supplied
by the Studies Department of the Banco de Cr dito Local
This content downloaded from 198.91.32.137 on Tue, 25 Feb 2014 14:22:29 PMAll use subject to JSTOR Terms and Conditions

Public Choice (2007) 131:293-313 299
Table 3 Strategies and restrictions
Strategy Restrictions applied in Spain
Debt charge limit Authorisations for short-term borrowing Control of competencies Limit on net savings to current revenue
Scenarios of municipal budget consolidation > 200,000 pop.
Current savings Use of borrowing for investment expenditure Level of fiscal autonomy
Co-funding effort Current and capital grants from central government
Som ce Compiled by the authors
on current revenue, by increasing the level of fiscal effort and fiscal autonomy assigned to
sub-national governments. . Policies affecting the co-funding effort These include two options, one is to reduce the
percentage of municipal co-funding of investments, the other is to reduce capital expendi
ture by fixing a maximum repayment period and requiring municipal authorities to fix a
repayment-tax plan, in other words, by adding extra "costs" to investment plans.
2.2 Rules for controlling municipal borrowing in Spain: an assessment
Which of the above strategies have been selected by Spanish legislation to deal with municipal debt? Over the study period, there have been several modifications to the rules for controlling
borrowing, especially since 1996. This has greatly increased the difficulty of our analysis.3 All three of the theoretical regulatory strategies described above are used to control local
debt in Spain as shown in Table 3. The borrowing authorization requirements, the limit
on net savings, and budgetary consolidation scenarios, affecting jurisdictions with larger
populations, are all policies with an impact on the debt load. Earmarking borrowed income
to fund investment and the broad range of freedom for municipal tax policy are aimed
at controlling current savings. Finally, transferred income levels are set by the national
government, thereby impacting on the co-funding effort.
The main institutional limits on municipal borrowing over the study period (1988-2000) are summarised in Table 4. This table shows that external restrictions on borrowing concern
foreign currency operations, public debt offerings and the level of certain financial ratios.4
There is also a ceiling on short-term borrowing, and on emergency borrowing operations.
Nevertheless, there remain certain shortcomings in the design of municipal borrowing
restrictions in Spain:
by strategic behaviour. In many cases, moreover, capital spending may generate a carry over of current
expenditures to subsequent cycles, Goetz (1977) ^ A detailed explanation of municipal borrowing rules and the modifications they have undergone can be found
in Ezquiaga (2000) and Monasterio (2000). As these authors explain, in spite of repeated tightening and the
fact that many operations required central government approval, the borrowing restrictions set up by the Local
Public Finance Law (Law, 39/1988, Reguladora de las Haciendas Locales, LRHL, 28 December, 1988) have
failed over the years to curb the increase in funding with debt revenue.
4 Limit on legal net savings and the ratio of outstanding debt to current revenue.
ta Springer
This content downloaded from 198.91.32.137 on Tue, 25 Feb 2014 14:22:29 PMAll use subject to JSTOR Terms and Conditions

300 Public Choice (2007) 131:293-313
Table 4 Legal restrictions on the use of municipal debt
1 Prior requisites: Targeted, except under certain circumstances, to finance capital expenditure
Budget must be approved for the current cycle by municipal council vote
2. External approxal
General
regulations
Cases in which approval is
required
Negative legal net savings in
the budget balance
Outstanding debt (short and
long term) over settled current
revenue exceeds 110%
By nature of operation . Foreign currency operations . Public debt offerings
Conditions for approval
A plan must be in place to
restore current budget balance
within a maximum of 3 years
A plan must be in place to bring indebtedness within the 110%
Remarks
1 Temporary regime limits of-1 5% and -0 75% of
current revenues for 1999 and 2000 respectively
2 Approval will not be needed for an operation
aimed at reducing capital spending or risk
Law of Budgetary
Stubility Stability objective is met when the budget is balanced or in surplus
Municipalities with
pop. over 200,000
Operations will not require approval, provided that the municipality is in a scenario of convergence with the yearly debt
objectives and three year budgetary deficit objectives agreed with the financial authority, and supervised by the Ministry of
the Economy and Treasury
3. Maximum limits:
. Each year the State Budgetary Laws may place a borrowing restriction on local authorities when circumstances advise such a measure
for the sake of the general economic policy
. Shoit-teim honoring total short-term debt must not exceed the permitted maximum of 30% of current revenue for the previous fiscal
year
. / mei gene \ bot towing the annual total must not exceed 5% of current revenue, and time period adjusted debt service must not exceed
25% of current revenue of the budget
4, Informing the Treasury: the Treasury must be informed of any operations that have not been formally submitted for approval according to
regulations, and of any operations approved at regional government level
Source Compiled by the authors
. The upper limit of 3% deficit or 60% debt as a share of GDP should be spread over the three
tiers of government,5 in proportion, say, to their investment commitments, after meeting
current national stability requirements and creating reserves for the future.6
. There is a lack of consensus on definition in the measures used to calculate control ratios.
There are, for example, various ways of calculating the yearly debt servicing rate and
investment funding is an ambiguous concept that may even include certain items of current
expenditure (Musgrave, 1959: 599-600).
5 As indicated earlier, these are the limits set by the Treaty of Maastricht, Article 104(2), or more precisely by the Protocol no 5 on the excessive deficit procedure annexed to this Treaty 6 As far as we are aware, the first case of debt sharing between central and local tiers of government was that of
Belgium, as described by Gilhams (1990) Later, Balassone, and Franco (2000) give a more detailed account
of the effect of the Growth and Stability Pact on decentralised government in each member state, touching on
both the theoretical and empirical sides of the issue
ta Springer
This content downloaded from 198.91.32.137 on Tue, 25 Feb 2014 14:22:29 PMAll use subject to JSTOR Terms and Conditions

Public Choice (2007) 131 293-313 301
Table 5 Municipalities by population size
Size of population Municipalities % Population % Expenditure %
Pop < 1 000 4927 6081 1583 554 3 99 148531 5 05
1 001 < Pop < 5 000 2 032 25 08 4 563 157 1149 3 303 39 1122 5 001 < Pop < 10 000 519 641 3 534 253 8 90 2 482 76 8 44
10 001 < Pop < 20 000 327 4 04 4 541265 1143 3 404 92 1157 20 001 < Pop < 50 000 181 2 23 5 243 892 1320 394541 1341 50 001< Pop < 100 000 62 0 77 4115861 1036 276971 941 100 001 < Pop < 500000 48 0 59 9 178 572 23 11 6 554 54 22 27
500 001< Pop <1 000 000 4 0 05 2 572 785 648 181381 6 16
Pop>1000001 2 002 4387087 1104 366931 1247 Total 8 102 100 00 39 720 426 100 00 29 429 13 100 00
Som ce Directorate General for Community and Regional Funding
Budget 2000 in millions of euros
. There is a variety of mechanisms for deterring the median voter from reverting investment
costs on to future generations through borrowing 7
Apart from the existing practice of
earmarking debt revenue, another option would be to fix maximum repayment periods
adjusted to the life cycle of the investment project, or the demands of depreciation-taxation
plans . There is not sufficient justification for the establishment of a maximum debt level Why
fix this at 110% of current revenue instead of another level9 What happens when there is a
decline in revenue after a service that has been self-funded with tariffs is later contracted
out9 Inadequate debt limits will always prove detrimental to municipal treasuries
3 Analysis of the impact of the different municipal borrowing restrictions
Here we examine the effectiveness of the various legal constraints on municipal borrowing
The data we use for this analysis are municipal budget balances aggregated by economic
classification of expenditure for Spanish municipalities, from 1988 to 2000 8
From these
data it is not possible to distinguish between short-term and long-term debt, nor is it possible to isolate debt repayment from debt refinancing However, we have succeeded m working
with various municipal population strata, the main characteristics of which are summarised
in Table 5 Table 6, which displays borrowing trends, shows a decline over the sample period m annual
municipal debt revenue as a share of municipal GDP indirectly estimated for each category
of population size Three stages can be appreciated 1988-1991, when revenue from this
source stood at 1 1% of estimated municipal GDP, 1992-1997 when there was an average
drop of 0 46 percentage points, and, finally, 1998 to 2000, when there was a further decline
m municipal indebtedness which took it to an average of 0 38% of estimated municipal GDP
Note the difference in the perfoimance of larger-sized municipalities, whose levels are much
higher in the first period and continue above those of the rest throughout
7 On this point, see Inman (1982, 1990), Abrams and Dougan (1986), Inman and Fitts (1990) and Schultz
(1995) 8 Aggregate data on the various budgetary chapters and other information relating to population size categories
are available from the authors upon request
ta Springer
This content downloaded from 198.91.32.137 on Tue, 25 Feb 2014 14:22:29 PMAll use subject to JSTOR Terms and Conditions

jg? Table Debt revenue share of estimated municipal GDP (%)
3 1988
3
(JQ _____________-_-_--_
^ Pop < 1,000 0 15
1 001 < Pop < 5,000 0 21 5,001 < Pop < 10,000 0 32 10,001< Pop < 20,000 0 54 20,001< Pop < 50,000 0 80
50,001 < Pop < 100,000 0 93
100,001<
Pop
<
500,000 1 02
500,001 <
Pop
< 1,000,000
1 73
Pop > 1,000,001 2 75
Total 1 03
1989 1990 1991 1992 015 017 021 025 0 47 0 39 0 38 0 30 047 071 063 046 0 72 0 65 0 69 0 71 0 93 1 03 0 94 1 06 0 98 0 98 0 93 0 82 1 04 1 06 0 90 0 76 2 43 2 02 1 48 1 32 2 44 2 74 3 10 0 83 1 12 1 15 1 10 075
1993 1994 1995 1996 1997 0 21 0 16 0 23 0 20 0 21 0 34 0 42 0 25 0 30 0 25 0 35 0 64 0 22 0 28 0 37 0 46 0 85 0 44 0 48 0 45 0 59 0 73 0 39 0 37 0 72 0 56 0 65 0 46 0 57 0 66 0 75 0 86 0 58 0 79 0 95 0 75 111 1 17 0 77 147 1 02 1 37 0 89 0 50 0 27 0 61 0 81 0 52 0 52 0 63
1998 1999 2000 Average
0 15 0 17 0 15 0 18 0 30 0 23 0 22 0 31 0 40 0 28 0 29 0 42 0 47 0 35 0 37 0 55 0 48 0 35 0 41 0 68 0 46 0 30 0 34 0 67 0 51 0 34 0 42 0 77 1 09 0 41 1 05 1 29 0 33 0 38 0 05 1 28 0 47 0 32 0 36 0 72
Soutce Calculations by the authors, from data supplied by the
Directorate
General for Coordination with the Regional Treasuries
This content downloaded from 198.91.32.137 on Tue, 25 Feb 2014 14:22:29 PMAll use subject to JSTOR Terms and Conditions

Public Choice (2007) 131:293-313 303
Source The authors, from data supplied by the Studies Department of the Banco de Cr dito Local
Fig. 1 Debt stock share of estimated municipal GDP (%)
Figure 1 shows the changes in debt revenue and debt servicing costs are reflected in debt
stock, which in its ratio to GDP moves through three stages (Figure 1). In the first, which covers the period 1988 to 1993, there is marked growth in stock. The second is a stage of
stability in which stock reaches its maximum ratio. Finally, in the third phase, 1995 to 2000, values remain stable but slightly lower. Again, the overall pattern is broken by the population category of above 500,000, where debt stock levels are higher.
Over the study period, borrowing operations stretching over more than one budget cycle were subject to restrictions that we will now detail. First, borrowed income must be used
exclusively to cover investment costs (Figure 2). Second, an upper threshold or cap was
placed on debt servicing costs relative to current revenue, beyond which prior approval was
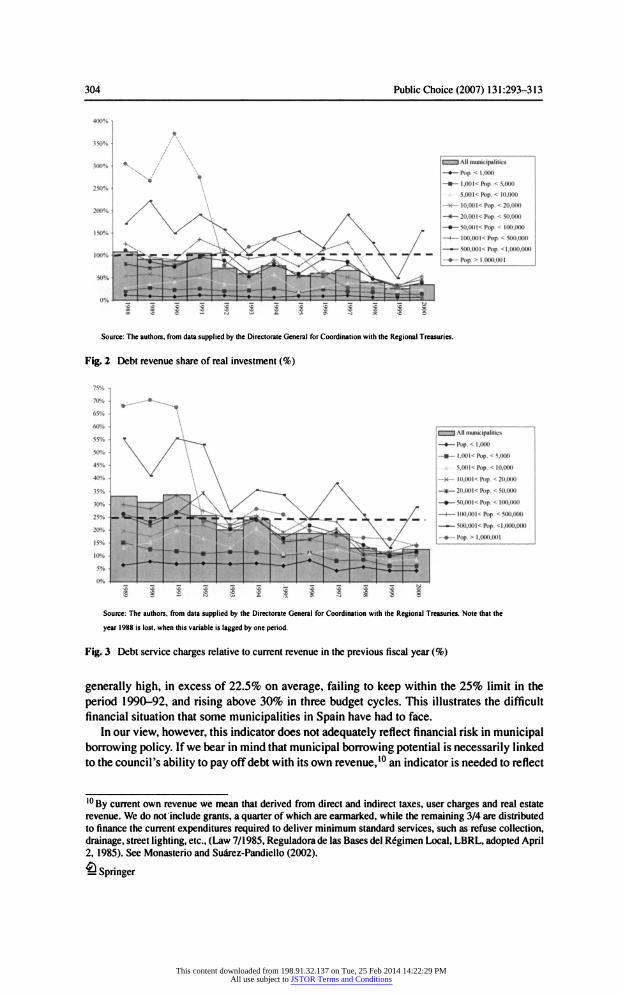
required from the national government (Figure 3).9 As far as the effects of the borrowing policy on capital expenditures is concerned (Figure 2),
it can be seen that during the budget cycles from 1988 to 1991, the ratio of debt revenue to investment expenditure is very high, that is, over 100% for more than one cycle, though it later
undergoes a strong and persistent decline. Note also that there is a similar temporary trend in debt repayment, which may mean that most of the borrowing that took place over the study period was chiefly used to pay off outstanding debt, a result of a major debt re-negotiation process that took place, primarily, during the 1990 and 1991 fiscal years, and also, though to a lesser extent, throughout 1994 and 1997.
Municipal borrowing restrictions have traditionally been based on a unique risk or solvency indicator, calculated from the ratio between debt servicing costs and the current revenue for the previous fiscal year. Figure 3 shows that, within an overall downward trend, values are
9 Over the period 1988-1998 this limit was 25% of current revenue. From 1998 the limit was set with respect to the proportion of net savings to current revenue, as reflected in block 2 of Table 3, but the previous limit
was maintained on current revenue for short-term and emergency borrowing, shown in block 3 of Table 3.
This was implemented through Law 50/1998, which modified the regulations on local borrowing constraints.
The new article 54 is particularly relevant, since it introduces stricter conditions for new long-term borrowing. New long-term borrowing without prior official authorization (The Ministry of Economy and Treasury or
The Autonomous Community) will no longer be allowed whenever budget returns show negative net savings
(formerly below -2% of current revenue). Note that, as explained in Monasterio (2000), the two limits are
related. Thus, although both are in operation, the one affecting net saving, being more stringent, replaces the
25% limit.
ta Springer
This content downloaded from 198.91.32.137 on Tue, 25 Feb 2014 14:22:29 PMAll use subject to JSTOR Terms and Conditions
304 Public Choice (2007) 131:293-313
BAB)
-.-Pop. < 1,000 .-t.OOK Pop. < 5,000 A 5.00K Pop. < 10,000
-**- 10,00l< Pop. < 20,000 20.00K Pop. < 50,000 50,00l< Pop. < 100,000 100.00K Pop. < 500,000
Pnp.<l,l > 1.000,001
iSIS Source The authors, from data supplied by the Directorate General for Coordination with the Regional Treasuries
Fig. 2 Debt revenue share of real investment (%)
-?_ Pop. < 1.000 -*-l,001< Pop. < 5.000
M 5.00K Pop. < 10,000 .*- IO.O0K Rip. < 20,000
-*- 20,00l< Pop. < 50,000 - - S0.00K Pop. < 100,000 -4- |00,00l< Pop. < 500,000
-- 500.00X Rip. <1,000,000
-?-Pop. > 1.000,001
i i i i i lill Source The authors, from data supplied by the Directorate General for Coordination with the Regional Treasuries. Note that the
year 1988 is lost, when this variable is lagged by one period
Fig. 3 Debt service charges relative to current revenue in the previous fiscal year (%)
generally high, in excess of 22.5% on average, failing to keep within the 25% limit in the
period 1990-92, and rising above 30% in three budget cycles. This illustrates the difficult financial situation that some municipalities in Spain have had to face.
In our view, however, this indicator does not adequately reflect financial risk in municipal borrowing policy. If we bear in mind that municipal borrowing potential is necessarily linked to the council's ability to pay off debt with its own revenue,10 an indicator is needed to reflect
10 By current own revenue we mean that derived from direct and indirect taxes, user charges and real estate
revenue. We do not include grants, a quarter of which are earmarked, while the remaining 3/4 are distributed
to finance the current expenditures required to deliver minimum standard services, such as refuse collection,
drainage, street lighting, etc., (Law 7/1985, Reguladora de las Bases del R gimen Local, LBRL, adopted April 2, 1985). See Monasterio and Su rez-Pandiello (2002).
Q Springer
This content downloaded from 198.91.32.137 on Tue, 25 Feb 2014 14:22:29 PMAll use subject to JSTOR Terms and Conditions

Public Choice (2007) 131:293-313 305
60%i +
-?-Pop. < 5.000
5.00K Pop. < 10,000
-?*- 10.00K Pop. < 20.000 -*- 20.00X Pop. < 50,000
-.-50,001< Pop. < 100.000 - - 100.00K Pop. < 500.000
- 500.00K Pop. <1,000,000 -.- Pop. > 1,000,001
l 2g21* 2S l
Source The authors, from data supplied by the Directorate General for Coordination with the Regional Treasuries
Fig. 4 Debt stock relative to current revenue (%)
the balance between debt service and own revenue in the previous fiscal year. This actually reveals the credit standing of Spanish municipalities to be even worse than described above.! l
Due, therefore, to the high interest rates and economic recession of the early nineties, and
to their limited fiscal capacity, Spanish municipalities can be seen to have run up excessive
debt during part of the study period. The combination of the two limits (borrowing only for investment purposes, and upper
limit of the debt load) shows that municipal governments need to generate sufficient current
savings to cover a major part of their capital expenditure, which probably largely explains
why the 25% limit of the capital charge relative to current revenue was later replaced with a
limit relative to current net savings, that is, the amount saved after deduction of repayment
costs.12
From the figures in Table 7, all that we can conclude is that larger municipalities have a
tendency to realise lower net savings to current revenue than smaller ones, but even in this
category the situation has improved in recent years. The above restrictions affect the borrowing policy each year, but not the debt stock. To
control the debt stock level, therefore, after several modifications, municipal borrowing rules
now include a new solvency or financial risk indicator (Figure 4), to capture the ratio of
debt stock to current revenue. The figure shows that, in spite of the slight upward trend of
this indicator, it never reaches the legal maximum of 110% mentioned in Table 3, block 2, under general regulations number 2, though it does increase with population size. In other
words, municipal authorities with larger populations tend to have less room for manoeuvre
than those with smaller populations, with respect to borrowing limits.
Summing up, we can say that the financial situation at municipal level in Spain, especially in the low population strata, gives no reason for concern, either in terms of annual debt or the
level of total debt accrued and nor, therefore, in terms of most of the mandatory restrictions
currently in force. The same cannot be said when it comes to net savings, where, on average,
debt redemption results in dissaving, due in part (though it is difficult to say exactly how far) to
1 ' If grants are excluded from the revenue on which this indicator is measured, capital charges now emerge at
22% to 35% of that revenue.
12Seeendnote9.
^ Springer
This content downloaded from 198.91.32.137 on Tue, 25 Feb 2014 14:22:29 PMAll use subject to JSTOR Terms and Conditions

|[ > Table 7 Approximate net savings relative to current revenue (%)
1988 1989 1990 1991 1992 1993 1994 1995 1996 1997 1998 1999 2000 Average
Pop < 1,000 29 5 27 1 29 1 18 8 23 3 19 4 217 20 1 20 7 211 18 1 19 7 18 2 22 1
1,001 < Pop < 5,000 146 200 183 104 147 108 134 119 117 16 1 155 158 159 146
5,001< Pop < 10,000 153 147 98 -13 74 58 41 12 3 104 10 1 96 136 119 95 10,001 < Pop < 20,000 68 59 74 -3 2 -0 6 35 -l8 57 48 104 124 125 119 58
20,001< Pop < 50,000 08 47 -17 -104 -102 -12 -2 9 52 48 38 94 106 112 19 50,001< Pop < 100,000 -58 -06 14 -66 -3 0 01 -0 2 22 -2 4 52 87 114 108 16
100,001< Pop < 500,000 -57 -3 0 -2 9 -124 -4 1 -2 2 -2 8 4 1 -10 06 114 115 55 -0 1 500,001< Pop < 1,000,000 -169 -214 -145 -24 7 -155 -2 7 -3 1 -12 06 -105 -12 107 -5 8 -8 2
Pop > 1,000,001 -483 -346 -33 0 -37 7 44 98 42 78 144 163 186 19 5 170 -3 2
Total -74 -3 1 -2 8 -119 -0 1 34 16 65 59 72 117 13 5 104 27
Som ce The authors, from data supplied by the Directorate General for Coordination with the Regional Treasuries
This content downloaded from 198.91.32.137 on Tue, 25 Feb 2014 14:22:29 PMAll use subject to JSTOR Terms and Conditions

Public Choice (2007) 131:293-313 307
debt refinancing operations. Generally speaking, however, the trend appears satisfactory, with
a much slower increase in municipal indebtedness in recent years and an improvement in the
financial solvency of Spanish municipalities, reflected in their scores on the financial solvency indicators applied in national regulations. Finally, however, in spite of the favourable overall
impression, it has to be said that a large number of Spanish municipalities fail to adhere to
mandatory borrowing limits, because they do not use debt strictly for the purpose of covering
capital expenditure, nor do they keep within debt service limits.
4 An econometric model for municipal indebtedness
One of the problems encountered while undertaking this study arose from the diversity of
the universe analysed, quite apart from the usual limitations of econometric studies based
on aggregate time series data. However, this problem is partially overcome by working with
panel data, which permits the use of fewer periods, while at the same time enabling us to
observe how municipal behaviour patterns vary with the size of the population. Two remaining problems, however, are that the data are heterogeneous and it is therefore
difficult to make comparisons across different sizes of population and across budget cycles. These problems are overcome on the one hand by ensuring the homogeneity of the data
by using only information supplied by the Directorate General for Coordination with Local
Regional Treasuries. Furthermore, we standardise the data in percentage terms of estimated
municipal GDP, thus enabling their comparison.
To check the robustness of the results yielded by the econometric model, we perform estimations using variables standardised relative to non-financial revenue stratified by popu lation. Though this procedure features the disadvantage that the level of non-financial revenue
depends on the size of the population, it does, however, enable us to check the sensitivity of
the significance parameter.
4.1 Hypotheses and variables for the model
We will now detail the hypotheses we aim to test, a summary of which is given in Table 8.
Specifically, we aim to ascertain how far debt use falls within theoretical premises and
mandatory restrictions. For this, we put three main hypotheses to empirical testing:
- HI. Borrowing is used mainly to finance municipal investment.
- H2. The cap on the financial charge on current revenue lagged one year is effective in
containing municipal debt. -
H3. Borrowing restrictions in the event of negative net savings are effective in containing
municipal debt.
Finally, we introduce a series of control variables. In the following table we summarize
the variables used to test each hypothesis and the sign they are expected to take in each case.
Their main features are described in detail below.
(a) Municipal borrowing (DEBT). A variable that stands for municipal borrowing and is defined as the ratio of debt revenue to municipal GDP. It captures the yearly total flow
of financial resources to municipalities from sources other than taxes or transfers.
(b) Intergenerational equity (INV). This is intended to capture whether indebtedness is a result of carrying forward real investment costs from one year to subsequent years, in
order to spread the costs over the different generations that stand to benefit from them.
ta Springer
This content downloaded from 198.91.32.137 on Tue, 25 Feb 2014 14:22:29 PMAll use subject to JSTOR Terms and Conditions

308 Public Choice (2007) 131-293-313
Table 8 Expected signs of the variables
Symbol Hypothesis Variable Expected sign
Endogenous variable
DEBT
Main hypotheses INV
LRHL(-l)
SAVEN
Control Variables
DMUNX(X = 1,2,
DTEN
TAX
GDPpc
,7)
"Proxy" for municipal
borrowing
Intergenerational
equity
Impact of control
mechanisms
(maximum legal
borrowing limit)
Co-funding capacity
Taxation capacity,
compulsory
competencies, services and transfer
costs (Level of
competencies)
Municipal borrowing trend (1988-2000)
Fiscal responsibility
Relative wealth
Ratio of debt revenue
to municipal GDP
Ratio of real
investment to GDP
Ratio of debt service to
current revenue in
the previous year per size of population
Net saving in debt
servicing costs
Stratified dummy variables
Increasing qualitative variable (1,2, t)
Ratio of own tax
revenue to GDP
Municipal GDP per
capita
Undetermined (-)
Undetermined
+
I
This would accord with theories on intergenerational equity and mandatory provisions.
This variable is constructed from the ratio of real investment to municipal GDP. A
positive coefficient is expected.
(c) Maximum legal borrowing limit (LRHL(-l)). The purpose of this variable is to capture the effectiveness of the maximum limit established for debt use. For each size of pop
ulation, we determine the ratio of debt service to current revenue in the previous year.
If the limit is effective, it is reasonable to expect a negative coefficient on this variable,
in other words, the higher the ratio of debt servicing costs to current revenue in a given
municipality in a given year, the lower its indebtedness in the following year; this be
ing an indicator of the financial risk carried by each size of population. Nevertheless,
the sign of the coefficient may change if the municipality incurs new debt in the year
following.
(d) Co-funding capacity (SAVEN). We aim to establish how far an increase in net saving can help to reduce the need for borrowing in order to fund investments. We will test
this hypothesis by comparing net savings in debt servicing costs to municipal GDP. The
coefficient is expected to be negative, since greater co-funding potential implies less
need to resort to borrowing as a source of funding.
We also introduce a series of control variables, which we have chosen to represent
institutional, fiscal or economic conditions that might have a strong impact on fluctuations
in debt levels. These variables and the sign of their correlation to borrowing are detailed
below.
Springer
This content downloaded from 198.91.32.137 on Tue, 25 Feb 2014 14:22:29 PMAll use subject to JSTOR Terms and Conditions

Public Choice (2007) 131:293-313 309
(e) Level of competencies (DMUNX). The purpose here is to determine the impact of
municipal debt on variations in municipal borrowing behaviour across different sizes of
population, contingent on their different levels of competencies,13 capacity for taxation
and other characteristics. To capture this institutional factor, we will use a series of
dummy variables that take a value of one for each category of population size and
zero for the rest, except for the over 500,000 category, in order to avoid problems of
multicollinearity. The expected sign is ambiguous.
(f) Trends in the funding system (DTEN). Here we propose to find out whether there is an
upward or downward trend in municipal indebtedness over the estimation period. We
will try to capture this effect by means of a qualitative variable that takes value of 1 for
the first fiscal year of the period, 2 for the second, and so on. A priori, the coefficient can
be expected to be ambiguous, though there are two factors that might lead us to expect a negative sign. The first of these relates to successive amendments to the municipal
funding system, which have rationalised debt control and increased the non-financial
resources available to local councils. The second is growing concern over the financial
situation of sub-national authorities, especially since acquiring the commitments implied in the signing of the Maastricht Treaty, which leads us to expect a downward trend in
borrowing.
(g) Fiscal responsibility (TAX). Aimed at measuring the effect of higher own tax revenue on municipal indebtedness in order to test the effectiveness of fiscal responsibility as a
tool for controlling borrowing. We will test this hypothesis by finding the ratio of own tax revenue (user charges, direct and indirect taxes) to municipal GDP.14 A negative sign is expected in this case, since the lesser (greater) the proportion of internal taxation, the
lesser (greater) the application of the power of taxation, which would force the munici
pality to resort to other extraordinary revenue sources, that is, to increase borrowing as
an alternative means of funding.15 On the other hand, higher tax revenue may reflect a greater ability to repay debt,
which could bring advantages in terms of access to borrowing, with debt servicing costs lower than taxation costs, in which case the coefficient would be positive. Given
these contradictory effects, expectations are ambiguous when it comes to the sign of the
coefficient of correlation between internal tax revenue and debt,
(h) Per capita income (Municipal GDPpc). Given that income has a positive impact on
demand for public spending, we will see how municipal GDP per capita relates to
borrowing. We aim to establish whether funding systems are failing to cover the main
demands on public spending in areas with high levels of municipal GDP per capita. In
other words, we will try to detect whether the funding system lacks sufficient flexibility to
be able to adapt to varying preferences. We expect a positive coefficient on this variable,
given the rigidity of the current local funding system.
n Note that legal regulations establish minimum compulsory expenditure responsibilities according to the size
of population (LBRL law) and also powers of taxation that increase with the population size (LRHL law), since the municipal tax rate structure is an increasing function of population size
l4Seeendnote 13 15 It should be pointed out that this result is related to the hypothesis of fiscal illusion, since this variable is
veiy highly correlated with current grants Though alternative tests were performed using payroll expenditure, costs of current goods and services, the sum of these two, and current transfers, all relative to GDP, there were no improvement in results
ta Springer
This content downloaded from 198.91.32.137 on Tue, 25 Feb 2014 14:22:29 PMAll use subject to JSTOR Terms and Conditions

310 Public Choice (2007) 131:293-313
4.2 The model specification and main findings from the estimation
Having established the hypotheses we wish to test, we will now specify the model in detail.
Our purpose is to ascertain whether trends in municipal borrowing are related to the investment
commitment of each local council, we aim to assess the impact of institutional borrowing
control mechanisms on debt service and savings. Our model for the panel data estimation is
as follows:
DEBT,, = D(INV", LRHL(-l),,, SAVEN,,, DMUNX,,, DTEN,,, TAX,,, GDPpc,,) (3)
where: / = municipal population size; t =
year (1988-2000); DX = dummy variable; and
X(-1) = the lagged indicator variable.
The results of the estimation, summarised in Table 9, indicate that municipal borrowing
is related to a combination of the proposed variables. The one that captures the borrowing
investment relationship (namely, INV,,), and the one associated with maximum borrowing
limits (LRHL(-1 ),,) prove significant and have the expected sign. Investment emerges as one
of the main reasons for borrowing. The maximum legal borrowing limit, meanwhile, has the
expected negative coefficient, therefore the empirical evidence demonstrates the institutional
borrowing restriction to be effective.
The negative correlation coefficient between net saving and municipal indebtedness shows
that local councils that adopt a policy of restraint in current spending either obtain higher
levels of current revenue (own or grant), or are more adept at planning the servicing of their
debt, have greater funding capacity, and have less need to resort to borrowing in order to fund
their investment projects.
Turning to the control variables, among the institutional factors, note the significance of
the time variable DTEN,,, which indicates a clear downward trend in municipal borrowing,
and the variable for economic conditions and fiscal powers, which reveals variations across
different sizes of population. It is worth mentioning that the groups with greatest funding requirements are those with populations of over 100,000, followed by those with populations
of between 1,000 and 20,000. Meanwhile, municipalities with populations of under 1,000, and those with populations between 20,000 and 100,000 are in a better position in terms of their borrowing needs.
The fact that local tax revenues prove significant and show a positive coefficient suggests
that there is no substitution relationship between the two revenue sources (tax and debt).16
Municipalities that levy more taxes tend to borrow more. This appears to suggest that they
stand at an advantage when it comes to accessing debt.
The empirical findings for the per capita income variable (GDPpc,,) show that municipal
debt is a response to local spending pressure resulting from the fact that local public goods are normal goods and their income elasticity of demand is positive. Municipalities cannot
meet this demand with non-financial revenue, because their taxation systems are too rigid to
adapt to changes in municipal income. To address potential problems with this variable, and
in order to confirm the findings based on the econometric model, we re-estimated it, using
variables adjusted to non-financial revenue in each category of population size. This failed
16 See Bonner (1972).
ta Springer
This content downloaded from 198.91.32.137 on Tue, 25 Feb 2014 14:22:29 PMAll use subject to JSTOR Terms and Conditions

Public Choice (2007) 131-293-313 311
Table 9 Models for municipal indebtedness, 1988-2000
Model standardised by estimated Model adjusted to non-financial
income stratified by population revenue stratified by population
Coefficient r-statistic Coefficient -statistic
INV
LRHL(-l) SAVEN DMUN1 DMUN2 DMUN3 DMUN4 DMUN5 DMUN6 DMUN7 DTEN TAX
GDPpc C
0.3705989070 -0.0000492118
-1.0011681128
-0.0041833294 -0.0035556266 -0.0036094498 -0.0037668898 -0.0045269094 -0.0042214489 -0.0026080451 -0.0009075498 0.4165379067 0.0000000059
-0.0056803343
3.818573**
-2.406318*
-17.39149**
-2.392185**
-2.906097**
-3.701289**
-4.803066**
-6.704109**
-6.272866**
-3.726676**
-2.664434**
4.384617**
2.096782*
-1.412783
0.3716545638 -0.0008542130
-0.9569622903 -0.1017996599 -0.1276403060 -0.1327354553 -0.1330008062 -0.1543091825 -0.1441115231 -0.0881385248 -0.0216356879 0.8233797740 0.0000001463
-0.385328080
4.497942**
-1.680375*
-17.12314**
-2.136868**
-3.987451**
-5.226054**
-5.710530**
-6.025576**
-5.933779**
-4.930282**
-2.469655*
2.996739**
2.026195*
-2.053623*
Observations 110 110
Mean of dependent variable
Variance
R2
R2 -adjusted
Durbin-Watson statistic
Heteroskedasticity test
(Breush-Pagan) F statistic
Exogeneity test (Hausman)
0.00667 0.00000251 0.92182 0.91089 1.56551
3.42766
84.3506 1.41145
0.17048 0.00161 0.91084 0.89837 1.66136
14.6315
73.0838 0.26362
"r-Student" statistic value appears in brackets below estimated coefficient * Significantly distinct from 0 at the 90% confidence level in the two-way test
**Significantly distinct from 0 at the 95% confidence level in the two-way test
to produce any significant difference in the results, and we take this as a confirmation of the
robustness of our estimations.17
5 Conclusions
We will begin by saying that our analysis of legal municipal borrowing restrictions reveals
that these involve the use of three disciplinary strategies. These include policies aimed at
controlling the permitted debt load, others that impact on current savings and a third type that
affect the co-funding effort. This shows that the measures used in Spain to control municipal
17 Though the estimations were checked for self-correlation, no significant problems emerged The estimations
also passed the Breusch-Pagan test for lack of heteroscedasticity. Finally, when the Hausman test was applied to analyse the explanatory variables for endogeneity, the hypothesis of endogeneity could not be rejected.
ta Springer
This content downloaded from 198.91.32.137 on Tue, 25 Feb 2014 14:22:29 PMAll use subject to JSTOR Terms and Conditions

312 Public Choice (2007) 131 293-313
borrowing appear to match the theories on budgetary discipline and control advanced in
Section 2, though the actual mechanisms still present design problems
The rules are complex and have been subject to repeated amendment in recent years This
makes it more difficult to keep voters adequately informed, and creates a climate of uncertainty
with respect to the borrowing policies adopted by local councils Moreover, though debt is
usually used for investment funding, as required by the Local Public Finance, (Law 39/1988,
Reguladora de las Haciendas Locales, LRHL, adopted December 28, 1988), there is also
evidence of it being used to cover other types of current and financial expenditures
On the whole, Spanish local councils, especially those with small populations, keep their
borrowing situation within most of the mandatory limitations However, the trend in average
net savings appears to be towards dissaving, due in part to debt refinancing operations
Nevertheless, the evidence in recent years is of much more subdued growth in borrowing, and an improvement in the financial solvency indicators used by national rule-makers
In relation to our econometric model of municipal borrowing, we can conclude that the
available empirical evidence confirms the notion that investment is one of the determinants
in municipal borrowing It can be seen, furthermore, that the legal limit on the ratio of capital
spending to current revenue has been effective m curbing over-borrowing by local councils In
addition to this and as the Local Public Finance Law also claims, net savings emerge as a clear
indicator of municipal funding capacity, less debt being taken on by councils with greater
funding capacity Councils that levy more taxes also tend to be more debt reliant This appears
to suggest that borrowing is not used as a substitute for taxation and that municipalities that
make a greater tax effort have easier access to credit Finally, we find support for a positive
relationship between municipal income and indebtedness This is explained by the fact that
most local public goods and services are normal, and by the rigidity of the municipal taxation
system, which hinders its adaptation to income growth
References
Abrams, B , & Dougan, W (1986) The effects of constitutional restraints on governmental spending Public
Choice 49(2), 101-116
Ashworth, J , Geys, B , & Heyndels, B (2005) Government weakness and local public debt development in
flemish municipalities International Tax and Public Finance 12(4), 395-422
Balassone, F, & Franco, D (2000) Public investment, the stability pact and the golden rule Fiscal Studies
2/(2), 207-229
Bayoumi, T, & Eichengreen, B (1994) The political economy of fiscal restrictions Implications for Europe from the United States Em opean Economic Re\iew 38(3-4), 783-791
Bayoumi, T, & Eichengreen, B (1995) Restraining yourself The implications of fiscal rules for economic
stabilization IMF Staff Papers 42(1), 32-48
Bonner, J ( 1972) Local authority investment and debt financing Scotti sh Joui nal of Political Economy 19(2), 135-149
Bunch, B (1991) The effect of constitutional debt limits on state governments' use of public authorities
Public Choice 65(1-3), 57-69
Dafflon, B (1996) The requirement of balanced local budget Theory and evidence from the Swiss Experience In G Pola, G France, & R Levaggi (Eds ), Developments in Local Governments Finance Theoiy and
Policy (pp 228-250) Cheltenham, UK Edward Elgar Dafflon, B , & Rossi, S (1999) Public accounting fudges towards EMU A first empirical survey and some
public choice considerations Public Choice 101, 59-84
Epple, D , & Spatt, C (1986) State restrictions on local debt Their role in preventing default Joui nal of Public Economics 29(2), 199-221
Ezquiaga, I (2000) Condicionantes de la sostenibihdad financiera de las Corporaciones Locales 1990-1999
Papeles de Econom a Espa ola 83, 232-250
ta Springer
This content downloaded from 198.91.32.137 on Tue, 25 Feb 2014 14:22:29 PMAll use subject to JSTOR Terms and Conditions

Public Choice (2007) 131 293-313 313
Farnham, PG (1985) Re-examining local debt limits A disaggregated analysis Southern Economic Journal
51(4), 1186-1201
Gilhams, H M (1990) Financing of subentities in the Belgian Federal System Palau 14 Re\ista Valenciana
de Hacienda Publica 6, 99-118
Goetz, Ch J (1977) Fiscal illusion in State and Local Finance In TE Borcherding (Ed), Budget and
Bmeauciats The som ces of t>o\ernment gi owth (pp 176-187) Durham Duke University Press
Heins, A J (1963) Constitutional j estnctions against state debt Madison, Wisconsin University of Wisconsin
Press
Inman, R P (1982) Limits on the size and growth of government The Economic Case for Limits to Govern
ment Ameiican Economic Re\ lew 72(2), 176-183
Inman, R P (1990) Public debts and fiscal politics How to decide ^ Amer icon Ec onomic Re\iew 80(2), 81-85
Inman, RP, & Fitts, M A (1990) Political Institutions and Fiscal Policy Evidence from U S Historical
Record Journal of Law Economics and Organization 6(Special Issue), 79-132
Kennedy, S , & Robbins, J (2001) The Role of Fiscal Rules in Determining Fiscal Performance Canadian
Depai tment of Finance Woi kin% Papei 2001-16
Kiewiet, D R , & Szakaly, K (1996) Constitutional limitations on borrowing An analysis of state bonded
indebtedness The Join nal of Law Economics and Organization 72(1), 62-97
Kopits, G (2001) Fiscal rules Useful policy framework or unnecessary ornament9 IMF Woikwg Papei no
01/145 McEachern, W A ( 1978) Collective decision rules and local debt choice A test of the median-voter hypothesis
National Tax Jomnal 31(2), 129-136
Misiolek, W S , & Elder, H W (1988) Tax structure and the size of government An empirical analysis of the
fiscal illusion and fiscal stress arguments Public Choice 57, 233-245
Mitchell, W E (1967) The effectneness of debt limits on state and local go\ emment borrowing New York
Institute of Finance New York University Monasterio, C (2000) La financiaci n subcentral en Espa a Principios y desarrollo Papeles de Econom a
Espa ola 83, 25-35
Monasterio, C , & Suarez Pandiello, J (2002) Local government financing and borrowing Spain In B
Dafflon (Ed ), Local Public finance in em ope Balancing the budget and controlling debt (pp 231-255) Cheltenham, UK Edward Elgar
Musgrave, R A (1959) The theory of public finance A study in public economy New York McGraw-Hill
Oates, WE (1988) On the nature and measurement of fiscal illusion A survey In G Brennan, B S Grewel, & P Groenewegen (Eds ), Taxation and Fiscal Fedeialism Essays in Honour of Russell Mathews Sydney Australian National University Press
Pogue, T F (1970) The effect of debt limits Some new evidence National Tax Journal 23(\), 36-49
Poterba, J M (1995) Balanced budget rules and fiscal policy Evidence from the States National Tax Journal
480), 329-337
Poterba, J M (1995b) Capital budgets, borrowing rules, and state capital spending Join nal of Public Eco nomics 56(2), 165-187
Poterba, J M (1997) Do budget rules work7 In A J Auerbach (Ed ), Fiscal Policy Lessons from Economic Research (pp 53-86) Massachusetts The MIT Press Cambridge
Poterba, J M ,& Reuben, K (1999) State fiscal institutions and the US municipal bond market In J Poterba, & J von Hagen (Eds ), Fiscal institutions and fiscal per foi manee, National Bureau of Economic Research,
Cambridge, Mass
Rossi, S , & Dafflon, B (2002) The theory of sub-national balanced budget and debt control In B Dafflon
(Ed) Local public finance in em ope Balancing the budget and conti ollinq debt (pp 15-44) Cheltenham, UK Edward Elgar
Roubini, N , & Sachs, J D (1989) Political and economic determinants of budget deficits in the industrial democracies European Economic Re\iew ii, 903-938
Schultz, C (1995) The balanced budget amendment Needed9 effective7 efficient7 National Tax Journal
480), 317-328
Strauch, R , & Von Hagen, J (2001 ) Formal fiscal restraints and budget processes as solutions to a deficit and
spending bias in public finances -US experience and possible lessons for EMU ZEI Working Paper B01 14
Ter Minassian, T, & Craig, J (1997) Control of sub national government borrowing In Ter-Minassian (Ed ), Fiscal Federalism in Theory and Practice IMF
t Springer
This content downloaded from 198.91.32.137 on Tue, 25 Feb 2014 14:22:29 PMAll use subject to JSTOR Terms and Conditions