Top Managers’ Compensation, Strategic Orientations, and Firm Performance: Empirical Evidence from...
18
Management Research, vol. 1, no. 1 (Winter 2002–3), pp. 27–44. © 2003 M.E.Sharpe, Inc. All rights reserved. ISSN 1536-5433 / 2003 $9.50 + 0.00. TOP MANAGERS’ COMPENSATION, STRATEGIC ORIENTATIONS, AND FIRM PERFORMANCE Empirical Evidence from Spanish Firms GREGORIO SÁNCHEZ MARÍN AND ANTONIO ARAGÓN SÁNCHEZ ABSTRACT: This paper analyzes the links among executive compensation, a firm’s strategic orientation, and firm performance. A number of key questions relative to the relationships among these elements remain unanswered because prior research on this subject has reported mixed results, and, moreover, has been confined almost exclusively to U.S. firms. We develop a framework that draws on arguments from agency theory to identify such links. A research design with both archival and survey data is used to test hypotheses in a sample of 253 Spanish companies. We found that top managers’ compensation systems are linked with a firm’s strategic orientations, but in a different form than that of previous studies. Results show two differentiated groups of firms: (1) prospective firms that adapt their managerial compensation systems to the requirements of strategic context, consequently obtaining positive performance effects; and (2) conservative firms that design managerial compensation systems independent of strategic context, consequently not obtaining additional performance benefits. RESUMEN: Este trabajo analiza las relaciones entre la retribución del directivo, la orientación estratégica de la empresa y los resultados de la organización. Un número de cuestiones clave relativas a estas relaciones permanecen sin respuesta debido a los resultados mixtos que sobre estos aspectos han obtenido estudios anteriores y a que la mayoría de la investigación realizada proviene del contexto estadounidense. En consecuencia, se ha desarrollado un marco teórico que, basado en la teoría de la agencia, permite identificar dichas relaciones. Un diseño empírico basado en datos de archivo y de encuesta han permitido la contrastación empírica de las hipótesis planteadas para una muestra de 253 empresas españolas. Se ha encontrado que el diseño de la retribución del directivo está vinculado con la orientación estratégica de la empresa pero de una forma distinta a la indicada por estudios previos. Los resultados muestran 2 grupos diferenciados de empresas: (1) empresas con orientación más exploradora que ajustan el diseño retributivo al contexto estratégico y, como consecuencia, obtienen beneficios en términos de resultados; y (2) empresas con orientación más defensiva que diseñan la retribución del directivo con independencia de su orientación estratégica y no obtienen beneficios adicionales. The academic discourse on executive compensation has fo- cused, almost without exception, on whether or not the com- pensation of chief executive officers (CEOs) in the largest corporations was designed so that executive decision making would be directed at improving firm performance. Currently, however, recognizing the need to expand the focus of com- pensation studies, research is beginning to examine pay and incentives within organizational hierarchies, shifting away from the focus on CEO pay to the study of compensation systems for lower-level managers (e.g., Fisher & Govindarajan, 1992; Gerhart & Milkovich, 1990; Roth & O’Donnell, 1996; Werner & Tosi, 1995). We share the opinion of Rajagopalan when she states that “there is no strong theoretical basis for expecting a universal relationship between executive pay and firm performance. Rather, such a relationship is likely to be contingent upon . . . the extent to which these [executive compensation] character- istics are consistent with the requirements posed by the firm’s strategic context” (1997: 761). As a consequence, research on executive management compensation systems has been the subject of considerable work in the strategy area (Hambrick & Snow, 1989) and several studies have recently examined the relationships among executive compensation, firm strategy, and firm performance (Boyd & Salamin, 2001; Montemayor, 1996; Rajagopalan, 1997; Romero & Valle, 2001). Thus, there has been considerable work documenting the existence of systematic variations in executive compensation across firms’ strategic contexts, with empirical studies focus- ing on corporate strategies (e.g., Galbraith & Merrill, 1991; Kerr, 1985; Napier & Smith, 1987), business strategies (e.g., Boyd & Salamin, 2001; Montemayor, 1996; Rajagopalan & Gregorio Sánchez Marín is an assistant professor of human re- source management in the Department of Management at Univer- sity of Murcia, Spain. He received his Ph.D. in management from the University of Murcia, Spain. His current research interests fo- cus on executive compensation management, human resource man- agement, and competitive strategies. Antonio Aragón Sánchez is an associate professor of organiza- tion and human resource management in the Department of Man- agement at University of Murcia, Spain. He received his Ph.D. in management from the University of Murcia, Spain. His current re- search interests include competitive strategies, training, and human resource management.
Transcript of Top Managers’ Compensation, Strategic Orientations, and Firm Performance: Empirical Evidence from...
Management Research, vol. 1, no. 1 (Winter 2002–3), pp. 27–44.© 2003 M.E.Sharpe, Inc. All rights reserved.
ISSN 1536-5433 / 2003 $9.50 + 0.00.
TOP MANAGERS’ COMPENSATION, STRATEGICORIENTATIONS, AND FIRM PERFORMANCE
Empirical Evidence from Spanish Firms
GREGORIO SÁNCHEZ MARÍN AND ANTONIO ARAGÓN SÁNCHEZ
ABSTRACT: This paper analyzes the links among executive compensation, a firm’s strategic orientation, and firmperformance. A number of key questions relative to the relationships among these elements remain unanswered becauseprior research on this subject has reported mixed results, and, moreover, has been confined almost exclusively to U.S.firms. We develop a framework that draws on arguments from agency theory to identify such links. A research designwith both archival and survey data is used to test hypotheses in a sample of 253 Spanish companies. We found that topmanagers’ compensation systems are linked with a firm’s strategic orientations, but in a different form than that ofprevious studies. Results show two differentiated groups of firms: (1) prospective firms that adapt their managerialcompensation systems to the requirements of strategic context, consequently obtaining positive performance effects;and (2) conservative firms that design managerial compensation systems independent of strategic context, consequentlynot obtaining additional performance benefits.
RESUMEN: Este trabajo analiza las relaciones entre la retribución del directivo, la orientación estratégica de la empresay los resultados de la organización. Un número de cuestiones clave relativas a estas relaciones permanecen sin respuestadebido a los resultados mixtos que sobre estos aspectos han obtenido estudios anteriores y a que la mayoría de lainvestigación realizada proviene del contexto estadounidense. En consecuencia, se ha desarrollado un marco teórico que,basado en la teoría de la agencia, permite identificar dichas relaciones. Un diseño empírico basado en datos de archivo yde encuesta han permitido la contrastación empírica de las hipótesis planteadas para una muestra de 253 empresasespañolas. Se ha encontrado que el diseño de la retribución del directivo está vinculado con la orientación estratégica dela empresa pero de una forma distinta a la indicada por estudios previos. Los resultados muestran 2 grupos diferenciadosde empresas: (1) empresas con orientación más exploradora que ajustan el diseño retributivo al contexto estratégico y,como consecuencia, obtienen beneficios en términos de resultados; y (2) empresas con orientación más defensiva quediseñan la retribución del directivo con independencia de su orientación estratégica y no obtienen beneficios adicionales.
The academic discourse on executive compensation has fo-cused, almost without exception, on whether or not the com-pensation of chief executive officers (CEOs) in the largestcorporations was designed so that executive decision makingwould be directed at improving firm performance. Currently,however, recognizing the need to expand the focus of com-pensation studies, research is beginning to examine pay andincentives within organizational hierarchies, shifting away fromthe focus on CEO pay to the study of compensation systems
for lower-level managers (e.g., Fisher & Govindarajan, 1992;Gerhart & Milkovich, 1990; Roth & O’Donnell, 1996; Werner& Tosi, 1995).
We share the opinion of Rajagopalan when she states that“there is no strong theoretical basis for expecting a universalrelationship between executive pay and firm performance.Rather, such a relationship is likely to be contingent upon . . .the extent to which these [executive compensation] character-istics are consistent with the requirements posed by the firm’sstrategic context” (1997: 761). As a consequence, research onexecutive management compensation systems has been thesubject of considerable work in the strategy area (Hambrick &Snow, 1989) and several studies have recently examined therelationships among executive compensation, firm strategy,and firm performance (Boyd & Salamin, 2001; Montemayor,1996; Rajagopalan, 1997; Romero & Valle, 2001).
Thus, there has been considerable work documenting theexistence of systematic variations in executive compensationacross firms’ strategic contexts, with empirical studies focus-ing on corporate strategies (e.g., Galbraith & Merrill, 1991;Kerr, 1985; Napier & Smith, 1987), business strategies (e.g.,Boyd & Salamin, 2001; Montemayor, 1996; Rajagopalan &
Gregorio Sánchez Marín is an assistant professor of human re-source management in the Department of Management at Univer-sity of Murcia, Spain. He received his Ph.D. in management fromthe University of Murcia, Spain. His current research interests fo-cus on executive compensation management, human resource man-agement, and competitive strategies.Antonio Aragón Sánchez is an associate professor of organiza-tion and human resource management in the Department of Man-agement at University of Murcia, Spain. He received his Ph.D. inmanagement from the University of Murcia, Spain. His current re-search interests include competitive strategies, training, and humanresource management.

28 Management Research
Finkelstein, 1992), and life-cycle strategies (e.g., Anderson &Zeithmal, 1984; Balkin & Gómez-Mejía, 1987). In addition,literature has revealed that the congruence between firm strat-egy and managerial compensation characteristics has posi-tive effects on firm performance (Balkin & Gómez-Mejía,1990; Gómez-Mejía, 1992; Rajagopalan, 1997).
Nevertheless, although prior research has supported thenotion that firms match their pay systems to their strategicorientation, some limitations and unanswered questions re-main. First, the contingent model, the dominant perspectivein most past studies, needs to be reinforced with new theo-retical approaches—for example, agency theory—to providea more consistent framework (Barkema & Gómez-Mejía,1998). Second, the empirical literature has reported contra-dictory results and conclusions in several compensation di-mensions (e.g., Balkin & Gómez-Mejía, 1990 and Rajagopalan& Finkelstein, 1992). Third, in most cases, studies have fo-cused on large firms, and corporations limit the knowledgeof performance-compensation links in non-diversified andsmall and medium-sized firms (Rajagopalan, 1997). Fourth,research has emphasized data relative to CEO compensationand incentives, but little evidence exists about the relation-ship of compensation, firm strategy, and firm performanceamong lower-level managers (Werner & Tosi, 1995). Fifth,empirical research has been quite limited in non–U.S. con-texts (Roth & O’Donnell, 1996) and data on other countriesrepresent a source of increased understanding of whetherstatistical relationships previously found for the U.S. settingapply in other settings (Barkema, Geroski, & Schwalbach,1997).
The dominant subject, therefore, remains exactly thesame—a lack of knowledge about the effects of the strategiccontext on executive compensation design as well as the firm’sperformance implications with regard to the degree of sucha fit or misfit between these elements (Barkema & Gómez-
Mejía, 1998). Hence, this paper attempts to fill some of thisimportant gap in the literature by focusing on the study oftop managers’ compensation, and examining its relationshipto firm strategy. We develop a model drawing on argumentsfrom agency theory (Jensen & Meckling, 1976) to understandthe effects of firms’ strategic orientations on top manage-ment compensation systems and to identify the performanceimplications of the links among these elements in Spanishfirms. Specifically, we make several contributions to existingresearch on managerial compensation. First, we analyze howdifferent strategies adjust their compensation systems and howthese links affect firm performance in the context of Spanishfirms. Second, we offer new data to understand the role thatmanagerial discretion plays in the design of managerial com-pensation. Third, we extend research on compensation designto one of the firm’s most important executive collectives: topmanagers. Finally, we also provide an important test ofgeneralizability of prior U.S. findings to global settings.
THEORETICAL FRAMEWORKAND RESEARCH HYPOTHESES
In this section, we draw upon agency theory (Eisenhardt, 1989;Jensen & Meckling, 1976) and managerial discretion(Hambrick & Finkelstein, 1987) to develop expected relation-ships among top managers’ compensation systems, firms’strategic orientations, and firm performance (see Figure 1).
To represent firms’ strategic orientations we adopt theMiles & Snow (1978) model because it is one of the mostcommonly studied typologies (Zahra & Pearce, 1990) and themost comprehensive at the business level. Miles & Snow dis-tinguish among three primary strategic orientations—pros-pectors, defenders, and analyzers—for addressing three do-mains: entrepreneurial, technological, and administrative.1 TheMiles & Snow typology is relatively parsimonious, embody-ing a few specific archetypes and utilizing rich conceptua-lization of strategy to prescribe the linkage with environment.Studies also offer strong support for the empirical and theo-retical validity of the strategic types and for the robustnessof the typology across different aspects of strategic behavior(Shortell & Zajac, 1990). Miles & Snow define prospectors asfirms that aggressively seek growth opportunities throughproduct and market development and innovation. Defendersare firms that adopt and protect narrow and stable domains.Just as prospectors are externally oriented and innovative,defenders are internally oriented and efficient. Analyzers arefirms that defend existing product markets through internal,efficiency-oriented strategies while cautiously penetrating newmarkets through product/market innovation. Hence, analyz-ers exhibit characteristics of both prospectors and defend-ers. Several studies (Boyd & Salamin, 2001; Rajagopalan, 1997;Rajagopalan & Finkelstein, 1992) have argued that a firm’s
Firm’s strategic orientations
- Prospector- Defender-Analyzer
FIT
Firm performance
Top managers’ compensation
-Compensation level-Incentives term orientation
- Compensation mix
Managerial control and managerial risk bearing
H1a, H2a, H3a, H4a
H1b, H2b, H3b, H4b
FIGURE 1Managerial Compensation Model
Winter 2002–3 29
strategic orientation—and, by extension, the Miles & Snowtypology—is a good proxy for managerial discretion becauseit has direct implications for the type and extent of manage-rial discretion available to key executives within the firm.Managerial discretion refers to the latitude of options topmanagers have in making strategic choices (Hambrick &Finkelstein, 1987: 371). In the Miles & Snow strategictypologies, for example, prospector firms—characterized byuncertainty, growth perspectives, risks, and innovation(Hambrick & Snow, 1989; Miles & Snow, 1978; Snow &Hrebiniak, 1980)—offer their top managers high levels ofdiscretion because of the complex strategic repertoires avail-able (Rajagopalan, 1997). On the contrary, defender firms—defined by more stable demand, pressure for lower costs andprices, reliable quality (Hambrick & Snow, 1989; Miles & Snow,1978; Snow & Hrebiniak, 1980)—tend to offer a consider-ably reduced level of discretion to their top managers due toa simple and narrow strategic repertoire that is sharply con-strained by routines (Rajagopalan, 1997).
The theoretical framework presented in Figure 1 integratesarguments from agency theory and managerial discretion todevelop the key premise of this paper: that the congruencebetween a firm’s strategic orientation and top managers’ com-pensation characteristics will have positive effects on firmperformance. The agency theory perspective on managerialdiscretion focuses on the fact that the manager’s potentialfreedom of action in decision making can cause the no maxi-mization of firm’s benefits by the manager (Finkelstein &Boyd, 1998: 180). As a consequence, a certain control of themanager’s behavior must be established by means of com-pensation, also taking into account his or her capacity to as-sume risks.
Firms’ strategic orientations have direct implications forthe extent of discretion available to managers within the or-ganization (Rajagopalan, 1997). Changes in the level of mana-gerial discretion have implications for two requirements iden-tified in agency literature (Beatty & Zajac, 1994). The firstrequirement focuses on the problems of managerial controlfrom the viewpoint of the firm’s principal (Jensen & Meckling,1976): The difficulty in controlling the manager’s behavior in-creases when the principal cannot a priori specify this behav-ior, thereby making it possible for this behavior to deviate fromwhat would be considered optimal for the principal. The sec-ond requirement focuses, from the viewpoint of the man-ager, on the analysis of managerial risk-bearing (Holmstrom,1979; Shavell, 1979): Variations in strategic orientation affectthe degree of risk borne by the manager, and, if that risklevel is excessive, this can encourage a manager to behaveagainst an organization’s goals (Hambrick & Snow, 1989).
One way to respond to these two requirements is to un-derstand the choices that are made in the design of firms’compensation strategies—the way that firms orchestrate dif-
ferent components of pay, such as base pay, bonuses andincentives, and benefits. The managerial compensation de-sign will change depending on the extent to which the firmattempts to solve the problem of the manager’s behaviorcontrol faced by the owner and/or the problem of the risk-bearing faced by the manager (Rajagopalan, 1997: 765). Al-though numerous compensation strategy dimensions havebeen suggested in the literature (see, e.g., Gómez-Mejía &Balkin, 1992), compensation decisions can be classified intofour distinct areas of compensation policy (Gerhart &Milkovich, 1992; Milkovich, 1988). The first is the pay-levelpolicy, which determines how firms pay in relation to thecurrent market wage level. The second area is how firms makepay differentiation decisions at the individual level. The thirdis the pay-structure policy, which governs the relationshipsof pay rendered at the various levels of an organization. Fi-nally, the benefits policy is the basis for how a firm providesemployees with indirect financial compensation. This paperfocuses on the first two areas: pay-level policies—if pay is at,above, or below the current market wage level—and pay dif-ferentiation at the individual level—if it emphasizes short-or long-term rewards, and if it emphasizes fixed pay or vari-able pay in the total compensation package. Thus, a firm’sstrategic orientation will be analyzed relative to these key di-mensions of managerial compensation, which have been usedextensively in previous compensation research and have beenfound to be important in determining compensation strate-gies (see, e.g., Fisher & Govindarajan, 1992; Galbraith &Merrill, 1991; Montemayor, 1996; Rajagopalan & Finkelstein,1992).
Compensation level. We defined compensation level as theextent to which the average pay level of top managers is aboveor below that of its competitors (Balkin & Gómez-Mejía,1990). Given that incentive-based pay plans are uncertain,Eaton & Rosen (1983) suggested that such plans increasemanagerial risk and tend to be balanced with greater amountsof pay. In this way, Rajagopalan & Finkelstein (1997) andBoyd & Salamin (2001) found that prospectors used incen-tive-based compensation plans for senior managers. How-ever, due to the risk associated with the increased outcomeuncertainty of these strategies (Hambrick & Snow, 1989), theattractiveness of incentive-based pay plans was then reducedbecause of risk borne by managers (Eisenhardt, 1989). Thus,a higher level of compensation is necessary to balance thereward structure (Conlon & Parks, 1990). On the contrary,defender strategies entail less risk and uncertainty than pros-pector strategies (Miles & Snow, 1978); consequently, defenderfirms tend to use non-incentive-based pay plans, which aremore attractive for managers due to the lower levels of riskborne by them (Hambrick & Snow, 1989). Hence, in that case,defenders use a lower level of compensation because manag-ers do not require additional compensation for risks
30 Management Research
(Rajagopalan & Finkelstein, 1992). Moreover, literature hasfound a positive effect on firm performance when compen-sation levels match a firm’s strategic orientation, and, there-fore, its extent of contextual discretion (Gerhart & Milkovich,1990). That is, higher levels of compensation have a strongerpositive effect on performance among firms in more discre-tionary contexts (Finkelstein & Boyd, 1998). As a result, wewould expect that prospectors—firms in a high discretion-ary context—use higher compensation levels than defend-ers—firms in a low discretionary context—and that fits be-tween compensation level design and strategic orientationwould have positive effects in performance.
Hypothesis 1a: Compensation levels for top managerswill be greater in prospector than in defender firms, thatis, in more discretionary contexts.
Hypothesis 1b: Higher levels of compensation for topmanagers will make a greater contribution to firmperformance in prospector than in defender firms, that is,in more discretionary contexts.
Incentives’ term orientation. Pay can be linked to firmperformance through long-term or short-term incentives.Short-term incentives do not shift as much risk to managersas do long-term incentives, since long-term goals may be lessclear and more uncertain (Werner & Tosi, 1995). Long-termincentives use a longer time period to evaluate managerialperformance, and they are likely to foster a longer decisionhorizon among managers and lead to the selection of strate-gies with longer-term payoffs (Galbraith & Merrill, 1991;Rappaport, 1978). In contrast, short-term incentives tend toemphasize short-term performance, and they have the ad-vantages of allowing the firm to target specific objectivesand focus attention on asset management and efficiency. Pastempirical research has found that long-term incentives aremore suited (Galbraith & Merrill, 1991) and more beneficial(Rajagopalan, 1997) when the strategic context confers a highdegree of discretion upon its managers, as in the case ofprospector firms, because incentives combine the benefitsof achieving congruence of the interests of the firm with-out shifting all the risk to the managers. On the contrary,short-term incentives are more often associated with de-fender firms (Galbraith & Merrill, 1991), producing posi-tive performance effects in these firms (Rajagopalan, 1997)due to the limited extent of managerial discretion, whichminimizes the scope for self-serving managerial behaviors(Rajagopalan, 1997). These arguments lead to the followingresearch hypotheses.
Hypothesis 2a: Long-term incentives for top managerswill be greater in prospector than in defender firms, thatis, in more discretionary contexts.
Hypothesis 2b: Long-term incentives for top managerswill make a greater contribution to firm performance inprospector than in defender firms, that is, in morediscretionary contexts.
Compensation mix. Two basic systems of managerial compen-sation designs are delineated in the literature (Eisenhardt, 1989;Rajagopalan & Finkelstein, 1992): systems that include non-incentive-based or fixed salary; and systems that include in-centive-based or variable compensation. As Tosi & Gómez-Mejía (1989: 172) have summarized, the agency problem isminimized when compensation for senior managers is in-centive based, in that it is tied to their performance. Incen-tive-based compensation is the more efficient contract whenappropriate managerial behaviors are difficult to monitor(Jensen & Meckling, 1976). Alternately, if an agent is expectedto perform a behavior that can be observed directly, the agentshould be paid directly for that behavior via salary (Eisenhardt,1988: 493). Prospector strategies are inherently riskier thanother strategies (Miles & Snow, 1978); hence, compensationplans that reward managers for risk seeking seem appropri-ate for these firms. In this way, several studies have foundthat prospectors make greater use of incentive-based com-pensation plans and tie a greater proportion of managers’pay to performance, due to these plans to reduce risk-aver-sion by top managers (Boyd & Salamin, 2001; Holmstrom,1979; Rajagopalan & Finkelstein, 1992). On the contrary, firmswith less discretionary strategic orientations, as in the case ofdefenders, utilize non-incentive-based compensation plans.In addition, the literature has found a positive effect on firmperformance when there is coherence between the compen-sation mix and the firm’s strategic orientation (Gerhart &Milkovich, 1990), such that the proportions of incentive wouldhave a stronger positive effect on performance among firmsin more discretionary strategic contexts (Montemayor, 1996;Rajagopalan, 1997). As a result, we would expect support forthe following propositions.
Hypothesis 3a: In a compensation mix, the proportionof incentive-based compensation for top managers will begreater in prospector than in defender firms, that is, inmore discretionary contexts.
Hypothesis 3b: In a compensation mix, the proportionof incentive-based compensation for top managers willmake a greater contribution to firm performance inprospector than in defender firms, that is, in morediscretionary contexts.
Compensation system. According to the literature (Balkin &Gómez-Mejía, 1990; Gómez-Mejía, 1992; Gómez-Mejía &Welbourne, 1988; Milkovich, 1988), the compensation choicesseldom occur in isolation; rather, they tend to form meaning-
Winter 2002–3 31
ful patterns. This means firms choose multiple pay strategiesthat are internally consistent. In this stream, the studies ofGómez-Mejía and colleagues (Gómez-Mejía, 1992; Gómez-Mejía & Welbourne, 1988) strongly suggest—heuristically andempirically—that pay choices evolve into two distinct, andopposite, patterns. Therefore, taking into account the threedimensions revealed previously, we can consider, as a whole,two distinct systems of managerial compensation. The firstpattern is labeled as “risk encouraging” because it is designedto pay top managers high salary levels, to use long-term in-centives, and to emphasize the variable part of total compen-sation. We refer to the second pattern as “risk discouraging”because it is designed to pay top managers lower salary levels,to use short-term incentives, and to emphasize the fixed partof total compensation. The risk-encouraging pattern has theopposite orientation of the risk-discouraging pattern. Hence,risk-encouraging systems can reduce monitoring costs whenappropriate managerial behaviors are difficult to determine,aligning interests between principal and agent (Jensen &Meckling, 1976) without shifting all the risk to the managers(Holmstrom, 1979). In this way, previous studies have foundthat risk-encouraging systems have narrow associations withfirms operating in a high discretionary context—as in thecase of prospectors (Rajagopalan & Finkelstein, 1992)—andthat this coherence has a positive effect on performance(Gómez-Mejía). On the other hand, risk-discouraging sys-tems are less able to reduce monitoring costs. For this rea-son, these systems have a greater association with—and havebeneficial performance effects in—firms operating in low-discretion contexts, such as defenders (Gómez-Mejía, 1992;Rajagopalan & Finkelstein, 1992), where the principal doesnot need to monitor top managers closely, and, hence, topmanagers do not demand to be compensated for a high risklevel. These differences lead to the formulation of the fol-lowing hypotheses:
Hypothesis 4a: A risk-encouraging orientation incompensation systems for top managers will be greater inprospector than in defender firms, that is, in morediscretionary contexts.
Hypothesis 4b: A risk-encouraging orientation incompensation systems for top managers will make agreater contribution to firm performance in prospector thanin defender firms, that is, in more discretionary contexts.
METHODS
Sample and Data Sources
The sampling domain of this study was manufacturing firmsbelonging to six industries—food, beverages, chemicals, phar-
maceuticals, motor vehicle manufacturing, and other equip-ment manufacturing— with more than 50 employees and salesvolume over U.S. $5 million annually. These companies wereselected from the Dun & Bradstreet 2000 database. Only largefirms were included because size implies a higher develop-ment of compensation functions and a more probable sepa-ration between ownership and control function, which makesit possible to comply with agency theory suppositions. Thus,we obtained a population of 1,254 firms: 556 belonging tothe food industry, 90 to beverages, 347 to chemicals, 45 topharmaceuticals, 154 to engine vehicle construction, and 62to other mechanical constructions.
Our study focuses on the top management team, that is,the group of chief executives who lead several departmentsof the firm (administration/finances, production, quality,commercial/marketing, human resources). Information wascollected by means of a postal survey. For each firm, the tophuman resource management executive was selected as aninformant because this individual is likely to be intimatelyinvolved and familiar with organizational pay policies con-cerning top managers (Gómez-Mejía, 1992). At the same time,this individual is likely to have a broad understanding of thefirm’s strategy and its environmental characteristics (Balkin& Gómez-Mejía, 1990). The survey was pre-tested using asample of these managers to ensure that it was complete andeasy to follow, and that items were not ambiguous. The postaldelivery was made in two steps: the first was sent May 10,2000. Four weeks later, the survey was sent again to thosefirms that had not answered. The final sample consists of253 firms out a population of 1,254. Specifically, 94 belong-ing to the food industry, 22 to beverages, 57 to chemicals, 25to pharmaceuticals, 41 to engine vehicle construction, and 14to other mechanical constructions. The return rate obtained(20.18 percent) is close to that reported in similar studies(Balkin & Gómez-Mejía, 1990; Gómez-Mejía, 1992;Montemayor, 1996). The differences in some population char-acteristics were not statistically significant between respon-dents and non-respondents or between those responding tothe first or second delivery. All participants were promisedstrict anonymity and confidentiality to ensure candid re-sponses, given the sensitive nature of the information beingrequested.
Operational Measures
Both self-report and archival measures were utilized in thisstudy. We used a survey to identify firms’ strategic orienta-tions and top managers’ compensation (the Appendix pre-sents the measurement scales) and archival measures tooperationalize firm performance.
Firms’ strategic orientation. Because of the limitations ofstrategy measurement using the paragraph approach (Conant,
32 Management Research
Mokwa, & Varadarajan, 1990; Zahra & Pearce, 1990), we de-veloped specifically for this study a multi-item scale to vali-date the measure of the Miles and Snow typology. Accordingto a review of the literature (Conant et al., 1990; Doty, Glick,& Huber, 1993; Miles & Snow, 1978; Segev, 1987, 1989; Smith,Guthrie, & Chen, 1986), and considering Miles and Snow’sentrepreneurial, technological, and administrative dimen-sions, we selected the following dimensions in order to de-sign this scale: product-market domain, success posture, sur-veillance, growth, technological process, technological stan-dardization, personnel characteristics, dominant coalition,planning systems, type of structure, and control and coordi-nation systems.
These dimensions were operationalized using 20 itemsformulated according to a 7-point anchored Likert-type scale,where “1” means that the proposition does not correspondat all to firm reality in relation to the rest of industry firms,and “7” means that the proposition corresponds completelyto that situation (see Appendix). We confirmed reliability ofthe multi-item scale by calculating the Cronbach alpha coef-ficient for all items—a value of 0.86—and for each of threedimensions separately: 0.89 for the entrepreneurial dimen-sion, 0.80 for the technological dimension, and 0.70 for the
administrative dimension. In all cases, the value of these co-efficients indicates an acceptable internal consistency(Nunnally, 1978), which is quite satisfactory considering thatwe used a new scale (Churchill, 1979).
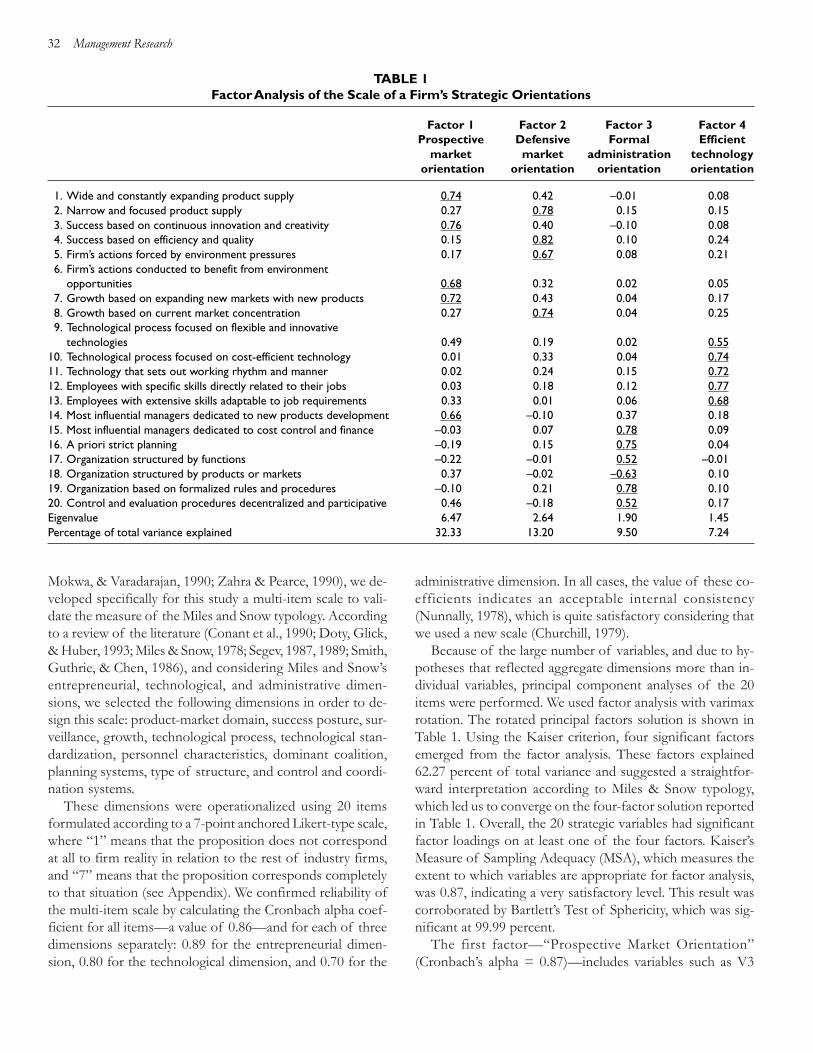
Because of the large number of variables, and due to hy-potheses that reflected aggregate dimensions more than in-dividual variables, principal component analyses of the 20items were performed. We used factor analysis with varimaxrotation. The rotated principal factors solution is shown inTable 1. Using the Kaiser criterion, four significant factorsemerged from the factor analysis. These factors explained62.27 percent of total variance and suggested a straightfor-ward interpretation according to Miles & Snow typology,which led us to converge on the four-factor solution reportedin Table 1. Overall, the 20 strategic variables had significantfactor loadings on at least one of the four factors. Kaiser’sMeasure of Sampling Adequacy (MSA), which measures theextent to which variables are appropriate for factor analysis,was 0.87, indicating a very satisfactory level. This result wascorroborated by Bartlett’s Test of Sphericity, which was sig-nificant at 99.99 percent.
The first factor—“Prospective Market Orientation”(Cronbach’s alpha = 0.87)—includes variables such as V3
TABLE 1Factor Analysis of the Scale of a Firm’s Strategic Orientations
Factor 1 Factor 2 Factor 3 Factor 4Prospective Defensive Formal Efficient
market market administration technology orientation orientation orientation orientation
1. Wide and constantly expanding product supply 0.74 0.42 –0.01 0.082. Narrow and focused product supply 0.27 0.78 0.15 0.153. Success based on continuous innovation and creativity 0.76 0.40 –0.10 0.084. Success based on efficiency and quality 0.15 0.82 0.10 0.245. Firm’s actions forced by environment pressures 0.17 0.67 0.08 0.216. Firm’s actions conducted to benefit from environment
opportunities 0.68 0.32 0.02 0.057. Growth based on expanding new markets with new products 0.72 0.43 0.04 0.178. Growth based on current market concentration 0.27 0.74 0.04 0.259. Technological process focused on flexible and innovative
technologies 0.49 0.19 0.02 0.5510. Technological process focused on cost-efficient technology 0.01 0.33 0.04 0.7411. Technology that sets out working rhythm and manner 0.02 0.24 0.15 0.7212. Employees with specific skills directly related to their jobs 0.03 0.18 0.12 0.7713. Employees with extensive skills adaptable to job requirements 0.33 0.01 0.06 0.6814. Most influential managers dedicated to new products development 0.66 –0.10 0.37 0.1815. Most influential managers dedicated to cost control and finance –0.03 0.07 0.78 0.0916. A priori strict planning –0.19 0.15 0.75 0.0417. Organization structured by functions –0.22 –0.01 0.52 –0.0118. Organization structured by products or markets 0.37 –0.02 –0.63 0.1019. Organization based on formalized rules and procedures –0.10 0.21 0.78 0.1020. Control and evaluation procedures decentralized and participative 0.46 –0.18 0.52 0.17Eigenvalue 6.47 2.64 1.90 1.45Percentage of total variance explained 32.33 13.20 9.50 7.24

Winter 2002–3 33
“success based on continuous innovation and creativity,” V1“wide and constantly expanding product supply,” V7 “growthbased on expanding new markets with new products,” V6“firm’s actions conducted to benefit from environment op-portunities,” and V14 “most influential managers dedicatedto new products development” that are clearly indicative of aprospector orientation in accordance with Miles and Snowtypology. Moreover, this dimension is consistent with previ-ous literature using multi-item scales (Conant et al., 1990; Dotyet al., 1993).
The second factor—“Defensive Market Orientation”(Cronbach’s alpha = 0.86)—includes variables that suggest astrategic behavior characterized by a conservative market ori-entation. Variables loading significantly on this factor includeV4 “success based on efficiency and quality,” V2 “narrowand focused product supply,” V8 “growth based on currentmarket concentration,” and V5 “firm’s actions forced by en-vironment pressures.” This orientation is also clearly indica-tive of a defender orientation in accordance with Miles &Snow typology and is consistent with the findings of previ-ous studies (Conant et al., 1990; Doty et al., 1993).
The third factor—“Formal Administration Orientation”(Cronbach’s alpha = 0.77)—suggests an orientation focusedon organizational procedures and characterized by high lev-els of formalization, planning, and control. Among the vari-ables loading significantly on this factor are V19 “organiza-tion based on formalized rules and procedures,” V15 “mostinfluential managers dedicated to cost control and finance,”V16 “a priori strict planning,” V18—in negative terms—“or-ganization structured by products or markets,” V17 “organi-zation structured by functions,” and V20—although with littlefactor loading, and, therefore, low influence—“control andevaluation procedures decentralized and participative.” Thisdimension is consistent with the Miles & Snow defender typein its administration dimension (Conant et al., 1990; Doty etal., 1993).
The fourth factor—“Efficient Technology Orientation”(Cronbach’s alpha = 0.80)—includes several variables thatindicate a strong orientation to efficiency and flexibility intechnological procedures as well as the adjustment of em-ployees’ skills to context. Variables loading significantly onthis factor include V12 “employees with specific skills directlyrelated to their jobs,” V10 “technological process focused oncost-efficient technology,” V11 “technology that sets outworking rhythm and manner,” V13 “employees with exten-sive skills adaptable to job requirements,” and V9 “techno-logical process focused on flexible and innovative technolo-gies.” This dimension is a hybrid between the defender andthe prospector technological dimensions because of the com-bination of efficiency and flexibility (Conant et al., 1990; Dotyet al., 1993; Miles & Snow, 1978); therefore, we can considerthis factor as representative of, in Miles & Snow’s terms, an
analyzer orientation in its technological dimension.We measured a firm’s strategic orientation base on facto-
rial analysis results. In that way, strategic orientations are rep-resented by four variables—prospective market orientation,defensive market orientation, formal administration orienta-tion, and efficient technology orientation—which are basedon the respective factors obtained previously. The final valueof each variable was calculated on the basis of the factorloadings for all items that generate each factor (as shown inTable 1). Using this procedure, we obtained a value for eachfirm for each of the four strategic orientations, which, giventhe consistent results achieved in factor analysis, helped inthe detection of meaningful strategic orientations patterns(Dess, Lumpkin, & Covin, 1997) that reflect the real situa-tion of Spanish firms. Thus, the factor scores obtained havebeen used as variables representing strategic orientations insubsequent analyses.
Top managers’ compensation. Specifically for this study, we de-signed a scale composed of ten items based on scales pro-posed in previous studies (Balkin & Gómez-Mejía, 1990;Gómez-Mejía, 1992). These items were grouped into threeseparate scales that measure each of the three compensationdimensions on which this paper focuses (see Appendix): com-pensation level (two items), incentives term orientation (twoitems), and compensation mix (six items). These scales mea-sured the degree to which firms followed certain compensa-tion policies for their top managers. Each item was scored ona 7–point Likert-type scale ranging from “1” (total disagree-ment” with the proposal) to “7” (total agreement). We madeanalyses to determine reliability and validity of each of thecompensation dimensions’ measures. The alpha coefficientof all items of top managers’ compensation was 0.83, indi-cating a satisfactory internal consistency. Specifically, the al-pha coefficients for each of three compensation dimen-sions—compensation level, incentives term orientation, andcompensation mix—were 0.80, 0.90, and 0.91, respectively,and, therefore, quite adequate (Churchill, 1979). In order toassess the construct validity of the measure in its discriminantsense, we have factor analyzed each of the three scales usingthe principal components method with varimax rotation.2 Us-ing the Kaiser criterion, as we expected, only one significantfactor emerged for each of the three scales. The values of fac-tors reached for compensation level, incentives term orienta-tion, and compensation mix were, respectively, 1.60, 1.83, and4.19, with a total explained variance of 89.00 percent, 91.31percent, and 69.8 percent, respectively. Kaiser’s MSA andBartlett’s Test presented satisfactory values in all three cases.Therefore, the discriminant validity was confirmed.
Once we confirmed the scale’s reliability and validity, wemeasured top managers’ compensation in two different ways,depending on whether we analyzed each of three compensa-
34 Management Research
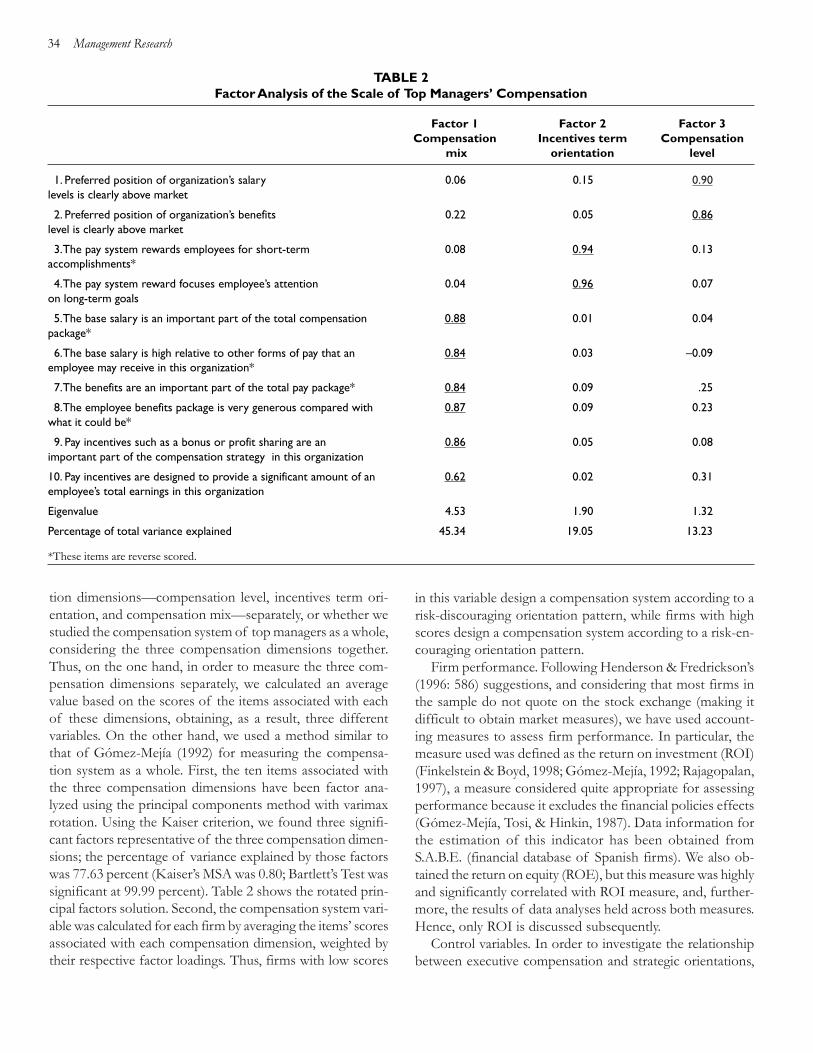
tion dimensions—compensation level, incentives term ori-entation, and compensation mix—separately, or whether westudied the compensation system of top managers as a whole,considering the three compensation dimensions together.Thus, on the one hand, in order to measure the three com-pensation dimensions separately, we calculated an averagevalue based on the scores of the items associated with eachof these dimensions, obtaining, as a result, three differentvariables. On the other hand, we used a method similar tothat of Gómez-Mejía (1992) for measuring the compensa-tion system as a whole. First, the ten items associated withthe three compensation dimensions have been factor ana-lyzed using the principal components method with varimaxrotation. Using the Kaiser criterion, we found three signifi-cant factors representative of the three compensation dimen-sions; the percentage of variance explained by those factorswas 77.63 percent (Kaiser’s MSA was 0.80; Bartlett’s Test wassignificant at 99.99 percent). Table 2 shows the rotated prin-cipal factors solution. Second, the compensation system vari-able was calculated for each firm by averaging the items’ scoresassociated with each compensation dimension, weighted bytheir respective factor loadings. Thus, firms with low scores
in this variable design a compensation system according to arisk-discouraging orientation pattern, while firms with highscores design a compensation system according to a risk-en-couraging orientation pattern.
Firm performance. Following Henderson & Fredrickson’s(1996: 586) suggestions, and considering that most firms inthe sample do not quote on the stock exchange (making itdifficult to obtain market measures), we have used account-ing measures to assess firm performance. In particular, themeasure used was defined as the return on investment (ROI)(Finkelstein & Boyd, 1998; Gómez-Mejía, 1992; Rajagopalan,1997), a measure considered quite appropriate for assessingperformance because it excludes the financial policies effects(Gómez-Mejía, Tosi, & Hinkin, 1987). Data information forthe estimation of this indicator has been obtained fromS.A.B.E. (financial database of Spanish firms). We also ob-tained the return on equity (ROE), but this measure was highlyand significantly correlated with ROI measure, and, further-more, the results of data analyses held across both measures.Hence, only ROI is discussed subsequently.
Control variables. In order to investigate the relationshipbetween executive compensation and strategic orientations,
TABLE 2Factor Analysis of the Scale of Top Managers’ Compensation
Factor 1 Factor 2 Factor 3Compensation Incentives term Compensation
mix orientation level
1. Preferred position of organization’s salary 0.06 0.15 0.90levels is clearly above market
2. Preferred position of organization’s benefits 0.22 0.05 0.86level is clearly above market
3. The pay system rewards employees for short-term 0.08 0.94 0.13accomplishments*
4. The pay system reward focuses employee’s attention 0.04 0.96 0.07on long-term goals
5. The base salary is an important part of the total compensation 0.88 0.01 0.04package*
6. The base salary is high relative to other forms of pay that an 0.84 0.03 –0.09employee may receive in this organization*
7. The benefits are an important part of the total pay package* 0.84 0.09 .25
8. The employee benefits package is very generous compared with 0.87 0.09 0.23what it could be*
9. Pay incentives such as a bonus or profit sharing are an 0.86 0.05 0.08important part of the compensation strategy in this organization
10. Pay incentives are designed to provide a significant amount of an 0.62 0.02 0.31employee’s total earnings in this organization
Eigenvalue 4.53 1.90 1.32
Percentage of total variance explained 45.34 19.05 13.23
*These items are reverse scored.
Winter 2002–3
35
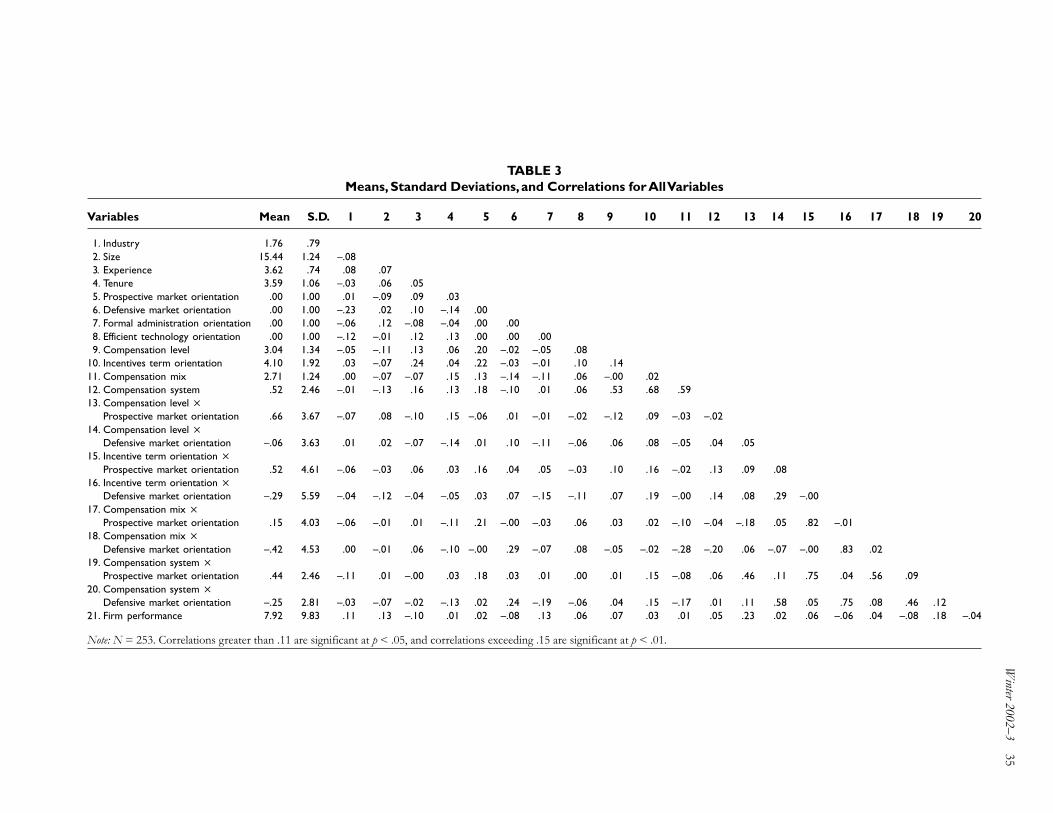
TABLE 3Means, Standard Deviations, and Correlations for All Variables
Variables Mean S.D. 1 2 3 4 5 6 7 8 9 10 11 12 13 14 15 16 17 18 19 20
1. Industry 1.76 .792. Size 15.44 1.24 –.083. Experience 3.62 .74 .08 .074. Tenure 3.59 1.06 –.03 .06 .055. Prospective market orientation .00 1.00 .01 –.09 .09 .036. Defensive market orientation .00 1.00 –.23 .02 .10 –.14 .007. Formal administration orientation .00 1.00 –.06 .12 –.08 –.04 .00 .008. Efficient technology orientation .00 1.00 –.12 –.01 .12 .13 .00 .00 .009. Compensation level 3.04 1.34 –.05 –.11 .13 .06 .20 –.02 –.05 .08
10. Incentives term orientation 4.10 1.92 .03 –.07 .24 .04 .22 –.03 –.01 .10 .1411. Compensation mix 2.71 1.24 .00 –.07 –.07 .15 .13 –.14 –.11 .06 –.00 .0212. Compensation system .52 2.46 –.01 –.13 .16 .13 .18 –.10 .01 .06 .53 .68 .5913. Compensation level ×
Prospective market orientation .66 3.67 –.07 .08 –.10 .15 –.06 .01 –.01 –.02 –.12 .09 –.03 –.0214. Compensation level ×
Defensive market orientation –.06 3.63 .01 .02 –.07 –.14 .01 .10 –.11 –.06 .06 .08 –.05 .04 .0515. Incentive term orientation ×
Prospective market orientation .52 4.61 –.06 –.03 .06 .03 .16 .04 .05 –.03 .10 .16 –.02 .13 .09 .0816. Incentive term orientation ×
Defensive market orientation –.29 5.59 –.04 –.12 –.04 –.05 .03 .07 –.15 –.11 .07 .19 –.00 .14 .08 .29 –.0017. Compensation mix ×
Prospective market orientation .15 4.03 –.06 –.01 .01 –.11 .21 –.00 –.03 .06 .03 .02 –.10 –.04 –.18 .05 .82 –.0118. Compensation mix ×
Defensive market orientation –.42 4.53 .00 –.01 .06 –.10 –.00 .29 –.07 .08 –.05 –.02 –.28 –.20 .06 –.07 –.00 .83 .0219. Compensation system ×
Prospective market orientation .44 2.46 –.11 .01 –.00 .03 .18 .03 .01 .00 .01 .15 –.08 .06 .46 .11 .75 .04 .56 .0920. Compensation system ×
Defensive market orientation –.25 2.81 –.03 –.07 –.02 –.13 .02 .24 –.19 –.06 .04 .15 –.17 .01 .11 .58 .05 .75 .08 .46 .1221. Firm performance 7.92 9.83 .11 .13 –.10 .01 .02 –.08 .13 .06 .07 .03 .01 .05 .23 .02 .06 –.06 .04 –.08 .18 –.04
Note: N = 253. Correlations greater than .11 are significant at p < .05, and correlations exceeding .15 are significant at p < .01.
36 Management Research
previous researchers have stated that firm size (Balkin &Gómez-Mejía, 1990; Rajagopalan & Finkelstein, 1992) andindustry type (Rajagopalan, 1997; Rajagopalan & Prescott,1990) may be organizational factors that affect these associa-tions. In addition, individual factors such as an executive’stenure (Finkelstein & Boyd, 1998; Rajagopalan & Finkelstein,1992) and professional experience (Gerhart & Milkovich,1990; Werner & Tosi, 1995) may have an effect on manage-rial compensation. The logarithm of sales was used as a mea-sure of firm size (Henderson & Fredrickson, 1996). Industrywas measured by considering several characteristics that arerelated to industry structure and influence top managementcompensation (Rajagopalan & Prescott, 1990). We obtaineda composite score base on executives’ responses to some di-mensions3 that are considered relevant to defining industrystructure in the literature (Finkelstein & Boyd, 1998). Basedon average scores obtained, we classified industry variablesinto six categories, ranging from 1 (low competitive industryscore) to 6 (high competitive industry score). Specifically, theclassification of industries according to the level of competi-tiveness was: beverages (1), food (2), chemicals (3), pharma-ceuticals (4), other mechanical constructions (5), and enginevehicle construction (6). The tenure variable was defined asthe number of years that a top manager has been in the cur-rent position (Rajagopalan & Finkelstein, 1992). The profes-sional experience variable was classified as the number ofyears that a manager has functioned as a top executive in thecurrent firm or in other firms (Gerhart & Milkovich, 1990).Both tenure and professional experience were measured asthe average of the top management team.
Data Analyses
Hypotheses 1a, 2a, 3a, and 4a were tested using correlationaland multiple regression analysis. The use of both types ofanalysis provides a broad basis for inference (Miller, 1988).These hypotheses concerning the relationships between topmanagers’ compensation practices and firms’ strategic orien-tations were tested using compensation practices as depen-dent variables and strategic orientations factors as indepen-dents variables.
Because hypotheses 1b, 2b, 3b, and 4b are concerned withthe interactive impact of firms’ strategic orientation and topmanagers’ compensation on firm performance, hierarchicalmultiple regression analysis has been considered the mostappropriate testing procedure (Gómez-Mejía, 1992;Rajagopalan, 1997). To examine the effects of the hypothesizedinteractions, variables were entered using a two-step process(Cohen & Cohen, 1983). The first step included control vari-ables, strategic orientations, and top managers’ compensation.The second step included interaction variables between topmanagers’ compensation and strategic orientations. The in-
teraction terms were calculated as the product of strategicorientation variables by manager compensation variables.
RESULTS
Table 3 provides the means, standard deviations, and correla-tions for all study variables for the final sample of 253 obser-vations. Correlation analysis was used to assess multicolinearityfor the regression analyses. As Table 3 shows, there were notmany significant correlations between variables used in sub-sequent regression analyses, which, a priori, indicated that wedid not have multicolinearity problems (an aspect corrobo-rated by the calculation of tolerance indexes that were withinacceptable limits). The results of the regression analyses wereseparately presented for managerial compensation and stra-tegic orientations (Table 4), and for firm performance andmanagerial compensation with strategic orientations as amoderator (Table 5).
Firms’ Strategic Orientations and Top Managers’Compensation: Hypotheses 1a, 2a, 3a, and 4a
Hypothesis 1a states that compensation level will be greaterin prospector than in defender firms. Tables 3 and 4 bothshow that only the prospective market orientation factor iscorrelated positively and significantly with compensation level.This indicates that firms with a prospector orientation—and,therefore, high levels of managerial discretion—tend to payhigher levels of compensation to their top managers. How-ever, correlational and regression analyses fail to support therelationship with the rest of the strategic orientations fac-tors. So hypothesis 1a receives only partial support.
Hypothesis 2a states that long-term incentives will begreater in prospector than in defender firms. Correlationaland regression analyses show that prospective market orien-tation is positively and significantly related with the incentiveterm orientation dimension. As we expected, firms with pros-pector orientation—with high levels of managerial discre-tion—design long-term-oriented incentives. However, analysisdoes not support any other expected links. These results pro-vide partial support for hypothesis 2a.
Hypothesis 3a states that, in a compensation mix, the pro-portion of incentive-based compensation for top managerswill be greater in prospector than in defender firms. Results ofcorrelational and regression analyses support this hypothesis.Clearly, firms with prospective market orientation—high mana-gerial discretion—tend to use a high proportion of incentivein their total compensation package, while firms with defen-sive market orientation—low managerial discretion—used alow proportion of incentive in their compensation package.
Finally, hypothesis 4a states that a risk-encouraging orien-

Winter 2002–3 37
TABLE 4Multiple Regression Analyses of Top Managers’ Compensation with Firm’s Strategic Orientations
Compensation dimensions
Compensation Incentives term Compensation CompensationIndependent variables level orientation mix system
Industry –0.128… –0.092 0.002 –0.093Size –0.219** –0.120… –0.036 –0.178*Experience 0.151* 0.112 0.005 0.167*Tenure 0.058 0.040 0.086 0.123…
Prospective market orientation 0.178** 0.195** 0.123… 0.158*Defensive market orientation 0.001 –0.013 –0.155* –0.084Formal administration orientation –0.047 –0.017 –0.106 0.018Efficient technology orientation 0.066 0.082 0.069 0.014
R2 0.142 0.094 0.069 0.117Overall F-value 4.022*** 2.530** 1.802… 3.240**
… p < .10* p < .05** p < .01*** p < .001
TABLE 5Hierarchical Regression Analyses of Firm Performance and Top Managers’
Compensation with Firm’s Strategic Orientations as a Moderator
Compensation Incentives term Compensation Compensationlevel orientation mix system
Main Main Main MainIndependent variables effects Full effects Full effects Full effects Full
Industry 0.158* 0.138… 0.154* 0.132… 0.132… 0.127… 0.142… 0.127…
Size 0.158* 0.166* 0.139* 0.141* 0.118… 0.115 0.134… 0.136…
Experience –0.191** –0.214** –0.185** –0.226** –0.160* –0.165* –0.177* –0.193*Tenure –0.028 0.027 –0.024 0.011 –0.020 –0.036 –0.029 –0.023Prospective market orientation 0.012 –0.003 0.009 0.476** 0.037 0.333* 0.026 0.081Defensive market orientation –0.006 0.007 –0.002 –0.007 –0.001 0.077 0.002 0.031Compensation level 0.170* 0.144**Compensation level × Prospective market orientation 0.285***
Compensation level ××Defensive marketorientation 0.007
Incentives term orientation 0.171* 0.169*Incentives term orientation × Prospective marketorientation 0.515***
Incentives term orientation × Defensive marketorientation –0.006
Compensation mix 0.032 0.031Compensation mix × Prospective market orientation 0.326*Compensation mix × Defensive market orientation –0.097Compensation system 0.093 0.099Compensation system × Prospective marketorientation 0.189**
Compensation system × Defensive marketorientation` –0.055
R2 0.068 0.114 0.070 0.118 0.044 0.064 0.055 0.088F-value 1.970* 3.488*** 2.023* 2.781** 1.242 1.420 1.445 1.998*Incremental R2 0.076*** 0.048** 0.020 0.037*
… p < .10* p < .05** p < .01*** p < .001
38 Management Research
tation in global compensation systems for top managers (con-sidering the three previous dimensions together in an overallsystem) will be more prevalent in prospector than in defenderfirms. We find that firms with a prospective market orienta-tion—high level of discretion—tend to design risk-encour-aging compensation systems for their top managers. The in-verse relationship (defensive market orientation with risk-dis-couraging compensation systems) is not confirmed, eventhough the links are in the expected direction. Therefore,hypothesis 4a is only partially supported.
Considering the findings as a whole, we can affirm thatlinks between top managers’ compensation and strategic ori-entations are almost limited to firms with a prospective mar-ket orientation, and, therefore, to firms with high levels ofmanagerial discretion. In these firms, the compensation de-sign is characterized by a riskier orientation. However, wehave found little evidence for these relationships in firms witha low discretion environment. Only in some cases, do firmswith a defensive market orientation seem to design compen-sation with a smaller risk orientation.
As a function of these results, and in accordance with thedictates of parsimony and validity, for subsequent analyses,we decided to eliminate factors number three (formal admin-istration orientation) and four (efficient technology orienta-tion), due to their null and void influence in compensationdesign. It seems logical to think that if these firms do not matchtheir compensation systems with their strategic orientations,they do not obtain positive effects in their performance ei-ther. So, the following analyses were made using only the tworemaining factors that do link compensation and strategy.
Firms’ Strategic Orientations, Top Managers’Compensation, and Firm Performance: Hypotheses1b, 2b, 3b, and 4b
The presence of several significant correlations (Table 3)between the variables representing strategy-compensationinteractions and the respective variables representing the maineffects indicates the appropriateness of using hierarchicalregressions (Cohen & Cohen, 1983) to test hypotheses 1b to4b.
Hypothesis 1b predicted that high levels of compensationwould be more positively associated with firm performancein prospector than in defender firms. Table 5 shows that theincremental R2 between the main effect and full models ispositive and significant, indicating that interaction variablesexplained a significant part of firm performance variation.Analyzing standardized coefficients of interactions, the re-gression coefficient for “Compensation level × Prospectivemarket orientation” is positive and statistically significant,indicating that the adoption of high levels of compensationwhen the firm follows a prospective orientation—high levels
of managerial discretion—has a positive effect on firm per-formance. However, the performance effect related to therelationship between defensive market orientation firms andlow levels of compensation is not significant. These resultsprovide partial support for hypothesis 1b.
Hypothesis 2b predicted that long-term-oriented incen-tives would be more positively associated with firm perfor-mance in prospector than in defender firms. The incremen-tal R2 between the main effect and full models is positive andsignificant. The regression coefficient for “Incentive termorientation × Prospective market orientation” is positive andstatistically significant. This means that firms with prospec-tive orientation—high levels of managerial discretion—thatdesign long-term-oriented incentives obtain a higher perfor-mance benefit. Again, the other expected relationship betweenperformance and “Incentive term orientation × Defensivemarket orientation” fails. Hence, hypothesis 2b is only par-tially supported.
Hypothesis 3b predicted that the proportion of incentive-based compensation would be more positively associated withfirm performance in prospector than in defender firms. Table5 shows that the incremental R2 is positive but not signifi-cant. Despite the signification of the regression coefficientfor “Compensation mix × Prospective market orientation,”sufficient evidence does not exist for sustaining our supposi-tions. Hence, hypothesis 3b is not supported.
Finally, considering the three previous dimensions togetherin the global compensation system, hypothesis 4b predictedthat risk-encouraging compensation systems would be morepositively associated with firm performance in prospectorthan in defender firms. The regression results reported pro-vide partial support for this hypothesis. The “Compensationsystem × Prospective market orientation” interaction is posi-tively and significantly associated with firm performance, butthe corresponding interaction term for the defensive orien-tation is not significant. This means that firms with a pro-spective orientation—high levels of discretion—that designrisk-encouraging compensation systems for their top man-agers obtain a higher performance benefit. These results pro-vide partial support for hypothesis 4b.
Considering the results as a whole, we can affirm that afirm’s strategic orientation moderates the relationship betweentop managers’ compensation and firm performance only whenfirms adopt a prospective market orientation, that is, whenfirms are in more discretionary contexts.
Additional Analyses
Simultaneously, we examined the interaction effects betweenstrategic orientations and compensation to determine howsensitive firm performance is to the three different compen-sation dimensions—compensation level, incentive term ori-

Winter 2002–3 39
entation, and compensation mix—analyzed in this paper.Again, hierarchical multiple regression analysis using a two-step process has been considered the most appropriate pro-cedure. We have designed four different regressions collect-ing all the combinations of compensation dimensions: Thefirst model introduced the three dimensions together, thesecond model entered level and incentive dimensions, the thirdincluded level and mix dimensions, and, finally, the fourthintroduced incentives and mix dimensions. All models weresignificant and the incremental R2 between the main effectand full models was positive and significant.
The results (tables available from the authors upon request)show that firm performance is positively associated with com-pensation dimensions only for firms with a prospective mar-ket orientation, confirming previous hypotheses. Specifically,prospective firms that design compensation for their topmanagers characterized by high pay levels, by a long-termorientation of incentives, and by a heavy weight of variablecomponents in the total package, obtain a positive perfor-mance impact. While we find that the most important vari-able influencing firm performance is compensation level, wealso find that firm performance is more sensitive to bothcompensation mix and incentive term orientation than tocompensation level. This is consistent with conclusions ofthe literature (Boyd & Salamin, 2001) and indicates that, inorder to design pay systems, variable components (incentivesand mix) provide flexibility while fixed components (com-pensation level) provide consistency.
DISCUSSION AND CONCLUSIONS
This study was designed to examine the links between topmanagers’ compensation and a firm’s strategic orientation aswell as to identify the performance implications of the fitbetween these two elements. In this paper, situated withinthe new trend of seeking non-economic explanations for theexecutive’s compensation, we presented arguments from theagency theory and the managerial discretion concept to de-velop a more complete explanation for top managers’ com-pensation systems. A sample of Spanish firms from a cross-section of industries provided data to evaluate propositionsconcerning such links. Overall, the results of this study par-tially support the theoretical argument exposed and revealtwo groups of firms with behaviors clearly differentiated.
Although prior work has found that firms have perfor-mance benefits when they align their compensation systemsto their strategic context (e.g., Finkelstein & Boyd, 1998;Magnan & St-Onge, 1997; Rajagopalan, 1997; Rajagopalan& Finkelstein, 1992), some questions and contradictions haveremained unanswered until now. Thus, this work contributesto the body of studies concerning managerial compensationand firm performance, and offers new empirical data to gain
a better understanding of the role that strategic context andmanagerial discretion plays in the design of managerial com-pensation systems. Moreover, we extend research on com-pensation design to lower levels of managers, specifically totop managers, and we provide an important test of thegeneralizability of prior U.S. findings, exploring whether therelationships previously found apply within the Spanish frame-work. Mainly, our study offers two valuable aspects in thedesign of top managers’ compensation systems.
First, empirical analyses demonstrate some significant re-lationships between top managers’ compensation and a firm’sstrategic orientations. We identify systematic links betweenmanagerial compensation design and firms whose strategy isoriented toward growth perspectives, innovation, and risk.Specifically, we find that the prospective strategic orientationhas significant effects on the level, type, and mix of top man-agers’ compensation. Thus, firms with more discretionarystrategic orientations offer higher compensation levels, usemore long-term incentives, and tie a greater proportion ofpay to performance. As a whole, these kinds of firms designa more risk-encouraging compensation system. These find-ings are consistent with prior studies (Balkin & Gómez-Mejía,1990; Boyd & Salamin, 2001; Montemayor, 1996; Rajagopalan& Finkelstein, 1992), and thus provide a useful confirmationand extension of this matter. For firms in lesser discretion-ary contexts, we find only that the defensive market orienta-tion is related to a smaller proportion of incentive-based com-pensation. The lack of significant interaction between mana-gerial compensation design and others firms’ strategic orien-tations is surprising, but, in a certain way, it shows a differen-tiated pattern of behavior for Spanish firms in comparisonwith U.S. companies. We find that only firms really orientedtoward growth, innovation, and risk match their top manag-ers’ compensation design with the requirements of manage-rial control and managerial risk bearing. However, firms withless innovative and less risky strategic orientations—in oursample we identify three groups: protective market, formaladministration, and efficient technology orientations—and,therefore, with low levels of discretion, seem to design com-pensation packages independent of such requirements.
Second, and consistent with our previous results, we findsupport for the notion that firm performance is a positivefunction of the degree to which top managers’ compensa-tion design reinforces, or is consistent with, the firm’s strate-gic orientation only when high levels of environmental dis-cretion exist. More specifically, the empirical results indicatethat higher levels of compensation, a longer-term incentivesorientation, and a greater proportion of incentive-based com-pensation tend to make a greater contribution to firm per-formance when the strategic context confers a high degreeof discretion upon its managers, as in the case of firms witha prospective market orientation. Such risk-encouraging com-
40 Management Research
pensation systems appear to alleviate the problem of the lackof congruence between managerial and firm interests in high-discretion strategic contexts, while combining the benefitsof achieving congruence between the interests of the firmand its managers without shifting all the risk to the managers(Rajagopalan, 1997). The results support the statement thatthe relationship between managerial compensation and firmperformance may be contingent upon firm strategy only forfirms with high levels of discretion. That is, managerial com-pensation systems result in superior performance only if theymatch the firm’s context. These results are consistent withthe conclusions obtained in studies formulating similar rela-tionships for U.S. companies (Balkin & Gómez-Mejía, 1990;Gómez-Mejía, 1992; Rajagopalan, 1997) and, hence, providegreater validity of the pay-performance relationships. How-ever, we cannot confirm links between performance and thethree compensation dimensions in firms with a more “de-fensive” strategic orientation. In that sense, there is no posi-tive effect on firm performance related to relationships be-tween firms with defensive strategic orientation—low levelsof managerial discretion—and those with risk-discouragingcompensation systems. These findings are consistent withour previous results and confirm the actual behavior of Span-ish firms in relation to the design of top managers’ compen-sation. These results indicate that firms operating in a low-discretion strategic context, due to the lack of fit betweenpay and strategic orientation (that we checked in previoushypotheses), do not obtain benefits in terms of economicperformance. In this respect, when strategic context confersa low degree of discretion upon its managers, as in the caseof a defensive market orientation, firms are not forced ex-haustively to control managerial behavior or to compensateexcessive managerial risk, and thus are not as concerned withthe design of managerial compensation.
Overall, these are significant results because they shed lighton a complex problem in managerial compensation researchrelated to the findings on the pay-performance relationship,while also checking the existence of these relationships inSpanish firms. The results of this study generally support thenotion that Spanish firms benefit from the adoption of mana-gerial compensation policies when their characteristics matchthe managerial motivation and control requirements imposedby the strategic context (Boyd & Salamin, 2001; Finkelstein& Boyd, 1998; Magnan & St-Onge, 1997; Rajagopalan, 1997),but only for certain kinds of firms. Thus, we can appreciatesome differences between Spanish and U.S. companies in re-lation to managerial compensation design. In our study, weshow there are two differentiated groups of Spanish firms:(1) prospective firms that adapt their managerial compensa-tion systems to the requirements of strategic context, and,consequently, obtain positive performance effects; and (2)defensive firms that design managerial compensation inde-
pendent of the strategic context, creating a lack of fit be-tween compensation and context that does not positively af-fect firm performance. The peculiarities of the second groupof firms are consistent with the findings of Romero & Valle(2001) for a set of manufacturing Spanish firms. However,unlike this work, we have discovered that there is a group ofSpanish firms—the first group—that displays behaviors simi-lar to U.S. firms with regard to managerial compensation de-sign. These firms design compensation models for their topmanagers that respond to a coherent action line, that matchthe firm’s strategic orientation, and that present positive ef-fects on overall performance from this adaptation.
More broadly, and consistent with both the formulatedmodel and other research in the same area (Boyd & Salamin,2001; Finkelstein & Boyd, 1998; Magnan & St-Onge, 1997;Rajagopalan, 1997; Rajagopalan & Finkelstein, 1992), thisstudy also contributes to the confirmation of managerial dis-cretion as an important element for the explanation of rela-tionships between managerial compensation and strategicorientation in non-U.S. firms. Thus, in prospective orienta-tion cases, organizations usually design managerial compen-sation systems based on the degree of managerial discretionavailable to top managers, that is, according to the range orautonomy of managerial action in making strategic choices(Hambrick & Finkelstein, 1987). Moreover, the adjustmentof managerial compensation to the range of managerial dis-cretion positively affects firm performance. These conclu-sions also have significant implications regarding managerialcontrol activities and managerial risk bearing. The firm’s stra-tegic orientation affects managerial behavior control and therisks the manager bears (Rajagopalan & Finkelstein, 1992:138). According to agency theory, the owner must recognizethe costs and risks, and assure that the firm’s compensationsystem is consistent with its strategic context. In particular,prospective firms need closer supervision of the manager,due to the high degree of managerial discretion in that con-text, so they use compensation systems with a risk-encourag-ing orientation that can also compensate for the higher riskthe manager faces in the development of his or her tasks(Rajagopalan, 1997).
In addition to those discussed above, several other find-ings of this study have interesting implications. First, althoughthe literature indicates that size is the most important deter-minant of compensation, we also appreciate that the profes-sional experience of top managers has a significant influencein the design of compensation systems, at least in the Span-ish context. This suggests that an individual executive’s char-acteristics—such as experience or tenure—should be intro-duced in subsequent studies in order to collect additional veryimportant factors (Finkelstein & Boyd, 1998; Gerhart &Milkovich, 1990).
Second, in connection with additional analyses, we find
Winter 2002–3 41
that compensation dimensions affect firm performance indifferent ways. First, compensation level has greater directeffects on firm performance than do incentives or mix, and,therefore, provides consistency to firm performance: higherpay levels are related to better firm performance. Second,incentives and mix design have a greater influence in firmperformance than does pay level when they are related tostrategic orientation. Thus, and consistent with Boyd &Salamin’s (2001) conclusions, variable components’ designseems to provide more flexibility while fixed componentsprovide more consistency. Consequently, variable componentsof top managers’ compensation are probably more impor-tant mechanisms in attaining a firm’s goal, while compensa-tion level is a basic instrument to achieve the required consis-tency of pay systems.
Finally, the lack of stronger results may be due to the factthat we analyzed lower-level managers—below the CEO inthe hierarchy. This situation reflects, as Boyd & Salamin (2001)show in their work, that hierarchical level is an importantvariable to consider in compensation studies because thereare a number of strategic pay topics that have reported dif-ferent and conflicting results when hypotheses have beentested at different hierarchical levels (e.g., Balkin & Gómez-Mejía, 1990; Rajagopalan & Finkelstein, 1992).
Limitations and Directions for Future Research
There are several limitations and directions for future researchthat should be noted. The first potential limitation concernsthe use of self-reported measures. Although perceptual datahave been used to assess the elements of this study quiteoften (e.g., Balkin & Gómez-Mejía, 1990; Gómez-Mejía, 1992;Rajagopalan, 1997; Rajagopalan & Finkelstein, 1992), we haveattempted to reduce potential bias by using multi-item scalesthat allow us to verify the reliability and validity of measures.
Second, in the empirical results, the proportion of ex-plained variance in firm performance attributed to compen-sation-strategy fit is modest, as other similar studies haveshown (see, for example, Gómez-Mejía, 1992; Rajagopalan,1997), but clearly is due to firm performance being respon-sive to many factors that are not easily captured. Despite this,the managerial compensation systems appear to play a rolethat should not be ignored with regard to other variables thathave been considered in the past.
Third, the dynamic interactive relationship between com-pensation strategies and a firm’s context over time needs tobe examined. Gerhart & Milkovich (1990) find that compen-sation strategies are remarkably stable over the years. Thismay create a situation where compensation strategies that aremore appropriate in support of firm strategies at the presenttime may become obsolete or even counterproductive in thefuture (Gómez-Mejía, 1992). Longitudinal studies are needed
to understand the relationships of interdependence of theseelements as changes occur in different parts of Spanish firms’systems over time.
Fourth, and equally interesting but untested by this study,is a normative analysis. That is, it would be useful to comparewhether high- and low-performing firms place differing em-phasis on strategic orientation or discretion when designingcompensation systems. Thus, the next step in completing thiswork is to compare high-performing and low-performingfirms. In this way, we can determine whether Spanish firmsare similar to U.S. companies in the sense that Finkelstein &Boyd (1998) and Magnan & St-Onge (1997) explain in theirrespective studies. Trying to confirm whether or not the twogroups of firms identified in this work really respond to dif-ferences in performance would allow us to determine whetherit is really only high-performing firms that design compensa-tion for their managers and adapt it to strategic context.
Finally, this study suggests that other situational factorsdifferent from a firm’s strategic orientation may be criticalcontingencies in the managerial compensation–firm perfor-mance relationships. Future research needs to explore whichelements have a high influence on the managerial compensa-tion design. For example, recent research leads us to thinkthat factors contemplated in institutional theory, such as thepolitical and legal context, the search for legitimacy, imita-tion, and so on are possible explanations for this link(Suchman, 1995). On the other hand, an emergent stream ofresearch collectively referred to as “behavioral economics”states that other possible contextual factors affecting com-pensation design are in the decision context. It recognizesthat the framing of decisions as either positive or negativeaffects managers’ perceptions and risk preferences (Wiseman& Gómez-Mejía, 1998).
In conclusion, this study provides evidence regarding theimplications for firm performance of the degree of fit ormisfit between the elements of the business context and topmanagers’ compensation design in Spanish firms. The re-sults obtained illustrate that the role of strategic context inallocating compensation is more complex than previouslybelieved, and depending on the level of discretion, we canfind two groups of firms with different behavior. There-fore, relationships among managerial compensation, firm strat-egy, and firm performance are both theoretically and empiri-cally an elusive and complex phenomenon that requires fur-ther research in the future to obtain a better and clearerunderstanding.
NOTES
1 This study does not include “reactor” orientation, becausecompanies following this strategy commit some incongruencesamong strategy, structure, and behavior or operating methods

42 Management Research
(Miles & Snow, 1978), and, therefore, the likely characteristicsof top managers’ compensation are unknown. Moreover, in oursample, none of the firms studied was autoclassified—using theSnow & Hrebiniak (1980) scale—as a reactor.
2 We use this method to check that only one factor reached ineach of the three scales, which means that each of the itemsmeasured the three compensation dimensions appropriately (Kim& Mueller, 1978).
3 Hambrick & Finkelstein’s (1987) study provides a useful back-ground to the view that the following factors affect industry’sstructure: product differentiability, market growth, level of con-centration, demand instability, industry regulation, and capitalintensity. We designed a seven-point Likert-type scale composedof six items in order to measure the extent to which managersbelieved their firms worked in a more or less competitive indus-try (scale available from the authors upon request).
REFERENCES
Anderson, C.R., & Zeithmal, C.P. 1984. Stage of the productlife cycle, business strategy, and business performance.Academy of Management Journal, 27: 5–14.
Balkin, D.B., & Gómez-Mejía, L.R. 1987. Toward a contingencytheory of compensation strategy. Strategic Management Jour-nal, 8: 169–182.
———. 1990. Matching compensation and organizational strat-egies. Strategic Management Journal, 11: 153–169.
Barkema, H., & Gómez-Mejía, L.R. 1998. Managerial compen-sation and firm performance: A general research frame-work. Academy of Management Journal, 41: 135–145.
Barkema, H., Geroski, P., & Schwalbach, J. 1997. Managerialcompensation strategy and firm performance. InternationalJournal of Industrial Organization, 15: 413–417.
Beatty, R.P., & Zajac, E.J. 1994. Managerial incentives, monitor-ing, and risk-bearing: a study of executive compensation,ownership, and board structure in initial public offerings.Administrative Science Quarterly, 39, 313–336.
Boyd, B.K., & Salamin, A. 2001. Strategic reward systems: Acontingency model of pay system design. Strategic Manage-ment Journal, 22: 777–792.
Churchill, G.A. 1979. A paradigm for developing better mea-sures of marketing constructs. Journal of Marketing Research,16: 64–73.
Cohen, J., & Cohen, P. 1983. Applied multiple regression/correlation analy-sis for the behavioral sciences. Hillsdale, NJ: Lawrence Erlbaum.
Conant, J.S., Mokwa, M.P., & Varadarajan, P.R. 1990. Strategictypes, distinctive marketing competencies and organiza-tional performance: A multiple measures based study. Stra-tegic Management Journal, 11: 365–383.
Conlon, E.J., & Parks, J.M. 1990. Effects of monitoring andtradition on compensation arrangements: An experimentwith principal-agent dyads. Academy of Management Journal,33: 603–622.
Dess, G.G., Lumpkin, G.T., & Covin, J.G. 1997. Entrepreneurialstrategy making and firm performance: Test of contingencyand configurational models. Strategic Management Journal, 18:677–695.
Doty, D.H., Glick, W.H., & Huber, G.P. 1993. Fit, equifinality,and organizational effectiveness: A test of two configura-tional theories. Academy of Management Journal, 36: 1196–1250.
Eaton, J., & Rosen, H.S. 1983. Agency, delayed compensation,and the structure of executive remuneration. Journal of Fi-nance, 38: 1489–1505.
Eisenhardt, K. 1988. Agency and institutional theory explana-tions: The case of retail sales compensation. Academy ofManagement Journal, 31: 488–511
———. 1989. Agency theory: An assessment and review. Acad-emy of Management Review, 14: 57–74.
Finkelstein, S., & Boyd, B.K. 1998. How much does the CEO mat-ter? The role of managerial discretion in the setting of CEOcompensation. Academy of Management Journal, 41: 179–199.
Fisher, T., & Govindarajan, V. 1992. Profit center manager com-pensation: An examination of market, political and humancapital factors. Strategic Management Journal, 13: 205–217.
Galbraith, C.S., & Merrill, G.B. 1991. The effect of compensa-tion program and structure on SBU competitive strategy:A study of technology-intensive firms. Strategic ManagementJournal, 12: 353–370.
Gerhart, B., & Milkovich, G.T. 1990. Organizational differencesin managerial compensation and financial performance.Academy of Management Journal, 33: 663–691.
———. 1992. Employee compensation: Research and practice.In M. Dunnette & L. Hough (eds.), Handbook of industrialand organizational psychology, vol. 3, 481–570. Palo Alto, CA:Consulting Psychologists Press.
Gómez-Mejía, L.R. 1992. Structure and process of diversifica-tion, compensation strategy, and firm performance. Strate-gic Management Journal, 13: 381–397.
Gómez-Mejía, L.R., & Balkin, D.B. 1992. Compensation, organiza-tional strategy, and firm performance. Cincinnati, OH: South-Western Publishing.
Gómez-Mejía, L.R., & Welbourne, T.M. 1988. Compensationstrategy: An overview and future steps. Human Resource Plan-ning, 11: 173–189.
Gómez-Mejía, L.R., Tosi, H., & Hinkin, T. 1987. Managerialcontrol, performance, and executive compensation. Acad-emy of Management Journal, 30: 51–70.
Hambrick, D.C. 1983. Some tests of the effectiveness and func-tional attributes of Miles and Snow’s strategic types. Acad-emy of Management Journal, 26: 5–26.
Hambrick, D.C., & Finkelstein, S. 1987. Managerial discretion:A bridge between polar views of organizational outcomes.In B.M. Staw & L.L. Cummings (eds.), Research in organiza-tional behavior, vol. 9, 369–406. Greenwich, CT: JAI Press.
Hambrick, D.C., & Snow, C.C. 1989. Strategic reward systems.In C.C. Snow (ed.), Strategy, organization design, and humanresources management, 333–368. Greenwich, CT: JAI Press.
Henderson, A.D., & Fredrickson, J.W. 1996. Information pro-cessing as a determinant of CEO compensation. Academyof Management Journal, 39: 575–606.
Holmstrom, B. 1979. Moral hazard and observability. Bell Jour-nal of Economics, 14: 74–91.
Jensen, M.C., & Meckling, W.H. 1976. Theory of the firm: Mana-
Winter 2002–3 43
gerial behavior, agency costs and ownership structure. Jour-nal of Financial Economics, 3: 305–360.
Kerr, J.L. 1985. Diversification strategies and managerial re-wards: An empirical study. Academy of Management Journal,28: 155–179.
Kim, J., & Mueller, C.W. 1978. Introduction to factor analysis: What itis and how to do it. Beverly Hills, CA: Sage.
Magnan, M.L., & St-Onge, S. 1997. Bank performance and ex-ecutive compensation: A managerial discretion perspective.Strategic Management Journal, 18: 573–581.
Miles, R.E., & Snow, C.C. 1978. Organizational strategy, structure,and process. New York: McGraw-Hill.
Milkovich, G.T. 1988. A strategic perspective on compensationmanagement. In K. Rowland & G. Ferris (eds.), Research inpersonnel and human resources, vol. 6, 263–288. Greenwich,CT: JAI Press.
Miller, D. 1988. Relating Porter’s business strategies to environ-ment and structure: Analysis and performance implications.Academy of Management Journal, 31: 280–308.
Montemayor, E.F. 1996. Congruence between pay policy andcompetitive strategy in high-performing firms. Journal ofManagement, 22: 889–908.
Napier, N.K., & Smith, M. 1987. Product diversification, per-formance criteria and compensation at the corporate man-ager level. Strategic Management Journal, 8: 195–201.
Nunnally, J. 1978. Psychometric theory. New York: McGraw-Hill.Rajagopalan, N. 1997. Strategic orientations, incentive plan adop-
tions, and firm performance: Evidence from electric utilityfirms. Strategic Management Journal, 18: 761–785.
Rajagopalan, N., & Finkelstein, S. 1992. Effects of strategic ori-entation and environmental change on senior managementreward systems. Strategic Management Journal, 13: 127–142.
Rajagopalan, N., & Prescott, J.E. 1990. Determinants of topmanagement compensation: Explaining the impact of eco-nomic, behavioral, and strategic constructs and the mod-erating effects of industry. Journal of Management, 16:515–538.
Rappaport, A. 1978. Executive incentives vs. corporate growth.Harvard Business Review, 56 (4): 81–88.
Romero, M.G., & Valle, R. 2001. Strategy and manager’s com-pensation: The Spanish case. International Journal of HumanResource Management, 12: 218–242.
Roth, K., & O’Donnell, S. 1996. Foreign subsidiary compensa-tion strategy: An agency theory perspective. Academy ofManagement Journal, 39: 678–703.
Segev, E. 1987. Strategy, strategy making and performance in abusiness game. Strategic Management Journal, 8: 565–577.
Segev, E. 1989. A systematic comparative analysis and synthesisof two business-level strategic typologies. Strategic Manage-ment Journal, 10: 487–505.
Shavell, S. 1979. Risk sharing and incentives in the principal andagent relationship. Bell Journal of Economics, 10: 55–73.
Shortell, S.M., & Zajac, E.J. 1990. Perceptual and archival mea-sures of Miles and Snow’s strategic types: A comprehen-sive assessment of reliability and validity. Academy of ManagementJournal, 33: 817–832.
Smith, K.G., Guthrie, J.P., & Chen, M. 1986. Miles and Snow’s
typology of strategy, organizational size, and organizationalperformance. Academy of Management Journal, 33: 817–832.
Snow, C.C., & Hrebiniak, L.G. 1980. Strategy, distinctive com-petence, and organizational performance. AdministrativeScience Quarterly, 25: 317–336.
Suchman, M. 1995. Managing legitimacy: Strategic and insti-tutional approaches. Academy of Management Review, 20:571–610.
Tosi, H.L., & Gómez-Mejía, L.R. 1989. The decoupling of CEOpay and performance: An agency theory perspective. Ad-ministrative Science Quarterly, 34: 169–190.
Werner, S., & Tosi, H.L. 1995. Other people’s money: The ef-fects of ownership on compensation strategy and mana-gerial pay. Academy of Management Journal, 38: 1672–1691.
Wiseman, R.M., & Gómez-Mejía, L.R. 1998. A behavioral agencymodel of managerial risk taking. Academy of ManagementReview, 23: 133–153.
Zahra, S., & Pearce, J. 1990. Research evidence on the Miles-Snow typology. Journal of Management, 16: 751–768.
APPENDIXQuestionnaire Items
Firm’s strategic orientation. Executives were asked to reflectthe strategic orientation of their firms with reference to theirindustry’s competitors. (Cronbach alpha = 0.86)
1. Entrepreneurial dimension. (Cronbach’s alpha = 0.89) (a) Wideand constantly expanding product supply. (b) Narrow and fo-cused product supply. (c) Success based on continuous inno-vation and creativity. (d) Success based on efficiency and qual-ity. (e) Firm’s actions forced by environment pressures. (f) Firm’sactions conducted to benefit from environment opportuni-ties. (g) Growth based on expanding new markets with newproducts. (h) Growth based on current market concentration.
2. Technological dimension. (Cronbach’s alpha = 0.80) (a) Techno-logical process focused on flexible and innovative technolo-gies. (b) Technological process focused on cost-efficient tech-nology. (c) Technology that sets out working rhythm andmanner. (d) Employees with specific skills directly related totheir jobs. (e) Employees with extensive skills adaptable tojob requirements.
3. Administrative dimension. (Cronbach’s alpha = 0.75) (a) Mostinfluential managers dedicated to new products development.(b) Most influential managers dedicated to cost control andfinance. (c) A priori strict planning. (d) Organization struc-tured by functions. (e) Organization structured by productsor markets. (f) Organization based on formalized rules andprocedures. (g) Control and evaluation procedures decentral-ized and participative.
Top managers’ compensation. Executives were asked to re-port the top managers’ compensation design applied throughtheir level of agreement with reference to different affirmations.(Cronbach’s alpha = 0.83)
1. Compensation level. (Cronbach’s alpha = 0.80) (a) Preferredposition of organization’s salary levels with respect to com-

44 Management Research
petitors is clearly above market. (b) Preferred position oforganization’s benefits level with respect to competitors isclearly above market.
2. Incentives term orientation. (Cronbach’s alpha = 0.90) (a) Thepay system rewards employees for short-term accomplish-ments during a fixed time period.* (b) The pay system re-ward has a futuristic orientation. It focuses employee’s atten-tion on long-term (two or more years) goals.
3. Compensation mix. (Cronbach’s alpha = 0.91) (a) The base sal-ary is an important part of the total compensation package.*
(b) The base salary is high relative to other forms of pay thatan employee may receive in this organization.* (c) The ben-efits are an important part of the total pay package*. (d) Theemployee benefits package is very generous compared withwhat it could be*. (e) Pay incentives such as a bonus or profitsharing are an important part of the compensation strategyin this organization. (f) Pay incentives are designed to pro-vide a significant amount of an employee’s total earnings inthis organization.
(*) These items are reverse scored.