Investors' assessment of implicit environmental liabilities: An empirical investigation
27
NOgl~-~ RESEARCH NOTE Investors' Assessment of Implicit Environmental Liabilities: An Empirical Investigation Denis Cormier and Michel Magnan The purpose of our study is to investigate how investors assess the financial implications of a firm's environmental performance, as measured by its pollution record relative to existing regulations (pollution measure). It is expected that the larger a firm's pollution measure, the greater is the magnitude of implicit environ- mental liabilities which investors will subtract from its stock market valuation. These implicit environmental liabilities reflect environmental costs and losses which the finn is expected to incur, but which are not yet accounted for in its financial statements. Results from a three-industry sample suggest that market participants assess implicit environmental liabilities to pulp and paper firms, chemicals, and oil refiners. The more these firms pollute, the greater the extent of their implicit environmental liabilities. Weaker evidence is provided for steel, metal and mining firms. © 1997 Elsevier Science Inc. 1. Introduction In recent years, individual and institutional investors have become increas- ingly concerned about corporate pollution. Their concerns result from enhanced social awareness and a realization that a firm's environmental Address correspondence to: Professor Michel Magnan, HEC-Montr6al, Department of Accoun- tancy, 3000, Cbte Ste. Catherine, Montr6al, Qu6bec, Canada H3T 2A7; E-mail: michel.magnan@ hec.ca. Journal of Accounting and Public Policy, 16, 215-241 (1997) © 1997 Elsevier Science Inc. 655 Avenue of the Americas, New York. NY 10010 0278-4254/97/$17.00 PII S0278-4254(97)00002-1
-
Upload
independent -
Category
Documents
-
view
4 -
download
0
Transcript of Investors' assessment of implicit environmental liabilities: An empirical investigation

N O g l ~ - ~
RESEARCH NOTE
Investors' Assessment of Implicit Environmental Liabilities: An Empirical Investigation
Denis Cormier and Michel Magnan
The purpose of our study is to investigate how investors assess the financial implications of a firm's environmental performance, as measured by its pollution record relative to existing regulations (pollution measure). It is expected that the larger a firm's pollution measure, the greater is the magnitude of implicit environ- mental liabilities which investors will subtract from its stock market valuation. These implicit environmental liabilities reflect environmental costs and losses which the finn is expected to incur, but which are not yet accounted for in its financial statements.
Results from a three-industry sample suggest that market participants assess implicit environmental liabilities to pulp and paper firms, chemicals, and oil refiners. The more these firms pollute, the greater the extent of their implicit environmental liabilities. Weaker evidence is provided for steel, metal and mining firms. © 1997 Elsevier Science Inc.
1. Introduction
In recent years, individual and institutional investors have b e c o m e increas- ingly conce rned about corpora te pollution. Their concerns result f rom enhanced social awareness and a realization that a firm's envi ronmenta l
Address correspondence to: Professor Michel Magnan, HEC-Montr6al, Department of Accoun- tancy, 3000, Cbte Ste. Catherine, Montr6al, Qu6bec, Canada H3T 2A7; E-mail: michel.magnan@ hec.ca.
Journal of Accounting and Public Policy, 16, 215-241 (1997) © 1997 Elsevier Science Inc. 655 Avenue of the Americas, New York. NY 10010
0278-4254/97/$17.00 PII S0278-4254(97)00002-1
216 D. Cormier and M. Magnan
performance is likely to result in costly sanctions I or penalties which will affect its future financial performance. In such a context, traditional financial statements may not adequately capture the financial conse- quences of a firm's environmental management. In addition, the level of disclosure in financial statements may not be sufficient for stockholders and other stakeholders to reasonably assess a firm's environmental risk (Rubinstein 1989, pp. 30-34).
These perceived deficiencies may undermine the value and usefulness of accounting information. Moreover, the emergence of ethical investors creates an additional demand for environmental reporting by firms which want to broaden their shareholders' base; the creation of a comprehensive database on the environmental performance of Standard and Poor's 500 firms by the Investor Research Responsibility Center (IRRC) illustrates that trend. IRRC itself is sponsored by institutional investors who are concerned as to how firms acquit themselves of their social responsibilities (IRRC 1992, p. iv). The need to take into consideration a firm's pollution record thus provides accountants with considerable challenge (Owen 1992, pp. 3-26). For instance, reliable measures of a firm's overall environmental performance have yet to be developed or standardized. Furthermore, a model which would formalize the relationship between a firm's environ- mental performance and its market value or its level of business risk does not yet exist.
The object of our paper is twofold. First, the adequacy of current financial statements in reflecting a firm's environmental condition is as- sessed. For that purpose, a corporate pollution measure which proxies for a firm's environmental performance, with government standards being used as a benchmark, was developed. The incremental informational content of the pollution measure over financial statements in explaining a firm's stock market value was then inferred from a cross-sectional valua- tion analysis. Second, the empirical model allows environmental liabilities to differ across industries, as the impact of a firm's environmental perfor- mance on its market valuation may differ across industries as a result of socio-political considerations.
Overall, our results indicate that a firm's poor environmental perfor- mance reduces its stock market valuation, thus implying the existence of implicit environmental liabilities. We found weak evidence that the valua- tion impact of corporate pollution is conditional upon a firm's industry, pulp and paper firms and chemical and oil refiners being penalized more severely for poor environmental performance than steel, mining and metals firms.
1 A n increase in thei r legal exposure is a major de t e rminan t of firms' env i ronmenta l decisions, as they can be sued or fined for the release of pol lu tants if " t he i r presence in the env i ronment may affect the qual i ty of life, the heal th , the safety or the well-being h u m a n s . . , or may cause damage to vegetat ion, an imal life or p rope r ty" (Env i ronment Qual i ty Act ( Q u r b e c ) 1981, Art . 20).

Assessment of Environmental Liabilities 217
Our paper is structured as follows. The next section reviews the empiri- cal evidence on the existence of a relation between environmental perfor- mance and a firm's stock market valuation. The following section briefly presents the regulatory context faced by Canadian firms and discusses the nature of implicit environmental liabilities. The next section presents the empirical model and the study's sample. The following section reports the results and the final section discusses the implications for accounting standard-setting and disclosure regulations.
2. The Relation between Environmental Performance and Firm Valuation
Prior to asserting that financial statements should be adapted to reflect the economic and financial consequences of a firm's environmental perfor- mance, it would be appropriate to assess the usefulness for investors of social and environmental information. Because the existence of a relation between environmental performance and firm stock market valuation is a key underpinning of our paper, a brief overview of the empirical evidence on the magnitude of stock market reactions to social information releases is presented to lay the groundwork for our paper's hypothesis. Prior studies can be regrouped into the following three broad categories: (1) the stock market impact of environment-related disclosures; (2) consideration of how financial performance attributes relate to a firm's environmental performance; and (3) a more recent stream of studies that build upon the existing literature, but from an accounting identity perspective, with the view of assessing the usefulness of financial statements.
2.1 Environmental Disclosure and the Stock Market
Belkaoui (1976, p. 44) found that disclosure of pollution control expenses by a firm improved its stock market performance. Ingrain (1978, pp. 282-283) showed that stock market reactions to voluntary social informa- tion disclosures (e.g., environmental, fair business, and community an- nouncements) vary according to firm and industry characteristics. These results imply that a cross-sectional design is possibly misspecified for empirical investigations.
Shane and Spicer (1983) showed that firms, the pollution performance of which was cited by the Council for Economic Priorities, 2 experienced a
2 The Council for Economic Priorit ies (CEP) has been a leading force in ethical investments research for about 20 years. I ts purpose is to research, collate and publicize the facts behind corporate and government programs to reveal how they affect people. CEP has now produced over 100 publicat ions covering issues such as air and water pollution, occupational safety, nuclear energy, toxic waste disposal, mil i tary spending and armaments . The CEP's funding is provided by ethical funds organizations (Owen 1992, pp. 245-246).
218 D. Cormier and M. Magnan
drop in their stock price which was conditioned by their pollution record. Freedman and Jaggi (1986) studied the impact of corporate pollution disclosures on security returns. They (1986, p. 200) used 10-K reports to compute pollution indicators. They (1986, p. 207) did not find any stock market reaction to the release of pollution information contained in the 10-K.
Maloney and McCormick (1982) argued that, by raising the amount of capital needed by potential entrants into an industry, strict environmental regulations constitute a barrier to entry which hinders competition. There- fore, existing producers' output prices and profits may be enhanced (Malo- ney and McCormick 1982, pp. 121-122). Results are consistent with their hypothesis (1982, 116): the confirmation by the Supreme Court of the United States that a restrictive regulation on cotton dust emissions was actually valid was found to be accompanied by a rise in the stock market price of textile firms, even after controlling for common industry factors. Porter and Van der Linde (1995) also observed that strict environmental regulations can be a barrier to entry to new competitors in an industry, thus actually helping the firms targeted by regulations.
Hughes et al. (1986) revisited the impact of the U.S. Supreme Court decision on the cotton dust emissions standard, initially investigated by Maloney and McCormick (1982). Hughes et al. (1986) posited that the effect of a pollution regulation on a firm's stock market value depends upon firm-specific characteristics such as cotton use and scale economies. They (1986, pp. 32-33) also analyzed all the events leading to the U.S. Supreme Court decision from its impact on the likelihood that the stan- dard would be upheld (1986, pp. 42-43). Overall, Hughes et al. (1986, p. 58) found no strong evidence of value enhancement following the enactment of more restrictive environmental standards, thus not confirm- ing Maloney and McCormick's (1982) initial findings.
Freedman and Stagliano (1991, p. 76) assessed if a firm's environmental disclosure policy influences the magnitude of the stock market reaction to an environmental event which has negative financial implications, in this case, a U.S. Supreme Court decision confirming a restrictive cotton dust emissions standard. On average, textile firms' stock prices declined follow- ing the decision (Freedman and Stagliano 1991, p. 76), a result which is consistent with Hughes et al. (1986, pp. 51-52). Moreover, Freedman and Stagliano (1991, pp. 78-80) found that the extent of the decline was influenced by a firm's disclosure prior to the decision. For instance, firms with extensive disclosure experienced a smaller decrease in their stock price than less transparent firms (see Freedman and Stagliano 1991, pp. 78-80).
Blacconiere and Patten (1994) examined the market reaction of chemi- cal firms following the Union Carbide chemical leak in Bhopal during 1984. Their (1994, p. 368) evidence indicated that a significant negative intra-industry reaction occurred for firms other than Union Carbide.
Assessment of Environmental Liabilities 219
However, firms with more extensive environmental disclosures in their financial report prior to the catastrophe experienced a less negative reaction than firms with less extensive disclosures (Blacconiere and Patten 1994, pp. 372-373). This would suggest that investors interpreted such disclosures as a positive sign of the firm's ability to manage its exposure to future regulatory costs (Blacconiere and Patten 1994, p. 375).
In a similar vein, Muoghalu et al. (1990, pp. 362-363) and Little et al. (1995, p. 389) showed that public announcements of lawsuits against U.S. firms not complying with environmental regulations caused significant drops in their stock prices. In contrast, Lanoie and Laplante (1994, pp. 666-670) found that environmental lawsuit announcements did not cause Canadian stockholders to react. However, Canadian firms involved in suit settlements experience a significant drop in their stock prices on the day of the announcement (Lanoie and Laplante 1994, pp. 666-670). Moreover, Little et al. (1995, pp. 390-391) observed more negative abnormal returns for the day preceding public announcement for firms which did not report the information in their annual report ( -1 .27% compared to -0 .98% for firms which did report the information in their annual report).
In summary, empirical evidence provides support for the existence of a relationship between environmental stewardship and firm value--news of poor environmental performance leading to declines in affected firms' stock market values. Moreover, the less environment-related information disclosed prior to bad news, the greater the stock-price decline.
2.2 Firm Performance and Corporate Pollution The first study to test the existence of an association between pollution and economic performance was conducted by Bragdon and Marlin (1972). For a sample of pulp and paper firms, they (1972, pp. 14-17) found a positive relation between pollution control and economic performance. Pollution performance is based on a classification of U.S. firms done by the CEP. Bragdon and Marlin (1972, pp. 14-17) used earnings per share, return on equity and return on investment as proxies for economic performance. In addition to accounting measures, Spicer (1978, p. 100) included some market variables in his study. He (1978, pp. 105-106) concluded that firms with better pollution control records tend to have greater profitability, a larger size and a higher price/earnings ratio than firms with poorer pollution control records. However, no inferences about causality can be drawn from either the Bragdon and Marlin (1972) study or the Spicer (1978) study.
Jaggi and Freedman (1992) examined the short term association be- tween pollution performance and economic and market performance of pulp and paper firms. They (1992, pp. 703-704) developed a pollution index based on pollution reports filed with the U.S. Environmental Protec- tion Agency (EPA). The "economic performance" indicators selected
220 D. Cormier and M. Magnan
were: net income, return on equity, return on assets, cash flow to equity and cash flow to assets (Jaggi and Freedman 1992, pp. 706-708). "Market performance" was measured by systematic risk and the price/earnings ratio (Jaggi and Freedman 1992, pp. 706-708). To measure the pollution level, Jaggi and Freedman (1992, pp. 706-708) developed an index by combining three different pollutants: biochemical oxygen demand (BOD), total suspended solids, and pH water acidity-alkalinity. Pearson correlation analyses indicated that net income and price/earnings ratios are nega- tively associated with pollution performance (Jaggi and Freedman, 1992, pp. 707-709). According to Jaggi and Freedman (1992, p. 709), if investors have a short-term interest in the firm, their reaction to pollution control might be negative because of the expected negative economic impact of the additional investments. Such a view is in contradiction with classical finance-based valuation models which assume rational investors and unbi- ased discounting of a firm's future cash flows (dividends) (e.g., Hand 1990). However, recent empirical findings suggest that market participants may exhibit functional fixation on accounting numbers, which could explain a short term focus (Harris and Ohlson 1990; Bernard and Stober 1989; Tinic 1990). Furthermore, the reliance of Jaggi and Freedman (1992, p. 706) on univariate statistical tests and on a small sample size (11 firms) is a limitation.
In an extension of Jaggi and Freedman (1992), Freedman and Jaggi (1992) evaluated the long-term relationship between pollution perfor- mance and economic performance (return on equity, return on assets, cash flows to assets, cash flows to equity and debt to equity) by examining the association between the percentage change in pollution measures and accounting ratios over periods of six and nine years (Freedman and Jaggi 1992, pp. 322-324). First, the change in each pollution measure (BOD, TSS, pH) over a nine-year period, i.e., 1978-1986 for three different dates, 1978, 1983 and 1986, was correlated with the change in each of the five ratios over the same period for the firm as a whole and for a sample of 13 firms (in the preceeding study, an overall pollution index was used). Relying on Spearman rank correlations, Freedman and Jaggi (1992, pp. 327-330) could not reject the null hypothesis of no correlation between pollution and long-term economic performance. In our opinion, as long- term economic performance is a multi-dimensional phenomenon, the fact that Freedman and Jaggi, (1992) only performed univariate tests is a limitation of their study.
2.3 Environmental Liabilities and the Balance Sheet
In an attempt to assess how investors value environmental liabilities, Barth and McNichols (1994, p. 192) first developed superfund liability estimates and computed a firm-specific liability according to its number of superfund

Assessment of Environmental Liabilities 221
sites. Then, Barth and McNichols (1994, pp. 198-199) examined whether firms' share prices reflected these estimates of environmental liabilities in addition to those already recognized in financial statements and, if so, which measures best corresponded to investors' assessments. Five mea- sures were estimated to proxy for environmental liabilities (Barth and McNichols 1994, p. 196). They (1994, p. 205) concluded that market participants assessed environmental liabilities to be in excess of the amount recognized by sample firms in their financial statements. Moreover, Barth and McNichols 1994, p. 180) suggested a proxy measure which used no information about capital cost (e.g., the number of times a firm was named as a potentially responsible party for Superfund sites) and which per- formed well relative to capital-cost based proxies, thus suggesting that the market's assessment of a company's environmental liability was crude, or that their cost-based proxies were noisy.
Relying on a valuation model similar to the one used by Barth and McNichols (1994, p. 193) and on a new environmental database put together by the IRRC, Johnson et al. (1996) found evidence that fines and penalties are but a small fraction of total costs associated with noncompli- ance. Furthermore, Johnson et al. (1996) suggested that the general toxicity of a firm's operations (waste cleanup responsibilities, legal releases of toxic chemicals and penalties) would be valuation relevant in assessing its future environmental obligations, irrespective of its current regulatory compliance status.
Finally, Cormier et al. (1993) investigated the relationship between a firm's pollution performance (measured by the relative level of water pollution) and its total stock market valuation (in Canadian dollars). The measure used by Cormier et al. (1993, p. 142) was based on water pollution information reported by environmental agencies. Results suggest that a firm's pollution level negatively affects its stock market value. Our paper extends Cormier et al. (1993) by: (1) encompassing a longer time period (six years instead of three years); (2) investigating if the impact of corpo- rate pollution on market valuation varies across industries and by conduct- ing industry-specific analyses; (3) taking into consideration in the research design the potential existence of time effects on firm valuation (through year-specific dummy variables in pooled cross-sectional OLS regressions and year-specific regressions); (4) assessing the sensitivity of the results using alternative pollution measures; (5) relying on a valuation model which includes a firm's balance sheet accounts as well as its profitability (EPS); and (6) performing statistical tests, e.g., Z tests on the results from year-specific regressions, which further validate the robustness of reported results.
Overall, the empirical evidence from the above mentioned studies supports the existence of a positive relation between environmental perfor- mance and firm stock market valuation, with deteriorating pollution per-

222 D. Cormier and M. Magnan
formances usually being associated with stock market value declines. Investors appear to infer that because of its pollution performance, a firm will bear various costs which will reduce its value. Such costs include direct expenses such as legal fees and damage assessments, as well as indirect expenses such as higher maintenance and pollution control costs (e.g., Barth and McNichols 1994, pp. 186-193). Moreover, the liquidation value of a firm is reduced by any additional clean-up and land-reclaiming expenses. 3 These results indicate that social information disclosure is valuable for market participants, as it seems to be used in revising a firm's valuation. How environmental costs map into implicit environmental liabil- ities will be discussed in the next section, which will also provide some information about the potential extent of implicit environmental liabilities faced by Canadian firms.
3. Implicit Environmental Liabilities
3.1 Regulatory Environment in QuJbec and Ontario Although results from various empirical studies (e.g., Barth and McNi- chols, 1994) relying on U.S. data suggest that a firm's environmental performance is valuation relevant, there is still a need to present prima facie evidence that Canadian firms actually face implicit environmental liabilities. A first step is to identify conditions or situations from which environmental liabilities may arise. In Canada, both the federal and provincial governments are involved in environmental issues. Prior to 1992, the federal government's involvement was mostly through the Fisheries Act (1970) which, among other things, mandated allowable discharges of biochemical oxygen demand and total suspended solids. 4 Both the QuEbec and Ontario provincial governments have enacted comprehensive environ- mental quality acts (with accompanying regulations) encompassing water, air and soil pollution. For instance, QuEbec and Ontario environmental
ministries can: (1) issue orders to stop operations at a given site; (2) clean up a site and claim costs to the firm which is deemed responsible or, (3) order a firm to fix a discharge problem within a limited time frame. (Environment Quality Act, QuEbec 1981; Environmental Protection Act, Ontario 1980).
3See Whyte (1992, p. 4) for a description of the potential valuation impact of environmental laws. 4Following the period under investigation (1986-1991), the federal government enacted the
Canadian Environmental Protection Act (1994)which required the virtual elimination of dioxin and furan from industrial plant effluents by 1994. More recently, provincial governments in Ontario and Qu6bec have adopted standards when ask for substantial reductions in absorbable organic halides (AOX) discharges before the end of the century (Mittelstaet, and Mahood 1993, B-7). It must be noted that the elimination in dioxin and furan discharges required by Canadian federal regulations has the practical effect of reducing AOX discharges (Mittelstaet and Mahood 1993, B-7).

Assessment of Environmental Liabilities 223
To summarize, current Canadian environmental laws and regulations can be regrouped into three broad categories (Laplante 1995, pp. 91-99):
o Compliance regulations which enjoin firms to limit their discharges of pollutants. Failure to respect these regulations may result in fines and penalties (Laplante 1995, p. 96);
• Remediation environmental laws which allow ministry officials to im- pose sanctions enjoining firms to correct situations which are deemed to be detrimental to the environment. Three examples illustrate this type of regulation. First, firms with plants which consistently exceed pollutant discharge guidelines may be forced to either (a) shut down the plant permanently or (b) correct the situation by replacing the defective equipment or installing new equipment. Sanctions must be acted upon within a specific number of days (Laplante 1995, p. 99). Second industrial or commercial sites' purchasers must obtain operat- ing permits from environmental officials in order to pursue production at a specific site; if criminal negligence can be proven, a firm's executives or directors (both groups being broadly defined) may be sentenced to prison terms (Laplante 1995, p. 99). Third, mining sites must be reclaimed and returned to their original state (Laplante 1995, p. 99);
• Preventive environmental regulations which require new plants or installations to meet specific discharge and technical standards in order to be allowed to go into production (Laplante 1995, p. 94).
3.2 E n v i r o n m e n t a l Costs
From an accounting perspective, the Canadian Institute of Chartered Accountants (1993, p. 12-13) has identified two types of environmental costs which may lead to potential environmental liabilities: (1) "costs resulting from environmental actions" (e.g., prevention, reduction and repair of environmental damages, resource conservation efforts) and, (2) "environmental losses" (e.g., fines, penalties, awards from lawsuits, costs which will not have lasting economic benefits). The following exam- ples illustrate the potential monetary magnitude of such environmental costs:
Compliance costs are currently estimated at $150 million. The deadline for compliance under Quebec regulations is October 1, 1995 and under Ontario regulations is December 31, 1995. (Abitibi-Price Inc. 1993, footnote, 1, p. 33).
The Federal, Qurbec and Ontario governments have adopted new environ- mental regulations that apply to Domtar's pulp and paper and packaging facilities . . . . Domtar estimates that it will need to make approximately $335

224 D. Cormier and M. Magnan
million in additional capital expenditures to comply with the pulp and paper and packaging environmental regulations. (Domtar Inc. 1993, footnote 11, p. 22).
Failure to comply to control order deadlines may result in fines, penal- ties, and potential plant shutdowns for these firms. Moreover, the value of a firm's production assets which do not comply with future environmental regulations may be seriously impaired. Such environmental costs are unlikely to be reflected in financial statements, as they do not meet Canadian generally accepted accounting principles criteria for being recog- nized as liabilities. With respect to fines and penalties, articles 20, 21, 22 and 31.1 of the Qu6bec Environment Quality Act (1981) prescribe that they may reach as much as $1,000,000 for pollutant releases (second offense). Ontario and federal regulations have similar attributes (Environ- mental Protection Act (Ontario), R.R.O. 1980; Canadian Environmental Protection Act 1994). Moreover, criminal procedures can be launched against a firm's managers and top executives if their actions (or inaction) may have contributed to an environmental infraction (see for example, Haggett 1992, p. 16).
Although fines of $1 million (Canadian) may seem large in absolute terms, they may be immaterial for billion-dollar firms. However, Karpoff and Lott (1993, pp. 758-759) suggest that firms may internalize pollution costs to a much larger extent than the amount of the fine would suggest. The empirical evidence of Karpoff and Lott (1993, p. 797) indicated that the amount of a criminal fine paid by a firm (and related legal fines) typically represents only 6.5% of the stock market loss associated with its disclosure. Karpoff and Lott (1993, pp. 782-784) also suggested that when evaluating the economic impact of a fine, stock market investors consider that the firm may face lower output prices, higher input prices, or may have difficulty in building or relocating plants, because of their criminal activities or their pollution record. Karpoff and Lott (1993, p. 786) labeled this phenomenon the "reputational penalty."
In light of the above discussion, we expect that the worse (better) a firm's pollution record, the greater (smaller) will be the amount of implicit environmental liabilities reducing its stock market valuation.
4. Empirical Model
4.1 Data Description and Identification of Sample Firms Firms cited in annual compliance reports published by the Department of Environment of the provinces of Ontario and Qu6bec as well as by the Canadian federal govemment from 1986 to 1993 constitute the population of water polluters for which pollution data is publicly available (Environ-
Assessment of Environmental Liabilities 225
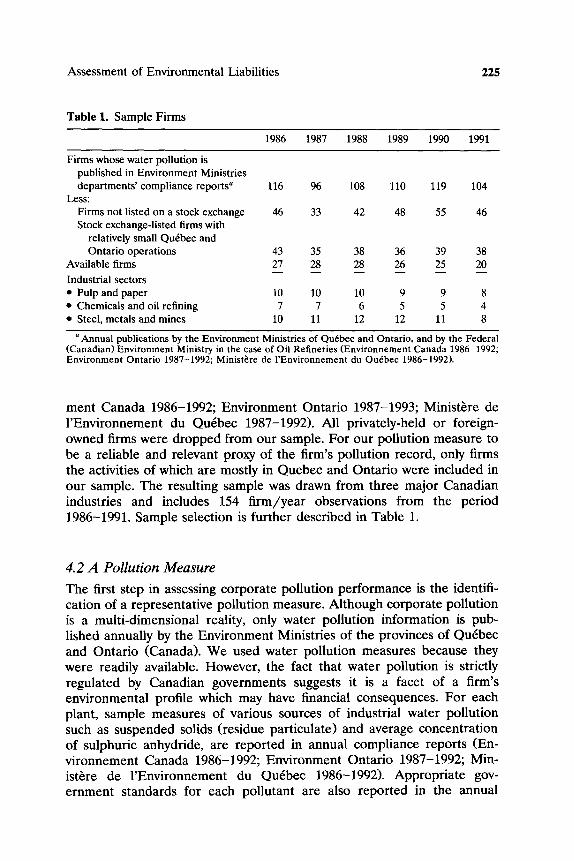
Table 1. Sample Firms
1986 1987 1988 1989 1990 1991
Firms whose water pollution is published in Environment Ministries depar tments ' compliance reports a 116 96 108 110 119 104
Less: Firms not listed on a stock exchange 46 33 42 48 55 46 Stock exchange-listed firms with
relatively small Quebec and Ontario operations 43 35 38 36 39 38
Available firms 27 28 28 26 25 20
Industrial sectors • Pulp and paper 10 10 10 9 9 8 • Chemicals and oil refining 7 7 6 5 5 4 • Steel, metals and mines 10 11 12 12 11 8
a Annual publications by the Environment Ministries of Qu6bec and Ontario, and by the Federal (Canadian) Environment Ministry in the case of Oil Refineries (Environnement Canada 1986-1992; Environment Ontario 1987-1992; Minist~.re de l 'Environnement du Qu6bec 1986-1992).
ment Canada 1986-1992; Environment Ontario 1987-1993; Minist~re de l'Environnement du Qu6bec 1987-1992). All privately-held or foreign- owned firms were dropped from our sample. For our pollution measure to be a reliable and relevant proxy of the firm's pollution record, only firms the activities of which are mostly in Quebec and Ontario were included in our sample. The resulting sample was drawn from three major Canadian industries and includes 154 firm/year observations from the period 1986-1991. Sample selection is further described in Table 1.
4.2 A Pollution Measure
The first step in assessing corporate pollution performance is the identifi- cation of a representative pollution measure. Although corporate pollution is a multi-dimensional reality, only water pollution information is pub- lished annually by the Environment Ministries of the provinces of Qu6bec and Ontario (Canada). We used water pollution measures because they were readily available. However, the fact that water pollution is strictly regulated by Canadian governments suggests it is a facet of a firm's environmental profile which may have financial consequences. For each plant, sample measures of various sources of industrial water pollution such as suspended solids (residue particulate) and average concentration of sulpburie anhydride, are reported in annual compliance reports (En- vironnement Canada 1986-1992; Environment Ontario 1987-1992; Min- ist~re de l'Environnement du Qu6bec 1986-1992). Appropriate gov- ernment standards for each pollutant are also reported in the annual

226 D. Cormier and M. Magnan
compliance reports. To obtain a pollution measure which allows inter-firm comparisons, waste water discharge summaries about each industry's most salient pollutant were computed for each sample firm.5 The pollution measure was computed using a formula developed in Cormier et al. (1993, p. 142):
Pollution
Y'~ Regulation
where:
= sum over total number of plants operated by a given firm, weighted according to a single plant's relative water flowthrough;
Pollution = plant-specific pollution level for a given flowthrough of discharged water, as reported by the environmental departments;
Regulation = plant-specific pollution level for a given flowthrough of discharged water, which is allowed under Ontario, Qu6bec, or Cana- dian regulations.
Thus, the smaller (greater) a firm's pollution, the more (less) closely it conforms to anti-pollution standards. In a manner consistent with Cormier et al. (1993, p. 142), the pollution measure was computed using the following industry-specific pollutants: (1) "biochemical oxygen demand (BOD) (kg per 5 days)" for paper and pulp firms and (2) "average daily concentration of suspended solids" (kg per day) for both oil refining and chemical firms, and for metals, steel, and mining firms (Cormier et al. 1993, p. 142). Further, in a manner consistent with Cormier et al. (1993, p. 142) in selecting the measures of water pollution, the following were considered: (1) every company in an industry had consistent disclosure of the measure; (2) every company in our sample had sufficient disclosure of the water pollution measure so that yearly averages existed; and (3) a reported government standard existed (Cormier et al. 1993, p. 142).
The fact that discharges for both pollutants were consistently measured, were compared against specific regulations, and were publicly reported, is indicative of their importance in evaluating a firm's environmental perfor- mance. Hence, it is posited that each pollutant considered for our study may expose a firm to implicit environmental liabilities. Moreover, relying on a relative pollution measure (actual pollution/allowed pollution), and not on actual pollution, to proxy for a firm's environmental performance may attenuate any potential bias resulting from the reliance on a single
5 In o rde r to assess the resul t ' s sensitivity, the pol lut ion measu re was also c o m p u t e d using only plants within a firm which exceeded al lowed water discharge levels (i.e., pol luted more than governmen t regula t ions permit) . The change in pollut ion measure did not affect implicit liabilities' inferences.
Assessment of Environmental Liabilities 227
pollutant. Furthermore, at this exploratory stage, and taking into account the extent of current knowledge about green accounting, a one-dimen- sional pollution measure, relying on few assumptions, seemed acceptable.
However, focussing on water pollution limits the scope of the investiga- tion, as environmental performance is much broader than water pollution (e.g., forest management by pulp and paper firms, air emissions by smelters and refineries). Another problem with studies based on plant-level pollu- tion performance is that the economic consequences at the firm level might be masked b y the economic performance of other business units which may have no relationship to pollution performance of a particular plant (Freedman and Jaggi 1994, p. 34). However, all sample firms had a sizable proportion of their operations (number of operating plants) in Qu6bec and Ontario, which ensures the relevance of the environmental performance computed according to compliance reports issued by the governments of these jurisdictions.
4.3 Valuation Model
Whereas most studies which have attempted to assess the relation between environmental performance and stock market valuation have used an abnormal returns approach (see Barth and McNichols 1994 for a discus- sion of that issue), our study relies on a cross-sectional valuation approach which is directly derived from the accounting identity. As such, results from our study can be of relevance to accounting standard-setters, busi- ness valuators and investors in general. A valuation approach can have many methodological advantages for an accounting researcher, as it par- tiaUy controls for other financial information which could be disclosed during the same period and provides direct inferences about the market premium assigned to corporations with good social performance.
Furthermore, because the diffusion of pollution information is not strictly under the control of reporting corporations, event studies are a low power tool for inferring the content of this sort of information. By attempting to define a firm's market value in terms of financial and pollution variables, a valuation approach allows for a direct assessment of the environmental information's usefulness for market valuation purposes without the need to specify a speculative event date (see Barth and McNichols 1994, pp. 193-195, for a discussion on that issue). The exact timing of the event is not as important to a valuation approach as it is to a returns approach. So long as the prices examined are from a period which dearly postdates the environmental information being impounded in prices, the identification of the exact event time and disclosure of the pollution record are not crucial (Atiase and Tse 1986, pp. 2-3).
Finally, our paper's valuation approach relies on financial statement variables and on a pollution measure. A finding that a firm's pollution
228 D. Cormier and M. Magnan
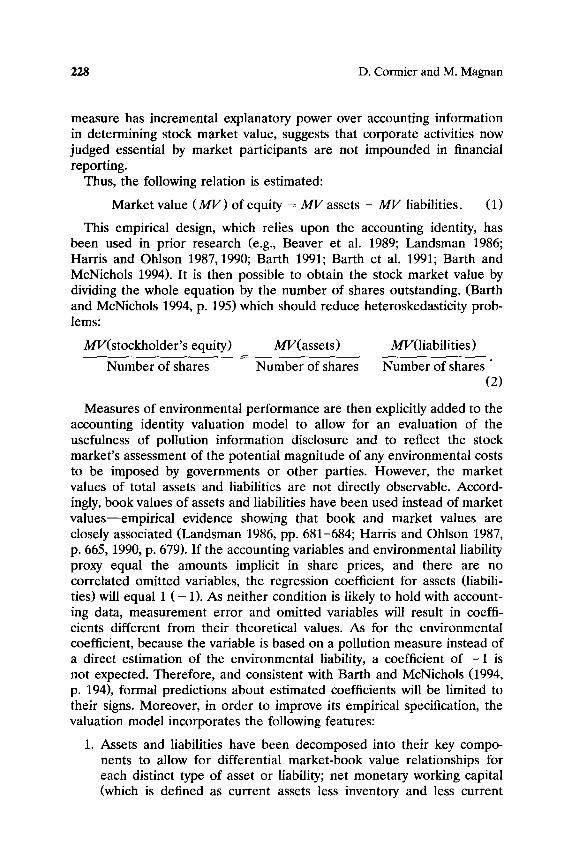
measure has incremental explanatory power over accounting information in determining stock market value, suggests that corporate activities now judged essential by market participants are not impounded in financial reporting.
Thus, the following relation is estimated:
Market value (MV) of equity = MV assets - MV liabilities. (1)
This empirical design, which relies upon the accounting identity, has been used in prior research (e.g., Beaver et al. 1989; Landsman 1986; Harris and Ohlson 1987, 1990; Barth 1991; Barth et al. 1991; Barth and McNichols 1994). It is then possible to obtain the stock market value by dividing the whole equation by the number of shares outstanding, (Barth and McNichols 1994, p. 195) which should reduce heteroskedasticity prob- lems:
MV(stockholder's equity)
Number of shares
MV(assets)
Number of shares
MV(liabilities)
Number of shares " (2)
Measures of environmental performance are then explicitly added to the accounting identity valuation model to allow for an evaluation of the usefulness of pollution information disclosure and to reflect the stock market's assessment of the potential magnitude of any environmental costs to be imposed by governments or other parties. However, the market values of total assets and liabilities are not directly observable. Accord- ingly, book values of assets and liabilities have been used instead of market values--empirical evidence showing that book and market values are closely associated (Landsman 1986, pp. 681-684; Harris and Ohlson 1987, p. 665, 1990, p. 679). If the accounting variables and environmental liability proxy equal the amounts implicit in share prices, and there are no correlated omitted variables, the regression coefficient for assets (liabili- ties) will equal 1 ( - 1). As neither condition is likely to hold with account- ing data, measurement error and omitted variables will result in coeffi- cients different from their theoretical values. As for the environmental coefficient, because the variable is based on a pollution measure instead of a direct estimation of the environmental liability, a coefficient of - 1 is not expected. Therefore, and consistent with Barth and McNichols (1994, p. 194), formal predictions about estimated coefficients will be limited to their signs. Moreover, in order to improve its empirical specification, the valuation model incorporates the following features:
1. Assets and liabilities have been decomposed into their key compo- nents to allow for differential market-book value relationships for each distinct type of asset or liability; net monetary working capital (which is defined as current assets less inventory and less current
Assessment of Environmental Liabilities 229
liabilities), inventories, fixed assets, other assets (liabilities), long term liabilities, minority interests and preferred stocks (Barth et al. 1993, p. 22, relied on an analogous procedure in their estimation of the value of pension cost components);
2. Earnings per share (EPS) has been added to balance sheet values as a proxy variable for a firm's growth potential. Prior theoretical work (Ohlson 1995; Black 1993) and empirical research (e.g., Amir 1993, pp. 705-706; Barth et al. 1993, pp. 18-19) have suggested that earnings is an essential complementary component of a balance sheet-based valuation model, as it is a dynamic indicator of value (flow) while the balance sheet is a static (stock) measure of value. Moreover, a firm with good (poor) management is likely to have both a high (low) stock market valuation and a low (high) level of pollu- tion; including earnings as an independent variable in the valuation model should capture the valuation impact of good (poor) manage- ment and attenuate the effect of any omitted variable problem.
3. In order to control for industry effect, two dummy variables (n - 1 industries) have been added to the model in an interactive form, i.e., pollution measure times dummy 1 (chemicals) and pollution measure times dummy 2 (steel). Hence, in equation (3) below, coefficient /39 captures the relationship between the pollution measure and stock market valuation for pulp and paper firms. Coefficients /310 and /311 indicate how chemicals and steel firms differ from pulp and paper firms in their relationship between the pollution measure and stock market valuation.
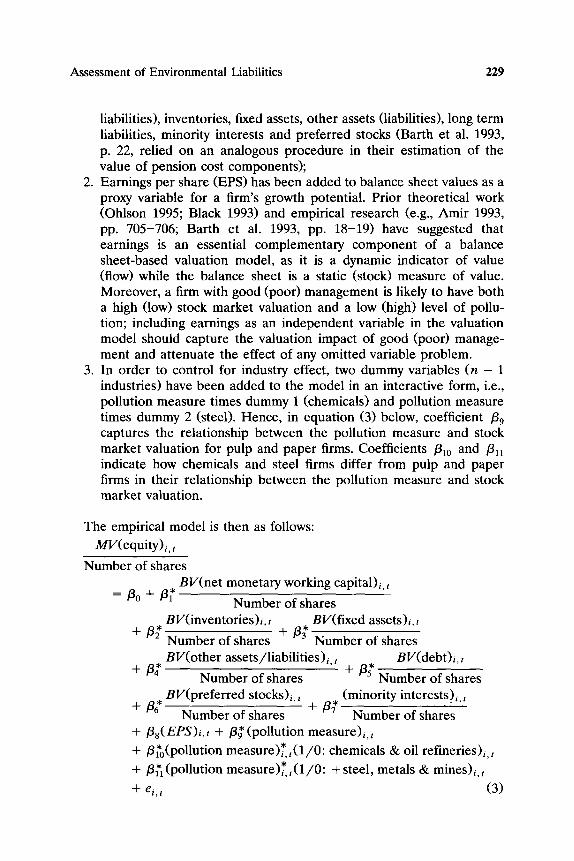
The empirical model is then as follows:
MV(equity)i, t
Number of shares BV(net monetary working capital)i, t
= /30 + /3~' Number of shares B V ( i n v e n t o r i e s ) i , t BV(fixed assets)i, t
+/3~' Number of shares + /3~ Number of shares BV(other assets/liabilities)i,t BV(debt)i, t
+/34* +/3~* Number of shares Number of shares BV(preferred stocks)i,t (minority interests)i, t
+/36* Number of shares +/3~' Number of shares + /38(EPS) i , t + /3~'(pollution measure)i,t
+ /3~'0(pollution measure)*t(1/0: chemicals & oil refineries)i,t
+ /3~'l(pOllution measure)*,(1/0: + steel, metals & mines)i,t
+ el, t (3)
2311 D. Cormier and M. Magnan
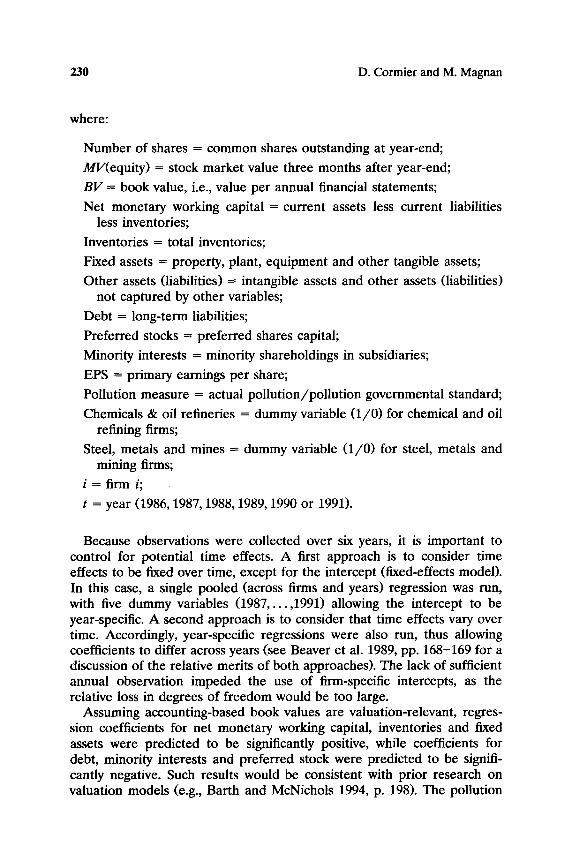
where:
Number of shares = common shares outstanding at year-end;
Ml,"(equity) = stock market value three months after year-end;
B V = book value, i.e., value per annual financial statements;
Net monetary working capital = current assets less current liabilities less inventories;
Inventories = total inventories;
Fixed assets = property, plant, equipment and other tangible assets;
Other assets (liabilities) = intangible assets and other assets (liabilities) not captured by other variables;
Debt = long-term liabilities;
Preferred stocks = preferred shares capital;
Minority interests = minority shareholdings in subsidiaries;
EPS = primary earnings per share;
Pollution measure = actual pollution/pollution governmental standard;
Chemicals & oil refineries = dummy variable (1/0) for chemical and oil refining firms;
Steel, metals and mines = dummy variable (1/0) for steel, metals and mining firms;
i = firm i;
t = year (1986, 1987, 1988, 1989, 1990 or 1991).
Because observations were collected over six years, it is important to control for potential time effects. A first approach is to consider time effects to be fixed over time, except for the intercept (fixed-effects model). In this case, a single pooled (across firms and years) regression was run, with five dummy variables (1987 . . . . . 1991) allowing the intercept to be year-specific. A second approach is to consider that time effects vary over time. Accordingly, year-specific regressions were also run, thus allowing coefficients to differ across years (see Beaver et al. 1989, pp. 168-169 for a discussion of the relative merits of both approaches). The lack of sufficient annual observation impeded the use of firm-specific intercepts, as the relative loss in degrees of freedom would be too large.
Assuming accounting-based book values are valuation-relevant, regres- sion coefficients for net monetary working capital, inventories and fixed assets were predicted to be significantly positive, while coefficients for debt, minority interests and preferred stock were predicted to be signifi- cantly negative. Such results would be consistent with prior research on valuation models (e.g., Barth and McNichols 1994, p. 198). The pollution

Assessment of Environmental Liabilities 231
coefficient (/39 ) w a s predicted to be significantly negative if implicit envi- ronmental liabilities did exist. A priori, pollution effect was not predicted to vary across industries, and the two interaction variables, which reflect interindustry differences in the relation between the pollution measure and market valuation, were expected to have a zero value. OLS regressions including and excluding outliers were used in order to properly warn the reader about the sensitivity of the results to sample characteristics. 6
5. Results
Table 2 reports the results from a pooled fixed-effects OLS regression relying on equation (3). The analysis was performed with and without outliers. The model with outliers explains a considerable proportion of sample firms' stock market values with an adjusted R 2 of 85.6% and a Fisher Snedecor statistic of 58.51 (p < .0001, two-tailed test). 7 All coeffi- cients have the predicted sign. 8
Accounting-based values for monetary working capital, inventories and fixed assets have been found to be positively related with stock market prices, thus suggesting that book values contain information which is relevant for stock market valuations purposes (e.g., Barth and McNichols 1994, pp. 189-190). The coefficient for EPS is positive, as predicted. 9 With respect to liabilities, the coefficients for long-term debt, preferred stock and minority interests are negative as predicted. 1°
The pollution coefficient (/39 - - pulp and paper industry) is negative and statistically significant (p < .005, one-tailed test). Therefore, the greater the level of pollution produced by a firm in the pulp and paper industry compared with government standards, the lower its stock market valuation. Since /310 is greater than /39 and significant (p < .077, two-tailed test), it could be inferred that the valuation implications of corporate pollution for chemicals and oil refineries firms are different than those for pulp and paper firms. The sum of/39 and /310 captures the actual relation between the pollution measure and stock market valuation for chemicals and oil refiners; its slightly positive value ( -5 .60 + 7.77 = 2.17) does not seem to suggest the existence of implicit environmental liabilities. The implicit
6 Standardized residual over 2 are considered to be large. 7An analysis of the correlat ion matrix and of variance inflation factors did not suggest the
presence of any mult icoll ineari ty problems. Durbin-Watson tests also did not indicate any serious residual autocorrelat ion problems.
s For pooled fixed-effects regressions, year-specific intercepts are not reported. 9 The analysis was performed without EPS with similar results being obtained. Furthermore, a
regression using undeflated variables provided similar evidence, with all coefficients having the same sign and comparable levels of statist ical significance.
10 Univariate pearson correlat ion statistics (not shown) indicate that the higher a firm's pollution measure, the higher its return on equity, the higher the proport ion of its assets comprising property, plant and equipment and the smaller its size (all three correlations significant at the 10% level, two-tailed).

2 3 2 D. C o r m i e r a n d M. M a g n a n
T a b l e 2. M a r k e t V a l u a t i o n R e g r e s s i o n ( O r d i n a r y L e a s t S q u a r e s E s t i m a t i o n )
Dependen t variable: Share market value
Number of shares outs tanding
Independent variables
Predicted Including outliers Excluding outliers
sign Coefficient P value* Coefficient P value*
Intercept and year-specific intercepts** 1- Monetary working
capital + 2- Inventories + 3- Fixed assets + 4- Other assets (liabilities) ? 5- Long-term debt 6- Preferred stocks 7- Minority interests 8- EPS + 9- Pollution measure
10- (Pollution measure) × (chemicals & oil refineries) ?
11- (Pollution measure) × (steel, metals & mines) ?
0.59 .001 0.90 .000 0.23 .082 0.34 .020 0.65 .000 0.83 .000
- 0.67 .000 - 0.08 .726 - 0.14 .156 - 0.56 .000 - 2.55 .000 - 2.74 .000 - 0.70 .038 - 0.64 .016
0.25 .070 0.02 .905 - 5.60 .005 - 4.72 .007
7.77 .077 1.41 .691
3.44 .100 3.40 .102
Number of observations 154 144 Adjusted R 2 85.7% 87.8% F statistic 58.51 65.54
P value (two-tailed) (.000) (.000) Durbin-Watson 2.04 2.27
* One-tailed if specific prediction, two-tailed otherwise. ** Not reported.
environmental liabilities hypothesis seems to apply to steel, metals and mining finns (/311), with the pollution measure interaction term coefficient being positive (p < .100, two-tailed test), but the sum of/39 and /311 being negative ( - 5.60 + 3.44 = - 2.16)J l
Table 2 also presents results excluding outliers, with quite similar evidence being provided. Among notable differences, the coefficient for monetary working capital increased from 0.59 to .90, which is a more realistic figure considering the liquid nature of these assets. In addition, the coefficient for long-term debt is now much closer to -1 .0 ( - . 5 6 vs -.14). The relationship between the pollution measure and market valua- tion is negative and statistically significant (p < .007, one-tailed test) for pulp and paper firms. The coefficient for chemicals and oil refineries is not
11 The analysis was also performed with industry-specific intercepts. Coefficients for these dummy variables were not statistically significant at conventional levels.
Assessment of Environmental Liabilities 233
statistically different from 0 (p < .691, two-tailed test), thus indicating that the impact of corporate pollution on market valuation for firms in that industry is not different from the relationship found for pulp and paper firms. As for steel, metals and mining firms, the coefficient for the pollution measure is positive, but not statistically significant at conven- tional levels. However, the sum of/39 (pulp and paper coefficient) and /311 (differential effect of steels) is now negative at - 1.32 ( - 4.72 + 3.40). This suggests that implicit environmental liabilities still seem to exist for steel, metals and mining firms, but at lower levels than pulp and paper firms. The political exposure which pulp and paper firms and chemical and oil refining firms faced over the last decade could explain the association between their pollution level and market valuation. For instance, pulp and paper firms have been subjected to harsh criticisms in the Canadian media for their environmental management practices (Lajoie 1990, pp. 2-5).
There is a weak indication, based upon regression results, that the economic consequences of a firm's pollution performance are found to be interpreted differently by investors depending on the firm's industrial sector, with pulp and paper firms as well as chemicals and oil refineries firms being affected the most. The magnitude of environmental liabilities needs to be highlighted, e.g., for pulp and paper firms: a rise of 1 (from 1.0 to 2.0) in the pollution measure implies an average decrease of $ - 5.60 in stock market value per share. This figure is to be compared with the sample's average stock price of $24.18.
Table 3 presents comparative results from separate regressions for each year from 1986 to 1991, and from the pooled fixed-effects regression shown on Table 2. Two Z statistics 12 were computed to test the significance of the separate year t-statistics. These tests confirmed the evidence from the pooled fixed-effects regression; that is, the greater a firm's pollution performance, the greater the extent of its implicit environmental liabilities. Moreover, Z statistics do not point towards strong inter-industry differ- ences in the valuation of implicit environmental liabilities, the interaction term coefficient not being statistically significant at conventional levels for chemicals and oil refiners and for steel, metals and mining firms.
Table 4 presents complementary direct evidence on the statistical signif- icance of the relation between the pollution measure and stock market valuation for firms from each industry. In order to obtain direct estimates of the relation between the pollution measure and stock market valuation for each industry, the regression shown in equation (3) was computed three times, with a different industry being used as benchmark each time.
12Z1 assumes independence of the es t imated t-statistics. See Hea ly et al. (1987, p. 17) for the c o m p u t a t i o n of Z1 test statistic. W h e n the pa r ame te r s are not independen t across years, Z1 statistics are likely to be overs ta ted (Bar th and McNichols 1994, p. 200). Z2 , which relaxes the independence assumpt ion, is compu ted as no ted in Bar th and McNichols (1994, p. 200).

234 D. Cormier and M. Magnan
Table 3. Market Valuation Regressions Separate Years versus Fixed Effects
D e p e n d e n t var iable: Share m a r k e t va lue
S e p a r a t e - y e a r regress ions
Fixed effects
regress ion
( including out l iers)
I n d e p e n d e n t P red ic ted M e a n p
var iables sign Coeff icient* ( t ) Z1 Z 2 Coeff ic ient** va lue***
1- M o n e t a r y work ing
capi tal + 1.23 2.21 4.57 2.54 0.59 .000
2- Inven to r i e s + 1.07 1.68 3.76 2.51 0.23 .082
3- Fixed assets + 0.61 2.90 7.06 8.18 0.65 .000
4- O t h e r assets
(liabilities) ? 0.04 - 0.25 - 0.48 - 0.23 - 0.67 .000
5- L o n g - t e r m deb t - - 0 . 7 1 1.11 - 1.34 - 1.01 - 0 . 1 4 .156
6- P r e f e r r e d stocks - - 2.66 - 1,90 - 4.28 - 4.14 - 2.55 .000
7- Minor i ty in teres ts - - 0.01 - 0.27 - 0.66 - 0.59 - 0.70 .038
8- EPS + 1.35 1.03 2.31 4.74 0.25 .070
9- Pol lut ion m e a s u r e - - 6.43 - 1.35 - 3.06 - 1.97 - 5.72 .005
10- (Pol lut ion
m e a s u r e ) x
(chemica ls & ? - 1.25 - 0 . 0 3 - 0 , 1 2 - 0 . 0 4 7.65 .077
oil ref iners)
11- (Pol lu t ion
m e a s u r e ) × ? 2.55 0.64 1,43 1.33 3.52 .100
(steel, me ta l s &
mines )
A d j u s t e d R 2 87.7% 85.6%
F statistic, P va lue (.000) (.000)
* Intercept not reported. ** Intercept and year-specific intercepts not reported. *** One-tailed t test if prediction, two-tailed otherwise. Z1 and Z2 tests allow inferences to be made about the statistical significance of year-specific
regression coefficients over the period 1986-1991: Z = 1.65 (p < 0.10), two tailed Z = 1.96 (p < 0.05), two tailed Z = 2.57 ( p < 0.01), two tailed
Overall, results confirm earlier evidence presented in Tables 2 and 3. For instance, relying on pooled cross-sectional regressions, the relation be- tween the pollution measure and stock market valuation was negative and statistically significant for pulp and paper firms ( -5 .6 0 ; p < 0.005, one- tailed test), as well as for steel, metal and mining firms ( -2 .2 0 ; p < 0.06, one-tailed test). The relation was not statistically significant for chemical and oil refineries (1.93; p < 0.688, one-tailed test). Results from year- specific regressions, which are less sensitive to outliers, suggest that there is a negative relation between the pollution measure and stock market valuation for firms from all three industries, with statistical significance at conventional levels obtained for pulp and paper as well as for chemicals

Assessment of Environmental Liabilities 235
Table 4. Direct Evidence of the Industry-Specific Relation between the Pollution Measure and Stock Market Valuation
From pooled From year-specific
Predicted cross-sectional analysis regressions
Industry sign Coefficient P value* Coefficient P value**
Pulp and paper - - - 5 . 6 0 .005 - 6 . 4 3 .005 Chemicals and oil - - 1.93 .688 - 7 . 3 6 .050 refineries Steel, metals and mines - - - 2.20 .060 - 3.56 .150
* P value from one-tailed t test. **P value from one-tailed Z l test.
and oil refiners. Overall, results from Table 4 are consistent with evidence from year-specific and pooled cross-sectional (without outliers) regressions, and suggest that interindustry differences are, at best, minimal.
6. Concluding Remarks The objective of this study was to assess if a firm's stock market valuation impounds information about its environmental performance. Environmen- tal performance was measured using actual water pollution relative to government-allowed pollution levels. We found that a firm's pollution performance was negatively related to its market valuation, thus suggesting the existence of implicit environmental liabilities which are not currently accounted for in the balance sheet. Thus, results are consistent with the evidence reported in Cormier et al. (1993, pp. 148-150). Moreover, results also weakly suggest that inter-industry differences in the magnitude of implicit environmental liabilities may exist. As financial statements, in their current form, might not adequately reflect a firm's environmental performance, accounting standard-setters might consider three issues which are discussed next.
First, standard-setters could consider expanding the portion of the management discussion and analysis report devoted to environmental issues. For example, the discussion on financial obligations and capital structure could be broadened to reflect the fact that poor environmental performance may bring a firm to allocate resources in order to remedy the situation. These outflows may take various forms (e.g., fines, penalties, loss of reputation, new equipments, lawsuits, remedial expenditures) but share a common characteristic in that they reduce the firm's future discretionary cash flows. Thus, effort needs to be expended in order to define and standardize environmental performance measures and the possible out- comes resulting from poor environmental management.

236 D. Cormier and M. Magnan
Second, accounting recognition and measurement criteria may need to be revised, as their current formulation leaves much freedom to managers and independent auditors, who often choose not to report any environ- mental liabilities because of the uncertainty regarding their magnitude. One reporting option is to record the most reasonable estimate of environ- mental liabilities on the balance sheet and to provide a range of estimates in a footnote. The fact that accounting standard-setters in Canada, the United States, and the United Kingdom have recently issued proposed standards on environmental liabilities illustrates that need (CICA 1995; FASB 1996; ASB 1996).
Third, auditing standards need to be tightened so that independent auditors increase consideration of environmental risks, the sources of such risks, and the potential consequences of such risks to the readers of financial statements. Environmental events or circumstances which can affect a firm's going concern status and its financial statements include, among others (CICA 1994, pp. 1-2, 4-5): (1) the imposition of sanctions by governments which can lead to suspensions of activities; (2) the potential magnitude and repercussions of environmental accidents, and (3) the extent of clean-up costs on existing properties which can severely under- mine their market value. Although auditing standard-setters such as the CICA, have published guidelines on this issue (CICA 1994), other mea- sures which might be used by the public accounting profession include: (1) the development of analytical review standards for the evaluation of environmental risk factors which can influence a firm's inherent and control risk, and (2) the specification of criteria for what constitutes corroborative evidence for environmental costs and liabilities.
The finding of a relationship between corporate pollution and stock market valuation must be interpreted in light of some inherent limitations. First, although the content of Environmental Ministries (Canada, Ontario, Qu6bec) reports is known to many insiders and government officials, it is obtainable with difficulty, only after a long delay (more than a year). In addition, the pollutants selected for our study may not be the most relevant and were restricted to water pollution. However, the fact that a significant negative relation between pollution level and market valuation was observed, despite these limitations, is an indication of the magnitude of corporate environmental liabilities. Moreover, the fact that results were robust to model specifications (pooled fixed-effects, without outliers, sepa- rate year-specific regressions) reinforces the results' validity.
The impact of pollution performance on firm value is likely to gain in magnitude as governments tighten legal loopholes and launch more regu- latory actions against corporate polluters. Therefore, analyses and ratios based upon financial statement figures which do not explicitly consider environmental liabilities could lead to erroneous judgments in view of the monetary magnitude of such debts.
Assessment of Environmental Liabilities 237
We thank the CGA-Canada Research Foundation for its financial support. We thank participants at Laval University's Ernst & Young workshop for their helpful comments. Suggestions and comments were also received from two anonymous reviewers and from Claude Laurin. The database used by the authors is available upon request.
References Accounting Standards Board (ASB). Dec. 1995. Provisions. Discussion paper.
London: Institute of Chartered Accountants of England and Wales.
Abitibi-Price Inc. 1993. Annual Report. Abitibi-Price Inc.
Amir, E. Oct. 1993. The market valuation of accounting information: The case of postretirement benefits other than pensions. The Accounting Review 68(4):703- 724.
Atiase, R. K. and Tse, S. 1986. Stock valuation models and accounting information: A review and synthesis. Journal of Accounting Literature 5:1-33.
Barth, M. E. July 1991. Relative measurement errors among alternative pension asset and liability measures. The Accounting Review 66(3):433-463.
Barth, M. E. and McNichols, M. F. 1994. Estimation and market valuation of environmental liabilities relating to Superfund sites. Journal of Accounting Re- search 32(Suppl.):177-209.
Barth, M. E., Beaver, W. and Landsman, W. Feb. 1993. A structural analysis of pension disclosures under SFAS 87 and their relation to share prices. Financial Analysts Journal 49(1):18-26.
Barth, M. E., Beaver, W. H. and Stinson, C. Jan. 1991. Supplemental data and the structure of thrift share prices. The Accounting Review 66(1):56-66.
Belkaoui, A. Winter 1976. The impact of the disclosures of the environmental effects of organizational behavior on the market. Financial Management 2(1): 26-31.
Beaver, W. H., Eager S. and Wolfson, M. A. Autumn 1989. Financial reporting supplemental disclosures and bank share prices. Journal of Accounting Research 27(2):157-178.
Bernard, V. and Stober, T. Oct. 1989. The nature and amount of information in cash flows and accruals. The Accounting Review 64(4):624-652.
Blacconiere, W. G. and Patten, D. M. Nov. 1994. Environmental disclosures, regulatory costs and changes in firm value. Journal of Accounting and Economics 18(3):357-377.
Black, F. Dec. 1993. Choosing accounting rules. Accounting Horizons 7(4):1-17.
Bragdon, H. H. and Marlin, J. Apr. 1972. Is pollution profitable? Risk Management 19(4):9-18.
Canadian Environmental Protection Act. 1993. C.R.C.
Canadian Institute of Chartered Accountants (CICA). 1994. Environmental Costs and Liabilities: Accounting and Financial Reporting Issues. Toronto, Ontario: Canadian Institute of Chartered Accountants.
238 D. Cormier and M. Magnan
Canadian Institute of Chartered Accountants (CICA). Jan. 1994. Guideline on the Audit o f Financial Statements upon Which Environmental Items May Have an Impact. Handbook--Auditing. Toronto, Ontario: Canadian Institute of Char- tered Accountants.
Canadian Institute of Chartered Accountants (CICA). Nov. 1995. Statement of Principles on Environmental Costs and Liabilities. Toronto, Ontario: Canadian Institute of Chartered Accountants.
Cormier, D., Magnan, M. and Morard, B. Oct. 1993. The impact of corporate pollution on market valuation: Some empirical evidence. Ecological Economics 8(2):135-156.
Council on Environmental Quality (CEQ). Dec. 1977. Environmental Quality. Washington, DC: U.S. Government Printing Office.
Domtar Inc. 1993. Annual Report. Domtar Inc. Environnement Canada. 1986. Rapport Annuel de Conformit~ ~ la R~glementation
des Raffineries de P~trole--Rdgion du Quebec (undated). Ottawa, Canada: Gov- ernment of Canada.
Environnement Canada. 1987. Rapport Annuel de Conformitd ~ la R~glementation des Raffineries de P~trole--R~gion du Qudbec (undated). Ottawa, Canada: Gov- ernment of Canada.
Environnement Canada. Dec. 1989. Rapport Annuel de Conformit~ au R~glement et Directives F~d~rales sur les Effluents des Raffineries de P~trole--R~gion du Quebec, 1988. Ottawa, Canada: Government of Canada.
Environnement Canada. Dec. 1990. Rapport Annuel de Conformit~ au Rdglement et Directives F~d~rales sur les Effluents des Raffineries de Pdtrole--R~gion du Qudbec, 1989. Ottawa, Canada: Government of Canada.
Environnement Canada. June 1991. Rapport annuel de Conformitd au R~glement et Directives F~d~rales sur les Effluents des Raf-fineries de P~trole--R~gion du Quebec, 1990. Ottawa, Canada: Government of Canada.
Environnement Canada. June 1992. Rapport Annuel de Conformit~ au R~glement et Directives F~d~rales sur les Effluents des Raffineries de P~trole--R~gion du Quebec, 1991. Ottawa, Canada: Government of Canada.
Environmental Protection Act (Ontario), R.R.O. 1980. Effluent Monitoring--Pulp and Paper Sector Regulation (O. Reg. 435/89)--Petroleum Refining Sector (O. Reg. 359/88)--Industrial Minerals Sector (O. Reg. 9/1/90). Iron and Steel Manufacturing Sector (O. Reg. 321/89).
Environment Ontario. Oct. 1987. Report on the 1986 Industries Direct Discharges in Ontario. Toronto, Ontario: Province of Ontario.
Environment Ontario. Oct. 1988. Report on the 1987 Industries Direct Discharges in Ontario. Toronto, Ontario: Province of Ontario.
Environment Ontario. Dec. 1989. Report on the 1988 Industries Direct Discharges in Ontario. Toronto, Ontario: Province of Ontario.
Environment Ontario. June 1991. Report on the 1989 Industries Direct Discharges in Ontario. Toronto, Ontario: Province of Ontario.
Environment Ontario. July 1992. Report on the 1990 Industries Direct Discharges in Ontario. Toronto, Ontario: Province of Ontario.

Assessment of Environmental Liabilities 239
Environment Ontario. July 1993. Report on the 1991 Industries Direct Discharges in Ontario. Toronto, Ontario: Province of Ontario.
Environment Quality Act (Qu6bec), 1981. Liquid Effluents of Petroleum Refiner- ies Regulation (R.R.Q. 1981, C.Q.-2, R.6)--Pulp and Paper Mills Regulation (R.R.Q. 1981, C.Q.-2, R-20).
Financial Accounting Standards Board (FASB). Feb. 1996. Accounting for Certain Liabilities Related to Closure or Removal of Long-Lived Assets. Exposure draft. Stamford, CT: Financial Accounting Standards Board.
Fisheries Act (Canada), R.S.C. 1970. C.811. Freedman, M. and Jaggi, B. 1986. An analysis of the impact of corporate pollution
disclosures included in annual financial statements on investors' decisions. In Advances in Public Interest Accounting, Vol. 1 (M. Neimark, B. Merino and T. Tinker, eds.). Greenwich, CT: JAI Press, pp. 193-212.
Freedman, M. and Jaggi, B. Dec. 1992. An investigation of the long-run relation- ship between pollution performance and economic performance: The case of pulp and paper firms. Critical Perspectives on Accounting 3(4):315-336.
Freedman, M. and Jaggi, B. Spring 1994. Analysis of the association between pollution performance and input cost factors: The case of electric utility plants. Journal of Accounting and Public Policy 13(1):31-48.
Freedman, M. and Stagliano, A. J. 1991. Differences in social-cost disclosures: A market test of investor reactions. Accounting, Auditing & Accountability Journal 4(1):68-82.
Haggett, S. June 1, 1992. Concentrating a director's mind. The FinancialPost, p. 16. Hand, J. R. M. Oct. 1990. A test of the extended functional fixation hypothesis. The
Accounting Review 65(4):739-763. Harris, T. and Ohlson, J. Oct. 1987. Accounting disclosure and the market's
valuation of oil and gas properties. The Accounting Review 62(4):651-670. Harris, T. and Ohlson, J. Oct. 1990. Accounting disclosures and the market's
valuation of oil and gas properties: Evaluation of market efficiency and func- tional fixation. The Accounting Review 64(4):764-780.
Healy, P. M., Kang, S. H. and Palepu, K. G. Apr. 1987. The effect of accounting procedure changes on CEOs' cash salary and bonus compensation. Journal of Accounting and Economics 9(1):7-34.
Hughes, J. S., Mogat, W. A. and Ricks, W. E. Apr. 1986. The economic conse- quences of the OSHA cotton dust standards: An analysis of stock price behavior. Journal of Law and Economics 29(1):29-59.
Ingram, R. W. Autumn 1978. An investigation of the information content of certain social responsibility disclosures. Journal of Accounting Research 16(2): 270-285.
Investor Responsibility Research Center (IRRC). 1992. Institutional Investor Needs for Corporate Environmental Information. Washington, DC: Investor Responsibil- ity Research Center.
Jaggi, B. and Freedman, M. Sept. 1992. An examination of the impact of pollution performance and economic and market performance: Pulp and paper firms. Journal of Business Finance & Accounting 19(5):697-713.

240 D. Cormier and M. Magnan
Johnson, M. F., Magnan, M. L. and Stinson, C. Apr. 1996. Nonfinancial measures of environmental performance as proxies for environmental risks and uncertain- ties. Working paper, University of Michigan.
Karpoff, J. and Lott, J. R. Oct. 1993. The reputational penalty firms bear from committing criminal fraud. Journal of Law and Economics 36(2):757-803.
Lajoie, G. Sept. 29, 1990. Les p~ttes et papiers au QuEbec: Une facture d'un milliard pour l'environment. Les Affaires 62(38): 1-5.
Landsman, W. Oct. 1986. An empirical investigation of pension and property rights. The Accounting Review 51(4):662-691.
Lanoie, P. and Laplante, B. Jan. 1994. The market response to environmental regulation in Canada: A theoretical and empirical analysis. Southern Economic Journal 60(3):657-672.
Laplante, B. 1995. La r~glementation environnemental. In Environnement, Economie et Entreprise (P. Lanoie, B. Laplante, M. Provost and R. Brulotte, eds.). Sainte-Foy: TEIE-Universit~, pp. 77-128.
Little, P., Muoghaly, M. I. and Robinson, H. D. Spring 1995. Hazardous waste lawsuits, financial disclosure, and investor's interests. Journal of Accounting, Auditing and Finance 10(2):383-398.
Maloney, M. T. and McCormick, R. E. Apr. 1982. A positive theory of environmen- tal quality regulation. The Journal of Law and Economics 25(1):99-123.
MinistEre de l'Environnement du QuEbec. 1987. Rapport de Conformit~ Sommaire Annuel: D~bit, Charge et Allocation des Fabriques de Pates et Papiers, 1986. QuEbec, QuEbec: Province of QuEbec.
Minist~re de l'Environnement du QuEbec. June 1988. Rapport de Conformit~ Sommaire Annuel: Ddbit, Charge 1987. QuEbec, QuEbec: Province
MinistEre de l'Environnement du Sommaire Annuek D~bit, Charge 1988. QuEbec, QuEbec: Province
Minist~re de l'Environnement du Sommaire Annuel." D~bit, Charge
et Allocation des Fabriques de Pates et Papiers, of QuEbec. QuEbec. Nov. 1989. Rapport de Conformitd
et Allocation des Fabriques de Pates et Papiers, of QuEbec. QuEbec. Aug. 1990. Rapport de Conformit~
et Allocation des Fabriques de Pates et Papiers, 1989. QuEbec, QuEbec: Province of QuEbec.
MinistEre de l'Environnement du QuEbec. April 1991. Bilan Annuel de Conformitd Environnementale Secteur de Pates et Papiers, 1990. QuEbec, QuEbec: Province of QuEbec.
MinistEre de l'Environnement du QuEbec. April 1992. Bilan Annuel de Conformit~ Environnementale Secteur de Pates et Papiers, 1991. QuEbec, QuEbec: Province of QuEbec.
Mittelstaet, M. and Mahood, C. Feb. 2, 1993. Ontario toughening organochlorine rules. The Globe and Mail 149(44,664):B-7.
Muoghalu, M. I., Robinson, H. D. and Glascock, J. L. Oct. 1990. Hazardous waste lawsuits, stockholder returns and deterrence. Southern Economic Journal 57(2):357-370.
Ohlson, J. A. Spring 1995. Earnings, book values, and dividends in equity valuation. Contemporary Accounting Research 11(2):661-688.
Assessment of Environmental Liabilities 241
Owen, D. 1992. Green Reporting: Accountancy and the Challenge of the Nineties. London: Chapman and Hall.
Porter, M. E. and Van der Linde, C. Sept./Oct. 1995. Green and competitive: Ending the stalemate. Harvard Business Review 73(5):120-134.
Rubinstein, D. B. Nov. 1989. Social costs that may lead to bankruptcy. CA Magazine 122(11):26-34.
Shane, P. and Spicer, B. July 1983. Market response to environmental information produced outside the firm. The Accounting Review 63(3):521-538.
Spicer, B. Jan. 1978. Investors, corporate social performance and information disclosure: An empirical study. The Accounting Review 53(1):94-111.
Tinic, S. M. Oct. 1990. A perspective on the stock market's fixation on accounting numbers. The Accounting Review 65(4):781-796.
Whyte, H. B. Mar. 6, 1992. Banks on liability alert. The Financial Post, p. 4.