Overview of Central Government Risks and Liabilities, Autumn ...
Upload
independentCategory
view
8download
0
Institute for International Integration Studies
IIIS Discussion Paper
No.190 / December 2006
The Shifting Composition of External Liabilities
André Faria International Monetary Fund
Philip R. Lane IIIS, Trinity College Dublin and CEPR
Paolo MauroInternational Monetary Fund
Gian Maria Milesi-FerrettiInternational Monetary Fund and CEPR

IIIS Discussion Paper No. 190
The Shifting Composition of External Liabilities
André Faria Philip R. Lane Paolo Mauro Gian Maria Milesi-Ferretti
Disclaimer Any opinions expressed here are those of the author(s) and not those of the IIIS. All works posted here are owned and copyrighted by the author(s). Papers may only be downloaded for personal use only.

THE SHIFTING COMPOSITION OF EXTERNAL LIABILITIES*
André Faria Philip R. Lane International Monetary Fund IIIS, Trinity College Dublin and CEPR Paolo Mauro Gian Maria Milesi-Ferretti International Monetary Fund International Monetary Fund and CEPR Abstract What determines the composition of external liabilities, both across countries and over time? More
specifically, which countries account for the massive increase in equity-like liabilities (foreign direct
investment and portfolio equity), especially since the mid-1990s? The empirical analysis draws on the
newly-released “External Wealth of Nations Mark II” dataset. In the cross-section, we find that larger,
more open economies with a better institutional quality score have a greater equity share in external
liabilities, which is also positively related to natural resource production. Along the time-series
dimension, we find that the shift towards equity financing is stronger among those countries that have
undertaken a greater degree of domestic financial reform. (JEL: F21, F34, F36)
* Forthcoming in Journal of European Economic Association, April-May 2007. Prepared for the invited session on “The Macroeconomics of Financial Globalization” at the 2006 European Economic Association conference, Vienna. The authors are grateful to Pedro Carneiro, Mick Devereux, and seminar participants at the IMF and the CEPR’s European Summer Symposium in International Macroeconomics (Tarragona, 2006) for helpful comments, and Agustin Benetrix, Vahagn Galstyan and Jose Romero for excellent research assistance. Lane’s work on this paper was supported by the IRCHSS and the HEA-PRTLI grant to the IIIS. The views expressed are those of the authors only and should not be attributed to the IMF.
E-mail addresses: Faria: [email protected]; Lane: [email protected]; Mauro: [email protected]; Milesi-Ferretti: [email protected].

1. Introduction
What determines the composition of external liabilities, both across countries and over time? While
the debt/equity choice is a key question in corporate finance, international economics has paid limited
attention to the relative weights of equity-like items (foreign direct investment and portfolio equity—
henceforth “equity”) and debt in total external liabilities. Yet, a high share of equity in total external
liabilities is generally viewed as desirable for improving a country’s ability to share risk with
international investors and its resilience to external shocks (Rogoff, 1999). First, equity-type
instruments offer a greater potential for international risk sharing because the return on equity tends to
be procyclical, with the return to the foreign investor lower when the economy is experiencing
difficulties and higher during boom conditions. Second, equity (FDI in particular) appears to be more
stable, especially in times of sudden stop to financial flows (Levchenko and Mauro, 2006).
A few studies have begun to fill this gap, on both the theoretical side (Albuquerque, 2003;
Razin and others, 1998; Schnitzer, 2002) and the empirical side (Faria and Mauro, 2004; Lane and
Milesi-Ferretti, 2001b; Wei, 2001). However, previous empirical studies have primarily relied on
cross-sectional information, with Albuquerque (2003) a notable exception. The massive increase in
FDI and portfolio equity as a share of both GDP and total liabilities, especially since the mid-1990s,
suggests that time series information can also contribute to a better understanding of external capital
structure. Accordingly, we take advantage of the recent availability of more extensive time-series data
and investigate the correlates of changes over time in external liability structures, while also
providing updated cross-sectional estimates to inform our analysis. We are especially interested in
exploring the potential connection between changes in the external capital structure and changes in
domestic institutions and policies. Do countries that undertake investor-friendly reforms experience
an increase in inward FDI? Do reforms that improve the climate for equity investment result in a shift
in the external capital structure towards equity instruments?
2
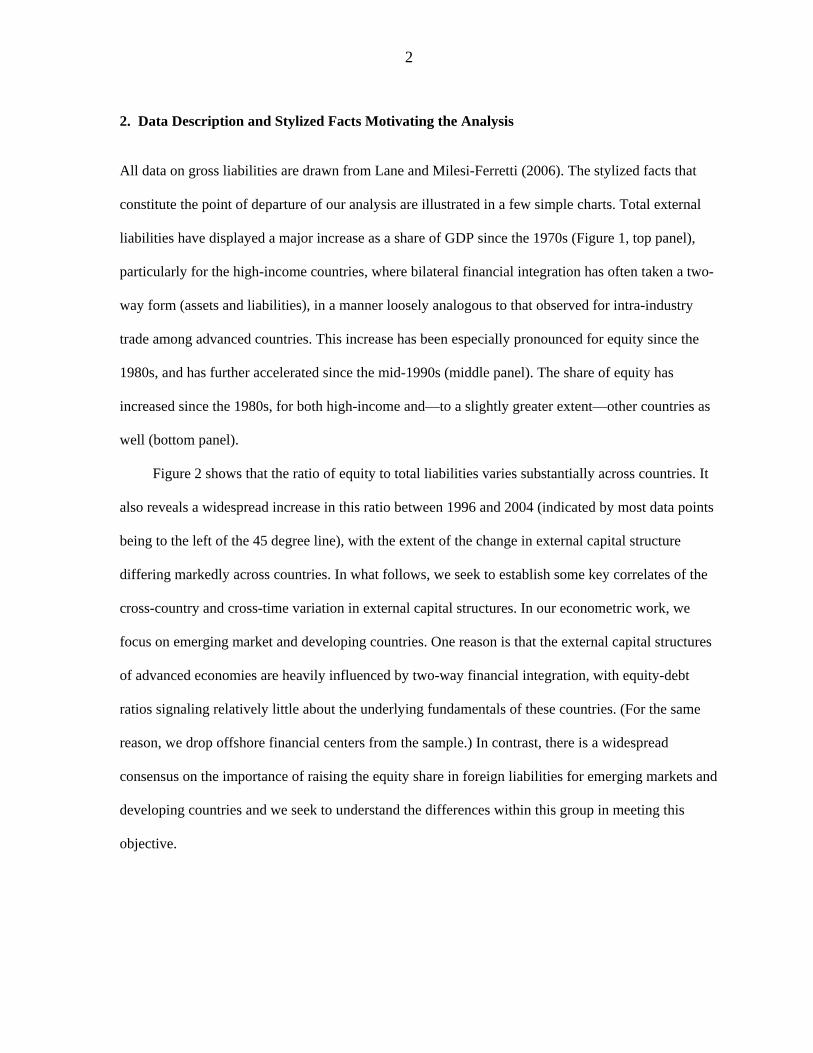
2. Data Description and Stylized Facts Motivating the Analysis
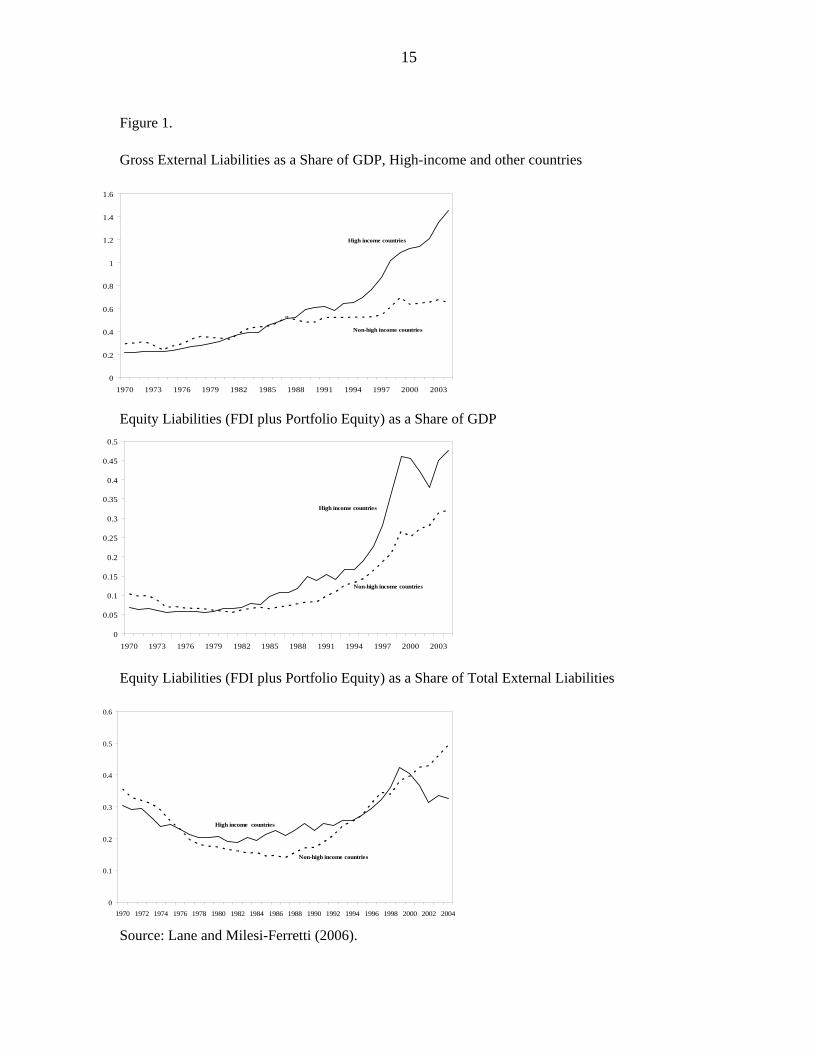
All data on gross liabilities are drawn from Lane and Milesi-Ferretti (2006). The stylized facts that
constitute the point of departure of our analysis are illustrated in a few simple charts. Total external
liabilities have displayed a major increase as a share of GDP since the 1970s (Figure 1, top panel),
particularly for the high-income countries, where bilateral financial integration has often taken a two-
way form (assets and liabilities), in a manner loosely analogous to that observed for intra-industry
trade among advanced countries. This increase has been especially pronounced for equity since the
1980s, and has further accelerated since the mid-1990s (middle panel). The share of equity has
increased since the 1980s, for both high-income and—to a slightly greater extent—other countries as
well (bottom panel).
Figure 2 shows that the ratio of equity to total liabilities varies substantially across countries. It
also reveals a widespread increase in this ratio between 1996 and 2004 (indicated by most data points
being to the left of the 45 degree line), with the extent of the change in external capital structure
differing markedly across countries. In what follows, we seek to establish some key correlates of the
cross-country and cross-time variation in external capital structures. In our econometric work, we
focus on emerging market and developing countries. One reason is that the external capital structures
of advanced economies are heavily influenced by two-way financial integration, with equity-debt
ratios signaling relatively little about the underlying fundamentals of these countries. (For the same
reason, we drop offshore financial centers from the sample.) In contrast, there is a widespread
consensus on the importance of raising the equity share in foreign liabilities for emerging markets and
developing countries and we seek to understand the differences within this group in meeting this
objective.
3
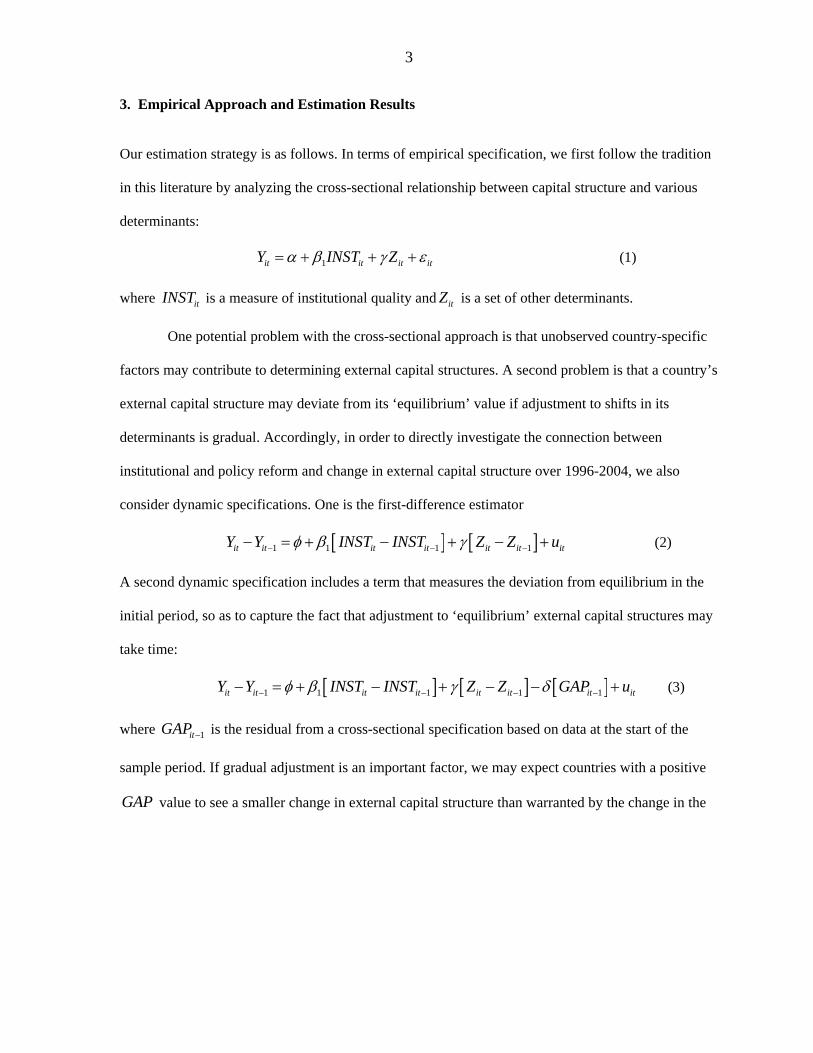
3. Empirical Approach and Estimation Results
Our estimation strategy is as follows. In terms of empirical specification, we first follow the tradition
in this literature by analyzing the cross-sectional relationship between capital structure and various
determinants:
1it it it itY INST Zα β γ ε= + + + (1)
where itINST is a measure of institutional quality and itZ is a set of other determinants.
One potential problem with the cross-sectional approach is that unobserved country-specific
factors may contribute to determining external capital structures. A second problem is that a country’s
external capital structure may deviate from its ‘equilibrium’ value if adjustment to shifts in its
determinants is gradual. Accordingly, in order to directly investigate the connection between
institutional and policy reform and change in external capital structure over 1996-2004, we also
consider dynamic specifications. One is the first-difference estimator
[ ] [ ]1 1 1 1it it it it it it itY Y INST INST Z Z uφ β γ− −− = + − + − +− (2)
A second dynamic specification includes a term that measures the deviation from equilibrium in the
initial period, so as to capture the fact that adjustment to ‘equilibrium’ external capital structures may
take time:
[ ] [ ] [ ]1 1 1 1 1it it it it it it it itY Y INST INST Z Z GAP uφ β γ δ− − −− = + − + − − +− (3)
where is the residual from a cross-sectional specification based on data at the start of the
sample period. If gradual adjustment is an important factor, we may expect countries with a positive
value to see a smaller change in external capital structure than warranted by the change in the
1itGAP −
GAP

4
regressors; conversely, a negative GAP value would be associated with a larger change in external
capital structure than warranted by the change in the regressors.1
3.1 Cross-sectional estimates
We first consider cross-sectional specifications that have been the primary focus of the literature on
external capital structure until now. We examine three dimensions of external capital structure: the
ratio of total foreign liabilities to GDP; the share of equity (portfolio and FDI) in total foreign
liabilities; and the share of FDI in total foreign equity liabilities. We report estimates for two years:
1996 (at the beginning of the acceleration in financial globalization) and 2004 (the most recent year in
our sample). The choice of initial year is also influenced by the fact that 1996 is the first year in the
dataset on institutional quality assembled by Kaufmann, Kraay and Mastruzzi (2005).
The choice of regressors largely follows the recent work of Faria and Mauro (2004) that
examined a broad range of potential determinants of external capital structure. However, some of the
variables considered by these authors (such as educational attainment) are excluded because these
added little explanatory power (owing in part to limited time-series variation in the data) and reduced
sample size. Following the framework laid out above, in order to assess the relation between external
capital structure and the institutional environment, a core regressor is an institutional quality index,
measured as the simple average of six individual indicators constructed by Kaufmann and others
(2005): Voice and Accountability; Political Stability and Absence of Violence; Government
Effectiveness; Regulatory Quality; Rule of Law; and Control of Corruption.2 This index is available
at a bi-annual frequency between 1996 and 2004, allowing us to consider the association between
1 The cross-sectional benchmark will be less useful, the more important are country fixed effects (that are not captured in such a specification). However, that should introduce a bias towards not finding a significantly negative role for the GAP term.
2 In the full country sample of Kaufmann and others (2005), the index ranges from -2.5 to 2.5 (for 99 percent of the observations), with a mean of zero and a standard deviation of one; the range is narrower in our sample because we exclude the advanced economies and the countries without adequate data coverage.

5
institutional quality and external capital structure at different points of time and the co-movement
between changes in institutional quality and changes in external capital structure.
The other main explanatory variables include the size of the economy (total GDP in U.S.
dollars); the level of economic development (GDP per capita in U.S. dollars); openness (sum of
imports and exports over GDP); and the relative importance of natural resources (share of exports of
fuels, metals, and ores as a ratio to total exports). Several of these potential explanatory variables are
correlated with each other, highlighting the importance of using multivariate regressions. Estimation
is by ordinary least squares. Faria and Mauro (2004) show that estimation by instrumental variables
delivers broadly similar results. The difficulty of establishing good instruments when considering
time-series information (notably, for the change in institutional quality between 1996 and 2004)
means that we confine attention to estimating partial correlations in this paper.
Column (1) of Table 1 shows that natural resources and country size (highly correlated with
trade openness) are significant in explaining the cross-sectional variation in the ratio of total liabilities
to GDP in 1996; the pattern is slightly different for the 2004 cross section in column (4), where
institutional quality, country size, and trade openness are significant. Turning to the share of equity in
total liabilities, columns (2) and (5) show a significant role for the institutional quality variable in
both 1996 and 2004: countries with better institutions have a greater share of equity instruments in
total liabilities. In addition, the equity share is positively correlated with country size and the ratio of
natural resources to GDP for both the 1996 and 2004 cross sections, while trade openness is also
significant in the 2004 cross section. Columns (3) and (6) show that the distribution of equity
liabilities between direct investment and portfolio equity is influenced by country size, with larger
countries having a greater proportion of portfolio equity liabilities.
In summary, the cross-sectional estimates for 1996 and 2004 show broadly the same pattern
across the two time periods. In particular, the cross-country variation in the share of equity in total
liabilities is positively associated with the level of institutional quality. Among the other covariates,
we find that larger countries have smaller total liabilities but a greater share of equity (especially

6
portfolio equity) in total liabilities. In addition, in the 2004 cross-section the equity share is also
positively associated with greater trade openness and a higher reliance on natural resources.
3.2 Dynamic Approach We turn to a dynamic analysis in Tables 2a-2b, where the goal is to understand the co-movements
between changes in external capital structure and changes in the independent variables between 1996
and 2004. We begin in Table 2a with a simple first-difference specification, which allows us to focus
on the time series information in the data by eliminating the impact of country fixed effects.
Columns (1)-(3) of Table 2a report estimates for the broad sample of emerging market and
developing countries. These regressions show that some dimensions of changes in external capital
structure can be successfully related to some of our independent variables. In particular, we find in
column (1) that growth in the ratio of total foreign liabilities to GDP over 1996 to 2004 is positively
associated with growth in output per capita and in trade openness. Furthermore, column (2) shows
that growth in output per capita is also positively associated with an increase in the equity share in
total liabilities. While the equity share in liabilities is positively associated with country size in the
cross-section, faster population growth is associated with a fall in the equity share in the dynamic
specification. Finally, the low R2 in column (3) shows that our specification is unable to explain the
relative growth of FDI versus portfolio equity during this period.
A common feature across columns (1)-(3) is that changes in external capital structure cannot
be related to changes in the index of institutional quality. This is not surprising, because measured
changes in this index over a relatively short time period are limited. Thus, at the price of a major
reduction in sample size, we examine an alternative specification in columns (4)-(6) that also includes
a variable that captures changes in financial sector policies during this period. We exploit the
database constructed by Detragiache and others (2006) which tracks financial reforms in seven areas
and provides indices of reforms in each area considered: credit controls, interest rate controls, entry
barriers, bank regulations, privatization, capital account, and securities markets. Following

7
Detragiache and others (2006), we employ the average across these indices as a general measure of
the level of financial reform at a national level.3
Columns (4) and (5) of Table 2a show that the financial reform index is significant in
explaining changes in the ratio of total foreign liabilities to GDP and in the equity share in liabilities:
countries that undertook deeper financial reforms during this period saw a decrease in the ratio of
total liabilities to GDP but also a larger shift towards equity-type instruments. However, the financial
reform index does not help explain changes in the relative importance of direct investment versus
portfolio equity investment (column 6).
As discussed earlier, a potential limitation of the simple first-difference estimator is that it
does not allow for gradual adjustment to the equilibrium capital structure. Accordingly, Table 2b
reports the results from the dynamic specification that includes the GAP variable (which captures
deviation from equilibrium in the initial year). This two-step procedure, in which the residuals from
the 1996 cross section enter the dynamic equation for changes between 1996 and 2004, imputes a
generated regressor in the regression of changes on changes. As discussed by Murphy and Topel
(1985) and Newey and McFadden (1994), a simple OLS approach that fails to take this into account
generates a bias in the estimated covariance matrices, thus making inference invalid. To correct for
this problem, we follow the approach of Dustmann and Meghir (2005) and Aguiar and Hurst (2005)
among others, and bootstrap the first and second stages of the estimation procedure together. It has
been shown that this relative simple procedure works at least as well as the asymptotic distribution in
small samples (Horowitz, 2001). (Relative to OLS, we usually find that the bootstrapped standard
errors are substantially larger.)
Taking first the results for the broad sample in columns (1)-(3) of Table 2b, the introduction
of the GAP variable substantially raises the overall explanatory power of these regressions. Moreover,
the GAP variable is itself significant: relative to the equilibrium values implied by the 1996 cross- 3 A separate measure of capital account liberalization turned out to be typically individually insignificant.

8
sectional estimates, and controlling for changes in the ‘fundamentals’, countries with a low share of
equity in total liabilities and a low share of FDI within the equity category saw faster growth in these
ratios over 1996 to 2004. The importance of the GAP variable illustrates how the values of key
variables (such as institutional quality) can have a persistent impact on the dynamics of external
capital structure if adjustment towards the equilibrium capital structure occurs gradually.
We next turn to the specifications for the narrower sample that includes the financial reform
variable in columns (4)-(6) of Table 2b. For this sample, the GAP variable is significant only in the
total liabilities regression in column (4); it also renders the financial reform index insignificant in this
regression. However, financial reform remains significant as a correlate for the change in the equity
share in liabilities in column (5). Finally, the introduction of the GAP variable in column (6) has only
a limited impact on our ability to capture the covariates of changes in the FDI share in equity
liabilities.
4. Conclusions
Our goal in this paper has been to examine the shift toward equity (FDI and portfolio equity) in the
composition of external liabilities, with a focus on emerging markets and developing economies. In
particular, we have attempted to capture the most important covariates of the equity share in total
foreign liabilities, a ratio that has featured heavily in recent policy analyses of the financial stability of
these countries.
We have shown that, along the cross-sectional dimension, larger, more open economies with
a better institutional quality score and a greater reliance on natural resource production have a greater
share of equity in external liabilities. Along the time-series dimension, the increase in the ratio of total
liabilities to GDP is larger for countries with higher growth and increased openness, and the shift
towards equity financing is stronger among those countries that have undertaken more domestic
financial reforms. In addition, we have shown the importance of a dynamic approach to estimation, in
view of the gradual nature of adjustment towards equilibrium capital structures.

9
This study provides only an initial step in uncovering the dynamic relation between changes
in external capital structure and in economic fundamentals. For instance, we have focused on the co-
movement between external capital structure and general indices of institutional quality and domestic
financial reform. It could be enlightening to disaggregate these general indices and investigate which
are the most important institutional changes and dimensions of financial reforms for the various
components of external capital structure. A further extension could verify whether an increase in the
equity share of liabilities is indeed associated with improved international risk sharing and greater
financial stability. We defer these important questions to future research.

10
References
Aguiar, Mark, and Erik Hurst, 2005, “Lifecycle Prices and Production.” NBER Working Paper No. 11601 (Cambridge, Massachusetts: National Bureau of Economic Research).
Albuquerque, Rui, 2003, “The Composition of International Capital Flows: Risk Sharing Through
Foreign Direct Investment,” Journal of International Economics, Vol. 1, No. 2, pp. 353–83. Detragiache, Enrica, Abdul Abiad, and Thierry Tressel, 2006, “A New Database of Financial
Reform,” IMF Working Paper, forthcoming. Dustmann, Christian, and Costas Meghir, 2005, “Wages, Experience, and Seniority,” Review of
Economic Studies, Vol. 72, No. 1, pp. 77–108. Faria, André, and Paolo Mauro, 2004, “Institutions and the External Capital Structure of Countries,”
IMF Working Paper 04/236 (Washington: International Monetary Fund). Horowitz, Joel L., 2001, “The Bootstrap,” in Handbook of Econometrics, Vol. 5, ed. by Heckman J. J.
and Leamer E. (North-Holland, Amsterdam). Kaufmann, Daniel, Aart Kraay, and Massimo Mastruzzi, 2005, “Governance Matters IV: Governance
Indicators for 1996–2004,” (Washington: World Bank). Lane, Philip, and Gian Maria Milesi-Ferretti, 2001a, “The External Wealth of Nations: Measures of
Foreign Assets and Liabilities for Industrial and Developing Countries,” Journal of International Economics, Vol. 55, No. 2, pp. 263–94.
———, 2001b, “External Capital Structure: Theory and Evidence,” in The World’s New Financial
Landscape: Challenges for Economic Policy, ed. by Horst Siebert, Springer-Verlag. ———, 2006, “The External Wealth of Nations Mark II: Revised and Extended Estimates of Foreign
Assets and Liabilities, 1970–2004,” IMF Working Paper 06/69 (Washington: International Monetary Fund).
Levchenko, Andrei, and Paolo Mauro, 2006, “Do Some Forms of Financial Flow Help Protect from
Sudden Stops?” IMF Working Paper 06/202 (Washington: International Monetary Fund). Murphy, Kevin M., and Robert H. Topel, 1985, “Estimation and Inference in Two-Step Econometric
Models,” Journal of Business and Economic Statistics, Vol. 3, No. 4, pp. 370–79. Newey, Whitney K., and Daniel L. McFadden. 1994. “Large Sample Estimation and Hypothesis
Testing,” in Handbook of Econometrics, Vol. 4, ed. by Engle, R.F. and McFadden D.L. (North-Holland, Amsterdam).
Razin, Assaf, Efraim Sadka, and Chi-Wa Yuen, 1998, “A Pecking-Order of Capital Inflows and
International Tax Principles,” Journal of International Economics, Vol. 44, No. 1, pp. 45–68. Schnitzer, Monika, 2002, “Debt versus Foreign Direct Investment: The Impact of Sovereign Risk on
the Structure of International Capital Flows,” Economica, Vol. 69. pp. 41–67.

11
Wei, Shang-Jin, 2001, “Domestic Crony Capitalism and International Fickle Capital: Is There a Connection?” International Finance, Vol. 4, No. 1, pp. 15–45.

12
Table 1. External Capital Structure: Cross-Sectional Evidence, 1996 and 2004
1996
Total Eq.Share FDI/Equity Total Eq.Share FDI/Equity
Institutional quality index 0.263 0.088** -0.047 0.241** 0.08* -0.059(0.143) (0.046) (0.033) (0.100) (0.046) (0.039)
GDP (log) -0.047 0.023** -0.066*** -0.066** 0.029** -0.064***(0.041) (0.013) (0.01) (0.030) (0.014) (0.011)
GDP per capita (log) -0.18* 0.017 0.025 -0.098 0.012 0.035(0.08) (0.026) (0.019) (0.061) (0.028) (0.022)
Openness 0.14 0.101 -0.031 0.257* 0.151** -0.029(0.23) (0.073) (0.053) (0.130) (0.060) (0.050)
Natural resources 0.41** 0.167** 0.047 0.236 0.157** 0.037(0.204) (0.066) (0.047) (0.154) (0.071) (0.059)
Constant 1.11** -0.077 1.55*** 1.43*** -0.042 1.53***(0.49) (0.156) (0.11) (0.35) (0.164) (0.14)
Observations 74 74 74 73 73 73R-squared 0.26 0.35 0.54 0.28 0.34 0.39
2004
Note: Standard errors in parentheses; *,**, *** denote significance at the 10, 5 and 1 percent levels respectively. Total liabilities (expressed as a ratio to GDP) consist of the sum of total equity plus portfolio debt, and other liabilities; Eq. Share is the ratio of (portfolio and FDI) equity in total liabilities; FDI/Equity is the ratio of FDI liabilities to total equity liabilities. The Institutional Quality Index is the simple average of six indicators from Kaufmann, Kraay and Mastruzzi (2005): voice and accountability; political stability and absence of violence; government effectiveness; regulatory quality; rule of law; and control of corruption. GDP and GDP per capita are from the World Bank’s World Development Indicators (WDI). Openness is the sum of imports and exports, divided by GDP and natural resources are the percentage of ore, metals and fuels in total exports.

13
Table 2a. Dynamics of External Capital Structure I: 1996-2004 (Basic Specification)
Full
Total Eq.Share FDI/Equity Total Eq.Share FDI/Equity
Institutional quality index -0.07 0.052 -0.058 -0.02 0.039 -0.057(0.17) (0.051) (0.048) (0.2) (0.065) (0.084)
Financial reform index -1.18* 0.55** -0.072(0.67) (0.22) (0.287)
GDP (log) -0.076 -0.039** -0.01 -0.08 0.003 -0.023(0.05) (0.015) (0.014) (0.082) (0.027) (0.035)
GDP per capita (log) 0.11** 0.025* 0.005 0.12 -0.016 0.017(0.043) (0.013) (0.012) (0.08) (0.026) (0.034)
Openness 0.94** 0.17 0.004 0.43 0.282 -0.123(0.41) (0.12) (0.12) (0.6) (0.199) (0.257)
Natural resources -0.24 0.038 0.14 1.0 -0.128 0.463(0.4) (0.12) (0.11) (0.71) (0.236) (0.305)
Constant 0.02 0.23*** -0.002 0.22 0.076 0.038(0.15) (0.05) (0.04) (0.24) (0.080) (0.103)
Observations 62 62 62 35 35 35R-squared 0.30 0.19 0.05 0.32 0.28 0.12
Narrow
Table 2b. Dynamics of External Capital Structure II: 1996-2004
Full
Total Eq.Share FDI/Equity Total Eq.Share FDI/Equity
Institutional quality index -0.053 0.034 -0.07 -0.026 0.048 -0.07(0.15) (0.052) (0.05) (0.170) (0.081) (0.09)
Financial reform index -1.317 0.503* -0.08(0.789) (0.274) (0.36)
GDP (log) -0.08 -0.024 -0.012 -0.067 0.008 -0.028(0.05) (0.015) (0.013) (0.104) (0.029) (0.045)
GDP per capita (log) 0.08* 0.024 0.01 0.070 -0.016 0.020(0.045) (0.014) (0.01) (0.095) (0.029) (0.04)
Openness 0.84** 0.17 -0.01 0.407 0.28 -0.124(0.4) (0.13) (0.09) (0.865) (0.248) (0.34)
Natural resources -0.001 0.15 0.805 -0.08 0.443(0.61) (0.16) (0.759) (0.27) (0.4)
ECM -0.5*** -0.31** -0.33** -0.73** -0.13 -0.42(0.13) (0.12) (0.15) (0.3) (0.25) (0.35)
Constant 0.1 0.17*** 0.003 0.31 0.06 0.05(0.13) (0.05) (0.04) (0.27) (0.09) (0.13)
Observations 62 62 62 35 35 35R-squared 0.49 0.27 0.14 0.48 0.29 0.19
Narrow
14
Note to Tables 2a and 2b: Standard errors in parentheses; *,**, *** denote significance at the 10, 5 and 1 percent levels respectively. Total liabilities (expressed as a ratio to GDP) consist of the sum of total equity plus portfolio debt, and other liabilities; Eq. Share is the ratio of (portfolio and FDI) equity in total liabilities; FDI/Equity is the ratio of FDI liabilities to total equity liabilities. The Institutional Quality Index is the simple average of six indicators from Kaufmann, Kraay and Mastruzzi (2005): voice and accountability; political stability and absence of violence; government effectiveness; regulatory quality; rule of law; and control of corruption. The financial reform index is a composite of indices of reforms in credit controls, interest rate controls, entry barriers, bank regulations, privatization, capital account, and securities market. GDP and GDP per capita are from the World Bank's World Development Indicators (WDI). Openness is the sum of imports and exports, divided by GDP and natural resources are the percentage of ore, metals and fuels in total exports.
15
Figure 1. Gross External Liabilities as a Share of GDP, High-income and other countries
0
0.2
0.4
0.6
0.8
1
1.2
1.4
1.6
1970 1973 1976 1979 1982 1985 1988 1991 1994 1997 2000 2003
High income countries
Non-high income countries
Equity Liabilities (FDI plus Portfolio Equity) as a Share of GDP
0
0.05
0.1
0.15
0.2
0.25
0.3
0.35
0.4
0.45
0.5
1970 1973 1976 1979 1982 1985 1988 1991 1994 1997 2000 2003
High income countries
Non-high income countries
Equity Liabilities (FDI plus Portfolio Equity) as a Share of Total External Liabilities
0
0.1
0.2
0.3
0.4
0.5
0.6
1970 1972 1974 1976 1978 1980 1982 1984 1986 1988 1990 1992 1994 1996 1998 2000 2002 2004
Non-high income countries
High income countries
Source: Lane and Milesi-Ferretti (2006).

16
Figure 2. Share of Equity in Total External Liabilities, 1996 and 2004.
SDNETH
MKD
GEO
NPL
MDG
BGD
MOZ
GIN
BGR
ISL
JOR
LBYMLITZADZA
NIC
BFA
CIV
UZB
BLRMDA
ROM
UGA
TURKENGABCMR
LKALAOSEN
AUT
KGZ
URY
SLV
UKRDEUPAK
HND
IRN
GHA
YEM
RUS
SYR
KORMAR
ITA
DNK
ZMB
RWA
JPN
IDN
INDISR
ECUKHM
GBR
TGO
POL
BOL
BEL
THA
AGO
GRC
SVKALB
LTU
TCD
PRT
FIN
SVN
COL
PRY
PER
VEN
ARG
CAN
PHL
EGY
MEX
LVA
NGA
FRA
NOR
CZE
SWE
VNM
BRA
DOM
USA
HUNJAMGTM
ESP
PNGTKM
ZAF
KAZ
EST
AUS
NLD
SWZ
TUN
BWA
NZL
CHL
CHN
NAM
SAU
AZE
TTO
0
1
0 1
Equity / Liabilities, 1996
Equi
ty /
Liab
ilitie
s, 20
0
Source: Lane and Milesi-Ferretti (2006).

Institute for International Integration StudiesThe Sutherland Centre, Trinity College Dublin, Dublin 2, Ireland
Copyright © 2022 FDOKUMEN