Historic Complementarities, Political Competition and Ethnic ...
Upload
khangminh22Category
view
2download
0
Ethnic Autonomy and Ethnic Inequality:
An Empirical Assessment of Ethnic Policy in Urban China
Xiaogang Wu, Professor Division of Social Science
Hong Kong University of Science and Technology Email: [email protected]
Guangye He, PhD Department of Sociology
School of Social and Behavior Sciences Nanjing University
163 Xianlin Boulevard, Qixia District Nanjing, China
Email: [email protected]
University of Michigan Population Studies Center Research Report 16-872 December 2016
This paper was presented at the Spring Meeting of the International Sociological Association’s Research Committee on Social Stratification and Mobility (RC28), May 26-28th, National University of Singapore. The authors would like to thank the Research Grants Council of Hong Kong for providing financial support via a General Research Fund project, “The Dynamics of Ethnic Stratification amid China's Economic Transition” (GRF 16600615). The authors would also like to thank Mr. Zeng Donglin for drawing the maps used in this paper. Direct all correspondence to Xiaogang Wu (email: [email protected]), Center for Applied Social and Economic Research (CASER), Hong Kong University of Science & Technology, Clear Water Bay, Kowloon, Hong Kong SAR, China

Ethnic Autonomy and Ethnic Inequality: An Empirical Assessment of Ethnic Policy in Urban China 2
ABSTRACT
To balance ethno-cultural diversity with national integration, the Chinese government started formulating a series of ethnic policies in the early 1950s, including policies on identifying and classifying ethnic groups, a system of regional ethnic autonomy, and a set of preferential treatment policies towards 55 minorities. This article aims to examine socioeconomic disparities between ethnic minorities and the Han majority in China, focusing on the role played by regional ethnic autonomy. Based on a large sample of China’s mini-census data collected in 2005, we show that among non-farm working populations, minorities are more likely than the Han to become managers/professionals or obtain high-status occupation, regardless of whether they are living in their own autonomous jurisdiction or other places. Minorities are paid lower wages, however, even after controlling for other characteristics, and the gap is even wider in autonomous jurisdictions than elsewhere. Finally, children of mixed Han-minority marriages in ethnic autonomous jurisdictions are more likely to identify themselves as minorities, especially those holding urban registration status (hukou) whose parents have received more schooling. Our findings have important implications for the current debate on ethnic policy in China.

Ethnic Autonomy and Ethnic Inequality: An Empirical Assessment of Ethnic Policy in Urban China 3
INTRODUCTION
China is a multi-ethnic nation consisting of 56 groups—the Han and 55 minorities. These 55
minority groups combined account for about 8.4 percent of the national population, according to
the most recent population census in 2010. These ethnic minorities are scattered across the vast
territory, but mainly concentrated in the border regions in northwestern and southwestern China,
with each inhabiting certain areas (Wu and He 2016). For a long period of time, it had been a
great challenge for the Chinese central authority to achieve national integration and social
cohesion while maintaining ethno-cultural diversity and dignity (Eliott 2015; Leibold 2013;
Sautman 2012). Back in the early 1950s, the newly established communist government had
adopted a more circumscribing ethnic policy that “sinicized” some important aspects of Marxist-
Leninist theory on ethnic issues within a country whose population was overwhelmed by the Han
majority. The new policy to advocate minorities’ socioeconomic rights and promote ethnic
egalitarianism and national unity consisted of three key elements: policies on identifying and
classifying ethnic groups, a system of regional ethnic autonomy, and a set of preferential
treatment policies towards minorities.
To implement the Chinese version of the affirmative actions, the party-state had to first
determine the number of ethnic groups in China so that they could be fully protected and
represented in the political, economic and cultural spheres. Ethnologists were dispatched to
determine the ethnic diversity of the new nation-state, which led to the official recognition of 56
ethnic groups comprising 55 minorities in addition to the Han majority (Mullaney 2011). Of the
55 ethnic minority groups, 18 had reached a population of 1 million by 1990 (Wu and He 2016).
Nowadays Chinese citizens have their ethnicity clearly marked on their personal identification
cards and also most other official documents (Gladney 2004).
According to the first Constitution of China in 1954, minority groups residing in a compact
community are entitled to the rights of regional autonomy. The governments of the autonomous
jurisdictions at various levels, which were created by the state based on the size and density of
the community, are usually headed by a member of the specified ethnic group. These
governments are given a certain degree of autonomy in finance, economic planning, arts, science,
Ethnic Autonomy and Ethnic Inequality: An Empirical Assessment of Ethnic Policy in Urban China 4
and culture and language policies, and even in the organization of the local police (Leibold 2013;
Tang, Hu and Jin 2016). They are allowed to interpret, adapt, and implement the state policies to
suit their specific local conditions. Moreover, non-Han populations residing outside of those
autonomous regions are also granted special rights and privileges, especially since the 1980s. For
instance, minorities are exempted from the one-child policy; many minority students receive
extra points in national college entrance examinations and preferential access to employment and
political office (Mackerras 1994; Sautman 1998).
With the series of affirmative action policies, the Chinese government is aiming to cultivate
a unique national form of “multiple origins, one body”, consisting of 56 distinct, indivisible and
theoretically equal constituencies, or minzu, to preserve ethnic diversity, promote ethnic equality
and ease ethnic tensions (Fei 1988). While these efforts were once claimed to be a great success
by the party-state, in the recent decade inter-ethnic conflict and violence, particularly the bloody
riots in Lhasa (2008) and Urumqi (2009), have started posing great challenges to China’s current
ethnic policies (Hao 2012). Some scholars have attributed the ethnic tensions to the fact that
minorities are increasingly lagging behind in China’s booming market economy and thus
advocated the strengthening of minority rights and autonomy (e.g., Wu and Song 2014). Others
tend to view the violence as a sign of policy failure, thus calling for the “second generation of
ethnic policies” (Elliott 2015; Hu and Hu 2011; Leibold 2013; Sautman 2012). These academic
and policy researchers argue that the preferential policies towards ethnic minorities in
autonomous regions create “reverse discrimination” against the Han, and that the large
investments in minority regions and fiscal transfers to these regions have not mitigated ethnic
animosity or promoted inter-ethnic cohesion. Instead, the special rights and autonomy granted to
minorities may have enhanced their ethnic identity and thereby created an obstacle to ethnic
assimilation and national unity (Ma 2007).
The ongoing debate over the future direction of China’s ethnic policies has been inviting
more evidence-based research on minorities’ socioeconomic relations with the Han majority in
the new age. Due to the unavailability of large-scale representative data, most ethnological
studies tend to focus on the social history and identification, marriage norms and patterns,

Ethnic Autonomy and Ethnic Inequality: An Empirical Assessment of Ethnic Policy in Urban China 5
religious and cultural orientations, linguistic practices, etc. of a specific minority group (e.g.,
Bovingdon 2001; Bulag 2002; Harrell 2001; Kaup 2000), whereas quantitative analyses of
survey data with a limited sample size often treat minorities as a homogeneous group. Neither
can afford a comprehensive comparison between a specific minority group and the Han, whose
relations may vary considerably under different circumstances (e.g., Gustafsson and Li 2003;
Hasmath 2008).
In this article, we attempt to investigate the socioeconomic attainment of ethnic minorities
in China, paying special attention to the effectiveness of state policies on regional ethnic
autonomy and preferential treatment. Based on a large sample of China’s mini-census data in
2005 with detailed geographic information, we assess the effect of minority status (both
combined and for selected ethnic groups with population exceeding one million) on the
attainment of occupation, employment sector, and wage in the local context, and the role that
regional ethnic autonomy plays in mitigating minorities’ disadvantages and enhancing their
children’s ethnic identity.
ROLE OF REGIONAL ETHNIC AUTONOMY
Historically, Chinese ethnic minorities have trailed the Han in terms of almost all socioeconomic
measures (Poston and Shu 1987; Poston and Xiong 2014). While it is true that minorities, on the
whole as well as individually for the large minority groups with a population exceeding a million,
continue to lag behind the Han in education, employment and wage, a huge internal variation
exists among themselves: Koreans, for instance, are well ahead of the Han, while Hui, Mongols
and Manchu show little difference from the Han (Wu and He 2016). Because most minorities
occupy their own compact territory and thus are spatially isolated from one another, except for a
limited amount of interaction with the Han majority, the socioeconomic relationship of each
minority group with the Han exhibits a pattern closely tied to the geographic distribution of the
non-Han population and the uneven regional development in China. Figure 1 plots the
geographic distribution of the 18 large minorities with at least 10 percent of them living in
certain prefectures, based on the population mini-census data in 2005. Minorities in these
highlighted regions account for 86.37 percent of the national population.

Ethnic Autonomy and Ethnic Inequality: An Empirical Assessment of Ethnic Policy in Urban China 6
Not incidentally, Koreans, Manchus, and Mongols are concentrated in the more developed
northeastern China, and Hui are much more scattered in the country, whereas most other
minorities of varying population each reside in their own compact communities in the
northwestern or southwestern regions: Bai in Dali of Yunnan, Dai in Xishuanbana of Yunnan,
Kazak in Yili of northwestern Xinjiang, Li in southern Hainan, Tibetans in Tibet and
neighboring prefectures in Qinghai and Sichuan, Tujia in western Hunan, Uyghurs in (southern)
Xinjiang, Zhuang in Guangxi, among others. Hence, underlying China’s ethnic stratification
dynamics is spatial disparities in socioeconomic opportunities and population migration (Wu and
He 2016). In this regard, comparisons between minorities and the Han at the national level could
be misleading without taking into account the unbalanced distribution of minorities and the Han
across different regions. Indeed, according to Hannum (2002), the ethnic gap in schooling in
China’s early reform years could be largely attributed to the compositional differences in the
geographic location of residence and family socioeconomic background. For example, ethnic
minorities in Xinjiang are less likely to enter high-status occupations due to their lower education.
Net of education, the ethnic difference in occupational attainment is negligible (Hannum and Xie
1998). These findings suggest that the ethnic affirmative policies were effective, at least in the
1980s and 1990s. Even after the sweeping market reform in the late 1990s, Uyghurs were more
likely than the Han to enter government/public institutions where they earned comparable wages.
Therefore, the party-state’s ethnic polices should not be blamed for minorities’ worsening
socioeconomic situations (Wu and Song 2014). Instead, it is the structural changes of
employment sectors that give rise to labor market discrimination against Uyghurs beyond the
reach of the state.
The socialist state has long played a visible and direct role in promoting ethnic
egalitarianism in China. Anecdotal evidence described above suggests that the state ethnic
policies had worked well to a large extent, at least up to the 1990s. Ethnic disparities, if they
indeed exist, are largely the result of historical and geographic factors, rather than systematic
exclusions and discrimination by the state policies. Against this backdrop, the difficulties that
Chinese ethnic minorities currently encounter in labor markets suggest that the state preferential
policies have stopped working since the late 1990s in the context of rapid marketization (Wu and
Song 2014). The pattern of ethnic stratification thus is jointly shaped by two competing forces:
Ethnic Autonomy and Ethnic Inequality: An Empirical Assessment of Ethnic Policy in Urban China 7
the market tends to enlarge the gap, whereas the state tends to reduce it. Between these two
forces, the former seems to dominate.
Unlike the preferential treatment policies towards minorities which have been implemented
on and off, the system of regional autonomy—another pillar of China’s ethnic policies—has
remained largely stable since the 1980s. As of 2012, there are 5 autonomous regions (equivalent
to provinces), 30 autonomous prefectures and 120 autonomous counties or the equivalence
(banners) in China, covering 71 percent of ethnic minorities and 64 percent of Chinese territory
(Leibold 2013; Paik and Ham 2012). The first ethnic autonomous jurisdiction, the Inner
Mongolia Autonomous Region, was formed way back in 1947 prior to the founding of the
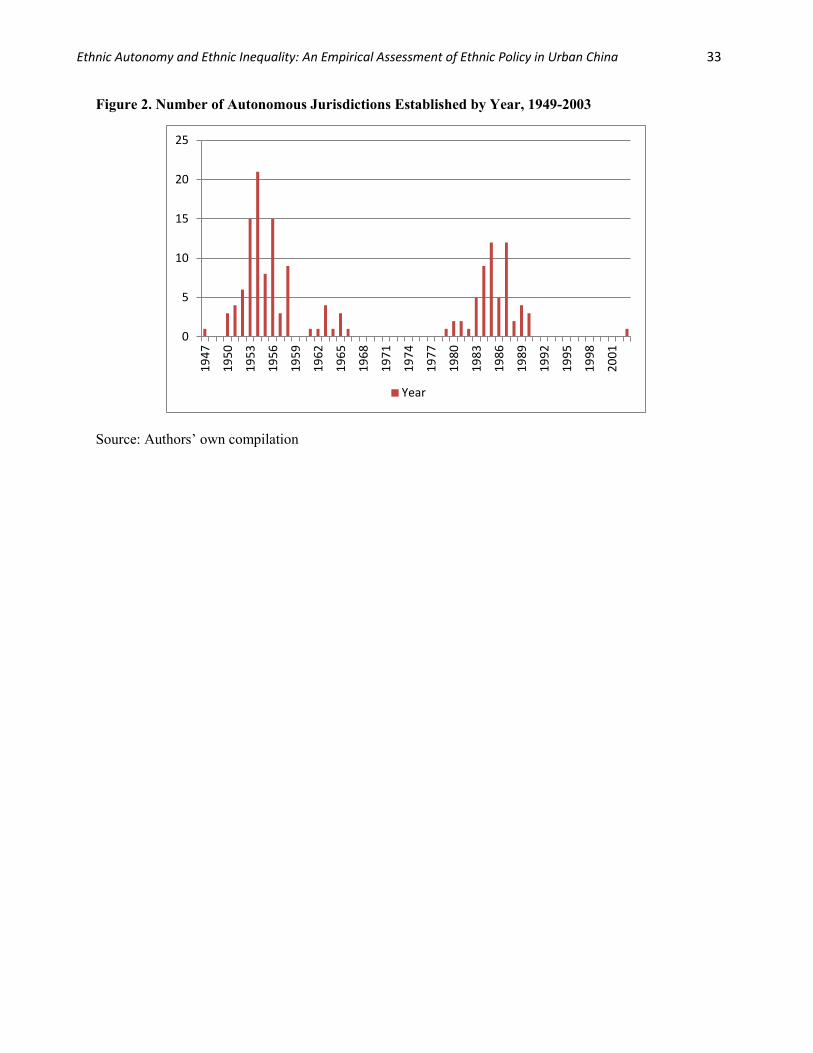
People’s Republic of China. Figure 2 plots the year in which each of the 155 autonomous
jurisdictions in China was established, in which two peak periods can be seen. The first occurred
around 1954, when the first Constitution laid out the new regime’s ethnic policy, whereas the
second occurred around 1984, when the “Law on Regional Autonomy” was enacted after the
chaotic years of the Cultural Revolution. After 1990, only one jurisdiction (Beichuan Qiang
autonomous county in Sichuan) was approved. Therefore, the establishment of new autonomous
jurisdictions has not kept up with the country’s rapid socioeconomic transformations since the
mid-1990s. None of the jurisdictions has ever had its autonomous status revoked.
Figure 3 plots the geographic distribution of the 155 ethnic autonomous jurisdictions in
China, which, not surprisingly, overlap with the areas shown in Figure 1 where most minorities
are concentrated. Notably, an ethnic group may not necessarily be the majority even in
autonomous regions. For instance, in three out of five such regions (the Inner Mongolia, Ningxia
and Guangxi), the Han Chinese still account for the majority of the population (79 percent
vs.17.1 percent Mongolian, 65.5 percent vs. 34.0 percent Zhuang, and 62 percent vs. 34 percent
Hui). At the prefectural level, Koreans account for 39 percent whereas Han account for 59
percent of the total population in Yanbian, Jilin Province; Kazak account for only 25.2 percent of
the total population in Yili, Xinjiang. Therefore, ethnic autonomous areas can be viewed mainly
as a product of state ethnic policies, although they may also be associated with spatial effects on
ethnic disparities.

Ethnic Autonomy and Ethnic Inequality: An Empirical Assessment of Ethnic Policy in Urban China 8
In sum, via both the system of ethnic autonomous regions and preferential treatment policies
towards minorities, the Chinese socialist state is aiming to promote ethnic equality and prevent
any kind of secession or independence. The effectiveness of such policies, however, has not been
empirically examined, likely because appropriate data were unavailable in the past. With the
continuing marketization and decentralization, the socialist redistributive hierarchy that used to
implement ethnic affirmative actions has been encountering daunting challenges in the 21st
century, making it difficult to disentangle the effect of the ethnic preferential policy from that of
market forces undermining the state policy when examining ethnic disparities in the country. Wu
and Song (2014), for instance, approximated the employment sector as a continuum in a single
dimension indicating both the influence of the rising market forces and the declining state to
examine wage disparities between Uyghurs and the Han in Xinjiang—an autonomous region
plagued by ethnic violence in recent years. While they found evidence that the ethnic gap is
negligible within the government sector, suggesting that the ethnic policy continues to be
effective in sectors still under administrative control, the disadvantages that Uyghurs faced in
other economic sectors do not necessarily suggest the failure of the ethnic policy per se, but
rather the changing conditions that lessened their effectiveness. In other words, counterfactual
scenarios between those who were affected and those who were not are needed for comparison to
assess the effectiveness of ethnic preferential treatment policy. Moreover, given the great
heterogeneity among minority groups and across regions (Wu and He 2016), the case of Xinjiang
may be too idiosyncratic to provide a sufficient basis to evaluate the state ethnic policy as a
whole.
The increasing ethnic tension and the escalating ethnic violence in recent decades have
prompted many academic and policy researchers to call for a rethinking of China’s ethnic
autonomy policy. They argue that the current “divide and conquer” tactics, inherited from the
former Soviet Union, are outdated both in terms of tradition and international norm and that
policy should deemphasize ethnic consciousness, improve ethnic relationship and promote
national unity in the long run (Hu and Hu 2011; Leibold 2013; Ma 2007; Sautman 2012).
Although the Chinese government has given no indication that it will change the current ethnic
policies in the near future, it is imperative that we empirically assess the effectiveness of ethnic

Ethnic Autonomy and Ethnic Inequality: An Empirical Assessment of Ethnic Policy in Urban China 9
autonomy for all parties involved to help address the unprecedented and ongoing debate on
policy changes. In this study, we compare between those ethnic groups that live in autonomous
regions and those that live outside in terms of socioeconomic disparities in occupation and wages.
While we are not able to measure ethnic consciousness directly, we indirectly examine the
difference in ethnic identification among children from inter-ethnic families living in and outside
autonomous regions to address the concern that regional autonomy tends to enhance ethnic
minority’s identity (e.g., Cherng and Hannum 2016; Hannuma, Cherng and Wang 2015; Jia and
Persson 2014).
DATA, VARIABLES AND METHODS
Data
We analyze a large sample of the one-percent population sample survey of China performed in
2005 (known as the “mini-census”, N=4,170, 700). This multi-stage stratified clustering
probability sampling survey was conducted by the National Bureau of Statistics to collect social
and demographic information on the national population in China between two censuses. Unlike
previous censuses and mini-censuses, the survey in 2005, for the first time, collected information
on respondents’ wage, work unit sector, working hours, occupation (2-digit code), hukou status,
as well as other demographics such as gender, age, education, and ethnicity (Wu and He 2015).
This mini-census uses a much larger sample than do surveys conducted by academic research
institutes and provides detailed geocode information on the place of residence. Thus it enables us
to compare a specific minority group with the Han in a localized context.
We restrict the analysis to those people residing in prefectures where at least 10 percent of
the population are minorities (save for Yao, which is set at 6 percent in several counties within
certain prefectures of Guangxi, Hunan and Guangdong). This procedure thus excludes those
from regions dominated by the Han in east-coastal and some central regions. We also code the
place of residence by the official autonomous area to which it belongs with reference to a
specific ethnic group. As mentioned earlier, 155 autonomous jurisdictions of different levels
currently exist in China, including 5 autonomous regions (equivalent to provinces), 30

Ethnic Autonomy and Ethnic Inequality: An Empirical Assessment of Ethnic Policy in Urban China 10
autonomous prefectures and 120 autonomous counties/banners. We adopt a coding system that
systematically links a minority’s own ethnicity to regional autonomous status, and prefecture-
level or county-level statistics if they are available, and compare them with the Han locals. Our
sample comprises 305,296 individuals of prime working age (i.e. between 20 and 54 years old),
of which 219,942 (or 72 percent) reside in autonomous areas and 85,354 (or 28 percent) reside in
non-autonomous areas. As shown in Figure 3, ethnic minorities are concentrated in less
developed inland and border regions. Not surprisingly, the majority of the sample still work in
agriculture (N=208,905), whereas 31.6 percent work in other sectors (see Table 1). Our analysis
focuses on the 96,391 individuals in non-agricultural employment, of which 62,449 and 33,942
live in autonomous and non-autonomous jurisdictions respectively. After deleting cases with
missing data at either the individual or county level, we are left with 91,888 individuals who
work full time (i.e. at least 30 hours per week) with a positive wage.
To examine whether autonomous region policy fosters ethnic consciousness and enhances
ethnic minorities’ identity, in a supplementary analysis, we restrict the sample to children aged
15 or under from inter-ethnic families and examine the determinants of children’s ethnicity and
how it varies between autonomous and non-autonomous jurisdictions. A total of 13,080 children
come from inter-ethnic marriages, of which 9,172 and 3,908 live in autonomous and non-
autonomous ethnic areas, respectively.
Variables
The key dependent variables of interest are occupation and hourly wage from work. We code
occupation in two different ways. First, we treat occupation as a dummy variable, with 1
indicating professionals and managers and 0 otherwise. Both professionals and managers are
considered “elite occupations” under China’s state socialist regime (Walder 1995). Second, we
convert the two-digit occupations used in the mini-census into an international socioeconomic
index (ISEI) (Ganzeboom, de Graaf, and Treiman, 1992), which is a continuous variable (see
details in Appendix II, Table 1A, Zhang and Wu 2016).

Ethnic Autonomy and Ethnic Inequality: An Empirical Assessment of Ethnic Policy in Urban China 11
The other dependent variable is hourly wage from work. The mini-census solicited
information on hourly income using the item “income in the last month” divided by the number
of work hours per week multiplied by four (October, 2005), including wages/salary and other
sources of work income such as that from self-employment. Thus income here, primarily wages,
is almost identical to wage. We take the logarithm of hourly wage as the dependent variable in
the following analysis.
Our key independent variables are ethnicity and whether the respondent lives in an
autonomous region. We treat ethnicity as an aggregate category and code it as a dummy (ethnic
minority=1; Han=0). We also replicate the analyses for the large minority groups provided that
enough sample cases are available for analyses. We code autonomous status at both prefecture
and county levels, and also match them with socioeconomic indicators such as GDP per capita.
In the five province-level autonomous regions, all subordinate jurisdictions within a region are
treated as autonomous areas. Hence, some minorities would be highly concentrated in specific
autonomous regions and for these minorities, there would be no comparison groups that live
outside the region (e.g., Uyghurs in Xinjiang).
Other independent variables include gender, education, work experience, and hukou status,
and work unit sector. Gender is coded as a dummy variable (female=1), as is hukou status
(urban=1). Education, as a proxy for human capital, is measured in four levels (1=primary
school or below, 2=junior high school, 3=senior high school, and 4=college or above). To
capture the effect of work experience and its curvilinear relation with wage, we include age and a
squared term in the model (Mincer 1974).
We code work unit in the non-agricultural sector into four categories when they are
included in the models as control variables: government/public institutions, public enterprises,
private enterprises, and self-employment. Most public enterprises were state-owned firms, with a
small proportion being collective enterprises. These four sectors form a hierarchy representing
the extent of influence of state policy (Wu and Song 2014). To control for regional variations in
economic development, we also include a set of dummy variables representing province and
whether the county is designated as “impoverished” by the central government of China. The
latter variable could capture local socioeconomic development to a large extent.1 1 The “impoverished” counties receive special assistance and policy from the State Council to facilitate
the development of their local economy. The list, updated from time to time, contains 592 counties in 27
Ethnic Autonomy and Ethnic Inequality: An Empirical Assessment of Ethnic Policy in Urban China 12
In the supplementary analysis, the dependent variable is whether a child from an inter-
ethnic family is registered as an ethnic minority. It is coded as a dummy variable (yes=1).
Independent variables include hukou status, gender, and age, coded in the same way as before,
and parental education (the father’s or the mother’s education, whichever is higher), which is
coded in four levels also as before. Inter-ethnic families are classified into two types: father is
non-Han and mother is Han; father is Han and mother is non-Han. It is coded as a dummy
variable (father is Han and mother is non-Han). We also exclude inter-ethnic marriages among
minorities. We compare ethnic identity in and outside the autonomous jurisdictions. Due to the
limited size of the subsample, we do not conduct separate analysis for each of the large minority
groups.
Methods and Analytical Strategy
Logistic regression models are employed when the dependent variable is a binary outcome
(attainment of professional/managerial occupation, or whether a child is identified as a minority),
and ordinary least square (OLS) regression models when the dependent variable is continuous
(occupational ISEI or logged wage).
The coefficient for the dummy variable (i.e., ethnic minority) is of particular interest, as it
measures the disparities between minorities and the Han, after controlling for a number of
individual and geographic covariates. Moreover, we create another dummy variable—whether an
individual resides in an autonomous jurisdiction of his/her own ethnicity. We introduce the
interaction term between an individual’s ethnicity and the autonomous region. The coefficient of
this term captures the difference in ethnic gap between autonomous and non-autonomous areas,
which can be interpreted as the result of the ethnic preferential policy.
provinces, of which 375 are in western regions and 217 in central regions, and 232 are in 8
provinces/autonomous regions with a significant proportion of ethnic minorities
(http://www.cpad.gov.cn/publicfiles/business/htmlfiles/FPB/fpyw/201203/175445.html).

Ethnic Autonomy and Ethnic Inequality: An Empirical Assessment of Ethnic Policy in Urban China 13
EMPIRICAL FINDINGS
Descriptive Statistics
Table 2 presents descriptive statistics for selected variables in the analysis, separately for the
Han and minorities and for non-autonomous and autonomous regions. As shown in Table 2,
at least among the non-agricultural workforces, the minorities are indeed faring better than
the Han in terms of socioeconomic attainment. For instance, the percentage of minorities
who received college education is greater than the percentage of Han who did (24.51 percent
vs. 22.93 percent), although the percentage of minorities with primary school education or
below (20.10 percent vs. 12.31 percent) is also greater. Minorities achieved higher-status
occupations, and they are more likely to enter government and public institutions and work
fewer hours, owing to the state preferential policies towards them. On the other hand,
minorities still earn lower monthly or hourly wages. Most of the differences are statistically
significant (p<0.001).
The size of the analytical sample for each subgroup is shown at the bottom of Table 2.
Among 91,888 individuals, 29,011 are minorities, accounting for 31.6 percent of our sample.
This proportion is much higher than the national average, because we have excluded those
who came from Han-dominated areas and are focusing on areas with a mix of minorities and
Han people. Moreover, 59,512 (or 64.8 percent) reside in autonomous jurisdictions and the
rest in non-autonomous ones. Even within autonomous areas, minorities account for only
39.6 percent of the sample (=23,543/59,514).
Ethnic Disparities in Occupational Attainment
As previously mentioned, we employ two variables to measure occupational attainment. The first
is a binary outcome indicating whether the respondent holds a managerial or professional job,
and the second is occupational attainment measured by ISEI.

Ethnic Autonomy and Ethnic Inequality: An Empirical Assessment of Ethnic Policy in Urban China 14
Table 3 presents results from binary logit models predicting the likelihood of attaining
managerial and professional occupations. The key independent variables include minority and
autonomous area, and the control variables include gender, education, age and its squared term,
hukou status, work unit sector, whether the county is “impoverished”, and province. In the left
two columns of Table 3, we estimate the models with the pooled sample from both ethnic
autonomous and non-autonomous areas. Model 1 is an additive model, and positive coefficients
for both minority and autonomous region show the consequence of China’s ethnic preferential
policy: minorities’ odds of becoming a manager or professional are 15.4 percent (e0.143-1) higher
than the Han’s; and the odds for those in autonomous jurisdictions are 14.7 percent (e0.137-1)
higher than the odds for those not in autonomous jurisdictions, net of other factors. The
differences are both statistically significant (p<.001).
In Model 2, we include an interaction term between minority and autonomous area. The
coefficient indicates the difference in minority-Han disparity between autonomous and non-
autonomous regions. Surprisingly, living in autonomous jurisdictions does not seem to accrue
additional advantages to minorities compared to living in non-autonomous jurisdictions. The
coefficient is negative and statistically insignificant.
We have been treating minorities as a single group (vs. the Han). If one minority group lives
in an autonomous area belonging to another minority group, the former group may not be able to
take advantage of the privileges associated with autonomous status (e.g., a Mongolian living in
the Xinjiang Uyghur Autonomous Region, or a Hui living in the Tibet Autonomous Region). To
check this possibility, in the right two columns of Table 3, we run the logit models separately for
those in non-autonomous areas and those in autonomous areas. For the latter we further
distinguish between minorities living in their own autonomous jurisdictions and minorities living
in the autonomous regions of other minorities. Results show that minorities are more likely than
the Han to become a manager or professional in their own autonomous jurisdictions, in the
autonomous areas of other minorities, or in non-autonomous areas, although the difference in
coefficients across the three types of regions is not statistically significant.

Ethnic Autonomy and Ethnic Inequality: An Empirical Assessment of Ethnic Policy in Urban China 15
Given the internal heterogeneity of minorities in terms their socioeconomic relationship with
the Han Chinese (Wu and He 2016), we replicate the analyses above for each of 14 large
minority groups, including Manchus, Yi, Miao, Tujia, Mongols, Dong, Buyi, Yao, Tibetans, Hui,
Koreans, Bai, Li and Dai, and report the coefficients of interest in Table 3A. The coefficient for
interaction terms is not statistically significant, suggesting that these minorities, irrespective of
whether they live in their own autonomous jurisdiction or not, are similarly more likely than the
Han to become a professional or manager. In other words, ethnic autonomy does not bring
additional benefits in access to managerial and professional occupations.
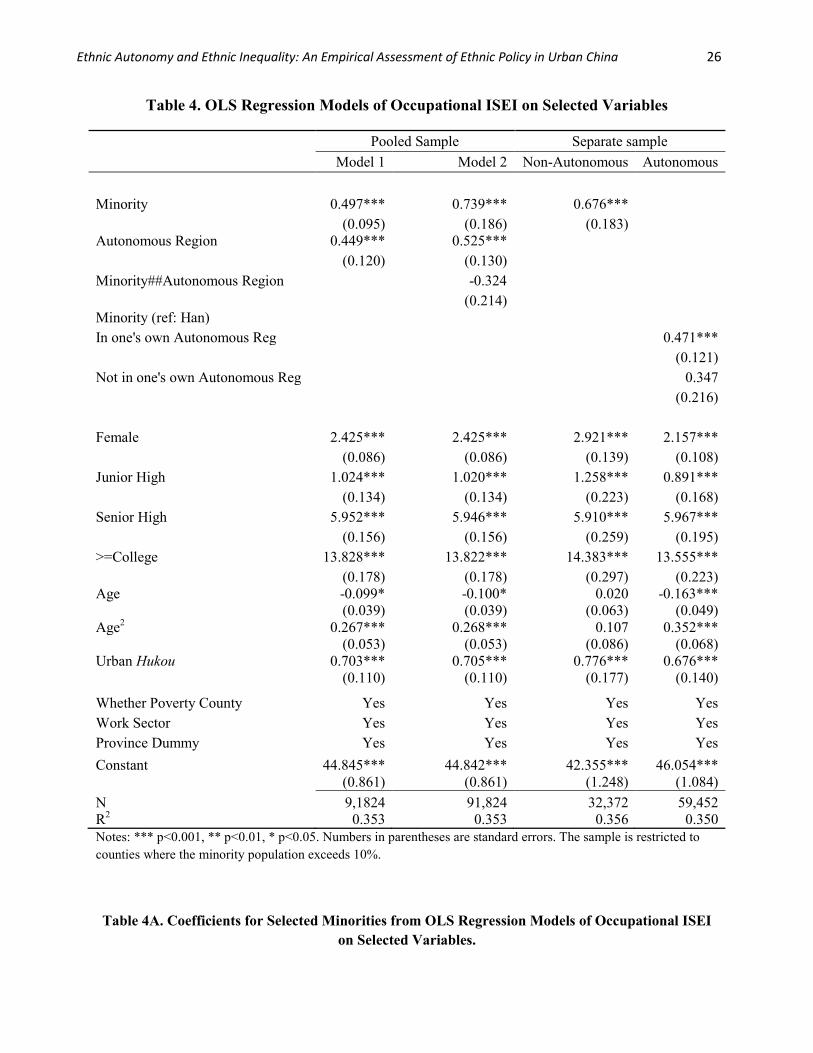
Moreover, we measure the full range of non-agricultural occupations with ISEI, and run OLS
regression models on selected variables. The results are presented in Table 4. As shown in Model
1, consistent with what we have found from logit models in Table 3, minorities’ occupational
ISEIs are indeed higher than the Han’s on average, by a net advantage of 0.497. In addition, on
average, those living in autonomous jurisdictions enjoy higher occupational ISEIs than those
living in non-autonomous regions, by a similar amount (0.449). The differences are statistically
significant (p<.001). Nevertheless, in Model 2, we include an interaction term to examine
whether minorities enjoy additional advantages by living in the autonomous jurisdiction. The
results show that no significant difference exists. Similarly, we run models separately for those
residing in non-autonomous jurisdictions, those in their own autonomous areas, and those in the
autonomous regions of other minorities. The results show that minorities living in autonomous
areas, especially in their own jurisdictions, seem to have enjoyed certain advantages in
occupational status, although those living in the autonomous areas of other minorities do not
differ significantly from the Han in occupational attainment.
We replicate the analyses for each of the 14 large minorities and report relevant estimated
coefficients in Table 4A. Again, with a few exceptions, all coefficients for the interaction terms
are not statistically significant.
Ethnic Autonomy and Ethnic Inequality: An Empirical Assessment of Ethnic Policy in Urban China 16
Ethnic Gaps in Wage
One of the important socioeconomic outcomes that scholars are interested in is wage, which is
closely related to occupation. In Table 5, we present the results from OLS regression on the
determinants of hourly wage (logged). We include the same set of independent variables as
before, as well as occupation. Contrary to the results for occupational attainment, Model 1 shows
that minorities indeed earn significantly less than Han (p<.001), albeit by a mere 4.02 percent (e-
0.041-1). Those living in autonomous areas, on the other hand, enjoy little advantage in wage, over
those living in non-autonomous regions. Moreover, minorities seem not to have benefited from
the regional autonomy system. The negative coefficient for the interaction term in Model 3
suggests that, other things being equal, minorities even earn significantly less than the Han in
autonomous areas than in non-autonomous areas.
By the same token, we replicate the analyses for each of the 14 large minorities and report
relevant estimated coefficients in Table 5A. In terms of wage, whether an ethnic minority
benefits from living in an autonomous region varies substantially, as indicated by the signs of the
coefficients for the interaction term. For instance, Yi and Li seem to have benefited from living
in autonomous regions; Tujia, Yao, and Bai are particularly disadvantaged in wage within the
autonomous regions. The remaining nine minority groups show no significant difference.
Ethnic Identification for Children of Inter-ethnic Marriages
The above analyses of occupational and wage attainment for ethnic minorities and the Han show
that autonomous regions have had little effect on reducing the disparities between the two groups.
The role of ethnic autonomy in promoting ethnic socioeconomic equality is thus doubtful.
Related to the issue of ethnic socioeconomic inequality and the ethnic preferential policy is that
the special policies towards ethnic minorities tend to enhance their ethnic identity and undermine
the concept of national unity (Hu and Hu 2011; Ma 2007). As we are unable to measure ethnic
consciousness or identity directly, we instead analyze the determinants of children’s ethnicity in
mixed families. Table 6 presents the descriptive statistics for selected variables for the whole
sample, and also separately for those living in autonomous and non-autonomous areas. Two-
sample t-tests are conducted to show how the variables differ for those living in the two types of
jurisdictions.

Ethnic Autonomy and Ethnic Inequality: An Empirical Assessment of Ethnic Policy in Urban China 17
As shown in Table 6, among the 13,859 children aged 15 or under born to cross-ethnic
marriages, 9,716 (or 70.1 percent) live in autonomous regions and 4,143 (or 29.9 percent) live
in non-autonomous areas. The percentage of those who identify themselves as minorities is 74.62
in autonomous regions and 73.26 in non-autonomous jurisdictions. The difference, however, is
only marginally significant (p<.10). From those whose mother is a minority and father is Han,
only 42.58 percent on average identify themselves as minorities, even though there is an implicit
rule that children should follow their mother’s ethnic status. Curiously, the percentage of those
who identify themselves in non-autonomous areas than in autonomous regions identify
themselves as minority, and the difference is statistically significant (p<.001).
Table 7 presents the estimated coefficients for binary logit models predicting the ethnic
identification of children from inter-ethnic families. Model 1 includes independent variables such
as autonomous area, urban hukou, gender, age and its squared term, parental education, and
family ethnic composition, as well as “impoverished” county and province dummies. Results
from multivariate analyses show that those living in autonomous areas are more likely than those
living in non-autonomous areas to identify themselves as minorities as opposed to Han, after
controlling for the social and demographic variables. The net odds are 53.0 percent higher (e0.425-
1), and the difference is statistically significant (p<.001). Parental education also increases the
likelihood that children identify themselves as minorities. The net odds of identifying oneself as
a minority are 14.7 percent (e0.137-1), 54.2 percent (e0.433-1), and 45.5 percent (e0.375-1) higher for
children whose parents received junior high school, senior high school, and college or above
education, respectively (p<.001), than for children whose parents only completed primary school
or lower. Moreover, in Model 2, we include an interaction between urban hukou status and
autonomous region. The positive coefficients show that those holding urban hukou status are
more likely to identify themselves as minorities in autonomous areas than in non-autonomous
areas; the odds are 38.1 percent (e0.323-1) higher (p<.05).
Similarly, Model 3 includes the interaction term between parental education and
autonomous area. Results show that children of college-educated parents are about twice as
likely to identify themselves as minorities in autonomous regions than those whose parents
received only primary school education (e0.733), and this difference is statistically significant
(p<.001).
Ethnic Autonomy and Ethnic Inequality: An Empirical Assessment of Ethnic Policy in Urban China 18
In sum, the analysis above provides evidence supporting the claim that ethnic preferential
policy tends to enhance ethnic identity, measured by the ethnic identification of children from
inter-ethnic marriages. Those who possess urban hukou status and have better educated parents
are more likely to identify themselves as minorities, probably because they have better
knowledge about how to take advantage of the state policy towards ethnic minorities.
SUMMARY, CONCLUSIONS AND DISCUSSION
To balance ethno-cultural diversity with national integration, the Chinese government began
formulating a series of ethnic policies in the early 1950s, including ways to identify and classify
ethnic groups, a system of regional ethnic autonomy, and a set of preferential treatment policies
towards 55 minorities. This article aims to examine socioeconomic inequality between ethnic
minorities and the Han majority in China, focusing on the role played by the regional ethnic
autonomy system.
Based on a large sample of China’s mini-census data in 2005, we show that among non-
farm working population, minorities are more likely than the Han to become managers or
professionals, or to attain occupations of higher ISEI, although they are still slightly
disadvantaged in wage compared to the Han majority. These findings strongly suggest that
minorities have benefited from the state preferential policy to a large extent. Moreover, these
differences do not vary between autonomous and non-autonomous regions; minorities are in fact
slightly more disadvantaged in wage in their own autonomous regions than elsewhere. Therefore,
it seems that the ethnic preferential system does not help promote socioeconomic equality
between ethnic minorities and the Han. We replicate the analyses for each of the 18 large
minority groups and results are by and large consistent.
While its role in promoting socioeconomic equality is limited, ethnic autonomous policy
tends to enhance minorities’ group identity. We analyze the ethnic identification of children from
inter-ethnic families in both autonomous and non-autonomous regions. Results show that, other
things being equal, those living in autonomous regions are more likely to identify themselves as

Ethnic Autonomy and Ethnic Inequality: An Empirical Assessment of Ethnic Policy in Urban China 19
the designated minority as opposed to Han, and those holding urban hukou and whose parents are
better educated are more likely to do so in autonomous regions than in non-autonomous regions.
Given that the preferential policies towards ethnic minorities are implemented across the country
rather than in certain autonomous regions only, ethnic identification should not differ by region.
Our results suggest that the system of ethnic autonomy may increase parents’ awareness of the
preferential treatment policy towards minorities and then register their children as minorities to
take advantage of the preferential policy. Those of urban hukou status are more likely to do so
than those of rural hukou status; and children of more educated parents are more likely to do so
too.
Our findings provide an empirical basis for discussions on ethnic issues in China. First,
generally speaking, the state policy to promote ethnic egalitarianism has been successfully
implemented to a large extent. After taking into account the effect of regional uneven
development, ethnic minorities indeed perform better than the Han in occupational attainment,
and their disadvantages in wage are negligible, despite increasing pressure from market forces
and the retreat of the redistributive state (Wu and Song 2014). Second, minorities’
socioeconomic relationships with the Han vary considerably (Wu and He 2016), which may be
linked to each group’s unique history and geographic location. The effectiveness of state ethnic
policies also varies. While the preferential policies towards ethnic minorities seem to work,
regional ethnic autonomy not only contributes little to reducing ethnic inequality, it also tends to
enhance ethnic minorities’ identity. Finally, although the findings have important implications
for the current debate on ethnic policy within China, the ethnic violence in Xinjiang and Tibet
that has added fuel to the debate may not necessarily be an indication of whether the policy has
succeeded or failed. Instead, the violence may simply reflect problems specific to the
autonomous regions.

Ethnic Autonomy and Ethnic Inequality: An Empirical Assessment of Ethnic Policy in Urban China 20
REFERENCES
Bovingdon, Gardner. 2001. “The History of the History of Xinjiang.” Twentieth-Century China 26(2): 95-139.
Bulag, Uradyn E. 2002. The Mongols at China’s Edge: History and the Politics of National Unity. Rowman & Littlefield Publishers.
Cherng, Sebastian and Emily Hannum. 2016. “Ethnic Categorization and Cross-Generational Boundary Crossing in China.” Working paper, New York University.
Elliott, Mark. 2015. “The Case of the Missing Indigene: Debate over a ‘Second-Generation’ Ethnic Policy.” The China Journal 73: 186-213.
Fei, Xiaotong. 1988. “Plurality and Unity in the Configuration of the Chinese People.” at http://www.tannerlectures.utah.edu/lectures/fei90.pdf.
Ganzeboom, Harry. B. G., Paul de Graaf., and Donald Treiman. 1992. “An International Scale of Occupational Status. Social Science Research 21:1–56.
Gladney, Dru 2004. Dislocating China. Chicago, IL: University of Chicago Press. Gustafsson, Björn, and Li Shi. 2003. “The Ethnic Minority-Majority Income Gap in Rural China
during Transition.” Economic Development and Cultural Change 51(4):805–22. Hannum, Emily. 2002. “Educational Stratification by Ethnicity in China: Enrollment and Attainment
in the Early Reform Years.” Demography 39(1):95–117. Hannum, Emily, and Yu Xie. 1998. “Ethnic Stratification in Northwest China: Occupational
Differences between Han Chinese and National Minorities in Xinjiang, 1982-1990.” Demography 35(3):323–33.
Hannum, Emily, Hua-yu Sebastian Cherng and Meiyan Wang 2015 “Ethnic Disparities in Educational Attainment in China: Considering the Implications for Interethnic Families.” Eurasian Geography and Economics. 56(1):8-23.
Hao, Zhidong. 2012. “Sovereignty, Ethnicity, and Culture: The Tibet Issue in an Institutionalist Perspective.” Journal of Contemporary China 21(73):131-147.
Harrell, Stevan. 2001. Perspectives on the Yi of Southwest China. Univ. of California Press. Hasmath, Reza. 2008. “The Big Payoff? Educational and Occupational Attainments of Ethnic
Minorities in Beijing: (Winner EADI Prize 2007).” The European Journal of Development Research 20(1):104–16.
Hu, Angang, and Lianhe Hu. 2011 “Dierdau Minzu Zhengce.” [Second Generation of Ethnic Policies,] Xinjiang Shifan Daxue Xuebao [Journal of Xinjiang Normal University] 32(5):1-13
Information Office of the State Council, 2005. China’s Ethnic Area Autonomy. White Papers (Chinese). (http://news.xinhuanet.com/zhengfu/2005-02/28/ content_2628105.htm, accessed 30.11.10) [in Chinese].
Information Office of the State Council, 2014. The History and Development of Xinjiang Production and Construction Corp. (http://news.xinhuanet.com/politics/2014- 10/05/c_1112715717.htm ) [in Chinese].
Jia, Ruixue, Torsten Persso 2014. “Ethnicity in Children and Mixed Marriages: Theory and Evidence from China.” Working Paper, Univ. of California San Diego.
Kaup, Katherine Palmer. 2000. Creating the Zhuang: Ethnic Politics in China. Lynne Rienner Publishers.

Ethnic Autonomy and Ethnic Inequality: An Empirical Assessment of Ethnic Policy in Urban China 21
Leibold, James. 2013. Ethnic Policy in China: Is Reform Inevitable? Honolulu, HI: East-West Center. (http://scholarspace.manoa.hawaii.edu /handle/10125/30617).
Ma, Rong. 2007. “A New Perspective in Guiding Ethnic Relationship in the Twenty-First Century.” Asian Ethnicity 8(3):199-217.
Mackerras, Colin. 1994. China’s Minorities: Integration and Modernization in the Twentieth Century. Oxford University Press Hong Kong.
Mincer, Jacob. 1974. Schooling, Experience, and Wage. NY: Columbia University Press. Mullaney, Thomas. 2011. Coming to Terms with the Nation: Ethnic Classification in Modern China
Berkeley, CA: University of California Press. National Bureau of Statistics. 2011. “Bulletin on the Major Figures from the Sixth National
Population Census in 2010”. (http://www.gov.cn/test/2012-04/20/content_2118413.htm, access on February 15th, 2014).
Paik, Wooyeal and Myungsik Ham. 2012. “From Autonomous Areas to Non-Autonomous Areas: The Politics of Korean Minority in Contemporary China.” Modern China 38 (1):110-133.
Poston, Dudley L., Jr., and Jing Shu. 1987. “The Demographic and Socioeconomic Composition of China’s Ethnic Minorities.” Population and Development Review 13(4):703–22.
Poston, Dudley L., and Qian Xiong. 2014. “Are China’s Minority Nationalities Still on the Margins?” Pp. 113–37 in Isabelle Attané and Baochang Gu (eds.) Analysing China’s Population. Springer.
Sautman, Barry. 1998. “Preferential Policies for Ethnic Minorities in China: The Case of Xinjiang.” Nationalism and Ethnic Politics 4(1-2):86–118.
Sautman, Barry. 2012. “Paved with Good Intentions: Proposals to Curb Minority Rights and Their Consequences for China.” Modern China, 38(1):10-39.
Tang, Wenfang, Yue Hu and Shuai Jin. 2016 “Affirmative Inaction: Education, Language Proficiency, and Socioeconomic Attainment Among China's Uyghur Minority.” Chinese Sociological Review 48(4):346-366.
Walder, Andrew. 1995. “Career Mobility and the Communist Political Order.” American Sociological Review 60(3): 309-328.
Wu, Xiaogang and Guangye He. 2015.“The Evolution of Population Census Undertakings in China, 1953–2010” The China Review, 15 (Spring): 203–238.
Wu, Xiaogang and Guangye He. 2016. “Changing Ethnic Stratification in Contemporary China.” Journal of Contemporary China [in press].
Wu, Xiaogang, and Xi Song. 2014. “Ethnic Stratification amid China’s Economic Transition: Evidence from the Xinjiang Uyghur Autonomous Region.” Social Science Research 44:158–72.
Zhang, Zhuoni and Xiaogang Wu 2016. “Registration Status, Occupational Segregation, and Rural Migrants in Urban China.” Working Paper.

Ethnic Autonomy and Ethnic Inequality: An Empirical Assessment of Ethnic Policy in Urban China 22
Table 1. Descriptive Statistics of Selected Variables for Restricted Samples
Full Sample Agriculture Non-Agriculture Subtotal Non-Auto Auto Subtotal Non-Auto Auto Subtotal Non-Auto Auto
Minority 48.49 24.45 57.83 56.15 29.35 64.9 31.9 17.02 39.98 Female 45.81 44.74 46.22 49.38 49.31 49.41 38.06 37.82 38.18 Age 36.29 36.91 36.05 36.55 37.44 36.26 35.72 36.09 35.52
(9.05) (8.96) (9.08) (9.34) (9.22) (9.36) (8.38) (8.48) (8.32) Education <=primary 46.67 38.36 49.90 61.13 54.75 63.21 15.35 13.55 16.33 junior high 35.45 41.20 33.22 34.6 40.90 32.54 37.3 41.66 34.93 Senior high 10.47 12.04 9.86 3.99 4.14 3.94 24.53 24.00 24.81 >=college 7.41 8.39 7.02 0.29 0.21 0.32 22.83 20.79 23.93 Urban hukou 21.15 25.51 19.46 2.76 2.3 2.91 60.99 60.66 61.17 “Impoverished” Counties 41.27 30.00 45.65 48.74 38.83 51.98 25.1 16.63 29.71 ISEI 34.83 35.59 34.53 30.51 30.70 30.45 44.18 43.01 44.81
(10.82) (11.19) (10.66) (1.96) (1.56) (2.06) (15.32) (14.83) (15.55) Working Hours/Week 45.23 44.39 45.56 45.23 44.39 45.56 46.64 46.49 46.72
(12.83) (12.90) (12.78) (13.67) (12.90) (13.49) (10.64) (10.49) (10.72) Monthly Income 464.78 518.67 443.87 266.46 273.07 264.31 894.59 890.69 896.71
(597.85) (773.36) (512.31) (237.28) (224.18) (241.36) (860.27) (1094.58) (700.79) Hourly Income 2.68 3.04 2.54 1.57 1.70 1.53 5.05 5.05 5.06
(3.79) (4.93) (3.23) (1.79) (1.62) (1.84) (5.46) (7.05) (4.37) N 305,296 85,354 219,942 208,905 51,412 157,493 96,391 33,942 62,449

Ethnic Autonomy and Ethnic Inequality: An Empirical Assessment of Ethnic Policy in Urban China 23
Table 2. Descriptive Statistics of Selected Variables for Full-Time Employed Individuals
Total Non-autonomous Jurisdictions Autonomous Jurisdictions
All Han Minor All Han Minor All Han Minor Occupation Manager 3.77 3.72 3.90 3.72 3.62 4.24 * 3.8 3.79 3.81 Prof./Assoc. Prof. 20.22 18.42 24.13 *** 17.34 16.97 19.17 *** 21.79 19.50 25.28 *** Clerk 11.09 10.77 11.77 *** 10.26 10.34 9.88 11.16 10.66 11.92 *** Service Worker 30.69 31.56 28.80 *** 30.89 30.82 31.24 30.58 32.12 28.23 ***
Worker 34.23 35.53 31.41 *** 37.45 37.94 35.04 *** 32.47 33.73 30.56 *** ISEI 44.35 43.77 45.62 *** 43.20 43.04 44.02 *** 44.98 44.32 45.99 ***
(15.38) (15.03) (16.03) (14.88) (14.79) (15.30) (15.60) (15.18) (16.17) Working Hours/Week 48.00 48.15 47.67 *** 47.81 47.86 47.55 * 48.10 48.37 47.70 ***
(8.51) (8.58) (8.35) (8.45) (8.47) (8.38) (8.54) (8.66) (8.35) Monthly Wage 905.80 926.49 860.95 *** 899.62 903.10 882.50 909.16 943.99 855.94 ***
(802.70) (850.73) (685.03) (957.86) (1012.41) (623.19) (704.06) (705.49) (698.53) Hourly wage 4.96 5.06 4.74 *** 4.94 4.95 4.88 4.97 5.14 4.71 ***
(4.43) (4.62) (3.97) (5.16) (5.42) (3.67) (3.97) (3.92) (4.04) Female 37.84 37.84 37.84 37.56 37.63 37.25 37.99 38.00 37.98 Education <=primary 14.77 12.31 20.10 *** 13.07 12.58 15.47 *** 15.69 12.10 21.18 *** junior high 37.03 38.98 32.80 *** 41.33 41.65 39.78 * 34.69 36.99 31.18 *** Senior high 24.77 25.78 22.59 *** 24.23 24.55 22.64 ** 25.07 26.70 22.58 *** >=college 23.43 22.93 24.51 *** 21.37 21.21 22.11 24.55 24.21 25.07 *Age 35.71 36.04 34.99 *** 36.07 36.22 35.35 *** 35.51 35.90 34.91 ***
(8.36) (8.27) (8.50) (8.46) (8.45) (8.49) (8.29) (8.13) (8.50) Urban hukou 61.71 64.19 56.35 *** 61.38 62.83 54.22 *** 61.89 65.2 56.84 *** Work Sector Gov./PubInst. 24.05 21.00 30.66 *** 19.81 18.92 24.18 *** 26.36 22.55 32.17 *** State/Collective Enter. 20.32 23.43 13.57 *** 22.29 23.36 17.06 *** 19.25 23.49 12.76 *** Private Enter 25.07 24.51 26.29 *** 27.18 27.27 26.76 23.93 22.45 26.18 *** Self-employed 30.55 31.05 29.48 *** 30.71 30.45 32.00 * 30.47 31.50 28.89 *** “Impoverish” County 25.00 19.62 36.65 *** 16.54 15.56 21.34 *** 29.60 22.66 40.21 *** Established after CR - - - - - - 10.74 8.99 13.43 *** N 91,888 62,877 29,011 32,375 26,907 5,468 59,513 35,970 23,543 Notes: *** p<0.001, ** p<0.01, * p<0.05; numbers in parentheses are standard deviations.

Ethnic Autonomy and Ethnic Inequality: An Empirical Assessment of Ethnic Policy in Urban China 24
Table 3. Binary Logit Models Predicting the Likelihood of Attaining Managerial and Professional Occupations
Pooled Sample Separate sample
Model 1 Model 2 Non-Autonomous Autonomous
Minority 0.143*** 0.176*** 0.121** (0.022) (0.043) (0.044)
Autonomous Region 0.137*** 0.148*** (0.028) (0.030)
Minority##Autonomous Region -0.043(0.049)
Minority (ref: Han) In one's own AutoReg 0.265***
(0.025) Not in one's own AutoReg 0.138**
(0.045)
Female 0.459*** 0.459*** 0.580*** 0.395*** (0.019) (0.019) (0.034) (0.023)
Junior High 0.396*** 0.395*** 0.662*** -0.162***(0.044) (0.044) (0.090) (0.046)
Senior High 1.458*** 1.457*** 1.736*** 0.844***(0.045) (0.045) (0.092) (0.046)
>=College 2.371*** 2.370*** 2.755*** 1.679***(0.048) (0.048) (0.095) (0.050)
Age -0.016 -0.016 -0.003 -0.024*(0.009) (0.009) (0.016) (0.011)
Age2 0.049*** 0.049*** 0.031 0.056*** (0.012) (0.012) (0.022) (0.015)
Urban Hukou 0.048 0.049 0.000 0.047 (0.029) (0.029) (0.050) (0.034)
“Impoverished” County Yes Yes Yes Yes Work Sector Yes Yes Yes Yes Province Dummy Yes Yes Yes Yes
Constant -2.231*** -2.232*** -2.673*** -1.213***(0.205) (0.205) (0.305) (0.202)
N 91,831 91,831 32,375 59,456 Chi2 27325.949 27326.716 9217.769 16641.105 Log-Likelihood -3.69e+04 -3.69e+04 -1.21e+04 -2.55e+04
Notes: *** p<0.001, ** p<0.01, * p<0.05; numbers in parentheses are standard errors. The sample is restricted to counties where the minority population exceeds 10%.

Ethnic Autonomy and Ethnic Inequality: An Empirical Assessment of Ethnic Policy in Urban China 25
Table 3A. Coefficients for Selected Minorities from Logit Models Predicting the Likelihood of Attaining Managerial and Professional Occupations.
Interaction Non-Autonomous Autonomous Ethnic Minority (ref: Han) Manchus -0.319 0.573*** 0.277
(0.215) (0.102) (0.192) Yi -0.381 0.497* 0.038
(0.241) (0.223) (0.103) Miao 0.241 -0.296 0.203
(0.292) (0.280) (0.119) Tujia 0.009 0.042 -0.005
(0.259) (0.214) (0.146) Mongolian -0.377 0.679 0.228**
(0.548) (0.618) (0.073) Dong 0.719 0.066 0.450
(0.466) (0.427) (0.244) Buyi 1.009 -0.068 0.535**
(0.887) (1.179) (0.188) Yao -0.402 0.804 0.233
(0.663) (0.741) (0.157) Tibet 0.041 0.500 0.853***
(0.396) (0.449) (0.079) Hui 0.154 -0.284 -0.041
(0.197) (0.180) (0.081) Korean -0.534 0.784 0.379*
(0.475) (0.466) (0.179) Bai -0.183 0.413 0.161
(0.478) (0.441) (0.214) Li -0.107 0.065 0.085
(0.333) (0.271) (0.225) Dai 0.057 -0.908 -0.086
(0.802) (0.898) (0.248) Notes: *** p<0.001, ** p<0.01, * p<0.05. Numbers in parentheses are standard errors. Interaction is the coefficient of the interaction term between ethnic minority and whether one is living in one’s own autonomous region; for non-autonomous and autonomous regions, the main effect of ethnic minority for one who is living in one’s own autonomous jurisdiction is presented.
Ethnic Autonomy and Ethnic Inequality: An Empirical Assessment of Ethnic Policy in Urban China 26
Table 4. OLS Regression Models of Occupational ISEI on Selected Variables
Pooled Sample Separate sample Model 1 Model 2 Non-Autonomous Autonomous
Minority 0.497*** 0.739*** 0.676*** (0.095) (0.186) (0.183)
Autonomous Region 0.449*** 0.525*** (0.120) (0.130)
Minority##Autonomous Region -0.324(0.214)
Minority (ref: Han) In one's own Autonomous Reg 0.471***
(0.121) Not in one's own Autonomous Reg 0.347
(0.216)
Female 2.425*** 2.425*** 2.921*** 2.157*** (0.086) (0.086) (0.139) (0.108)
Junior High 1.024*** 1.020*** 1.258*** 0.891*** (0.134) (0.134) (0.223) (0.168)
Senior High 5.952*** 5.946*** 5.910*** 5.967*** (0.156) (0.156) (0.259) (0.195)
>=College 13.828*** 13.822*** 14.383*** 13.555*** (0.178) (0.178) (0.297) (0.223)
Age -0.099* -0.100* 0.020 -0.163***(0.039) (0.039) (0.063) (0.049)
Age2 0.267*** 0.268*** 0.107 0.352***(0.053) (0.053) (0.086) (0.068)
Urban Hukou 0.703*** 0.705*** 0.776*** 0.676*** (0.110) (0.110) (0.177) (0.140)
Whether Poverty County Yes Yes Yes Yes Work Sector Yes Yes Yes Yes Province Dummy Yes Yes Yes Yes
Constant 44.845*** 44.842*** 42.355*** 46.054*** (0.861) (0.861) (1.248) (1.084)
N 9,1824 91,824 32,372 59,452 R2 0.353 0.353 0.356 0.350 Notes: *** p<0.001, ** p<0.01, * p<0.05. Numbers in parentheses are standard errors. The sample is restricted to counties where the minority population exceeds 10%.
Table 4A. Coefficients for Selected Minorities from OLS Regression Models of Occupational ISEI on Selected Variables.

Ethnic Autonomy and Ethnic Inequality: An Empirical Assessment of Ethnic Policy in Urban China 27
Interaction Non-Autonomous Autonomous Ethnic Minority (ref: Han) Manchus -1.623* 2.576*** 1.036
(0.778) (0.386) (0.744) Yi -0.562 0.713 -0.173
(0.984) (0.906) (0.417)Miao 2.670* -0.683 1.549**
(1.192) (1.123) (0.570)Tujia 0.051 0.678 0.055
(0.987) (0.815) (0.575) Mongolian 0.494 -0.202 0.707
(2.469) (2.115) (0.367) Dong 2.601 -0.963 0.911
(1.838) (1.649) (0.960) Buyi 3.842 -1.359 1.964*
(2.637) (2.333) (0.851) Yao -2.358 3.519* 0.527
(1.874) (1.731) (0.665) Tibet -0.060 1.441 3.169***
(2.466) (2.008) (0.562) Hui 0.246 -0.182 -0.132
(0.738) (0.731) (0.327)Korean -1.015 1.375 0.999
(2.056) (1.960) (0.768) Bai -0.402 -1.592 -1.914*
(1.656) (1.462) (0.794)Li -1.237 0.777 -0.393
(1.445) (1.123) (0.987)Dai 2.056 -4.177 -0.747
(2.891) (2.565) (0.849)Notes: *** p<0.001, ** p<0.01, * p<0.05. Numbers in parentheses are standard errors. Interaction is the coefficient of the interaction term between ethnic minority and whether one is residing in one’s own autonomous jurisdiction; for non-autonomous and autonomous jurisdictions, the main effect of ethnic minority for one who is residing in one’s own autonomous jurisdiction is presented.

Ethnic Autonomy and Ethnic Inequality: An Empirical Assessment of Ethnic Policy in Urban China 28
Table 5. OLS Regression Models of the Logarithm of Hourly Wage on Selected Variables
Pooled Sample Separate Sample Model 1 Model 2 Model 3 Non-Auto Auto
Minority -0.041*** -0.043*** 0.004 -0.064*** (0.004) (0.004) (0.008) (0.010)
Autonomous Region/100 0.006 -0.174 1.321* (0.543) (0.542) (0.587)
Minority##Autonomous Region -0.064***(0.010)
Minority (ref: Han) In one's own Autonomous Reg -0.075***
(0.005)Not in one's own Autonomous Reg 0.001
(0.010)
Female -0.228*** -0.229*** -0.229*** -0.239*** -0.225***(0.004) (0.004) (0.004) (0.006) (0.005)
Junior High 0.183*** 0.178*** 0.177*** 0.158*** 0.187*** (0.006) (0.006) (0.006) (0.010) (0.008)
Senior High 0.359*** 0.339*** 0.338*** 0.314*** 0.349*** (0.007) (0.007) (0.007) (0.012) (0.009)
>=College 0.693*** 0.648*** 0.647*** 0.667*** 0.633*** (0.008) (0.008) (0.008) (0.014) (0.010)
Age 0.040*** 0.040*** 0.040*** 0.037*** 0.042*** (0.002) (0.002) (0.002) (0.003) (0.002)
Age2 -0.046*** -0.047*** -0.047*** -0.044*** -0.048***(0.002) (0.002) (0.002) (0.004) (0.003)
Urban Hukou 0.088*** 0.088*** 0.089*** 0.060*** 0.105*** (0.005) (0.005) (0.005) (0.008) (0.006)
Occupation Dummy No Yes Yes Yes Yes Whether Poverty County Yes Yes Yes Yes Yes Work Sector Yes Yes Yes Yes Yes Province Dummy Yes Yes Yes Yes Yes Constant 0.775*** 0.999*** 0.998*** 1.092*** 0.849***
(0.039) (0.040) (0.040) (0.059) (0.050) N 91,161 91,161 91,161 32,129 59,032 R2 0.335 0.340 0.341 0.327 0.353 Notes: *** p<0.001, ** p<0.01, * p<0.05. Numbers in parentheses are standard errors. The sample is restricted to counties where the minority population exceeds 10%.

Ethnic Autonomy and Ethnic Inequality: An Empirical Assessment of Ethnic Policy in Urban China 29
Table 5A. Coefficients for Selected Minorities from OLS Regression Models of the Logarithm of Hourly Wage on Selected Variables
Interaction Non-Autonomous Autonomous Ethnic Minority (ref: Han) Manchus 0.051 -0.023 0.011
(0.035) (0.017) (0.033) Yi 0.166*** -0.160*** -0.038
(0.048) (0.045) (0.020)Miao 0.096 -0.059 -0.039
(0.052) (0.051) (0.024)Tujia -0.178*** 0.081* -0.089***
(0.045) (0.037) (0.026)Mongol -0.101 0.128 -0.031
(0.108) (0.110) (0.016)Dong 0.019 -0.151* -0.061
(0.080) (0.072) (0.042)Buyi 0.030 -0.087 -0.056
(0.108) (0.102) (0.035)Yao -0.393*** 0.154 -0.088**
(0.081) (0.094) (0.028)Tibet -0.157 0.003 -0.074**
(0.112) (0.079) (0.026)Hui -0.057 0.056 -0.017
(0.032) (0.032) (0.014)Korean 0.017 0.053 0.152***
(0.082) (0.077) (0.031)Bai -0.249** 0.154* -0.169***
(0.080) (0.072) (0.037)Li 0.153* -0.191*** -0.082
(0.062) (0.047) (0.044)Dai -0.220 0.208 -0.051
(0.150) (0.121) (0.045)Notes: *** p<0.001, ** p<0.01, * p<0.05. Numbers in parentheses are standard errors. Interaction is the coefficient of the interaction term between ethnic minority and whether one is living in one’s own autonomous region; for non-autonomous and autonomous jurisdictions, the main effect of ethnic minority for one who is living in one’s own autonomous jurisdiction is presented.

Ethnic Autonomy and Ethnic Inequality: An Empirical Assessment of Ethnic Policy in Urban China 30
Table 6. Descriptive Statistics of Selected Variables for Children (<16 years old) from Inter-Ethnic (Han-NonHan) Families
Non-Autonomous Autonomous Total Sig Non-Han 73.26 74.62 74.21 Urban Hukou 22.23 23.22 22.92 Female 47.74 47.81 47.79 Age 8.10 8.23 8.19
(4.46) (4.47) (4.47) Parental Education Less than Primary 31.57 34.42 33.57 **
Junior High 47.84 42.79 44.30 *** Senior High 11.32 13.00 12.50 **
College or above 9.27 9.80 9.64
Familial Ethnic Composition M: Nonhan F: Han 50.35 42.58 44.9 *** Observations 4,143 9,716 13,859

Ethnic Autonomy and Ethnic Inequality: An Empirical Assessment of Ethnic Policy in Urban China 31
Table 7. Binary Logit Model Predicting Co-Residing Children’s Ethnic Identity in Inter-ethnic (Han-Non Han) Families
Model 1 Model 2 Model 3 Autonomous Region 0.425*** 0.366*** 0.348***
(0.056) (0.060) (0.081) Urban Hukou 0.074 -0.138 0.072
(0.072) (0.104) (0.072) Female 0.030 0.030 0.028
(0.043) (0.043) (0.043) Age 0.003 0.003 0.003
(0.005) (0.005) (0.005) Age2 -0.003 -0.003 -0.003
(0.002) (0.002) (0.002)Parental Education (ref: <=Primary) Junior HS 0.137** 0.137** 0.135
(0.051) (0.051) (0.091) Senior HS 0.433*** 0.426*** 0.306*
(0.083) (0.083) (0.142) College+ 0.375*** 0.370*** -0.102
(0.106) (0.106) (0.155)Familial Ethnic Composition (Ref: F: Nonhan M: Han) M: Nonhan F: Han 1.898*** 1.896*** 1.896***
(0.051) (0.051) (0.051)
Interactions Autonomous * Urban Hukou 0.323**
(0.115) Autonomous *Parental Junior HS 0.003
(0.106) Autonomous *Parental Senior HS 0.187
(0.163) Autonomous *Parental College or Above 0.733***
(0.177) Poverty County Yes Yes Yes Province Dummy Yes Yes Yes
Constant 1.110 1.125* 1.147* (0.568) (0.567) (0.571)
N 13,845 13,845 13,845 Chi2 2443.296 2451.101 2462.970 Log-Likelihood -6685.319 -6681.417 -6675.482Notes: *** p<0.001, ** p<0.01, * p<0.05. Numbers in parentheses are standard errors. The sample is restricted to counties where the minority proportion exceeds 10%.

Ethnic Autonomy and Ethnic Inequality: An Empirical Assessment of Ethnic Policy in Urban China 32
Figure 1. Geographic Distribution of the 18 Largest Ethnic Minority Groups in China, 2005
* Prefectures where the minority population exceeds 10 percent (the threshold is set at 6 percent for Yao people,who are concentrated in several counties within certain prefectures of Guangxi, Hunan and Guangdong dominatedby the Han population).
Ethnic Autonomy and Ethnic Inequality: An Empirical Assessment of Ethnic Policy in Urban China 33
Figure 2. Number of Autonomous Jurisdictions Established by Year, 1949-2003
Source: Authors’ own compilation
0
5
10
15
20
25
1947
1950
1953
1956
1959
1962
1965
1968
1971
1974
1977
1980
1983
1986
1989
1992
1995
1998
2001
Year

Ethnic Autonomy and Ethnic Inequality: An Empirical Assessment of Ethnic Policy in Urban China 34
Figure 3. Ethnic Autonomous Jurisdictions in China (2012)
Source: http://www.seac.gov.cn/col/col108/index.html
Copyright © 2022 FDOKUMEN


![Skvirsky [Ethnic Turn] for ETDfinal3 - CiteSeerX](https://static.fdokumen.com/doc/165x107/631f1c694573ad0c3e02e959/skvirsky-ethnic-turn-for-etdfinal3-citeseerx.jpg)