Do changes in environmental and fishing pressures impact marine communities? An empirical assessment
39
Please note that this is an author-produced PDF of an article accepted for publication following peer review. The definitive publisher-authenticated version is available on the publisher Web site 1 Journal of Applied Ecology August 2010, Volume 47 Issue 4, Pages 741 - 750 http://dx.doi.org/10.1111/j.1365-2664.2010.01841.x © 2010 British Ecological Society, Wiley Blackwell Publishing, Inc. The definitive version is available at http://www3.interscience.wiley.com/ Archimer http://archimer.ifremer.fr Do changes in environmental and fishing pressures impact marine communities? An empirical assessment Marie-Joëlle Rochet 1, *, Verena M. Trenkel 1 , André Carpentier 2 , Franck Coppin 2 , Luis Gil de Sola 3 , Jean-Pierre Léauté 4 , Jean-Claude Mahé 5 , Porzia Maiorano 6 , Alessandro Mannini 7 , Matteo Murenu 8 , GerJan Piet 9 , Chrissi-Yianna Politou 10 , Bruno Reale 11 , Maria-Teresa Spedicato 12 , George Tserpes 13 and Jacques A. Bertrand 1 1 Ifremer, B.P. 21105, 44311 Nantes CEDEX 03, France 2 Ifremer, 150, quai Gambetta, BP 699, 62321 Boulogne-sur-Mer Cedex, France 3 Instituto Español de Oceanografía, Muelle Pesquero s/n, 29640 Fuengirola, Spain 4 Ifremer, Place du Seminaire – BP 7, 17137 L'Houmeau, France 5 Ifremer, 8, rue François Toullec, 56100 Lorient, France 6 Department of Animal and Environmental Biology, Università di Bari, Via Orabona, 4 – 70125 Bari, Italy 7 Università di Genoa – DIP.TE.RIS., Viale Benedetto XV, 3 – 16132 Genoa, Italy 8 Dipartimento Biologia Animale ed Ecologia, Università degli Studi di Cagliari, V.le Poetto, 1 – 09126 Cagliari, Italy 9 Wageningen IMARES, PO Box 68, 1970 AB IJmuiden, The Netherlands 10 Hellenic Centre for Marine Research, Institute of Marine Biological Resources, Agios Kosmas, 16777 Helliniko, Greece 11 C.I.B.M., V.le N. Sauro, 4 – 57128 Livorno, Italy 12 COISPA TECNOLOGIA & RICERCA, Via dei Trulli, 18/20, 70126 – BARI, Torre a Mare, Italy 13 Hellenic Centre for Marine Research, PO Box 2214, 71003 Poros, Heraklion, Greece *: Corresponding author : M.-J. Rochet, email address : [email protected] Abstract: 1. The development of ecosystem approaches to environmental management implies the need to account for multiple pressures on ecosystems. Trends in multiple metrics that respond differently to changes in major environmental pressures need to be combined to evaluate the impacts of fishing and environmental changes on fish communities. 2. An exploited fish community is viewed as a three-level food chain in which the two upper levels, or functional groups, are targeted by fishing fleets, while the lowest level is subject to environmental variation. Qualitative modelling is used to predict changes at the two upper levels, that is, top-down vs. bottom-up perturbations. Abundance and length metrics are calculated from survey data for 14 Mediterranean and East-Atlantic groundfish shelf communities at both population and functional group levels. The joint likelihood of time trends in metrics is used to evaluate the evidence for different causes of changes.
-
Upload
independent -
Category
Documents
-
view
4 -
download
0
Transcript of Do changes in environmental and fishing pressures impact marine communities? An empirical assessment
Ple
ase
note
that
this
is a
n au
thor
-pro
duce
d P
DF
of a
n ar
ticle
acc
ept
ed fo
r pu
blic
atio
n fo
llow
ing
peer
rev
iew
. The
def
initi
ve p
ub
lish
er-a
uthe
ntic
ated
ve
rsio
n is
ava
ilab
le o
n th
e pu
blis
her
Web
site
1
Journal of Applied Ecology August 2010, Volume 47 Issue 4, Pages 741 - 750 http://dx.doi.org/10.1111/j.1365-2664.2010.01841.x © 2010 British Ecological Society, Wiley Blackwell Publishing, Inc. The definitive version is available at http://www3.interscience.wiley.com/
Archimerhttp://archimer.ifremer.fr
Do changes in environmental and fishing pressures impact marine communities? An empirical assessment
Marie-Joëlle Rochet1, *, Verena M. Trenkel1, André Carpentier2, Franck Coppin2, Luis Gil de Sola3,
Jean-Pierre Léauté4, Jean-Claude Mahé5, Porzia Maiorano6, Alessandro Mannini7, Matteo Murenu8, GerJan Piet9, Chrissi-Yianna Politou10, Bruno Reale11, Maria-Teresa Spedicato12, George Tserpes13
and Jacques A. Bertrand1 1 Ifremer, B.P. 21105, 44311 Nantes CEDEX 03, France 2 Ifremer, 150, quai Gambetta, BP 699, 62321 Boulogne-sur-Mer Cedex, France 3 Instituto Español de Oceanografía, Muelle Pesquero s/n, 29640 Fuengirola, Spain 4 Ifremer, Place du Seminaire – BP 7, 17137 L'Houmeau, France 5 Ifremer, 8, rue François Toullec, 56100 Lorient, France 6 Department of Animal and Environmental Biology, Università di Bari, Via Orabona, 4 – 70125 Bari, Italy 7 Università di Genoa – DIP.TE.RIS., Viale Benedetto XV, 3 – 16132 Genoa, Italy 8 Dipartimento Biologia Animale ed Ecologia, Università degli Studi di Cagliari, V.le Poetto, 1 – 09126 Cagliari, Italy 9 Wageningen IMARES, PO Box 68, 1970 AB IJmuiden, The Netherlands 10 Hellenic Centre for Marine Research, Institute of Marine Biological Resources, Agios Kosmas, 16777 Helliniko, Greece 11 C.I.B.M., V.le N. Sauro, 4 – 57128 Livorno, Italy 12 COISPA TECNOLOGIA & RICERCA, Via dei Trulli, 18/20, 70126 – BARI, Torre a Mare, Italy 13 Hellenic Centre for Marine Research, PO Box 2214, 71003 Poros, Heraklion, Greece *: Corresponding author : M.-J. Rochet, email address : [email protected]
Abstract:
1. The development of ecosystem approaches to environmental management implies the need to account for multiple pressures on ecosystems. Trends in multiple metrics that respond differently to changes in major environmental pressures need to be combined to evaluate the impacts of fishing and environmental changes on fish communities.
2. An exploited fish community is viewed as a three-level food chain in which the two upper levels, or functional groups, are targeted by fishing fleets, while the lowest level is subject to environmental variation. Qualitative modelling is used to predict changes at the two upper levels, that is, top-down vs. bottom-up perturbations. Abundance and length metrics are calculated from survey data for 14 Mediterranean and East-Atlantic groundfish shelf communities at both population and functional group levels. The joint likelihood of time trends in metrics is used to evaluate the evidence for different causes of changes.

Ple
ase
note
that
this
is a
n au
thor
-pro
duce
d P
DF
of a
n ar
ticle
acc
ept
ed fo
r pu
blic
atio
n fo
llow
ing
peer
rev
iew
. The
def
initi
ve p
ub
lish
er-a
uthe
ntic
ated
ve
rsio
n is
ava
ilab
le o
n th
e pu
blis
her
Web
site
2
3. A wide diversity of impacts is found to have equal evidence at the population level within each community. Consistency between the impacts identified and changes in pressures known from independent information is found at the functional group and community level. The results suggest that there is some compensation between species within functional groups.
4. Synthesis and applications. The method can be used to conduct an integrated assessment of community dynamics subject to multiple pressures. Joint trends in metrics provide evidence of which known pressures are having an impact on the community, and thus, which management actions should be taken to mitigate these changes.
Keywords: bottom-up control • community metrics • compensation • ecosystem approach to fisheries • ecosystem assessment • functional groups • groundfish community • Mediterranean • North Atlantic • top-down control
1. Introduction
The development of ecosystem approaches to environmental management implies taking account of multiple pressures. For example, the European Marine Strategy Framework Directive (2008) includes a list of the predominant pressures and impacts exerted by human activities on marine waters, including underwater noise, inputs of fertilizers and selective extraction of species. Indicators are widely accepted as tools to monitor changes in ecosystems and several indicators are needed to identify multiple pressures on ecosystems. However methods are lacking for integrating signals from indicators. Current methods consist of presenting raw time-series (Link & Brodziak 2002), correlated time-trends highlighted using traffic-light-type colouring (DFO 2003) or composite indices (averages, or ratios) such as the ‘Living planet index’ (Loh et al. 2005) (ref). The latter convey a broad measure of ‘sustainability’ or ‘ecological integrity’, but provide little understanding of what is actually changing and why. Moreover, divergent trends in single metrics might cancel each other and precious information could be lost. There have been attempts to identify causes of changes by combining information on changes in indicator species that react differently to different sources of pollution (Lenihan et al. 2003), or in population metrics more sensitive to variations in mortality or recruitment (the number of fish that enter the exploitable population each year) (Trenkel, Rochet & Mesnil 2007). This study aims to generalize this approach. We hypothesize that changes in pressures cause changes in ecosystem state which we call impacts and examine whether combining trends in multiple metrics can detect the effects of changes in major pressures, that is, help to identify likely causes of impacts.
Human activities generate pressures at the level of organisms by impairing physiological processes such as growth or reproduction, or by increasing mortality. Impacts on individuals may or may not propagate to the population level, and population impacts in turn may or may not emerge at the community level (Sandström et al. 2005). Impacts at all organisational levels are of policy relevance (Jones & Lawton 1995).
It has been contended that functional groups are an appropriate level for tracking the impacts of environmental pressures (Mouillot et al. 2006; Sanders et al. 2007). Under the compensation paradigm, populations within a functional group have distinctive sensitivities to pressures, which leads to variation between population responses, and buffers effects at the functional group level. This has been examined for fish (Duplisea & Blanchard 2005; Shackell & Frank 2007), plankton (Fischer, Frost & Ives 2001), and other plant or animal communities (Houlahan et al. 2007). Alternatively, ecosystems are viewed as networks in which functional groups are the nodes and impacts propagate through the food web (Hulot et al. 2000; Vasas et al. 2007; Frank, Petrie & Shackell 2008). Under the network paradigm, impacts should be found precisely at the functional group level. Given the two paradigms, the question is then, which organization level—populations within groups or functional group—is the most sensitive to pressure changes and is therefore the most appropriate to identify impacts?
Exploited fish communities are subject to fisheries and environmental drivers that propagate through the food web owing to multi-species interactions (Hall 1999). Ecosystem functions of interest relate to productivity, energy transfer from primary production to fish and the provision of edible resources to fishing fleets. Two kinds of pressures might affect these functions: those that modify productivity of lower trophic levels, such as pollution and eutrophication, and fishing pressure, which will cause mortality of target and by-catch species.
There is an ongoing discussion regarding whether marine communities are top-down or bottom-up controlled. If top-down controlled, impacts of fishing would propagate to lower trophic levels while if bottom-up controlled, environmental variability would be a driver of changes at higher trophic levels. Generally, top-down effects of predation have been found to be transferred farther in food webs than bottom-up effects of eutrophication (Borer, Halpern & Seabloom 2006). However, recent publications suggest that both bottom-up and top-down
3
effects are important in the marine environment (Daskalov et al. 2007; Vasas et al. 2007; Frank et al. 2008; Link et al. 2008).
This study compares 14 temperate exploited groundfish communities to elucidate whether changes in fishing and environmental pressures are propagated bottom-up, top-down, or both. We use models of expected changes in state due to fishing or environmental pressures, based on a qualitative analysis, i.e. a mathematical analysis of the direction, not amount, of change (Hulot et al. 2000; Dambacher et al. 2009). Metrics that describe changes at population and functional group levels are also needed. We use trawl survey data to estimate length- and number-based metrics. While population metrics are well developed (Hall & Mainprize 2004), there has been less consideration of appropriate metrics for functional groups. If the species in a functional group are interchangeable (network paradigm), aggregate properties such as total abundance are suitable. However, if species vary in their contribution to the group function (compensation paradigm), averages across populations might be more appropriate (Sanders et al. 2007). We compare both types of metrics because either paradigm could apply. Finally, the trends in metrics need to be combined, taking account of uncertainty and variability. We use the likelihood principle to identify the causes that best explain observed trends in metrics, and the sum of log-likelihood values to combine evidence across metrics, populations, and organization levels (Trenkel & Rochet 2010).
The consistency of the causes of impacts derived from joint metric time trends is evaluated to determine the controlling pressures for the 14 groundfish communities. The role of functional groups, buffers or transmitters of pressures, is examined by comparing the results for different types of metrics. The sensitivity of results to methodological details, including the choice of metrics or functional groups is examined.
2. Materials and methods
2.1. Changes in pressures Fishing generally inflicts mortality at two trophic levels: piscivores, and a lower trophic level that might be their prey. Changes in temperature and hydrodynamic conditions will result in changes in the timing, amount, and quality of primary production, modifying food availability, which will affect recruitment and/or individual growth in some way depending on the biology of each species. Similarly, eutrophication will locally enhance primary production and possibly indirectly fish growth. We gathered information on these three groups of factors (piscivore fishing, prey fishing, and ecosystem productivity) and their direction of change over the last two decades for each groundfish community (see Appendix S1 in Supporting Information).
2.2. Predictions of impacts We used ecological knowledge and modelling to predict the impact of changes in fishing or ecosystem productivity on two classes of metrics: firstly expressing abundance and secondly related to size structure. Different models were used for the population and functional group levels.
At the population level, classical results of population dynamics models predict the expected direction of change in abundance and length structure of populations following changes in pressure (Table 1). Specifically, increased fishing mortality F decreases both population abundance N and size structure L (Beverton & Holt 1957) while increased productivity can lead to strong year-classes, i.e. increase recruitment R, which will increase population abundance and shift its length-structure to smaller sizes (Beverton & Holt 1957). Increased productivity might also enhance growth, thereby shifting the length distribution to larger sizes (Rijnsdorp & van Leeuwen 1996). These predictions only consider first-order effects and neglect density-dependence in growth and recruit survival (Rose et al. 2001), or evolutionary effects of size-selective fishing (Stokes, McGlade & Law 1993). Having predicted the expected
4
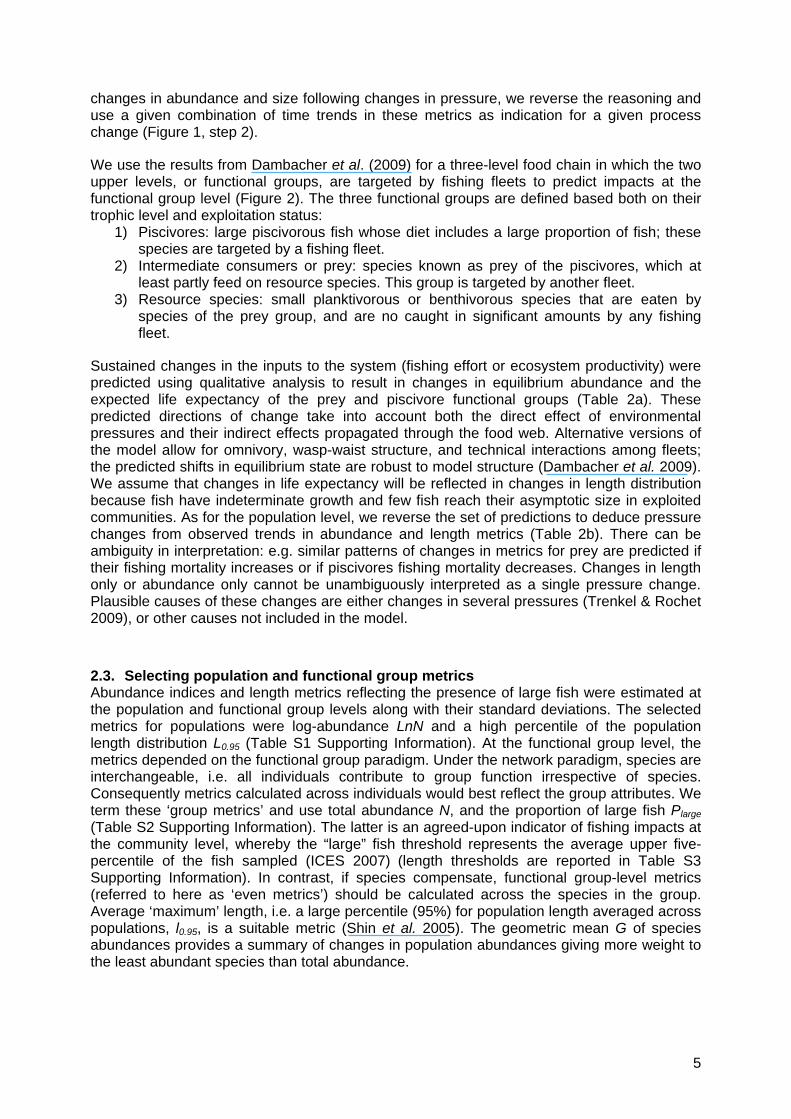
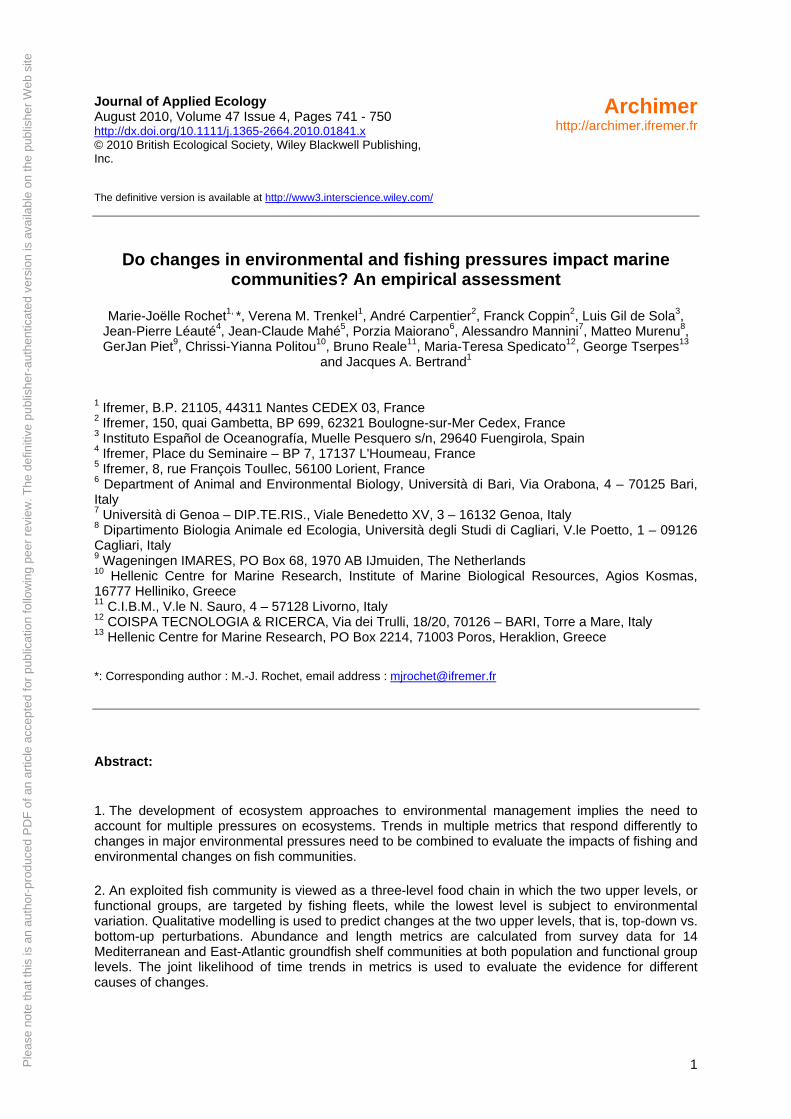
changes in abundance and size following changes in pressure, we reverse the reasoning and use a given combination of time trends in these metrics as indication for a given process change (Figure 1, step 2).
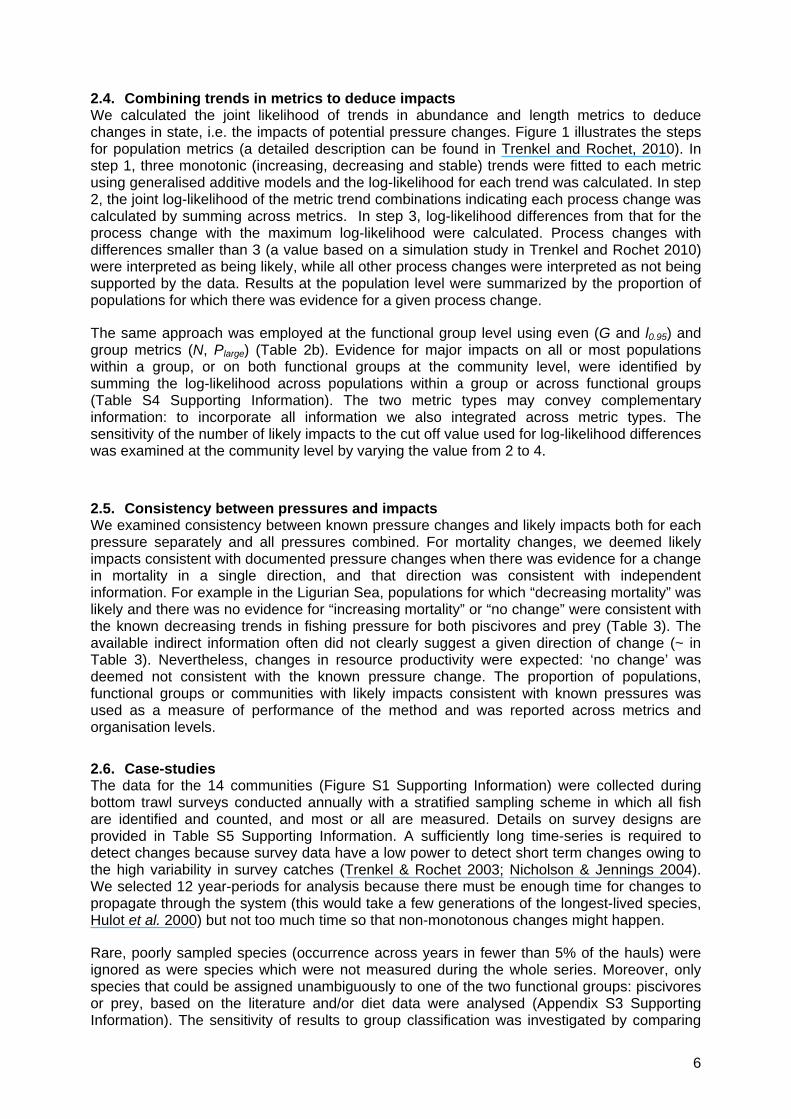
We use the results from Dambacher et al. (2009) for a three-level food chain in which the two upper levels, or functional groups, are targeted by fishing fleets to predict impacts at the functional group level (Figure 2). The three functional groups are defined based both on their trophic level and exploitation status:
1) Piscivores: large piscivorous fish whose diet includes a large proportion of fish; these species are targeted by a fishing fleet.
2) Intermediate consumers or prey: species known as prey of the piscivores, which at least partly feed on resource species. This group is targeted by another fleet.
3) Resource species: small planktivorous or benthivorous species that are eaten by species of the prey group, and are no caught in significant amounts by any fishing fleet.
Sustained changes in the inputs to the system (fishing effort or ecosystem productivity) were predicted using qualitative analysis to result in changes in equilibrium abundance and the expected life expectancy of the prey and piscivore functional groups (Table 2a). These predicted directions of change take into account both the direct effect of environmental pressures and their indirect effects propagated through the food web. Alternative versions of the model allow for omnivory, wasp-waist structure, and technical interactions among fleets; the predicted shifts in equilibrium state are robust to model structure (Dambacher et al. 2009). We assume that changes in life expectancy will be reflected in changes in length distribution because fish have indeterminate growth and few fish reach their asymptotic size in exploited communities. As for the population level, we reverse the set of predictions to deduce pressure changes from observed trends in abundance and length metrics (Table 2b). There can be ambiguity in interpretation: e.g. similar patterns of changes in metrics for prey are predicted if their fishing mortality increases or if piscivores fishing mortality decreases. Changes in length only or abundance only cannot be unambiguously interpreted as a single pressure change. Plausible causes of these changes are either changes in several pressures (Trenkel & Rochet 2009), or other causes not included in the model.
2.3. Selecting population and functional group metrics Abundance indices and length metrics reflecting the presence of large fish were estimated at the population and functional group levels along with their standard deviations. The selected metrics for populations were log-abundance LnN and a high percentile of the population length distribution L0.95 (Table S1 Supporting Information). At the functional group level, the metrics depended on the functional group paradigm. Under the network paradigm, species are interchangeable, i.e. all individuals contribute to group function irrespective of species. Consequently metrics calculated across individuals would best reflect the group attributes. We term these ‘group metrics’ and use total abundance N, and the proportion of large fish Plarge (Table S2 Supporting Information). The latter is an agreed-upon indicator of fishing impacts at the community level, whereby the “large” fish threshold represents the average upper five-percentile of the fish sampled (ICES 2007) (length thresholds are reported in Table S3 Supporting Information). In contrast, if species compensate, functional group-level metrics (referred to here as ‘even metrics’) should be calculated across the species in the group. Average ‘maximum’ length, i.e. a large percentile (95%) for population length averaged across populations, l0.95, is a suitable metric (Shin et al. 2005). The geometric mean G of species abundances provides a summary of changes in population abundances giving more weight to the least abundant species than total abundance.
5
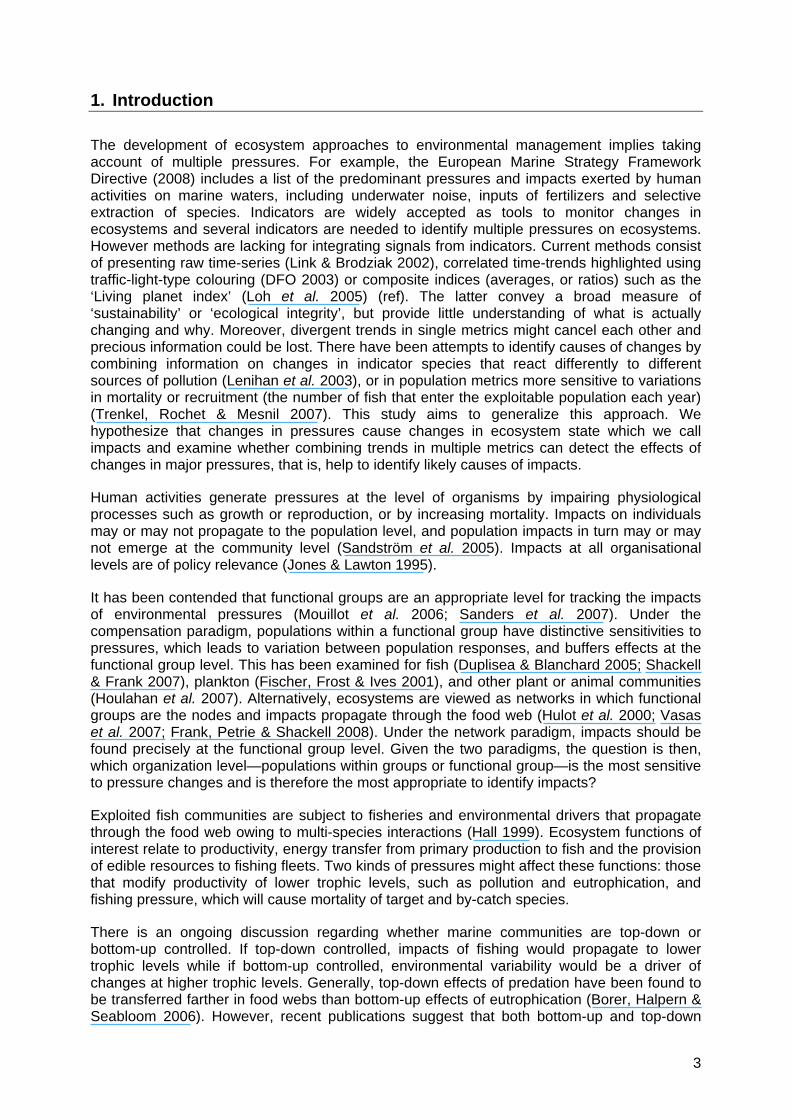
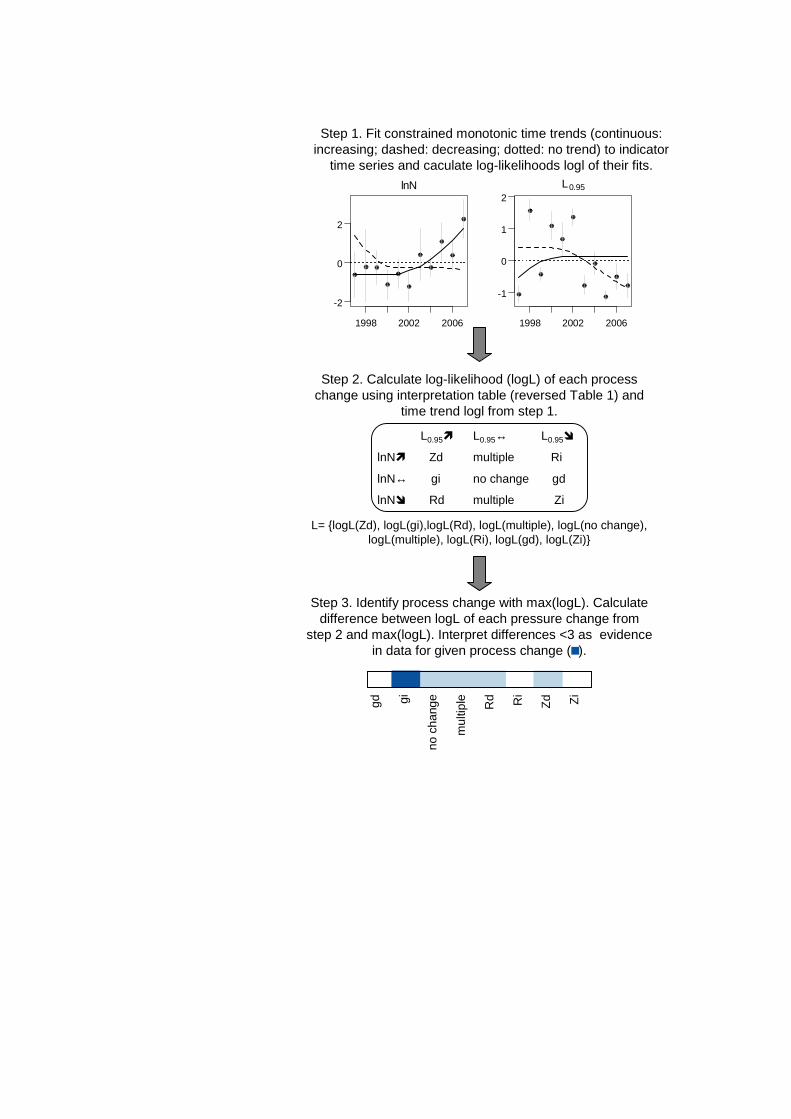
2.4. Combining trends in metrics to deduce impacts We calculated the joint likelihood of trends in abundance and length metrics to deduce changes in state, i.e. the impacts of potential pressure changes. Figure 1 illustrates the steps for population metrics (a detailed description can be found in Trenkel and Rochet, 2010). In step 1, three monotonic (increasing, decreasing and stable) trends were fitted to each metric using generalised additive models and the log-likelihood for each trend was calculated. In step 2, the joint log-likelihood of the metric trend combinations indicating each process change was calculated by summing across metrics. In step 3, log-likelihood differences from that for the process change with the maximum log-likelihood were calculated. Process changes with differences smaller than 3 (a value based on a simulation study in Trenkel and Rochet 2010) were interpreted as being likely, while all other process changes were interpreted as not being supported by the data. Results at the population level were summarized by the proportion of populations for which there was evidence for a given process change.
The same approach was employed at the functional group level using even (G and l0.95) and group metrics (N, Plarge) (Table 2b). Evidence for major impacts on all or most populations within a group, or on both functional groups at the community level, were identified by summing the log-likelihood across populations within a group or across functional groups (Table S4 Supporting Information). The two metric types may convey complementary information: to incorporate all information we also integrated across metric types. The sensitivity of the number of likely impacts to the cut off value used for log-likelihood differences was examined at the community level by varying the value from 2 to 4.
2.5. Consistency between pressures and impacts We examined consistency between known pressure changes and likely impacts both for each pressure separately and all pressures combined. For mortality changes, we deemed likely impacts consistent with documented pressure changes when there was evidence for a change in mortality in a single direction, and that direction was consistent with independent information. For example in the Ligurian Sea, populations for which “decreasing mortality” was likely and there was no evidence for “increasing mortality” or “no change” were consistent with the known decreasing trends in fishing pressure for both piscivores and prey (Table 3). The available indirect information often did not clearly suggest a given direction of change (~ in Table 3). Nevertheless, changes in resource productivity were expected: ‘no change’ was deemed not consistent with the known pressure change. The proportion of populations, functional groups or communities with likely impacts consistent with known pressures was used as a measure of performance of the method and was reported across metrics and organisation levels.
2.6. Case-studies The data for the 14 communities (Figure S1 Supporting Information) were collected during bottom trawl surveys conducted annually with a stratified sampling scheme in which all fish are identified and counted, and most or all are measured. Details on survey designs are provided in Table S5 Supporting Information. A sufficiently long time-series is required to detect changes because survey data have a low power to detect short term changes owing to the high variability in survey catches (Trenkel & Rochet 2003; Nicholson & Jennings 2004). We selected 12 year-periods for analysis because there must be enough time for changes to propagate through the system (this would take a few generations of the longest-lived species, Hulot et al. 2000) but not too much time so that non-monotonous changes might happen.
Rare, poorly sampled species (occurrence across years in fewer than 5% of the hauls) were ignored as were species which were not measured during the whole series. Moreover, only species that could be assigned unambiguously to one of the two functional groups: piscivores or prey, based on the literature and/or diet data were analysed (Appendix S3 Supporting Information). The sensitivity of results to group classification was investigated by comparing
6
the results for four areas (Ligurian, Eastern Ionian, Aegean and North Seas) with those based on an alternative classification using exploitation only: species exploited by the same fleet (e.g., pelagics versus bottom trawlers) were grouped irrespective of their trophic role.
3. Results
3.1. Changes in pressures Water warming has been reported over the last decades in most areas (Table 3, Appendix S1). In these cases, changes in ecosystem productivity and individual growth are expected, but their direction is not predictable. Fishing pressure on both piscivores and prey has decreased in some areas; only in the Channel did fishing on prey increase and on piscivores decrease.
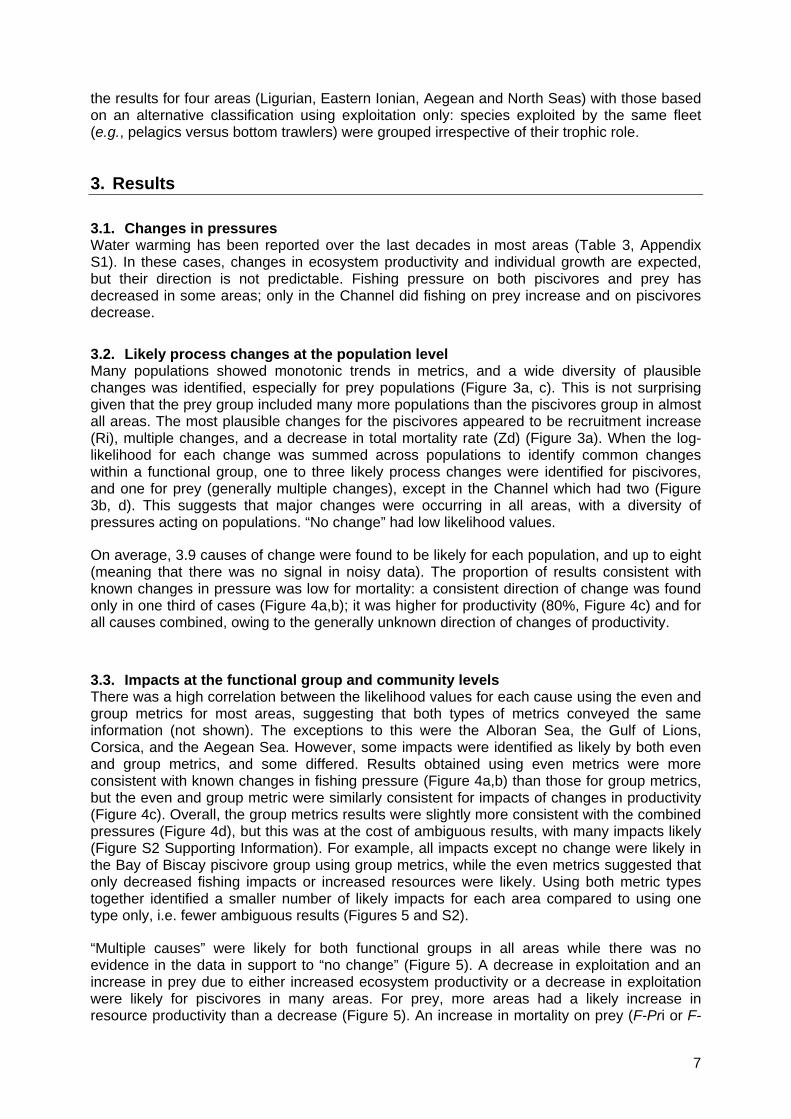
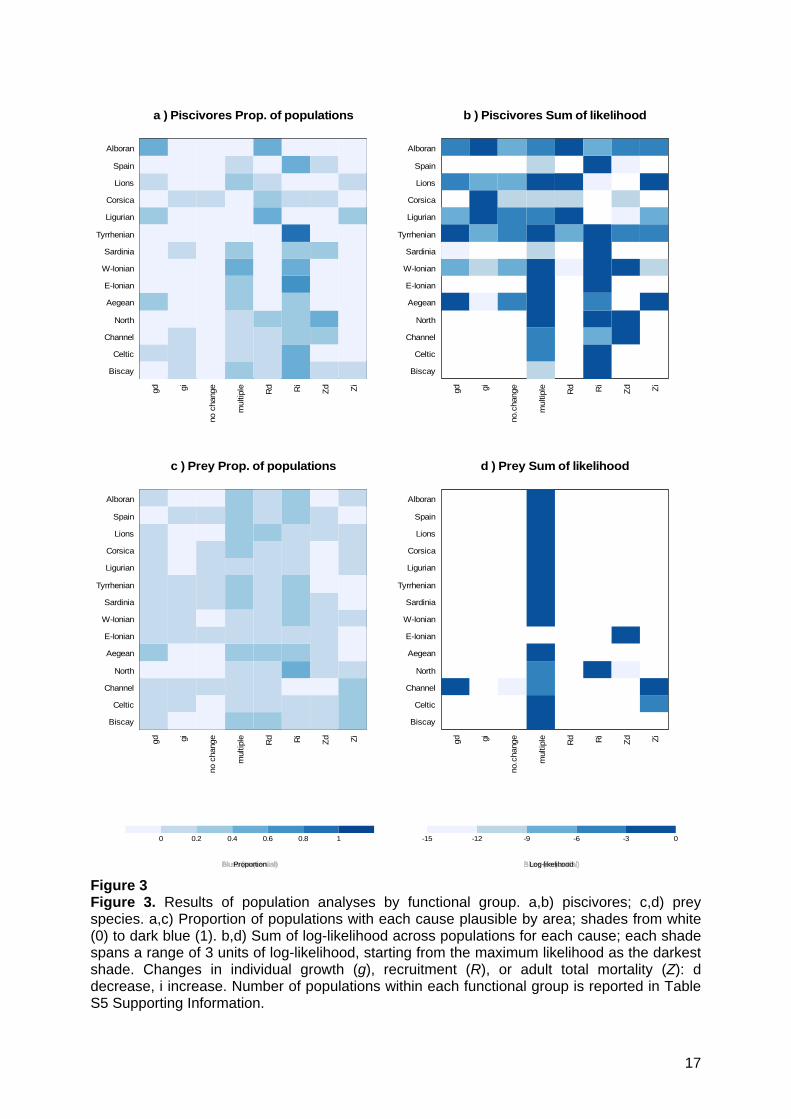
3.2. Likely process changes at the population level Many populations showed monotonic trends in metrics, and a wide diversity of plausible changes was identified, especially for prey populations (Figure 3a, c). This is not surprising given that the prey group included many more populations than the piscivores group in almost all areas. The most plausible changes for the piscivores appeared to be recruitment increase (Ri), multiple changes, and a decrease in total mortality rate (Zd) (Figure 3a). When the log-likelihood for each change was summed across populations to identify common changes within a functional group, one to three likely process changes were identified for piscivores, and one for prey (generally multiple changes), except in the Channel which had two (Figure 3b, d). This suggests that major changes were occurring in all areas, with a diversity of pressures acting on populations. “No change” had low likelihood values.
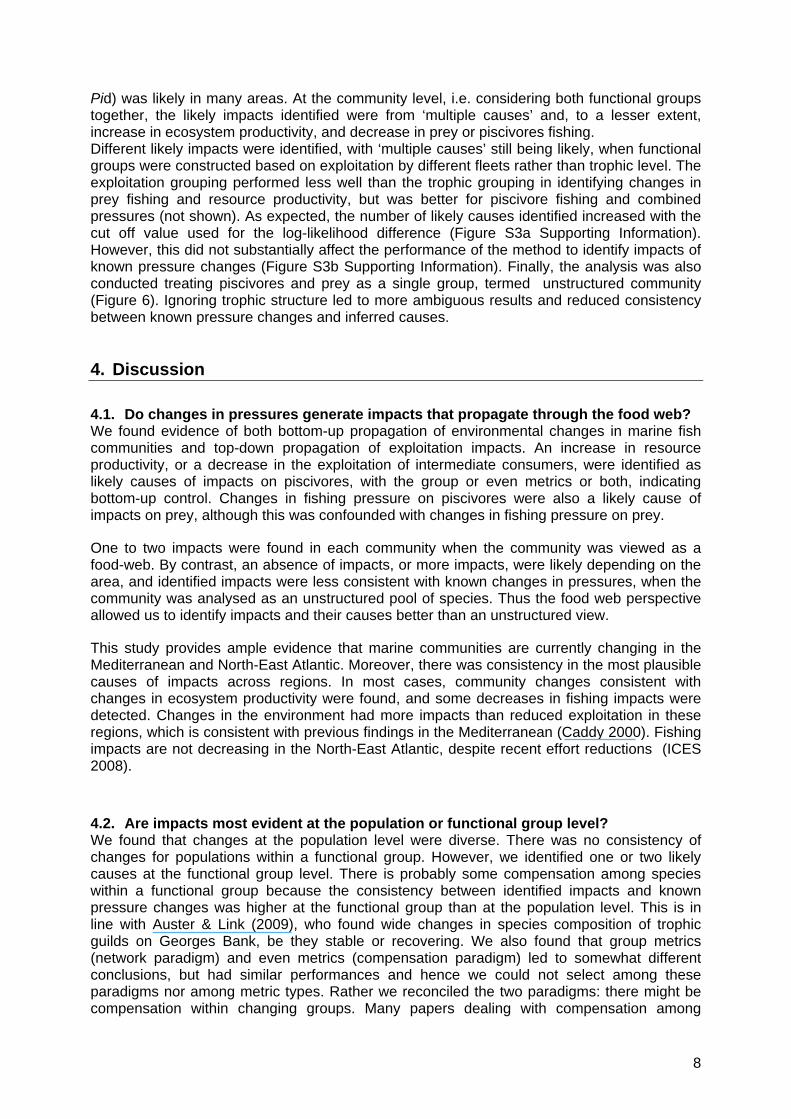
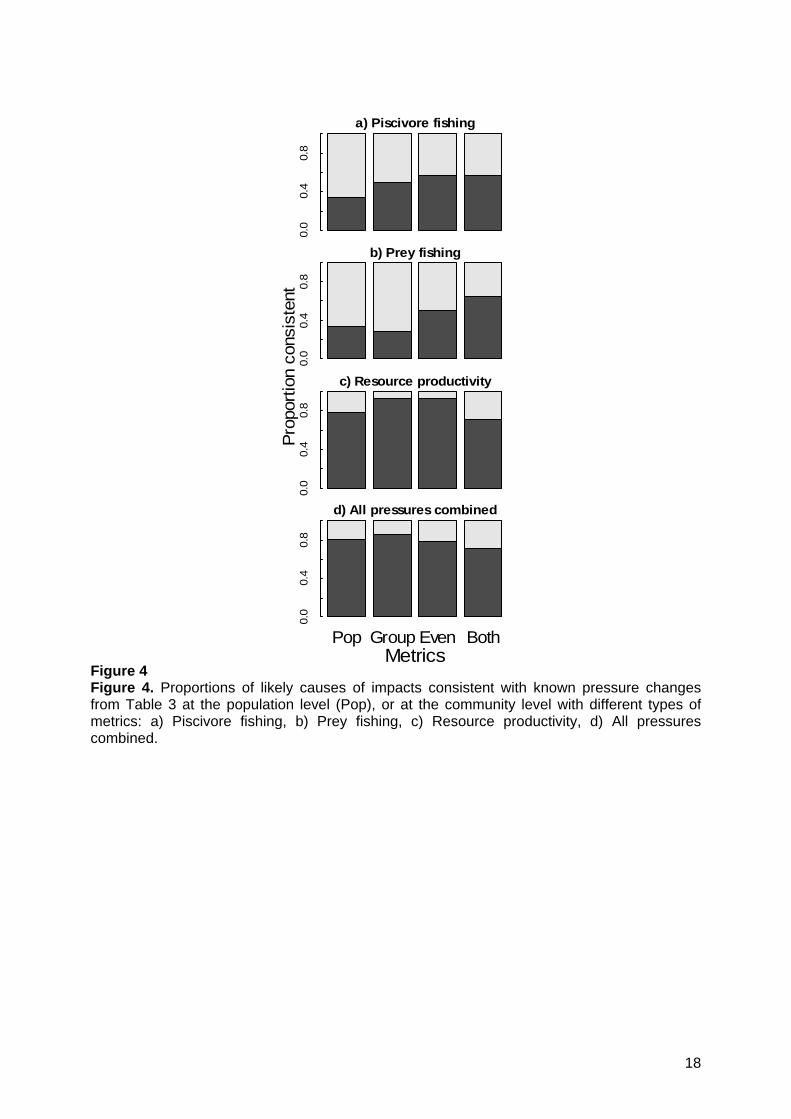
On average, 3.9 causes of change were found to be likely for each population, and up to eight (meaning that there was no signal in noisy data). The proportion of results consistent with known changes in pressure was low for mortality: a consistent direction of change was found only in one third of cases (Figure 4a,b); it was higher for productivity (80%, Figure 4c) and for all causes combined, owing to the generally unknown direction of changes of productivity.
3.3. Impacts at the functional group and community levels There was a high correlation between the likelihood values for each cause using the even and group metrics for most areas, suggesting that both types of metrics conveyed the same information (not shown). The exceptions to this were the Alboran Sea, the Gulf of Lions, Corsica, and the Aegean Sea. However, some impacts were identified as likely by both even and group metrics, and some differed. Results obtained using even metrics were more consistent with known changes in fishing pressure (Figure 4a,b) than those for group metrics, but the even and group metric were similarly consistent for impacts of changes in productivity (Figure 4c). Overall, the group metrics results were slightly more consistent with the combined pressures (Figure 4d), but this was at the cost of ambiguous results, with many impacts likely (Figure S2 Supporting Information). For example, all impacts except no change were likely in the Bay of Biscay piscivore group using group metrics, while the even metrics suggested that only decreased fishing impacts or increased resources were likely. Using both metric types together identified a smaller number of likely impacts for each area compared to using one type only, i.e. fewer ambiguous results (Figures 5 and S2).
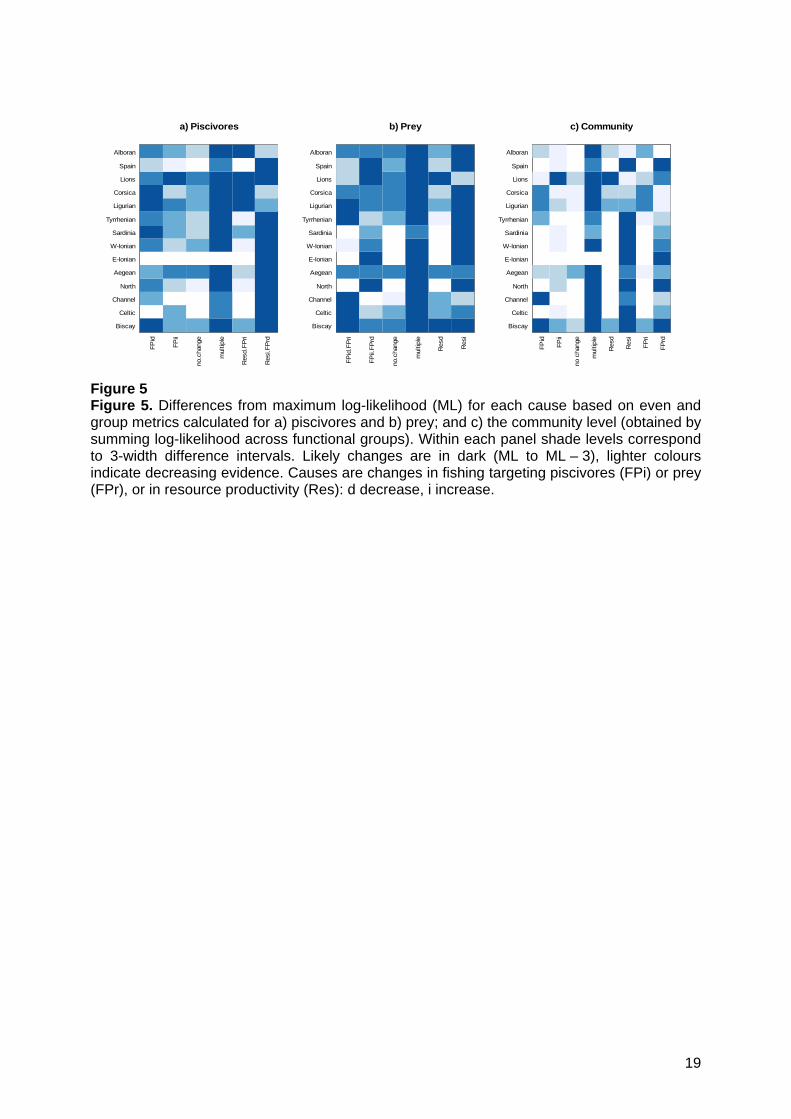
“Multiple causes” were likely for both functional groups in all areas while there was no evidence in the data in support to “no change” (Figure 5). A decrease in exploitation and an increase in prey due to either increased ecosystem productivity or a decrease in exploitation were likely for piscivores in many areas. For prey, more areas had a likely increase in resource productivity than a decrease (Figure 5). An increase in mortality on prey (F-Pri or F-
7
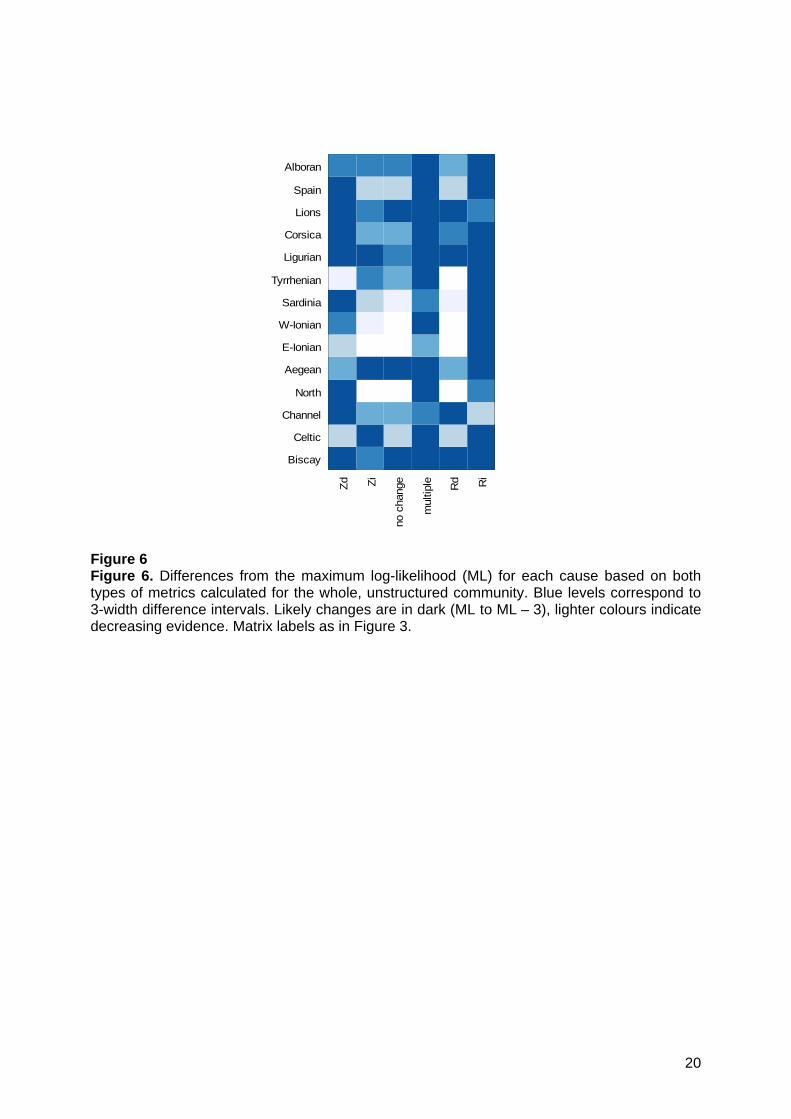
Pid) was likely in many areas. At the community level, i.e. considering both functional groups together, the likely impacts identified were from ‘multiple causes’ and, to a lesser extent, increase in ecosystem productivity, and decrease in prey or piscivores fishing. Different likely impacts were identified, with ‘multiple causes’ still being likely, when functional groups were constructed based on exploitation by different fleets rather than trophic level. The exploitation grouping performed less well than the trophic grouping in identifying changes in prey fishing and resource productivity, but was better for piscivore fishing and combined pressures (not shown). As expected, the number of likely causes identified increased with the cut off value used for the log-likelihood difference (Figure S3a Supporting Information). However, this did not substantially affect the performance of the method to identify impacts of known pressure changes (Figure S3b Supporting Information). Finally, the analysis was also conducted treating piscivores and prey as a single group, termed unstructured community (Figure 6). Ignoring trophic structure led to more ambiguous results and reduced consistency between known pressure changes and inferred causes. 4. Discussion
4.1. Do changes in pressures generate impacts that propagate through the food web? We found evidence of both bottom-up propagation of environmental changes in marine fish communities and top-down propagation of exploitation impacts. An increase in resource productivity, or a decrease in the exploitation of intermediate consumers, were identified as likely causes of impacts on piscivores, with the group or even metrics or both, indicating bottom-up control. Changes in fishing pressure on piscivores were also a likely cause of impacts on prey, although this was confounded with changes in fishing pressure on prey.
One to two impacts were found in each community when the community was viewed as a food-web. By contrast, an absence of impacts, or more impacts, were likely depending on the area, and identified impacts were less consistent with known changes in pressures, when the community was analysed as an unstructured pool of species. Thus the food web perspective allowed us to identify impacts and their causes better than an unstructured view.
This study provides ample evidence that marine communities are currently changing in the Mediterranean and North-East Atlantic. Moreover, there was consistency in the most plausible causes of impacts across regions. In most cases, community changes consistent with changes in ecosystem productivity were found, and some decreases in fishing impacts were detected. Changes in the environment had more impacts than reduced exploitation in these regions, which is consistent with previous findings in the Mediterranean (Caddy 2000). Fishing impacts are not decreasing in the North-East Atlantic, despite recent effort reductions (ICES 2008).
4.2. Are impacts most evident at the population or functional group level? We found that changes at the population level were diverse. There was no consistency of changes for populations within a functional group. However, we identified one or two likely causes at the functional group level. There is probably some compensation among species within a functional group because the consistency between identified impacts and known pressure changes was higher at the functional group than at the population level. This is in line with Auster & Link (2009), who found wide changes in species composition of trophic guilds on Georges Bank, be they stable or recovering. We also found that group metrics (network paradigm) and even metrics (compensation paradigm) led to somewhat different conclusions, but had similar performances and hence we could not select among these paradigms nor among metric types. Rather we reconciled the two paradigms: there might be compensation within changing groups. Many papers dealing with compensation among
8
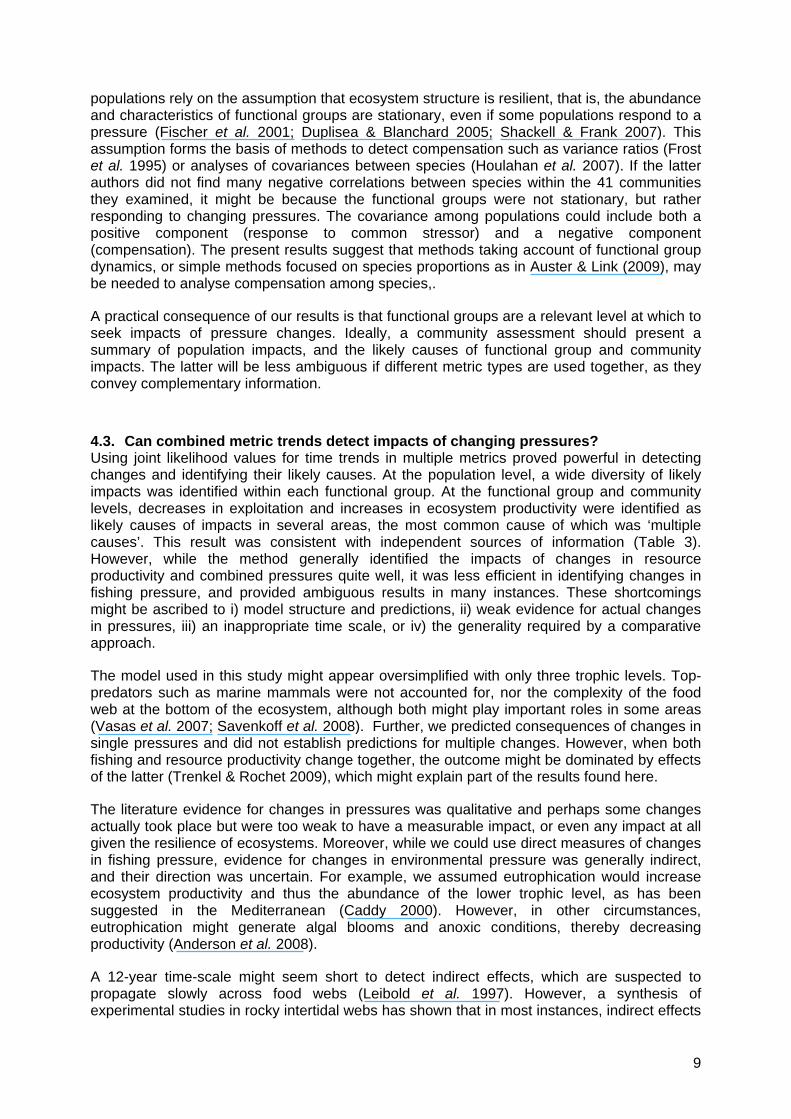
populations rely on the assumption that ecosystem structure is resilient, that is, the abundance and characteristics of functional groups are stationary, even if some populations respond to a pressure (Fischer et al. 2001; Duplisea & Blanchard 2005; Shackell & Frank 2007). This assumption forms the basis of methods to detect compensation such as variance ratios (Frost et al. 1995) or analyses of covariances between species (Houlahan et al. 2007). If the latter authors did not find many negative correlations between species within the 41 communities they examined, it might be because the functional groups were not stationary, but rather responding to changing pressures. The covariance among populations could include both a positive component (response to common stressor) and a negative component (compensation). The present results suggest that methods taking account of functional group dynamics, or simple methods focused on species proportions as in Auster & Link (2009), may be needed to analyse compensation among species,.
A practical consequence of our results is that functional groups are a relevant level at which to seek impacts of pressure changes. Ideally, a community assessment should present a summary of population impacts, and the likely causes of functional group and community impacts. The latter will be less ambiguous if different metric types are used together, as they convey complementary information.
4.3. Can combined metric trends detect impacts of changing pressures? Using joint likelihood values for time trends in multiple metrics proved powerful in detecting changes and identifying their likely causes. At the population level, a wide diversity of likely impacts was identified within each functional group. At the functional group and community levels, decreases in exploitation and increases in ecosystem productivity were identified as likely causes of impacts in several areas, the most common cause of which was ‘multiple causes’. This result was consistent with independent sources of information (Table 3). However, while the method generally identified the impacts of changes in resource productivity and combined pressures quite well, it was less efficient in identifying changes in fishing pressure, and provided ambiguous results in many instances. These shortcomings might be ascribed to i) model structure and predictions, ii) weak evidence for actual changes in pressures, iii) an inappropriate time scale, or iv) the generality required by a comparative approach.
The model used in this study might appear oversimplified with only three trophic levels. Top-predators such as marine mammals were not accounted for, nor the complexity of the food web at the bottom of the ecosystem, although both might play important roles in some areas (Vasas et al. 2007; Savenkoff et al. 2008). Further, we predicted consequences of changes in single pressures and did not establish predictions for multiple changes. However, when both fishing and resource productivity change together, the outcome might be dominated by effects of the latter (Trenkel & Rochet 2009), which might explain part of the results found here.
The literature evidence for changes in pressures was qualitative and perhaps some changes actually took place but were too weak to have a measurable impact, or even any impact at all given the resilience of ecosystems. Moreover, while we could use direct measures of changes in fishing pressure, evidence for changes in environmental pressure was generally indirect, and their direction was uncertain. For example, we assumed eutrophication would increase ecosystem productivity and thus the abundance of the lower trophic level, as has been suggested in the Mediterranean (Caddy 2000). However, in other circumstances, eutrophication might generate algal blooms and anoxic conditions, thereby decreasing productivity (Anderson et al. 2008).
A 12-year time-scale might seem short to detect indirect effects, which are suspected to propagate slowly across food webs (Leibold et al. 1997). However, a synthesis of experimental studies in rocky intertidal webs has shown that in most instances, indirect effects
9
appear simultaneously or shortly after direct effects (Menge 1997). Various experimental and field studies suggest that this also holds in shelf communities (Daan et al. 2005; Myers et al. 2007; Eriksson et al. 2009). Indeed, we were able to detect indirect as well as direct effects. We also oversimplified by tracking impacts over the same time period as pressure changes, while most systems experienced high fishing pressures for a long period beforehand and might still be responding to these sustained past pressures.
We used the same general model for all case studies for the sake of comparability. Investigations of processes and interactions important within each area would help the development of more specific models which would lack the generality of the present approach but, in principle, they would be more testable. Similarly, metrics selected based on the knowledge of local species biology and ecological interactions might be more relevant. The method appears to be sensitive to details such as the choice of metrics or the criteria used for species grouping. It should be adapted and take account of the relevant knowledge available to be applied for assessing impacts in a particular context.
Several impacts were often found to be likely at all organization levels leading to ambiguous results that might be difficult to use for ecosystem assessment and decision making. This is partly expected given noisy data and indirect evidence, a constraint unavoidable when more complex assessments need to be carried out, accounting for multiple pressures and interactions. Ambiguous results are a way to acknowledge uncertainty. One way to use them would be to identify the need for further investigation. However, it is important to note that the trade-off between power and ambiguity can be decided upon by changing the cut off value for log-likelihood differences. When it is set to 2, several competing causes of impacts are seldom identified. Increasing this value leads to more ambiguous assessments. This could be used in a precautionary manner in subsequent management decisions: if among several identified causes one is manageable, a precautionary approach would lead to action to reverse the trends by addressing this cause. Finally, less ambiguous results are obtained when more information from different trophic levels and/or different metrics is combined. Combining metric trends appears a powerful method for synthesizing information across ecosystem components and data sources. It has wide applicability as pressure and/or socio-economic metrics could be incorporated as well, providing a tool for integrated ecosystem assessment.
Acknowledgements
We thank our colleagues involved in the survey programs and the institutions which support it. This work was partially funded by the EU project IMAGE (contract FP6 – 044227). Hugues Benoît, Jeremy Collie, Jeff Dambacher and two anonymous referees gave useful comments on previous versions of this manuscript. References
Anderson, D., Burkholder, J., Cochlan, W., Glibert, P., Gobler, C., Heil, C., Kudela, R., Parsons, M., Rensel, J., Townsend, D., Trainer, V. & Vargo, G. (2008) Harmful algal blooms and eutrophication: Examining linkages from selected coastal regions of the United States. Harmful Algae, 8, 39-53. Auster, P. J. & Link, J. S. (2009) Compensation and recovery of feeding guilds in a northwest Atlantic shelf fish community. Marine Ecology Progress Series, 382, 163–172. Beverton, R. J. H. & Holt, S. J. (1957) On the dynamics of exploited fish populations. Her Majesty's Stationery Office, London. Borer, E. T., Halpern, B. S. & Seabloom, E. W. (2006) Asymmetry in community regulation: effects of predators and productivity. Ecology (New York), 87, 2813-2820.
10
Caddy, J. F. (2000) Marine catchment basin effects versus impacts of fisheries on semi-enclosed areas. ICES Journal of Marine Science, 57, 628-640. Daan, N., Gislason, H., G. Pope, J. & C. Rice, J. (2005) Changes in the North Sea fish community: evidence of indirect effects of fishing? ICES Journal of Marine Science, 62, 177-188. Dambacher, J. M., Gaughan, D. J., Rochet, M. J., Rossignol, P. A. & Trenkel, V. M. (2009) Qualitative Modelling and Indicators of Exploited Ecosystems. Fish and Fisheries, 10, 305–322. Daskalov, G. M., Grishin, A. N., Rodionov, S. & Mihneva, V. (2007) Trophic cascades triggered by overfishing reveal possible mechanisms of ecosystem regime shifts. Proceedings of the National Academy of Sciences of the United States of America, 104, 10518-10523. DFO (2003) State of the Eastern Scotian Shelf Ecosystem. Fisheries and Oceans Canada, Dartmouth. Duplisea, D. E. & Blanchard, F. (2005) Relating species and community dynamics in an heavily exploited marine fish community. Ecosystems, 8, 899-910. Eriksson, B. K., Ljunggren, L., Sandström, A., Johansson, G., Mattila, J., Rubach, A., Råberg, S. & Snickars, M. (2009) Declines in predatory fish promote bloom-forming macroalgae. Ecological Applications, 19, 1975-1988. European Union (2008) Directive 2008/56/EC of the European Parliament and of the Council of 17 June 2008 establishing a framework for community action in the field of marine environmental policy (Marine Strategy Framework Directive). Official Journal of the European Union, L 164, 19-40. Fischer, J. M., Frost, T. M. & Ives, A. R. (2001) Compensatory dynamics in zooplankton community responses to acidification: measurement and mechanisms. Ecological Applications, 11, 1060-1072. Frank, K. T., Petrie, B. & Shackell, N. L. (2008) The ups and downs of trophic control in continental shelf ecosystems. Trends in Ecology & Evolution, 22, 236-242. Frost, T. M., Carpenter, S. R., Ives, A. R. & Kratz, T. K. (1995) Species compensation and complementarity in ecosystem function. Linking species and ecosystems (ed C. G. Jones & J. H. Lawton), pp. 224-239. Chapman and Hall, New York. Hall, S. J. (1999) The effect of fishing on marine ecosystems and communities, 1 edn. Blackwell, Oxford. Hall, S. J. & Mainprize, B. (2004) Towards ecosystem-based fisheries management. Fish and Fisheries, 5, 1-20. Houlahan, J. E., Currie, D. J., Cottenie, K., Cumming, G. S., Ernest, S. K. M., Findlay, C. S., Fuhlendorf, S. D., Gaedke, U., Legendre, P., Magnuson, J. J., McArdle, B. H., Muldavin, E. H., Noble, D., Russell, R., Stevens, R. D., Willis, T. J., Woiwod, I. P. & Wondzell, S. M. (2007) Compensatory dynamics are rare in natural ecological communities. Proceedings of the National Academy of Sciences of the United States of America, 104, 3273-3277. Hulot, F. D., Lacroix, G., Lescher-Moutoué, F. & Loreau, M. (2000) Functional diversity governs ecosystem response to nutrient enrichment. Nature, 405, 340-344. ICES (2007) Report of the working group on ecosystem effects of fishing activities (WGECO) April 11–18 2007, Copenhagen, Denmark. ICES, Copenhagen. ICES (2008) Report of the working group on ecosystem effects of fishing activities (WGECO) May 6–13 2008, Copenhagen, Denmark. ICES, Copenhagen. Jones, C. G. & Lawton, J. H. (1995) Linking species & ecosystems. Champan & Hall, New York. Leibold, M. A., Chase, J. M., Shurin, J. B. & Downing, A. L. (1997) Species turnover and the regulation of trophic structure. Annual Review of Ecology and Systematics, 28, 467-494. Lenihan, H. S., Peterson, C. H., Kim, S. L., Conlan, K. E., Fairey, R., McDonald, C., Grabowski, J. H. & Oliver, J. S. (2003) Variations in marine benthic community composition allows discrimination of multiple stressors. Marine Ecology Progress Series, 261, 63-73. Link, J., Overholtz, W. J., O'Reilly, J., Green, J., Dowa, D., Palka, D., Legault, C., Vitaliano, J., Guida, V., Fogarty, M. J., Brodziak, J. K. T., Methratta, E. T., Stockhausen, W. T., Col, L. & Griswold, C. (2008) The Northeast U.S. continental shelf Energy Modeling and Analysis
11
exercise (EMAX): Ecological network model development and basic ecosystem metrics. Journal of Marine Systems, 74, 453-474. Link, J. S. & Brodziak, J. K. T. (2002) Status of the Northeast US continental shelf ecosystem. Northeast Fisheries Science Center Reference Document, Northeast Fisheries Science Center, Woods Hole, Massachussetts. Loh, J., Green, R. E., Ricketts, T., Lamoreux, J., Jenkins, M., Kapos, V. & Randers, J. (2005) The Living Planet Index: using species population time series to track trends in biodiversity. Philosophical Transactions of the Royal Society B, 360, 289–295. Menge, B. A. (1997) Detection of direct versus indirect effects: were experiments long enough? American Naturalist, 149, 801-823. Mouillot, D., Spatharis, S., Reizopoulou, S., Laugier, T., Sabetta, L., Basset, A. & Do Chi, T. (2006) Alternatives to taxonomic-based approaches to assess changes in transitional water communities. Aquatic Conservation: Marine and Freshwater Ecosystems, 16, 469-182. Myers, R. A., Baum, J. K., Shepherd, T. D., Powers, S. P. & Peterson, C. H. (2007) Cascading effects of the loss of apex predatory sharks from a coastal ocean. Science, 315, 1846-1850. Nicholson, M. D. & Jennings, S. (2004) Testing candidate indicators to support ecosystem-based management: the power of monitoring surveys to detect temporal trends in fish community metrics. ICES Journal of Marine Science, 61, 35-42. Rijnsdorp, A. D. & van Leeuwen, P. I. (1996) Changes in growth of North Sea plaice since 1950 in relation to density, eutrophication, beam-trawl effort, and temperature. ICES Journal of Marine Science, 53, 1199-1213. Rose, K. A., Cowan, J. A. J., Winemiller, K. O., Myers, R. A. & Hilborn, R. (2001) Compensatory density dependence in fish populations: importance, controversy, understanding and prognosis. Fish and Fisheries, 2, 293-327. Sanders, J. L., Kendall, M. A., Hawkins, A. J. S. & Spicer, J. I. (2007) Can functional groups be used to indicate estuarine ecological status? Hydrobiologia, 588, 45-58. Sandström, O., Larsson, Å., Andersson, J., Appelberg, M., Bignert, A., Ek, H., Förlin, L. & Olsson, M. (2005) Three decades of swedish experience demonstrates the need for integrated long-term monitoring of fish in marine coastal areas. Water Quality Research Journal of Canada, 40, 233-250. Savenkoff, C., Morissette, L., Castonguay, M., Swain, D. P., Hammill, M. O., Chabot, D. & Hanson, J. M. (2008) Interactions between marine mammals and fisheries: implications for cod recovery. Ecosystem ecology research trends (ed J. Chen & C. Guô), pp. 107-151. Nova Science Publishers, Hauppauge NY, USA. Shackell, N. L. & Frank, K. T. (2007) Compensation in exploited marine fish communities on the Scotian Shelf, Canada. Marine Ecology Progress Series, 336, 235-247. Shin, Y.-J., Rochet, M.-J., Jennings, S., Field, J. & Gislason, H. (2005) Using size-based indicators to evaluate the ecosystem effects of fishing. ICES Jounal of Marine Science, 62, 384-396. Stokes, T. K., McGlade, J. M. & Law, R. (1993) The exploitation of evolving resources. Lecture Notes in Biomathematics Springer-Verlag, Berlin. Trenkel, V. M. & Rochet, M.-J. (2009) Qualitative food-web modelling for predicting the joined directions of change of population and community indicators: identifying dominant process changes as a step towards an EAF. ICES CM 2009/P:02, 9. Trenkel, V. M. & Rochet, M.-J. (2010) Combining time trends in multiple metrics for identifying persistent changes in population processes or environmental stressors. Journal of Applied Ecology, 47. Trenkel, V. M., Rochet, M.-J. & Mesnil, B. (2007) From model-based prescriptive advice to indicator-based interactive advice. ICES Journal of Marine Science, 64, 768-774. Trenkel, V. M. & Rochet, M. J. (2003) Performance of indicators derived from abundance estimates for detecting the impact of fishing on a fish community. Canadian Journal of Fisheries and Aquatic Sciences, 60, 67-85. Vasas, V., Lancelot, C., Rousseau, V. & Jordán, F. (2007) Eutrophication and overfishing in temperate nearshore pelagic food webs: a network perspective. Marine Ecology Progress Series, 336, 1-14.
12

Tables Table 1. Predicted consequences of increases in pressures on individual processes, and consequently on population metrics; the consequences of decreases in these pressures are reversed. Pressures: F fishing pressure, Res resource productivity; processes: g growth, R recruitment, Z adult total mortality; population metrics: lnN log-transformed population abundance and L0.95 95% percentile of the population length distribution. indicate metric trend in direction of arrow, no trend. () increase (decrease) in process. Pressure change Population process change Change in lnN Change in L0.95 4.4. F Z
g 4.5.
Res R
Table 2. a) Predicted consequences of increases in pressures on functional group metrics. b) Changes in pressure suggested by combinations of changes in metrics. Pressures: F-Pi piscivore fishing, F-Pr prey fishing, Res resource productivity. Metrics: L length metrics, N abundance metrics. indicate metric trend in direction of arrow, no trend. () increase (decrease) in pressure. ‘multiple’: several or other pressure changes. a) Piscivores Prey Pressure change Change in N Change in L Change in N Change in L F-Pi F-Pr Res b)
Piscivores Prey L L L L L L
N F-Pi multiple F-Pr / Res F-Pi / F-Pr multiple Res N multiple no
change multiple multiple no change multiple
N F-Pr / Res multiple F-Pi Res multiple F-Pi / F-Pr
13
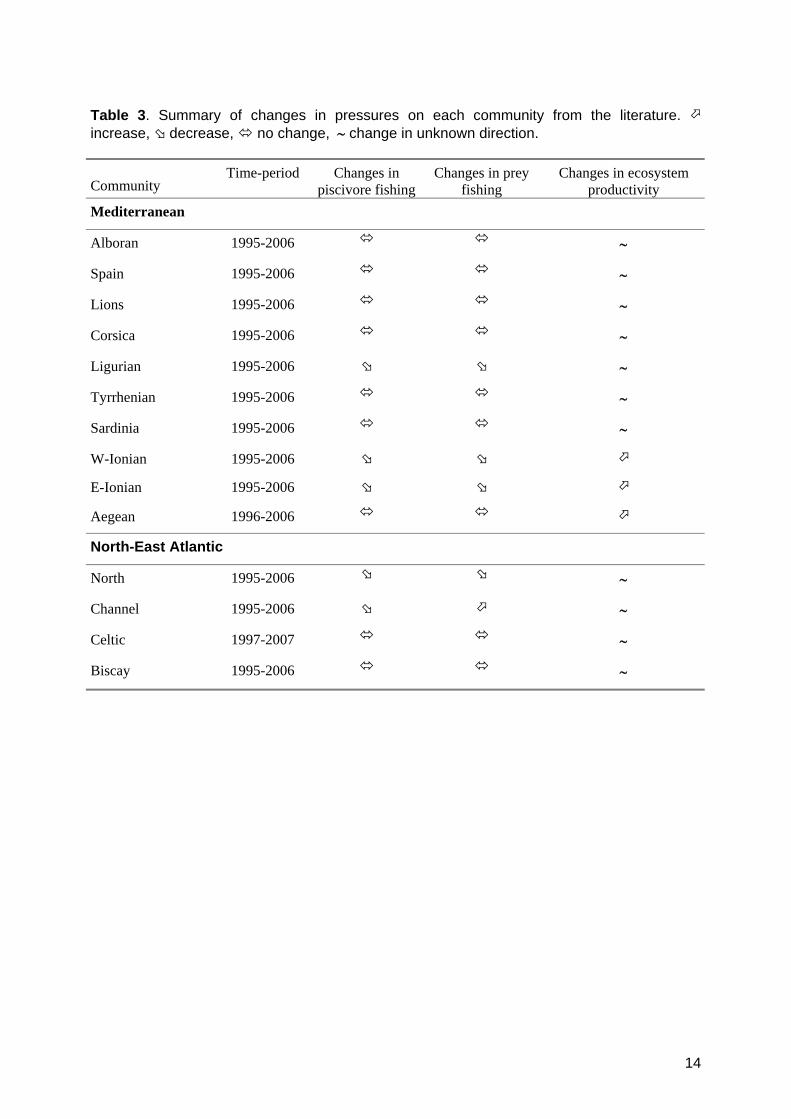
Table 3. Summary of changes in pressures on each community from the literature. increase, decrease, no change, change in unknown direction. Community
Time-period Changes in piscivore fishing
Changes in prey fishing
Changes in ecosystem productivity
Mediterranean
Alboran 1995-2006
Spain 1995-2006
Lions 1995-2006
Corsica 1995-2006
Ligurian 1995-2006
Tyrrhenian 1995-2006
Sardinia 1995-2006
W-Ionian 1995-2006
E-Ionian 1995-2006
Aegean 1996-2006
North-East Atlantic
North 1995-2006
Channel 1995-2006
Celtic 1997-2007
Biscay 1995-2006
14

Figures
Figure 1. Flow chart of method to identify most likely causes of changes.
15
1998 2002 2006
-2
0
2
lnN
1998 2002 2006
-1
0
1
2L0.95
Step 1. Fit constrained monotonic time trends (continuous: increasing; dashed: decreasing; dotted: no trend) to indicator
time series and caculate log-likelihoods logl of their fits.
Step 2. Calculate log-likelihood (logL) of each process change using interpretation table (reversed Table 1) and
time trend logl from step 1.
L0.95� L0.95↔ L0.95�
lnN� Zd multiple Ri
lnN↔ gi no change gd
lnN� Rd multiple Zi
L= {logL(Zd), logL(gi),logL(Rd), logL(multiple), logL(no change), logL(multiple), logL(Ri), logL(gd), logL(Zi)}
Step 3. Identify process change with max(logL). Calculate difference between logL of each pressure change from
step 2 and max(logL). Interpret differences <3 as evidence in data for given process change ( ).
gd gi
no c
hang
e
mul
tiple Rd Ri
Zd Zi
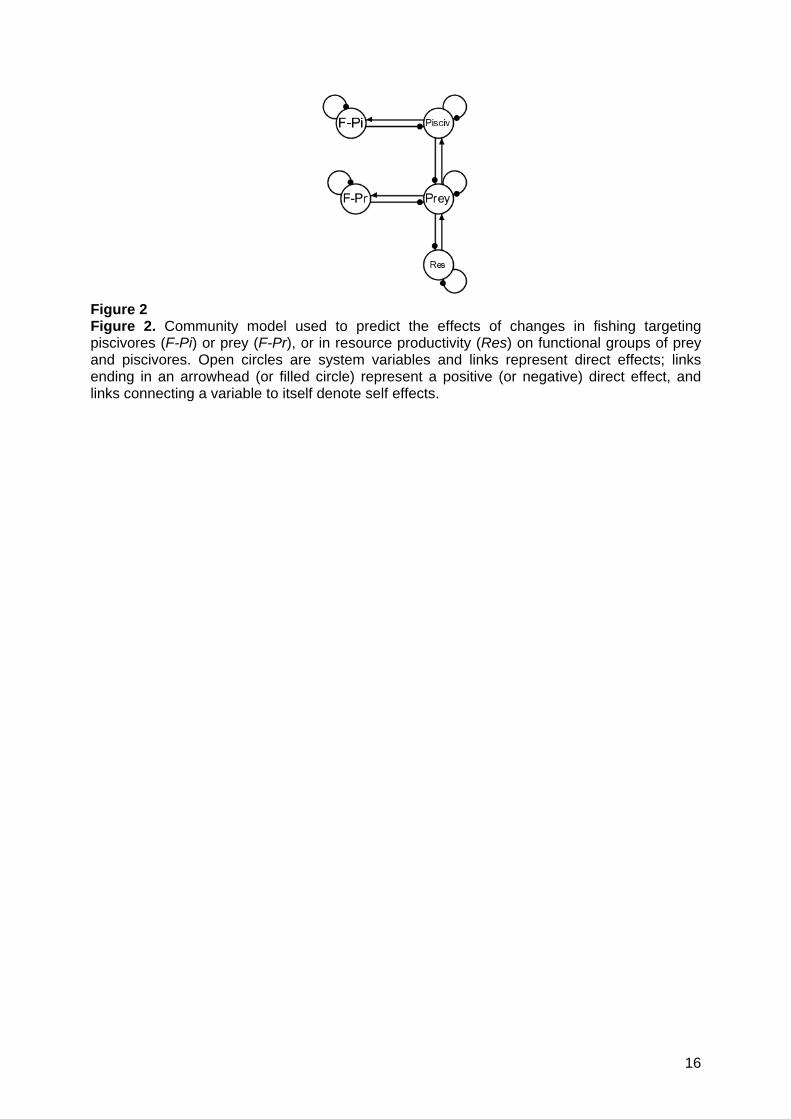
Figure 2 Figure 2. Community model used to predict the effects of changes in fishing targeting piscivores (F-Pi) or prey (F-Pr), or in resource productivity (Res) on functional groups of prey and piscivores. Open circles are system variables and links represent direct effects; links ending in an arrowhead (or filled circle) represent a positive (or negative) direct effect, and links connecting a variable to itself denote self effects.
16
a ) Piscivores Prop. of populations
Biscay
Celtic
Channel
North
Aegean
E-Ionian
W-Ionian
Sardinia
Tyrrhenian
Ligurian
Corsica
Lions
Spain
Alborangd gi
no c
hang
e
mul
tiple Rd Ri
Zd Zi
b ) Piscivores Sum of likelihood
Biscay
Celtic
Channel
North
Aegean
E-Ionian
W-Ionian
Sardinia
Tyrrhenian
Ligurian
Corsica
Lions
Spain
Alboran
gd gi
no.c
hang
e
mul
tiple Rd Ri
Zd Zi
c ) Prey Prop. of populations
Biscay
Celtic
Channel
North
Aegean
E-Ionian
W-Ionian
Sardinia
Tyrrhenian
Ligurian
Corsica
Lions
Spain
Alboran
gd gi
no c
hang
e
mul
tiple Rd Ri
Zd Zi
d ) Prey Sum of likelihood
Biscay
Celtic
Channel
North
Aegean
E-Ionian
W-Ionian
Sardinia
Tyrrhenian
Ligurian
Corsica
Lions
Spain
Alboran
gd gi
no.c
hang
e
mul
tiple Rd Ri
Zd Zi
Blues (sequential)
0 0.2 0.4 0.6 0.8 1
Blues (sequential)Proportion Blues (sequential)
-15 -12 -9 -6 -3 0
Blues (sequential)Log-likelihood
Figure 3 Figure 3. Results of population analyses by functional group. a,b) piscivores; c,d) prey species. a,c) Proportion of populations with each cause plausible by area; shades from white (0) to dark blue (1). b,d) Sum of log-likelihood across populations for each cause; each shade spans a range of 3 units of log-likelihood, starting from the maximum likelihood as the darkest shade. Changes in individual growth (g), recruitment (R), or adult total mortality (Z): d decrease, i increase. Number of populations within each functional group is reported in Table S5 Supporting Information.
17
a) Piscivore fishing
0.0
0.4
0.8
b) Prey fishing
0.0
0.4
0.8
c) Resource productivity
0.0
0.4
0.8
d) All pressures combined
0.0
0.4
0.8
Pop Group Even BothMetrics
Pro
port
ion
cons
iste
nt
Figure 4 Figure 4. Proportions of likely causes of impacts consistent with known pressure changes from Table 3 at the population level (Pop), or at the community level with different types of metrics: a) Piscivore fishing, b) Prey fishing, c) Resource productivity, d) All pressures combined.
18
a) Piscivores
Biscay
Celtic
Channel
North
Aegean
E-Ionian
W-Ionian
Sardinia
Tyrrhenian
Ligurian
Corsica
Lions
Spain
AlboranF
Pid
FP
ii
no.c
hang
e
mul
tiple
Res
d.F
Pri
Res
i.FP
rd
b) Prey
Biscay
Celtic
Channel
North
Aegean
E-Ionian
W-Ionian
Sardinia
Tyrrhenian
Ligurian
Corsica
Lions
Spain
Alboran
FP
id.F
Pri
FP
ii.F
Prd
no.c
hang
e
mul
tiple
Res
d
Res
i
c) Community
Biscay
Celtic
Channel
North
Aegean
E-Ionian
W-Ionian
Sardinia
Tyrrhenian
Ligurian
Corsica
Lions
Spain
Alboran
FP
id
FP
ii
no c
hang
e
mul
tiple
Res
d
Res
i
FP
ri
FP
rd
Figure 5 Figure 5. Differences from maximum log-likelihood (ML) for each cause based on even and group metrics calculated for a) piscivores and b) prey; and c) the community level (obtained by summing log-likelihood across functional groups). Within each panel shade levels correspond to 3-width difference intervals. Likely changes are in dark (ML to ML – 3), lighter colours indicate decreasing evidence. Causes are changes in fishing targeting piscivores (FPi) or prey (FPr), or in resource productivity (Res): d decrease, i increase.
19
Biscay
Celtic
Channel
North
Aegean
E-Ionian
W-Ionian
Sardinia
Tyrrhenian
Ligurian
Corsica
Lions
Spain
Alboran
Zd Zi
no c
hang
e
mul
tiple Rd Ri
Figure 6 Figure 6. Differences from the maximum log-likelihood (ML) for each cause based on both types of metrics calculated for the whole, unstructured community. Blue levels correspond to 3-width difference intervals. Likely changes are in dark (ML to ML – 3), lighter colours indicate decreasing evidence. Matrix labels as in Figure 3.
20

21
Supporting Information
The following supporting information is available online from www.Blackwell-Synergy.com: Appendix S1. Changes in pressures documented for each study-area. Appendix S2. Definition of population and functional group and community metrics.
Table S1: Population metrics Table S2: Functional group and community metrics
Table S3. Length thresholds for indicator ‘proportion of large fish’. Table S4. Calculation of log likelihood at the functional group and community levels. Figure S1. Map of study areas. Table S5. Communities included in this study and survey details. Appendix S3. List of species included in the analysis.
Table S6 Mediterranean areas. Table S7 East Atlantic communities
Figure S2. Log-likelihood for each cause based on even or group metrics. Figure S3. Sensitivity to test value. Supplementary references.
Supporting information Rochet, M. J., Trenkel, V. M., Carpentier, A., Coppin, F., Gil de Sola, L., Léauté, J.-P., Mahé, J.-C., Maiorano, P., Mannini, A., Murenu, M., Piet, G. J., Politou, C.-Y., Reale, B., Spedicato, M. T., Tserpes, G. & Bertrand, J. A. (2010) Do changes in environmental pressures impact marine communities? An empirical assessment. Journal of Applied Ecology, 47.
Appendix S1. Changes in pressures documented for each study-area. Fishing pressure was characterized based on fishing capacity (number of vessels and horsepower) and/or fishing effort (number of days at sea), taking account where possible of changes in fishing power. When available, recent fish stock assessments gave complementary information on fishing mortality. Unfortunately, evidence of changes in productivity was generally indirect and required assumptions on the effects of pressures on resource productivity. The physical environment was described by temperature, salinity and oxygen. The chemical environment was assessed through time series of various pollutants including heavy metals, organic compounds and macro-waste. Information related to eutrophication was gathered as well. Over the whole Mediterranean region, fishing effort is reported to have decreased in terms of fleet size and horsepower during the 1995-2006 period (Campillo 1992; Berthou et al. 2002; Papaconstantinou 2005; García-Rodriguez, Fernandez & Esteban 2006; Leblond et al. 2007). However, fishing pressure might have remained stable owing to technical progress, which is consistent with stable catches over the recent period and continued diagnostics of overexploitation for formally assessed stocks like red mullet and hake (Aldebert, Recasens & Lleonart 1993; Stergiou et al. 1997; Papaconstantinou & Farrugio 2000; Jadaud et al. 2006). The exceptions to this rule are the Eastern Ionian Sea where coastal catches decreased by 37% between 1994 and 2006 (Source: Greek National Statistical Service); and the Ligurian and Northern Tyrrhenian Sea where the current size of the fishing fleet is about 50% lower than twenty years ago and total catches decreased by 24% from 2000 to 2006 (Source: Italian National Statistical Service - IREPA). Another general pattern in the Mediterranean is water warming over the last two decades, with higher increases in the Eastern compared to the Western Mediterranean at least for maximum surface temperature (Diaz-Almela, Marbà & Duarte 2007). In the Ionian Sea, in addition, recent changes in water circulation have contributed to an increase in biological production (Souvermezoglou & Krasakopoulou 2005). Overall pollution by heavy metals, nutrients and macro-waste are widespread among Mediterranean regions and have remained stable or slowly decreased over the study period (Stergiou et al. 1997; Galgani et al. 2000; RNO 2000). Only in the Aegean Sea increasing levels of eutrophication locally resulted in increased biological production in recent years (Papaconstantinou & Farrugio 2000). In the North Sea, ICES (2008d) shows that from 2000 onwards fishing effort decreased by about 25% with the greatest change occurring in 2002 with the measures, particularly effort control, introduced as part of the European Union Common Fisheries Policy reform. To some extent this may be countered by an increase in fishing power which for the beam trawl fishery in the period 1990-2003 amounted to 2.8% and 1.6% per year per unit of effort for the major target species
1
sole and plaice (Rijnsdorp, Daan & Dekker 2006). However, estimated fishing mortalities of the major target species confirm that the decline in fishing effort has indeed resulted in a decreased pressure on the demersal fish community. Probably the main environmental effect was a gradual increase in temperature. In the North Sea, winter bottom temperature has increased by 1.6°C over the past 25 years (Dulvy et al. 2008). Because of an extremely cold winter in 1996 the trend during the study period is probably steeper. In the English Channel an analysis of landings shows that many species of functional group S2 decreased over the 1989-2006 period; while no massive trend was found in the landings of piscivorous species. Meanwhile, most intermediate consumers had a decreasing trend in abundance indices from the local survey while piscivores increased (Rochet et al. 2008). This would suggest that fishing pressure increased on preys and decreased on piscivores, which is also consistent with trends in fishing mortality estimated for some of these stocks (ICES 2008d). During the study period, water temperature increased, eutrophication decreased and concentration of various pollutants decreased (Rochet et al. 2008), so that the overall effect on ecosystem productivity is difficult to predict. In the Celtic Sea, fishing effort has decreased since the late 90’s (ICES 2008c; ICES 2008b). Depending on species, fishing mortality has shown different trends in recent years. As in other areas, improved technology has resulted in an overall high level of exploitation despite effort decrease. At the beginning of the study period, many fish stocks in the area were overexploited and are still assessed as being at a low level in 2006. Environmentally, the major pattern identified is a steady warming of the area. Also, general and continuing reduction of copepod abundance and recent changes in zooplankton composition were observed. These are likely to have had diverse impacts on species, depending on their life histories (ICES 2008a). In the Bay of Biscay, the number of vessels decreased over recent years (Daurès et al. 2009) but effort in power times days fished increased and total catches and fishing mortality on the main stocks remained fairly stable since the early 1990s (ICES 2008d; Lorance et al. 2009). There is little indication of changes in pressure from other human activities; temperature and salinity were rising during the study period (Persohn, Lorance & Trenkel 2009).
2
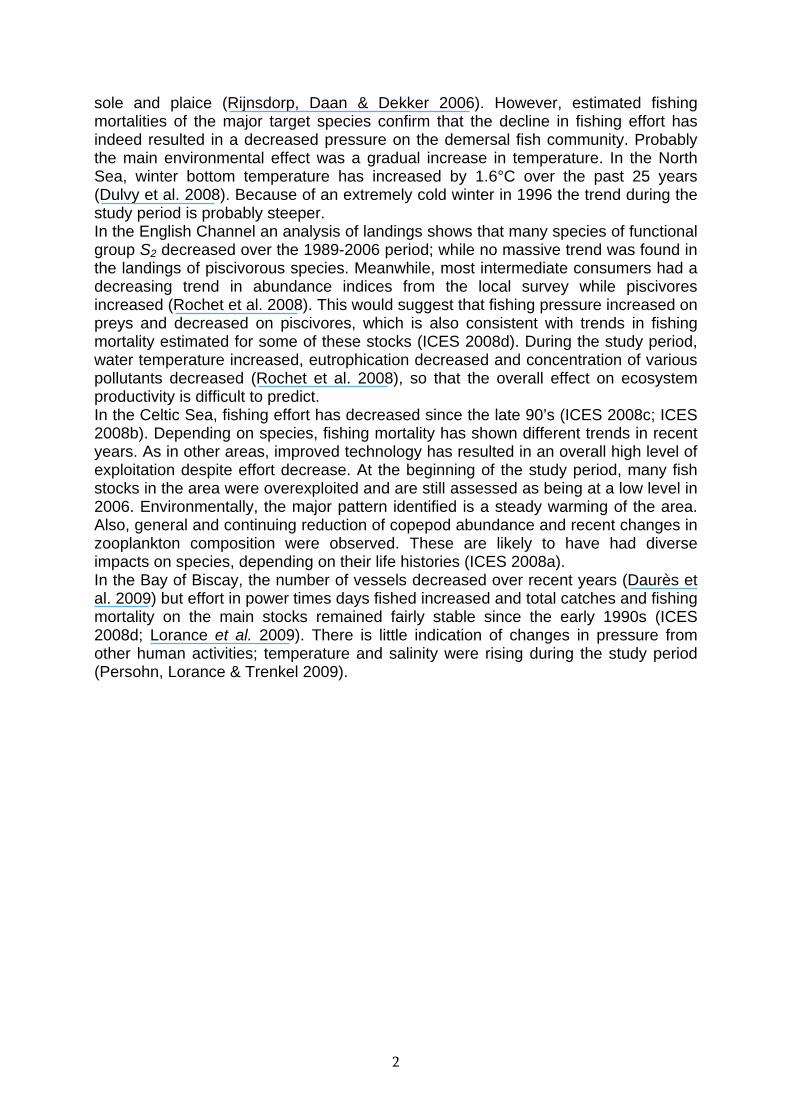
Appendix S2. Definition of population (Table S1) and functional group and community metrics (Table S2) used in the analysis.
Table S1: Population metrics
Name Definition Required data Estimator lnNi Abundance
index for species i
Catch haul k stratum j yk,j
Swept area ak,j Stratum area Aj
jj n
k
jk
j
n
k
jkj
j
jii ayANN1
,
1
,,
2/)(ln)ln(ln iii NVarNN
j
n
kn
kjk
n
kjk
jk
jk
j
ji
j
j
j
a
y
a
y
n
ANVar
1
2
1,
1,
,
,2
1
1
)(ln)(ln
2i
ii
NNVar
NVar
iqL ,
q = 0.95
Percentile of the population length distribution
Catch per length class yl,i
qy
ylL
i
l
l
il
iqiq
q
1
,
,,
2,
,
1
iili
iqyyy
qqLVar
q
Table S2: Functional group and community metrics
Name Required input Estimator Total abundance N
Catch haul k stratum j yk,j
Swept area ak,j Stratum area Aj
jj n
k
jk
j
n
k
n
i
ikjj
j
ji ayANN1
,
1
,
j
n
kn
k
jk
n
k
n
i
i
jk
i
kji
j
jj
j
j
a
y
a
y
nANVar
1
2
1
,
1
,,
,
,2
1
Geometric mean G iN
n
i i
tit
NN
nG
11
log1exp1,
,
Variance by parametric boostrap Proportion of large individuals plarge larger than lbig = fixed length
)(tyl
)(ty
catch per length class l
total catch (measured species) Large size threshold lbig
)()(large tytytplbigl
l
ty
pppVar largelarge
large
1
Average population length percentiles l0.95
Population length percentiles
S number of consistently iqL ,
SLlS
i
iqq
1
,
3
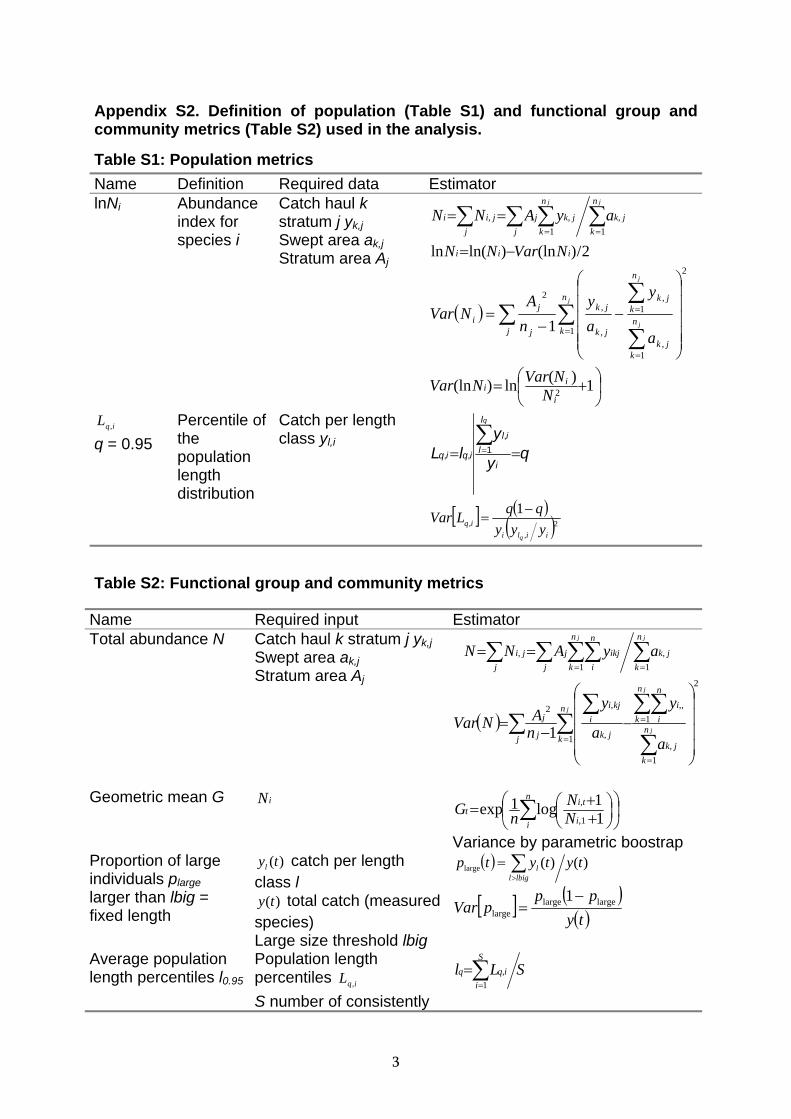
Name Required input Estimator measured species
S
iiqq LVarlVar
1,
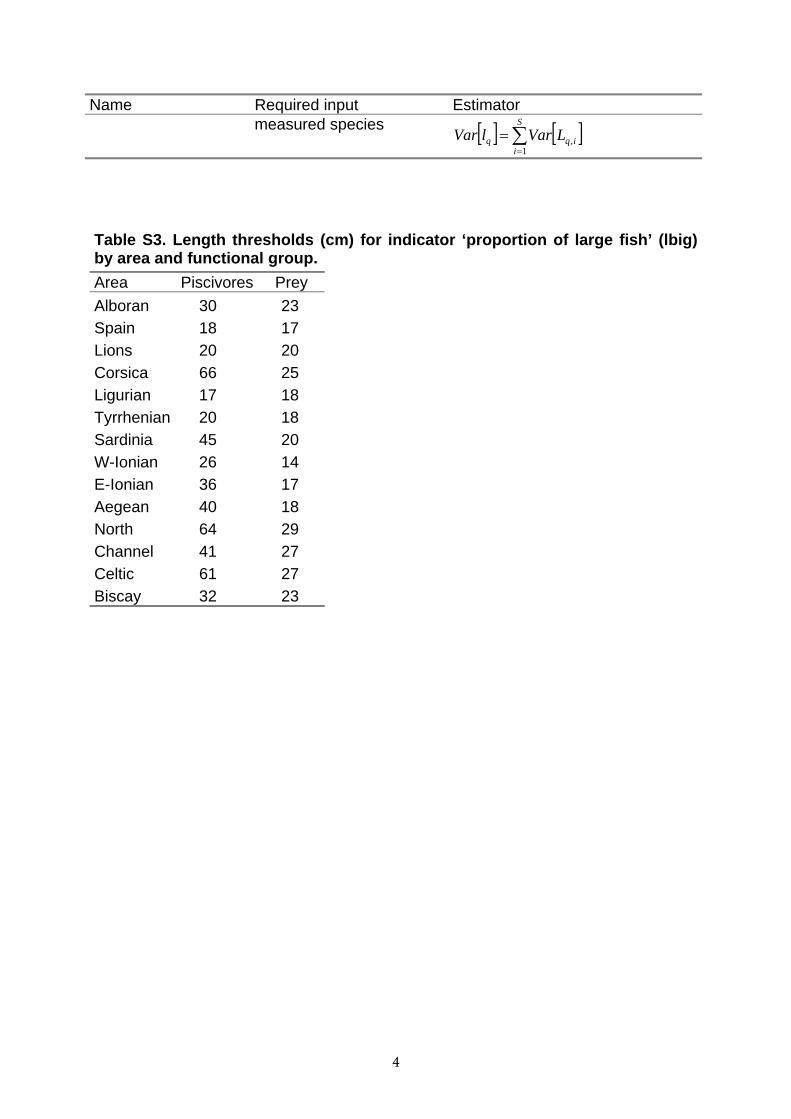
Table S3. Length thresholds (cm) for indicator ‘proportion of large fish’ (lbig) by area and functional group.
Area Piscivores Prey
Alboran 30 23
Spain 18 17
Lions 20 20
Corsica 66 25
Ligurian 17 18
Tyrrhenian 20 18
Sardinia 45 20
W-Ionian 26 14
E-Ionian 36 17
Aegean 40 18
North 64 29
Channel 41 27
Celtic 61 27
Biscay 32 23
4
5
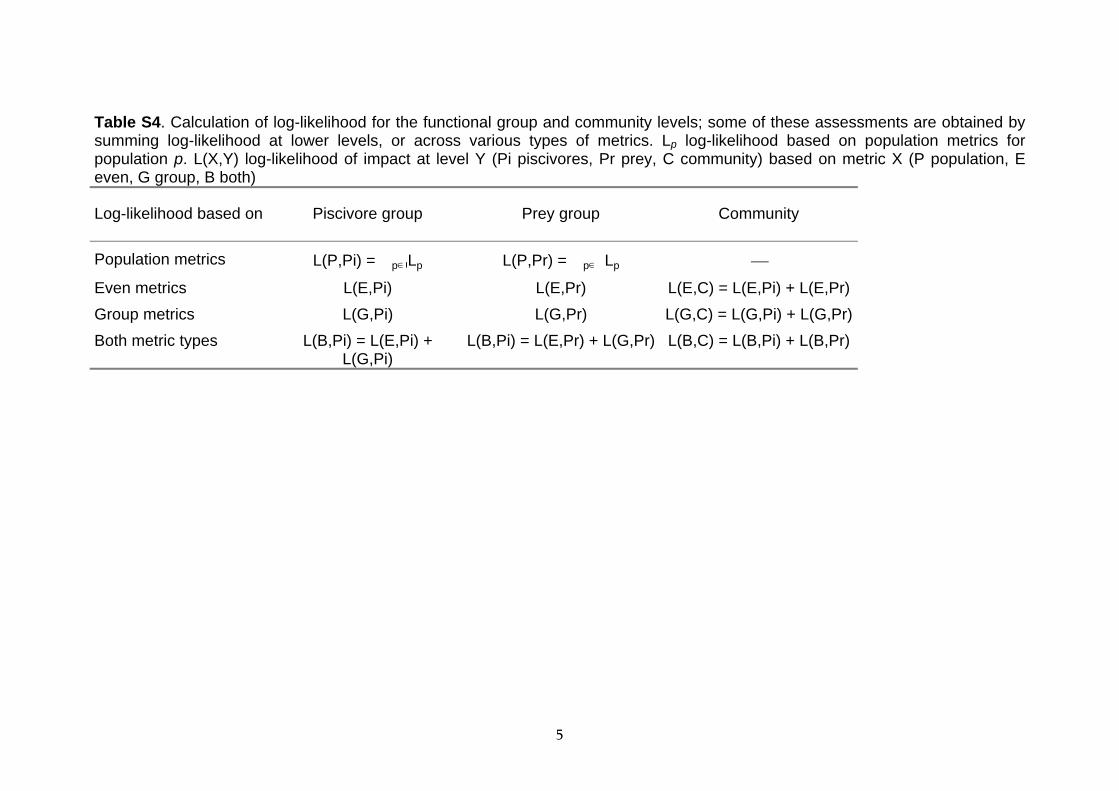
Table S4. Calculation of log-likelihood for the functional group and community levels; some of these assessments are obtained by summing log-likelihood at lower levels, or across various types of metrics. Lp log-likelihood based on population metrics for population p. L(X,Y) log-likelihood of impact at level Y (Pi piscivores, Pr prey, C community) based on metric X (P population, E even, G group, B both)
Log-likelihood based on Piscivore group Prey group Community
Population metrics L(P,Pi) = �pLp L(P,Pr) = �p�Lp
Even metrics L(E,Pi) L(E,Pr) L(E,C) = L(E,Pi) + L(E,Pr)
Group metrics L(G,Pi) L(G,Pr) L(G,C) = L(G,Pi) + L(G,Pr)
Both metric types L(B,Pi) = L(E,Pi) + L(G,Pi)
L(B,Pi) = L(E,Pr) + L(G,Pr) L(B,C) = L(B,Pi) + L(B,Pr)
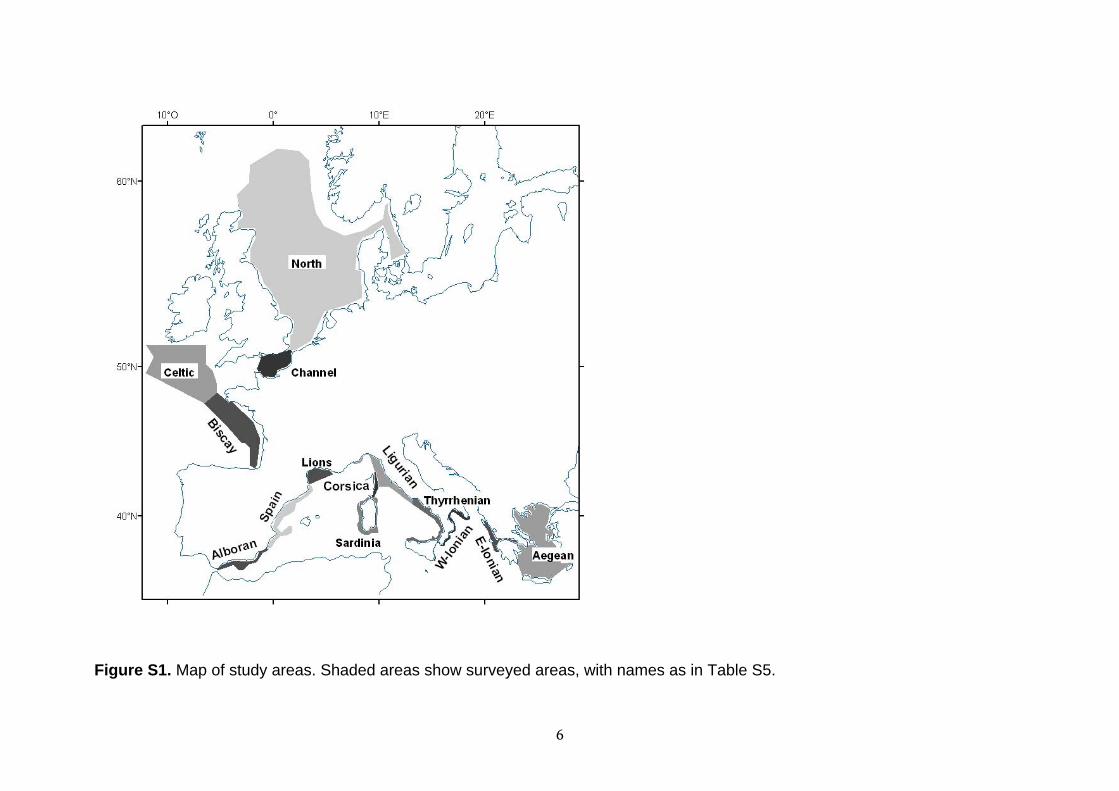
Figure S1. Map of study areas. Shaded areas show surveyed areas, with names as in Table S5.
6
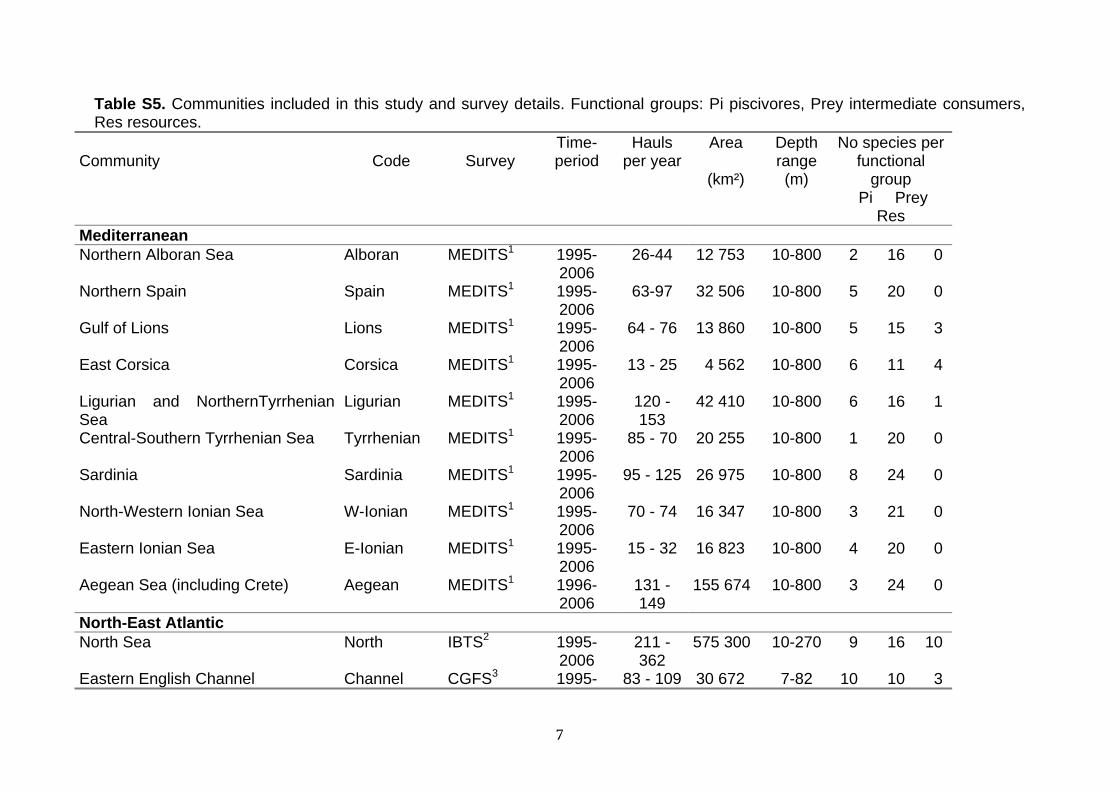
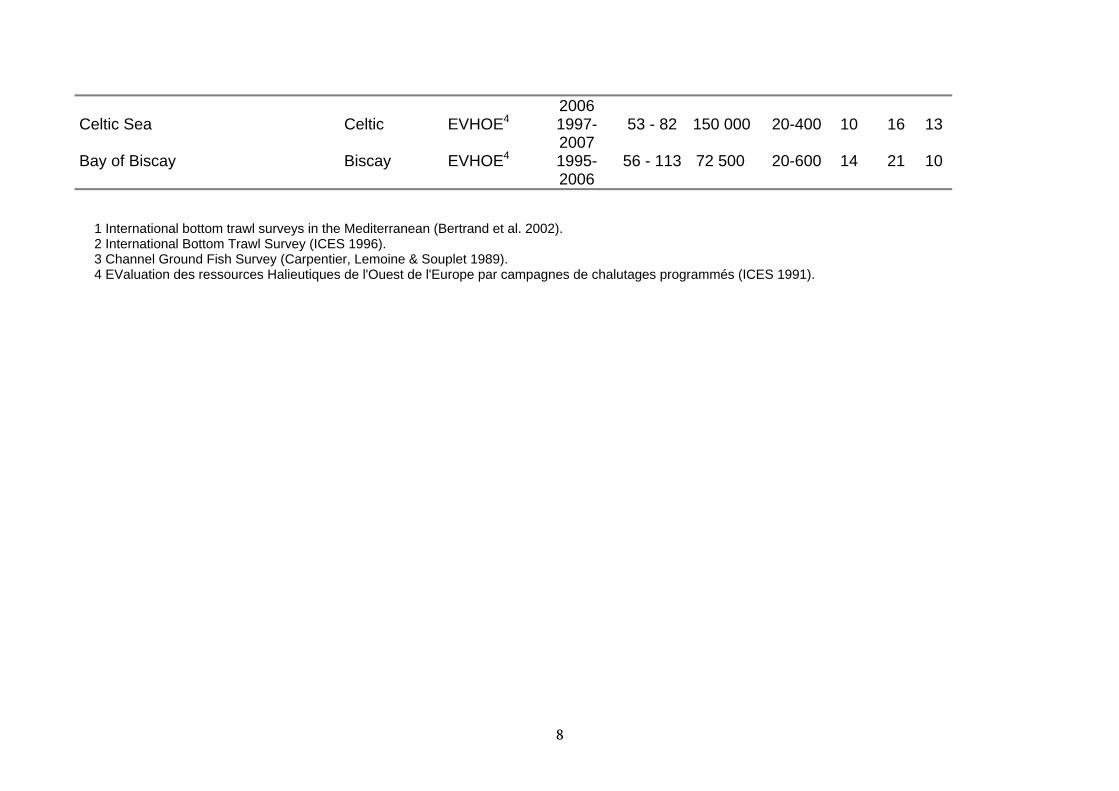
Table S5. Communities included in this study and survey details. Functional groups: Pi piscivores, Prey intermediate consumers, Res resources.
Community
Code
Survey
Time-period
Hauls per year
Area
(km²)
Depth range (m)
No species per functional
group Pi Prey
Res Mediterranean Northern Alboran Sea Alboran MEDITS1 1995-
2006 26-44 12 753 10-800 2 16 0
Northern Spain Spain MEDITS1 1995-2006
63-97 32 506 10-800 5 20 0
Gulf of Lions Lions MEDITS1 1995-2006
64 - 76 13 860 10-800 5 15 3
East Corsica Corsica MEDITS1 1995-2006
13 - 25 4 562 10-800 6 11 4
Ligurian and NorthernTyrrhenian Sea
Ligurian MEDITS1 1995-2006
120 - 153
42 410 10-800 6 16 1
Central-Southern Tyrrhenian Sea Tyrrhenian MEDITS1 1995-2006
85 - 70 20 255 10-800 1 20 0
Sardinia Sardinia MEDITS1 1995-2006
95 - 125 26 975 10-800 8 24 0
North-Western Ionian Sea W-Ionian MEDITS1 1995-2006
70 - 74 16 347 10-800 3 21 0
Eastern Ionian Sea E-Ionian MEDITS1 1995-2006
15 - 32 16 823 10-800 4 20 0
Aegean Sea (including Crete) Aegean MEDITS1 1996-2006
131 - 149
155 674 10-800 3 24 0
North-East Atlantic North Sea North IBTS2 1995-
2006 211 - 362
575 300 10-270 9 16 10
Eastern English Channel Channel CGFS3 1995- 83 - 109 30 672 7-82 10 10 3
7
2006 Celtic Sea Celtic EVHOE4 1997-
2007 53 - 82 150 000 20-400 10 16 13
Bay of Biscay Biscay EVHOE4 1995-2006
56 - 113 72 500 20-600 14 21 10
1 International bottom trawl surveys in the Mediterranean (Bertrand et al. 2002). 2 International Bottom Trawl Survey (ICES 1996). 3 Channel Ground Fish Survey (Carpentier, Lemoine & Souplet 1989). 4 EValuation des ressources Halieutiques de l'Ouest de l'Europe par campagnes de chalutages programmés (ICES 1991).
8
9
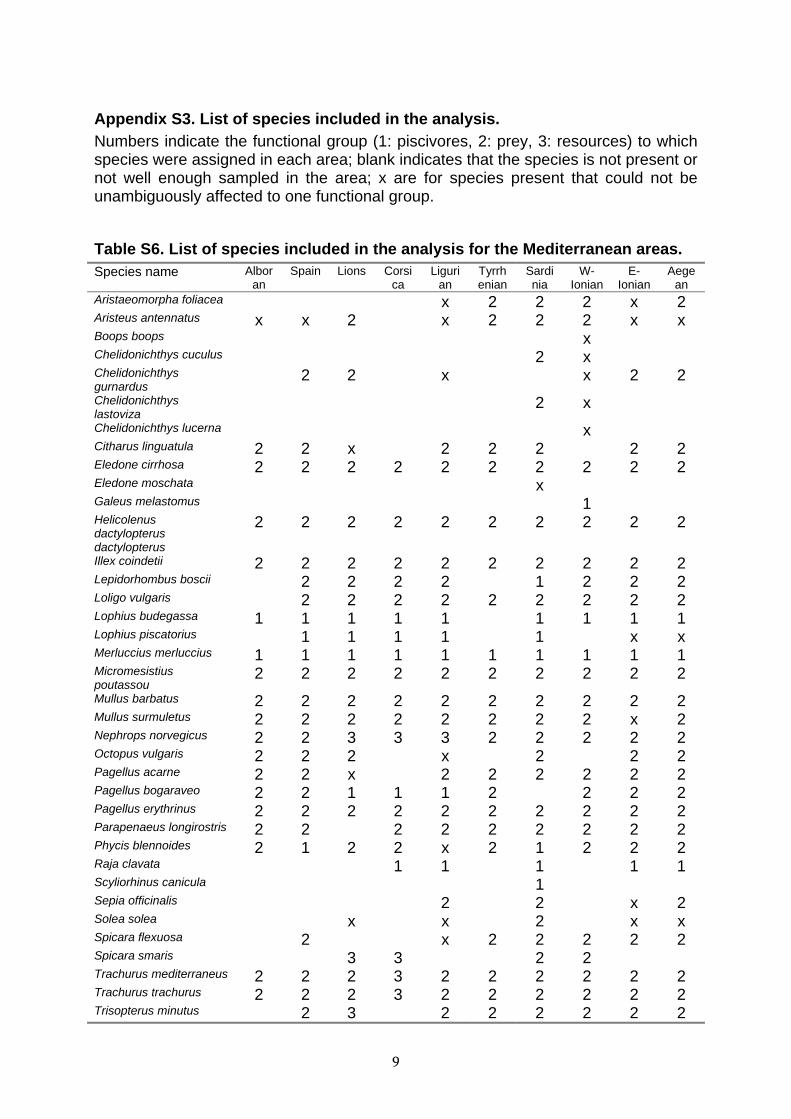
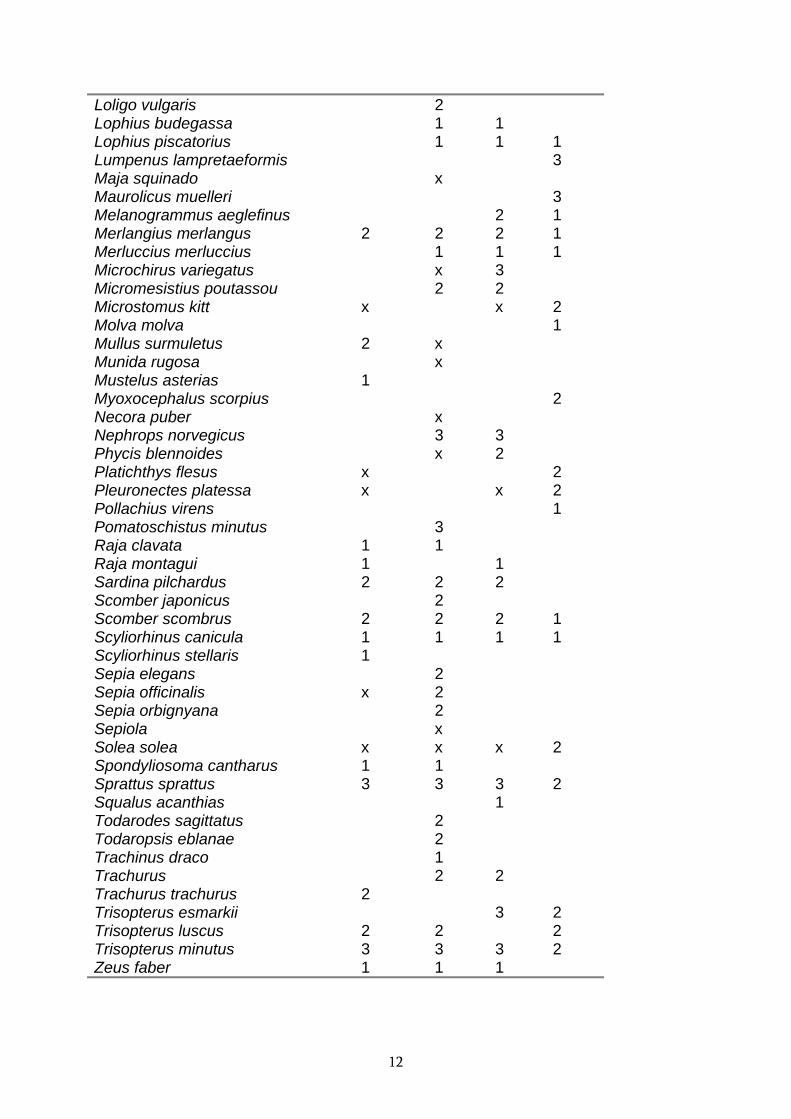
Appendix S3. List of species included in the analysis. Numbers indicate the functional group (1: piscivores, 2: prey, 3: resources) to which species were assigned in each area; blank indicates that the species is not present or not well enough sampled in the area; x are for species present that could not be unambiguously affected to one functional group.
Table S6. List of species included in the analysis for the Mediterranean areas. Species name Albor
an Spain Lions Corsi
ca Liguri
an Tyrrhenian
Sardinia
W-Ionian
E-Ionian
Aegean
Aristaeomorpha foliacea x 2 2 2 x 2 Aristeus antennatus x x 2 x 2 2 2 x x Boops boops x Chelidonichthys cuculus 2 x Chelidonichthys gurnardus
2 2 x x 2 2
Chelidonichthys lastoviza
2 x
Chelidonichthys lucerna x Citharus linguatula 2 2 x 2 2 2 2 2 Eledone cirrhosa 2 2 2 2 2 2 2 2 2 2 Eledone moschata x Galeus melastomus 1 Helicolenus dactylopterus dactylopterus
2 2 2 2 2 2 2 2 2 2
Illex coindetii 2 2 2 2 2 2 2 2 2 2 Lepidorhombus boscii 2 2 2 2 1 2 2 2 Loligo vulgaris 2 2 2 2 2 2 2 2 2 Lophius budegassa 1 1 1 1 1 1 1 1 1 Lophius piscatorius 1 1 1 1 1 x x Merluccius merluccius 1 1 1 1 1 1 1 1 1 1 Micromesistius poutassou
2 2 2 2 2 2 2 2 2 2
Mullus barbatus 2 2 2 2 2 2 2 2 2 2 Mullus surmuletus 2 2 2 2 2 2 2 2 x 2 Nephrops norvegicus 2 2 3 3 3 2 2 2 2 2 Octopus vulgaris 2 2 2 x 2 2 2 Pagellus acarne 2 2 x 2 2 2 2 2 2 Pagellus bogaraveo 2 2 1 1 1 2 2 2 2 Pagellus erythrinus 2 2 2 2 2 2 2 2 2 2 Parapenaeus longirostris 2 2 2 2 2 2 2 2 2 Phycis blennoides 2 1 2 2 x 2 1 2 2 2 Raja clavata 1 1 1 1 1 Scyliorhinus canicula 1 Sepia officinalis 2 2 x 2 Solea solea x x 2 x x Spicara flexuosa 2 x 2 2 2 2 2 Spicara smaris 3 3 2 2 Trachurus mediterraneus 2 2 2 3 2 2 2 2 2 2 Trachurus trachurus 2 2 2 3 2 2 2 2 2 2 Trisopterus minutus 2 3 2 2 2 2 2 2

Zeus faber 1 1 1 1 1 1 2
10
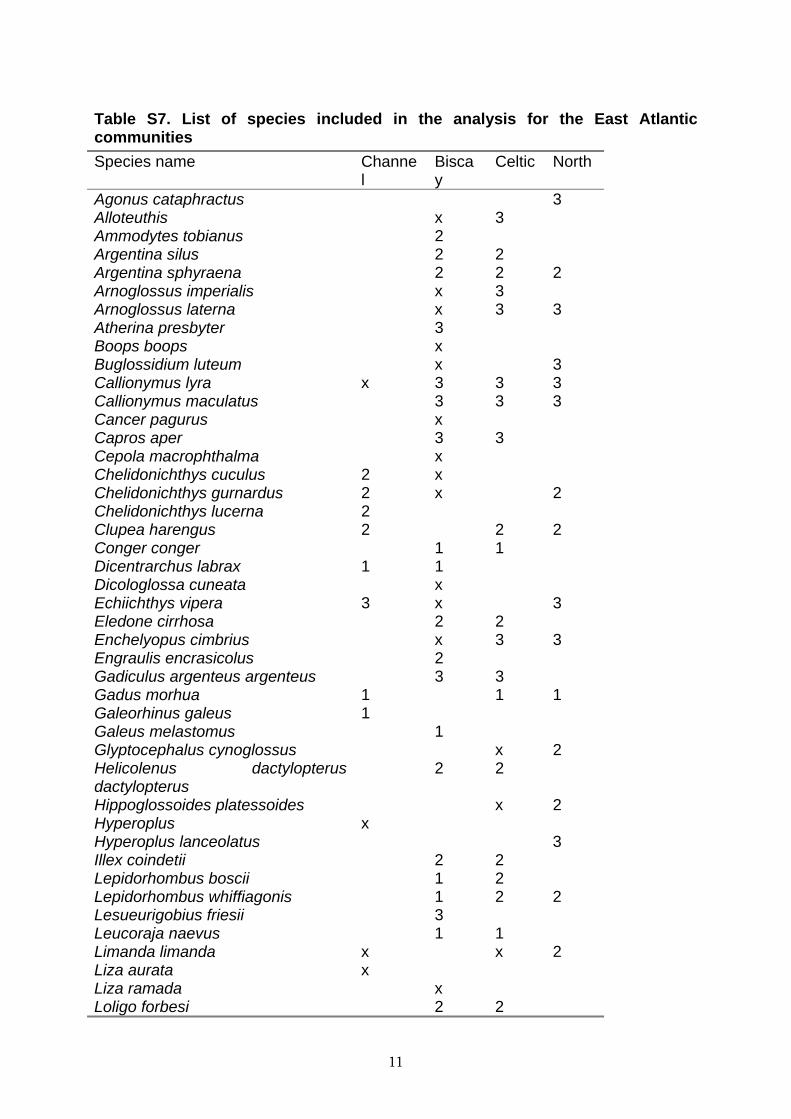
Table S7. List of species included in the analysis for the East Atlantic communities
Species name Channel
Biscay
Celtic North
Agonus cataphractus 3 Alloteuthis x 3 Ammodytes tobianus 2 Argentina silus 2 2 Argentina sphyraena 2 2 2 Arnoglossus imperialis x 3 Arnoglossus laterna x 3 3 Atherina presbyter 3 Boops boops x Buglossidium luteum x 3 Callionymus lyra x 3 3 3 Callionymus maculatus 3 3 3 Cancer pagurus x Capros aper 3 3 Cepola macrophthalma x Chelidonichthys cuculus 2 x Chelidonichthys gurnardus 2 x 2 Chelidonichthys lucerna 2 Clupea harengus 2 2 2 Conger conger 1 1 Dicentrarchus labrax 1 1 Dicologlossa cuneata x Echiichthys vipera 3 x 3 Eledone cirrhosa 2 2 Enchelyopus cimbrius x 3 3 Engraulis encrasicolus 2 Gadiculus argenteus argenteus 3 3 Gadus morhua 1 1 1 Galeorhinus galeus 1 Galeus melastomus 1 Glyptocephalus cynoglossus x 2 Helicolenus dactylopterus dactylopterus
2 2
Hippoglossoides platessoides x 2 Hyperoplus x Hyperoplus lanceolatus 3 Illex coindetii 2 2 Lepidorhombus boscii 1 2 Lepidorhombus whiffiagonis 1 2 2 Lesueurigobius friesii 3 Leucoraja naevus 1 1 Limanda limanda x x 2 Liza aurata x Liza ramada x Loligo forbesi 2 2
11
Loligo vulgaris 2 Lophius budegassa 1 1 Lophius piscatorius 1 1 1 Lumpenus lampretaeformis 3 Maja squinado x Maurolicus muelleri 3 Melanogrammus aeglefinus 2 1 Merlangius merlangus 2 2 2 1 Merluccius merluccius 1 1 1 Microchirus variegatus x 3 Micromesistius poutassou 2 2 Microstomus kitt x x 2 Molva molva 1 Mullus surmuletus 2 x Munida rugosa x Mustelus asterias 1 Myoxocephalus scorpius 2 Necora puber x Nephrops norvegicus 3 3 Phycis blennoides x 2 Platichthys flesus x 2 Pleuronectes platessa x x 2 Pollachius virens 1 Pomatoschistus minutus 3 Raja clavata 1 1 Raja montagui 1 1 Sardina pilchardus 2 2 2 Scomber japonicus 2 Scomber scombrus 2 2 2 1 Scyliorhinus canicula 1 1 1 1 Scyliorhinus stellaris 1 Sepia elegans 2 Sepia officinalis x 2 Sepia orbignyana 2 Sepiola x Solea solea x x x 2 Spondyliosoma cantharus 1 1 Sprattus sprattus 3 3 3 2 Squalus acanthias 1 Todarodes sagittatus 2 Todaropsis eblanae 2 Trachinus draco 1 Trachurus 2 2 Trachurus trachurus 2 Trisopterus esmarkii 3 2 Trisopterus luscus 2 2 2 Trisopterus minutus 3 3 3 2 Zeus faber 1 1 1
12
a) Piscivores, Even metrics
Biscay
Celtic
Channel
North
Aegean
E-Ionian
W-Ionian
Sardinia
Tyrrhenian
Ligurian
Corsica
Lions
Spain
Alboran
FP
id
FP
ii
no.c
hang
e
mul
tiple
Res
d.F
Pri
Res
i.FP
rd
b) Piscivores, Group metrics
Biscay
Celtic
Channel
North
Aegean
E-Ionian
W-Ionian
Sardinia
Tyrrhenian
Ligurian
Corsica
Lions
Spain
Alboran
FP
id
FP
ii
no.c
hang
e
mul
tiple
Res
d.F
Pri
Res
i.FP
rd
c) Prey, Even metrics
Biscay
Celtic
Channel
North
Aegean
E-Ionian
W-Ionian
Sardinia
Tyrrhenian
Ligurian
Corsica
Lions
Spain
Alboran
FP
id.F
Pri
FP
ii.F
Prd
no.c
hang
e
mul
tiple
Res
d
Res
i
d) Prey, Group metrics
Biscay
Celtic
Channel
North
Aegean
E-Ionian
W-Ionian
Sardinia
Tyrrhenian
Ligurian
Corsica
Lions
Spain
Alboran
FP
id.F
Pri
FP
ii.F
Prd
no.c
hang
e
mul
tiple
Res
d
Res
i
e) Community, Even metrics
Biscay
Celtic
Channel
North
Aegean
E-Ionian
W-Ionian
Sardinia
Tyrrhenian
Ligurian
Corsica
Lions
Spain
Alboran
FP
id
FP
ii
no c
hang
e
mul
tiple
Res
d
Res
i
FP
ri
FP
rd
f) Community, Group metrics
Biscay
Celtic
Channel
North
Aegean
E-Ionian
W-Ionian
Sardinia
Tyrrhenian
Ligurian
Corsica
Lions
Spain
Alboran
FP
id
FP
ii
no c
hang
e
mul
tiple
Res
d
Res
i
FP
ri
FP
rd
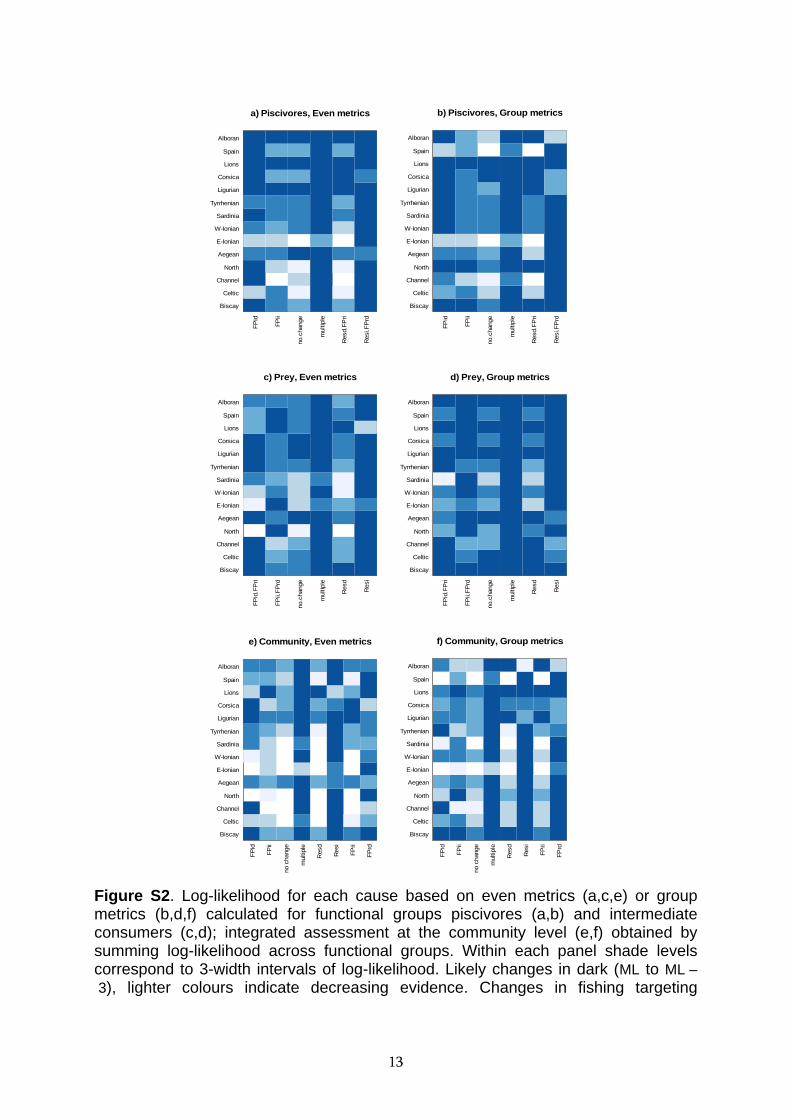
Figure S2. Log-likelihood for each cause based on even metrics (a,c,e) or group metrics (b,d,f) calculated for functional groups piscivores (a,b) and intermediate consumers (c,d); integrated assessment at the community level (e,f) obtained by summing log-likelihood across functional groups. Within each panel shade levels correspond to 3-width intervals of log-likelihood. Likely changes in dark (ML to ML – 3), lighter colours indicate decreasing evidence. Changes in fishing targeting
13

piscivores (FPi) or prey (FPr), or in resource productivity (Res): d decrease, i increase.
14
1
23
4
2 4 6 8 2 4 6 8 2 4 6 8 2 4 6 8 2 4 6 8
2 2.5 3 3.5 4
Num
ber of c
ause
s
Log-likelihood ratio test value
a) Number of equally likely causes
2.0 2.5 3.0 3.5 4.0
0.0
0.2
0.4
0.6
0.8
1.0
b) Proportion consistent
Log-likelihood ratio test value
Pro
portio
n
F-PiF-PrResall
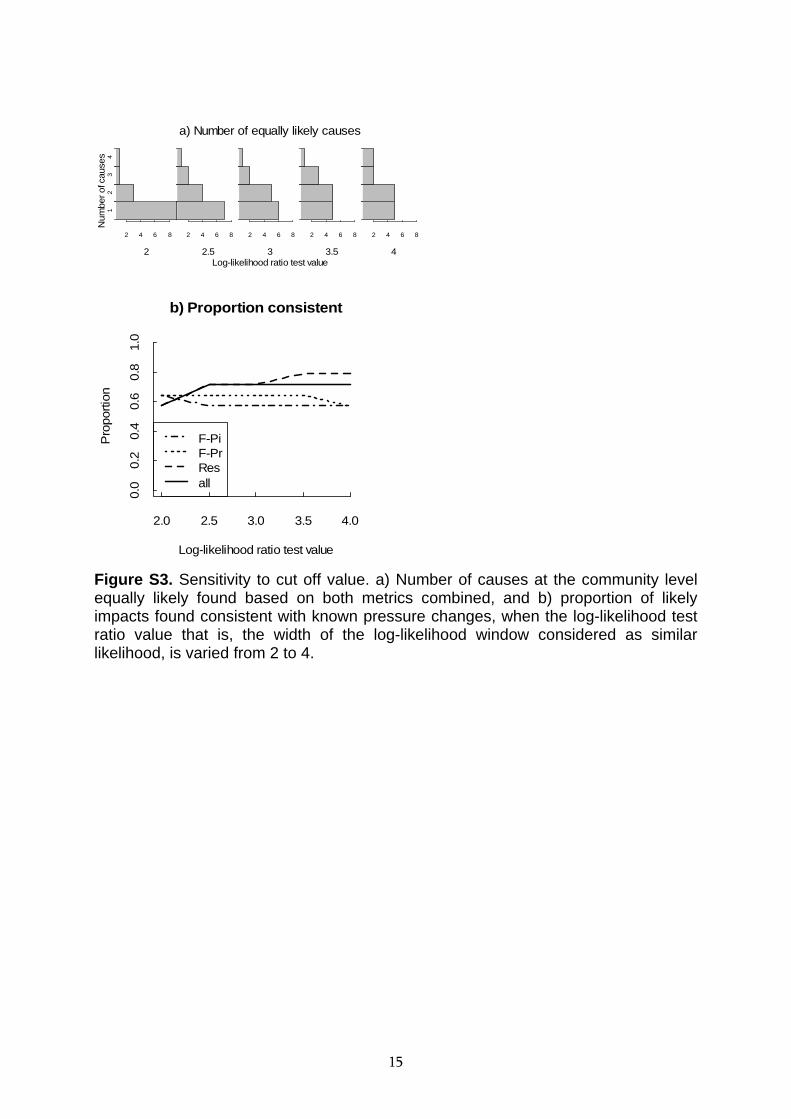
Figure S3. Sensitivity to cut off value. a) Number of causes at the community level equally likely found based on both metrics combined, and b) proportion of likely impacts found consistent with known pressure changes, when the log-likelihood test ratio value that is, the width of the log-likelihood window considered as similar likelihood, is varied from 2 to 4.
15
Supplementary references Aldebert, Y., Recasens, L. & Lleonart, J. (1993) Analysis of gear interactions in a
hake fishery: the case of the Gulf of Lions (NW Mediterranean). Scientia Marina, 57, 207-217.
Berthou, P., Daurès, F., Guyader, O., Leblond, E., Merrien, C. & Jezequel, M. (2002) Synthèse des pêcheries 2001. Flotte Méditerranée : PACA et Languedoc-Roussillon. Ifremer, Brest.
Bertrand, J. A., Gil de Sola, L., Papaconstantinou, C., Relini, G. & Souplet, A. (2002) The general specifications of the Medits surveys. Scientia Marina, 66, 9-17.
Campillo, A. (1992) Les pêcheries françaises de Méditerranée. Synthèse des connaissances. IFREMER, Sète.
Carpentier, A., Lemoine, M. & Souplet, A. (1989) Description and first results of a new ground fish survey in the English Channel. ICES CM 1989/ F: 43.
Daurès, F., Rochet, M. J., Van Iseghem, S. & Trenkel, V. M. (2009) Fishing fleet typology, economic dependence, and species landing profiles of the French fleets in the Bay of Biscay, 2000-2006. Aquatic Living Resources, 22, 535–547.
Diaz-Almela, E., Marbà, N. & Duarte, C. M. (2007) Consequences of Mediterranean warming events in seagrass (Posidonia oceanica) flowering records. Global change biology, 13, 224-235.
Dulvy, N. K., Rogers, S. I., Jennings, S., Stelzenmüller, V., Dye, S. R. & Skjoldal, H. R. (2008) Climate change and deepening of the North Sea fish assemblage: a biotic indicator of warming seas. Journal of Applied Ecology, 45, 1029-1039.
Galgani, F., Léauté, J.-P., Moguedet, P., Souplet, A., Verin, Y., Carpentier, A., Goraguer, H., Latrouite, D., Andral, B., Cadiou, Y., Mahé, J.-C., Poulard, J. C. & Nérisson, P. (2000) Litter on the sea floor along European coasts. Marine Pollution Bulletin, 40, 516-527.
García-Rodriguez, M., Fernandez, A. M. & Esteban, A. (2006) Characterisation, analysis and catch rates of the small-scale fisheries of the Alicante Gulf (SE Spain) over a 10 years time series. Fisheries Research, 75, 226-238.
ICES (1991) Report of the study group on the coordination of bottom trawl surveys in sub-areas VI, VII and VIII and division IXa. ICES C.M. 1991 / G: 13.
ICES (1996) Manual for the International Bottom Trawl Surveys. Addendum to ICES C.M. 1996 / H: 1, ICES.
ICES (2008a) Report of the Working Group for Regional Ecosystem Description (WGRED). ICES, Copenhagen.
ICES (2008b) Report of the Working Group on Assessment of Southern Shelf Demersal Stocks (WGSSDS). ICES, Copenhagen.
ICES (2008c) Report of the Working Group on Assessment of Southern Shelf Stocks of Hake, Monk and Megrim (WGHMM). ICES, Copenhagen.
ICES (2008d) Report of the working group on ecosystem effects of fishing activities (WGECO) May 6–13 2008, Copenhagen, Denmark. ICES, Copenhagen.
Jadaud, A., Mellon, C., Farrugio, H., Guijarro, B., Valls, M., Massuti, E., Ordinas, F. & Quetglas, A. (2006) Stock assessment of the French-Spanish shared stock of hake (Merluccius merluccius) in the Gulf of Lions. GFCM-SAC WG.
16
17
Leblond, E., Daurès, F., Berthou, P., Bernell, S., Jezequel, M., Lespagnol, P., Merrien, C. & Planchot, M. (2007) Synthèse des flottilles de pêche 2005. Flotte de la façade Méditerranée. Ifremer, Brest.
Lorance, P., Bertrand, J. A., Brind’Amour, A., Rochet, M. J. & Trenkel, V. M. (2009) Assessment of impacts from human activities on ecosystem components in the Bay of Biscay in the early 1990s. Aquatic Living Resources, 22, 409-431.
Papaconstantinou, C. (2005) The Hellenic Fisheries. State of the Hellenic Marine Environment (ed Papathanasiou & A. Zenetos). Hellenic Centre for Marine Research, Athens.
Papaconstantinou, C. & Farrugio, H. (2000) Fisheries in the Mediterranean. Mediterranean Marine Science, 1, 5-18.
Persohn, C., Lorance, P. & Trenkel, V. M. (2009) Habitat preferences of selected demersal fish species in the Bay of Biscay and Celtic Sea, North-East Atlantic. Fisheries Oceanography, 65, 1449-1455.
Rijnsdorp, A. D., Daan, N. & Dekker, W. (2006) Partial fishing mortality per fishing trip: a useful indicator of effective fishing effort in mixed demersal fisheries. ICES Journal of Marine Science, 63, 556-566.
RNO (2000) Surveillance du milieu marin. Travaux du RNO. Edition 2000. Ifremer et Ministère de l'Aménagement du Territoire et de l'Environnement, Nantes.
Rochet, M. J., Prigent, M., Bertrand, J. A., Carpentier, A., Coppin, F., Delpech, J.-P., Fontenelle, G., Foucher, E., Mahé, K., Rostiaux, E. & Trenkel, V. M. (2008) Ecosystem trends: evidence for agreement between fishers’ perceptions and scientific information. ICES Journal of Marine Science, 65, 1057-1068.
Souvermezoglou, A. & Krasakopoulou, E. (2005) Nutrients in deep seas. State of the Hellenic Marine Environment (ed Papathanasiou & A. Zenetos), pp. 137-145. Hellenic Centre for Marine Research, Athens.
Stergiou, K. I., Christou, E. D., Georgopoulos, D., Zenetos, A. & Souvermezoglou, A. (1997) The Hellenic Seas: physics, chemistry, biology and fisheries. Oceanography and Marine Biology Annual Review, 35, 415-538.