Optimal Exact and Fast Approximate Two Dimensional Pattern Matching Allowing Rotations

J.F. Craig (ed). Freshwater Fisheries Ecology – Wiley Blackwell
1
5.5 The optimal fishing pattern Jeppe Kolding1, Richard Law, Michael Plank & Paul A.M. van Zwieten
Abstract Conventional fisheries management encourages highly selective fishing patterns for various purposes, such as increase relative yield, reduce unwanted bycatch, protect various species or sizes and rebuild ecosystems. Recent empirical and theoretical studies, however, show increasing evidence that selective removals of targeted components have unintended adverse effects on stocks, fish communities and the ecosystem. Based on case studies from artisanal African freshwater fisheries, and results from dynamic size-based models, this chapter supports the renewed suggestion that an application of a more balanced fishing pattern will mitigate adverse effects and enhance food security better than increased selectivity. Contrary to common belief, small-scale unregulated artisanal fisheries, with a high diversity of seasonally adapted fishing methods, are probably the closest empirical examples we have of an optimal exploitation pattern with the least disruptive effects on the structure of the ecosystem. As such they are among the best examples of an ecosystem approach to fisheries that we have. Key words Yield, Conservation, Selectivity, Ecosystem approach, Multi-gear, Size-spectra, Balanced harvesting INTRODUCTION The basic biological objective of fisheries management is to control the quantity of fish that sustainably can be caught from a given stock or fish community. Catch (C) is a function of the available biomass (B) multiplied by the applied fishing mortality (F). Consequently, there are only two practical options for regulating the catch; either set the catch limits (total allowable catch) or regulate the fishing mortality. The fishing mortality at any given moment is a combination of the numerical effort (number of units fishing, f) and the capture efficiency of each unit, the so-called catchability coefficient (q). Catchability is strongly related to the selectivity of the gear (i.e the likelihood that a certain species or size is caught) and as nearly all fishing methods are selective, and since aquatic communities are highly size structured, the efficiency of different gears or methods will affect different parts of the stock or the community in a different way. This differential probability of capture on either species or sizes relative to their occurrence in the ecosystem, resulting from a specific constellation of fishing methods applied, is called the fishing pattern. The overall fishing mortality on a fish stock or community is thus the fishing pattern (‘how’) times the number of units or fishing power (‘how much’).
In governance, the regulation of the fishing pattern is used deliberately to selectively protect or target certain species or sizes. While total allowable catch determinations are dynamic, data intensive and expensive to monitor, gear restrictions, or mesh size regulations,
1 corresponding author

J.F. Craig (ed). Freshwater Fisheries Ecology – Wiley Blackwell
2
(so-called technical measures) are static, much cheaper and simpler to implement and control. Therefore, in most freshwater fisheries, size-limits and gear and mesh size restrictions are the preferred and often only available option for managers, besides area closures and fishing seasons. No examples for regulated fisheries exist where there is not some kind of selectivity regulation in the form of gear restrictions (Misund et al., 2002). Mesh or hook size regulations are our oldest management tool, dating back to medieval legislation (Kolding & van Zwieten, 2011).
Selectivity and fisheries are therefore deeply intertwined historically, practically and theoretically. Fishermen have always primarily targeted the largest species or individuals of their prey stocks, and the notion of protecting young and juveniles for both economic and ethical reasons is deeply engrained in our mentality and our societies. The biological justifications were formulated already in the 19th century and consist of two elements: (1) a normative argument, known as the ‘propagation theory’, that fish should be given at least one chance to reproduce before being caught (Fulton, 1890; Holt, 1895), and (2) the ‘growth theory’ that fish should not be fished too young before they have realized their growth potential (Petersen, 1894). Half a century later, a mathematical formulation of ‘growth-overfishing’, the so-called single-species yield-per-recruit models was developed by Beverton & Holt (1957). The idea of ‘growth overfishing’’ has been a conceptual cornerstone in fisheries management ever since, with a deep effect on the pervasiveness of mesh size regulations and legislation globally. More recently, the non-targeted sections of the catch, often discarded as bycatch in industrial fisheries, has become of great concern for managers. Worldwide considerable effort is expended in minimizing the catch of unwanted species or sizes for either economic, ethical or conservation purposes (Kelleher, 2005; FAO, 2011; Gilman et al., 2012). The result of these converging notions and ideas is that non-selective, or indiscriminate fishing methods have become almost synonymous with destructive, inefficient and often illegal fishing methods. Increased selectivity remains the prevailing mantra in fisheries governance and conservation.
Yet, any kind of selective removal at any level within a community, or among trophic levels of species, stocks, populations, sizes and sexes, will by definition alter the relative abundance and consequently cause composition and demographic changes in the community with various ensuing cascading effects on the ecosystem structure and function. There is now increasing empirical evidence that the systematic removal of large mature adults, over time will result in a decrease in the mean size of sexual maturity and decreased growth rates (Law, 2000; Fenberg & Roy, 2008). We already know that the largest fish mothers, so-called BOFFFFs (big old fat fecund female fish), produce the most eggs [the fecundity (number of eggs) in fish increase approximately as a cube function of length], but in addition, have the best quality of eggs ensuring the highest fry survival. Differential mortality is simply the opposite of differential survival as we know from natural selection driving evolution, and ultimately, in the long run, heavy fishing pressure can result in genetic change of various traits, or so-called fishery induced evolution (Jørgensen et al., 2007). Furthermore, any fishery removes biomass and continued fishing keeps biomass at a lower level than under pristine unfished conditions. For instance, at maximum sustainable yield (MSY) the biomass selected by the fishery is fished down in general to around half of their unfished levels. Selectively removing the largest size categories of fish from a community will therefore inevitably alter its size and biomass structure and trophic functioning. The rationale of our deliberate, and until recently firmly established tradition of concentrating fishing mortality on a narrow determined subset of targets within the community, has therefore started to become increasingly questioned among evolutionary ecologists and fisheries biologists (Conover &

J.F. Craig (ed). Freshwater Fisheries Ecology – Wiley Blackwell
3
Munch, 2002; Bundy et al., 2005; Frid et al., 2006; Fenberg & Roy, 2008; Zhou et al., 2010; Rochet et al., 2011; Garcia et al., 2012; Law et al., 2012, 2013).
At the global level, natural resources management, including fisheries, has become increasingly dependent on international agreements and conventions. In addition to a general objective of maintaining stocks at high productive levels (WSSD, 2002), fisheries management also has to consider conservation objectives and most nations have signed the Convention of Biological Diversity (CBD) which has adopted the so-called ‘ecosystem approach’ as a guiding principle for sustainable use and conservation of biodiversity. A key feature of the ecosystem approach includes the preservation of ecosystem integrity, structure and functioning (the Malawi principles, http://www.cbd.int/ecosystem/principles.shtml). Technically, this is therefore in contrast to selective removals that affect the internal structure and composition of a fish community. The rationale is that ecosystem function and resilience depends on a dynamic relationship within species, between species and between species and their abiotic environment, so that the conservation of these interactions and processes is of greater significance for the long-term maintenance of biological diversity than simple protection of species (CBD, 1998). Thus one of the cardinal new questions in the use of renewable biological resources is how can we maximize food production, while making the least structural and functional disturbance to the ecosystem? Consequently, the optimal fishing pattern must be one that balances the objectives of maximizing yield while minimizing the effect on ecosystems.
In this chapter we will describe and suggest a fishing pattern that will satisfy both fishery objectives and conservation objectives. It will build on some old ideas, illustrated by empirical observation from African freshwater fisheries, and supported by recent theoretical developments. We will challenge the present paradigm of improving selectivity and conclude that a ‘balanced harvest’, defined as a moderate mortality distributed across the widest possible range of species and sizes in an ecosystem in proportion to their productivity (Garcia et al., 2012), is, from a community and ecosystem perspective, the optimal fishing pattern. Such a fishing pattern can only be obtained by abolishing size limitations, and allow fishing the whole community with a balanced multitude of different fishing methods.
THE CLASSICAL VIEWS ON SELECTIVITY AND THEIR CONSEQUENCES
In classical single-species fisheries models the optimization of yield is closely connected with selectivity of the catch. Species specific size limits have their justification from calculations on which age (size) of recruitment into a fishery would give the highest relative yield, also called yield per recruit. This, our conventional collective wisdom, is succinctly formulated by Hillis & Arnasson (1995): ‘ (…) a fishery will yield its maximum physical returns if all fish are allowed to grow to the point where the rate of increase in weight just ceases to outstrip losses due to natural mortality and then harvested, sparing a breeding stock if the existing stock has not bred sufficiently prolifically. (This is logical, and is how a farmer would produce meat, bearing in mind that he must leave a breeding stock.)’
Consequently, in order to ‘allow the fish to grow’, and preferably also to breed at least once, the size-at-entry into the fishery has to be controlled through size limits and mesh size regulations. In addition, increased selectivity for either species or sizes is repeatedly advocated as a general solution to prevent overfishing, reduce bycatch and rebuild collapsed fisheries. We find these calls in the ‘Ecosystem Approach to Fisheries’ framework (FAO, 2003; Pikitch et al., 2004), the Code of Conduct for Responsible Fisheries (Bianchi, 2008;

J.F. Craig (ed). Freshwater Fisheries Ecology – Wiley Blackwell
4
FAO, 2011), and in the work of conservation biologists (Lewinson et al., 2004; Worm et al., 2009). Conversely, indiscriminate unselective fishing is considered unethical, wasteful, destructive and harmful to the ecosystem, as illustrated for example in ‘Fishing down the foodweb’ narrative (Pauly et al., 1998) and the general despair over unregulated non-compliant small-scale fisheries (Misund et al., 2002). For many the normative argument that killing juveniles is depleting the stocks has become so dogmatic that it does not even warrant verification (Kolding & van Zwieten, 2011).
Selective fishing on large adults, however, does not always increase yields (Pope, 1991; Conover & Munch, 2002) and it has unintended ecological side effects. For instance, targeted removal of large adult fish selects for earlier maturation and decreased adult body size (Law, 2000), with unknown evolutionary consequences for the stock. Truncation of size and age structure can result in increased population fluctuations (Anderson et al., 2008; Hsieh et al., 2010) and decreased population fecundity and resilience increasing the potential for collapse (Pikitch et al., 2012). At the community level, selective fishing changes the tropic and demographic structure with cascading effects on the ecosystem (Rice & Gislason, 1996; Bundy et al., 2005; Daan et al., 2005) HISTORY, EMPIRICAL AND THEORETICAL EVIDENCE.
Marten & Polovina (1982) suggested that the highest potential yield of a mixed multispecies fishery would be obtained by a balanced diversity of gears. Following this idea, Caddy & Sharp (1986) described what they called the 'utopian', but optimal exploitation pattern, by which an ecosystem could be maintained in balance. They suggested fishing each component in proportion to the rate of natural mortality (M) it is subjected to: Y1 (M1 B1)
-1 = Y2 (M2 B2)
-1 = Y3 (M3 B3)-1 .......... =Yn (Mn Bn)
-1, thus removing as yield (Yi) a constant proportion of the total production Pi = MiBi for species i = 1, 2, 3, ... n, here B is the biomass of a component. This would be equivalent to setting a constant ratio of fishing mortality to total mortality, the so-called exploitation rate (E). Strangely, however, they called this strategy utopian because it would be impossible to control the species specific rates of fishing, and because the constant ratio would be difficult to define. Neither of these arguments are easy to understand as species specific rates of harvest (whether MSY or maximum rate of fishing mortality, FMSY) and sustainable exploitation rates (Y:P or fishing mortality:total mortality, F:Z) are the ultimate aim of all stock assessments. So if such target or reference points are utopian, then all contemporary fisheries management is utopian. The largest difference to present management is how to distinguish between the traditional single species MSY (where man is the only predator) and a multispecies MSY where productivity must be shared among all predators. If the ideal exploitation rate is constant on all components of the fish community, however, then that would also affect consumption by all components equally. The maximum sustainable single population exploitation rate (conventionally set at 0.5) could ideally be simply divided by two, which theoretically would mean that half of the maximum surplus production can go to the fishery and the other half to all other predators (Kolding, 1993). The exploitation rate (or ‘how much’ question), however, is not the focus here where we will concentrate on the exploitation pattern (or the ‘how’ question).
The idea of a balanced fishing across a range of species and sizes by a balanced diversity of gears was recently revived by Garcia et al. (2011, 2012). They concluded that conventional selective fishing was having unintended consequences that were inconsistent with a range of international conventions on the ecosystem approach and rebuilding of stocks, and that selectivity regulations, such as mesh size limitations, would be conflicting with goals

J.F. Craig (ed). Freshwater Fisheries Ecology – Wiley Blackwell
5
to maintain biodiversity or maximize yields. Instead they suggested that balanced harvest, obtained by distributing the fishing mortality as a proportion of the productivity across the widest possible range of species, stocks and sizes in the ecosystem (Fig. 5.5.1), would mitigate the unintended ecological effect of fishing while supporting sustainable fisheries.
FIG. 5.5.1. Different fishing patterns on a fish community, illustrated as a Lindeman trophic pyramid with fish predators at the top and phytoplankon and detritus eaters at the bottom. The width of the triangle represents relative biomass. Black curves represent selective removals, arrows the direction of increased fishing pressure. By fishing proportionally at all trophic levels and sizes, the pyramid stays internally intact. After Kolding & van Zwieten (2011).
EMPIRICAL CASE STUDIES OF BALANCED HARVEST
Given the selective properties of all fishing gears, a harvest that is targeting all components can only be achieved by a range of different gears that are flexibly employed in time and space over the available habitats. Given also our history, theory, legislation and natural preferences for certain species or sizes, however, very few fisheries are fished unselectively or in balance with its production. As unselective or indiscriminate fishing is usually also illegal, and therefore regarded as poaching and rarely reported (so-called IUU fishing), we have very little empirical evidence from such systems. It is therefore an open question how ‘detrimental’ such fishing methods in reality are (Misund et al., 2002). There are, however, a few examples of such fisheries from inland Africa where the actual effect of non-selective illegal gear used in small-scale fisheries has been studied (Jul-Larsen et al., 2003). These are all relatively unregulated fisheries, due to lack of enforcement, in which the fishing is tailored to the available biomass in the fish community. One such example is the traditional Bangweulu swamps fishery in northern Zambia, which albeit being technically illegal in most activities, has adapted a fishing pattern that largely reflects the regenerative processes of the fish community, and therefore appears to be in ecological balance (Kolding et al., 2003a). Another example is Lake Volta, Ghana, which highlights the flexible effort dynamics required to potentially achieve such fishing patterns (van Zwieten et al, 2011). Bangweulu
The vast oligotrophic Bangweulu floodplain and swamps in northern Zambia is the second most important fishery in the country and the single most important economic activity in the area. The ecosystem and the fishery are highly dependent on the seasonal and inter-annual fluctuations of the water levels (Kolding & van Zwieten, 2012), causing large areas of

J.F. Craig (ed). Freshwater Fisheries Ecology – Wiley Blackwell
6
floodplains to be temporarily inundated. The amount of rain is the main environmental driver, and good fishing years are preceded by years of high water levels. Being adapted to a fluctuating environment, most fish species are generally small, hardy, fast growing and with a high biological overturn. Only a single stock assessment has been performed in Bangweulu 15 years ago, which found no indications of biological overfishing (Kolding et al., 2003a).
The fishing pattern in terms of various methods and gears used is adapted to catch a high variety of predominantly small fishes. The fishing consists of a seasonally changing mixture of weirs, long-lines, seines and gillnets, the last often combined with beating the water (so-called kusikila). Both the fishery and the fish biology are strongly adjusted to the annual flood cycles. During the dry season the water recedes, and all the fishes including juveniles that have been feeding on the floodplains are forced back. They concentrate in the isolated pools or into the main channels. Here they enter a cut-throat competition for space, and those isolated enter a period of high mortalities from avian predation, reduced water quality and sometimes stranding. Only the luckiest, largest and strongest survive to the next boom season.
Through centuries of experience the fishers in the Bangweulu wetlands have become well adapted to the environmental conditions. The various fishing methods are highly seasonal and follow the annual floodplain cycle (Huchzermeyer, 2013). The earth dams (weirs) on the grassy floodplains only operate according to the rainfall for a few weeks of April and May, but in that period they can yield high catches while the falling water carries fishes (mostly juveniles) to the swamps. The reed weirs in the permanent swamp channels, generally inundated during the first part of the year, come into operation around June to July and only last to August to September. They mainly target small mormyrids, such as bulldogs Marcusenius macrolepidotus. From August to November the drive gillnet (kusikila) for breams Tilapia rendalli and Serranochromis spp. and longline fishery for the larger predators (catfish Clarias gariepinus and tigerfish Hydrocynus vittatus) starts in the lagoons and open channels. The peak season for the whole fishery (> 50% of fishers actually fishing) is from May to November.
The fisheries regulations in Zambia are largely inherited from colonial times and have roots in classical fisheries theory and terrestrial game legislation (Malasha, 2003). In Bangweulu they consist of: (1) a closed fishing season from 1 December to 1 March, (2) mesh size restrictions with a minimum limit of 51 mm (2”) stretched mesh and (3) all forms of active fishing are prohibited. This includes the popular kusikila fishing (kusikila, also known as kutumpula, is a technique which drives the fish into stationary surrounding gillnets by beating into the water with clubs or paddles from wading or canoeing fishermen) and seining. Although not explicitly mentioned in the fisheries act, fishing weirs are generally regarded as illegal gears as well due to their fine meshed traps. In practice, however, these regulations are ignored by the fishers who disagree with most of them. Nearly 80 % of the fishing gears and methods applied in Bangweulu are technically illegal if weirs are included, and three quarters of the mesh sizes (again including weir traps) are under the legal limit of 51 mm (Table 5.5.1). This combination of fishing gears and methods used in the Bangweulu swamps have not changed much for as long as records are available. Weir, line, gillnet, kusikila and basket fishing have always been part of the traditional fishery (Brelsford, 1946). The only modern improvement is the transition during the 1940s to 1950s from nets made of natural plant fibres to multifilament synthetic twine. The strong contradiction between the traditional and established fishing pattern and the legal

J.F. Craig (ed). Freshwater Fisheries Ecology – Wiley Blackwell
7
framework has for decades caused serious conflicts between the fishers and the managers. Fishermen claim that catches of most of the small species with abundant populations, such as Tilapia sparmanii, Barbus paludinosus, Petrocphalus catastoma and others would not be economically viable if the regulations were followed. On the other hand the management authority, the Department of Fisheries, has neither the means nor the manpower to enforce the regulations other than through sporadic patrols. The result is an ongoing tug-of-war, and a serious breach of confidence and trust between the parties (Chanda, 1998).
The general perception with the local administration and many non-governmental organizations (NGOs) is that the fish stocks are heavily fished, and perhaps even threatened, by high fishing pressure. For a long time recurrent fears have been expressed that the fishery of the Bangweulu system has undergone alarming changes indicated by a decrease in the mean size of fish caught and a general decline in individual catch rates. Fishermen are believed to have caused these changes by an intensified illegal utilization of small meshed gillnets, seining, weirs, as well as kusikila. TABLE 5.5.1. Total number of fishing gears by type and mesh size for the Bangweulu swamps during the 1992 and 1996 frame surveys. The proportion of legal gears and mesh sizes are indicated in green and contributes only 22% of total. Illegal gears are shown as orange. Although not specifically mentioned in the act, the weirs are generally considered illegal because the small mesh sizes in their traps (modified from Kolding et al., 2003a)
The fishing pressure on a population is measured in terms of how much of the annual production is harvested as yield. This is given as the exploitation rate (E), which is simply the total annual catch (C) divided by the annual production (P) [also expressed as the fishing mortality (F) divided by the total mortality (Z)]. All fishes are born as tiny fry, and it usually takes time to grow large. Thus the larger the fishes are, the longer they are subject to exploitation and the more they are commonly targeted in a fishery. Consequently, there is usually a clear positive trend between the exploitation rate and size. This is illustrated by correlating the size range of exploitation, which is the difference between maximum length (L∞) and the median size of fish caught, with the mean exploitation rate (Fig. 5.5.2).
Mesh size Mesh size(mm) gillnets kusikila seines weir traps cumulative %
3 3869 134 8358 416 2322 498 387 501025 534 17 53 5238 6719 68 178 7550 4233 135 49 9063 1260 643 9776 554 74 9989 136 - 99
102 - - 114 - 127 255 100140 -
Total: 13691 937 280 14936 29844% 46 3 1 50 100
% legal 22
Total number of gear by type

J.F. Craig (ed). Freshwater Fisheries Ecology – Wiley Blackwell
8
FIG. 5.5.2. Exploitation rate (fishing mortality: total mortality, F:Z) of all species investigated in all gears except weirs plotted against their average size (LT) range of exploitation. Exploitation rates (F:Z) are the fraction of the total production harvested, and are considered safe when < 0.5 (= maximum 50% of total production caught). Only the largest predators (Clarias gariepinus and Hydrocynus vittatus) are technically overfished in mainly the legal gillnets. For all the smallest species in the system the harvest rates are < 10% (from Kolding et al., 2003a). TABLE 5.5.2. The top seven most important species in the Bangweulu fishery comprising 80% of the total catches, and their main method of captures during the 1994 to 1997 stock assessment surveys. P:B is the annual production to biomass ratio (= turnover rate of the biomass).The exploitation rates(= fraction of total production harvested) are weighed averages from all methods. As a rule of thumb species are considered overexploited when exploitation values are higher than c. 0.5. Data in Kolding et al. (2003a) and Chanda (1998).
Species Main method Total catch (t)
Per cent of total
P:B Average exploitation
Marcusenius macrolepidotus Seines, weirs 1570 18 3.7 0.38 Tilapia rendalli Kusikila 1195 14 2.7 0.37 Serranochromis angusticeps Kusikila 1101 13 1.8 0.35 Clarias gariepinus Weirs, gillnets 1013 12 1.4 0.47 Serranochromis mellandi Weirs, gillnets 874 10 2.1 0.41 Serranochromis robustus Kusikila 739 8 1.8 0.54 Tilapia sparrmanii Gillnets 487 7 3.0 0.04 Total 6979 80 2.4
In order to investigate these perceived threats, a formal assessment of the fish stocks in the Bangweulu swamps to establish their level of exploitation was performed during the period 1994 to 1997 (Kolding et al., 1996, 2003a; Chanda, 1998). They found that seven species (Table 5.5.2) together accounted for 80% of the total catches. The most important species by volume is the small shoaling invertebrate feeding snoutfish Marcusenius macrolepedotus. The ubiquitous catfish Clarias gariepinus is one of the larger predators in the system and contributes significantly to the fishery. The adults are mainly caught in gillnets
R² = 0.7738
0.0
0.1
0.2
0.3
0.4
0.5
0.6
0.7
0.8
0 5 10 15 20 25 30 35 40 45 50
Mea
n e
xplo
itat
ion
rat
e (F
:Z)
Size range of exploitation (L00-L50%, cm LT)
Large predatorsin gillnets
Medium sized cichlids
Small species
Clarias gariepinus and Serranochromis robustus
in seines
r2 = 0.77

J.F. Craig (ed). Freshwater Fisheries Ecology – Wiley Blackwell
9
and longlines, while the juveniles are caught in large quantities in the seasonal floodplain weirs. The remaining five of the top-seven are all cichlids: Two of these are predators (Serranochromis angusticeps and Serranochromis robustus), one is the herbivore redbreast bream Tilapia rendalli, and the last is the small ubiquitous omnivore banded tilapia Tilapia sparmanii.
Contrary to expectations, the stock assessments revealed that the only species that were technically ‘overexploited’ (E > 0.5), were the largest predators (C. gariepinus, H. vittatus and S. robustus) caught in the legal gears (gillnets and hooks). A reduction in fishing effort of close to 50% on these species could therefore increase (marginally: the theoretical potential increase for these three species was calculated at c. 30 tons year-1, i.e. < 0.5% of the total fishery) the total yield for these species, but this would, under a legal fishing pattern, entail a corresponding 50% reduction in the overall landings. Clearly, there would be no economic incentive for such a reduction, and none of the large predators are threatened; only their long-term yields are slightly lower than they perhaps could be. By contrast, the medium sized cichlids could all be submitted to a higher fishing pressure to increase yields, but again the effect would be rather small. Only the smallest species in the system are technically under-utilized and can sustain a substantially higher fishing pressure. The overall conclusion from the stock assessment was that the yield obtained with the observed combination of gears (including illegal) and effort was remarkably close to the potential long-term MSY summed for each species over the fish community under steady state conditions; steady state conditions means that there are no changes in the environmental driving forces (i.e. precipitation), and that the observed relative species and abundance composition is constant. The only change accounted for in such an analysis is change in the fishing effort.
FIG. 5.5.3. Estimated standing biomass (kg ha-1) and length (LT) of the 13 most important species in the Bangweulu fishery (the measured biomass comprises those fishes and sizes that could be caught by the sampling gears; thus specimens of < 6-7 cm were not representatively sampled and therefore not included). Only three predatory species: Clarias gariepinus, Hydrocynus vittatus and Serranochromis robustus are getting larger than c. 30 cm. The largest biomass is from Tilapia rendalli, Tilapia sparmanni and Marcusenius macrolepidotus. From Kolding et al. (2003a).
Most of the standing fish biomass in Bangweulu swamps (Fig. 5 5.3) is from specimen and species < 15 cm in total length (LT) and c. 90% of the measured biomass is < 25 cm.
0.0
0.5
1.0
1.5
2.0
2.5
3.0
3.5
4.0
Bio
mas
s (k
g ha
-1)
Total Length (cm)
Clarias gariepinus
Hydrocynus vittatus
Serranochromis robustus
Serranochromis angusticeps
Tilapia rendalli
Oreochromis macrochir
Serranochromis mellandi
Tilapia sparrmanii
Schilbe mystus
Petrochephalus catostoma
Marcusenius macrolepidotus
Barbus trimaculatus
Barbus paludinosus

J.F. Craig (ed). Freshwater Fisheries Ecology – Wiley Blackwell
10
When comparing the fishing pattern (Fig. 5.5.4) with the biomass-size distributions of the fish stocks (Fig. 5.5.3) it is clear that the fishers, by the traditional combination of fishing methods used, to a large extent had optimized the fishery. Ninety per cent of the gillnet catches are taken in mesh sizes smaller than the legal 51 mm stretched mesh, and these catches consist mainly of small species such as T. sparmanni and M. macrolepidotus, which are abundant and only low to moderately exploited (Table 5.5.2).
FIG. 5.5.4. Relative species and and length (LT) composition (number fish caught) of the main fishing methods in the Bangweulu fishery during the 1994 to 1997 surveys. Each method has its own distinctive composition, and only by using a dynamic combination of all will an overall balanced (i.e proportional) harvest of the whole community be possible. However, only the largest fish (> c. 15 cm) caught in gillnets are technically legal.
As seen from Fig. 5.5.2, the largest species in the system are the most heavily fished, while the smallest species are hardly harvested. Thus, over time, the community structure will change under heavy exploitation which selectively is targeting large fishes. As these become fewer, there will often be an increase in the smaller fish (due to less predation), and this will typically be seen as an increase in the slope (it will become steeper) of the community spectrum (Fig. 5.5.5). In the fishery it will be observed as the typical decrease in the mean size of the organisms caught (there will be more small and less large fish), and this feature is a common diagnostic indicator of intensive exploitation. Although this is an unavoidable consequence of selectively targeting large fishes, the usual responses are calls for obeying the fisheries regulations and enforcing the ubiquitous gear, mesh, or minimum size regulations. As this is aimed at killing the large adults and sparing the juveniles it will only exacerbate the symptoms that the interventions are meant to cure (Kolding & van Zwieten, 2011).
On the other hand, fishers will invariably react in the opposite direction. As the fishery expands and effort grows (i.e. more and more fishers enter a system), then there will be more and more users to share the same pie (= the total annual production summed over all species). This will consistently result in a decrease in each individual’s share, which the fisherman will see as a decline in his own catches. This means that, over time, the fisher will experience that,

J.F. Craig (ed). Freshwater Fisheries Ecology – Wiley Blackwell
11
each time he sets a net, or empty a weir basket, there will be fewer fish per unit effort. This is the so-called catch rate, or catch per unit effort (CPUE). When the individual fishers experience a decrease in their CPUE, then the only ways to compensate is to (1) invest in more gears, a limited option in most small scale fisheries, (2) find new fishing grounds by investing in engine power, range expansion, also a limited option in most small scale fisheries, (3) change the target species, or (4) start catching the more numerous and abundant smaller species in the system. The last can only be achieved by decreasing the mesh sizes or using gears actively instead of passively, both affecting the selectivity of the fishing gears. Typically this will result in entering into the realm of illegal fishing methods, and thus in opposite direction of the prescription of the managers.
FIG. 5.5.5. Ln-transformed cumulated mass by species and length (LT) caught by all major fishing methods in Bangweulu during the 1994 to 1997 surveys (Fig. 5.5.4). Each colour represents a separate species. Superimposed (○ red circles, full line) is the total ln-transformed biomass ha-1 LT distribution of the 13 most important species (Fig. 5.5.3). The slopes of regressions represent the demographic fish community structure of the system from prey (small sizes and juveniles) to predators (large sizes). The slope of the combined catches (-----) is lower than the community biomass (full line) in correspondence with larger species being more exploited (Fig. 5.5.2). To maintain the natural structure under harvesting, all species and sizes must be fished relative to their production rates. Simply put: for every single fish > 90 cm a corresponding 100 000 small fish < 10 cm should be caught for the system to remain in balance.
By naturally adapting the fishing activities, driven by individual catch rates, to target the most abundant parts of the fish community (Fig. 5.5.3 & 5.5.5), the traditional fishing pattern of Bangweulu (Fig. 5.5.4) is applying a much more ‘ecosystem based approach’ to fishing, albeit largely illegal, than would be achieved if the fishers had complied with the present management regulations. Only by targeting all species and sizes in proportion to their current abundances (maintained by underlying production rates), will the overall community structure remain in ‘ecological balance’. This, in fact, is precisely what the fishers in Bangweulu have been largely doing, most probably for many centuries.

J.F. Craig (ed). Freshwater Fisheries Ecology – Wiley Blackwell
12
Thus the more the management authorities try to enforce the existing regulations, largely based on the notion of ‘growth overfishing’, the more the fishers will tend to disobey them. It soon becomes the well-known eternal conflict between managers and fishers in many fisheries, and it will invariably lead to allegations of non-compliance, overfishing and destructive practises. Ironically, this tug-of-war is not only unsolvable but also completely futile from an ecological perspective (Kolding & van Zwieten, 2011).
The dilemma is not new; the ichthyologist J.J. Soulsby (1963) recognized that mesh-size limitations lead to imbalanced exploitation of the fish community and suggested that small mesh sizes should be allowed. But he was soon to be criticized and silenced by mathematically inclined colleagues (Kenmuir, 1973) under the influence of the ruling yield-per-recruit models. Ever since, the ubiquitous mesh and gear restrictions are causing tense situations, often with violent outcomes, between fishers and managers all over Africa (Kolding & van Zwieten, 2011). Volta
Lake Volta in Ghana was created in 1964 with the completion of the Akosombo hydro-electrical dam creating a huge reservoir of c. 8500 km2. A large fishery developed soon after, operated by c. 72 000 fishers (1998) and on which c. 300 000 people are dependent for their livelihoods. The reported landings for Lake Volta probably are greatly underestimated: according to FAO statistics (van Zwieten et al., 2011), the reservoir generated 75 x103 t of fish in 2006, c. 20% of the total national Ghanaian fish production, but the true amount could be up to 250 x103 t (van Zwieten et al., 2011). About a third of the catch is used for local consumption while the remaining two thirds is traded in various forms throughout Ghana and further in the region. Currently 121 species have been recorded in the lake (Dankwa et al., 1999), 60 of which are important in the fishery.
As in Lake Bangweulu, the size and composition of the fish community in Lake Volta is heavily dependent on the seasonal and inter-annual fluctuations of the water levels. Each year between 115 and 1800 km2 (median = 640 km2) of the lake area is drying up and subsequently inundated, creating new fresh aquatic habitats for fishes. The annual flooding of large tracts of land, that are grazed during the dry season, most probably explains the high productivity of the reservoir as the riverine and reservoir waters are relatively low in nutrient concentrations. This also means that the annual production of fishes will vary accordingly, comparable to floodplains. Fishers around Lake Volta have over the years developed an amazing array of at least 27 different types of fishing gear to make use of this production: various forms of brush parks known as acadja or atidza and nifa-nifa; the most common gears are gillnets that are used in at least seven types of fisheries with various mesh sizes, including small mesh sizes, used in passive and active methods and in different habitats; seines including different forms of beach and purse seining; cast nets; a range of traps including the widely used simple and effective bamboo pipes; four types of long-lines; hand-lines; harpooning; a range of other methods (van Zwieten et al., 2011). Daily catch rates of all fisheries are typical for small scale freshwater fisheries with limited technological development. Median daily catch rate of all gears was 25 kg boat-1, but varies between gears from 6 kg boat-1 (pellonula seines) to 82 kg boat-1 (winch nets with engines). The annual catch of a canoe is c. 7.5 t year-1, which, with two or three fishers per boat on average gives a catch of 2.5 to 3.8 t fisher-1 year-1. This is in the same range of values as several other African freshwater fisheries (Jul-Larsen et al., 2003; Kolding & van Zwieten, 2006; van Zwieten et al., 2011).

J.F. Craig (ed). Freshwater Fisheries Ecology – Wiley Blackwell
13
The freshwater fisheries regulations of Ghana, however, are like Zambia heavily influenced by the former colonial administration and conventional fisheries theory. In Lake Volta the minimum legal mesh size in nets and traps is 50 mm stretched for multifilament and 75 mm for monofilament. The following fishing methods are deemed illegal: any towed or moving gear like seines, lift nets and trawls; bamboo pipes, which allegedly catches Chrysichthys spp. carrying eggs; winch net, a kind of purse seine introduced into the Volta by migrant fishers from the marine sector and which has very high catch; atidza (brush park), which creates conflicts because of territorialism; nifa-nifa, a type of gillnet set at the shores into which fishes are driven by beating the water with sticks, paddles or the hands; wangara nets, which is a gillnet but deployed horizontally instead of vertically. TABLE 5.5.3. Seasonality in gear use (□ light grey, used; ■, best period; □, not used) on Lake Volta.
From van Zwieten et al. (2011) Gear Jan Feb Mar Apr May Jun Jul Aug Sep Oct Nov Dec Receding water level Rising water level Palm trap Hook (Bagrus) Nifa-nifa Beach seine Acadja Ripping hook Gillnet Bamboo pipe Winch net Wangara Drift net Cast net Tilapia trap Hook (Lates) Lift basket
The majority of the fishing gears in Lake Volta are, like Bangweulu, thus technically
illegal, but the regulations are likewise ignored by the fishers. Most gears are used seasonally over different periods of the flood cycle (Table 5.5.3), as well as in different habitats, and all of them are multispecies gears catching a wide range from at least nine and up to 56 species. Fishers frequently shift between gears in the course of the year and lake level fluctuations affect spatial and temporal allocation of effort. As the surface area of the reservoir decreases during lake level recession fish migrate to deeper waters, creating concentrations of fish assemblages requiring specific pelagic and demersal fishing methods. Rising water levels provide opportunities for floodplain fish species to spawn in the submerged vegetation, as well as food and shelter for those species that prefer shallow water, requiring other, shallow water, fishing methods. Inter-annual variation in lake level also determines the effectiveness of methods. For instance, brush-parks depend on high water levels. When the water level is low after a season with limited rainfall they can at most be used for only a limited part of the year. Fishers migrate extensively along the shores together with their families: they can be found within weeks at completely different parts of the reservoir. Whole fishing villages of > 100 canoes are deserted when its inhabitants migrates to better fishing grounds. Fishers on Lake Volta are generally full-time, operating c. 300 days year-1, in working weeks of c. 6 to 6.5 days. Many fishers stop fishing for a month depending on the particular festivals at their place of origin.

J.F. Craig (ed). Freshwater Fisheries Ecology – Wiley Blackwell
14
FIG. 5.5.6. Relative length (LT) frequency distribution in the catch of dominant gears used in the Lake Volta fishery. Between March 2007 and June 2008, 10 fishermen recorded their catches twice a week utilizing their own gear. Indicated are the number of sets recorded for a set of gears and the average number of specimen caught per set. From van Zwieten et al. (2011).
All gears are size specific but most gear catch species over the whole trophic range
available. Therefore each gear appears to have a distinct trophic signature (TS) that ranges between 2 and 4.5. The trophic signature of a gear is calculated when taking the (adult) trophic level of each species weighted by their proportional abundance in the catch. Gear that fish at low trophic levels (around 2.1) are tilapia traps, acadja, nifa-nifa and cast nets. Different hook sizes on long-lines target Bagrus bayad, B. docmac Lates niloticus, Clarias gariepinus and C. anguillaris and have high trophic signatures (3.3, 3.6 and 4.5). One-inch (25 mm) gillnets that target the small pelagic predator Odaxothrissa mento also have a high trophic signature (3.8). Furthermore each gear targets a specific length (LT) range between 10 and 200 cm. Mosquito seines (TS=3.1) target specimen and species with lengths (LT) of

J.F. Craig (ed). Freshwater Fisheries Ecology – Wiley Blackwell
15
between 4 and 16 cm, dominated by Pellonula leonensis that forms 86% of the catch. Species of median length (40–150 cm LT) targeted by bamboo traps (TS=3.5) are dominated by the catfish Chrysichthys auratus (81%) and Chrysichthys nigrodigitatus, while species targeted by palm traps (TS=2.9) are dominated by C. auratus (23%), C. nigrodigitatus (57%) and Synodontis schall (11%). The length (LT) distribution in daily catches of 10 fishers is shown in Fig. 5.5.6: 90% of the specimen caught was < 35 cm and 10% were <15 cm. This corresponds to c. 40 to 50% of the maximum length (LT) of most of the targeted species.
FIG. 5.5.7. Proportional length (LT) frequency distribution of five cichlid species (black = Sarotherodon galilaeus Lmax, T = 41 cm; Lightgrey = Oreochromis niloticus Lmax, T = 74 cm, Tilapia zillii , Lmx, T = 49 cm, hatched = Hemichromis fasciatus, Lmax, T = 25cm, darkgrey = Chromidotilapia guentheri, Lmax, T = 16cm) in the catch of an acadja (number set =266, n = 5127) in the Dzemeni area Lake Volta (Dzemeni area), with data collected daily for 1 year in 2007 to 2008. From van Zwieten et al. (2011).
Fish species tend to reduce in size under heavy fishing pressure on large specimens. Acadjas and atidzas targeting large cichlids in Lake Volta are relatively unselective with regard to size, as fishes are first attracted into the brush park and then caught by chasing the fishes into a net surrounding the brush park (Fig. 5.5.7) where size of capture is limited by the minimum mesh size used in the surrounding net. In a 2007 to 2008 study (van Zwieten et al., 2011) the average size (LT) of five different cichlid species caught was between 7cm (Chromidotilapia guntheri) and 28 cm (Oreochromis niloticus), or between 37 – 60% of their maximum size. For all species, however, a high proportion of the catch was large specimens, and the catch distribution is likely to reflect the size distribution in the riparian environment. These results indicate that the overall expected reduction in size resulting from the heavy fishing pressure in Lake Volta is limited. Under conditions of high competition, fishers with different fishing gears are behaving like niche separating predators, each with their own speciality to capture preferential prey. The result of such niche partitioning, resulting from strong competition, is an overall homogenous fishing pressure on virtually all sizes and trophic levels available over different seasons.

J.F. Craig (ed). Freshwater Fisheries Ecology – Wiley Blackwell
16
THEORETICAL EVIDENCE FROM SIZE-BASED MODELS
The life-history of most teleosts is quite different from most other vertebrates. The majority of all fish species are carnivorous and have very high fecundities and minuscule progenies. In short, they breed like plants but feed like lions. Consequently, aquatic communities are different from terrestrial in that nearly all animals, even the largest predators, start their life as small prey. Aquatic primary consumers (grazers) are usually very small organisms that can effectively utilize the microscopic size of phytoplankton (the main primary producers). This means that fish during ontogeny often traverse across several trophic levels. In fact, size is a better predictor of trophic level than species (Jennings et al., 2001). The whole demographic structure and food chain is therefore strongly dominated by size where the larger organisms eat the smaller ones. As most fishes are born as tiny fry, and it usually takes time to grow large, then even the juveniles of large predators have to run through this gauntlet of being preyed upon before they turn the table. Consequently, most fish species with little parental care produce very high numbers of eggs and there is a strong linear correlation between the average size of the eggs, and the number of fry per batch.
The food assimilation efficiency or the consumption to production ratio in fishes is usually c. 20 to 25%. In other words, it takes on average 4 to 5 kg of prey to produce 1 kg of a predator. Thus there is a steady exponential loss of mass as one moves along the size range from small to large organisms and on a logarithmic transformed biomass (or number) scale, this produces a typical triangular shape, the so-called biomass-size distribution (Fig. 5.5.3 & 5.5.8). Most aquatic systems are therefore strongly size-structured with uniform slopes of the logarithmic biomass-size spectrum (Sheldon et al.. 1972; Kerr & Dickie, 2001) and the demographic composition of most fish stocks follows the same pattern. It is this flow of biomass from small to large organisms that ultimately determines the community size structure and the levels of exploitation marine ecosystems can sustain (Law et al., 2012).
FIG. 5.5.8. Diagram of a dynamic size spectrum model for abundance U(w) as a function of body mass w, over the course of time t in a fish population feeding on itself and on plankton. The first-order flux terms are shown, including growth from eating prey where G(w) is the growth rate at mass w from eating plankton and fishes, and death where M(w) is the death rate at mass w from being eaten and from other causes. A proportion 1-E(w) of incoming resource is diverted to reproduction at mass w and the remaining proportion goes to continuing growth; E(w) goes from 1 when fishes are small to 0 when fishes reach their maximum size.
Sizew
AbundanceU(w)
Static producer spectrum
Dynamic spectrum
Abundance of larvae
Reproduction:
Larvae size
Maturation size
( ) MUGUw
Et
U −∂∂−=
∂∂
( )( ) ( ) ( )∫ − dwwUwGwE1
Growth
Predation
Food

J.F. Craig (ed). Freshwater Fisheries Ecology – Wiley Blackwell
17
While traditional single species fish models, such as yield-per-recruit models (Beverton & Holt, 1957), try to capture such size distributions, by external negative exponential death functions and external growth functions such as a von Bertalanffy equation, size-spectra models (Fig. 5.5.8) internally keep account of the mechanics of mass flow through ecosystems down to the level of organisms as they eat each other and grow. By simply defining the ratio between predator and prey size (usually 1% of their own mass), they allow fish to grow from egg to adulthood, changing their preferred prey from microorganisms to increasingly large organisms as they grow. Dynamic size spectra therefore have the property of internalizing growth, reproduction and mortality within the dynamical system by accounting for the feedback between growth and the availability of food, the feedback between assimilated food and reproduction, and the feedback between mortality and predation (Fig. 5.5.8; Law et al., 2012, 2013). In short, size-spectrum models depend on and account for available food, while in yield-per-recruit models the food is invisible, external and free. When food is explicitly accounted for in the model, the concept of growth overfishing disappears. Biomass and abundance will typically decline with size in accordance with trophic pyramids (Fig. 5.5.1 & 5.5.8). If forage, or juvenile, fishes have the same per unit mass value as predators, or adults, then there are no longer any energetic gains by cultivating adult lions. The majority of the biomass in the lower trophic levels consists of smaller organisms (Fig. 5.5.3), and waiting for this biomass to be converted to larger individuals will only make most of it disappear in metabolism.
There is therefore sharp contrast between the results of the traditional yield-per-recruit models and the more recent size-structured models. While the former, due to a disconnection between growth and (underestimated) mortality, advocates delayed fishing mortality by regulating the entrance into the fishery, the latter conform with the general notion that the highest productivities are in the lower trophic levels or in the younger individuals of a population, and that a delayed fishing mortality, by size-at-entry regulations, therefore will not produce the highest yields.
Law et al. (2012) used a size-based model to investigate the success of different fishing patterns, based on three criteria: (1) the size of the sustainable yield (Y), taking ‘sustainable’ to mean that yields are evaluated at steady state; (2) the effect of exploitation on the resilience (R) of the system to disturbances such as truncating demographic effect from fishing; (3) the disruption (D) to the natural size structure of the system caused by exploitation, measured as the deviation of the exploited from the unexploited system when steady state was achieved. The three evaluation criteria (Y, R, D) were tested against four different exploitation patterns (Fig. 5.5.9): (1) a conventional size-at-entry fishery with a minimum size limit, (2) an opposite pattern with an upper size limit, (3) a slot-size fishery with a lower and an upper boundary, such as is used for instance in the Lake Victoria Nile perch Lates niloticus fishery (Kolding et al., 2008) and (4) a ‘balanced harvest’ pattern where fishing mortality is scaled by the productivity of the relative sizes (Caddy & Sharp, 1986; Garcia et al., 2012).
The results show that harvesting smaller fishes (with highest productivity) produced a higher overall sustainable yield than targeting larger fishes (with lower productivity) (Fig. 5.5.10). The protection of the spawning biomass from higher fishing pressure on smaller fishes contributed to this. The greatest resilience and the least disturbance to the original size distribution were obtained by adopting a balanced harvest pattern (Fig. 5.5.9). The results also showed that the conventional size-at-entry fishing pattern, with entry set close to size at first maturity as usually practised, is potentially destabilizing and increases the risk of stock

J.F. Craig (ed). Freshwater Fisheries Ecology – Wiley Blackwell
18
collapse. In contrast, when fishing is proportional to productivity (roughly inversely correlated with size) as in balanced harvest, then resilience continues to increase until very high values of fishing mortality.
FIG. 5.5.9. (a), (c), (e), (g) Four different fishing patterns, fishing mortality (F) as a function of mass: (a) conventional size-at-entry with minimum size limit, (c) maximum size limit, (e) slot-size entry and (g) balanced harvest with F proportional to growth with two start levels. (b), (d), (f), (h) corresponding steady state mass spectra, continuous line as compared with the unexploited size spectrum (-------). Modified from Law et al. (2012).
Law et al. (2012) concluded that balanced harvest, being a compromise between harvesting small or large sizes, had some clear advantages over more selective fishing patterns. Fishing proportionally to productivity across the entire size-spectrum, resulting in predation mortality being largely replaced by fishing mortality (Law et al., 2013), makes the fishing pattern directly equivalent to the capacity for sustaining exploitation, as evidenced by
J.F. Craig (ed). Freshwater Fisheries Ecology – Wiley Blackwell
19
the largest yields combined with the highest resilience and least distortion to the community structure.
FIG. 5.5.10. Yield as a function of (a) biomass and (b) fishing mortality (F). -----, results from conventional size-at-entry, with decreasing entry size from 160 (lowest curve), down to 60, 22 and 8 g; solid line, result from ‘balanced harvest’, starting with fishing mortality F1, which then decreases according to productivity [Fig. 5.5.9(g)]. This is the reason for the initial lower yield from balanced harvest as a function of F (b).
THE OPTIMAL FISHING PATTERN: CAN FISHERY OBJECTIVES AND CONSERVATION OBJECTIVES BE COMBINED?
From a management perspective, the contradiction and inconsistency between the
functional structure of aquatic communities (where large predominantly eats small) and the traditional fisheries aim (target only the large), poses a conflicting theoretical and practical conundrum (Garcia et al., 2012; Law et al., 2012, 2013). There is also increasing empirical evidence that the systematic removal of large mature adults will select for and cause evolution of sexual maturity at smaller body size and decreased growth rates (so-called fishery induced evolution). We also know that the largest fish mothers produce the most eggs and are having the best quality of eggs ensuring the highest fry survival.
Theoretically, looking at Fig. 5.5.1, a balanced harvesting strategy that distributes fishing pressure across the widest possible range of trophic levels, sizes and species of an ecosystem, in proportion to their natural productivity (Garcia et al., 2012) will produce (1) the highest biological yield and (2) the least structural effect (the proportional abundance of all components are the same, but everything is less). Such a strategy, where the cumulative fishing pattern over all species and sizes is considered instead of individual species, and where small fishes and species receive a higher fishing pressure than the large few adults, is in stark contrast to conventional management thinking with focus on minimum mesh sizes and protection of young fishes. Such a fishing pattern can be achieved in practice, as observed in the various case studies, when the market has no strong size preferences and fishers are continuously adapting their fishing methods to obtain the highest individual return (CPUE), but where the technological development is still so low that the overall fishing mortality remains moderate. It requires a high diversification of fishing gears and the ability of the fishers to quickly adapt to changing environmental conditions and fluctuating seasons and stocks.
J.F. Craig (ed). Freshwater Fisheries Ecology – Wiley Blackwell
20
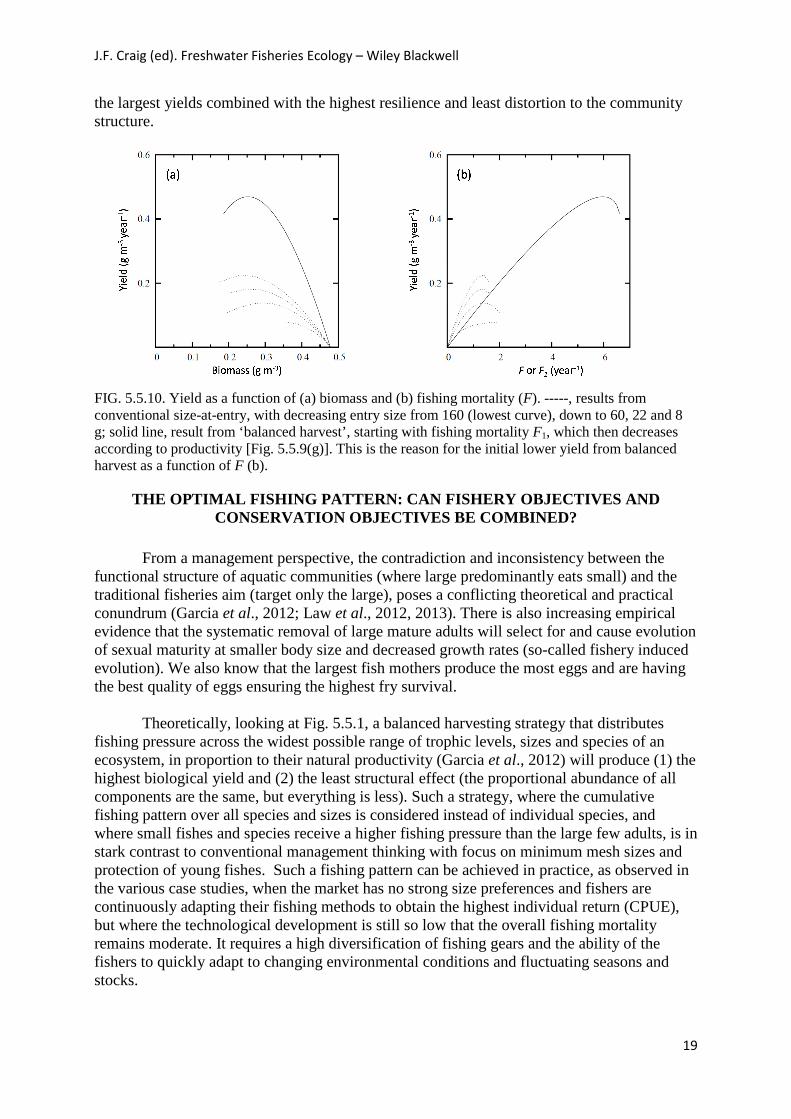
FIG. 5.5.11. Results of intensive fishing under different exploitation patterns. Solid lines, the resulting community structure under exploitation; -------, the unexploited original structure. (a) An increase in the slope and the intercept under conventional size selective management as has been observed in the North Sea (Rice & Gislason, 1996). (b) Parallel slopes obtained with an increased use of smaller (often illegal) mesh sizes as has been observed in Lake Kariba (Kolding et al., 2003b). Modified from Garcia et al. (2012).
Different fishing patterns will result in different changes in the community structure (Fig. 5.5.9). There is increasing evidence that the conventional and deeply ingrained concept of selective fishing, such as illustrated in the North Sea scenario (Fig. 5.5.11), is not the best for either fisheries or conservation purposes. On the other hand, limited evidence from unregulated African fisheries, such as Bangweulu swamps, Lake Kariba (Kolding et al., 2003a,b), Lake Volta (van Zwieten et al., 2011) and Lake Mweru (van Zwieten et al., 2003) strongly suggest that a more balanced fishing pattern has the least adverse side effects, while sustaining high yields under relatively high fishing pressure. The ultimate ‘optimal’ fishing pattern as suggested by Caddy & Sharp (1986) and supported by Garcia et al. (2012) has not been fully tried or observed empirically, but recent simulations with different ecosystem, or size-based models (Garcia et al.,. 2012; Law et al., 2012, 2013) all support the idea that a balanced harvest in proportion to individual productivity will yield the largest sustainable catches with the smallest demographic or structural changes to the fish community or the ecosystem. At the moment we know of no better alternative that combines both fisheries and conservation objectives to the benefit of man and Nature. Acknowledgements RL and MJP were supported by RSNZ Marsden grant number 08-UOC-034. JK and PvZ are grateful to all the indomitable African fishers who over the past 20 years made them realise that their taught theoretical education was incorrect. References Anderson, C.N.K., Hsieh, C-h., Sandin, S.A., Hewitt, R., Hollowed, A., Beddington, J., May, R.M., & Sugihara, G. (2008). Why fishing magnifies fluctuations in fish abundance. Nature 452, 835–839. Beverton, R.J.H. & Holt, S. J. (1957). On the dynamics of exploited fish populations. Fisheries Investigations Series 2, Sea Fisheries. 19, 1-533. Bianchi, G. (2008). The concept of the ecosystem approaches to fisheries. In: The Ecosystem Approach to Fisheries (eds. G. Bianchi. & H.R. Skjoldal). pp. 20-38. CAB International. Wallingford, UK. ISBN: 978-1-84593-414-9.

J.F. Craig (ed). Freshwater Fisheries Ecology – Wiley Blackwell
21
Brelsford, W.V. (1946). Fishermen of the Bangweulu swamps - A study of the fishing activities of the Unga tribe. The Rhodes-Livingstone Papers No. 12. Manchester University Press, 169 pp. Bundy, A., Fanning, P. & Zwanenburg, K.C.T. (2005). Balancing exploitation and conservation of the eastern Scotian Shelf ecosystem: application of a 4D Ecosystem exploitation index. ICES Journal of Marine Science 65, 503-510. Caddy, J.F. & Sharp, G.D. (1986). An ecological framework for marine fishery investigations. FAO Fish. Tech. Pap. 283, FAO, Rome. 152 pp. Chanda, B. (1998). Effects of weir fishing on commercial fish stocks of the Bangweulu swamp fisheries, Luapula Province, Northern Zambia, MPhil. thesis, Dept. of Fisheries and Marine Biology, University of Bergen. Conover, D. & Munch, S. (2002). Sustaining fisheries yields over evolutionary time scales. Science 297, 94–96. Daan, N., Gislason, H., Pope, J. G., & Rice, J. C. (2005). Changes in the North Sea fish community: evidence of indirect effects of fishing? ICES Journal of Marine Science 62, 177-188. Dankwa, H.R., Abban, E.K. & Teugels, G.G. (1999). Freshwater fishes of Ghana: identification, distribution, ecological and economic importance. Annales Sciences Zoologiques 283, 53 pp. Musée Royale de l’Afrique Centrale, Tervuren, Belgium. FAO (2003). The ecosystem approach to fisheries. FAO Technical Guidelines for Responsible Fisheries. No. 4, Suppl. 2. Rome. 112 p. FAO (2011). Report of the technical consultation to develop internattional guidelines on bycatch management and reduction of discards. Rome, 6-10 December 2010. FAO Fisheries and Aquaculture Report No. 957, FAO, Rome. Fenberg, P. & Roy, K. (2008). Ecological and evolutionary consequences of size-selective harvesting: how much do we know? Molecular Ecology 17, 209–220. Frid, C., Paramor, O. & Scott, C. (2006). Ecosystem-based management of fisheries: is science limiting? ICES Journal of Marine Science 63, 1567-157. Fulton, T.W. (1890). The capture and destruction of immature fish. 9th Annual Report Fishery Board Scotland, 201-211. Garcia, S.M. (Ed.), Kolding, J., Rice, J., Rochet, M.-J., Zhou, S., Arimoto, T., Beyer, J., Borges, L., Bundy, A., Dunn, D., Graham, N., Hall, M., Heino, M., Law, R., Makino, M., Rijnsdorp, A.D., Simard, F., Smith, A.D.M. & Symons, D. (2011). Selective Fishing and Balanced Harvest in Relation to Fisheries and Ecosystem Sustainability. Report of a scientific workshop organized by the IUCN-CEM Fisheries Expert Group (FEG) and the European Bureau for Conservation and Development (EBCD) in Nagoya (Japan), 14–16 October 2010. Gland, Switzerland and Brussels, Belgium: IUCN and EBCD. iv + 33pp Garcia, S., Kolding, J., Rice, J., Rochet, M.-J., Zhou, S., Arimoto, T., Beyer, J. E., Borges, L., Bundy, A., Dunn, D., Fulton, E. A., Hall, M., Heino, M., Law, R., Makino, M., Rijnsdorp, A., Simard, F., & Smith, A. (2012). Reconsidering the consequences of selective fisheries. Science 335, 1045-1047. Holt, E.W.L. (1895). An examination of the present state of the Grimsby trawl fishery, with especial reference to the destruction of immature fish. Journal of the Marine Biological Association of the United Kingdom. New Series 3(5), 337–446.

J.F. Craig (ed). Freshwater Fisheries Ecology – Wiley Blackwell
22
Hsieh, C-h., Yamauchi, A., Nakazawa, T., & Wang, W.-F. (2010). Fishing effects on age and spatial structures undermine population stability of fishes. Aquatic Sciences 72(2), 165–178. Huchzermeyer C.F. 2013. Fish and fisheries of Bangweulu wetlands, Zambia. [MSc thesis]. Rhodes University, Grahamstown, South Africa. 171 p. Jennings, S., Pinnegar, J. K., Polunin, N. V. C., & Boon, T. W. (2001). Weak cross-species relationships between body size and trophic level belie powerful size-based trophic structuring in fish communities. Journal of Animal Ecology 70:934-944. Jul-Larsen, E., Kolding, J., Nielsen, J.R., Overå, R. & van Zwieten, P.A.M. (2003). Management, co-management or no management? Major dilemmas in southern African freshwater fisheries. Part 1: Synthesis Report. FAO Fisheries Technical Paper 426/1. FAO, Rome. 137 pp. ISBN 925104919X Jørgensen, C., K. Enberg, E. S. Dunlop, R. Arlinghaus, D. S. Boukal, K. Brander, B. Ernande, A. G. Gårdmark, F. Johnston, S. Matsumura, H. Pardoe, K. Raab, A. Silva, A. Vainikka, U. Dieckmann, M. Heino, & A. D. Rijnsdorp. (2007). Ecology: Managing Evolving Fish Stocks. Science 318:1247-1248. Kelleher, K. (2005). Discarding in the World’s Marine Fisheries: An Update. Food and Agriculture Organization of the United Nations. FAO Fisheries Technical Paper No. 470. FAO, Rome. Kenmuir,D.H.S. (1973). The ecology of the tigerfish, Hydrocynus vittatus Castelnau, in Lake Kariba. Occasional Papers of the National Museums and Monuments of Rhodesia. B5(3): 115-170 Kerr, S.R. & Dickie, L.M. (2001). The Biomass Spectrum - A Predator-Prey Theory of Aquatic Production. Complexity in Ecological Systems Series. Columbia University Press, New York. 320 pp. Kolding, J. (1993). Trophic interrelationships and community structure at two different periods of Lake Turkana, Kenya - a comparison using the ECOPATH II box model. In: Trophic models of aquatic ecosystems (eds. V. Christensen & D. Pauly). pp. 116-123. ICLARM Conference Proceedings No. 26. Manila, Phillipines. Kolding, J. & van Zwieten, P.A.M. (2006). Improving productivity in tropical lakes and reservoirs. Challenge Program on Water and Food - Aquatic Ecosystems and Fisheries Review Series 1. Theme 3 of CPWF, C/o WorldFish Center, Cairo, Egypt. 139 pp. ISBN: 977-17-3087-8 Kolding, J. & van Zwieten, P.A.M. (2011). The tragedy of our legacy: how do global management discourses affect small-scale fisheries in the South? Forum for Development Studies 38(3), 267-297. Kolding, J. & van Zwieten, P.A.M. (2012). Relative lake level fluctuations and their influence on productivity and resilience in tropical lakes and reservoirs. Fisheries Research 115-116, 99-109. doi:10.1016/j.fishres.2011.11.008 Kolding, J., Ticheler, H. & Chanda, B. (2003a). The Bangweulu Swamps – a balanced small-scale multi-species fishery. In: Management, co-management or no management? Major dilemmas in southern African freshwater fisheries, Part 2: Case studies (eds. E. Jul-Larsen, J. Kolding, J.R. Nielsen, R. Overa, & P.A.M van Zwieten). pp. 34-66 . FAO Fisheries Technical Paper 426/2. FAO, Rome. Kolding, J., Musando, B & Songore, N. (2003b). Inshore fisheries and fish population changes in Lake Kariba. In: Management, Co-management or No management? Major Dilemmas in Southern African Freshwater Fisheries, Part 2: Case studies (eds. E. Jul-Larsen, J. Kolding, J.R. Nielsen, R. Overa, & P.A.M van Zwieten), pp. 67-99. FAO Fisheries Technical Paper 426/2. FAO, Rome.

J.F. Craig (ed). Freshwater Fisheries Ecology – Wiley Blackwell
23
Kolding , J., van Zwieten, P., Mkumbo, O. , Silsbe, G. & Hecky, R. (2008). Are the Lake Victoria fisheries threatened by exploitation or eutrophication? Towards an ecosystem based approach to management. In The Ecosystem Approach to Fisheries (eds. G. Bianchi & H.R. Skjoldal). pp. 309-354. CAB International. ISBN: 978-1-84593-414-9. Law, R. (2000) Fishing, selection, and phenotypic evolution. ICES Journal of Marine Sciences 57, 659–668. Law, R., Plank, M.J. & Kolding, J. (2012). On balanced exploitation of marine ecosystems: results from dynamic size spectra. ICES Journal of Marine Sciences 69, 602-614. doi: 10.1093/icesjms/fss031. Law, R., Kolding, J. & Plank, M.J. (2013). Squaring the circle: Reconciling fishing and conservation of aquatic ecosystems. Fish and Fisheries, online 7 September. Doi: 10.1111/faf.12056 Lewison, R.L., Crowder, L.B., Read, A.J. & Freeman, S.A. (2004). Understanding impacts of fisheries bycatch on marine megafauna. Trends in Ecology & Evolution 19, 598-604. Malasha, I. (2003). Colonial and post colonial fisheries regulations: the cases of Zambia and Zimbabwe. In: Management, Co-management or No management? Major Dilemmas in Southern African Freshwater Fisheries, Part 2: Case studies (eds. E. Jul-Larsen, J. Kolding, J.R. Nielsen, R. Overa, & P.A.M van Zwieten), pp. 253-266. FAO Fisheries Technical Paper 426/2. FAO, Rome. Marten, G.C. & Polovina, J.J. (1982). A comparative study of fish yields from various tropical ecosystems. ICLARM conference proceeding 9, 255-285. Misund, O.A., Kolding, J. & Fréon, P. (2002). Fish capture devices in industrial and artisanal fisheries and their influence on management. In: Handbook of Fish Biology and Fisheries, vol. II (eds. P.J.B. Hart and J.D. Reynolds). pp. 13-36. Blackwell Science, London. Petersen, C,G.J. (1894). On the biology of our flatfishes and on the decrease of our flatfish fisheries. Report of the Danish Biological Station 4, 147 pp. Copenhagen. Pauly, D., Christensen, V., Dalsgaard, J., Froese, R., & Torres, F. J. (1998). Fishing down marine food webs. Science 279, 860-863. Pikitch, E.K., C. Santora, E.A. Babcock, A. Bakun, R. Bonfil, D.O. Conover, P. Dayton, P. Doukakis, D. Fluharty, B. Heneman, H.D. Houde, J. Link, P.A. Livingston, M. Mangel, M.K. McAllister, J. Pope & K.J. Sainsbury. (2004). Ecosystem-Based Fishery Management. Science 305, 346-347. Pope, J.G. (1991). The ICES Multispecies Assessment Working Group: evolution, insights and future problems. ICES Marine Science Symposium 193, 22-33 Rice, J. & Gislason, H. (1996). Patterns of change in size spectra of numbers and diversity of the North Sea fish assemblages, as reflected in surveys and models. ICES Journal of Marine Science 53, 1214-1225. Rochet, M., Collie, J., Jennings, S., & Hall, S. (2011). Does selective fishing conserve community biodiversity? Predictions from a length-based multispecies model. Canadian Journal of Fisheries and Aquatic Sciences 68, 469-486. Sheldon, R.W., Prakash, A., & Sutcliffe Jr., W.H. (1972). The size distribution of particles in the ocean. Limnology and Oceanography 17, 327–340.

J.F. Craig (ed). Freshwater Fisheries Ecology – Wiley Blackwell
24
Soulsby, J.J. (1963). Fishing Survey at the Lake Kariba Fishery. Rhodesian Agricultural Journal 60, 135-138. Worm, B., Hilborn, R., Baum, J.K., Branch, T.A., Collie, J.S., Costello, C., Fogarty, M.J., Fulton, E.A., Hutchings, J.A., Jennings, S., Jensen, O.P., Lotze, H.K., Mace, P.M., McClanahan, T.R., Minto, S., Palumbi, S.R., Parma, A.M., Ricard, D., Rosenberg, A.A., Watson, R. & Zeller, D (2009). Rebuilding global fisheries. Science 325, 578 –585. DOI: 10.1126/science.1173146. Zhou, S., Smith, A. D. M. , Punt, A. E., Richardson, A. J., Gibbs, M., Fulton, E. A., Pascoe, S., Bulman, C., Bayliss, P. & Sainsbury, K. (2010). Ecosystem-based fisheries management requires a change to the selective fishing philosophy. Proceedings of the National Academy of Sciences 107, 9485-9489. Zwieten P.A.M. van, Goudswaard, P.C. & Kapasa, C.K. (2003). Mweru-Luapula is an open exit fishery where a highly dynamic population of fishers makes use of a resilient resource base. In: Management, co-management or no-management? Major dilemmas in southern African freshwater fisheries (eds. E. Jul-Larsen, J. Kolding, R. Overå, J. Raakjær Nielsen & P.A.M. van Zwieten). pp. 1-33. FAO Fisheries Technical Paper 426/2. Rome, FAO. Zwieten, P.A.M.van; Béné, C.; Kolding, J.; Brummett, R.; Valbo - Jorgensen, J. (Eds). (2011) Review of tropical reservoirs and their fisheries: the cases of Lake Nasser, Lake Volta and Indo-Gangetic Basin reservoirs. FAO Fisheries and Aquaculture Technical Paper. No. 557. Rome, FAO. 152 p. Electronic References CBD (1998). Report of the Workshop on the Ecosystem Approach. Lilongwe, Malawi, 26 - 28 January 1998. UNEP/CBD/COP/4/Inf.9. Available at: http://www.cbd.int/doc/meetings/cop/cop-04/information/cop-04-inf-09-en.pdf Gilman, E., Passfield, K. & Nakamura, K. (2012). Performance Assessment of Bycatch and Discards Governance by Regional Fisheries Management Organizations. IUCN, Gland, Switzerland, ix + 484 pp. Available at: http://www.iucn.org/knowledge/publications_doc/publications/?uPubsID=4674 Hillis, J. P & Arnason, R. (1995). Why fisheries cannot be managed by technical measures alone: a comparison of selected fisheries inside and outside the European Union. ICES CM 1995: S/9.Available from http://info.ices.dk/products/CMdocs/94-99/yel95.asp Kolding, J, Ticheler, H,. & Chanda, B. (1996). Assessment of the Bangweulu Swamps fisheries. Final Report prepared for WWF Bangweulu Wetlands Project, SNV/Netherlands Development Organisation, and Department of Fisheries, Zambia. 51 p + annexes. Available at: https://www.academia.edu/676518/Assessment_of_the_Bangweulu_swamps_fisheries_final_report Pikitch, E., Boersma, P.D., Boyd, I.L., Conover, D.O., Cury, P., Essington, T., Heppell, S.S., Houde, E.D., Mangel, M., Pauly, D., Plagányi, É., Sainsbury, K., & Steneck, R.S. (2012). Little Fish, Big Impact: Managing a Crucial Link in Ocean Food Webs. Lenfest Ocean Program. Washington, DC. 108 pp. Available at: http://www.lenfestocean.org/foragefishreport WSSD (2002). World Summit of Sustainable Development, Plan of Implementation, § 31 a, Johannesburg 2002. Available at: www.un.org/esa/sustdev/documents/WSSD_POI_PD/English/WSSD_PlanImpl.pdf
Copyright © 2022 FDOKUMEN