The Role of Photon Scattering in Optical Signal Distortion during Arrhythmia and Defibrillation
13
The Role of Photon Scattering in Optical Signal Distortion during Arrhythmia and Defibrillation Martin J. Bishop,* Blanca Rodriguez,* Fujian Qu, y Igor R. Efimov, y David J. Gavaghan,* and Natalia A. Trayanova z *Oxford University Computing Laboratory, Oxford OX1 3QD, United Kingdom; y Department of Biomedical Engineering, Washington University, St. Louis, Missouri; and z Department of Biomedical Engineering, The Johns Hopkins University, Baltimore, Maryland ABSTRACT Optical mapping of arrhythmias and defibrillation provides important insights; however, a limitation of the technique is signal distortion due to photon scattering. The goal of this experimental/simulation study is to investigate the role of three- dimensional photon scattering in optical signal distortion during ventricular tachycardia (VT) and defibrillation. A three-dimensional realistic bidomain rabbit ventricular model was combined with a model of photon transport. Shocks were applied via external electrodes to induce sustained VT, and transmembrane potentials (V m ) were compared with synthesized optical signals (V opt ). Fluorescent recordings were conducted in isolated rabbit hearts to validate simulation results. Results demonstrate that shock- induced membrane polarization magnitude is smaller in V opt and in experimental signals as compared to V m . This is due to transduction of potentials from weakly polarized midmyocardium to the epicardium. During shock-induced reentry and in sustained VT, photon scattering, combined with complex wavefront dynamics, results in optical action potentials near a filament exhibiting i), elevated resting potential, ii), reduced amplitude relative to pacing, and iii), dual-humped morphologies. A shift of up to 4 mm in the phase singularity location was observed in V opt maps when compared to V m . This combined experimental/simulation study provides an interpretation of optical recordings during VT and defibrillation. INTRODUCTION Optical mapping is a powerful tool capable of providing high-resolution recordings of wavefront dynamics during arrhythmia and defibrillation. The technique has, however, an important limitation: signal distortion due to scattering of fluorescent photons from a three-dimensional (3D) volume of tissue beneath the recording site (1–5). It is thus unclear which characteristics of the recorded signal are due to un- derlying electrophysiological properties of the tissue and which are scattering artifact, leading to difficulties in experi- mental data interpretation. A consequence of fluorescent scattering is that informa- tion regarding transmembrane potentials within the mid- myocardium is transduced through the ventricular wall by scattered photons and is manifested in the optical signal. The scattering volume associated with a particular epicardial optical recording site represents the 3D region of tissue be- neath the site from which the majority of detected fluorescent photons originate. Ding et al. (2) used Monte Carlo simula- tions of photon movement during optical mapping to show that 90% of photons recorded by a particular epicardial re- cording site originate from a tissue volume, approximately hemispherical in shape, which extends ;1–2 mm both radi- ally and from depth, with the specific dimensions depending sensitively upon the particular dye and wavelength used. Simulation studies using simplified geometries (1,3,4,6), and more recently a realistic ventricular model (5), have been conducted to provide insight into the distortion effects of this averaging of transmembrane potential levels from within the scattering volume upon the optical signals during pacing. These studies have explained characteristics of the paced optical signals that render them different from microelectrode recordings, such as prolonged action potential (AP) upstroke, and increased wavefront width (1,7). However, 3D photon- scattering distortions in fluorescent signals during events of complex spatiotemporal dynamics, such as arrhythmogene- sis, have not yet been fully assessed (3). Photon-scattering distortions in optical recordings have been suggested to underlie unusual characteristics of fluo- rescent signals, which, during arrhythmias, are at odds with microelectrode recordings, and in the case of defibrillation when electrical recordings during and shortly after the shock are not possible, at odds with realistic computer simulations. For instance, during sustained ventricular tachycardia (VT), photon scattering from the passage of a subsurface wavefront has been suggested to underlie the formation of dual-hump APs (3,8,9), which have never been documented in micro- electrode recordings. Furthermore, the source of resting po- tential elevation and AP amplitude reduction observed in optical signals near the reentrant core remains a puzzle. Such phenomena cannot be explained by ion accumulation close to the core, as accumulations build up over a number of reentrant cycles (10). Finally, there exists a disparity in the magnitude of the optically recorded and simulated virtual electrode polariza- tion (VEP) induced by a defibrillation-strength shock (11). doi: 10.1529/biophysj.107.110981 Submitted April 23, 2007, and accepted for publication July 12, 2007. Address reprint requests to Martin J. Bishop, Oxford University Computing Laboratory, Oxford OX1 3QD, UK. Tel.: 44-1865-283568; E-mail: martin. [email protected]. Editor: David W. Piston. Ó 2007 by the Biophysical Society 0006-3495/07/11/3714/13 $2.00 3714 Biophysical Journal Volume 93 November 2007 3714–3726
-
Upload
independent -
Category
Documents
-
view
0 -
download
0
Transcript of The Role of Photon Scattering in Optical Signal Distortion during Arrhythmia and Defibrillation

The Role of Photon Scattering in Optical Signal Distortion duringArrhythmia and Defibrillation
Martin J. Bishop,* Blanca Rodriguez,* Fujian Qu,y Igor R. Efimov,y David J. Gavaghan,*and Natalia A. Trayanovaz
*Oxford University Computing Laboratory, Oxford OX1 3QD, United Kingdom; yDepartment of Biomedical Engineering, WashingtonUniversity, St. Louis, Missouri; and zDepartment of Biomedical Engineering, The Johns Hopkins University, Baltimore, Maryland
ABSTRACT Optical mapping of arrhythmias and defibrillation provides important insights; however, a limitation of the techniqueis signal distortion due to photon scattering. The goal of this experimental/simulation study is to investigate the role of three-dimensional photon scattering in optical signal distortion during ventricular tachycardia (VT) and defibrillation. A three-dimensionalrealistic bidomain rabbit ventricular model was combined with a model of photon transport. Shocks were applied via externalelectrodes to induce sustained VT, and transmembrane potentials (Vm) were compared with synthesized optical signals (Vopt).Fluorescent recordings were conducted in isolated rabbit hearts to validate simulation results. Results demonstrate that shock-induced membrane polarization magnitude is smaller in Vopt and in experimental signals as compared to Vm. This is due totransduction of potentials from weakly polarized midmyocardium to the epicardium. During shock-induced reentry and in sustainedVT, photon scattering, combined with complex wavefront dynamics, results in optical action potentials near a filament exhibiting i),elevated resting potential, ii), reduced amplitude relative to pacing, and iii), dual-humped morphologies. A shift of up to 4 mm in thephase singularity location was observed in Vopt maps when compared to Vm. This combined experimental/simulation studyprovides an interpretation of optical recordings during VT and defibrillation.
INTRODUCTION
Optical mapping is a powerful tool capable of providing
high-resolution recordings of wavefront dynamics during
arrhythmia and defibrillation. The technique has, however,
an important limitation: signal distortion due to scattering of
fluorescent photons from a three-dimensional (3D) volume
of tissue beneath the recording site (1–5). It is thus unclear
which characteristics of the recorded signal are due to un-
derlying electrophysiological properties of the tissue and
which are scattering artifact, leading to difficulties in experi-
mental data interpretation.
A consequence of fluorescent scattering is that informa-
tion regarding transmembrane potentials within the mid-
myocardium is transduced through the ventricular wall by
scattered photons and is manifested in the optical signal. The
scattering volume associated with a particular epicardial
optical recording site represents the 3D region of tissue be-
neath the site from which the majority of detected fluorescent
photons originate. Ding et al. (2) used Monte Carlo simula-
tions of photon movement during optical mapping to show
that 90% of photons recorded by a particular epicardial re-
cording site originate from a tissue volume, approximately
hemispherical in shape, which extends ;1–2 mm both radi-
ally and from depth, with the specific dimensions depending
sensitively upon the particular dye and wavelength used.
Simulation studies using simplified geometries (1,3,4,6),
and more recently a realistic ventricular model (5), have been
conducted to provide insight into the distortion effects of this
averaging of transmembrane potential levels from within the
scattering volume upon the optical signals during pacing.
These studies have explained characteristics of the paced
optical signals that render them different from microelectrode
recordings, such as prolonged action potential (AP) upstroke,
and increased wavefront width (1,7). However, 3D photon-
scattering distortions in fluorescent signals during events of
complex spatiotemporal dynamics, such as arrhythmogene-
sis, have not yet been fully assessed (3).
Photon-scattering distortions in optical recordings have
been suggested to underlie unusual characteristics of fluo-
rescent signals, which, during arrhythmias, are at odds with
microelectrode recordings, and in the case of defibrillation
when electrical recordings during and shortly after the shock
are not possible, at odds with realistic computer simulations.
For instance, during sustained ventricular tachycardia (VT),
photon scattering from the passage of a subsurface wavefront
has been suggested to underlie the formation of dual-hump
APs (3,8,9), which have never been documented in micro-
electrode recordings. Furthermore, the source of resting po-
tential elevation and AP amplitude reduction observed in
optical signals near the reentrant core remains a puzzle. Such
phenomena cannot be explained by ion accumulation close
to the core, as accumulations build up over a number of
reentrant cycles (10).
Finally, there exists a disparity in the magnitude of the
optically recorded and simulated virtual electrode polariza-
tion (VEP) induced by a defibrillation-strength shock (11).
doi: 10.1529/biophysj.107.110981
Submitted April 23, 2007, and accepted for publication July 12, 2007.
Address reprint requests to Martin J. Bishop, Oxford University Computing
Laboratory, Oxford OX1 3QD, UK. Tel.: 44-1865-283568; E-mail: martin.
Editor: David W. Piston.
� 2007 by the Biophysical Society
0006-3495/07/11/3714/13 $2.00
3714 Biophysical Journal Volume 93 November 2007 3714–3726

Nonlinearity in the response of membrane-bound dyes at
high transmembrane potentials has been deemed insufficient
to account for such disparity (12). Instead, the difference has
been attributed to the averaging effects of photon scattering
(6,12). However, controversy remains over the specific depth
from which optical signals arise (12). Detection of VEP within
the depth of the ventricular wall is potentially important for
studies of shock-induced arrhythmogenesis, in which knowl-
edge of the location and extent of regions of intramural
excitable gap is of vital importance to understanding shock
outcome (11).
The goal of this study is to investigate the role of 3D pho-
ton scattering in signal distortion during optical recordings of
arrhythmias and defibrillation. Specifically, we hypothesize
that dual-hump APs, occurring near the reentrant core, can be
directly attributed to 3D photon scattering but occur from a
variety of specific mechanisms in which local ventricular
geometry also plays a role. Further, we surmise that resting
potential elevation/reduced AP amplitude of the optical sig-
nal near the reentrant core stem from photon scattering but
are also consequences of complex wavefront propagation
combined with optical mapping normalization techniques.
Finally, we aim to demonstrate that the disparity between the
magnitude of the optically recorded shock-end VEP and that
predicted by realistic simulations of defibrillation is due to
scattering of photons, which originate from midmyocardial
regions of significantly weaker VEP relative to the epicar-
dium.
To achieve our objectives, a 3D anatomically realistic
bidomain model of the rabbit ventricles, which can represent
at once VEP and origin of arrhythmias after defibrillation
shocks, as well as sustained VT, is combined with a photon
diffusion model accounting for illumination and fluorescent
emission to simulate the synthesis of optical signals recorded
by a panoramic mapping system. By comparing simulated
transmembrane potential maps with simulated fluorescent
maps on the ventricular surfaces, the mechanisms responsi-
ble for optical signal distortion can be effectively elucidated.
To provide input regarding the optical parameters of rabbit
ventricular tissue and to validate the optical simulation re-
sults, optical mapping experiments were conducted in iso-
lated rabbit hearts.
MATERIALS AND METHODS
Experimental preparation
Excised hearts of young New Zealand white rabbits were placed on a
Langendorff apparatus and perfused with oxygenated modified Tyrode’s
solution. Hearts were stained with the voltage-sensitive dye di-4-ANEPPS
(Molecular Probes Eugene, OR). Excitation-contraction uncoupler 2,3-
butanedione monoxime (BDM, Fisher Scientific, Fair Lawn, NJ) reduced
motion artifacts. Hearts were positioned in a perfusion chamber (Fig. 1 A), and
activity on the anterior was recorded optically, as described previously (8,9).
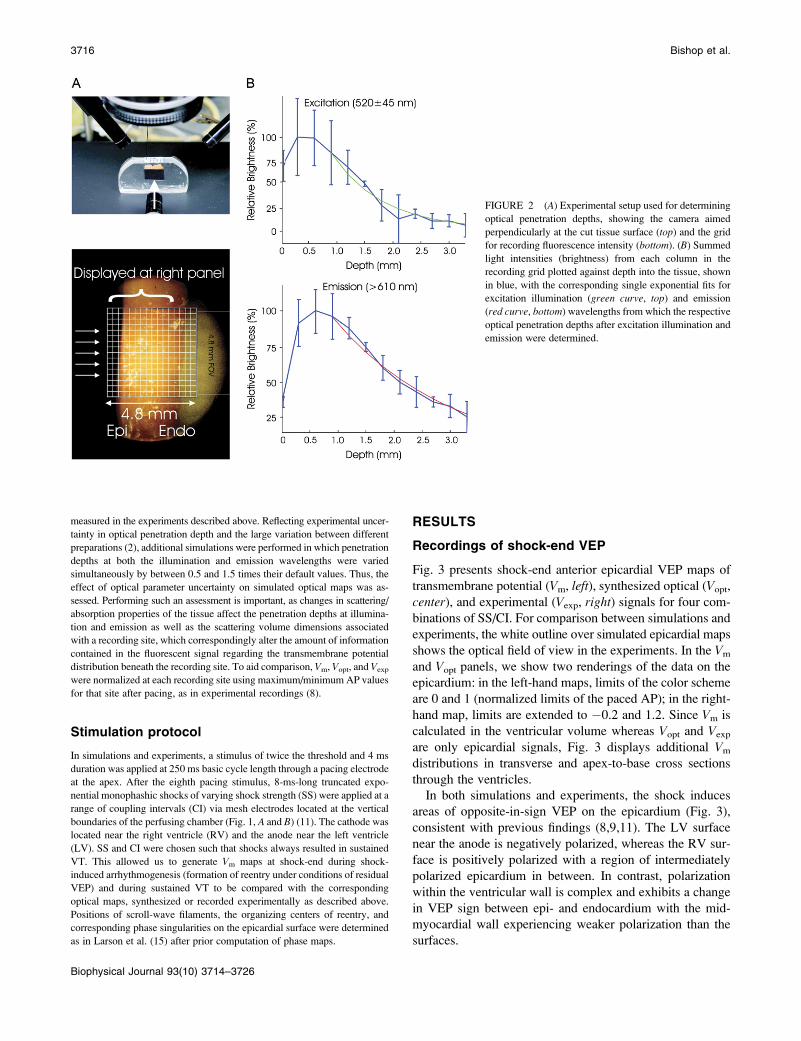
Measurement of light attenuation within ventricular tissue at illumination
(545 6 20 nm) and emission (610 6 20 nm) wavelengths was performed in
a manner similar to Baxter et al. (1). Briefly, a camera, aimed perpendic-
ularly at the cut piece of tissue, shown in Fig. 2 A (top), recorded light at-
tenuation with depth from the irradiated epicardium. Fig. 2 A (bottom) shows
the field of view of the camera with respect to the preparation. Light in-
tensities for each column in the field of view in Fig. 2 A (bottom) were
summed. Single exponential decay functions were fitted to the data, and
decay constants, representing penetration depths at the given wavelength,
were determined as shown in Fig. 2 B for illumination (top) and emission
(bottom). A monoexponential decay function was chosen as it has previously
been shown to accurately model the decay of light intensity with depth in
cardiac tissue (4). Exponential functions were only fitted to data points taken
from depths .1 mm to account for misalignment of the nonplanar epicardial
surface with the recording array. Optical penetration depths of 0.90 mm at
the illumination wavelength and 2.10 mm at the emission wavelength were
found, which agree well with values recorded at similar wavelengths in
previous studies (1,2,4).
Computational model
The anatomically based finite-element model of rabbit ventricles (Fig. 1 B)
described previously (13) was used to simulate both electrical activation and
photon scattering/absorption during illumination and emission. The model
incorporated realistic geometry and fiber orientation and representations of
the perfusing bath and the blood in the ventricular cavities. The distribution
of transmembrane potential (Vm) throughout the ventricles was calculated
using the bidomain equations. Membrane kinetics was represented by an
augmented version of the Luo-Rudy dynamic model (14).
As in our previous publication (5), distribution of photon density after
uniform epicardial illumination (Fillum) was calculated throughout the
ventricles using the steady-state photon diffusion equation and convoluted
with the local value of Vm to represent fluorescent emission intensity. The
photon diffusion equation was again solved to calculate photon density at the
emission wavelength (Fem). Fick’s law was used to relate the gradient of
Fem at the epicardial surface to the photon flux recorded by the detector
(Vopt). Optical signals were thus synthesized solely on the epicardial surface.
Tissue optical properties at illumination and emission wavelengths were
represented by penetration depths of 0.90 mm and 2.10 mm, respectively, as
FIGURE 1 Langendorff-perfused rabbit heart (A) and rab-
bit ventricular model (B) with shock electrodes in perfusing
chamber. The white outline represents the approximate op-
tical system field of view. B presents preshock epicardial
transmembrane potential distribution (CI ¼ 140 ms).
Optical Signal Distortion in Arrhythmias 3715
Biophysical Journal 93(10) 3714–3726
measured in the experiments described above. Reflecting experimental uncer-
tainty in optical penetration depth and the large variation between different
preparations (2), additional simulations were performed in which penetration
depths at both the illumination and emission wavelengths were varied
simultaneously by between 0.5 and 1.5 times their default values. Thus, the
effect of optical parameter uncertainty on simulated optical maps was as-
sessed. Performing such an assessment is important, as changes in scattering/
absorption properties of the tissue affect the penetration depths at illumina-
tion and emission as well as the scattering volume dimensions associated
with a recording site, which correspondingly alter the amount of information
contained in the fluorescent signal regarding the transmembrane potential
distribution beneath the recording site. To aid comparison, Vm, Vopt, and Vexp
were normalized at each recording site using maximum/minimum AP values
for that site after pacing, as in experimental recordings (8).
Stimulation protocol
In simulations and experiments, a stimulus of twice the threshold and 4 ms
duration was applied at 250 ms basic cycle length through a pacing electrode
at the apex. After the eighth pacing stimulus, 8-ms-long truncated expo-
nential monophashic shocks of varying shock strength (SS) were applied at a
range of coupling intervals (CI) via mesh electrodes located at the vertical
boundaries of the perfusing chamber (Fig. 1, A and B) (11). The cathode was
located near the right ventricle (RV) and the anode near the left ventricle
(LV). SS and CI were chosen such that shocks always resulted in sustained
VT. This allowed us to generate Vm maps at shock-end during shock-
induced arrhythmogenesis (formation of reentry under conditions of residual
VEP) and during sustained VT to be compared with the corresponding
optical maps, synthesized or recorded experimentally as described above.
Positions of scroll-wave filaments, the organizing centers of reentry, and
corresponding phase singularities on the epicardial surface were determined
as in Larson et al. (15) after prior computation of phase maps.
RESULTS
Recordings of shock-end VEP
Fig. 3 presents shock-end anterior epicardial VEP maps of
transmembrane potential (Vm, left), synthesized optical (Vopt,
center), and experimental (Vexp, right) signals for four com-
binations of SS/CI. For comparison between simulations and
experiments, the white outline over simulated epicardial maps
shows the optical field of view in the experiments. In the Vm
and Vopt panels, we show two renderings of the data on the
epicardium: in the left-hand maps, limits of the color scheme
are 0 and 1 (normalized limits of the paced AP); in the right-
hand map, limits are extended to �0.2 and 1.2. Since Vm is
calculated in the ventricular volume whereas Vopt and Vexp
are only epicardial signals, Fig. 3 displays additional Vm
distributions in transverse and apex-to-base cross sections
through the ventricles.
In both simulations and experiments, the shock induces
areas of opposite-in-sign VEP on the epicardium (Fig. 3),
consistent with previous findings (8,9,11). The LV surface
near the anode is negatively polarized, whereas the RV sur-
face is positively polarized with a region of intermediately
polarized epicardium in between. In contrast, polarization
within the ventricular wall is complex and exhibits a change
in VEP sign between epi- and endocardium with the mid-
myocardial wall experiencing weaker polarization than the
surfaces.
FIGURE 2 (A) Experimental setup used for determining
optical penetration depths, showing the camera aimed
perpendicularly at the cut tissue surface (top) and the grid
for recording fluorescence intensity (bottom). (B) Summed
light intensities (brightness) from each column in the
recording grid plotted against depth into the tissue, shown
in blue, with the corresponding single exponential fits for
excitation illumination (green curve, top) and emission
(red curve, bottom) wavelengths from which the respective
optical penetration depths after excitation illumination and
emission were determined.
3716 Bishop et al.
Biophysical Journal 93(10) 3714–3726

Fig. 3 shows that photon scattering results in differences
between Vm and Vopt maps, with Vopt maps being a signifi-
cantly better match to Vexp maps than Vm maps. Although in
the Vm maps the majority of the epicardium has strong
positive/negative VEP, both Vopt and Vexp maps contain large
areas of intermediate polarization. This finding is quantified
in Fig. 4 A, which presents the percentage of epicardial area
within the experimental field of view experiencing normal-
ized polarization of .0.7, 0.3�0.7, and ,0.3. The percent-
age of intermediately polarized epicardium (0.3�0.7) in Vopt
maps is 44.1%, 55.8%, 40.0%, and 32.2% for the four cases
in Fig. 3 (top to bottom); these are in close agreement with
Vexp values of 34.3% 6 12.1%, 49.0% 6 10.7%, 54.1% 6
6.3%, and 53.5% 6 15.8%. In contrast, Vm maps show
consistently smaller percentages of intermediately polarized
epicardium, namely 20.1%, 15.9%, 7.2%, and 15.4% for the
four cases in Fig. 3 (top to bottom).
Fig. 3 shows that photon scattering results in informa-
tion on transmural VEP, visible in the transmural Vm cross
sections, being transduced through the myocardial wall and
manifested in the surface Vopt recordings. In the transmural
Vm VEP cross sections, for each SS/CI episode, large re-
gions of the LV midmyocardial wall are negatively polarized
(dark blue); these regions increase with the increase in CI.
Direct comparison of these transmural Vm maps with the
corresponding epicardial Vopt maps shows a consistent spa-
tial alignment of the intramural excitable regions in the
midmyocardium and areas of strong negative epicardial po-
larization in the Vopt maps. To confirm that this effect is due
to transduction, from depth, of information regarding po-
larization levels, Vm images were replotted, scaled to the
maximum and minimum Vopt values (results not shown). The
resulting pattern of VEP did not resemble the Vopt VEP
pattern (for example, there was no strong polarization close
to the LV apex, above the intramural excitable gap), indi-
cating that Vm signals from deeper layers are contributing
significantly to the Vopt signal. Photon scattering also leads to
a reduction in the range of VEP magnitude in Vopt maps
compared to Vm maps; the match between simulated and
experimental optical VEP maps indicates that the same dis-
tortion takes place in Vexp signals.
Fig. 4 B shows the maximum and minimum values of
normalized VEP, within the experimental field of view on
the epicardium, for the Vm, Vopt, and Vexp maps shown in
Fig. 3. Vm and Vexp polarization ranges differ by up to 103%
for all episodes of 11 V/cm strength (three different CIs) and
up to 170% for the SS¼ 17V/cm and CI¼ 140 ms case. This
difference is significantly reduced when photon scattering is
taken into account: the difference between Vopt and Vexp
ranges of VEP magnitude is ,20% for the three cases of
SS ¼ 11 V/cm shown in the figure and ,31% for the SS ¼17 V/cm case. Therefore, in the VEP images of Fig. 3, if
we adjust the normalization limits by just 20% from 0–1
to �0.2–1.2, we obtain an improved qualitative VEP pattern
match between Vopt and Vexp maps (right image in each panel
of Fig. 3).
We have recently shown that variations in tissue scat-
tering/absorption properties can affect the level of distortion
FIGURE 3 Shock-end VEP maps from simulations (left)
and experiments (right) for various SS/CI combinations.
Simulated maps include distributions of transmembrane
potential (Vm, left) and optical signals (Vopt, center).
Experimental maps, Vexp, are normalized between�85 and
15 mV. Vm and Vopt maps are presented with color scale
limits between 0 and 1 (normalized limits of paced AP)
(left) and between �0.2 and 1.2 (right). All optical maps
show anterior epicardium, and Vm distributions are also
presented in transmural and apex-to-base cross sections.
The white outline in the simulated maps shows experi-
mental optical field of view.
Optical Signal Distortion in Arrhythmias 3717
Biophysical Journal 93(10) 3714–3726

in optical AP upstroke during pacing (5). In Fig. 4 C, we
present variations in maximum and minimum VEP for the
SS ¼ 11 V/cm/CI ¼ 140 ms case (Fig. 3) as penetration
depths during illumination and emission are simultaneously
varied. Vopt maps of VEP for specific penetration depths
(indicated by arrows) are also shown along with correspond-
ing representations of the percentage of positively (.0.7),
negatively (,0.3), and intermediately (0.3–0.7) polarized
FIGURE 4 (A) Percentage of surface area, within experimental field of view, of polarization values .0.7, 0.3–0.7, and ,0.3, for Vm, Vopt, and Vexp maps and
for different combinations of SS/CI. For Vexp, mean values are shown with error bars of one standard deviation. For each SS/CI, the number of rabbits in
experiments varied as follows: n ¼ 4 (11 V/cm/120 ms); n ¼ 5 (11 V/cm/140 ms); and n ¼ 2 (17 V/cm/140 ms); and n ¼ 5 (11 V/cm/160 ms). (B) Range of
normalized polarization values in Vm, Vopt, and Vexp within experimental field of view for episodes shown in Fig. 3 A. (C) Variation in maximum/minimum
normalized Vopt polarization shown in B for the CI ¼ 140 ms/SS ¼ 11 V/cm episode as penetration depths at illumination and emission wavelengths change
simultaneously by relative fractions between 0.5 and 1.5. Corresponding Vopt polarization distributions are shown for selected penetration depths, along with
representations of percentage of area within the experimental field of view having normalized VEP of .0.7, 0.3–0.7, and ,0.3.
3718 Bishop et al.
Biophysical Journal 93(10) 3714–3726

epicardium within the experimental field of view. As pene-
tration depths are changed by 0.5–1.5 times their original
values, the range of Vopt normalized polarization decreases
by 36% (1.36–0.87). Furthermore, Vopt maps in Fig. 4 Cshow that areas of strong positive/negative polarization
(.0.7 and ,0.3) within the experimental field of view
decrease, whereas areas of intermediate polarization (0.3–
0.7) increase from 31.5% to 63.8%. Of particular interest in
Fig. 4 C is the surface distribution of VEP on the LV for large
penetration depths: as scattering volume increases (through
increasing penetration depths), regions of strong negative
polarization on the LV epicardium in the Vopt maps align
more directly above intramural excitable areas in the depth of
the LV wall in the corresponding Vm (SS ¼ 11 V/cm/CI ¼140 ms) map of Fig. 3. As penetration depths increase,
fluorescent signals are sampled from greater depths. Thus,
for large penetrations depths, the only regions of Vopt on the
epicardial surface which remain strongly negatively polar-
ized (as seen close to the apex on the LV in Fig. 4 C) lie
directly above intramural regions of tissue which have strong
negative polarization throughout the depth of the ventricular
wall (as seen in the corresponding transmural Vm image in
Fig. 3).
Shock-induced arrhythmogenesis
For all chosen SS/CI here, postshock propagation evolves
into arrhythmia generation. Figs. 5 and 8 present progression
of this activity for the SS ¼ 11 V/cm/CI ¼ 140 ms episode;
in this case sustained VT has a figure-of-eight pattern, with
one rotor on the anterior and another on the posterior. The
same type of arrhythmia is obtained in experiments, as
illustrated by the activation map in Fig. 7 A (SS ¼ 11 V/cm/
CI ¼ 140 ms), although here only the rotor on the anterior is
visible in the experimental field of view.
We make a distinction here between immediate wavefront
propagation after the shock (shock-induced arrhythmogene-
sis, defined as the period up to the completion of the first
postshock beat) and sustained VT (analyzed in the following
section), as the existence of residual VEP produces signif-
icantly different propagation and reentry patterns immedi-
ately after the shock than during sustained VT. For timings
within the period of shock-induced arrhythmogenesis, epi-
cardial and transmural Vm distributions are presented in Fig.
5 A, top, and the bottom panel shows the corresponding
epicardial Vopt maps. The presence of residual VEP leads to
complex wavefront propagation, often including entirely
intramural wavefronts. Such propagation patterns are ob-
served in the LV wall in Vm maps of Fig. 5 A. In the first few
milliseconds after the shock, the LV midmyocardium is
largely refractory at the base, whereas tissue on and directly
beneath the epicardium is negatively polarized (3 ms panels).
The latter provides an excitable pathway and is traversed by
a wavefront, which propagates on the epicardium from
posterior to anterior (12 ms, 23 ms) but which cannot excite
the refractory midmyocardium. Meanwhile, another wave-
front is propagating into the intramural excitable area in the
LV wall near the apex. At 39 ms, the two wavefronts
coalesce and can now propagate into the LV midmyocar-
dium, which has meanwhile recovered from the shock.
FIGURE 5 Shock-induced arrhythmogenesis. (A) Ante-
rior epicardial Vm and Vopt distributions at several instances
postshock for the SS ¼ 11 V/cm/CI ¼ 140 ms episode.
Maps of Vm in an apex-to-base cross section are also shown.
White curved arrows in 39 ms maps indicate direction of
spiral-wave rotation. Black dots represent phase singular-
ities with long arrows indicating shifts in their locations.
Straight white arrows depict directions of local propagation.
Sites of dual-hump APs are marked by black crosses.
Approximate scattering volume is shown by a dashed
semicircle. (B) Schematic representation of subsurface
wavefront propagation.
Optical Signal Distortion in Arrhythmias 3719
Biophysical Journal 93(10) 3714–3726

However, tissue on and directly beneath the epicardium is
still depolarized from earlier excitation (23 ms) and thus
activation only proceeds intramurally (52 ms). A schematic
of this subsurface propagation is shown in Fig. 5 B. Similar
entirely intramural wavefront propagation patterns were
observed during other episodes of arrhythmia induction.
For the same episode of arrhythmogenesis as above, Fig. 6
shows the corresponding filaments (purple) at 54 ms, with
Vm distribution rendered semitransparent. Fig. 6 also pres-
ents the evolution of Vm and Vopt signals at specific epicardial
locations. Similar experimental traces are depicted in Fig. 7,
B and C, for the episode of shock-induced arrhythmogenesis
illustrated in Fig. 7 A. Figs. 5 and 6 demonstrate that photon
scattering results in significant differences between Vm and
Vopt maps and traces during an episode of shock-induced
arrhythmogenesis.
The underestimation of shock-end potentials shown in the
previous section is clearly visible in the fluorescent traces.
Traces in Fig. 6 also demonstrate that photon scattering
results in prolonged AP upstroke and thus in increased width
of the optical wavefront relative to Vm (4,5) (evident in
epicardial maps of Fig. 5). The increase in wavefront width,
combined with photon scattering from a region of multilevel
residual VEP surrounding a filament during shock-induced
arrhthmogenesis, leads to shifts in the phase singularity
locations on the epicardial surface in Vopt as compared to Vm
maps, evident in the 39 ms panel of Fig. 5. This optical signal
distortion is significant; for instance, the shift across the
epicardial surface of the RV phase singularity location is
4.08 mm, which is larger than both core size and accuracy of
the experimental phase singularity detection method (16).
The Vopt trace v of Fig. 6 is from an epicardial site above
the filament associated with the reentrant subsurface prop-
agation described in Fig. 5 (location shown as black cross).
The Vopt trace has a noticeable second local maximum
(hump) 20–30 ms after the initial peak of the AP, not present
in the corresponding Vm trace. In Fig. 5 A, the intramural
wavefront propagates, to a large extent, within the scattering
volume associated with the epicardial recording site (repre-
sented by dashed black semicircle), without breaking onto
the epicardium. Photons emitted as the midmyocardium is
depolarized by the intramural wave are scattered through the
wall and detected in the recorded epicardial signal, appearing
as a hump.
FIGURE 6 Time course of Vm (dashed blue lines) and Vopt (solid red lines) signals during periods of shock-induced arrhythmogenesis and sustained VT
for the same episode as in Fig. 5. Semitransparent snapshots of Vm distribution at 54 ms, with filaments in purple, indicate where signals are recorded from.
Vertical dashed lines demarcate periods of shock-induced arrhythmogenesis and sustained VT.
3720 Bishop et al.
Biophysical Journal 93(10) 3714–3726
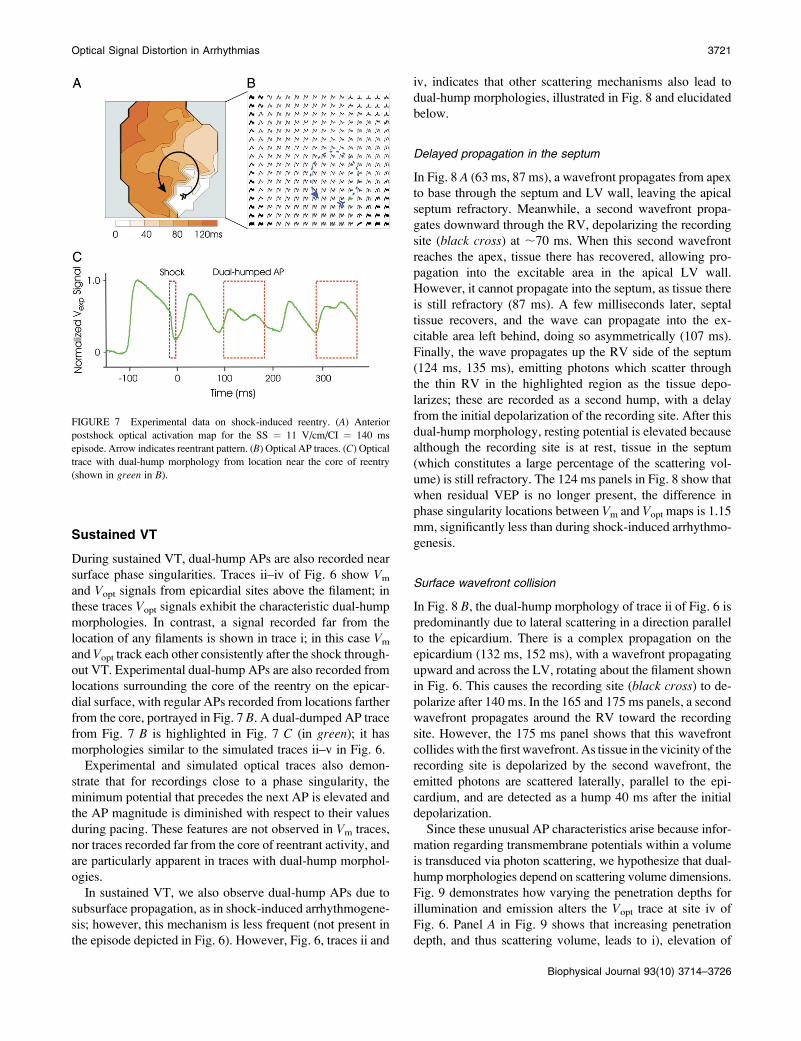
Sustained VT
During sustained VT, dual-hump APs are also recorded near
surface phase singularities. Traces ii–iv of Fig. 6 show Vm
and Vopt signals from epicardial sites above the filament; in
these traces Vopt signals exhibit the characteristic dual-hump
morphologies. In contrast, a signal recorded far from the
location of any filaments is shown in trace i; in this case Vm
and Vopt track each other consistently after the shock through-
out VT. Experimental dual-hump APs are also recorded from
locations surrounding the core of the reentry on the epicar-
dial surface, with regular APs recorded from locations farther
from the core, portrayed in Fig. 7 B. A dual-dumped AP trace
from Fig. 7 B is highlighted in Fig. 7 C (in green); it has
morphologies similar to the simulated traces ii–v in Fig. 6.
Experimental and simulated optical traces also demon-
strate that for recordings close to a phase singularity, the
minimum potential that precedes the next AP is elevated and
the AP magnitude is diminished with respect to their values
during pacing. These features are not observed in Vm traces,
nor traces recorded far from the core of reentrant activity, and
are particularly apparent in traces with dual-hump morphol-
ogies.
In sustained VT, we also observe dual-hump APs due to
subsurface propagation, as in shock-induced arrhythmogene-
sis; however, this mechanism is less frequent (not present in
the episode depicted in Fig. 6). However, Fig. 6, traces ii and
iv, indicates that other scattering mechanisms also lead to
dual-hump morphologies, illustrated in Fig. 8 and elucidated
below.
Delayed propagation in the septum
In Fig. 8 A (63 ms, 87 ms), a wavefront propagates from apex
to base through the septum and LV wall, leaving the apical
septum refractory. Meanwhile, a second wavefront propa-
gates downward through the RV, depolarizing the recording
site (black cross) at ;70 ms. When this second wavefront
reaches the apex, tissue there has recovered, allowing pro-
pagation into the excitable area in the apical LV wall.
However, it cannot propagate into the septum, as tissue there
is still refractory (87 ms). A few milliseconds later, septal
tissue recovers, and the wave can propagate into the ex-
citable area left behind, doing so asymmetrically (107 ms).
Finally, the wave propagates up the RV side of the septum
(124 ms, 135 ms), emitting photons which scatter through
the thin RV in the highlighted region as the tissue depo-
larizes; these are recorded as a second hump, with a delay
from the initial depolarization of the recording site. After this
dual-hump morphology, resting potential is elevated because
although the recording site is at rest, tissue in the septum
(which constitutes a large percentage of the scattering vol-
ume) is still refractory. The 124 ms panels in Fig. 8 show that
when residual VEP is no longer present, the difference in
phase singularity locations between Vm and Vopt maps is 1.15
mm, significantly less than during shock-induced arrhythmo-
genesis.
Surface wavefront collision
In Fig. 8 B, the dual-hump morphology of trace ii of Fig. 6 is
predominantly due to lateral scattering in a direction parallel
to the epicardium. There is a complex propagation on the
epicardium (132 ms, 152 ms), with a wavefront propagating
upward and across the LV, rotating about the filament shown
in Fig. 6. This causes the recording site (black cross) to de-
polarize after 140 ms. In the 165 and 175 ms panels, a second
wavefront propagates around the RV toward the recording
site. However, the 175 ms panel shows that this wavefront
collides with the first wavefront. As tissue in the vicinity of the
recording site is depolarized by the second wavefront, the
emitted photons are scattered laterally, parallel to the epi-
cardium, and are detected as a hump 40 ms after the initial
depolarization.
Since these unusual AP characteristics arise because infor-
mation regarding transmembrane potentials within a volume
is transduced via photon scattering, we hypothesize that dual-
hump morphologies depend on scattering volume dimensions.
Fig. 9 demonstrates how varying the penetration depths for
illumination and emission alters the Vopt trace at site iv of
Fig. 6. Panel A in Fig. 9 shows that increasing penetration
depth, and thus scattering volume, leads to i), elevation of
FIGURE 7 Experimental data on shock-induced reentry. (A) Anterior
postshock optical activation map for the SS ¼ 11 V/cm/CI ¼ 140 ms
episode. Arrow indicates reentrant pattern. (B) Optical AP traces. (C) Optical
trace with dual-hump morphology from location near the core of reentry
(shown in green in B).
Optical Signal Distortion in Arrhythmias 3721
Biophysical Journal 93(10) 3714–3726

diastolic potential, ii), decrease in AP amplitude, and iii),
increase in the amplitude of the hump. The dual-hump ratio,
defined as the ratio of the amplitude of the hump to that of the
initial AP depolarization, is depicted in Fig. 9 B.
Changes in dual-hump ratio and resting potential with
increases in penetration depth are quantified in Fig. 9, C and
D. Our results demonstrate that increasing penetration depths
from 0.5 to 1.5 times their default values results in an
increase in normalized resting potential from 0.09 to 0.36,
along with an increase in dual-hump ratio from 0.63 to 0.82.
DISCUSSION
The goal of this study was to provide a comprehensive un-
derstanding of the role of 3D fluorescent photon scattering in
signal distortion during optical mapping of arrhythmias and
defibrillation. The anatomically realistic bidomain model of
the rabbit ventricles was combined with an accurate repre-
sentation of 3D photon scattering in the ventricles to develop
a unique model of panoramic optical imaging. This approach
allowed us to simulate transmembrane potential distributions
during arrhythmia and defibrillation and compare them to the
corresponding simulated optical maps, revealing distortion
mechanisms specific to each electrophysiological scenario
(sustained VT, shock-induced arrhythmogenesis, or VEP).
The simulation approach was complemented by experiments
on intact rabbit hearts, the results of which served both as
model input (optical parameters of the tissue) and as means
of model validation.
For the first time, our simulations reveal the mechanisms
by which photon scattering can give rise to optical signal
characteristics such as dual-hump morphologies, elevated
resting potentials, and reduced AP amplitudes near the re-
entrant core, as well as to shifts in the phase singularity
locations. During the defibrillation strength shock, scat-
tering significantly modulates the magnitude of the opti-
cally recorded VEP. The close match between simulated
and experimental optical maps demonstrates that these
specific mechanisms of distortion, stemming from pho-
ton scattering, are intrinsic to the fluorescent imaging
FIGURE 8 Simulated Vm (anterior
epicardial and in a cross section) and
Vopt maps during sustained VT; nota-
tions are as in Fig. 5. Schematic
drawings (right) present formation of
dual-hump APs due to A, delayed
propagation into septum (Fig. 5, trace
iv); and B, surface wavefront collision
(Fig. 6, trace ii).
3722 Bishop et al.
Biophysical Journal 93(10) 3714–3726

technique. Each of these mechanisms is discussed in the
sections below.
This study, together with our previous publication on
optical signal distortion during pacing (5), clearly demon-
strates the necessity to 1), accurately model scattering of pho-
tons in all directions (i.e., 3D) and not only in the direction
normal to the tissue surface (i.e., one-dimensional (1D)), as
assumed previously (3,6), thus allowing the effects of scat-
tering in the plane parallel to the epicardium to be also
evaluated; and 2), represent realistically ventricular anatomy,
as opposed to assuming idealized tissue geometries (3,4,6),
thus allowing the detection of distortions associated with
propagation of complex wavefronts. Both features place our
optical imaging model in a unique position to provide
accurate assessment of distortion mechanisms arising from
photon scattering.
Modulation of shock-end VEP
In agreement with previous studies (11), our simulations
demonstrate that at the end of a strong shock, a complex VEP
is induced throughout the ventricles, with the epicardium
strongly polarized and polarization magnitude dramatically
diminishing (or even changing sign) in the depth of the wall.
Optical mapping experiments after identical shock protocols
have found, however, significantly weaker shock-end VEP
on the epicardium (9,11). We demonstrate that 3D photon
scattering accounts for this discrepancy. Indeed, because
VEP of diminishing magnitude is distributed, at the time of
shock termination, within a scattering volume beneath an
epicardial recording site, the optical signal at that instant,
which represents a ‘‘weighted-average’’ of VEP values
within that volume, has a lower resultant value as compared
to the VEP value at the actual epicardial site.
As a result of this averaging effect, the overall degree of
optical signal distortion at shock-end depends upon the spe-
cific distribution of transmural VEP beneath the epicardial
surface. Specifically, it depends upon the difference between
the magnitude of the epicardial VEP at the recording site and
VEP magnitude in midmyocardial tissue residing just
beneath that site (2). Polarization residing below this depth
contributes only very weakly to the signal. Therefore, differ-
ences in ventricular wall thicknesses at different ventricular
locations and between RV and LV have only a minor role in
optical signal distortion by photon scattering.
Our results demonstrate not only that the gap between
simulated and optically recorded VEP is bridged by ac-
counting for 3D photon scattering but also that it is also
possible to use the optical maps to obtain information about
the distribution of excitable areas created by the shock (areas
of VEP around or below rest) in the depth of the myocardial
wall. These areas provide an avenue for postshock propa-
gation, often before the surfaces recover from the shock.
Therefore, knowledge of their location and extent could be
critical in devising strategies to halt postshock propagation
and alter shock outcome. As shown in Fig. 4 C, if photon
scattering is maximized (by appropriate preparations and fluo-
rescent dyes (17)), then regions of strong epicardial negative
polarization in optical maps lie directly above intramural
excitable areas.
FIGURE 9 (A) Vopt dual-hump AP from Fig. 6, trace iv,
together with the same signals obtained upon variations of
penetration depths at illumination and emission wave-
lengths by 0.5, 1.0, and 1.5 times their default values. The
corresponding Vm trace is also shown. (C and D) Changes
in resting potential and dual-hump ratio for variations in
penetration depths as in A. Panel B shows how quantities in
C and D are measured.
Optical Signal Distortion in Arrhythmias 3723
Biophysical Journal 93(10) 3714–3726

Shift in phase singularity locations
In arrhythmia research, locating phase singularities is a widely
used analysis tool (16,18). We demonstrate that photon scat-
tering is manifested as a shift in the phase singularity loca-
tions obtained by processing the optical maps. Since phase
singularities/scroll-wave filaments are surrounded by differ-
ent levels of transmembrane potential, the distribution of
transmembrane potential within a scattering volume associ-
ated with a recording site near the reentrant core is highly
heterogeneous, resulting in signal distortion as these differ-
ences are transduced through the myocardial wall by scat-
tered photons. As a filament is an intrinsic 3D entity,
assessing correctly the magnitude of this distortion depends
critically upon the inclusion of 3D photon scattering in the
model. If photon scattering were assumed to occur only in
depth (1D, i.e., in the direction normal to the surface), then a
shift in the phase singularity location would occur only if the
filament is at an angle to the surface. This is because for
a filament orientated normally to the epicardium, potential
values do not differ along the normal; thus the results of 1D
depth averaging would predict no shift. However, account-
ing for photon scattering within a volume (3D) results in a
shift, due to differences in potential levels within this vol-
ume. This shift is amplified by arbitrary filament orientations
and particularly by filament bending below the epicardium,
as variations in transmembrane potential then occur closer to
the surface, where fluorescence is stronger. Thus, accounting
for 3D rather than 1D scattering and complex filament ori-
entations explains the significantly larger shifts documented
here, as compared to shifts of just 0.57 6 0.16 mm found in
Bray and Wikswo (3). The shift in the positions of optically
recorded phase singularities, as found here, could have im-
portant implications for the application of localized stimuli
near the epicardial spiral-wave core and the ability to control
spiral-wave dynamics (19).
Dual-hump APs
This study demonstrates that 3D scattering in regions near
the scroll-wave filament is manifested in the optically re-
corded APs as dual-hump morphologies. Previous studies
have attributed such morphologies exclusively to subsurface
wavefronts passing close to, but not breaking onto, the
epicardial surface (3,8). Here we uncovered two additional
mechanisms for dual-hump AP formation: 1), wavefront
collision on the epicardium, with dual-hump morphology
arising from photon scattering in a plane parallel to the
epicardium as well as from depth; and 2), delayed propaga-
tion into the septum, with dual-hump morphology stemming
from fluorescent photons scattering through the RV cavity. A
phenomenon similar to the latter has been documented in
optical recordings of rabbit papillary muscles, whereby dual-
hump APs were eliminated by placing opaque plastic over
the septum, thus shielding scattered fluorescent photons
carrying an electrophysiological signature of the septum
(20). These findings provide insight into the contribution of
3D fluorescent photon scattering to the generation of dual-
humped APs in experimental optical recordings and the role
played by intramural wavefront propagation and ventricular
anatomy made possible through the realistic ventricular
model used in the study.
Resting potential elevation/decrease inAP amplitude
Our results demonstrate that elevation of resting potential
and decrease in the amplitude of fluorescent APs, relative to
the corresponding levels during pacing, recorded near scroll-
wave filaments can be solely attributable to 3D photon
scattering. Specifically, these effects are due to a combina-
tion of the heterogeneous distribution of transmembrane
potentials near the filament and the normalization procedure
used in optical mapping experiments. Optical APs at a given
site are normalized by the amplitude of the paced optical AP
at that site. However, such normalization limits are specific
to wavefront propagation through the scattering volume
beneath the particular recording site. During pacing, optical
mapping records a maximum value of the AP when the entire
scattering volume associated with the recording site is
depolarized; depending on conduction velocity and scatter-
ing volume dimensions, this occurs a few milliseconds after
the single pacing-induced wavefront passes by the recording
site. Similarly, optical resting potential is measured before
the wavefront arrives at the recording site and corresponds to
the entire scattering volume being at rest.
During arrhythmia, however, propagation through the
scattering volume associated with a recording site near the
filament is more complex than during pacing; the entire scat-
tering volume is never depolarized or at the resting potential
at the same time, i.e., when the recording site itself is de-
polarized (or at rest), typically not all the tissue within the
scattering volume is depolarized (or at rest). The normali-
zation limits obtained from pacing subsequently under-/
overestimate the local maximum/minimum of the optical AP
at the recording site. Although changes in diastolic potential
and AP amplitude close to the core of reentry during ar-
rhythmia have been shown to be attributed to ion accumu-
lation, this typically takes a number of reentrant cycles to
develop. The findings from our study demonstrate that such
changes, observed in this case in the stages of reentry
formation, can be solely explained by optical signal distor-
tion due to fluorescent photon scattering.
Variation in optical parameters
Photon scattering/absorption parameters and the correspond-
ing optical penetration depths vary widely, depending on a
large number of factors including the fluorescent dye used,
the wavelength of recording, the specifics of the tissue prep-
arations (i.e., blood or Tyrode’s perfused), and variations
3724 Bishop et al.
Biophysical Journal 93(10) 3714–3726

between species. Even for animals of the same species, there
can be large variability in the optical properties of the
preparation (2), due to factors such as age and degree of
heterogeneity within the tissue (fibroblast and fatty tissue
density). In addition, accurate experimental measurement of
the optical parameters in a given preparation is subject to
limitations (discussed below). Therefore throughout this
study, simulations were performed with optical penetration
depths 650% of their measured values to account for this
difference. More importantly, however, these variations act
to further underscore the large role played by photon scat-
tering in optical signal distortion. From the figures showing
the effects of optical parameter variation (Figs. 3 and 8), it is
evident that for small penetration depths Vopt tends toward
Vm, whereas as penetration depths increase, all of the observed
effects, such as modulation of shock-end VEP, dual-humped
AP morphology, and increase in AP resting potential/decrease
in AP amplitude, are all significantly accentuated.
Study limitations
The limitations of the rabbit ventricular bidomain model and
experimental techniques have been outlined elsewhere (11).
Limitations of the optical model include i), effects of lens
and optics of the detection system not being represented
(thought to be secondary to photon-scattering distortion
analyzed here); ii), the lack of small-scale tissue heteroge-
neities in the model and the impact these might have on light
scattering/absorption in localized regions; and iii), the use of
the excitation contraction uncoupling agent BDM not
completely removing motion artifacts, although these small
remaining distortions are not thought to affect the findings in
this study.
Our method to experimentally measure optical penetration
depths at the illumination and emission wavelengths, al-
though employed in previous studies (1,4), is also subject to
limitations. The technique infers photon density in the depth
of the tissue by recording photon intensity exiting perpen-
dicularly from the cut tissue surface. Although approximate,
this technique has been shown to provide an accurate
assessment of optical penetration depths in myocardium
(1,4). Moreover, the measured values of optical penetration
depths obtained here agree closely with those determined in
previous studies (1,2,4). Nonetheless, to accommodate un-
certainty in the experimentally measured values of the pene-
tration depths as well as possible variations in optical
parameters between individual tissue samples throughout
this study, values of the optical penetration depths were
varied and an assessment of the effect of this variation on the
simulated optical signal was conducted.
The quantitative analysis performed in this study (partic-
ularly regarding the shock-end VEP distributions where
percentages of surface areas with different polarization levels
were compared for Vm, Vopt, and Vexp) was specific to the
experimental system used here where the field of view
encompasses parts of RV and LV. However, this was used
only as a quantitative validation of the optical model. The
major findings in this study, including distortion of optically
recorded shock-end VEP due to transduction of information
from weakly polarized midmyocardial regions by fluorescent
photon scattering and the optical artifacts in the fluorescent
signals during shock-induced arrhythmogenesis and VT, are
common to all experimental systems, as they are inherent
consequences of the optical mapping technique itself.
Despite its limitations, this study demonstrates an excellent
match between simulations and experiments and presents a
compelling set of mechanisms for photon-scattering-induced
distortion in optical signals.
This work was supported by the United Kingdom Engineering and Physical
Sciences Research Council through a Life Sciences Interface Doctoral
Training Centre studentship (GR/S58119/ 01, M.J.B.) and Integrative Biol-
ogy E-Science pilot project (GR/S72023/01, D.J.G.), the United Kingdom
National Grid Service, and a National Science Foundation (CBET-
0601935, N.A.T.) and National Institutes of Health award (HL063195,
HL082729, N.A.T., and HL074283, I.R.E).
REFERENCES
1. Baxter, W. T., S. F. Mironov, A. V. Zaitsev, J. Jalife, and A. M. Pertsoz.2001. Visualizing excitation waves inside cardiac muscle using transil-lumination. Biophys. J. 80:516–530.
2. Ding, L., R. Splinter, and S. Knisley. 2001. Quantifying spatial localiza-tion of optical mapping using Monte Carlo simulations. IEEE Trans.Biomed. Eng. 48:1098–1107.
3. Bray, M. A., and J. P. Wikswo. 2003. Examination of optical deptheffects on fluorescence imaging of cardiac propagation. Biophys. J. 85:4134–4145.
4. Hyatt, C. J., S. F. Mironov, M. Wellner, O. Berenfeld, A. K. Popp, D. A.Weitz, J. Jalife, and A. M. Pertsov. 2003. Synthesis of voltage-sensitivefluorescence signals from three-dimensional myocardial activation pat-terns. Biophys. J. 85:2673–2683.
5. Bishop, M. J., B. Rodriguez, J. Eason, J. P. Whiteley, N. A. Trayanova,and D. J. Gavaghan. 2006. Synthesis of voltage-sensitive optical signals:application to panoramic optical mapping. Biophys. J. 90:2938–2945.
6. Janks, D. L., and B. J. Roth. 2002. Averaging over depth during opticalmapping of unipolar simulation. IEEE Trans. Biomed. Eng. 49:1051–1054.
7. Girouard, S. D., K. R. Laurita, and D. S. Rosenbaum. 1996. Uniqueproperties of cardiac action potentials with voltage-sensitive dyes.J. Cardiovasc. Electrophysiol. 7:1024–1038.
8. Efimov, I. R., V. Sidorov, Y. Cheng, and B. Wollenzier. 1999. Evi-dence of three-dimensional scroll waves with ribbon-shaped filamentsas a mechanism of ventricular tachycardia in isolated rabbit heart.J. Cardiovasc. Electrophysiol. 10:1451–1462.
9. Efimov, I. R., F. Aguel, Y. Cheng, B. Wollebzier, and N. A. Trayanova.2000. Virtual electrode polarization in the far field: implications forexternal defibrilation. Am. J. Physiol. Heart Circ. Physiol. 279:H1055–H1070.
10. Kleber, A. G., and Y. Rudy. 2004. Basic mechanisms of cardiac impulsepropagation and associated arrhythmias. Physiol. Rev. 84:431–488.
11. Rodriguez, B., L. Li, J. C. Eason, I. R. Efimov, and N. A. Trayanova.2005. Differences between left and right ventricular chamber geometryaffect cardiac vulnerability to electric shocks. Circ. Res. 97:168–175.
12. Roth, B. R. 2002. Artifacts, assumptions, and ambiguity: pitfalls in com-paring experimental results to numerical simulations when studyingelectrical stimulation of the heart. Chaos. 12:973–981.
Optical Signal Distortion in Arrhythmias 3725
Biophysical Journal 93(10) 3714–3726

13. Trayanova, N. A., J. Eason, and F. Aguel. 2002. Cardiac defibrillation:a look inside the heart. Comput. Vis. Sci. 4:259–270.
14. Ashihara, T., and N. A. Trayanova. 2004. Asymmetry in membraneresponses to electric shocks: insights from bidomain simulations.Biophys. J. 87:2271–2282.
15. Larson, C., L. Dragnev, and N. A. Trayanova. 2003. Analysis ofelectrically induced reentrant circuits in a sheet of myocardium. Ann.Biomed. Eng. 31:768–780.
16. Iyer, A. N., and R. A. Gray. 2001. An experimentalist’s approach toaccurate localization of phase singularities during reentry. Ann.Biomed. Eng. 29:47–59.
17. Cheong, W. F., S. A. Prahl, and A. J. Welch. 1990. A review of theoptical properties of biological tissues. IEEE J. Quantum Electron.26:2166–2175.
18. Jalife, J., R. A. Gray, G. E. Morely, and J. M. Davidenko. 1998. Self-organization and the dynamical nature of ventricular fibrillation. Chaos.8:79–93.
19. Ashihara, T., T. Namba, M. Ito, T. Ikeda, K. Nakazawa, and N. A.Trayanova. 2004. Spiral wave control by a localized stimulus: abidomain model study. J. Cardiovasc. Electrophysiol. 15:226–233.
20. Al-Khadra, A., V. Nikolski, and I. R. Efimov. 2000. The role ofelectroporation in defibrillation. Circ. Res. 87:797–804.
3726 Bishop et al.
Biophysical Journal 93(10) 3714–3726