the role of p21-activated protein kinase 1 in metabolic ...
264
THE ROLE OF P21-ACTIVATED PROTEIN KINASE 1 IN METABOLIC HOMEOSTASIS by YU-TING CHIANG A thesis submitted in conformity with the requirements for the degree of Doctor of Philosophy Graduate Department of Physiology University of Toronto © Copyright by Yu-ting Chiang 2014
-
Upload
khangminh22 -
Category
Documents
-
view
0 -
download
0
Transcript of the role of p21-activated protein kinase 1 in metabolic ...

THE ROLE OF P21-ACTIVATED PROTEIN KINASE 1 IN METABOLIC HOMEOSTASIS
by
YU-TING CHIANG
A thesis submitted in conformity with the requirements for the degree of
Doctor of Philosophy
Graduate Department of Physiology
University of Toronto
© Copyright by Yu-ting Chiang 2014

ii
The Role of P21-Activated Protein Kinase 1 in Metabolic Homeostasis Yu-ting Chiang
Doctor of Philosophy Department of Physiology
University of Toronto 2014
Abstract Our laboratory has demonstrated previously that the proglucagon gene (gcg), which encodes the
incretin hormone GLP-1, is among the downstream targets of the Wnt signaling pathway; and that
Pak1 mediates the stimulatory effect of insulin on Wnt target gene expression in mouse gut non-
endocrine cells. Here, I asked whether Pak1 controls gut gcg expression and GLP-1 production,
and whether Pak1 deletion leads to impaired metabolic homeostasis in mice. I detected the
expression of Pak1 and two other group I Paks in the gut endocrine L cell line GLUTag, and co-
localized Pak1 and GLP-1 in the mouse gut. Insulin was shown to stimulate Pak1 Thr423 and β-cat
Ser675 phosphorylation. The stimulation of insulin on β-cat Ser675 phosphorylation, gcg promoter
activity and gcg mRNA expression could be attenuated by the Pak inhibitor IPA3. Male Pak1-/-
mice showed significant reduction in both gut and brain gcg expression levels, and attenuated
elevation of plasma GLP-1 levels in response to oral glucose challenge. Notably, the Pak1-/- mice
were intolerant to both intraperitoneal and oral glucose administration. Aged Pak1-/- mice showed
a severe defect in response to intraperitoneal pyruvate challenge (IPPTT). In primary hepatocytes,
however, IPA3 reduced basal glucose production, attenuated glucagon-stimulated glucose
production, and inhibited the expression of Pck1 and G6pc. This implicates that the direct effect of
group I Paks in hepatocytes is the stimulation of gluconeogenesis, and that the impairment in
IPPTT in aged Pak1-/- mice is due to the lack of Pak1 elsewhere. The defect in IPPTT in aged

iii
Pak1-/- mice could be rescued by stimulating gcg expression with forskolin injection or by
enhancing the incretin effect via sitagliptin administration. In summary, my study demonstrates
that: 1) Pak1 positively regulates GLP-1 production, 2) Pak1/β-cat signaling plays a role in
gut/liver axis or gut/pancreas/liver axis governing glucose homeostasis, and 3) Pak1-/- mice can be
utilized as a novel model for metabolic research.

iv
Acknowledgements
I would like to express my deepest gratitude to my supervisor Dr. Tianru Jin, for his
continuous support and guidance throughout my studies. He has exemplified the merging of a
critical mind with a relentless pursuit of knowledge, which has been and always will be an
inspiration to me, both in science and in life. I would like to extend my gratitude toward the
members of my Supervisory Committee, my co-supervisor Dr. Michael Wheeler, as well as Dr.
Herbert Gaisano and Dr. Qinghua Wang, whose constant encouragement and advice have made the
completion of this research project an enjoyable experience. Thanks to all the past and present
members of the Jin lab and the TMDT 10th floor diabetes lab, you all made the past few years so
much more colorful and memorable. Thanks to Joan and Wilfred for journeying with me, your
assistance, advice, and friendship have been invaluable. I want to give special thanks to my
parents, David and Lisa, who supported me unconditionally from afar and whose wisdom and love
have always been just a Skype call away. Last but not least, I want to thank my sister Helen for the
numerous dinner conversations revolving around science, research, Western blots, and mice. Your
daily companionship as a sister, friend, and fellow scientist has been a true blessing.
This thesis is dedicated to the loving memory of my teacher and mentor Dr. Robert Carsten
(Jack) von Borstel (1925-2012) from the University of Alberta, whose immeasurable kindness and
encouragements have been instrumental in the completion of all my post-graduate studies.
I can do all things through Christ who strengthens me. (Philippians 4:13)

v
Table of Contents ABSTRACT ....................................................................................................................................................................................... II
TABLE OF CONTENTS .................................................................................................................................................................. V
LIST OF FIGURES .......................................................................................................................................................................... IX
LIST OF FIGURES ........................................................................................................................................................................... X
LIST OF FIGURES .......................................................................................................................................................................... XI
LIST OF TABLES .......................................................................................................................................................................... XII
LIST OF APPENDICES ............................................................................................................................................................... XIII
LIST OF ABBREVIATIONS ....................................................................................................................................................... XIV
LIST OF PUBLICATIONS .......................................................................................................................................................... XIX
1 INTRODUCTION ................................................................................................................................................ 1
1.1 DIABETES MELLITUS AND THE METABOLIC SYNDROME ........................................................................................ 2
1.1.1 Diabetes mellitus and the metabolic syndrome ................................................................................................ 2
1.1.2 Major metabolic hormones in glucose homeostasis ....................................................................................... 4 1.1.2.1 Hormones ................................................................................................................................................................................................ 4 1.1.2.2 The pancreas and islets of Langerhans..................................................................................................................................... 5
1.1.2.3 Insulin ....................................................................................................................................................................................................... 6
1.1.2.4 Glucagon ................................................................................................................................................................................................ 11
1.1.2.5 Somatostatin ........................................................................................................................................................................................ 13
1.1.2.6 Pancreatic polypeptide ................................................................................................................................................................... 15
1.1.2.7 Leptin ...................................................................................................................................................................................................... 16
1.1.3 The liver as a central organ in glucose homeostasis ................................................................................... 18 1.1.3.1 Glycogenolysis and glycogenesis ............................................................................................................................................... 19
1.1.3.2 Glycolysis and gluconeogenesis ................................................................................................................................................. 22
1.2 THE INCRETIN HORMONE GLUCAGON-LIKE PEPTIDE 1 ....................................................................................... 24
1.2.1 Proglucagon gene, GLP-1 production and degradation ............................................................................ 24
1.2.2 Mechanisms underlying proglucagon gene expression ............................................................................. 30
1.2.3 The functions of GLP-1 .............................................................................................................................................. 38
1.3 THE WNT SIGNALING PATHWAY AND PROGLUCAGON GENE EXPRESSION ....................................................... 42
1.3.1 Overview of the Wnt signaling pathway ........................................................................................................... 42
1.3.2 Wnt signaling pathway and metabolic homeostasis .................................................................................. 44
1.3.3 Wnt signaling pathway effectors as mediators of proglucagon gene expression ......................... 47
1.4 P21-ACTIVATED PROTEIN KINASE 1 AND ITS ROLE IN METABOLIC HOMEOSTASIS........................................ 48
1.4.1 Overview of the Pak family ...................................................................................................................................... 48 1.4.1.1 The discovery of Paks 1-3 ............................................................................................................................................................. 48
1.4.1.2 The discovery of Paks 4-6 ............................................................................................................................................................. 52 1.4.1.3 Structural features, activation mechanisms, and upstream regulators of Paks ................................................. 53

vi
1.4.1.3.1 Structural features of Paks ..................................................................................................................................................... 53
1.4.1.3.2 Activation mechanism of group I Paks ............................................................................................................................. 55
1.4.1.3.3 Positive regulators of Pak1 .................................................................................................................................................... 58
1.4.1.4 Negative regulators of Pak1 ......................................................................................................................................................... 59
1.4.1.5 Substrate specificity ......................................................................................................................................................................... 62 1.4.1.6 The role of Paks in tumorigenesis and cancer .................................................................................................................... 62
1.4.1.7 The functions of Paks ...................................................................................................................................................................... 64
1.4.1.7.1 Cell cycle progression ............................................................................................................................................................... 64
1.4.1.7.2 Cell survival and apoptosis .................................................................................................................................................... 66
1.4.1.7.3 Cytoskeleton remodeling ........................................................................................................................................................ 67
1.4.1.7.4 Host-pathogen response ......................................................................................................................................................... 69
1.4.1.7.5 Gene transcription and mRNA splicing ............................................................................................................................ 70
1.4.1.7.6 Endothelial and vascular biology ........................................................................................................................................ 72
1.4.1.7.7 Metabolic homeostasis............................................................................................................................................................. 73
1.4.2 Pak1 and glucose transport in muscle ............................................................................................................... 73
1.4.3 Pak1 and insulin secretion in pancreas ............................................................................................................. 82
1.4.4 Pak1 as a mediator of the crosstalk between insulin and Wnt signaling pathways .................... 86
2 RATIONALE, HYPOTHESIS, AND RESEARCH AIMS ............................................................................. 88
2.1 RATIONALE ................................................................................................................................................................. 89
2.2 HYPOTHESIS AND RESEARCH AIMS ......................................................................................................................... 89
3 GENERAL MATERIALS AND METHODS .................................................................................................. 91
3.1 CHEMICALS AND ANTIBODIES .................................................................................................................................. 92
3.2 WESTERN BLOTTING ................................................................................................................................................. 92
3.3 RNA EXTRACTION AND REAL-TIME QUANTITATIVE REVERSE-TRANSCRIPTASE PCR ................................... 93
3.4 EXPERIMENTAL ANIMALS, MAINTENANCE, AND GENOTYPING........................................................................... 94
3.5 MOUSE ORGAN WEIGHT MEASUREMENTS ............................................................................................................. 95
3.6 IMMUNOHISTOCHEMISTRY OF MOUSE INTESTINE AND PANCREAS ................................................................... 95
3.7 STATISTICAL ANALYSES AND DENSITOMETRY ANALYSIS .................................................................................... 95
4 P21-ACTIVATED PROTEIN KINASE 1 MEDIATES THE CROSSTALK BETWEEN INSULIN AND ΒETA-
CATENIN ON REGULATING PROGLUCAGON GENE EXPRESSION IN THE GUT ................................................. 96
4.1 ABSTRACT ................................................................................................................................................................... 97
4.2 INTRODUCTION .......................................................................................................................................................... 97
4.3 MATERIALS AND METHODS ...................................................................................................................................... 99
4.3.1 Cell lines and tissue culture ..................................................................................................................................... 99
4.3.2 Fetal rat intestinal cell isolation ........................................................................................................................... 99
4.3.3 Plasmids, transfection, and luciferase reporter gene analysis ............................................................ 100
4.3.4 Real-time quantitative reverse-transcriptase PCR ................................................................................... 101

vii
4.3.5 Northern blotting ..................................................................................................................................................... 101
4.4 RESULTS ................................................................................................................................................................... 102
4.4.1 Insulin stimulates Pak1 activation in gcg-expressing cells ................................................................... 102
4.4.2 Insulin-stimulated gcg expression can be attenuated by Pak inhibition ........................................ 103
4.4.3 Pak inhibition attenuates insulin-stimulated β-cat Ser675 phosphorylation .............................. 104
4.5 DISCUSSION ............................................................................................................................................................. 111
4.6 ACKNOWLEDGEMENTS .......................................................................................................................................... 113
5 ABLATION OF P21-ACTIVATED PROTEIN KINASE 1 PERTURBS GLUCOSE HOMEOSTASIS .............. 114
5.1 ABSTRACT ................................................................................................................................................................ 115
5.2 INTRODUCTION ....................................................................................................................................................... 115
5.3 MATERIALS AND METHODS ................................................................................................................................... 116
5.3.1 Real-time quantitative reverse-transcriptase PCR ................................................................................... 116
5.3.2 Mouse distal ileum GLP-1 extraction ............................................................................................................... 116
5.3.3 Mouse brain primary neuron isolation ........................................................................................................... 117
5.3.4 Intraperitoneal and oral tolerance tests ....................................................................................................... 118
5.3.5 Hormone measurements ....................................................................................................................................... 118
5.4 RESULTS ................................................................................................................................................................... 119
5.4.1 Pak1−/− mice in mixed C57BL/6-129 background have normal phenotypes ................................ 119
5.4.2 Pak1−/− mice in C57BL/6 background show impaired glucose disposal and reduced gut gcg expression level .......................................................................................................................................................... 119
5.4.3 Pak1−/− mice have reduced brainstem gcg expression level ................................................................. 121
5.4.4 Pak1−/− mouse brain neurons show abolished response to insulin on β-cat Ser675 phosphorylation ........................................................................................................................................................ 121
5.4.5 Pak1-/- mice have reduced distal ileum weight ........................................................................................... 121
5.4.6 Pak1-/- mice have comparable responses to intraperitoneal insulin tolerance test .................. 122
5.5 DISCUSSION ............................................................................................................................................................. 131
5.6 ACKNOWLEDGEMENTS .......................................................................................................................................... 136
6 THE ROLE OF P21-ACTIVATED PROTEIN KINASE 1 IN HEPATIC GLUCOSE PRODUCTION ............... 137
6.1 ABSTRACT ................................................................................................................................................................ 138
6.2 INTRODUCTION ....................................................................................................................................................... 138
6.3 MATERIALS AND METHODS ................................................................................................................................... 140
6.3.1 Mouse primary hepatocyte isolation ............................................................................................................... 140
6.3.2 Glucose production assay ...................................................................................................................................... 141
6.3.3 Real-time quantitative reverse-transcriptase PCR ................................................................................... 142
6.3.4 Intraperitoneal administration of forskolin and sitagliptin gavage in mice ................................ 142
6.4 RESULTS ................................................................................................................................................................... 142
6.4.1 Aged Pak1-/- mice exhibit more severe defects in IPPTT and GLP-1 secretion response ......... 142

viii
6.4.2 Inhibition of Group I Paks represses glucose production in primary hepatocytes ..................... 143
6.4.3 Inhibition of group I Paks represses gluconeogenic gene expression in hepatocytes ............... 144
6.4.4 In vivo forskolin administration improves IPPTT and increases gut gcg mRNA levels in aged Pak1-/- mice ................................................................................................................................................................... 145
6.4.5 Sitagliptin gavage reverses the IPPTT defect and stimulates plasma GLP-1 levels in aged Pak1-/- mice ................................................................................................................................................................... 146
6.4.6 Aged Pak1-/- mice have reduced epididymal fat pad weight ................................................................ 147
6.5 DISCUSSION ............................................................................................................................................................. 158
6.6 ACKNOWLEDGEMENTS .......................................................................................................................................... 162
7 GENERAL DISCUSSIONS, CONCLUSION, AND FUTURE DIRECTIONS .......................................... 164
7.1 GENERAL DISCUSSIONS .......................................................................................................................................... 165
7.1.1 The crosstalk between insulin and Wnt signaling pathways and its effect on GLP-1 production .................................................................................................................................................................... 165
7.1.2 The in vivo role of Pak1 deficiency.................................................................................................................... 167
7.1.3 The gut/liver axis or gut/pancreas/liver axis ............................................................................................. 172
7.1.4 Redundant functions of group I Paks .............................................................................................................. 175
7.1.5 Pak1-/- mice as a novel model for metabolic and aging studies .......................................................... 177
7.2 OVERALL IMPORTANCE OF STUDY AND CONCLUSION ....................................................................................... 179
7.3 FUTURE WORK ........................................................................................................................................................ 182
7.3.1 Liver-specific Pak1 knockout mice ................................................................................................................... 182
7.3.2 IPA3 as a potential glucose-lowering drug .................................................................................................. 182
7.3.3 The role of Pak1 and Wnt signaling in adipogenesis ............................................................................... 184
7.3.4 GLP-2 as an intestinotrophic factor and as a treatment for intestinal diseases ......................... 188
8 REFERENCES ................................................................................................................................................. 190
9 APPENDICES .................................................................................................................................................. 240
9.1 AGED PAK1-/- MICE EXHIBIT REDUCED WHOLE BODY FAT ............................................................................... 241
9.2 AGED PAK1-/- MICE HAVE COMPARABLE HEPATIC FAT CONTENT ................................................................... 241
9.3 AGED PAK1-/- MICE HAVE REDUCED CIRCULATING GLP-2 LEVELS ................................................................ 241

ix
List of figures Chapter 1
Fig. 1.1 Insulin signaling pathway .................................................................................................. 9
Fig. 1.2 Glycogenolysis and glycogenesis ................................................................................. 20
Fig. 1.3 Glycolysis and gluconeogenesis .................................................................................... 23
Fig. 1.4 Proglucagon and proglucagon derived peptides (PGDPs) ................................. 26
Fig. 1.5 GLP-1 and its derivatives. ............................................................................................... 28
Fig. 1.6 Cis- and trans-elements involved in the regulation of gcg promoter activity. ................................................................................................................................... 31
Fig. 1.7 Transcriptional regulation of the proglucagon gene. ........................................... 33
Fig. 1.8 Schematic presentation of the function of GLP-1. ................................................. 39
Fig. 1.9 Overview of Wnt signaling pathway. .......................................................................... 43
Fig. 1.10 P21-activated protein kinases (PAKs) are effectors for selected small GTPases. ................................................................................................................................ 50
Fig. 1.11 Structural features of Pak proteins. .......................................................................... 54
Fig. 1.12 Activation mechanism of Pak1. .................................................................................. 56
Fig. 1.13 Interaction domains and phosphorylation sites of Pak1. ................................ 57
Fig. 1.14 Pak1 and its upstream positive and negative regulators. ................................ 61
Fig. 1.15 Pak1 and its downstream effectors regulate a multitude of cellular functions. ............................................................................................................................. 65
Fig. 1.16 Summary of the role of Pak1 in skeletal muscle and pancreas. ...................... 74
Fig. 1.17 Overview of mechanisms underlying insulin-stimulated glucose uptake in skeletal muscle. ........................................................................................................... 77 Fig. 1.18 Overview of the mechanisms underlying glucose-stimulated insulin secretion in pancreas. ..................................................................................................... 83

x
Chapter 4
Fig. 4.1 Insulin activates Pak1 in gcg-expressing cell lines ............................................. 106
Fig. 4.2 Pak1 expression profiles in selected tissues of C57BL/6 and CD1 mice .... 107
Fig. 4.3 Insulin-activated gcg promoter and mRNA expression can be attenuated by IPA3 .................................................................................................................................. 108
Fig. 4.4 Wnt ligand Wnt3A stimulates gcg promoter and mRNA expression in GLUTag cell line ................................................................................................................. 109
Fig. 4.5 Insulin stimulates β-cat Ser675 phosphorylation in GLUTag cells ................ 110 Chapter 5 Fig. 5.1 Pak1-/- mice exhibit impaired glucose disposal .................................................... 123
Fig. 5.2 Body weight monitoring of Pak1-/- mice in C57BL/6-129 mixed genetic background ......................................................................................................................... 124
Fig. 5.3 Pak1-/- mice show abnormalities in plasma hormone levels and gut gcg expression ............................................................................................................................. 125
Fig. 5.4 Pak1-/- mice exhibit comparable pancreatic islet architecture ........................ 126
Fig. 5.5 Pak1-/- mice show reduced brainstem gcg mRNA level and Pak1 regulates gcg expression in brain neurons ................................................................................. 127
Fig. 5.6 Pak1-/- mice brain neurons show lack of response in insulin-stimulated β-cat Ser675 phosphorylation ...................................................................................... 128
Fig. 5.7 Pak1-/- mice exhibited reduced weight of distal ileum ....................................... 129
Fig. 5.8 Pak1-/- mice and age-matched wild-type (WT) mice have comparable responses in intraperitoneal insulin tolerance test .............................................. 130
Fig. 5.9 Our current understanding of the role of Pak1 in glucose homeostasis...... 135

xi
Chapter 6
Fig. 6.1 Aged Pak1-/- mice show severe defect in IPPTT .................................................... 148 Fig. 6.2 The group I Pak inhibitor IPA3 represses glucose production in primary hepatocytes........................................................................................................................... 149 Fig. 6.3 IPA3 represses gluconeogenic gene expression in primary hepatocytes ... 150 Fig. 6.4 Forskolin injection improves IPPTT and increases gut gcg mRNA levels in aged Pak1-/- mice ................................................................................................................. 151 Fig. 6.5 Forskolin injection for one week generated no effect on body weight in aged Pak1-/- mice and wild-type control mice ........................................................ 152 Fig. 6.6 Sitagliptin rescues the IPPTT and OGTT impairments in aged Pak1-/- mice ............................................................................................................... 153-155 Fig. 6.7 No changes in body weight during sitagliptin treatment in aged Pak1-/- mice .......................................................................................................................... 154 Fig. 6.8 Aged Pak1-/- mice exhibit smaller epididymal fat pads ...................................... 155 Fig. 6.9 Summary of the role of Pak1 in metabolic homeostasis and the phenotypes of Pak1-/- mice ....................................................................................................................... 163 Chapter 7 Fig. 7.1 Overall summary and significance of study ............................................................ 181

xii
List of tables
Chapter 1
Table 1 Examples from the two categories of GLP-1 based therapeutics ........................ 29

xiii
List of appendices
Appendix 1 Aged Pak1-/- mice exhibit reduced whole body fat ................................ 242
Appendix 2 Aged Pak1-/- mice have comparable hepatic fat content ........................ 243
Appendix 3 Aged Pak1-/- mice have reduced circulating GLP-2 levels .................... 244

xiv
List of Abbreviations
AID Autoinhibitory domain APC Adenomatous polyposis coli AR Androgen receptor ARH Arcuate nucleus of the hypothalamus ATF3 Activated transcription factor 3 ATP Adenosine triphosphate BAD Bcl-2-associated death promoter Bak Bcl-2-homologous killer Bax Bcl-2-associated protein Bcl-2 B-cell lymphoma-2 BMMC Bone marrow derived mast cell Brn4 Brain-4 CAM Chorioallantoic membrane Camp Cyclic adenosine monophosphate CCK Cholecystokinin Cdc42 Cell division control protein 42 homolog Cdx-2 Caudal type homeobox-2 cGMP Cyclic guanosine monophosphate ChIP Chromatin immunoprecipitation CK1α Casein kinase 1 α CNS Central nervous system cpE carboxypeptidase E CRE cAMP response element CREB cAMP response element binding CRIPAK Cysteine-rich inhibitor of Pak1 CtBP1 C-terminal binding protein 1 of E1A DKO Double-knockout DLC1 Dynein light chain 1 DMEM Dulbecco’s Modified Eagles Medium DPP-IV Dipeptidyl peptidase IV Dvl Dishevelled ECL Enhanced chemiluminescence EGF Epidermal growth factor eIF4E Eukaryotic translatioin initiation factor 4E Epac Exchange protein activated by cAMP

xv
ER Endoplasmic reticulum Ex-4 Exendin-4 F-1,6-P2 Fructose-1,6-bisphosphate F6P Fructose-6-phosphate FBP Fructose-1,6-biphosphatase FBS Fetal bovine serum FFA Free fatty acid FGF Fibroblast growth factor FGFR Fibroblast growth factor receptor FoxO Forkhead box O FRIC Fetal rat intestinal cell Frz Frizzled G1P Glucose-1 phosphate G6P Glucose-6-phosphate G6P Glucose-6-phosphatase G6ph Glucose-6-phosphatase GAP GTPase activating protein GC Glucagon challenge Gcg Proglucagon gene GcgR Glucagon receptor GDI Guanine nucleotide dissociation inhibitor GDP Guanosine diphosphate GEF Guanine nucleotide exchange factor GI Gastrointestinal GIP Glucose-dependent insulinotropic peptide GK Glucokinase GLP-1 Glucagon-like peptide-1 GLP-1R Glucagon-like peptide 1 receptor GLUT1/2 Glucose transporter 1/2 GLUT4 Glucose transporter 4 Glyc-3-P Glyceraldehyde-3-phosphate Glycogenn Glycogen chain GNG Gluconeogenesis GP Glycogen phosphorylase GPa Glycogen phosphorylase active form GPb Glycogen phosphorylase inactive form GPCR G-protein coupled receptor GPM Glucose production medium GRPP Glicentin-related pancreatic polypeptide GS Glycogen synthase
GSa Glycogen synthase active form

xvi
GSb Glycogen synthase inactive form GSIS Glucose stimulated insulin secretion GSK3 Glycogen synthase kinase-3 GST Glutathione-S-transferase GTP Guanosine triphosphate HD Homeobox domain HDL High density lipoprotein HGF Hepatocyte growth factor HGP Hepatic glucose production HIV Human immunodeficiency virus HMG High-mobility group hPIP1 Human Gβ-like WD-repeat protein 1 IBMX 3-isobutyl-1-methylxanthine IDDM Insulin-dependent diabetes mellitus IGF Insulin-like growth factor 1 IP1 Intervening peptide-1 IP2 Intervening peptide-2 IPGTT Intraperitoneal glucose tolerance test IPITT Intraperitoneal insulin tolerance test IPPTT Intraperitoneal pyruvate tolerance test IR Insulin receptor IRK Insulin receptor kinase IRS Insulin receptor substrate Isl-1 Insulin gene enhancer protein-1 KATP ATP-sensitive K+ channel LADA Latent autoimmune diabetes in adults LDL Low density lipoprotein LEPR Leptin receptor LIMK Lim kinase LKB1 Serine threonine kinase liver kinase B1 LPA Lysophosphatidic acid LRP5/6 Low-density lipoprotein receptor-related proteins 5 and 6 LTD Long-term depression LTP Long-term potential LUC Luciferase reporter gene MAPK Mitogen-activated protein kinase MAPKK6 Mitogen-activated protein kinase kinase 6 MBP Myelin basic protein MEF Mouse embryo fibroblast

xvii
MHC Myosin heavy chain miRNA microRNA MLCK Myosin light chain kinase MODY Maturity onset diabetes of the young MPGF Major proglucagon fragment mTOR Mammalian target of rapamycin NADPH Nicotinamide adenine dinucleotide phosphate Nck Tyrosine kinase adaptor protein NIDDM Non-insulin-dependent diabetes mellitus NPY Neuropeptide Y OAA Oxaloacetate OGTT Oral glucose tolerance test Pak p21-activated protein kinase Pax Paired box PBD p21-GTPase-binding domain Pbx Pre-B cell leukemia transcription factor PC Pyruvate carboxylase PC1/3 Prohormone convertase 1/3 PC2 Prohormone convertase 2 PCA Passive cutaneous anaphylaxis PCBP1 PolyC-RNA-binding protein 1 PDE3B Phosphodiesterase 3B PDGF Platelet-derived growth factor PDK1 Pyruvate dehydrogenase lipoamide kinase isozyme 1 PEI Polyethylenimine PEP Phosphoenolpyruvate PEPCK Phosphoenolpyruvate carboxykinase PGDP Proglucagon derived peptide PI3K Phosphoinositide 3-kinase PK Phosphorylase kinase PyrK Pyruvate kinase PKA Protein kinase A PKa Phosphorylase kinase active form PKb Phosphorylase kinase inactive form PKB Protein kinase B POU3F4 POU class 3 homeobox 4 PP Pancreatic polypeptide PP1 Protein phosphatase-1 PTB Phosphotyrosine-binding PtdIns(4,5)P2 Phosphatidylinositol (4,5) bisphosphate

xviii
PYY Peptide YY qRT-PCR quantitative reverse transcriptase polymerase chain reaction RIA Radioimmunoassay RIPA Radioimmuno precipitation assay RLC Regulatory light chain ROCK Rho-associated coiled-coil-containing protein kinases SA SST analog SAD-A Synapses of amphids defective SNP Single nucleotide polymorphism SKIP Skeletal muscle and kidney enriched inositol phosphatase SSC Saline sodium citrate SST Somatostatin SSTR Somatostatin receptor T1D Type 1 diabetes T2D Type 2 diabetes TAG Triacylglycerol TxNIP Thioredoxin-interacting protein VSMC Vascular smooth muscle cell Y4R Y4 receptor β-cat β-catenin

xix
List of Publications
Original Research Articles:
1) Chiang Y, Ip W, Shao W, Song ZE, Chernoff J, Jin T. Sitagliptin normalizes impaired
hepatic glucose production in aged p21-activated protein kinase 1 knockout mice. (Revised manuscript submitted, Endocrinology).
2) Chiang Y, Shao W, Xu XX, Chernoff J, Jin T. 2013. P21-activated protein kinase 1 (Pak1) mediates the cross talk between insulin and β-catenin on proglucagon gene expression and its ablation affects glucose homeostasis in male C57BL/6 mice. Endocrinology 154(1):77-88.
3) Ip W, Shao W, Chiang Y, Jin T. 2013. GLP-1-derived nonapeptide GLP-1(28-36)
represses hepatic gluconeogenic gene expression and improves pyruvate tolerance in high fat diet fed mice. Am J Physiol Endocrinol Metab 305(11):E1348-58.
4) Shao W, Wang Z, Ip W, Chiang Y, Xiong X, Chai T, Xu C, Wang Q, Jin T. 2013. GLP-1(28-36) improves β-cell mass and glucose disposal in streptozotocin induced diabetes mice and activates PKA-β-catenin signaling in beta-cells in vitro. Am J Physiol Endocrinol Metab 304(12):E1263-72.
5) Shao W, Wang D, Chiang Y, Ip W, Xu F, Columbus J, Belsham DD, Irwin DM, Zhang H,
Wen X, Wang Q, and Jin T. 2013. The Wnt signaling pathway effector TCF7L2 controls gut and brain proglucagon gene expression and glucose homeostasis. Diabetes 62(3):789-800.
6) Ip W, Shao W, Chiang Y, Jin T. 2012. The Wnt signaling pathway effector TCF7L2 is upregulated by insulin and represses hepatic gluconeogenesis. Am J Physiol Endocrinol Metab 303(9):E1166-76.
7) Liu S, Liu R, Chiang Y, Song L, Li X, Jin T, Wang Q. 2012. Insulin detemir enhances proglucagon gene expression in the intestinal L cells via stimulating beta-catenin and CREB activities. Am J Physiol Endocrinol Metab 303(6):E740-51.
8) Shao W, Yu Z, Chiang Y, Yang Y, Chai T, Foltz W, Lu H, Fantus IG, Jin T. 2012.
Curcumin prevents high fat Diet induced insulin resistance and obesity via attenuating lipogenesis in liver and inflammatory pathway in adipocytes. PLoS One 7(1):e28784.
9) Columbus J, Chiang Y, Shao W, Zhang N, Wang D, Gaisano HY, Wang Q, Irwin DM, Jin T. 2010. Insulin treatment and high-fat diet feeding reduces the expression of three TCF genes in rodent pancreas. J Endocrinol 207(1): 77-86.

xx
Review Articles:
1) Chiang Y, Jin T. P21-activated protein kinases and their emerging roles in metabolic
homeostasis. (Revised article submitted, Am J Physiol Endo Metab) 2) Chiang Y, Ip W, Jin T. The role of the Wnt signaling pathway in incretin hormone
production and function. 2012. Front Physiol 3:273.
3) Ip W, Chiang Y, Jin T. The involvement of the Wnt signaling pathway and TCF7L2 in diabetes mellitus: The current understanding, dispute, and perspective. 2012. Cell Biosci. 2(1):28.
Summary of publications:
Number of first-authored original research articles: 1 published, 1 revision submitted
Number of first-authored review articles: 1 published, 1 revision submitted
Number of co-authored publications: 8 published

1
1 Introduction Figures 1.4 and 1.8 were modified from figures of a review article published by Chiang et al. The role of the Wnt signaling pathway in incretin hormone production and function. 2012. Front Physiol 3:273 [200]. Figure 1.7 was modified from a figure of a review article published by Jin T. Mechanisms underlying proglucagon gene expression. The Journal of endocrinology. 2008;198(1):17-28 [192]. Figures 1.10, 1.11, 1.12, and 1.13 were from a review article that has been submitted by Chiang et al. P21-activated protein kinases and their emerging roles in metabolic homeostasis (revised article submitted, Am J PhysiolEndoMetab).

2
1.1 Diabetes mellitus and the metabolic syndrome
1.1.1 Diabetes mellitus and the metabolic syndrome
Diabetes mellitus, commonly referred to as diabetes, is a medical condition in which
blood glucose concentrations are elevated beyond the normal range. There are several forms of
diabetes mellitus(1). The most common form is type 2 diabetes (T2D), also called maturity-onset
diabetes or non-insulin-dependent diabetes mellitus (NIDDM). T2D is mainly characterized by:
1) insulin resistance, which is the inability of the target tissues of insulin to respond to insulin
action and 2) pancreatic β cell failure resulting in defective insulin secretion. Another form is
Type 1 diabetes (T1D), also called juvenile-onset diabetes or insulin-dependent diabetes mellitus
(IDDM). T1D is characterized by the autoimmune destruction of the pancreatic β cells, leading
to insulin deficiency. There are several key features that differ between these two forms of
diabetes. The typical age of onset of T2D occurs at >40 years, while that of T1D occurs between
6 months and 25 years (1). The typical body physique of T2D patients is overweight or obese,
while T1D patients are normally lean and even show weight loss at disease diagnosis (1).
Other distinct but more rare forms of diabetes have been identified (1). Gestational
diabetes mellitus refers to diabetes occurring in pregnant women (2). It usually disappears post
partum, but predisposes the mothers to increased risk of developing T2D later in life. Maturity
onset diabetes of the young (MODY) refers to a group of conditions (MODY1 to MODY7),
where each is inherited in a Mendelian fashion (3). The genetic basis of these forms is being
uncovered; for example, MODY2 is caused by a mutation in glucokinase, which causes defects
in pancreatic β cell insulin secretion in response to high glucose. Other types of MODY seem to
result from mutations in transcription factors involved in β cell development or function. Lastly,

3
latent autoimmune diabetes in adults (LADA) refers to the autoimmune-mediated β cell
destruction that occurs in adults, and hence is often misdiagnosed as T2D (4). An estimated 10%
of those diagnosed with T2D have this rare form of diabetes, and LADA patients often progress
to insulin treatment earlier than those with T2D.
The term ‘metabolic syndrome’ reflects the notion that insulin resistance, the core of
T2D, is associated with a wide array of other inter-related diseases. These dysfunctions include
obesity and liver diseases; as well as vascular disorders, for example coronary heart disease,
hypertension, and atherosclerosis (5-9). In addition, a number of diabetes-associated
complications manifest in diabetic patients, such as diabetic nephropathy, retinopathy, and
diabetic foot. The severity of insulin resistance in diabetic patients occurs in a continuum, and it
is now recognized that the condition of insulin resistance is associated with numerous adverse
metabolic changes in the body. Some common features associated with insulin resistance
include: glucose intolerance, elevated plasma triglyceride levels, reduced plasma high density
lipoprotein (HDL)-cholesterol concentrations, impaired endothelia functions, elevated blood
pressure, increased blood coagulation, and higher blood uric acid concentration.
Although various modern medical interventions have been developed for the treatment of
diabetes, it continues to spread at an alarming rate and is on the verge of becoming a global
pandemic, affecting over 371 million people worldwide (10). Moreover, it is estimated that
currently half of those affected remain undiagnosed, and diabetes is expected to impose
enormous health and socioeconomic burden in almost every single country. Hence, the journey
to find a cure for diabetes continues, and efforts are being made in multiple dimensions,
including the development of approaches in regenerative medicine, new types of insulin delivery

4
machineries, novel glucose-lowering agents, and further improvements of current therapies such
as the latest category of glucagon-like peptide-1 (GLP-1) based therapeutics.
1.1.2 Major metabolic hormones in glucose homeostasis
1.1.2.1 Hormones
The word “hormone” comes from the Greek word “horman” which means to “to set in
motion or to excite” (11). A hormone is defined as a substance that is secreted into the
bloodstream, and once it reaches its destination, it is able to regulate the activity of cells or
organs. A distinction must be made, however, between hormones and metabolites. Hormones are
regulators whose action affects changes in substances other than themselves, whereas a
metabolite is also able to regulate cellular activities, but the change occurs within the substance
itself. An example of a hormone is insulin; it is produced in the pancreas and travels through the
bloodstream to the muscle tissue where it stimulates glucose uptake. Glucose, on the other hand,
is a metabolite; it is produced in the liver and secreted into the bloodstream, and once it reaches
the muscle tissue, it is taken up by the muscle cells.
Hormones are produced by glands, which are organs that are able to produce
“secretions”, be it a hormone that enters the bloodstream (e.g. insulin), a juice that enters an
organ (e.g. gastric juice), or a substance that is released out of the body (e.g. sweat). There are
two major categories of glands: exocrine (secretions to be delivered out of the body) and
endocrine (secretions to be delivered to internal organs). The main endocrine organs in humans
are the pancreas, the pituitary gland, the thyroid gland, and the adrenal glands. In addition to

5
these glands, tissues such as the adipose tissue, the heart, the kidney, the skeletal muscle, the
brain, and the intestine are now being uncovered as “metabolic tissues”, referring to their ability
to produce and secrete hormones.
1.1.2.2 The pancreas and islets of Langerhans
The pancreas is a central organ in controlling glucose homeostasis. It is a tadpole-shaped
organ lying in between the stomach and the liver. As a polarized organ, the ‘head’ of the
pancreas points towards the body’s midline, while its ‘tail’ end points towards the left side of the
body. The pancreas is composed of both exocrine and endocrine tissues, where the exocrine
function consists of the secretion of digestive juices into the small intestine, and the endocrine
function consists of the secretion of an array of hormones. Exocrine cells make up almost 94% of
the pancreas, and produce a digestive juice containing amylase, lipase, trypsin, chymotrypsin and
other enzymes. This cocktail of digestive juices is secreted from the exocrine cells into small
ducts, which then join together to form the pancreatic duct. The pancreatic duct exits the
pancreas and is joined with the bile duct, with the other end entering the duodenum of the small
intestine. Hence, the pancreatic digestive juices are released into the duodenum together with the
bile salts, and together they aid in the neutralization of the acidic chyme and the breakdown of
proteins and lipids. Endocrine cells were discovered by the German medical student Paul
Langerhans in 1869 and were described as small “islands of cells” scattered among the exocrine
tissue; they are hence called “islets of Langerhans” (12), or are commonly referred as “islets”.
Although only representing a small percentage of the total pancreas mass, there are about one
million islets in the adult pancreas.

6
The cytoarchitecture of an islet is somewhat defined, and it has been recognized that
there are differences between species (13,14). In a rodent islet, the structural organization is
clearly distinguished by the periphery portion consisting of α cells, which secrete glucagon, and
the inner core, which is made up of β cells secreting insulin, δ cells secreting somatostatin, PP
cells secreting pancreatic polypeptide (PP), and ε cells secreting ghrelin. In human islets, the
organization is not as defined, with the α and the β cell types often intermingled with each other.
Each islet is surrounded by pancreatic arteries from which it receives blood supply, and by
pancreatic veins, which join the hepatic vein and thus act as a transport system for pancreatic
hormones to be delivered to the liver. Hence, the liver is the first organ to be exposed to the
pancreatic hormones, and this has important implications on the metabolic functions of the liver
(for details see Section 1.1.3).
1.1.2.3 Insulin
Insulin production
Insulin is a peptide hormone made up of two peptide chains: the α chain consisting of 21
amino acids, and the β chain, consisting of 30 amino acids. The two chains are held together via
two disulfide bonds, located at A-Cys7/B-Cys7 and A-Cys20/B-Cys19. The gene encoding insulin
in human is the INS gene, located on the q-arm of chromosome 11 (15). The first precursor,
preproinsulin, is translated from the mRNA transcript at the endoplasmic reticulum (ER)
membrane. A signal peptidase situated at the ER membrane removes the 24 amino acid signal
peptide, leading to the formation of proinsulin. Proinsulin then undergoes protein folding and
disulfide bond formation in the ER lumen, and is exported from the ER to the Golgi apparatus,

7
where it is packed into secretory granules and cleaved by the endopeptidases prohormone
convertase (PC) 2 and PC1/3. Cleavage by the last peptidase carboxypeptidase E (cpE) yields the
final mature insulin hormone, and in equimolar ratio the 31 amino acid active C-peptide
fragment. Several stressors, including oxidative stress, endoplasmic reticulum stress, and
amyloid protein formation, have been recognized as contributing factors to accelerated cell
death, leading to cell dysfunction and impaired insulin response in T2D (16-19).
Insulin secretion
Insulin secretion is tightly controlled by the metabolic or nutritional state of the body, and
the pancreatic β cells function as “glucose sensors”. The consensus model is that, when exposed
to high extracellular glucose concentrations, the β cell takes up glucose via glucose transporter
1/2 (GLUT1/2) transporters, and the glucose is converted into pyruvate through the glycolysis
pathway in the cytosol. The end product of glycolysis, pyruvate, enters the mitochondria and
undergoes the Citric Acid cycle, leading to the oxidation of glucose and the generation of energy
in the form of adenosine triphosphate (ATP) (20). The increase in ATP/ADP ratio results in the
closing of the ATP-sensitive KATP channel, cell membrane depolarization, and opening of the
voltage-gated Ca2+ channel (20). The resulting exocytosis of insulin-containing granules is
mediated by the intricate interplay between membrane-bound and membrane-associated
signaling proteins, ion channels, and the soluble N-ethylmaleimide-sensitive factor attachment
protein receptor (SNARE) protein machinery (21).
Multiple insulin secretory defects are present in T2D, including the loss of early-phase
insulin secretion, lower basal and stimulated plasma insulin concentrations, and progressive loss

8
of insulin secretory response over time (20). The exquisite control of insulin granule exocytosis
is mediated by a wide panel of transducer and adapter proteins, small GTPases and their
effectors, and cytoskeletal proteins (21-24). For example, depletion of Munc proteins that induce
the formation of SNARE complexes, or of Sec5, a downstream effector of Ral-GTPase, have
been shown to abrogate insulin granule mobilization in cells (25,26). It has also been reported
that intracellular compartmentalization, mediated by the coupling of SNARE proteins to lipid
rafts, and membrane lipid content, such as cholesterol levels, are involved in the regulation of
insulin secretion (27,28). Glucose is not the only stimulus for insulin secretion; other stimuli
include amino acids arginine (29) and leucine (30), acetylcholine (31), sulfonylurea (32),
cholecystokinin (CCK) (33), leptin (34), and the well-known insulin secretion inducer GLP-1
(35,36).
Insulin action
As a hormone, insulin circulates freely in the bloodstream, and it exerts its effect in the
target tissues through the activation of the insulin signaling pathway (Fig. 1.1). The insulin
signaling pathway is important for the regulation of a multitude of cellular activities, including
gene expression, protein synthesis, cell differentiation/growth/survival, fatty acid metabolism,
glycogen synthesis, and glucose uptake among many others. The insulin receptor (IR) tetramer
has two extracellular α subunits and two transmembrane β subunits. Upon the binding of insulin
to the α subunits, the resulting conformational change leads to the autophosphorylation of Tyr
residues of the β subunits. These phosphorylation events are sensed by the phosphotyrosine-
binding (PTB) domains of the adapter protein insulin receptor substrate (IRS), in turn resulting in
the phosphorylation of key Tyr residues of IRS proteins, and the activation of p110, the catalytic

Fig. 1.1 Insulin signaling pathway. An overview of major downstream pathways of insulin signaling. IR: insulin receptor; IRS: insulin receptor substrate; GLUT4: glucose transporter 4; Grb: growth factor receptor-bound protein; Shc: Src-homology containing protein; SOS: son-of-sevenless; PTP1B: protein tyrosine phosphatase-1B; PTEN: phosphatase and tensin homolog; SHIP: SH2 domain-containing inositol 5’-phosphatase PIP2: phosphatidylinositol (4,5) biphosphate; PIP3: phosphatidylinositol (3,4,5) trisphosphate; PP2A: protein phosphatase 2A; PDK1: pyruvate dehydrogenase lipoamide kinase isozyme 1 AS160: Akt substrate of 160kDa; GS: glycogen synthase; Erk: extracellular signal-regulated kinase; FOXO: forkhead class of transcription factors; Bad: B-cell lymphoma/leukemia 2 (Bcl-2)/Basal cell lymphoma-extra large (Bcl- xl)-associated death promoter ; PI3K: phoshoinositide 3-kinase; AKT/PKB: protein kinase B; mTOR: mammalian target of rapamycin; 4EBP1: eIF4E-binding protein 1; p70S6K: p70 ribosomal S6 kinase; Pak1: p21-activated protein kinase 1.
9
GLUT4 IR
Akt
PI3K Grb
PDK1
PTEN
SHIP1/2
Bad GSK-3
GS AS160
FOXO
Shc
TSC1 TSC2
mTOR
p70S6K 4EBP1
eIF4E
PP2A
Pak1
Ras
Raf
MEK
Erk
Insulin
GLUT4 vesicle
IRS SOS
FOXO
Gene transcription
Cytoplasm
Nucleus
PIP2
PIP3
P P
P P
PTP1B
Plasma membrane
Cell growth and proliferation Hepatic glucose production
Adipogenesis GLP-1 production
Glucose
Apoptosis
Glycogen synthesis
Protein synthesis
Glucose uptake
PDK1

10
subunit of phosphoinositide 3-kinase (PI3K). p110 then phosphorylates phosphatidylinositol
(4,5) bisphosphate (PIP2), leading to the formation of PIP3 and the activation of its downstream
effectors pyruvate dehydrogenase lipoamide kinase isozyme 1 (PDK1) and protein kinase B
(PKB) (also known as AKT). The insulin signaling cascade is both intricate and extensive and
regulates a vast number of pathways, including the mammalian target of rapamycin (mTOR)
pathway for protein synthesis, the glycogen synthase (GS) pathway for glycogen synthesis, the
forkhead box O (FOXO) pathway for gene transcription, the AS160/Rab pathway for GLUT4
translocation, and the mitogen-activated protein kinase (MAPK) pathway for regulating cell
growth and differentiation.
Insulin clearance
The IR-bound insulin is removed by receptor-mediated internalization. The mechanism is
reported to involve the insulin receptor kinase (IRK), a tyrosine kinase that is activated by insulin
binding (37). The insulin-IR-IRK complex is internalized into endosomes, followed by the
proteolytic degradation of insulin. This endosome trafficking process has been suggested to serve
two purposes: the clearance of insulin from circulation and the attenuation of insulin-mediated
signal transduction responses (38). Although the detailed mechanism for insulin clearance is not
completely understood, the liver is a major organ for insulin clearance. It is estimated that about
50-70% of the insulin reaching the liver is removed during its passage. Therefore, only a fraction
of the insulin reaches circulation, resulting in the “dampening” of the insulin effect (39). This is
another illustration of the importance of the liver in insulin signaling and glucose metabolism.

11
1.1.2.4 Glucagon
Glucagon production
Glucagon is generally viewed as the counter-regulatory hormone of insulin and is a single
polypeptide of 29 amino acids long. Glucagon is encoded by the proglucagon gene (gcg), located
on the q-arm of chromosome 2 (40). The mRNA transcript is translated into the 160 amino acid
prohormone proglucagon, which then undergoes tissue-specific post-translational cleavage to
give rise to different peptide hormones (for details see Section 1.2.1). Cleavage by PC2 gives
rise to glucagon in the pancreatic α cells (41), and cleavage by PC1/3 produces GLP-1 in the
intestinal L cells (42) and certain neurons in the hypothalamus and brainstem (43).
Regulation of glucagon production
Glucagon production, similar to that of insulin, is mainly controlled by circulating
glucose concentration, and its major action is to stimulate hepatic gluconeogenesis during the
fasting state (44). The release of glucagon is stimulated by hypoglycemia, epinephrine (45),
amino acids arginine (46) and alanine (47), acetylcholine (48), leptin (34), and CCK (49).
Suppressors of glucagon secretion include insulin (50), somatostatin (51), and increased levels of
free fatty acids (FFAs) (52). As in the case of insulin, a proportion of glucagon is removed as it
passes through the liver; it is estimated that the reduction is about 20% (53).

12
Glucagon action
Although the main action of glucagon is the stimulation of hepatic glucose production
(HGP) during hypoglycemia, glucagon exerts a number of physiological effects in other organs.
One of these effects is in the central nervous system (CNS), where central infusion of glucagon
lead to the activation of protein kinase A (PKA), which was associated with inhibition of hepatic
gluconeogenesis (54). Other effects include the control of energy expenditure, lipid metabolism,
and weight loss. Transient infusion of glucagon in humans has been demonstrated to increase
resting energy expenditure; the infusion also caused a rise in plasma glucose levels, which was
then abrogated by the infusion of GLP-1 due to its insulinotropic effect (55). The activation of
the glucagon receptor (GcgR) using GcgR agonists resulted in hyperglycemia, reduced body fat,
and lower plasma cholesterol (56). Injection of glucagon in humans also resulted in elevated
circulating levels of fibroblast growth factor 21 (FGF21) (56). FGF21 is a protein secreted from
liver, adipose tissue, and pancreas, and has been reported to exert beneficial effects in improving
insulin sensitivity, and lipid and energy metabolism (57). Acute infusion of glucagon in humans
was shown to lower hepatic lipoprotein particle production as well as inhibiting particle
clearance, but did not have an effect on intestinal lipoprotein metabolism (58). Lastly,
pharmaceutical dosages of glucagon administration in human subjects lead to the reduction of
motility in the small (59) and large intestine (60).
Hyperglucagonemia
Hyperglucagonemia is widely observed in both type 1 and type 2 diabetic patients. Due
to the inter-relational nature of glucagon and insulin, the challenge lies in dissecting their

13
individual effects. Animal studies have shown that β cell destruction leads to
hyperglucagonemia, as a result of the attenuated intra-islet suppression of glucagon secretion by
insulin (61). Long-term infusion of glucose in rats leads to the development of
hyperglucagonemia, which was found to precede the reduction of plasma insulin (62). The rise in
glucagon was accompanied by hyperglycemia and accelerated HGP, which are rescued by the
infusion of anti-glucagon antibodies (62). The detailed role of glucagon in the pathogenesis of
diabetes remains to be identified; however, it is apparent that overproduction of glucagon is a
central defect in diabetes and glucagon suppression may serve as potential therapies for the
treatment of diabetes (63).
1.1.2.5 Somatostatin
Somatostatin (SST) was discovered, isolated, and first characterized more than three
decades ago (64-66). SST is synthesized in two bioactive forms: the predominant but less
biologically active somatostatin-14 (SST-14), and the larger more potent somatostatin-28 (SST-
28) (67). The actions of SST are mediated through the binding to a family of somatostatin
receptors belonging to the G-protein coupled receptor (GPCR) superfamily. Six somatostatin
receptor (SSTR) subtypes have been identified and cloned, including sst1, sst2A and sst2B, sst3,
sst4, and sst5 (68). In the human intestine, all six SSTR subtypes are expressed, and the
implicated cellular signaling pathways modulated by SSTRs include cyclic adenosine
monophosphate (cAMP), K+, Ca2+, Na+, protein lipase C, cyclic guanosine monophosphate
(cGMP), protein tyrosine phosphatases, and MAPK (69).

14
SST and SSTRs have been detected in almost every single tissue and organ, and
reflecting this ubiquity, the functions of SST are extremely versatile. SST can function in the
dimensions of a neurohormone, a neurotransmitter, or an autocrine/paracrine hormone (70). The
main actions of SST can be classified into three major categories: in the central and peripheral
nervous systems, in the endocrine and exocrine systems, and in the proliferation and differential
of normal and tumor cells. Originally identified as a peptide produced in the hypothalamus that
inhibits the secretion of growth hormone and thyroid-stimulating hormone, the central actions of
SST have been well characterized. Furthermore, the endocrine and exocrine functions of SST
have been established, emphasizing its important role in nutrient and metabolism. SST inhibits
the secretion of insulin, glucagon, and PP in the endocrine pancreas, and the secretion of
bicarbonate and digestive enzymes in the exocrine pancreas. In the gastrointestinal (GI) tract,
SST inhibits the secretion of a multitude of peptide secretions including: gastrin, secretin,
cholecystokinin, vasoactive intestinal peptide, gastric inhibitory polypeptide, motilin,
enteroglucagon, and neurotensin (70). In addition to modulating pancreatic and GI secretions,
SST also regulates GI functions, such as inhibiting bowel motility, gastric emptying, GI transit,
and intestinal nutrient absorption.
In the recent years, SST analogs (SAs) have been and are actively being developed as
anti-proliferative agents for the treatment of various types of neuroendocrine tumors (71,72),
including insulinoma, pancreatic fistula, thymomas, and hepatocellular carcinoma. Other uses of
SAs include treatment for pancreatitis and acromegaly.

15
1.1.2.6 Pancreatic polypeptide
Originally isolated in 1968 during the preparation of insulin, PP is the founding member
of the 36 amino acid pancreatic polypeptide family (73,74); the other two members are peptide
YY (PYY) and neuropeptide Y (NPY). PP is released from pancreatic PP-cells and gut endocrine
cells in response to food ingestion. The secretion of PP occurs in a biphasic manner, with the
first phase resulting from vagal stimulation and the second prolonged phase resulting from
hormonal stimulation (75). Elevated PP levels can remain up to 6 h postprandially (76).
PP is part of the gut-brain axis, referring to the bidirectional communication between the
gut and the brain, and is importantly involved in appetite control and food intake. Transgenic
overexpression of PP in murine pancreatic islets led to reduced food intake, which is abolished
by the administration of anti-PP antiserum (77). Peripheral administration of PP in mice led to
acute reduction of food intake and gastric emptying, and prolonged administration resulted in
attenuated body weight gain and energy expenditure (78). PP-overexpressing mice exhibited the
lean phenotype with lower food intake and gastric emptying rate (79). In the leptin-deficient
Lepob/ob (ob/ob) mouse model, repeated intraperitoneal PP injection attenuated body weight gain
and ameliorates insulin resistance and hyperlipidemia (78). In humans, some reports have
suggested that PP levels are lower in obese subjects (80,81), and peripheral PP administration
reduced food intake and gastric emptying (82,83). Intravenous infusion of PP in healthy lean
volunteers resulted in reduced appetite and decreased energy intake, where the inhibition of
energy intake sustained for up to 12 h (76).
The action of PP is implicated to be mediated by the Y4 receptor (Y4R), a subtype of the
NPY receptor family, in the brainstem and hypothalamus. The involvement of the vagus nerve is
demonstrated by the lack of PP anorectic effects following vagotomy in rodents (78). Y4R is

16
expressed in multiple neural centers in the brain, including AP, NTS, DVN, ARC, and PVN (84),
and the major site of PP action is suggested to be the brainstem. Despite the clear appetite-
suppressing role of exogenous PP administration in rodents and humans, central administration
of PP stimulates food intake (85), suggesting that its physiological actions are dependent on the
route of administration. This may occur due to the different distribution of receptor or activation
sites, although the exact mechanisms remain undetermined. Although mechanistically PP could
be a potential target for anti-obesity drugs, it is rapidly degraded in the circulation; however, the
development of Y4 agonists may provide a potential avenue in treating obesity.
1.1.2.7 Leptin
Leptin is a 16 kDa hormone synthesized in adipose tissues, and it controls various
metabolic processes and physiological behaviors, such as appetite regulation, body weight loss,
neuroendocrine functions, and glycemia. Leptin is produced proportionally to the amount of
adipose tissue in the body, and its effects are mediated through leptin receptors (LEP-Rs, also
known as Ob-Rs) expressed in the central nervous system (86,87). The hypothalamus is a key
site in the brain for the actions of insulin and leptin in regulating energy homeostasis, where their
actions are mediated via the NPY and agouti-related peptide (AgRP) expressing neurons.
Neuronal insulin resistance was demonstrated to lead to impaired leptin-mediated regulation of
neuronal signaling and gene expression and hence central lepin resistance (88).
A multitude of preclinical studies have reported the anti-obesity action of leptin (89).
Daily injection of recombinant leptin into healthy mice resulted in reduced caloric intake,
increased energy expenditure, and almost complete elimination of adipose tissue (90). However,

17
these beneficial effects were not observed in the initial clinical trials, where leptin therapy was
only effective in treating obese individuals who also suffered from congenital leptin deficiency
(91,92). Furthermore, the potential to develop leptin into an anti-obesity drug was halted by
observations of leptin resistance, where obese patients have elevated leptin levels are resistant to
exogenously administered leptin (93,94).
Nonetheless, leptin has multiple beneficial effects that have been confirmed in animal
models and human subjects. In mouse models of T1D, leptin treatment ameliorated the
deleterious effects of insulin deficiency (95,96), and leptin therapy along with insulin improved
insulin sensitivity in T1D patients (97), revealing the anti-diabetic potential of leptin in T1D. In
the T2D setting, leptin administration has been shown to improve insulin resistance as well as
glucose and lipid imbalances in mouse models (98-101). On the other hand, leptin clinical trials
indicated that leptin therapy is only marginally effective in improving diabetes and insulin
resistance in obese individuals (102,103). However, this does not preclude the potential use of
leptin in other types of T2D patients, for example lean T2D subjects.
Leptin administration was also shown to correct insulin resistance and hyperglycemia in
the context of lipodystrophy in mice (104), and this was recapitulated in humans where leptin
treatment improved insulin resistance, hyperglycemia, and hypertriglyceridemia in patients
suffering from severe hypoleptinaemia and lipodystrophy (105,106). Due to the heterogeneous
nature of lipodystrophy, not all patients have extremely low leptin levels. Furthermore, leptin
therapy did not improve glycemia in lipodystrophic individuals with moderately low leptin levels
(107), thus posing a limitation on the potential of leptin therapy in the context of lipodystrophy.
The remarkable effectiveness of leptin in improving glucose and lipid profiles have been
observed in select T1D and T2D animal models and certain T2D patients, as well as in

18
lipodystrophy patients, which are a small subgroup of T2D patients. Despite these promising
findings, several potential pitfalls must be overcome before leptin therapy becomes an anti-
diabetic treatment option. For example, it has been demonstrated that leptin administration
increases arterial pressure (108), thereby posing a risk of worsening the hypertension that is
commonly observed in T2D patients. As leptin is known to stimulate PI3K, a major regulator of
cell proliferation, its potential tumor-inducing effects must not be overlooked (109). Lastly, the
pervasiveness of leptin resistance in T2D individuals, leading to hyperleptinemia, renders these
subjects unsuitable for leptin therapy. Despite these challenges, leptin could still prove itself
useful in the treatment of targeted populations of patients, for example once its beneficial effects
can be ascertained in non-obese, leptin-sensitive T2D patients.
1.1.3 The liver as a central organ in glucose homeostasis
The liver lies beneath the diaphragm, and is supplied from below with blood from two
major vessels: the hepatic artery (supplying about 20% of the blood) and the hepatic portal vein
(supplying about 80% of the blood). The hepatic portal vein carries blood that has passed
through the intestinal tract, and is formed by further joining the veins from the stomach, the
spleen, and the pancreas. The hepatic portal vein is rich in monosaccharides and amino acids
absorbed from the intestine, and it also receives pancreatic hormones such as insulin and
glucagon. Blood leaves the liver through the hepatic veins, which enter the inferior vena cava,
the main blood vessel returning blood from the lower parts of the body towards the heart.
The majority of the liver (about 80% by mass) is composed of one cell type: hepatocytes.
In a liver cross-section, the hepatocytes form lobules, which appear as hexagonal units in a

19
stacked formation. At each corner of the hexagon there is a triad of three vessels: branches of the
hepatic portal vein, the hepatic artery, and the bile duct. Blood flows from the hepatic portal vein
and the hepatic artery into tiny passages called sinusoids, the equivalent of capillaries in other
tissues. The sinusoids lead to the branch of the hepatic vein located at the center of the hexagon,
and is redirected back to the heart. From the center, individual hepatocytes radiate out from the
hepatic vein, where their specific arrangement reflects metabolic zonation. The hepatocytes on
the outside of each lobule (periportal hepatocytes) are exposed to incoming blood from the
hepatic portal vein and hepatic artery, and hence are well-oxygenated and rich in nutrients;
therefore, the synthesis of glucose (gluconeogenesis) predominates. The cells near the center of
each lobule (perivenous hepatocytes) are located near the hepatic vein and are mainly the site of
glycolysis. Despite the zonation, each hepatocyte is able to perform either function, depending
on varying physiological conditions. The biochemical processes of glucose metabolism under
fasting and fed conditions that occur in the liver are outlined in the sections below.
1.1.3.1 Glycogenolysis and glycogenesis
Glycogenolysis
Glycogenolysis is the process by which liver metabolizes stored glycogen into glucose, to
be released into the bloodstream under fasting condition. Figure 1.2 illustrates the biochemical
reactions of glycogenolysis. Glycogenolysis is stimulated by glucagon, acting through the
cAMP-PKA pathway. PKA phosphorylates phosphorylase kinase (PK), converting it from the
inactive (PKb) to the active form (PKa). Active PKa then phosphorylates and activates glycogen
phosphorylase (GP), converting it from the inactive form (GPb) to the active form (GPa). GPa

Fig. 1.2 Glycogenolysis and glycogenesis. Glycogenolysis is stimulated by glucagon, acting through the cAMP-PKA pathway. PKA phosphorylates PK, converting it from the inactive (PKb) to the active form (PKa). Active PKa then phosphorylates and activates GP, converting it from the inactive form (GPb) to the active form (GPa). GPa subsequently catalyzes the release of one G1P unit from an existing glycogen chain (Glycogenn). G1P is converted to G6P and then to glucose, which is then released into the bloodstream via GLUT2. Glycogenolysis is inhibited by insulin, where insulin stimulates PP1, which converts the active GPa to inactive GPb via dephosphorylation. Glycogenesis is the formation of glycogen under fed conditions. Glucose is converted to G6P and subsequently to G1P, which is assembled onto an existing glycogen chain (Glycogenn-1) by active GSa. Glycogenesis is mainly controlled by the phosphorylation-mediated regulation of GS. GSK3 phosphorylates the active GSa and converts it to the inactive form GSb. Insulin signaling leads to the inactivation of GSK3 and activation of PP1, thereby promoting the formation of active GSa. PK, phosphorylase kinase; GP, glycogen phosphorylase; G1P, glucose-1-phosphate; G6P, glucose-6-phosphate; PP1, protein phosphatase-1; GS, glycogen synthase; GSK3, glycogen synthase kinase-3.
GPb
GPa
GSa
GSb
PKa PP1
G6P
Glycogenn
PKb P
GLYCOGENESIS
GLYCOGENOLYSIS
Glycogenn-1
Glucose
G1P +
PKA
= Phosphorylation
Blood Hepatocyte
GLUT2 Glucose
+ Insulin
+ Glucagon
+ Insulin
GSK3 PP1
20
GSK3
+ Insulin
P
P
P
P

21
subsequently catalyzes the release of one glucose-1-phosphate (G1P) unit from an existing
glycogen chain (Glycogenn). G1P is converted to glucose-6-phosphate (G6P) and then to
glucose, which is then released into the bloodstream via GLUT2. Glycogenolysis is inhibited by
insulin, where insulin stimulates protein phosphatase-1 (PP1), which converts the active GPa to
inactive GPb via dephosphorylation.
Glycogenesis
Upon exposure to high glucose concentrations under fed conditions, the hepatocytes take
up the glucose via the GLUT2 transporter and use them for glycogen synthesis, a process also
called glycogenesis. Figure 1.2 illustrates the biochemical pathway of glycogenesis. Glucose is
converted to G6P and subsequently to G1P, which is assembled onto an existing glycogen chain
(Glycogenn-1) by active glycogen synthase (GSa). Glycogenesis is mainly controlled by the
phosphorylation-mediated regulation of GS. Glycogen synthase kinase-3 (GSK3) phosphorylates
the active GSa and converts it to the inactive form GSb. Insulin signaling leads to the
phosphorylation and hence inactivation of GSK3, and therefore promotes the formation of active
GSa. In addition, insulin activates PP1 and induces the conversion of inactive GSb into active
GSa via phosphorylation.

22
1.1.3.2 Glycolysis and gluconeogenesis
Glycolysis
The pathways of glycolysis and gluconeogenesis (GNG) catalyze opposite functions, and
conditions that favor the one will suppress the other. Glycolysis is stimulated by starving
conditions, whereas GNG is induced by fed conditions. Figure 1.3 illustrates the biochemical
reactions of glycolysis, where the three enzymes that differ for glycolysis (GK, PFK, PK) listed
at their corresponding steps. Glycolysis is the sequential conversion of glucose to pyruvate.
Glucose is converted to G6P by glucokinase (GK), which is then formed into fructose-6-
phosphate (F6P). Phosphofructokinase (PFK) then converts F6P to fructose-1.6-bisphosphate (F-
1,6-P2), which through the intermediaries glyceraldehyde-3-phosphate (Glyc-3-P) and
phosphoenolpyruvate (PEP), eventually forms pyruvate by the action of pyruvate kinase (PyrK).
Insulin positively regulates the gene expression of GK and PyrK, whereas glucagon suppresses
gene expression of PyrK. Insulin also regulates via allosteric mechanisms, and stimulates PFK
activation.
Gluconeogenesis
In addition to glycogenesis, another mechanism by which the body can produce glucose
under fasting condition is GNG, which is the formation of glucose from non-carbohydrate
substrates. In mammals, GNG is found predominantly in the liver, although to a lesser extent it
also occurs in the kidney and intestine (110). The amino acids alanine, glycine, threonine,
cysteine, serine, arginine, proline, histidine, glutamine, methionine, valine, asparagine, and
aspartate are referred to as ‘glucogenic’ amino acids, based on their ability to enter GNG once

Fig. 1.3 Glycolysis and gluconeogenesis Glycolysis is the sequential conversion of glucose to pyruvate. Glucose is converted to G6P by GK, which is then formed into F6P. PFK then converts F6P to F-1,6-P2, which through the intermediaries Glyc-3-P and PEP, eventually forms pyruvate by the action of PK. Insulin positively regulates the gene expression of GK and PK, whereas glucagon suppresses gene expression of PK. Insulin also regulates via allosteric mechanisms, and stimulates PFK activation. GNG utilizes lactate as its main substrate. LDH converts lactate to pyruvate, which enters the mitochondrial matrix, which is then converted to OAA by PC. OAA is decarboxylated and phosphorylated to PEP by PEPCK. PEP is converted to Glyc-3-P, then to F-1,6-P2, and subsequently to F6P by FBP. F6P is converted to G6P and subsequently to glucose by G6ph. Long-term regulation of the gene encoding PEPCK is mediated by the suppressive effect of insulin and the inductive effect of glucagon. PEP is subsequently converted to F6P through multiple steps, and F6P is converted to G6P by glucose-6-phosphatase. Similarly, insulin suppresses, while glucagon stimulates, the gene expression of G6ph. GK, glucokinase; F6P, fructose-6-phosphate; PFK, phosphofructokinase; F-1,6-P2, fructose-1,6-bisphosphate; Glyc-3-P; glyceraldehyde-3-phosphate; PEP, phosphoenolpyruvate; PyrK, pyruvate kinase. LDH, lactate dehydrogenase; OAA, oxaloacetate; PC, pyruvate carboxylase; PEPCK, phosphoenolpyruvate carboxykinase; F-1,6-P2, fructose-1,6-bisphophate; FBP, fructose-1,6-bisphosphatase; G6ph, glucose-6-phosphatase.
Glucose
G6P
F6P
F-1,6-P2
Glyc-3-P
PEP
OAA
Mitochondria
OAA
GLYCOLYS I S
GLUCONEOGENES I S
GK
PFK
Pyruvate PyrK
DHAP
PC
PEPCK
G6ph
FBP
+ Insulin
+ Insulin - Glucagon
+ Insulin
- Insulin + Glucagon
+ Glucagon - Insulin
Pyruvate
Lactate
LDH
Pyruvate
23

24
they are catabolized. The remaining two amino acids, leucine and lysine, cannot be utilized as
GNG substrates. In humans, the main precursors utilized for GNG are lactate, glycerol (from the
breakdown of triacylglycerol, TAG), alanine, and glutamine (111).
The majority of the biochemical reactions of GNG are those of glycolysis reversed.
Figure 1.3 illustrates the biochemical pathway of GNG, where the four enzymes that differ from
glycolysis (PC, PEPCK, FBP, G6ph) are listed at their corresponding steps. GNG begins in the
mitochondrial matrix with the formation of oxaloacetate (OAA) from pyruvate by pyruvate
carboxylase (PC). OAA is then decarboxylated and phosphorylated to phosphoenolpyruvate
(PEP) by phosphosenolpyruvate carboxykinase (PEPCK). PEP is converted to Glyc-3-P, F-1.6-
P2, and then to F6P by fructose-1,6-biphosphatase (FBP). F6P is converted to G6P and
subsequently to glucose by glucose-6-phosphatase (G6Ph). Long-term control of the expression
of Pck gene (the gene encoding PEPCK) is mediated by the suppressive effect of insulin and the
inductive effect of glucagon. Similarly, insulin suppresses, while glucagon stimulates, the gene
expression of G6pc (the gene encoding G6ph).
1.2 The incretin hormone glucagon-like peptide 1
1.2.1 Proglucagon gene, GLP-1 production and degradation
In 1902, two English physiologists, Sir William Maddock Bayliss and Ernest Henry Starling,
speculated that after ingesting carbohydrates, the intestinal mucosa produces a hormone which
travels to and stimulates endocrine secretions from the pancreas (112). They named these ‘gut
factors’ with the term ‘secretin’ (112). In 1930, several scientists proposed the terms ‘incretin’

25
and ‘enterogastrone’, referring to a hormonal extract from the duodenum (113). Half a century
later, interests were sparked with the discovery of the glucose-lowering effect of the incretin
hormone glucose-dependent insulinotropic peptide (GIP) (114-116) and after the identification of
the second incretin hormone, glucagon-like peptide 1 (GLP-1) (117,118). The incretin effect is
defined as the amplification of pancreatic insulin secretion in response to orally ingested glucose,
compared to intravenous glucose given at the same amount. Decades of research have yielded a
substantial body of knowledge of the two incretin hormones, in particular of GLP-1.
GLP-1 is a peptide hormone produced in the L cells of the intestinal epithelium. GLP-1 is
produced in all regions of the small intestine and colon, although the highest level of expression
is localized to the distal ileum and colon (119). GLP-1 is encoded by the proglucagon gene (gcg),
which among others also encodes glucagon produced in the pancreatic α-cells, as well as GLP-2,
a gut growth factor (120). Fig. 1.4A illustrates the overall structure of the proglucagon peptide
and the cleavage sites by the preprohormone convertases 2 and 1/3 (PC2 and PC1/3). The
proglucagon undergoes post-translational splicing in tissue-specific manners, leading to unique
expression profiles of proglucagon derived peptides (PGDPs) in different organs or cell types. In
pancreatic α-cells, the main products are glucagon, glicentin-related pancreatic polypeptide
(GRPP), intervening peptide-1 (IP1) and major proglucagon fragment (MPGF) (Fig. 1.4B).
Although uncommon, under certain scenarios such as during embryonic development or when
islets encounter stress, low levels of GLP-1 can be detected in pancreatic α-cells. In intestinal L
cells and certain neuronal cells in the brain, GLP-1 is liberated by PC1/3-mediated cleavage of
the precursor proglucagon (Fig. 1.4B). In addition to GLP-1, other products glicentin, GLP-2,
intervening peptide-2 (IP2), GRPP and oxyntomodulin are also produced in the intestine and
brain.

Fig. 1.4 Proglucagon and proglucagon derived peptides (PGDPs). A) Proglucagon, encoded by the gcg gene, is a pro-hormone with 160 amino acid residues. The peptide contains both PC2 and PC3 cleavage sites. The amino acid sequences of the cleavage sites are as indicated, bold letters represent amino acids adjacent to the cleavage sites. B) Schematic presentation of the cleavage products in pancreas (top) and intestine/brain (bottom). Although GLP-1 is not normally produced in the pancreas, during the embryonic stage or when islets are under stress, some pancreatic α-cell will produce GLP-1. In the intestine and brain, GLP-1 is a 31 amino acid peptide, with the amino acid sequence as indicated. PC2 and PC1/3, preprohormone convertases 2 and 1/3; GRPP, glycentin related polypeptide; IP1 and IP2, intervening peptide 1 and 2; MPGF, major proglucagon fragment. GLP-2, glucagon-like peptide 2.
GRPP Glucagon IP1 MPGF
1 30 33 61 64 69 72 158
Glicentin
Oxyntomodulin
GLP-1
IP2 GLP-2
1
33
69
78 107
111 122 126 158
69
Pancreas:
Intestine and brain:
GRPP
1 30
GLP-1
78 107
HAEGT FTSDV SSYLE GQAAK EPIAW LVKGR G
N C Glucagon IP1 GLP-1 GLP-2 IP2 GRPP
1 30 33 61 64 69 78 107 111 122 126 158 160
EDKRHS NTKRNR IAKRH RGRRDF LGRRHA ERHA TDRK
PC2 PC2 PC2 PC1/3 PC1/3 PC1/3 PC1/3
A
B
Proglucagon peptide:
26

27
Fig. 1.5 depicts the four currently identified and biologically active GLP-1 derivatives. GLP-1(7-
37) and GLP-1(7-36) amide are the two main biologically active forms of GLP-1 in circulation. A
recently identified short form, GLP-1(9-36) amide, was initially presumed to be an inactive
degradation product, but has recently been demonstrated to exert protective effects in the heart
(121-126). A nonapeptide, GLP-1(28-36) amide, has also been identified and demonstrated to exert
metabolic functions as reported by a few studies (127,128).
The identification and study of the metabolic functions of the incretin hormones such as GIP
and GLP-1 led to the coinage of the term “enteroinsular axis”, referring to the connection
between the gut and pancreatic islets (129). Oral nutrient ingestion is a potent stimulus of GLP-1
secretion, and all the macronutrients (carbohydrates, fat, and protein) of a mixed meal contribute
to GLP-1 secretion (130). Although both GIP and GLP-1 can elicit the incretin effect, the
circulating levels of GLP-1 after a meal are much lower than those of GIP, and hence GLP-1 is a
more potent stimulator of insulin secretion (131). A biphasic rise in postprandial plasma GLP-1
is observed in humans, peaking first at 15-20 min and then at 1-2 h (132,133). The half-life of
GLP-1 in circulation is only a few minutes, due to the rapid cleavage by the enzyme dipeptidyl
peptidase IV (DPP-IV), thus limiting its direct use as clinical therapeutic agents. However, two
new categories of T2D drugs have been developed based on established knowledge of the
incretin hormone GLP-1. One category is the GLP-1 analogs, such as the injectable Exenatide (a
synthetic form of Ex-4, marketed as Byetta®), and the second category is DPP-IV inhibitors,
such as Sitagliptin (Januvia®) (134). Table 1 lists one example from each of the two categories
of GLP-1 based therapeutics (135).

Fig. 1.5 GLP-1 and its derivatives. Amino acid sequences of the four currently identified GLP-1 derivatives. GLP-1 is a 31 amino acid peptide, numbered aa 78-107 of the proglucagon prohormone, but more commonly referred as aa 7-37 based on numbering of the MPFG fragment. The cleavage sites of DPP-IV and NEP24.11 are as indicated, where DPP-IV generates the GLP-19-36 amide while NEP24.11 produces the nonapeptide GLP-128-36 amide. MPFG, major proglucagon fragment; DPP-IV, dipeptidyl peptidase-4; NEP 24.11, neutral endopeptidase 24.11.
HAEGT FTSDV SSYLE GQAAK EFIAW LVKGR G
HAEGT FTSDV SSYLE GQAAK EFIAW LVKGR
EGT FTSDV SSYLE GQAAK EFIAW LVKGR
FIAW LVKGR
NH2
NH2
NH2
DPP-IV NEP24.11
GLP-17-36 amide
GLP-17-37
GLP-19-36 amide
GLP-128-36 amide
28

29
Table 1 Examples from the two categories of GLP-1 based therapeutics.
Category Generic name (Brand) Dosage Adverse reactions
GLP-1 Analogs Exenatide (Byetta®)
Adults: 5mcg SQ, 60
min before am & pm meals.
Nausea, vomiting, diarrhea, feeling jittery, dizziness, headache, dyspepsia, injection-site reactions, dysgeusia, somnolence, generalized pruritus and/or urticarial, macular or popular rash, angioedema, rare reports of anaphylactic reaction, abdominal pain, hypoglycemia.
DPP-IV inhibitor
Sitagliptin phosphate (Januvia®)
Adults: 100mg qd.
(Monotherapy/Combination therapy): Upper respiratory tract infection, nasopharyngitis, headache. (Combination therapy): Hypoglycemia.

30
1.2.2 Mechanisms underlying proglucagon gene expression
Overview of proglucagon gene transcriptional regulation
In the early 1980s, gcg was first identified based on cDNA sequences from rodents and
humans (117,136-138). Gcg transcription is regulated by multiple signaling cascades and
components, including homeobox domain proteins, Wnt signaling effectors, as well as
downstream targets of cAMP and insulin signaling. Notably, these signaling pathways intertwine
and crosstalk with each other, and together they provide sophisticated, tissue- or cell-type
specific transcriptional regulation of gcg expression.
A schematic of the cis- and trans-elements involved in the regulation of gcg expression
are presented in Fig. 1.6. The promoter region of gcg contains multiple cis-elements: G1, G2,
G3, G4, and G5 enhancer elements, a cAMP response element (CRE), and a GATA box. The
homeobox domain (HD) proteins, including Isl1, Pax-2, Pax-6, Cdx-2, Brn-4, and Pbx have been
shown to bind to G1and G3. Components of the cAMP signaling cascade, including cAMP and
cAMP response element binding protein (CREB), as well as Ca2+ and Activated transcription
factor 3 (ATF3), bind to the CREs located at the distal gcg promoter and within G2. In
pancreatic α cells, insulin was shown to bind to G3 and suppress gcg expression. In the
hypothalamic gcg-expressing cell line mHypoE-20/2, insulin and leptin were reported to
stimulate gcg expression (139). Our laboratory further demonstrated that in intestinal L cells but
not in pancreatic α cells, the Wnt effectors β-cat/TCF bind to G2 and are positive regulators of
gcg expression.

Fig. 1.6 Cis- and trans-elements involved in the regulation of gcg promoter activity. Gcg contains five enhancer elements (G1-G5). The homeodomain box proteins Pax bind to the G1 and G3. Cdx-2, Pbx, Isl-1, and Brn-4 bind to G1. The Wnt bipartite transcription factor β-cat/TCF, cAMP, calcium, and ATF3 bind to G2. Insulin was found to bind to G3 and suppress gcg expression in pancreatic α cells. Gcg contains two CREs, one at the distal promoter and one located within G2. The distal gcg promoter contains a GATA-binding motif.
31
CRE G4 G1 G5 G3 GATA
Insulin
β-cat/TCF
cAMP
Cdx-2
Isl-1
Brn-4
Pax Pax CREB
gcg
Pbx
Ca2+
ATF3
G2

32
In the gut, the regulation of gcg expression by G-protein coupled receptor signaling,
insulin/IGF-1 signaling, and Wnt signaling, as well as their crosstalk with each other, is
illustrated in Fig. 1.7. The cAMP-PKA cascade, activated in response to stimulation of GPCR or
cAMP promoting agents such as forskolin, leads to CREB binding to the CRE at the distal
promoter region. Insulin signaling activates PI3K, which crosstalks with both the cAMP-PKA as
well as the Wnt signaling pathway to regulate gcg transcription. Insulin also exerts its effect
through the Epac pathway. The crosstalk between insulin and Wnt signaling involves the
participation of the key Wnt effector β-cat; however, the detailed mechanism is not known. The
β-cat/TCF bipartite transcription factor binds to the G2 enhancer element of proximal gcg
promoter and induces gcg expression. Lastly, activation of Wnt signaling, either through Wnt
ligand binding or treatment with lithium chloride (LiCl), leads to the stimulation of gcg
expression.
Homeobox domain proteins
HD proteins are DNA-binding proteins that play important roles in the patterning of
developmental processes. They were first discovered in Drosophila melanogaster to regulate
homeotic genes, from which the name originates. To date, HD proteins are defined as possessing
the HD motif, a conserved sequence of about 180 base pairs long, and are mostly classified as
transcription factors. About a dozen HD proteins were found to be expressed in pancreatic α cells
and/or intestinal L cells, including Insulin gene enhancer protein-1 (Isl-1), Paired box (Pax)
proteins, Caudal type homeobox-2 (Cdx-2), Brain-4 (Brn4), Pre-B cell leukemia transcription
factor (Pbx) proteins, and members of the Nkx family.

Fig. 1.7 Transcriptional regulation of the proglucagon gene. Cell signaling cascades crosstalk with each other in regulating gcg expression. The cAMP-PKA cascade, activated in response to stimulation of GPCR or cAMP promoting agents such as forskolin, leads to CREB binding to the CRE at the distal promoter region. Insulin signaling activates PI3K, which crosstalks with both the cAMP-PKA as well as the Wnt signaling pathway to regulate gcg transcription. Insulin also exerts its effect through the Epac pathway. The crosstalk between insulin and Wnt signaling occurs through the participation of the key Wnt effector β-cat. The β-cat/TCF bipartite transcription factor binds to the G2 enhancer element of proximal gcg promoter and induces gcg expression. Lastly, activation of Wnt signaling, either through Wnt ligand binding or treatment with lithium chloride (LiCl), leads to the stimulation of gcg expression.
GPCR RTK 7-TMR
cAMP
PKA
PI3K GSK3β
β-cat
CREB TCF
CRE G2
Peptide hormones Insulin/IGF-1 Wnt
β-cat
Epac
Transcription factors
LiCl
Forskolin
?
gcg
?
33

34
Isl-1 is expressed in all pancreatic cell types that are hormone-producing, and it regulates
the transcription of the insulin, gcg, and somatostatin genes (140-143). Isl-1 was found to
mediate the activation of gcg transcription in the pancreatic α cell line InR1-G9, where it binds to
TAAT-rich motifs of the G1 enhancer element (142). Disruption of Isl-1 in mice led to arrested
embryonic development, accompanied by the complete lack of pancreatic endocrine cells (144).
Pax-2 binds to G3 and G1 enhancer elements of the gcg promoter and activates gcg
transcription in vitro (145), although this binding was not observed in rodent pancreas and
intestinal tissues (146). The transgenic Pax-2 (1Neu) mice have normal islet α cells and intestinal
L cells, and no change in pancreatic and intestinal gcg expression (146), while another study
indicates that these mice have enlarged pancreas volume, without affecting pancreatic insulin
and glucagon content (145). Pax-6 plays an important role in islet cell development (147), and is
expressed in the epithelium of pancreatic buds during development. Over-expression of Pax-6
stimulates gcg expression in intestinal endocrine L cells through its binding to G3 (Fig. 1.6A)
(148), and Pax-6 and Cdx-2 have additive effects in stimulating gcg promoter activity (149). The
Sey-/- mice, which carry a spontaneous mutation in the Pax6 gene, have abnormal islet
organization, less α, β, δ and PP cells, accompanied by reduced insulin and glucagon production
(150).
Cdx-2 is a caudal-like HD protein, and is expressed in the pancreatic α cell line InR1-G9,
and the intestinal GLUTag and STC-1 cell lines, and in mouse pancreas (151). Cdx-2 binds to
two AT-rich motifs within the G1 enhancer element of the gcg promoter. Co-transfection of
Cdx-2 stimulates gcg promoter expression, while mutating the Cdx-2 binding sites abolishes this
stimulation. Over-expression of Cdx-2 leads to increased gcg mRNA production in InR1-G9
(152). Two alternatively spliced isoforms of Cdx-2 exist in InR1-G9, with the longer form being
the main stimulator of gcg expression (153). Cdx2-/- mice die as embryonic lethals, due to the

35
critical role of Cdx-2 in embryo implantation, and they exhibit multiple developmental
abnormalities despite having normal pancreas development (154). Cdx-2 regulates its own
transcription by binding to two AT-rich motifs within the proximal Cdx-2 promoter region, and
based on this auto-regulatory mechanism it has been suggested that having one copy of the
functional Cdx-2 allele is sufficient in maintaining normal development of pancreatic and
intestinal gcg -expressing cells (155).
Brn-4, also referred to as POU class 3 homeobox 4 (POU3F4), is expressed in pancreatic
α cells but not β cells, and is an α cell specific transcription factor. Brn-4 stimulates gcg
expression in pancreatic α cells (156), while induced expression in the pancreatic β cell line Ins-1
led to detectable glucagon levels (157). Furthermore, expression of Brn-4 using the β cell
specific Pdx-1 promoter resulted in ectopic gcg expression in these insulin-expressing β cells,
confirming the role of Brn-4 as a key controller of the pancreatic α cell lineage. Despite this,
Brn-4-/- mice display normal pancreatic bud formation, gcg -expressing cell numbers, and other
physiological parameters (158). Brn-4 binds to motifs within the G1 enhancer element of the gcg
promoter, and Brn-4 acts in a synergistic manner with Cdx-2 in stimulating gcg expression (159).
Pbx proteins were originally identified as Hox cofactors, as part of transcriptional
complexes that regulate developmental programming. Pbx expression has been detected in
embryonic pancreas, as well as in all four pancreatic hormone-producing cell types and acinar
and ductal cells of adult mouse pancreas. Pbx-1 was shown to interact with Cdx-2 through a
penta-peptide motif within Cdx-2, and co-transfection of Pbx-1 with Cdx-2 stimulated the
activation of the gcg promoter by Cdx-2. When the penta-peptide motif is mutated, Cdx-2
stimulated gcg promoter expression was attenuated (160). Pbx-1-/- mice die prior to birth, with
noticeable defects in the pancreatic endocrine and exocrine cells (161). These mice also

36
exhibited abnormalities in pancreas development, accompanied by islet malformation and
hyperinsulinemia, suggesting its critical role in the growth of pancreatic cells and pancreas organ
development (161).
The Nkx family of transcription factors consists of eleven members. The two members
Nkx2.2 and Nkx6.1 were originally identified as regulators of neural patterning and organ
development, and subsequently were found to be involved in pancreas development, islet cell
specification and differentiation, and maintaining proper β cell function. Nkx2.2 is expressed in
early pancreatic progenitors as early as e9.5 (162), and is then limited to pancreatic β cells and a
subset of α cells and PP cells (163). Nkx2.2-/- mice have defects in pancreatic α and β cell
differentiation (162,163), and they die shortly after birth, and thus the role of Nkx2.2 in mature β
cells remains unknown. Nkx2.2 is suggested to function as a transcriptional repressor during
endocrine cell differentiation, as a dominant Nkx2.2 repressor derivative can rescue the
specification of α and β cells during embryogenesis in the absence of endogenous Nkx2.2
(164,165). Nkx6.1 is implicated to regulate β cell proliferation and thereby maintaining β cell
mass (166). Nkx6.1 has been reported to bind to the gcg promoter and repress gcg mRNA
production (167). Adenovirus-mediated over-expression of Nkx6.1 increases β cell mass in
isolated human and rat islets, whereas knockdown of Nkx6.1 using siRNA method led to the
opposite effect (168). In Nkx6.1-/- mice, expression of Nkx6.1 transgenes in select progenitor cell
populations rescued the formation and maturation of insulin-producing β cells (169). However,
transgenic mice over-expressing β cells specific Nkx6.1, using an inducible Cre-recombinase-
based system, failed to exhibit enhanced β cell proliferation, β cell mass, and glucose metabolism
(170). Nkx6.1-/-;Nkx2.2-/- double knockout mice exhibit similar phenotypes as the single Nkx2.2-/-
mice, raising the possibility that Nkx6.1 functions downstream of Nkx2.2 (171).

37
The cAMP signaling cascade
The effectors of the cAMP signaling pathway are well-recognized activators of gcg
expression in pancreatic α cells and intestinal L cells. The distal gcg promoter contains a CRE
(172,173), and the stimulatory effect of cAMP signaling has been established in multiple
pancreatic α cell lines as well as in islet primary cell cultures (172,174-179). In intestinal L cell
lines and primary fetal rat intestinal cells, membrane-permeable cAMP analogues and cAMP
promoting agents increase gcg expression and GLP-1 production (173,180,181). However,
deletion of the CRE motif, located between -291 and -298 bp of the rat gcg promoter, only
partially attenuated the stimulatory effect of cAMP (182). The identification of a second CRE
motif, located within the G2 enhancer element, led to the finding that this second CRE motif can
mediate the effects of cAMP, calcium (183) as well as the ATF3 (179). The identification of the
second CRE within G2, as well as two CRE-like elements in the distal gcg promoter, provided
explanations for the only partial attenuation of cAMP-stimulated gcg expression following the
mutation or deletion of the canonical CRE motif (183,184).
In the PKA-deficient InR1-G9 cell line, cAMP still exerts a stimulatory effect on gcg
expression, albeit the effect being much smaller compared to that in intestinal L cell lines
GLUTag and STC-1 which do express PKA (173,176,185). The Exchange protein directly
activated by cAMP (Epac) signaling cascade was then discovered as another signaling pathway
for mediating the effect of cAMP (186,187), where Epac proteins exert their effects through the
downstream Rap-Raf-MEK-ERK pathway (188,189). In intestinal L cell lines, PKA inhibition
cannot fully block cAMP-stimulated gcg expression, and Epac pathway specific cAMP analogs
stimulate gcg promoter and mRNA production (190).

38
The Wnt signaling pathway
Recent advances in our understanding of the regulation of gcg expression include the
identification of the involvement of the developmental Wnt signaling pathway and its effectors,
such as β-cat. For a detailed overview of the Wnt signaling pathway, please refer to Section
1.3.1. A general overview of the role of Wnt signaling in metabolic homeostasis is presented in
Section 1.3.2. The involvement of Wnt signaling in regulating gcg expression and GLP-1
production is described in detail in Section 1.3.3. In addition, one may refer to a number of
recent review articles published by our lab and others, which outline the recent advances and
perspectives on the role of Wnt signaling pathway in metabolic disorders (191-200).
1.2.3 The functions of GLP-1
Extensive investigations in the past two decades have revealed both pancreatic and extra-
pancreatic functions of GLP-1. GLP-1 exerts its functions mainly through the glucagon-like
peptide 1 receptor (GLP-1R), which belongs to the G-protein coupled receptor family and was
originally isolated from a rat pancreatic islet cDNA library (201). Although early studies focused
on the effects of GLP-1 in pancreatic β cells, numerous recent studies demonstrate the existence
of a wide panel of extra-pancreatic functions of GLP-1, including both central and peripheral
actions. Figure 1.8 illustrates the pancreatic and extra-pancreatic effects of GLP-1.

Fig. 1.8 Schematic presentation of the function of GLP-1. In the pancreas, stomach, heart and brain, the effects of GLP-1 are likely to be mediated by its specific receptor GLP-1R. As GLP-1(9-37) was also shown to exert protective effects in the heart and improve cardiac function, whether there is a yet to be identified receptor is under debate. It is not clear at this stage whether the effect of GLP-1 in liver, fat and muscle is mediated directly through GLP-1R.
Appetite ↓
Gastric emptying ↓
Insulin ↑ Glucagon ↓
Somatostatin ↑ β cell mass ↑
Glucose uptake ↑
Lipolysis ↑
Gluconeogenesis ↓ Cardioprotection ↑
39
GLP-1

40
Pancreatic functions of GLP-1
GLP-1 potentiates insulin secretion after a rise in blood glucose levels following nutrient
intake. Insulin secretion occurs via the closure of ATP-sensitive K+ channels (KATP), resulting in
subsequent membrane depolarization, and a rise in intracellular Ca2+ level, which lead to the
release of insulin-containing granules to the plasma membrane (202,203). Both PKA and Epac
signaling pathways are involved in this process (204). GLP-1 has also been demonstrated to
induce insulin secretion via inhibiting voltage-dependent K+ channels (202). In addition, GLP-1
enhances insulin biosynthesis and insulin gene transcription and mRNA stability (205). GLP-1
strongly inhibits glucagon secretion from α cells, and stimulates the secretion of somatostatin
from δ cells (206,207). The combined effects of GLP-1 in stimulating insulin secretion while
suppressing its counter-hormone glucagon lead to reduced hepatic glucose production, thereby
contributing to the lowering of blood glucose levels. Additional pancreatic effects of GLP-1 are
both tropic and protective, where GLP-1 increases β cell proliferation, induces β cell neogenesis
from precursor cells, and inhibits β cell apoptosis (208-211). Lastly, our group and others have
shown that in pancreatic β-cells, GLP-1 and Exendin-4 (Ex-4, a naturally occurring GLP-1R
agonist) reduces the expression level of thioredoxin-interacting protein (TxNIP), a mediator of
glucotoxicity (212,213). In summary, the beneficial effects of GLP-1 in pancreatic β cells are its
incretin effect on stimulating insulin secretion, its proliferative effect on stimulating β cell
growth and neogenesis, and its protective effect on reducing glucotoxicity (214).

41
Extra-pancreatic functions of GLP-1
GLP-1R has been detected in various tissues, including pancreatic islets, lung, stomach,
heart, intestine, kidney, brainstem, hypothalamus and pituitary gland. Whether it is expressed in
hepatocytes has been controversial (215-218).
GLP-1 functions as an enterogasterone, where it inhibits gastrointestinal motility and
secretion, leading to reduced gastric emptying and improved postprandial glucose excursions
(219-221). Central GLP-1 signaling suppresses appetite, and chronic GLP-1 administration leads
to weight loss associated with reduced appetite (222). GLP-1 produced in the nucleus of the
solitary tract of the brain was shown to regulate food intake and blood glucose levels via
activation of the GLP-1R in the hypothalamus and brainstem (223-227). GLP-1 also has
beneficial effects on the cardiovascular system, where it enhances myocardial performance,
reducing infarct size, and improves endothelial dysfunction (228,229). The clinical potential of
GLP-1 based therapeutics in alleviating cardiovascular burden, especially in T2D patients, are
being actively investigated (230,231). Interestingly, the cardioprotective effects of GLP-1 were
observed for both GLP-1(7-36) amide and GLP-1(9-36) amide (125,232,233). Ex-4 was found to
stimulate glucose uptake in rat skeletal muscle (233), and GLP-1 was shown to bind to GLP-1R
in hepatocytes and rat skeletal muscle in a cAMP-independent mechanisms (234). In adipocytes,
Ex-4 induces secretion of the lipolytic hormone adiponectin and stimulates lipolysis (235,236).
GLP-1 also regulates lipoprotein metabolism by inhibiting triglyceride-rich lipoprotein
production (237). In the liver, GLP-1 has been reported to exert beneficial effects by reducing
gluconeogenesis; however, the exact mechanism is unclear, as the expression of GLP-1R in
hepatocytes has been controversial (215,218,238), and it has been suggested that the hepatic
actions of GLP-1 may be through indirect mechanisms (239).

42
Numerous review articles have been published on the physiological actions of GLP-1,
and one may refer to these selected articles for further details (228,239-254).
1.3 The Wnt signaling pathway and proglucagon gene
expression
1.3.1 Overview of the Wnt signaling pathway
The Wnt signaling pathway was initially discovered in research on embryonic
development in Drosophila, Xenopus, and other organisms, and subsequently intensively
investigated in tumor biology. Wnt ligands, through their cell membrane bound receptors and co-
receptors, exert many fundamental physiological and pathophysiological functions in different
organs and cell lineages, including patterning and organogenesis, tumorigenesis and metastasis,
as well as metabolic homeostasis.
Fig. 1.9 presents the key components of the Wnt signaling pathway. The major
downstream effector of the canonical Wnt signaling pathway (referred to as Wnt signaling
pathway hereafter) is the bipartite transcription factor β-cat/TCF, formed by β-cat and a member
of the TCF family (TCF7, LEF-1, TCF7L1 and TCF7L2). The pool of free cytosolic β-cat is
tightly controlled by proteasome-mediated degradation, carried out by a ‘destruction complex’
involving the tumor suppressor adenomatous polyposis coli (APC), axin, GSK3, and casein
kinase 1α (CK1α). In the absence of Wnt activation, β-cat is phosphorylated by CK1α at Ser45,
which primes β-cat for further phosphorylation events by GSK-3 at Ser33, Ser37, and Thr41.
These destabilizing phosphorylation events lead to the degradation of β-cat. Wnt signaling
activation is initiated by the binding of Wnt ligand to its seven-transmembrane domain Frizzled

Fig. 1.9 Overview of Wnt signaling pathway. In its active state, Wnt signaling effector β-cat is bound by the destruction complex consisting of CK1α, GSK3, APC, and axin, leading to its proteosomal degradation. At the same time, TCF is bound by corepressors Groucho and CtBP, thereby suppressing Wnt target gene expression. Upon Wnt ligand binding to the Frz receptor and LRP5/6 coreceptor, conformational changes lead to the association of Dvl with Frz, causing the disintegration of the destruction complex. Free β-cat accumulates in the cytosol and is translocated into the nucleus, where it binds with TCF and stimulates Wnt target gene expression.
GSK3
Frz
Wnt target gene
TCF
LRP5/6
β-cat
CK1α
APC
axin
Dvl
Inactive Wnt signaling
Frz
Wnt target gene
TCF β-cat
LRP5/6
β-cat
GSK3
CK1α
APC
axin Dvl
Active Wnt signaling
β-cat
β-cat
Groucho
CtBP
Wnt
β-cat
Proteosomal degradation
Nucleus Nucleus
Cytoplasm Cytoplasm
43

44
(Frz) receptor and the Low-density lipoprotein receptor-related proteins 5 and 6 (LRP5/6) co-
receptor.
Following Wnt ligand binding, the Frz receptor associates with Dishevelled (Dvl). This
leads to the binding of Dvl with axin and thereby titrating axin away from the ‘destruction
complex’. As a result, the inactivating phosphorylation of β-cat is inhibited and its degradation is
prevented. Free cytosolic β-cat accumulates in the cytosol, and subsequently translocates into the
nucleus to form the β-cat/TCF complex and to activate the transcription of Wnt target genes (Fig.
1.9). Unlike the GSK3- and CK1α-mediated phosphorylation events, other residues have been
identified as ‘activating’ residues. PKA signaling is known to stimulate β-cat phosphorylation at
Ser675, an event that has positively associated with β-cat nuclear localization and activity
(255,256). Furthermore, both PKA and Akt were shown to phosphorylate β-cat at Ser552, which
promotes β-cat nuclear localization and transcriptional activity (255,257,258). GSK3 is an
important negative modulator of the Wnt signaling pathway, and lithium and other inhibitors of
GSK-3 have been established as pharmacological agents that mimic the function of Wnt ligands
in stimulating the expression of Wnt downstream target genes.
1.3.2 Wnt signaling pathway and metabolic homeostasis
Several studies have demonstrated that TCF and/or β-cat serve(s) as effectors of a
number of signaling cascades other than Wnt signaling, including several peptide hormones,
such as insulin, IGF-1 and other growth factors that use cAMP as the second messenger, as well
as the lipid metabolite lysophosphatidic acid (LPA) (259-261).

45
The Wnt effector TCF7L2
Although TCF7 (previously referred to as TCF-1) was originally isolated as a lymphoid
transcription factor, members of this family are now well recognized to be transcriptional
regulators of many physiological processes. Shortly after the identification of TCF7, isolated
cDNAs for TCF7L1 and TCF7L2 were identified, and at that time these two members were
named TCF-3 and TCF-4, respectively (262). Because the high-mobility group (HMG) boxes of
the TCF7L1, TCF7L2, and TCF7 sequences show marked similarity, it was suggested that these
members represent a subfamily of TCF7-like HMG box-containing transcription factors (262).
Subsequently, the genomic structure of the human TCF7L2 gene was identified and mapped to
chromosome 10q25.3 (263).
At a time when little is known about the genetic basis of T2D, a genome-wide linkage
study in an Icelandic population reported a suggestive link between T2D and chromosome 10q
(264). Subsequently, a genome-wide scan of Mexican American pedigrees revealed a
susceptibility locus on 10q, which was linked to T2D and age of onset of T2D (265). In a
landmark study in 2006, Grant et al. genotyped 228 microsatellite markers in Icelandic
individuals with T2D and in healthy controls across a 10.5 Mb interval on chromosome 10q
(266). The microsatellite DG10S478, located within intron 4 of the TCF7L2 gene, was found to
be associated with the risk of T2D (266). This observation was then replicated in a Danish cohort
as well as a U.S. cohort (266). Two single nucleotide polymorphisms (SNPs), rs12255372 and
rs7903146, were found to be in strong linkage disequilibrium with DG10S478 and also showed
similar robust associations with T2D (266). Heterozygous carriers (38%) and homozygous
carriers (7%) of the at-risk alleles have relative elevated T2D risks of 1.45 and 2.41, respectively
(266).

46
Following this pioneering report, the findings have been replicated in all main ethnic
groups by numerous independent researchers (267-288). To date, meta-analysis of published
studies show that TCF7L2 locus remains the most statistically significant genetic finding of T2D
(289). Despite the consistently observed genetic association between TCF7L2 and T2D, the
mechanism through which intronic TCF7L2 SNPs confer T2D risk remains elusive. A number of
studies point to the potential roles of these TCF7L2 SNPs in modulating incretin-stimulated
insulin secretion in pancreatic β cells and in regulating hepatic gluconeogenesis
(282,283,287,288).
The Wnt effector β-cat
The transcriptional co-activator β-cat is recruited to chromatin DNA via its binding
partner TCF, thereby driving the expression of Wnt target genes. It is critically involved in cell
proliferation, and its overexpression is associated with many types of carcinomas. Mice over-
expressing β cell specific active β-cat exhibited increased β cell proliferation and islet mass
expansion (290). Treatment with GLP-1 and Ex-4 induced TCF/LEF-driven reporter gene
expression in pancreatic β cells, and Ex-4 treatment stimulated β-cat activation and binding of β-
cat/TCF to Wnt target gene promoter (291). PKA, a known effector of GLP-1 signaling, was
found to induce β-cat activation through its Ser675 phosphorylation in pancreatic β cells (291).

47
Other Wnt signaling components
In addition to the Wnt effectors TCF7L2 and β-cat, several other Wnt signaling
components were shown to participate in metabolic processes, in particular β cell proliferation
and function. The Wnt ligand Wnt3a was found to stimulate pancreatic β cell proliferation and
Wnt target gene expression in β cell lines and islets, whereas mice over-expressing the negative
Wnt modulator Axin in a β cell specific manner exhibited β cell hypoplasia and defects in islet
development (290). This was repeated in another study, where treatment with Wnt ligands
induced insulin secretion in the presence of high glucose, and where addition of a soluble Frz
antagonist abolished the effect (292). Glucokinase is a critical regulator of β cell glucose
sensing, and gck gene expression was found to be activated by β-cat, where β-cat is a coactivator
of PPARγ at the gck promoter (293). These in vitro findings depict the importance of Wnt
signaling for β cell glucose sensing and islet development. The physiological role of the Wnt
coreceptor LRP5/6 was established when LRP5/6-deficient mice exhibited marked glucose
intolerance under chow diet, and showed increased plasma cholesterol levels in response to high
fat diet (292). However, β-cat deficient mice show normal glucose tolerance after birth (294).
1.3.3 Wnt signaling pathway effectors as mediators of proglucagon gene
expression
As illustrated in Fig. 1.7, our laboratory has made major contributions in the concept of
Wnt signaling-mediated regulation of incretin hormone production (295,296). Our laboratory
demonstrated that gcg promoter expression can be stimulated by lithium, a general Wnt signaling
activator, and by constitutively active S33Y mutant β-cat (295). Lithium also stimulated
endogenous gcg mRNA expression and GLP-1 production in the mouse intestinal GLUTag and
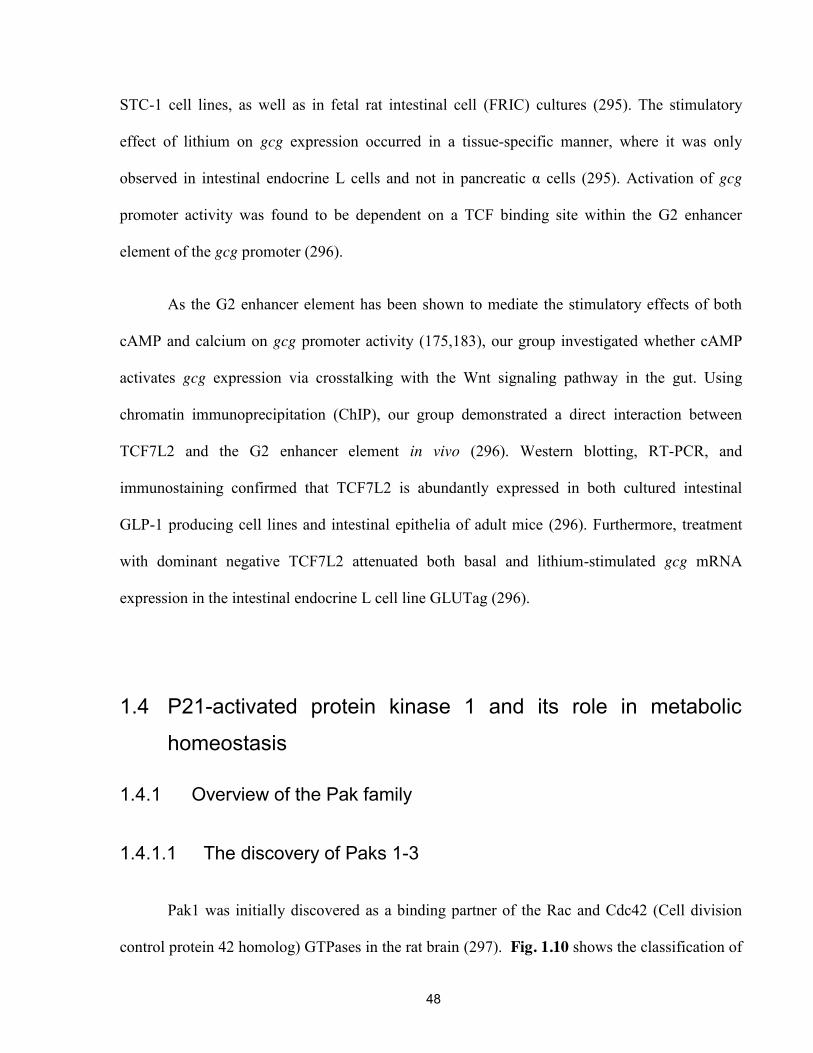
48
STC-1 cell lines, as well as in fetal rat intestinal cell (FRIC) cultures (295). The stimulatory
effect of lithium on gcg expression occurred in a tissue-specific manner, where it was only
observed in intestinal endocrine L cells and not in pancreatic α cells (295). Activation of gcg
promoter activity was found to be dependent on a TCF binding site within the G2 enhancer
element of the gcg promoter (296).
As the G2 enhancer element has been shown to mediate the stimulatory effects of both
cAMP and calcium on gcg promoter activity (175,183), our group investigated whether cAMP
activates gcg expression via crosstalking with the Wnt signaling pathway in the gut. Using
chromatin immunoprecipitation (ChIP), our group demonstrated a direct interaction between
TCF7L2 and the G2 enhancer element in vivo (296). Western blotting, RT-PCR, and
immunostaining confirmed that TCF7L2 is abundantly expressed in both cultured intestinal
GLP-1 producing cell lines and intestinal epithelia of adult mice (296). Furthermore, treatment
with dominant negative TCF7L2 attenuated both basal and lithium-stimulated gcg mRNA
expression in the intestinal endocrine L cell line GLUTag (296).
1.4 P21-activated protein kinase 1 and its role in metabolic
homeostasis
1.4.1 Overview of the Pak family
1.4.1.1 The discovery of Paks 1-3
Pak1 was initially discovered as a binding partner of the Rac and Cdc42 (Cell division
control protein 42 homolog) GTPases in the rat brain (297). Fig. 1.10 shows the classification of

49
G proteins. Rac and Cdc42 are two subfamilies that belong to the Rho family of GTPases, along
with the other subfamily RhoA. The Rho family is part of the Ras superfamily, which makes up
the small (~21 kDa) monomeric G-proteins. Based on their small sizes, they are commonly
referred to as p21 GTPases. In addition to the Rho family, there are seven other families: Ras,
Rab, Arf, Ran, Rap, Rheb, and Rit (Fig. 1.10). The p21 GTPases act as nucleotide exchange
factors by binding to and catalyzing the hydrolysis of guanosine triphosphate (GTP) to guanosine
diphosphate (GDP). They act as molecular switches, cycling between the active GTP-bound and
inactive GDP-bound states, and are regulated by three categories of proteins. The guanine
nucleotide exchange factors (GEFs) promote the dissociation of GDP from the GTPase, thereby
freeing the GTPase for the binding of GTP at the plasma membrane, and hence act as activators
of GTPases. GTPase activating proteins (GAPs) accelerate GTP hydrolysis and the subsequent
production of GDP, thereby promoting the inactivation of GTPases. The guanine nucleotide
dissociation inhibitors (GDIs) bind to and sequester the GTPase in the cytosol and thereby
maintain the inactive state of the GTPases.
In addition to the small monomeric p21 GTPases, other GTPases exist as heterotrimeric
G proteins. These G proteins are made up of three subunits – the largest G subunit, and the two
smaller G and G subunits – which together act as part of the GPCRs. Upon ligand binding to
the GPCR, the receptor undergoes a conformational change that activates the GDP-bound G
subunit, inducing the exchange of GTP in place of GDP. This is followed by the dissociation of
the GTP-bound G subunit from the G-G dimer and the receptor, and the subsequent hydrolysis
of GTP to GDP and the activation of adenylyl cyclase, which converts ATP to cAMP. Following
GTP hydrolysis, the inactive GDP-bound G subunit is recycled to the plasma membrane for
binding to the receptor.

Fig. 1.10 P21-activated protein kinases (PAKs) are effectors for selected small GTPases. Pak proteins are downstream targets and functional effectors for Rac and Cdc42 small p21 GTPases, which are classified as the Rho family within the Ras superfamily of GTPases. The Rho subfamily contains five PAK-interacting members, known as Rac1, Rac2, Rac3, RhoG and Cdc42. The Ras superfamily contains over 90 members, known as monomeric G proteins, in contrast with heterotrimeric G proteins, which are downstream effector of G-protein coupled receptors.
50
Subfamily Family Superfamily
Monomeric G proteins
Heterotrimeric G proteins
Ras Rho
Ras
Rab
Arf
Ran
RhoA
Rac
Cdc42
Rac1
Rac2
Rac3
RhoG Rap
Rheb
Rit
GTPase
PAKs

51
In 1994, Manser et al. identified a group of novel serine/threonine kinases that bind to
Rac1 and Cdc42 in a gel overlay assay using [-32P]GTP-labeled glutathione-S-
transferase(GST)-p21 fusion protein as substrate (297). Three kinases of 68kDa, 65kDa, and
62kDa were found to bind to Cdc42 and Rac1 but not RhoA, and were abundantly present in rat
brain cytosol. Closer examination of the first kinase, termed p65 Pak, revealed that it
preferentially binds to the GTP-loaded form of Cdc42/Rac, which leads to p65 Pak
autophosphorylation and activation. As newly identified targets and effectors of the small p21
GTPases, these kinases were therefore coined p21-activated protein kinases (Paks), and the three
molecular sizes were found to represent three isoforms of the same kinase family: -Pak (Pak1),
-Pak (Pak2), and -Pak (Pak3). Purification and sequence comparison of the first member,
Pak1, showed that it was related to the yeast protein kinase Ste20, which is involved in G-protein
mediated pheromone-response pathways.
Following the initial discovery by Manser et al., several other studies further confirmed
the role of Paks as targets and effectors of Cdc42 and Rac (298-300). The purification and
cloning of the human Pak1 (termed hPAK65) from human exhibited >95% and ~63% sequence
homology in its kinase domain with rat Pak1 and yeast Ste20, respectively (298). The hPAK65
exhibits identical specificity with endogenous brain Pak1, where it binds to Rac and Cdc42 in a
GTP-dependent manner, leading to the autophosphorylation of hPAK65 (298). Once activated,
Rac or Cdc42 are no longer required for hPAK65 activity (298). Pak1 is involved in
inflammatory responses in phagocytic leukocytes, by acting as an effector of Rac in activating
nicotinamide adenine dinucleotide phosphate (NADPH) oxidase activity in a GTP-dependent
manner (299). The cloning of the mouse homolog (termed m-PAK-3) from a mouse fibroblast
cDNA library showed that m-PAK-3 activation was stimulated by binding to GTP-loaded forms
of Cdc42 and Rac, but not RhoA (300). The m-PAK-3 contained potential SH3 domain binding

52
sites, bound to the SH3 domain of phospholipase C- in a highly specific fashion, and interacted
with at least one SH3 domain of the adaptor protein non-catalytic region of tyrosine kinase
adaptor protein (Nck) (300).
1.4.1.2 The discovery of Paks 4-6
Since the initial discovery of Paks 1-3, three more isoforms have been identified in
mammals. Unlike Paks 1-3, which are collectively called group I Paks, Paks 4-6 differ
significantly in their structural organization and regulation, and hence are referred to as group II
Paks. Pak4 was the first reported member from the group, and was identified from a PCR screen
using degenerate primers based on Pak2. Pak4 had a fairly ubiquitous expression profile, with
highest levels expressed in the prostate, testis, and colon (301,302). Pak6 was identified as an
androgen receptor interacting protein in a yeast two-hybrid screen, and its expression was found
to be highest in the testis and prostate (303) as well as in the brain, kidney, and placenta (304).
Pak5 is the last member of the family identified, and is primarily expressed in adult neuronal
tissue, with higher levels detected in the cerebellum (305), cerebral cortex, and olfactory bulb
(305).

53
1.4.1.3 Structural features, activation mechanisms, and upstream
regulators of Paks
1.4.1.3.1 Structural features of Paks
The structural features and domains of each Pak isoform are illustrated in Fig. 1.11. All
Paks have two major domains: an N-terminal p21-GTPase-binding domain (PBD) (aa 67-113 in
Pak1), and a highly conserved C-terminal catalytic kinase domain (KD) (aa 255-529 in Pak1). In
the group I Paks, a prominent feature is an additional autoinhibitory domain (AID) (aa 83-149 in
Pak1), which overlaps but is not coincident with the PBD. The AID acts as an ‘inhibitory switch’
and is critical for the auto-inhibition of group I Paks. The six Pak isoforms have one or more
proline-rich regions interspersed at the N-terminal and/or in the central region, where Pak1 has
five, Pak2 has two, and Pak3 has four canonical PXXP SH3-binding motifs. For Pak1, the first,
second canonical SH3-binding motifs interact with the adapter proteins Nck (306,307) and Grb2
(308), while Cloned out of library (Cool)/Pak-interacting exchange factor (PIX) protein binds to
the non-canonical site (309). Pak1 also has a conserved binding site for the G subunit of the
heterotrimeric G proteins near the end of the C terminus (310,311).

Fig. 1.11 Structural features of Pak proteins. Common features of Pak members include the p21-binding domain (PBD, orange), the catalytic kinase domain (KD, green), and multiple PXXP canonical SH3-binding motifs (brown) near the N-terminus and/or in the central region. The group I PAKs have a common auto-inhibitory domain (AID, black), which interacts with the KD in the PAK-PAK homodimer formation and thereby leading to the inactivation of PAK kinase activity. Members of group I Paks also contain acid-rich domains known as ED-rich regions (light blue) as well as a non-canonical PXP Pix/Cool SH3-binding motif (dark blue) in the central region.
54
AID KD PBD N C
P21-Binding Domain
Auto-Inhibitory Domain Kinase Domain
Pak1
Pak2
Pak3
Pak4
Pak5
Pak6
Group II
Group I
N C
N C
N C
N C
N C
N C
PBD
KD
PXXP SH3-binding motifs
AID
ED-rich regions
PXP SH3-binding motifs

55
1.4.1.3.2 Activation mechanism of group I Paks
As the most extensively studied and representative member of the Pak family, the crystal
structure of Pak1 in an auto-inhibited conformation was determined by Lei et al. in 2002 (312).
A simplified depiction of the Pak1 activation mechanism is illustrated in Fig. 1.12. Inactive Pak1
exists as a homodimer in a trans-inhibited conformation, where the N-terminal AID of one Pak1
molecule binds to and inhibits the KD of the other Pak1 molecule. The current understanding of
the activation mechanism consists of a model where the binding of the p21 GTPases Cdc42 or
Rac to the PBD domain disrupts Pak1 dimerization, leading to a series of conformational
changes that destabilize the folded structure of the inhibitory switch, thereby inducing the
dissociation of the two Pak1 molecules from each other. Once freed from each other, the Pak1
molecules undergo sequential phosphorylation steps leading to its activation.
Pak1 contains seven auto-phosphorylation sites, which are Ser21, Ser57, Ser144, Ser149,
Ser199, Ser204, and Thr423, as illustrated in Fig. 1.13 (313,314). The key event of Pak1
activation is its phosphorylation at the Thr423 residue, located within the KD, which is required
for maintaining relief from the auto-inhibition and the full activation of the catalytic kinase
activity towards exogenous substrates (315-317). An acidic substitution at this site (T423E)
renders Pak1 constitutively active. Following the Thr 423 phosphorylation event, Pak1
autophosphorylates at Ser 141, an event that is associated with the initiation and/or maintenance
of its activation, and which is required for GTPase- but not sphingosine-dependent activation
(318).

Fig. 1.12 Activation mechanism of Pak1. In its active state, Pak1 forms a homo dimer in a trans-inhibited formation where the catalytic domain (green) is bound by the AID (black) of the other Pak1 molecule. The binding of p21 GTPases to the PBD domain (orange) leads to the destabilization of the AID, resulting the dissociation of the two Pak1 molecules from each other. Pak1 then undergoes a series of phosphorylation and autophosphorylation events, the key activating residue being Thr423 (yellow circle), which renders Pak1 as fully active in its catalytic activity.
Inactive Pak1 homodimer
Thr 423
Thr 423
p21
p21
Active Pak1 molecules
56
P
P
Fig. 1.13 Interaction domains and phosphorylation sites of Pak1. Illustration of the PAK1 molecule. The small p21 GTPases, including Rac, Cdc42, CHP, TC10, and Wrch-1, bind to the PBD (orange) and stimulates its activation. Ser21, Ser57, Ser144, Ser149, Ser199, Ser204, and Thr423 are seven autophosphorylation sites. The adapter proteins Nck and Grb2 bind to two PXXP motifs (brown) near the N terminus. The non-canonical PXP motif (dark blue) interacts with the adapter protein Pix/Cool. The endogenous inhibitors of PAK1 include hPIP1, Merlin, LKB1, CRIPAK, and Nischarin, with their sites of interaction as indicated (red line).
57
N C
Pak1
P
Nck Grb2
Akt
P
Ser21 Thr212
p35/Cdk5 Cdc2
Erk1/2
P Thr423
Pdk-1 SAD-A
Ser57 Ser144 Ser199 Ser204
P
Rac Cdc42 CHP TC10
Wrch-1
Pix/Cool
hPIP1
CRIPAK
P P P P
Ser223
CK2
Merlin
P Thr109
LKB1
SKIP Nischarin
Src
P
Tyr131

58
1.4.1.3.3 Positive regulators of Pak1
Pak1 is activated by a wide panel of upstream regulators, including GTPases such as
Rac1, Rac2, Rac3 (297,319,320), Cdc42 (297), but not by Rho A-G or by other Ras superfamily
members. When bound to Pak, the intrinsic- and GAP-stimulated GTP hydrolysis of the GTPase
is inhibited, hence making the Pak PBD a useful affinity reagent for detecting Rac and Cdc42
activation (321). Small GTPases including Rac and Cdc42, as well as atypical small GTPases
such as CHP (322), TC10 (323), and Wrch-1 (324) bind to the PBD and stimulate Pak1
activation (Fig. 1.13). The CHP/Pak1/Pix signaling has been shown to regulate cell adhesion
during zebrafish embryonic development (325). TC10 was found to activate Pak1 when
examining insulin-stimulated prolactin gene expression in the rat pituitary cells (326). Wrch-1 is
a Wnt-1 stimulated small GTPase, which stimulates Pak1 Thr423 phosphorylation in the COS-7
cell line (324).
The adapter proteins Nck and Grb2 interact with the N-terminal canonical proline-rich
motifs, while Pix/Cool binds to the non-canonical motif in the centre region (Fig. 1.13).
Upstream activators of Pak1, such as Akt, Src, p35/Cdk5, Cdc2, Erk1/2, Pdk1, and SAD-A
induce the phosphorylation of Ser and Thr residues, some of which overlap with the auto-
phosphorylation sites of Pak1 (Fig. 1.13).
Hormones and growth factors that regulate Pak1
An overview of the positive and negative factors that regulate Pak1 activity is presented
in Fig. 1.14. In addition to the small GTPases, Pak1 is activated by tumorigenic factors, growth
factors, and hormones. Thrombin-stimulated Pak1 activation was observed in vascular smooth

59
muscle cells, and expression of the kinase-dead Pak1 mutant was shown to attenuate stress fiber
formation and cell migration (327) (Fig. 1.14). The epidermal growth factor (EGF) stimulates
Pak1 activation in breast cancer cells, and expression of a dominant-negative Pak1 was shown to
attenuate EGF-induced cell migration (328) (Fig. 1.14). Pak1 is a point of convergence for
platelet-derived growth factor (PDGF) and lysophosphatidic acid in regulating collagen matrix
contraction in human fibroblasts (329). Over-expression of PDGF is known to stimulate Erk
activity in medulloblastoma cells, and this was found to be mediated through the PAK1-MEK-
Erk signaling cascade (330). Pak1 was also shown to mediate the function of estrogen in
stimulating FKHR phosphorylation, leading to FKHR nuclear exclusion and the inhibition of cell
apoptosis (331) (Fig. 1.14). Noteworthy, the growth factor insulin-like growth factor-1 (IGF-1),
as well as the metabolic hormone insulin, were found to activate Pak1 as well (Fig. 1.14). IGF-1
activates RUNX2, a transcription factor that promotes endothelial cell migration, invasion, and
proliferation. Pak1 inhibition attenuates RUNX2 DNA-binding (332). Importantly, we and others
have also demonstrated that Pak1 mediates the function of the metabolic hormone insulin in
muscle and intestine (333,334).
1.4.1.4 Negative regulators of Pak1
Considerable efforts have been made to develop highly selective and potent Pak
inhibitors, which can be used as part of Pak-based therapeutics in targeting cancer. One method
is to identify endogenous Pak1 inhibitors. The domains of Pak1 that interact with its negative
regulators are illustrated in Fig. 1.13, while the list of these negative regulators is presented in
Fig. 1.14. Interaction of Pak1 N-terminal regulatory domain with the human Gβ-like WD-repeat
protein called human Pak1 interacting protein 1 (hPIP1), which shares sequence homology with

60
the Pak regulator Skb15 in fission yeast, abolishes Cdc42/Rac-stimulated Pak1 kinase activity
(335) (Fig. 1.14). Merlin, the product of the Nf2 tumor-suppressor gene, inhibits the activation of
Pak1 by binding to its PBD (336) (Fig. 1.14). The serine threonine kinase liver kinase B1
(LKB1, also known as serine/threonine kinase 11 or STK11), the product of another tumor-
suppressor gene, suppresses Pak1 activity by phosphorylating it at Thr109 in the PBD (337) (Fig.
1.14). The cysteine-rich inhibitor of Pak1 (CRIPAK) was identified in a yeast two-hybrid screen,
which suppresses Pak1-mediated ER transactivation in breast cancer cells (338) (Fig. 1.14). The
skeletal muscle and kidney enriched inositol phosphatase (SKIP) binds to the KD of Pak1 and
inhibits its scaffolding activity (detailed in Section 1.4.2) (Fig. 1.14). The integrin binding
partner Nischarin selectively inhibits Pak1 kinase activity and Pak1-mediated cell migration
through its direct interaction with Pak1 C-terminal domain (339) (Fig. 1.14). Two
serine/threonine phosphatases, POPX1 and POPX2, inactivate Pak1 via dephosphorylation, and
represent yet another component of the signaling pathways that regulate Pak activity (340).
The microRNAs (miRNAs) are non-coding RNAs that inhibit the expression of their
targets in a sequence-specific manner, and miRNA-7 (miR-7) was found to suppress Pak1
expression via interacting with its 3’-untranslated region of Pak1 mRNA in human cancer cells
(341). In a cellular model for breast cancer, levels of Pak1 protein were upregulated whereas
those of miR-7 and its upstream activator HoxD10 were found to be downregulated (341). In
another study, two homologs of the miRNA miR-126, miR-126a and miR-126b, were identified
in the zebrafish genome and were found to downregulate Pak1 mRNA expression.
Overexpression of miR-126a/b overexpression lead to decreased Pak1 transcript levels, whereas
knockdown of miR-126a/b causes increased Pak1 transcript levels in endothelial cells (342).

Fig. 1.14 Pak1 and its upstream positive and negative regulators. Small p21 GTPases, including Cdc42 and Rac1, as well as atypical ones CHP, TC10, and Wrch-1, can stimulate Pak1. Pak1 can also be activated by other upstream factors, including tumorigenic factors, growth factors, and hormones such as insulin. Several endogenous inhibitors of PAK1 have been identified, including the kinase LKB1, the phosphatase SKIP, and other factors such as Merlin, CRIPAK, Nischarin, and hPIP1.
61
• Rac1 • Cdc42 • CHP • TC10 • Wrch-1
• Estrogen • Insulin
• EGF • PDGF • IGF-1
• SKIP • Merlin • LKB1 • CRIPAK • Nischarin • hPIP1
Pak1
p21 GTPases
Hormones Growth factors
Positive regulators Negative regulators
Endogenous inhibitors
• Thrombin
Tumorigenic factors

62
1.4.1.5 Substrate specificity
Many downstream substrates for the group I Paks, Pak1 in particular, have been
identified. A portion of these substrates are also targeted by the group II Paks. Thus, it is not
clear as to what degree these two groups of Paks recognize similar substrates and the extent of
their redundancy. Based on their sequence divergence, however, one would predict that the two
groups of Paks exhibit at least some degree of substrate specificity. Using a degenerate peptide
library method, characterization of the consensus phosphorylation motifs of Pak1, Pak2, and
Pak4 showed that Pak1 and Pak2 exhibit virtually identical substrate specificity, which is distinct
from that of Pak4 (343). Comparison of crystal structures of Pak4, Pak5, and Pak6 to those of
group I Paks revealed significant differences between the two groups in the rearrangements of
the C helix, which would suggest conformational differences and thereby contributing to
substrate specificity (344).
1.4.1.6 The role of Paks in tumorigenesis and cancer
Pak proteins have been found to be upregulated and have been extensively researched in
a variety of cancers. The mechanisms underlying tumorigenesis and cancer metastasis include
increased copy number of Pak1 gene, hyperactivation of GTPases or upstream activators, as well
as downregulation or inhibition of endogenous negative regulators of Pak (345-347). Pak1
deregulation is well-documented in breast cancer, where more than 50% of human breast cancers
display overexpression and/or hyperactivation of Pak1 (348). Other cancers where altered
expression of Pak kinases occurs include the following cancer types: brain (349), esophagus

63
(350), liver (351), kidney (352), pancreas (353), colon (350,354,355), bladder (356), ovarian
(357-359), prostate (360), and T-cell lymphoma (361). A detailed review of Pak kinases and
their role in cancers has been summarized by Dummler et al (362).
Pak small-molecule inhibitors
Significant progress has been made in developing Pak1 small molecule inhibitors, with
the initial studies focusing on ATP-competitive inhibitors. Oncogenic Ras mutants such as v-Ha-
Ras are upstream activators of Pak1, and the synthetic derivative of the ATP antagonist K252a,
called CEP-1347, was found to directly inhibit Pak1 activity and able to block Ras-induced
transformation in vitro and in vivo in nude mice (363). The cyclooxygenase inhibitor derivative
OSU-03121 was found to reduce the levels of phosphorylated Pak1, whereas the octahedral
ruthenium complex FL-172 targets the Pak1 ATP-binding site and shows an ability to inhibit
Pak1 in mammalian cells (364).
In addition to ATP-competitive inhibitors, allosteric inhibitors that can interact with Pak1
outside of the ATP-binding sites are also under development. The most recent discovery is the
group I Pak inhibitor IPA3 (2,2’-dihydroxy-1,1’-dinaphtyldisulfide), which bound covalently to
the Pak1 regulatory domain and prevented Pak1 from binding to its upstream activator Cdc42
(365,366). IPA3 selectively inhibited the group I Paks and not the group II Paks, and had no
effect on pre-activated group I Pak kinases (365,366).

64
1.4.1.7 The functions of Paks
An overview of the functions of Paks, focusing on the group I Paks, are presented in Fig. 1.14,
where each column represents a category of related functions, and each category is described in
further detail in the sections below.
1.4.1.7.1 Cell cycle progression
Pak proteins play critical roles in cell cycle progression (Fig. 1.15, column 1). Pak1
localizes to specific structures during mitosis, such as chromosomes, centrosomes, mitotic
spindles, and the contraction ring during cytokinesis (367). During mitosis, two Pak-binding
proteins, GIT1 and Cool/PIX, bind to and activate Pak1 independently of Rac or Cdc42.
Activated Pak1 then in turn phosphorylates and activates two protein kinases, Aurora-A at
Thr288 and Ser342 (368), and Polo-like 1 (Plk1) at Ser49 (369), both of which are important
regulators of mitotic events. During the early phase of mitosis, Pak1 co-localizes with Histone
H3 on condensing chromosomes and phosphorylates Histone H3 on Ser10, leading to the
initiation of chromosome condensation (370). Another downstream target of Pak1 is cyclin D1,
and constitutively active Pak1 has been shown to induce transcription of cyclin D1 via activation
of the transcription factor NFκB (348,371). Paks have also been shown to regulate the MAPK
pathway, where Pak1 phosphorylates two mediators of the MAPK pathway, MEK1 at Ser298
and Raf1 at Ser338 (372-376), and could potentially regulate cell cycle progression through this
pathway as well. Phosphorylation of MEK1 and Raf1 by Pak is not sufficient to activate these
two MAPK pathway effectors, but enhances their activation by the respective upstream
activators Ras and Raf1.

Fig. 1.15 Pak1 and its downstream effectors regulate a multitude of cellular functions. Pak1 and its downstream targets regulate cell cycle progression (1), cell survival and apoptosis (2), cytoskeleton remodeling (3), host-pathogen response (4), and gene transcription and mRNA splicing (5).
65
Cell survival and apoptosis
Cell cycle progression
Aurora-A
PIK1
histone H3
NFκB
(1)
MEK1
Raf1
Raf1
NFB
FKHR
BimL
(2)
DLC1
MLCK
LIMK
Cytoskeleton remodeling
Myosin
Myo3p
RLC
MLC
MHC
(3)
Erk
NFAT
CtBP1
Host-pathogen response
(4)
Transcription and splicing
PCBP1
FKHR
SHARP
histone H3
Snail
CtBP
MAPK
AR
(5)
Pak1
β-cat

66
1.4.1.7.2 Cell survival and apoptosis
Initiation of apoptosis is carried out by Bcl-2-associated protein (Bax) and Bcl-2
homologous killer (Bak), two families of pro-apoptotic proteins that localize to the mitochondria
and induce pore formation in the mitochondria outer membrane, thereby allowing cytochrome C
to escape into the cytoplasm and leading to the activation of the pro-apoptotic caspase cascade.
This series of events can be blocked by the anti-apoptotic protein B-cell lymphoma-2 (Bcl-2),
which binds to and forms heterodimers with Bax or Bak, thus preventing apoptosis. The
regulation of apoptosis is further enhanced by Bcl-2-associated death promoter (BAD) proteins,
where dephosphorylated BAD forms heterodimers with and inactivates Bcl-2, subsequently
allowing Bax/Bak-mediated apoptosis to proceed. Akt, on the other hand, can phosphorylate
BAD, leading to the formation of BAD/14-3-3 homodimers, which leaves Bcl-2 free to inhibit
Bax/Bad-triggered apoptosis.
The pro-survival and anti-apoptotic functions of Pak1 are presented in Fig. 1.15 column
2. Pak1 is anti-apoptotic and protects cells from intrinsic apoptotic signals via its downstream
target Raf1. Pak1, as well as Pak5, phosphorylates Raf1 at Ser338 and stimulates its
translocation to the mitochondria (377,378). In the mitochondria, Raf1 binds to Bcl-2 and forms
the protective Raf1-Bcl-2 complex. Like Akt, Raf1 can phosphorylate the pro-apoptotic protein
BAD at Ser112, a site that renders BAD unable to bind to Bcl-2, and therefore maintaining Bcl-2
activity and its inhibition of apoptosis. FKHR is involved in the induction of apoptotic genes,
and Pak1 directly phosphorylates FKHR and sequesters it in the cytosol, thereby inhibiting its
ability to induce transcription of FKHR target genes (331).

67
Paks mediate their pro-survival effects through the transcription factor NFκB. NFκB has
been shown to regulate genes involved in cell survival, proliferation, and angiogenesis, and is
often active in tumor cell types. Pak1 has been reported to activate NFκB, but the exact
mechanism is still unclear (348,371,379,380).
Other downstream targets that are inactivated by Pak1 are BimL and dynein light chain 1
(DLC1) (381). In a similar manner to BAD, BimL is a pro-apoptotic protein that binds to and
inactivates Bcl-2. Upon initiation of apoptosis, DLC1-BimL dimers are released from the dynein
motor complex, where BimL then interacts with and inactivates Bcl-2 at the mitochondria. This
process is inhibited by Pak1, where Pak1 binds to and phosophorylates BimL, preventing it from
binding to Bcl-2 and resulting in an anti-apoptotic action.
1.4.1.7.3 Cytoskeleton remodeling
The regulation of the cytoskeleton by Pak kinases is well-established (Fig. 1.15 column
3), and the process may be dependent or independent on the Pak kinase activity (382,383). It is
known that the formation of lamellipodia and filopodia is regulated through the effects of Rac
and Cdc42 on the cytoskeleton, respectively. The role of Pak1 in the induction of lamellipodia,
filopodia, formation of membrane ruffles, and cell motility was identified through its interaction
with its downstream target LIM domain kinase (LIMK) (384). Pak1 phosphorylates LIMK at
Thr508, leading to LIMK activation (385,386). Active LIMK catalyzes the phosphorylation of
cofilin, which suppresses its activity in acting as an actin capping and severing protein and
subsequently results in increased amount of cellular filamentous actin (387).

68
In addition, several of the Pak-interacting proteins are main components of thin, thick,
and intermediate filaments. Myosin activity is crucial for the intracellular movement machinery
underlying cytoskeletal rearrangements, and myosins have been identified as targets of Pak
proteins. Pak1 was initially identified as the mammalian homolog of the yeast protein Ste20,
which is a kinase that modulates cell morphology and polarity in Saccharomyces cerevisiae
(388). This budding yeast has two myosin-I isoforms, encoded by Myo3 and Myo5 genes. Myo3p
was found to be a phosphorylation target (at Ser357) for Ste20p and Cla4p, another member of
the yeast Pak family, both in vitro and in vivo (389). Phosphorylation of myosin-I was required
for yeast budding and was found to regulate the reorganization of actin cytoskeleton (390).
In Drosophila melanogaster, Pak1 phosphorylates the regulatory light chain (RLC) of
nonmuscle myosin II on Ser21 and Thr20, sites that are homologous to Ser19 and Thr18 in the
mammalian smooth muscle myosin RLC (391). In Xenopus laevis, activated Pak1
phosphorylates the regulatory light chain (MLC) of myosin II on Thr18 and Ser19 (392).
Mammalian Pak1 phosphorylates MLC on Ser19 (393-395), and MLC phosphorylation by Pak1
and Pak3 in neuronal cells promotes dendritic spine morphogenesis by local stabilization of the
actin network (396). Pak1 also phosphorylates the myosin heavy chain (MHC) of myosin VI,
which plays a central role in membrane trafficking and cell migration (397).
Pak1 can also indirectly regulate the phosphorylation of myosin by myosin light chain
kinase (MLCK), where Pak1 phosphorylates MLCK and thereby decreasing its activity (398).
Cdc42-activated Pak2 can phosphorylate MLCK on Ser439 and Ser991, which inhibits MLCK
activity and thereby hindering the development the isometric tension in smooth muscle and non-
muscle cells (399).

69
1.4.1.7.4 Host-pathogen response
The group I Paks are highly expressed in most leukocytes, and Pak proteins are being
recognized to play important roles in immune function and responses (Fig. 1.15 column 4). Pak1
acts downstream of the Nck/Vav/SLP-76 signaling complex and is required for T-cell mediated
activation of Erk and NFAT (400). This is consistent with the observation that macrophages
from Pak1-/- mice display reduced Erk activation in response to growth factors and defective
lamellipodia stability, since the effect of lamellipodial dynamics can be mimicked by Erk
inhibitors (401). Pak1 activation is required for chemotaxis of leukocytes in response to the
chemokine CXCR2 (402), and expansion of the active Pak1 pool via its interaction with G,
Cool/PIX, and Cdc42, is needed for chemotaxic signaling in myeloid cells (403). More recent
studies have shown that Pak1 plays a key role in mast cells, which are important regulators of
allergic diseases, where activation of high affinity IgE receptors lead to the release of
proinflammatory mediators (404). Mast cell-deficient mice which received locally reconstituted
Pak1-/- mice bone marrow derived mast cells (BMMCs) showed decreased allergen-induced
vascular permeability and reduced IgE receptor degranulation, indicating that Pak1 is a target for
modulating acute mast cell responses in allergic diseases (404).
Mammalian Pak kinases have also been implicated in several types of host/pathogen
responses, in particular in Human Immunodeficiency Virus (HIV) pathogenesis, where one or
more Pak isoforms were identified to interact with the HIV-encoded protein Nef. Structural
studies show that Pak2 associates with a hydrophobic binding surface on Nef (405), which leads
to Pak2 activation (406). Nef, but not Nef mutants that are incapable of Pak binding, are able to
block T-cell induced apoptosis during HIV replication, suggesting that Pak-Nef is required for its
anti-apoptotic effects during HIV pathogenesis (407).

70
Pak proteins are also involved in the pathogenesis of other virus types. Alphaherpesvirus
encode a protein kinase, US3, which induces actin cytoskeleton reorganization leading to virus
spread. US3 is known to directly bind to and activate Pak, and in mouse embryo fibroblasts
(MEFs) from Pak2-/- mice, US3-mediated stress fiber disassembly is impaired, whereas Pak1-/-
MEFs show impaired US3-mediated cell projections, which suggest that each Pak isoform plays
a distinct role in the cell/virus interactions and that Pak proteins are required for efficient
herpesvirus spread (408).
Group I Paks are implicated in other stages of the virus life cycle as well. The
participation of Pak1 is essential for vaccinia virus entry, involving macropinocytosis and
membrane blebbing (409). This process may also involve Pak-mediated activation of C-terminal
binding protein 1 of E1A (CtBP1, also known as brefeldin A-ribosylated substrate BARS), an
event necessary for the fission of the macropinocytic cup (410). For the human adenovirus
serotype Ad3, activation of the viral Pak1 and its phorphorylation target CtBP1 are required for
Ad3 infectious entry; this is consistent with the observation that a phosphorylation-defective
S147A-CtBP1 blocks Ad3 infection, and demonstrates the role of Pak1-CtBP1 in adenovirus
entry (409).
1.4.1.7.5 Gene transcription and mRNA splicing
Three nuclear localization signals have been identified in Pak1 N-terminus (411). In
addition to its well-characterized kinase activity, it is increasingly recognized that Paks also
participate in nuclear events, such as transcription and mRNA splicing (Fig. 1.15 column 5).
One of the main targets of Pak1 is presumably through the activation of MAPK (300,412,413).

71
Endogenous Pak1 was found to localize to the nucleus of interphase cells and bind to histone H3
(367).
Pak6 was found to interact with androgen receptor (AR) and translocate into the nucleus
upon androgen stimulation (303). Pak2 has been identified to undergo caspase-mediated
cleavage, and the resulting Pak2 fragment containing the nuclear localization signal relocated
into the nucleus and stimulated programmed cell death (414). Yeast two hybrid screening of a
mammary gland cDNA library using Pak1 as bait identified polyC-RNA-binding protein 1
(PCBP1), which controls mRNA translation, as an interacting partner of Pak1 (415). Pak1
activation led to enhanced nuclear retention of PCBP1, its recruitment to the eukaryotic
translation initiation factor 4E (eIF4E) promoter, and the stimulation of eIF4E expression, which
subsequently resulted in alternative splicing of eIF4E target genes (415).
Estrogen was found to rapidly activate Pak1 in mammary cancer cells in a PI3K-
dependent manner (331). Pak1 in turn directly phosphorylates and activates FKHR (also known
as FOXO1), resulting in the nuclear exclusion of FKHR and the repression of FKHR target gene
expression (331). CtBP is a ubiquitous transcriptional corepressor during development and
oncogenesis. Pak1 was shown to bind to and phosphorylate CtBP at Ser151, inducing CtBP
cellular redistribution and thereby blocking its corepressor function (416). A single amino acid
substitution (S158A) of CtBP, as well as the use of siRNA-mediated Pak1 knockdown, inhibited
CtBP phosphorylation by Pak1 (416).
The Notch signaling pathway is important for the determination of cell fate and
differentiation in many organs, and dysregulation of Notch and Pak1 have been observed in
many types of cancers. SHARP, a component of Notch signaling, was identified as a Pak1-
interacting protein in a yeast two hybrid screen. Pak1 phosphorylated SHARP at Ser3486 and

72
Thr3568, leading to the stimulation of SHARP repressor activity on Notch target gene expression
(417). Snail is a zinc finger phosphprotein that regulates cell epithelial-mesenchymal transition, a
process that underscores the transition of early stage tumors to invasive malignancies. Pak1
regulates Snail repressor activity by phosphorylating it at Ser246, inducing its nuclear
localization and its repressor function on target gene expression (418).
1.4.1.7.6 Endothelial and vascular biology
Rac1 has been established as a well-known regulator of vascular development, where
endothelial-cell-specific Rac1 deletion results in embryonic lethality. The Rac1-/- embryos
exhibit defective vessel development, and vascular development was completely absent in the
yolk sacs of Rac1 knockout mice (419). The involvement of Pak1 in vascular development is less
understood. Early studies have suggested a role for Pak1 in cultured endothelial cells (420).
Subsequently, a chicken chorioallantoic membrane (CAM) model was developed to study the
role of Pak1 in angiogenesis, which uses βFGF-soaked filters placed on the chorioallantoic
membrane of developing chicken embryos, and a peptide mimicking the effects of dominant-
negative Pak1 was able to impair βFGF-mediated angiogenesis (421). In zebrafish, mutation in
Pak2α resulted in embryonic brain haemorrhage with intact gross development of the vasculature
and normal hemostatic function (422). More recently, Pak4 null embryos show abnormalities in
both yolk sacs and placentas, with lack of vasculature throughout the extra-embryonic tissue and
abnormal formation of the labyrinthine layer of the placenta (423).

73
1.4.1.7.7 Metabolic homeostasis
In the last decade, Pak kinases are beginning to emerge as important regulators of
metabolic homeostasis. Specifically, Pak1 has been demonstrated to participate in the regulation
of glucose homeostasis in two key processes: 1) insulin-stimulated glucose uptake in skeletal
muscle (detailed in Section 1.4.2), and 2) glucose-stimulated insulin secretion in β cells (detailed
in Section 1.4.3) (Fig. 1.16).
1.4.2 Pak1 and glucose transport in muscle
Discovery of the kinase PK65
In 1996, Tsakiridis et al. used an in-gel kinase assay to examine the presence of insulin-
responsive renaturable kinases in lysates of L6 myotubules (333). Using histone VI-S as
substrate, they observed that insulin treatment induced the phosphorylation of a kinase of 65kDa,
and they referred to this kinase as ‘PK65’ (Protein Kinase 65 kDa) (333). PK65 was found to be
activated within minutes upon stimulation with insulin (333). When myelin basic protein (MBP)
was used as substrate, a modest induction of PK65 was detected, suggesting that histone VI-S is
the preferred substrate compared to MBP (333). Tsakiridis et al. then further investigated the
dependence of PK65 on insulin activation, and found that treatment with erbstatin abolished the
activation of PK65 by insulin, implying that stimulation of PK65 requires tyrosine kinase activity
(333). To identify whether PI3K, a critical node of insulin signaling, was involved, they
pretreated myotubes with wortmannin prior to insulin activation, and found that wortmannin
blocked the insulin stimulation of PK65, while not affecting insulin-induced tyrosine

Fig. 1.16 Summary of the role of Pak1 in skeletal muscle and pancreas. Upon feeding, the rise in blood glucose level leads to elevated circulating insulin levels. In the muscle, insulin stimulates GLUT4 translocation via the PI3K-Cdc42-Rac1-Pak1 signaling axis and the PI3K-Akt-AS160 axis, in promoting muscle glucose uptake (left). In the pancreas, increased blood glucose level elicits the postprandial release of insulin form the β-cells, involving the Cdc42-Pak1-Rac1 signaling cascade (right).
Cdc42
Pak1
Rac1 GLUT4
translocation
Glucose uptake
Muscle
Elevated glucose Elevated insulin
Insulin response
Pancreas
FEEDING
Cdc42 Pak1 Rac1
insulin secretion
74

75
phosphorylation of IRS-1 or the two tyrosine phosphorylation and activation of Erk 1 and 2
(333). In contrast, the PKC inhibitor BIM did not affect insulin-stimulated PK65 activation, and
neither did the inhibitor of p70S6k rapamycin (333).
Identification and renaming of PK65 as Pak1
In their in-gel kinase assay, PK65 from myotubes co-migrated with a 65 kDa fMLP-
stimulated renaturable kinase from neutrophils, which at that time was suggested to be the
neutrophil PAK65 (now known as Pak1 and referred to as Pak1 hereafter) (333). In order to
identify whether PK65 was indeed Pak1 in myotubes, Tsakiridis et al. used anti-Pak1 antibodies
and examined by immunoblotting and immunoprecipitation experiments using control and
insulin-stimulated myotubes, and confirmed that PK65 present in the myotubes was indeed Pak1
(333). They further confirmed the identity of PK65/Pak1 using GST-Cdc42Hs coupled to
agarose beads preincubated with GDP or GTPS followed by incubation with cell lysates (333).
PK65/Pak1 activity was significantly enhanced in the presence of GTPS compared to GDP
(333).
Pak1 activates MAPK pathway
Since transfection of dominant negative PK65/Pak1 was found to inhibit Rac and Cdc42
activation of p38 MAPK in Cos-7 cells (412), and tyrosine phosphorylation is an essential step in
the activation of MAPK, Tsakiridis et al. further examined the effect of insulin on the MAPK
pathway (333). Lysates from control and insulin-treated myotubes pretreated with or without

76
wortmannin were probed with anti-MAPK antibodies, and insulin was found to induce tyrosine
phosphorylation of p38 MAPK within 5 min (333). Unlike the activation of Pak1 by insulin,
activation of MAPK by insulin was not blocked by wortmannin, suggesting that Pak1 and
MAPK are activated by insulin through different pathways in myotubes (333).
The PI3K/Akt2 and PI3K/Rac/Pak1 axes in muscle glucose uptake
An overview of the mechanisms underlying skeletal muscle glucose uptake and the role
of Pak1 is illustrated in Fig. 1.17.
Insulin is known to stimulate GLUT4 vesicle translocation to the cell surface, leading to
glucose uptake in skeletal muscle tissue (424). This process requires the tyrosine
phosphorylation of IRS-1, which recruits and activates PI3K. Insulin signaling bifurcates at
PI3K, with one arm leading to Akt2 activation, and another arm leading to Rac1 activation
(424,425). Akt2 phosphorylates and inactivates its target AS160, which is a GAP and in the
absence of insulin stimulation leads to the inactivation of the GTPases. Hence, insulin
stimulation leads to the activation of Akt2 and the GPTases Rab8A and Rab13, ultimately
resulting in GLUT4 vesicle translocation and glucose uptake in muscle (426).
Both the Rac1 arm and the Akt2 arm promote glucose uptake in the skeletal muscle, and
it has been proposed that each arm act independently of each other in promoting GLUT4 vesicle
translocation (427,428). The role of PI3K/Rac signaling in the regulation of glucose uptake in
muscle cells have been further elucidated, and F-actin remodeling is one of the major
downstream mechanisms for Rac-mediated GLUT4 translocation. Actin cytoskeleton
reorganization is involved in insulin-stimulated GLUT4 vesicle translocation, as

Fig. 1.17 Overview of mechanisms underlying insulin-stimulated glucose uptake in skeletal muscle. Insulin binding to the IR leads to the activation of PI3K, which bifurcates into the Akt2 arm and the Rac1 arm. The Akt2-mediated inactivation of AS160 enables the activation of the GTPases Rab8A and Rab13, which promote GLUT4 translocation. The Rac1 arm stimulates GLUT4 translocation through various mechanisms, including Pak1 which potentially involves LIMK/cofilin signaling, ROCK, and RalA, all of which lead to F-actin remodeling. Muscle contraction and exercise activate Rac1/Pak1 signaling and stimulates GLUT4 vesicle translocation. The phosphatase SKIP is an endogenous negative regulator of Pak1 in the muscle and inhibits its scaffolding activity. IR: Insulin receptor; PI3K: Phosphoinositide 3-kinase; LIMK: LIM domain kinase; ROCK: Rho-associated coiled-coil-containing protein kinases ; SKIP: Skeletal muscle and kidney enriched inositol phosphatase .
77
IR
Insulin
PI3K
Rac1
IRS
Akt2
Pak1 SKIP ROCK RalA
F-actin remodeling
GLUT4
Glucose
AS160
Rab8A Rab13
GLUT4 vesicle
?
Muscle contraction Exercise
LIMK cofilin
?

78
pharmacological agents that disrupt actin dynamics, such as latrunculin B, inhibited GLUT4
translocation to the plasma membrane and lead to reduced glucose uptake in the muscle cells
(425,429-431). Insulin is known to regulate actin dynamics in cultured muscle cells and in the
mouse L6 myotubes (432,433). Insulin-induced actin cytoskeleton reorganization in muscle cells
requires PI3K activity (431,434,435), and insulin-stimulated GLUT4 translocation and actin
remodeling can be blocked either by depleting Rac1 or by inducing conditions that mimic insulin
resistance in cultured muscle cells (424,436). Expression of a constitutively-active Rac1 elicited
GLUT4 vesicle translocation even in the absence of insulin, suggesting that the presence of
active Rac1 suffices in stimulating GLUT4 translocation, at least in the in vitro setting (436).
Treating cultured muscle cells with glucose oxidase mimics insulin resistance in vitro, and this
leads to the inhibition of Rac1 activation, accompanied by the loss of Rac1-mediated Pak1
Thr423 phosphorylation (424). These observations highlighted the requirement of Rac1 signaling
in insulin-stimulated muscle glucose uptake, involving the process of cytoskeleton remodeling.
Consistent with the observations made in the above in vitro investigations, insulin was
shown to stimulate Rac1 activation in mouse skeletal muscle, and mice Rac1 ablation in the
muscle only showed reduced insulin-induced GLUT4 vesicle translocation in the muscle tissue
(437). The aforementioned observations collectively indicated the essential role of Rac1 in
mediating the stimulatory effect of insulin on GLUT4 membrane translocation, and that Pak1 is
among the downstream targets of insulin and Rac1 in the muscle.
The generation of Pak1-/- mice enabled the direct assessment of the contribution of Pak1
in muscle glucose uptake. Following insulin injection, muscle samples collected from Pak1-/-
mice showed significantly reduced GLUT4 vesicle translocation to the plasma membrane when
compared with muscle samples from control mice (438). Cofilin has been reported to act
downstream of the PAK1 effector LIMK, and is critically involved in the regulation of actin

79
filaments in a marsupial kidney epithelial cell line (439). In line with the role of
Pak1/LIMK/cofilin signaling in cytoskeletal reorganization in epithelial cells, the skeletal muscle
from Pak1-/- mice was shown to lack the response to insulin treatment in stimulating cofilin
phosphorylation (438). Hence, the PI3K/Pak1/LIMK/cofilin axis may be one of the mechanisms
underlying insulin-stimulated GLUT4 translocation.
A very recent study by Sylow and colleagues provided extended evidence that Rac1-Pak1
signaling centrally regulates muscle glucose uptake in intact muscle tissue, and that this signaling
axis was rendered defective under the insulin-resistant state (429). First, they demonstrated that
insulin indeed stimulates Rac1 and Pak1 activation in both mouse and human skeletal muscle
(429). Pharmacological inhibition of Rac1 resulted in the loss of insulin-stimulated glucose
uptake, independent of Akt status, in isolated mouse skeletal muscle (429). Muscle-specific
deletion of Rac1 in mice resulted in reduced insulin-stimulated muscle glucose uptake,
associated with attenuated insulin-stimulated Pak1 Thr423 phosphorylation in the muscle (429).
Importantly, skeletal muscle isolated from high fat diet fed mice showed reduced Rac1
expression, associated with blunted Pak1 Thr423 phosphorylation in response to insulin
treatment (429). These observations in the experimental animals were at least partially
recapitulated in humans, where skeletal muscle insulin resistance induced via intralipid infusion
resulted in a loss of insulin-stimulated Pak1 Thr423 phosphorylation during a hyperinsulinemic-
euglycemic clamp study (429).
The Rho-associated coiled-coil-containing protein kinases (ROCKs) are serine/threonine
kinases that act as downstream effectors of certain small GTPases, and ROCKs have been shown
to participate in insulin signaling and energy homeostasis (440). Inhibition of ROCK1 impaired
GLUT4 translocation, while over-expression of ROCK1 resulted in enhanced insulin-sensitizing
effect on glucose transport in adipocytes (441). In myoblasts, ROCK1 depletion lead to

80
attenuated insulin-stimulated glucose transport, associated with defects in actin cytoskeleton
remodeling (441). Hence, ROCKS which are similar to Paks and act as downstream effectors of
GTPases, are potentially involved in GLUT4 translocation and glucose transport in the muscle as
well (424,440,441).
Furthermore, the small GTPase RalA has been reported to function as the effector of
Rac1 in mediating its stimulatory effect on muscle glucose uptake (442). Depletion of RalA
using the siRNA-mediated knockdown approach was shown to reduce Rac1-stimulated GLUT4
vesicle plasma membrane translocation in the mouse L6 myotubes (442), and therefore represent
yet another potential mechanism for Rac-mediated GLUT4 vesicle translocation.
The joint requirement of both the PI3K-Akt2 arm and the PI3K-Rac arm in insulin-
stimulated GLUT4 translocation has been proposed. Pharmacological inhibition of both Akt2
and Rac1 signaling cascades was shown to be required to completely block insulin-stimulated
glucose uptake in mouse muscle cells (428). In addition, both Akt2 and Rac1 signaling pathways
were found to be dysfunctional in the muscle tissue of the insulin-resistant ob/ob mouse model
(428). Interestingly, in examining the involvement of Pak1 as the effector of Rac1 signaling,
muscle tissue isolated from Akt2-/- mice appear to have blunted insulin-stimulated Pak1 Thr423
phosphorylation, while pharmacological inhibition of Akt2 does not alter Pak1 activation (428).
To explain this obvious discrepancy, it has been proposed that although the Rac1 and Akt2 arms
do not crosstalk with each other in regulating glucose uptake, the presence of Akt2 is still
required for the activation of the Rac1 cascade (428). In summary, the critical role of Rac1 in
regulating actin dynamics underlying muscle glucose uptake has been demonstrated in numerous
investigations (424,425,427,436). Pak1 has been shown to regulate actin filament dynamics in a
number of other cell types, including neuronal cells and pancreatic -cells (detailed in the

81
Section 1.4.3) (443-446). However, the direct function of Pak1 on actin remodeling and glucose
uptake in muscle, for example whether it involves LIMK/cofilin or other yet-to-be-identified
mechanisms, remains to be investigated.
Even though the majority of studies to date have focused on assessing Pak1 in the muscle
as a protein kinase, Ijuin et al has recently identified a potential novel mechanism for Pak1 in
regulating muscle glucose uptake (447). The phosphatase SKIP has been shown to inhibit
insulin/PI3K/Akt signaling, and repress insulin-stimulated GLUT4 translocation as well as
glucose uptake in the mouse L6 myoblasts (448-450). It has been postulated that the underlying
mechanism involves the binding of SKIP to Pak1, which blocks Pak1 scaffolding function
without affecting its kinase activity in mouse myoblasts (447) (Fig. 1.15). Hence, the potential
dual function (kinase versus scaffold function) of Pak1 in insulin-stimulated muscle glucose
uptake remains to be identified.
In addition to insulin activation, muscle contraction represents another mechanism by
which muscle glucose uptake can be stimulated (451). The activity of Rac1 was observed to be
elevated during contraction-stimulated glucose uptake in skeletal muscle, and this was
concomitant with enhanced Pak1 Thr423 phosphorylation (452). Pak1 activation and muscle
glucose uptake following contraction were attenuated by either Rac1 inhibition or the use of F-
actin depolymerizing agents in vitro, and a similar defect was observed in muscle-specific Rac1-/-
mice (429,452). Furthermore, exercise enhanced Pak1 Thr423 phosphorylation in mouse and
human skeletal muscle, suggesting that Rac/Pak1 signaling plays a role in muscle glucose
disposal during exercise (429,452).

82
1.4.3 Pak1 and insulin secretion in pancreas
Insulin is released from pancreatic β cells in two distinct phases following glucose
stimulation. The first phase of insulin release is triggered by an elevation of intracellular calcium
levels, leading to the fusion of predocked insulin-containing granules to the plasma membrane.
The second phase of insulin release involves the mobilization of stored granule pools to the cell
surface, and represents the sustained insulin release for an hour or longer following glucose
stimulation. F-actin remodeling is known to be involved in the process of granule mobilization to
the SNARE sites at the cell surface, suggesting that actin remodeling is key to insulin granule
release.
An overview of the mechanisms underlying GSIS and the role of Pak1 is presented in
Fig. 1.18.
Cdc42/Pak1/Rac axis regulates actin cytoskeleton remodeling
In 2007, Wang et al. proposed that Cdc42-induced signaling is involved in actin
reorganization in the islet β cell (453). Using siRNA-based approaches, Wang et al. first
demonstrate that siRNA-mediated Cdc42 knockdown attenuated glucose-induced insulin
secretion in the mouse pancreatic β cell line MIN-6 (453). Isolated mouse islets were used for
insulin release kinetics, and insulin secretion following glucose treatment in the control islets
showed biphasic responsiveness (453). On the other hand, islets transduced with siCdc42 showed
~50% reduction in the second phase of insulin release, without any changes to the first phase
insulin release and the basal insulin level (453).

Fig. 1.18 Overview of the mechanisms underlying glucose-stimulated insulin secretion in pancreas. Glucose is taken up into the cell via the GLUT4 transporter, and is converted to pyruvate through the glycolytic pathway. The pyruvate serves as a substrate for the Kreb’s cycle, and results in the rise of intracellular ATP concentration. This leads to the closing of the ATP-sensitive K channel (KATP) and membrane depolarization, resulting to the opening of the voltage-gated Ca2+ channel (VGCC). The influx of Ca2+ stimulates the mobilization of insulin granule-containing vesicles to the plasma membrane, leading to insulin release. The small GTPase Cdc42 stimulates insulin secretion via its effector Pak1, which acts through Rac1 and MEK/Erk signaling, leading to F-actin remodeling and insulin vesicle release. The SAD-A kinase has been shown to stimulate Pak1 in stimulating insulin secretion, and it has been proposed that this kinase may mediate the stimulation of insulin secretion by GLP-1. SAD-A: synapses of amphids defective .
83
GLP-1
Insulin granule-containing vesicle
Glucose
GLUT4
Glucose
Pyruvate
Glycolysis
Kreb’s cycle
ATP ↑
KATP VGCC
K+
Ca2+
GLP-1R
AC
PKA
cAMP ↑
Epac
SAD-A
Rac1
Cdc42
Pak1
F-actin remodeling
MEK
Erk
Insulin secretion

84
Having established the importance of Cdc42 in the second phase of insulin release, Wang
et al. sought to determine the role of Rac (453). Using both pancreatic β cell lines and isolated
islets, they observed that Cdc42 activation precedes Rac activation during glucose-stimulated
insulin release (453). Following glucose treatment, Rac activation was found to be dependent on
Pak1 activation, while Pak1 activation was dependent on Cdc42 activation (453). Pak1 depletion
abolished Cdc42-mediated Rac activation, placing Pak1 as a linker in the Cdc42/Pak1/Rac axis
in glucose-stimulated insulin release in pancreatic β cells (453).
The critical role of F-actin remodeling in GSIS has been recognized, where F-actin
filaments were shown to act as barriers at the plasma membrane to prevent the docking and
fusion of insulin granules under un-stimulated conditions (454-456). Rac1 and a number of other
small GTPases have been implicated in various steps of GSIS in pancreatic β cells (457). In a
murine β-cell line, Rac1 activation was shown to be stimulated by high glucose treatment (458).
The expression of a dominant-negative Rac1 in β-cells abolished its cytosol-to-membrane
translocation upon high glucose stimulation, which was associated with reduced GSIS (458).
Very recently, Asahara and colleagues demonstrated the role of Rac1 in regulating GSIS
via modulating F-actin using both in vitro and in vivo approaches (459). In the pancreatic cell
line MIN-6, Rac1 activation was observed following high glucose treatment (459). Rac1
knockdown leads to the persistence of intact F-actin in the presence of high glucose, associated
with reduced insulin secretion following glucose stimulation (459). The study utilizing islets
isolated from cell specific Rac1-/- mice also recapitulated the observations of defective insulin
secretion following high glucose treatment, without significant alterations in islet morphology
(459).

85
Although Pak1 is evidently involved in the second phase of GSIS, the exact mechanism
by which Pak1 evokes F-actin remodeling in response to glucose is still not completely
understood. An early study identified the role of the Cdc42-Pak1-Rac1 axis in regulating F-actin
rearrangement and insulin secretion in cells (453). It was further demonstrated that glucose-
induced cortical F-actin remodeling also involves the Cdc42-PAK1-MEK-Erk pathway, and that
glucose-induced insulin granule exocytosis can be blocked by the PAK inhibitor IPA3 (460,461).
The downstream effects of the PAK1-MEK-Erk signaling cascade may include MLCK, an actin-
associated kinase which has been implicated in cell insulin secretion (461,462).
In a recent study by Kalwat and colleagues, they utilized live cell imaging techniques to
further elucidated the mechanistic requirement of Pak1 in glucose stimulated insulin granule
exocytosis (460). Pretreatment of mouse pancreatic cells with IPA3 inhibited glucose-induced
F-actin remodeling and ablated glucose-stimulated insulin granule localization to the plasma
membrane (460). In mouse cells, glucose treatment stimulated Raf1 phosphorylation and
activation, while IPA3 treatment or Cdc42 inhibition abolished this activation (460). Similarly,
IPA3 treatment blunted MEK to Erk signaling, while the presence of a MEK-Erk inhibitor
disrupted F-actin remodeling and resulted in defective insulin granule release (460). Altogether,
these in vitro findings implicate the functional requirement of Pak1 in transmitting the signal of
Cdc42 to the downstream Raf1-MEK-Erk cascade, which leads to the potentiation of insulin
granule mobilization through F-actin remodeling (460).
Despite a number of the studies supporting the participation of Pak1 in insulin granule
mobilization, how Pak1 activation is stimulated by high glucose treatment in pancreatic cells
remains unknown. The synapses of amphids defective (SAD-A) kinase is a serine/threonine
kinase closely related to the AMP-activated kinases (463). SAD-A is exclusively expressed in

86
the brain and pancreas, and has been implicated in synaptic function and neuronal development
(464). In examining the role of SAD-A in insulin secretion, Nie et al first showed that treatment
with high glucose induces SAD-A activation, and that SAD-A in turn can stimulate Pak1 Thr423
phosphorylation and Pak1 kinase activity in a murine pancreatic cell line (465). SAD-A was
also shown to interact with recombinant GST-PBD of Pak, which can be completely abolished
by a point mutation that inactivates the SAD-A kinase activity (465). Over-expression of SAD-A
resulted in enhanced cortical F-actin formation, while expression of a kinase-dead SAD-A K48M
mutant induced cortical actin filament disintegration (465). Conversely, shRNA-mediated SAD-
A knockdown attenuated GSIS in the mouse cell line MIN-6, and adenoviral expression of
either K48M SAD-A or the dominant-negative Pak1 mutant K299R was able to significantly
reduce GSIS in mouse islets (465). Taken together, SAD-A is at least one of the direct upstream
activators of Pak1, in regulating insulin granule exocytosis in cells. SAD-A has been
postulated as the downstream effect of PKA and calmodulin-dependent protein kinase kinase
(CaMMK) (465), while the relationship between SAD-A and Rac1 remains to be investigated.
The potential role of SAD-A in mediating the stimulation of insulin secretion by GLP-1
signaling remains to be identified.
1.4.4 Pak1 as a mediator of the crosstalk between insulin and Wnt
signaling pathways
Hyperinsulinemia and type 2 diabetes patients have higher correlated risk of developing
colorectal cancer, while the Wnt signaling pathway is centrally involved in the development and
progression of various tumors, including colorectal tumors (355,466). Activation of the Wnt

87
signaling pathway occurs upon the binding of Wnt ligands to the Frizzled receptor and LRP5/6
co-receptor, resulting in the nuclear translocation of β-cat. Nuclear β-cat will subsequently
interact with a member of TCF transcription factor family, forming the bipartite transcription
factor β-cat/TCF. A number of pro-proliferation genes, such as c-Myc and cyclin D1, are known
downstream targets of β-cat/TCF.
Both insulin and IGF-1 were shown to stimulate Pak1 Thr432 phosphorylation in muscle
and intestinal cells (333,334,467,468), while our laboratory has demonstrated that intraperitoneal
injection of insulin in mice resulted in Pak1 Thr432 phosphorylation in the liver, fat, heart, small
and large intestines (334). Expression of dominant-negative K299R Pak1 attenuated insulin-
induced c-Myc and cyclin D1 protein expression, and reduced insulin-stimulated binding of β-
cat/TCF to the human c-Myc gene promoter (334). Furthermore, Pak1 knockdown resulted in a
drastic reduction of c-Myc and cyclin D1 expression, accompanied by attenuated Erk
phosphorylation in the presence and absence of insulin stimulation (334). Insulin stimulates β-cat
phosphorylation at Ser675, an event that is positively correlated with β-cat nuclear translocation
and activity (255,256,334). Pak1 knockdown attenuated insulin-stimulated β-cat Ser675
phosphorylation, the binding of β-cat to c-Myc promoter, and c-Myc gene expression (334).
Collectively, these findings revealed the potential role of Pak1 as a linker underlying the
crosstalk between the insulin/IGF-1 and the Wnt signaling pathways.

88
2 Rationale, hypothesis, and research aims

89
2.1 Rationale
Previous studies have identified Pak1 as a mediator of insulin-stimulated glucose uptake
in skeletal muscle and glucose-stimulated insulin secretion in pancreatic cells (333,453). In
examining the crosstalk between insulin and Wnt signaling pathways, our lab has identified the
role of Pak1 in mediating the proliferative effect of insulin in intestinal cancer cell lines. Insulin
was also shown to concurrently activate Pak1 and the Wnt effector -cat, leading to the
stimulation of Wnt target genes c-Myc and cyclin D1 (334). These studies by our group and
others collectively emphasize the function of Pak1 as an effector of insulin signaling, and as a
linker in the crosstalk between insulin and Wnt signaling pathways. Hence, I aimed to examine
the role of Pak1 in mediating the effect of insulin in vitro and in vivo, in the context of intestinal
gcg expression and GLP-1 production, and the deleterious effects of Pak1 ablation on glucose
homeostasis.
2.2 Hypothesis and research aims
Central hypothesis
Pak1 is a linker between insulin and Wnt signaling pathways. It is centrally involved in
regulating gcg expression and GLP-1 production, and hence is an important modulator of
glucose metabolism and homeostasis.

90
Aim I
To assess whether Pak1 mediates the crosstalk between insulin and β-cat in regulating
proglucagon gene expression in the in vitro setting (presented in Chapter 4).
Aim II
To assess whether Pak1 ablation perturbs glucose homeostasis in mice (presented in Chapter 5).
Aim III
To assess whether Pak1 regulates hepatic glucose production in vitro and in vivo (presented in
Chapter 6).

91
3 General materials and methods

92
3.1 Chemicals and antibodies
The group I Pak inhibitor 2,2’-dihydroxy-1,1’-dinaphthyldisulfide (IPA3), PKA inhibitor
H89, adenylyl cyclase activator forskolin, and inhibitor of cAMP phosphodiesterase 3-isobutyl-
1-methylxanthine (IBMX) were obtained from Sigma Aldrich (St. Louis, MO, USA). Sitagliptin
(Januvia®) was the product of Merck Canada Inc. (Montreal, Canada). The GLP-1 receptor
(GLP-1R) agonist exendin-4 (Ex-4) was the product of Genscript (Piscataway, NJ, USA).
Phospho-β-cat (Ser675), phospho-Pak1 (Thr423)/Pak2 (Thr402), Pak1, Pak2, Pak3,
phospho-GSK3α (Ser21)/β (Ser9), GSK3β, Akt1, and phospho-CREB1 (Ser133) antibodies were
purchased from Cell Signaling (Beverly, MA, USA). Total β-cat antibody was purchased from
Santa Cruz Biotechnology (Santa Cruz, CA, USA). β-Actin antibody was the product of Sigma
Aldrich. Phospho-Akt1(Ser473) antibody was from Signalway Antibodies (College Park, MD,
USA).
3.2 Western blotting
Cells were harvested using radioimmuno precipitation assay (RIPA) buffer (200 μL for a
single well from 6-well plates), centrifuged at 16,110 × g for 5 min at 4°C, and supernatant is
collected and placed on ice. The protein content was determined using Bradford protein assay.
In a cuvette, 1 μL of the supernatant was added to 1 mL of Bradford reagent (Sigma Aldrich) and
gently mixed by vortexing. The protein concentration was determined by spectrophotometer
reading at 595 nm and quantified using a bovine serum albumin standard curve.

93
The Western blotting procedure was conducted as follows. The protein samples (20-40
µg) were resolved by SDS-PAGE with 10% polyacrylamide gels before transfer to a
nitrocellulose (Pierce, Rockford, Ill) membrane. Blots were incubated on shaker at room
temperature in 5% non-fat milk in 1 × Tris-buffered saline Tween-20 (TBST, 137mM NaCl,
20mM Tris, 0.1% Tween-20, pH 7.6) for 1 h, followed by overnight incubation on shaker in
primary antibody (1/1000 dilution) in 5% BSA in 1 × TBST at 4°C. The next day, blots undergo
1 h incubation on shaker at room temperature with horseradish peroxidase-conjugated secondary
antibody (1/3000-1/5000 dilution) (Santa Cruz Biotechnology Inc, Dallas, TX, USA). Blots were
then developed using enhanced chemiluminescence (ECL) (Pierce, Rockford, IL, USA) and
exposed to Maximum Sensitivity double emulsion imaging film (Kodak).
3.3 RNA extraction and real-time quantitative reverse-
transcriptase PCR
Cellular RNA was extracted using TRI reagent (Invitrogen Life Technologies, Carlsbad,
CA) based on a modification of the manufacturer’s protocol. Cells were harvested using 1 mL of
TRI reagent and stored at −80°C. On the day of extraction, samples were thawed on ice, and 200
μL of chloroform was added followed by vigorous shaking and incubation at room temperature
for 5 min. The sample was centrifuged at 4°C for 10 minutes at 16,110 × g, and supernatant was
collected into new microfuge tube. To this tube, 500 μL of isopropanol was added followed by
inversion mixing and incubation at −20°C for 20 min for RNA precipitation. The sample was
centrifuged at 16,110 × g at 4°C for 10 minutes, and the RNA pellet was washed with 1 mL 75%
ethanol. The resulting RNA pellet was air-dried and reconstituted in the appropriate amount of
UltraPure DNase/RNase-free distilled water (Invitrogen Life Technologies, Carlsbad, CA). The

94
RNA solution is incubated at 60°C for 10 min, and subsequently cooled on ice and stored at
−80°C. For real-time quantitative reverse transcriptase polymerase chain reaction (real-time
qRT-PCR), the RNA was reverse-transcribed into cDNA using high-capacity cDNA reverse
transcription kit (Invitrogen Life Technologies, Carlsbad, CA, USA) as per manufacturer’s
protocol.
3.4 Experimental animals, maintenance, and genotyping
The generation of the Pak1-/- mouse line has been described previously (404), and were
provided by Dr. Jonathan Chernoff (Fox Chase Cancer Center, Philadelphia, PA, USA). We
obtained the Pak1-/- mouse line in the mixed C57BL/6-129 background, and performed the
backcross to the C57BL/6 genetic background for 7 generations. These mice were then
intercrossed to produce Pak1−/− and wild-type offspring. Adult male mice were used in all
studies. The mice were maintained on a standard chow diet and water ad libitum with 12h-12h
light-dark cycles.
Extraction of genomic mouse tail DNA and genotyping was conducted using the KAPA
mouse genotyping kit (KAPA Biosystems Inc, Woburn, MA, USA), as per manufacturer’s
instructions. The KAPA Express Extract solution is added to the mouse tail biopsy, and the
sample was incubated at 50-60°C for 20 min. After the completion of the enzymatic digestion,
the resulting sample containing mouse tail DNA was mixed with the KAPA2G Fast Genotyping
Mix solution and the genotyping primers for PCR amplification.
The forward primer (5’-GCC CTT CAC AGG AGC TTA ATG A-3’) together with the

95
Pak1-specific reverse primer (5’-GAA AGG ACT GAA TCT AAT AGC A-3’) resulted in the
amplification of a 240 bp product from the WT allele. The use of the same forward primer
together with a specific reverse primer for the neomycin cassette (5’-CAT TTG TCA CGT CCT
GCA CGA-3’) amplified a 360 bp product from the targeted allele.
3.5 Mouse organ weight measurements
During animal euthanasia, organs such as epididymal fat pad, liver, and 5 cm of distal
ileum were dissected and weighed using a digital bench-top balance from Mettler Toledo.
3.6 Immunohistochemistry of mouse intestine and pancreas
The co-immunostaining studies were conducted by the pathology laboratory at the
Toronto Centre for Phenogenomics (Toronto, Ontario, Canada), as per their established standard
protocols.
3.7 Statistical analyses and densitometry analysis
Results are presented as average ± SEM, and they were analyzed using a two-tailed
unpaired Student t test or one-way ANOVA followed by post hoc analysis as appropriate, with a
p < 0.05 being considered statistically significant. Densitometry analyses for Western blots were
performed using ImageJ.

96
4 P21-activated protein kinase 1 mediates the crosstalk between insulin and β-catenin on regulating
proglucagon gene expression in the gut
Data presented in this chapter, as well as those in Chapter 5, have been published by Chiang et
al. 2013. P21-activated protein kinase 1 (Pak1) mediates the cross talk between insulin and β-
catenin on proglucagon gene expression and its ablation affects glucose homeostasis in male
C57BL/6 mice. Endocrinology 154(1):77-88 (468).
All experiments were performed and figures contributed by Yu-ting Chiang. The mouse
hypothalamic gcg-expressing cell line mHypoE-20/2 was a gift of Dr. Denise Belsham (469).
The K299R kinase-dead Pak1 (dominant negative Pak1) plasmid was provided by Jeffrey Field
(470).

97
4.1 Abstract
In gut endocrine L cells, the Wnt signaling pathway effector β-cat/TCF7L2 mediates the
stimulatory effect of insulin on proglucagon (gcg) expression and glucagon-like peptide-1 (GLP-
1) production. In several other cell lineages, insulin was shown to to stimulate Pak1. Here, we
determined the role of Pak1 in gcg expression in two gut gcg-expressing cell lines and in a brain
gcg-expressing cell line. Insulin stimulated Pak1 activation through its Thr423 phosphorylation
in gut gcg-expressing cell lines, associated with increased gcg mRNA levels. This stimulation
was attenuated by the Pak inhibitor 2,2′-dihydroxy-1,1′-dinaphthyldisulfide (IPA3) or expression
of dominant-negative Pak1. Both insulin and cAMP-promoting agents activated β-cat Ser675
phosphorylation, which was attenuated by IPA3 or protein kinase A inhibition, respectively. We
hence suggest that Pak1 mediates the cross talk between insulin and Wnt signaling pathways on
gut and brain gcg expression.
4.2 Introduction
The proglucagon gene (gcg) encodes three major peptide hormones, including glucagon,
glucagon-like peptide-1 (GLP-1) and GLP-2, which are importantly involved in maintaining
glucose homeostasis and the growth of small intestines (120,471). Glucagon produced by
pancreatic α-cells is a major counter-regulatory hormone of insulin, whereas GLP-1 produced by
gut endocrine L cells is among the two important incretin hormones (472). GLP-1 is also
expressed in certain neuronal cells in the brainstem, which controls satiety and peripheral
glucose homeostasis by yet-to-be-further-defined mechanisms (246).

98
Gcg expression is controlled by a number of transcription factors and cell signaling
molecules or pathways in cell-type specific manners, in response to nutritional and hormonal
regulation (151,153,192,473,474). We have demonstrated previously that the G2 enhancer
element within the proximal gcg promoter region is responsible for the stimulation of gcg
transcription by the Wnt signaling pathway effectors transcription factor 7-like 2 (TCF7L2)
(previously known as TCF-4) (266) and β-catenin (β-cat) (295,296). β-cat and a member of the
TCF family form the bipartite transcription factor β-cat/TCF, which not only mediates the effect
of Wnt ligand stimulation but also the effects of other cellular signaling molecules, including a
battery of peptide hormones that use cAMP as the second messenger; insulin, IGF-I and other
growth factors; and the lipid metabolite lysophosphatidic acid (475). Although insulin represses
pancreatic gcg expression, glucagon production and secretion (476-478), it evidently stimulates
gut gcg expression and GLP-1 production in vitro and in vivo in the MKR hyperinsulinemic and
insulin-resistant mouse model (479-481). Interestingly, insulin was shown to use the same G2
enhancer element that mediates Wnt activation in stimulating gcg promoter expression in the gut
endocrine L cells, and this stimulation is likely to be mediated by a PI3K-dependent but Akt-
independent mechanism (479).
Paks are a highly conserved group of serine/threonine kinases, which are implicated in a
number of cellular processes including cell proliferation, cell polarity, and actin cytoskeleton
reorganization (482). They were initially recognized as key mediators of the Rho family
GTPases, Cdc42 and Rac, which are importantly involved in many biological functions,
including insulin secretion (483). Functional studies have implicated Pak1 in tumorigenesis and
tumor metastasis (466). Pak1 expression and activation are elevated in cancer cells of numerous
types. Pak1 Thr423 phosphorylation, indicating Pak1 activation, can be stimulated by insulin or
IGF-I (334). In mouse muscle cells, this activation is PI3K dependent (333). In the gut endocrine

99
L cells, Cdc42 was shown to regulate actin remodeling, ERK1/2 activation, Pak1 activation, as
well as GLP-1 secretion in response to insulin treatment (480). We have reported previously that
in intestinal nonendocrine cells, insulin or IGF-I stimulates the Pak1 Thr423 phosphorylation in
an Akt-independent manner, associated with increased β-cat Ser675 phosphorylation and Wnt
target gene expression (334).
4.3 Materials and methods
4.3.1 Cell lines and tissue culture
The mouse intestinal gcg-expressing GLUTag and STC-1 cell lines were available in our
laboratory. The mouse hypothalamic gcg-expressing cell line mHypoE-20/2 was a gift of Dr.
Denise Belsham (469). Tissue culture media, serum, and antibiotics were purchased from Sigma
Aldrich (St. Louis, MO, USA). GLUTag and STC-1 were maintained in Dulbecco’s Modified
Eagles Medium (DMEM) containing 10% fetal bovine serum (FBS) and penicillin/streptomycin
(P/S, 100 U/mL and 100 μg/mL, respectively). InR1G9 was grown in RPMI 1640 medium with
10% FBS and P/S. Cell cultures were maintained in incubators at 37°C and supplied with 5%
CO2.
4.3.2 Fetal rat intestinal cell isolation
Fetal rat intestinal cells (FRIC) were isolated for tissue culture via a method developed by
Dr. Patricia Brubaker (484). Briefly, on day 1 the intestines from a litter of 19 to 21 day gestation

100
fetal Wistar rats were collected and pooled. The intestines were minced using sterilized surgical
scissors, and intestinal tissue pieces underwent two sequential 30 min incubations with an
enzyme cocktail solution (10 mL Hanks buffer solution containing 40 mg collagenase, 50
hyaluronidase, and 5 mg deoxyribonuclease I). After enzymatic digestion, the dispersed cells
were washed and seeded into monolayer cultures with DMEM supplemented with 10% FBS for
24 h and grown at 37°C and 5% CO2 for further treatment.
4.3.3 Plasmids, transfection, and luciferase reporter gene analysis
The 2.4kb-gcg-LUC, G2S-TK-LUC, and−302bp-gcg-LUC plasmid constructs have been
described previously (151,173). The K299R kinase-deficient Pak1 (dominant negative Pak1)
plasmid was provided by Dr. Jeffrey Field (470).
Polyethylenimine (PEI) was obtained from Sigma Aldrich, St. Louis, MO, USA) and was
used as the transfection reagent, with a protocol modified from the manufacturer’s instructions.
Cells were seeded on day 1 at 60-70% confluency or 0.7-1.0 × 10⁵ cells. For each single well
from a 6-well plate, the DNA-PEI complex is prepared by mixing DNA and PEI at a ratio of 1:3
w/w in Opti-MEM transfection medium (Invitrogen Life Technologies, Burlington, Ontario,
Canada). The microfuge tube containing the DNA-PEI complex was incubated at room
temperature for 15 min, and mixed gently by inverting the tube. After 15 m incubation, the
DNA:PEI mixture was added to the cells and transfection is performed for 24 h. On day 2, cells
were serum starved overnight prior to subsequent drug treatments and luciferase reporter gene
analysis on day 3.

101
The luciferase reporter gene (LUC) analysis was carried out by a method described
previously with minor modifications (296). Briefly, cells were washed with PBS and scraped off
the plate with rubber scrapers after incubating with 0.3 mL of LUC harvesting buffer (50 mM
Tris/MES, 1mM dithiothreitol and 0.1% Triton X-100). The collected samples were vortexed for
40 seconds and centrifuged at 16,110 × g at 4°C for 10 minutes. Supernatant was collected and
placed on ice. From that, 100 μL of the supernatant is dispensed into a clean tube, followed by
the addition of 15 μL ATP cocktail solution (50mM Tris/MES, 0.18M MgOAc and 40mM ATP)
and 100 μL of LUC harvesting buffer. LUC activity is immediately measured using a
luminometer (Lumat LB 9507 from Fisher Scientific).
4.3.4 Real-time quantitative reverse-transcriptase PCR
Gcg mRNA levels were normalized to 18S ribosomal RNA levels. The primer pairs used
are as follows: gcg forward, 5′-TGG ACT CCC GCC GTG CCC AA-3′, gcg reverse, 5′-CGA
CTT CTT CTG GGA AGT CTC GCC T-3′;; 18S forward, 5′-CGG ACA TCT AAG GGC ATC
A-3′, 18S reverse, 5′-AAG ACG GAC CAG AGC GAA A-3′.
4.3.5 Northern blotting
The method for Northern blotting was modified from an existing protocol (151). In brief,
following RNA extraction, the RNA sample was resolved by gel electrophoresis. The gels
contained 12% agarose and 12.5% v/v 37% formaldehyde, prepared in 1 × MOPS buffer (40mM
MOPS, 10mM sodium acetate, 1mM EDTA, pH 8.3). The resolved RNA on the gel was then

102
transferred to a nylon membrane by passive upward transfer overnight, using 10 × Saline sodium
citrate (SSC) solution (300 nM sodium citrate, 1 M sodium chloride, pH 7.0). The next day, the
RNA on the membrane is UV-crosslinked for 5 min. The radioactive labeled nucleotide probe
was prepared using the commercial Amersham Nick Translation dCTP kit (GE Healthcare Life
Sciences, Baie d’Urfe, Quebec, Canada) as per manufacturer’s instructions. The membranes
were hybridized in rollers containing the P32-labelled nucleotide probe in prehybridization buffer
(5% dextran sulphate, 40% formamide, 4 × SSC, 7mM Tris, 1 × Denhardt, 100 µg/mL salmon
sperm DNA) at 42°C overnight. Following hybridization, the membranes were washed twice in 2
× SSC rolling at 55°C for 15 min, and placed into cassettes with Maximum Sensitivity double
emulsion imaging film (Kodak) for exposure at −80°C for 1-3 days.
4.4 Results
4.4.1 Insulin stimulates Pak1 activation in gcg-expressing cells
To investigate the role of Pak1 in gcg expression and glucose homeostasis, we first of all
examined Pak1 protein expression in the gut and brain gcg-expressing cell lines and in various
mouse tissues. As shown in Fig. 4.1A, Pak1 is expressed in the GLUTag cell line along with the
other two group I Paks (Pak2 and Pak3). In mouse tissues, Pak1 shows a ubiquitous expression
pattern with abundant levels in a number of organs that are potentially important in glucose
homeostasis, including brain, distal ileum, pancreas, liver, muscle, and fat (Fig. 4.2). Pak1 is also
expressed in the heart, colon, lung, and kidney (Fig. 4.2). Furthermore, Pak1 expression was
colocalized with GLP-1 in the mouse gut endocrine L cells by coimmunostaining (Fig. 4.1B).
Similar to what we have observed in the gut nonendocrine cells (334), in the GLUTag cell line,

103
insulin also stimulated Pak1 Thr423 phosphorylation (Fig. 4.1C). Furthermore, insulin treatment
led to the stimulation of Pak1 Thr423 phosphorylation in STC-1, another mouse intestinal gcg-
expressing cell line (Fig. 4.1D) and in the mouse gcg-expressing neuronal cell line mHypoE-
20/2 (Fig. 4.1E).
4.4.2 Insulin-stimulated gcg expression can be attenuated by Pak
inhibition
We then assessed the effect of Pak inhibition on insulin- and cAMP-stimulated gcg
promoter activity. Figure 4.3A shows that insulin-stimulated Pak1 activation can be partially
attenuated by pretreating the GLUTag cells with IPA3, a highly selective, non-ATP-competitive
inhibitor targeting the autoregulatory domain of group I Paks (365). Upon transfection of the
2.4kb-gcg-LUC construct (151) into the GLUTag cell line, both insulin and forskolin/3-isobutyl-
1-methylxanthine (F/I) treatment stimulated LUC reporter activity as we have anticipated (Fig.
4.3B). The stimulation by insulin was blocked by IPA3 pretreatment (Fig. 4.3B), whereas the
stimulation by F/I was moderately but significantly attenuated by IPA3 pretreatment (Fig. 4.3C).
Next, we tested the effect of Pak inhibition on insulin- or cAMP-stimulated G2S-TK-
LUC expression. The TCF-binding motif containing G2 element is known to mediate the
stimulation by cAMP, calcium, and insulin (183,296,479). Similarly, the stimulatory effect of
cAMP and insulin on G2S-TK-LUC expression was attenuated by IPA3 pretreatment (Fig.
4.3D). To further verify the inhibitory effect of IPA3 on cAMP signaling, we tested its effect in
GLUTag cells using the −302bp-gcg-LUC fusion gene, which contains the cAMP response
element (485). Evidently the stimulatory effect of cAMP elevation on LUC expression can be
moderately but significantly attenuated by IPA3 pretreatment (Fig. 4.3E). These, along with the
observed stimulatory effect of Wnt ligand Wnt3A on gcg promoter and gcg mRNA expression in

104
the GLUTag cell line (Fig. 4.4), indicated the involvement of Pak in mediating the crosstalk
between cAMP and Wnt signaling pathways as well as between insulin and Wnt signaling
pathways. We have also verified by qRT-PCR (Fig. 4.3F) and Northern blotting (Fig. 4.3G) that
IPA3 pretreatment partially blocked the stimulation by insulin on gcg mRNA expression in
GLUTag cells. Finally, we directly tested the effect of functional knockdown of Pak1, using the
dominant-negative Pak1 K299R plasmid construct. Cotransfection of Pak1 K299R significantly
attenuated the stimulation by insulin on the expression of the 2.4 kb-gcg-LUC fusion gene (Fig.
4.3H). Insulin has been shown to repress gcg expression in pancreatic islets (476,477), in
contrast to its stimulatory effect on gcg expression in the gut (479).
4.4.3 Pak inhibition attenuates insulin-stimulated β-cat Ser675
phosphorylation
PKA-mediated stimulation of β-cat Ser675 phosphorylation has been recognized as an
event leading to enhanced β-cat transcriptional activity and Wnt downstream target gene
expression (255,256). Insulin has also been shown to stimulate β-cat Ser675 phosphorylation in
intestinal nonendocrine cells (334). We demonstrate here that in the GLUTag cell line, F/I or
insulin treatment led to increased β-cat Ser675 phosphorylation (Fig. 4.5A and B). cAMP-
stimulated β-cat Ser675 phosphorylation can be blocked by PKA inhibition (H89) but not by
IPA3 (Fig. 4.5C). Insulin-stimulated β-cat Ser675 phosphorylation, however, can be partially
attenuated by IPA3 pretreatment (Fig. 4.5D). Thus, in the gut endocrine L cell line GLUTag,
both PKA and Pak activation lead to β-cat Ser675 phosphorylation. Based on this new
observation and our previous findings (296,479), we suggest that insulin is able to activate gut

105
gcg transcription via increasing β-cat Ser675 phosphorylation and concurrently involving the
activation of Pak1.

Insulin
A
C p-Pak1/2 (Thr423/Thr402)
Pak1 p-Akt1 (Ser473)
Akt1
Time (min) 0 5 60 30 10 20
Insulin
D p-Pak1 (Thr423)
Pak1
GSK3β p-GSK3α/β (Ser21/Ser9)
β-actin
Time (min) 0 5 60 30 10 20
Insulin
E p-Pak1 (Thr423)
Pak1
GSK3β p-GSK3α/β (Ser21/Ser9)
β-actin
p-Akt1(Ser473) Akt1
Time (min) 0 5 60 30 10 20
β-actin
Pak1 Pak2 Pak3 70 kDa
B
b c a
Fig. 4.1 Insulin activates Pak1 in gcg-expressing cell lines. A, Detection of the expression of group I Paks (Pak1, 68 kDa; Pak2, 61 kDa; Pak3, 65 kDa) in the GLUTag cell line. Approximately 40 g whole-cell lysate proteins were loaded into each lane for Western blotting, with indicated antibody. B, Colocalization of Pak1 and GLP-1 in mouse distal ileum cryptic L cells. A 5-cm region of mouse distal ileum was isolated and prepared for coimmunostaining of Pak1 (brown) and GLP-1 (pink). Arrow points to the same crypt region under various magnification views. Bar indicates 200 μm (a); 50 μm (b); 20 μm (c). C–E, Insulin stimulated Pak1 Thr423 phosphorylation in GLUTag (C), STC-1 (D), and mHypoE-20/2 (E) cell lines. All images are representative blots (n ≥ 3). Fold change indicates the change in p-Pak1 Thr423 levels compared to the basal level.
106
Fold change 1 1.2 1.3 1.6 2.8 2.9
Fold change 1 2.9 3.2 3.3 3.1 2.7
Fold change 1 5.4 7.2 3.2 3.5 1.7

C57BL/6
CD1
Pak1
γ-tubulin
γ-tubulin
Pak1
Fig. 4.2 Pak1 expression profiles in selected tissues of C57BL/6 and CD1 mice. A representative blot is shown. Protein lysates were prepared from indicated tissues of 8-weeks-old male C57BL/6 or CD1 mouse. Equal amount of proteins (40 µg) were loaded for Western blotting with Pak1 and γ-tubulin antibodies.
107

Fig. 4.3 Insulin-activated gcg promoter and mRNA expression can be attenuated by the Pak inhibitor IPA3. A, Insulin-stimulated Pak1 activation can be attenuated by IPA3 in GLUTag cells. GLUTag cells were serum starved for 16 h, and pretreated with IPA3 (10 μM) or dimethylsulfoxide (DMSO) (vehicle) for 1 h, followed by insulin treatment for 10 min. Line indicates noncontiguous lanes on the same blot. B–E, The stimulatory effect of insulin and cAMP on gcg promoter was attenuated by IPA3 pretreatment. GLUTag cells were transfected with 1 μg of 2.4kb-gcg-LUC (B and C), G2S-TK-LUC (D), or −302bp-gcg-LUC (E) for 18 h, followed by serum starvation for 16 h. The cells were then pretreated with IPA3 (10 μM) or DMSO for 1 h, followed by insulin (100 nM) or F/I (10 μM each) treatment for 4 h. LUC activity is presented as fold change against the control DMSO treatment (n ≥ 3 with triplicates in each experiment). F and G, Insulin-stimulated gcg mRNA expression was attenuated by IPA3. GLUTag cells were serum starved for 16 h, followed by IPA3 (10 μM) or DMSO pretreatment for 1 h. Total RNA was extracted for qRT-PCR (results normalized against 18S) (F) or Northern blotting (representative blot in which the line indicates the noncontiguous lanes on the same blot, n ≥ 3) (G). H, Dominant-negative Pak1 (K299R) cotransfection attenuated insulin-stimulated gcg promoter activity. GLUTag cells were cotransfected with Pak1(K299R) and 2.4 kb-gcg-LUC constructs (n ≥ 3). *, P ≥ 0.05; **, P ≥ 0.01; ***, P ≥ 0.001.
108
2.4kb-gcg-LUC
0 2 4 6 8
10 12 14 16
DMSO IPA3
Luci
fera
se (f
old
chan
ge) Basal F/I
*** ***
B
D E
F G H
C
0 1 2 3 4 5 6 7
DMSO IPA3
Luci
fera
se (f
old
chan
ge) Basal F/I
*** *
-302bp-gcg-LUC
2.4kb-gcg-LUC
0.0
0.5
1.0
1.5
2.0
DMSO IPA3
Luci
fera
se (f
old
chan
ge) Basal Insulin
*** *
0
1
2
3
4
DMSO IPA3 gcg
mR
NA
(fo
ld c
hang
e) Basal Insulin
** *
0
1
2
3
4
DMSO IPA3
Luci
fera
se (f
old
chan
ge) Basal Insulin F/I
*
*** *
*
G2S-TK-LUC
0.0
0.5
1.0
1.5
2.0
Luci
fera
se (f
old
chan
ge)
Basal Insulin
* *
Pak1 (K299R)
gcg
IPA3 - + - + Basal Insulin
18S
A p-Pak1/2 (Thr423/Thr402)
p-GSK3α/β (Ser21/Ser9)
Pak1
GSK3β
DMSO IPA3 Insulin
+ + + +
+ +
- -
- - -
-
Vector

A
0
1
2
3
Control Wnt3A (0.25 nM)
Wnt3A (2.5 nM)
Luci
fera
se (f
old
chan
ge) *
*
B
0
0.5
1
1.5
2
DMSO IPA3
gcg
mR
NA
(fol
d ch
ange
) Basal Wnt3A Wnt11
***
* N.S.
N.S.
Fig. 4.4 Wnt ligand Wnt3A stimulates gcg promoter and mRNA expression in GLUTag cell line. A, GLUTag cells were transfected with 1 µg of 2.4kb-gcg-LUC overnight, serum-starved for 16 h, and treated with indicated concentration of Wnt3A for 2 h. Cells are subsequently harvested for LUC analysis. B, GLUTag cells were treated with 2.5 nM Wnt3A or Wnt11 (a non-canonical Wnt ligand as control) for 2h, followed by RNA extraction and qRT-PCR.
109

B
A
C
D
Time (min) 0 5 10 30 60 120
p-β-cat (Ser675)
β-cat
p-CREB1 (Ser133)
β-actin
F/I
p-β-cat (Ser675) β-cat p-Akt1 (Ser473)
Akt1 β-actin
Time (min) 0 5 10 30 60 120
Insulin
Insulin - + - +
p-β-cat (Ser675)
β-cat
DMSO IPA3
p-β-cat (Ser675)
β-cat p-CREB1 (Ser133)
β-actin
IPA3
- + - + - + F/I
DMSO H89
Fig. 4.5 Insulin stimulates β-cat Ser675 phosphorylation in GLUTag cells. A and B: Both F/I and insulin stimulated β-cat Ser675 phosphorylation in GLUTag cells. GLUTag cells were serum-starved for 18 h, followed by F/I (10 µM each) (A) or insulin (100 nM) (B) treatment. C and D: F/I-stimulated β-cat S675 phosphorylation was attenuated by pre-treatment with the PKA inhibitor H89 but not with IPA3 (C), while insulin-stimulated β-cat Ser675 phosphorylation was attenuated by IPA3 pre-treatment (D). GLUTag cells were serum-starved for 16 h, followed by 1 h IPA3 (10 µM) or H89 (10 µM) pre-treatment and 30 min F/I (10 µM each) or insulin (100 nM) treatment. All images are representative blots (n=3). Fold change indicates the change in β-cat Ser675 levels compared to the basal level.
110
Fold change 1 3.8 2.9 4.5 3.2 2.4
Fold change 1 3.2 3.7 3.3 3.9 2.5
Fold change 1 2.6 1 1.3 1 0.9
Fold change 1 2.8 1 1.2

111
4.5 Discussion
Gcg encodes several important peptide hormones that are critically involved in glucose
homeostasis and satiety (192,472). Because gut GLP-1 and pancreatic glucagon exert opposite
effects on glucose homeostasis, significant effort has been made to identify molecular
mechanisms that control gcg expression in cell-type specific manners (192). Evidently cAMP
elevation stimulates gcg expression in both the gut endocrine L cells and pancreatic α-cells,
although the levels of stimulation could vary (173,175). Insulin is known to repress gcg
expression and glucagon secretion in pancreatic α-cells (476-478). We found previously,
however, that both the Wnt pathway effector β-cat/TCF7L2 and insulin specifically stimulate
gcg expression in gut endocrine L cells (296,479) and that this stimulation led to increased gut
GLP-1 production (296). We suggest that Wnt signaling as well as the crosstalk between Wnt
and insulin signaling pathway are among the cell-type specific mechanisms that control gut gcg
expression. Recently, García-Martínez et al. (486) have demonstrated that the Wnt/β-cat
signaling pathway also stimulates the production of another incretin hormone, glucose-dependent
insulinotropic peptide, indicating that Wnt signaling is a common regulator of incretin hormone
production.
Here we present evidence showing that, similar as in the skeletal muscle as demonstrated
by other groups (333,438), Pak1 is among the downstream targets of the insulin signaling
pathway in gut and brain gcg-expressing cells. In addition, insulin stimulates both Pak1 Thr432
phosphorylation/activation and β-cat Ser675 phosphorylation. Insulin-stimulated gcg
transcription in gut endocrine L cells can be attenuated by either the chemical inhibitor IPA3 or
the expression of dominant-negative Pak1 (K299R). These in vitro results collectively suggest

112
that: 1) Pak1 is important for gut and brain gcg expression, and 2) Pak1 mediates the stimulatory
effect of insulin on gcg transcription, using the Wnt signaling pathway bipartite transcription
factor β-cat/TCF as the effector. This is further supported by a very recent study, showing that in
another cell lineage Rac1/Pak1 cascade directly controls β-cat Ser675 phosphorylation and its
full activation (487).
Paks were initially discovered as effectors of the small GTPases, Cdc42 and Rac1.
Although the implication of Paks in cell motility and tumorigenesis has been well recognized
(466), relatively less is known about their involvement in metabolic homeostasis. Insulin
signaling is important in stimulating GLUT4 activity in muscle and adipocytes (488). Tsakiridis
et al. (333) demonstrated that insulin rapidly stimulates Pak1 in differentiated L6 muscle cells,
and the activation can be blocked by the PI3K inhibition. It has been implicated that this
stimulation mediates the effect of insulin on GLUT4 activation (425). In pancreatic β-cells, there
is accruing evidence that small G protein signaling is critically involved in insulin secretion
(489). Wang et al. (453) showed that small interfering RNA-mediated depletion of Pak1
abolished Rac1 but not Cdc42 activation and blocked the second phase of glucose-stimulated
insulin release. Subsequently Kowluru et al. demonstrated that Raf, Rac, and ERK are
importantly involved in glucose-stimulated insulin secretion, thus further supporting the pivotal
role of the small G protein signaling in pancreatic β-cells (490).
The role of Wnt ligands, Wnt signaling pathway, and its effectors β-cat and TCF7L2 in
glucose homeostasis has received widespread attention in the past few years (271,293,479),
especially after the discovery that certain single nucleotide polymorphisms within the intronic
region of TCF7L2 are strongly associated with the risk of type 2 diabetes (266,271,293,491,492).
A number of studies have shown that in pancreatic β-cells, TCF7L2 plays an important role in

113
facilitating insulin secretion, preventing β-cell apoptosis as well as in stimulating the expression
of receptors for the two incretin hormones (287,288). We show here that β-cat is a downstream
target of the insulin/Pak1 signaling cascade in regulating gcg expression in intestinal L cells. It
will be interesting to determine whether some of the observed beneficial effects of TCF7L2 in
pancreatic β-cells revealed to date are mediated by the Wnt signaling effector β-cat/TCF7L2,
with the participation of the insulin/Pak1/β-cat signaling cascade.
Group 1 Paks may exert certain redundant functions in neurons or other cell types. We
conclude that Pak1 mediates the crosstalk between cAMP and Wnt signaling pathways, as well
as the cross talk between insulin and the Wnt signaling pathways in gcg-expressing cell lines.
Functionally, these cross talks are important for gcg expression and gut GLP-1 production.
Questions that remain to be answered include: 1) whether the two other group I Paks (Pak2 and
Pak3) are also involved in gut and brain gcg expression and 2) whether brain insulin-Pak1
signaling cascade could provide therapeutic targets for improving peripheral glucose
homeostasis. Indeed, brain Pak1 is also controlled by the FOXO signaling pathway, another
downstream target of the insulin signaling (493).
4.6 Acknowledgements
We thank Dr. Jeffery Field for providing the K299R Pak1 plasmid and Dr. Denise Belsham for
providing the mHypoE-20/2 cell line.

114
5 Ablation of p21-activated protein kinase 1 perturbs glucose homeostasis
Data presented in this chapter (except Fig. 5.8 and 5.9), and those presented in Chapter 4, have
been published by Chiang et al. 2013. P21-activated protein kinase 1 (Pak1) mediates the cross
talk between insulin and β-catenin on proglucagon gene expression and its ablation affects
glucose homeostasis in male C57BL/6 mice. Endocrinology 154(1):77-88 (468).
All experiments were performed and figures contributed by Yu-ting Chiang. The Pak1-/- mouse
line was provided by Dr. Jonathan Chernoff (Fox Chase Cancer Center).

115
5.1 Abstract
We have previously identified the role of Pak1 as an effector of insulin-stimulated the
proglucagon gene (gcg) expression, and as a linker for the crosstalk between insulin and Wnt
signaling pathways in the intestinal and brain gcg-expressing cell lines. In order to assess the in
vivo physiological role of Pak1 in metabolic homeostasis, we have characterized the Pak1−/−
mice. Gut gcg levels were reduced in male Pak1−/− mice, associated with impaired glucose
tolerance after an ip or oral glucose challenge. These mice had lower circulating active GLP-1
levels after a glucose challenge, as well as reduced distal ileum GLP-1 content after insulin
treatment. Finally, the Pak1−/− mice exhibited reduced brainstem gcg mRNA levels and
abolished β-cat Ser675 phosphorylation in brain neurons after insulin treatment. These
observations suggest that Pak1 mediates the crosstalk between insulin and Wnt signaling
pathways on gut and brain gcg expression, and its ablation reduced circulating postprandial GLP-
1 levels, which contributed to the defects in glucose homeostasis in Pak1−/− mice.
5.2 Introduction
Pak1 deficient mice were previously shown to exhibit defects in the second phase of
pancreatic insulin secretion, peripheral insulin resistance, and ip glucose tolerance test (IPGTT)
(438). Notably, islets obtained from T2D patients have ~80% reduction in Pak1 protein levels,
and IPA treatment resulted in impaired glucose stimulated insulin secretion (GSIS) in human
islets (438). These observations implicate the importance of Pak1 in pancreatic β cell insulin
secretion and the manifestation of glucose intolerance.

116
I have previously identified Pak1 as an effector of insulin-stimulated gcg expression in
both intestinal and brain gcg-expressing cells (468). Insulin stimulated Pak1 Thr423
phosphorylation and activation, associated with insulin-mediated β-cat phosphorylation at
Ser675 (468). Gcg promoter activity and mRNA production following insulin treatment was
attenuated in the presence of the group I Pak inhibitor IPA3, and expression of dnPak1 blocked
insulin-stimulated gcg promoter expression (468). As the incretin effect is estimated to
contribute 50-70% of postprandial insulin secretion, and is importantly involved in the regulation
of glucose homeostasis, in this study I aimed to assess the in vivo roles of Pak1 in gcg expression
and GLP-1 production, and the effect of Pak1 ablation on glucose homeostasis (438).
5.3 Materials and methods
5.3.1 Real-time quantitative reverse-transcriptase PCR
Gcg mRNA levels were normalized to 18S ribosomal RNA levels. The primer pairs used
are as follows: gcg forward, 5′-TGG ACT CCC GCC GTG CCC AA-3′, gcg reverse, 5′-CGA
CTT CTT CTG GGA AGT CTC GCC T-3′, 18S forward, 5′-CGG ACA TCT AAG GGC ATC
A-3′, and 18S reverse, 5′-AAG ACG GAC CAG AGC GAA A-3′.
5.3.2 Mouse distal ileum GLP-1 extraction
The extraction of GLP-1 from mouse distal ileum sections were performed using a
protocol developed by Dr. Patricia Brubaker (494). The procedure involved the extraction of

117
peptides from distal ileum tissue using the Classic C18 Sep-Pak cartridges from Waters (Milford,
MA, USA). The distal ileum section was dissected from mice, and homogenized using a polytron
in extraction medium (1% trifluoroacetic acid, TFA, pH-adjusted to 2.5 using diethylamine). The
cartridges were pre-moistened using 10 mL Reagent A (80% 2-propanol with 0.1% TFA), and
washed with Reagent B (0.1% TFA solution in water). The tissue homogenate was added slowly
to the cartridge using a syringe, and the flow-through was discarded. After washing with 10 mL
of Reagent B, the bound peptides were eluted using the appropriate volume of Reagent A. The
purified peptides were collected into a clean tube and stored at −80°C for further GLP-1 RIA
measurements.
5.3.3 Mouse brain primary neuron isolation
The protocol for isolating mouse brain primary neurons was modified from an existing
protocol (495). On day 1, the cerebellums were dissected from neonatal (P0 to P7) mice, rinsed
with glucose-PBS solution (2 mg/mL glucose in 1 × PBS at pH 7.4), placed into a 15mL tube,
and minced using sterilized surgical dissecting scissors. Immediately, the trypsin/DNase solution
(10 mg/mL trypsin, 1 mg/mL DNase, 5 mg/mL MgSO4, 2 mg/mL glucose, prepared in 1 × PBS
at pH 7.4) was added at a volume to cover the tissue pieces, and the tube is incubated at 37°C for
3 minutes. Using a 20 G needle, the tissue solution was drawn up and then expelled, with the
entire process repeated 15-20 times to mechanically shear the tissue pieces. After the process has
been completed, the tissue homogenate was loaded onto a Percoll gradient with 30% and 60%
Percoll, and centrifuged at 150 × g at 4°C for 2 minutes. The neuron-enriched fraction resides at
the 30%-60% interface, and was collected into a new tube. The neuron-enriched fraction is
resuspended in culturing medium (DMEM with 10% FBS and 2% glucose), and plated at 2.5-5 ×

118
104 cells/mL on polylysine-coated dishes. The primary neurons are incubated in 37°C at 5% CO2
for overnight. On day 2, if needed, the neurons were serum starved, for subsequent treatments on
day 3.
5.3.4 Intraperitoneal and oral tolerance tests
For ip glucose tolerance test (IPGTT), ip pyruvate tolerance test (IPPTT), ip insulin
tolerance test (IPITT), mice were fasted for 16 h prior to the test, and for glucagon challenge
(GC) mice were fasted for 6 h prior to the test. An ip bolus of glucose (2 g/kg), pyruvate (2
g/kg), insulin (0.75 U/kg) or glucagon (15 μg/kg) was administered, respectively, and tail vein
blood samples were collected at indicated time points followed by AccuChek glucometer
(Roche, Basel, Switzerland) measurements.
For oral glucose tolerance test (OGTT), mice were fasted for 16 h prior to the test. An
oral glucose load (2 g/kg) was given via gavage, followed by the same blood collection and
glucose measurement method as described above.
5.3.5 Hormone measurements
Mice blood was collected from tail vein followed by the isolation of the serum or plasma
fraction. Hormone analyses were conducted using the following commercial kits: Insulin, mouse
insulin ELISA kit from Crystal Chem Inc. (Downer’s Grove, IL, USA);; total GLP-1, RIA kit
from EMD Millipore (Billerica, MA, USA) and ELISA kit from Meso Scale Discovery
(Rockville, MD, usa); active GLP-1, ELISA kit from Meso Scale Discovery with an antibody

119
recognizing GLP-17-36 amide; glucagon, RIA assay from EMD Millipore; GLP-2, Yanaihara
(Shizuoka, Japan). All protocols were conducted as per manufacturers’ instructions.
5.4 Results
5.4.1 Pak1−/− mice in mixed C57BL/6-129 background have normal
phenotypes
A recent study by Wang et al. (438) demonstrated that Pak1−/− mice in the C57BL/6
genetic background exhibit defects in glucose disposal, associated with peripheral insulin
resistance and impaired GLUT-4 translocation in skeletal muscle after insulin stimulation. Here,
we focused on determining the effect of Pak1 ablation on gut and brain gcg expression, GLP-1
content, and glucose homeostasis.
5.4.2 Pak1−/− mice in C57BL/6 background show impaired glucose
disposal and reduced gut gcg expression level
The absence of Pak1 protein expression in various tissues was confirmed by Western
blotting (Fig. 5.1A). In the C57BL/6 background, the adult male Pak1−/− mice showed a trend of
increased body weight starting at the age of 19 wk (Fig. 5.1B). This trend, however, was less
obvious when the mice were in the mixed C57BL/6-129 genetic background (Fig. 5.2).
Importantly, the Pak1−/− mice showed impairments in IPGTT (Fig. 5.1C), which is in agreement
with the findings by Wang et al. (438), as well as in OGTT (Fig. 5.1D). Furthermore, the Pak1−/−

120
mice exhibited increased blood glucose levels in IPPTT (Fig. 5.1E), indicating these mice may
have elevated hepatic glucose production.
To determine whether Pak1 ablation affects circulating hormone levels, mice were
challenged with glucose gavage. Wild-type mice showed a significant increase in serum insulin
levels at 30 min after glucose gavage. The increase in the Pak1−/− mice, however, was not
detectable (Fig. 5.3A). Furthermore, serum glucagon levels were significantly lower in the
Pak1−/− mice, both before and 30 min after the glucose gavage (Fig. 5.3B). We, however, did not
detect any notable defects in the architecture of Pak1−/− mice in their pancreatic islets, as shown
by insulin and glucagon co-immunostaining (Fig. 5.4).
We then examined whether Pak1 ablation affects gut gcg expression in vivo. The Pak1−/−
mice showed significantly reduced gut gcg mRNA levels, assessed by qRT-PCR (Fig. 5.3C).
This reduction, however, was not appreciably associated with a change of circulating total GLP-
1 level, either during fasting or 5 min after oral glucose gavage (Fig. 5.3D). We then measured
active GLP-1 levels (GLP-17-36 amide) and observed that wild-type mice had increased serum
active GLP-1 levels after glucose gavages; however, this increase was absent in the Pak1−/− mice
(Fig. 5.3E). We then assessed distal ileum GLP-1 content by dissecting a 5-cm region of the
distal ileum followed by treatment with or without insulin for 2 h. The distal ileum GLP-1
content was induced by insulin treatment in the wild-type mice but not in the Pak1−/− mice (Fig.
5.3F).

121
5.4.3 Pak1−/− mice have reduced brainstem gcg expression level
Gcg is expressed in the brainstem and central infusion of GLP-1 or GLP-1 receptor
agonist inhibits food intake. As Pak1 is also abundantly expressed in the mouse brain, I then
aimed to assess whether Pak1 ablation would affect brain gcg expression. As shown in Fig.
5.5A, Pak1−/− mice had dramatically reduced brain gcg mRNA level as measured by qRT-PCR.
Furthermore, I observed that in the brain gcg-expressing mHypoE-20/2 cell line, insulin or F/I
treatment stimulated gcg promoter expression. The stimulation can be significantly attenuated by
IPA3 pretreatment in both cases (Fig. 5.5B).
5.4.4 Pak1−/− mouse brain neurons show abolished response to insulin
on β-cat Ser675 phosphorylation
Brain neuron cells from Pak1−/− mice and wild-type controls were prepared for insulin or
F/I treatment. Whereas cAMP-stimulated β-cat Ser675 phosphorylation was partially attenuated
in the Pak1−/− mice (Fig. 5.6A), insulin-stimulated β-cat Ser675 phosphorylation was abolished
in the Pak1−/− mice, although insulin was still able to stimulate Akt Ser473 phosphorylation (Fig.
5.6B).
5.4.5 Pak1-/- mice have reduced distal ileum weight
The distal ileum section was dissected from the mice the age of 16 wks and 8 wks. A 5
cm longitudinal segment was isolated from each mouse, and organ weight measurement was

122
performed (Fig. 5.7). At both age groups, the Pak1−/− mice have about 30% reduction in distal
ileum weight.
5.4.6 Pak1-/- mice have comparable responses to intraperitoneal insulin
tolerance test
At the age of 7wks, ip insulin tolerance test was performed in Pak1−/− and age-matched
wild-type control mice (Fig. 5.8). Both groups of mice exhibited comparable responses to ip
insulin, where blood glucose levels fell within the first 60 min post ip insulin followed by
subsequent normoglycemia after the first 60 min.

Pak1-/- mouse Wild-type mouse
Pak1 β-actin
A
B
D E
5
10
15
20
0 20 40 60 80 100 120
Glu
cose
(mm
ol/L
)
Time (min)
Wild-type Pak1-/-
0
1000
2000
AU
C
Wild-type Pak1-/- Pak1-/-
**
*
*
Pak1-/-
OGTT
5
10
15
20
0 20 40 60 80 100 120
Glu
cose
(mm
ol/L
)
Time (min)
Wild-type Pak1-/-
0
500
1000
1500
AU
C
Wild-type Pak1-/- Pak1-/-
***
**
Pak1-/-
IPPTT
5
10
15
20
25
30
0 20 40 60 80 100 120
Glu
cose
(mm
ol/L
)
Time (min)
Wild-type Pak1-/-
0
1000
2000
3000
AU
C
Wild-type Pak1-/- Pak1-/-
**
**
**
Pak1-/-
IPGTT C
0
10
20
30
40
50
4 6 8 10 12 19 21 24
Body
wei
ght (
g)
Age (weeks)
Wild-type Pak1-/- Pak1-/-
Fig. 5.1 Pak1-/- mice exhibit impaired glucose disposal. A, Lack of Pak1 protein expression in Pak1-/- mouse tissues. Wild-type mouse pancreas serves as positive control. B, Pak1-/- mice showed a trend of increased body weight starting at wk 19 (n ≥ 6). C, Representative result of IPGTT (30 wk old, n ≥ 10). Inset shows area under the curve (AUC). D, Representative result of OGTT (31 wk old, n ≥ 12). Inset shows AUC. E) Representative result of IPPTT (12 wk old, n ≥ 6 for both groups). Inset shows AUC. *, P ≥ 0.05; **, P ≥ 0.01; ***, P ≥ 0.001.
123

0
10
20
30
40
50
4 6 8 10 12 19 21 24
Body
wei
ght (
g)
Age (weeks)
Wild-type Pak1-/- Pak1-/-
Fig. 5.2 Body weight monitoring of Pak1-/- mice in C57BL/6-129 mixed genetic background. Measurements performed with n=5 mice per group.
124

0
20
40
60
80
100
Basal Insulin
Dist
al il
eum
GLP
-1 c
onte
nt
(pg/
mL)
0
2
4
6
8
Fasting 5 min 15 min
Seru
m a
ctiv
e G
LP-1
(p
g/m
L)
A
D C
E
0.0
0.5
1.0
1.5
Wild-type Pak1-/-
gcg
mR
NA
(fo
ld c
hang
e)
Pak1-/-
***
0
10
20
30
40
Fasting 5 min Se
rum
tota
l GLP
-1
(pg/
mL)
Wild-type Pak1-/-
Wild-type Pak1-/-
*** ***
F
Wild-type Pak1-/-
*** *
Wild-type Pak1-/-
0
20
40
60
80
Fasting 30 min 60 min
Seru
m g
luca
gon
(p
g/m
L)
** **
B
0.0
0.5
1.0
1.5
2.0
Fasting 30 min
Seru
m in
sulin
(ng/
mL)
Wild-type Pak1-/-
* **
Fig. 5.3 Pak1-/- mice show abnormalities in plasma hormone levels and gut gcg expression. A, Pak1-/- mice show attenuated elevation of insulin 30 min after glucose challenge (12 wk old, n ≥ 4). B, Pak1-/- mice exhibit reduced glucagon levels during fasting and postglucose gavage. After mice (12 wk old and n ≥ 4 per group) were fasted for 16 h, blood samples were taken before and after glucose gavage (2 g/kg, in PBS) at indicated times. Serum glucagon levels were measured by RIA (Millipore). C, Distal ileum gcg mRNA level was significantly reduced in Pak1-/- mice. gcg mRNA levels were determined by qRT-PCR (16 wk old, n ≥ 6 for both groups). D and E, Assessment of serum total (D) and active (E) GLP-1 levels in the Pak1-/- mice. The Pak1-/- mice showed no significant difference in serum total GLP-1 levels under fasting condition and 5 min postglucose gavage (n ≥ 4 for both groups, aged 16 wk). For assessment of serum-active GLP-1 levels, mice were faster for 16 h followed by three glucose gavages spaced at 5-min intervals. The Pak1-/- mice exhibited attenuated rise in serum active GLP-1 at 5 min after the third glucose gavage (24 wk old, n ≥ 9). F, Insulin-stimulated GLP-1 content in the distal ileum is attenuated in the Pak1-/- mice. The distal ileum 5-cm segments are dissected out from 16 h-fasted mice (28 wk, n ≥ 8 –9) and treated with or without insulin (100 nM, 2 h). Tissue GLP-1 content was normalized to tissue protein content. *, P ≥ 0.05; **, P ≥ 0.01; ***, P ≥ 0.001.
125

Fig. 5.4 Pak1-/- mice exhibit comparable pancreatic islet architecture. Pancreas sections of a Pak1-/- mice and an age-matched wild-type controls (age 9 or 10wks) were prepared for co-immunostaining of insulin (brown) and glucagon (red). Arrow points to the islet shown in the insets, bar indicates a and c: 1 mm, b and d: 100 µm.
a b
c d
126
Wild-type
Pak1-/-

B A
0.0
0.2 0.4 0.6
0.8 1.0
1.2 1.4 1.6
Wild-type Pak1-/-
gcg
mR
NA
(fol
d ch
ange
) ***
Pak1-/-
0
1
2
3
4
5
DMSO IPA3
Luci
fera
se (
fold
cha
nge)
Basal Insulin F/I
*
**
*
**
Fig. 5.5 Pak1-/- mice show reduced brainstem gcg mRNA level and IPA3 attenuates insulin-and forskolin-stimulated gcg promoter activity in brain neurons. A, Pak1-/- mice show reduced brainstem gcg expression levels by qRT-PCR (16 wk old, n ≥ 6 for both groups). B, IPA3 attenuates insulin- and F/I- stimulated 2.4 kb-gcg-LUC promoter activity in the mHypoE-20/2 cell line. The cells were transfected with 2.4 kb-gcg-LUC for 24 h, pretreated with IPA3 or dimethylsulfoxide (DMSO) and stimulated with insulin or F/I for 4 h, followed by LUC analysis (n ≥ 3, triplicates each). *, P ≥ 0.05; **, P ≥ 0.01; ***, P ≥ 0.001.
127

B
p-β-cat (Ser675)
β-cat
p-Akt1 (Ser473)
Akt1
0 0 60 60 120 120 Wild-type
Insulin (min) Pak1-/-
Fold 1 1.2 1.5 1 0.6 0.6
A
p-β-cat (Ser675)
β-cat
p-CREB1 (Ser133) β-actin
- + - + F/I
Wild-type Pak1-/-
Fold 1 2.1 1 1.3
Fig. 5.6 Pak1-/- mice brain neurons show lack of response in insulin-stimulated β-cat Ser675 phosphorylation. A, Neuronal cells from Pak1-/- mice show attenuated F/I-mediated β-cat Ser675 phosphorylation. Representative blot (n ≥ 3) is shown with brain neuronal cells from Pak1-/- mice and wild-type controls. Fold change of p-β-cat Ser675 is shown, with each basal state defined as 1-fold. B, Neuronal cells from Pak1-/- mice lack the β-cat Ser675 phosphorylation in response to insulin stimulation (representative blot, n ≥ 3 for both groups). Fold change of p-β-cat Ser675 is shown, with each basal state defined as 1-fold.
128

Fig. 5.7 Pak1-/- mice exhibited reduced weight of distal ileum. Male mice were sacrificed for organ extraction and organ weight measurement at the age of 16 wks (A) (n≥6) or 8 wks (B) (n≥6). Pak1-/- mice showed significant reduction in distal ileum weight (measurement performed using 5 cm segments).
A B
0.00
0.02
0.04
0.06
0.08
0.10
0.12
Wild-type Pak1-/-
Dist
al il
eum
wei
ght (
g)
**
Pak1-/- 0.00
0.02
0.04
0.06
0.08
0.10
0.12
Wild-type Pak1-/-
Dist
al il
eum
wei
ght (
g)
***
Pak1-/-
129

0.0
2.0
4.0
6.0
8.0
10.0
12.0
0 10 30 60 90 120
Bloo
d gl
ucos
e lev
el
Time (min)
WT
Pak1-/-
Fig. 5.8 Pak1-/- mice and age-matched wild-type (WT) mice have comparable responses in intraperitoneal insulin tolerance test. Male mice were subjected to intraperitoneal insulin tolerance test at the age of 7 wks (n≥6).
130
Pak1+/+
Pak1-/-
Wild-type

131
5.5 Discussion
In an ex vivo study by Wang et al., Pak1−/− islets exhibited profound defects in the second
phase of insulin secretion (438). They subsequently conducted their in vivo study, revealing that
Pak1−/− mice showed impaired IPGTT and IPITT (438). I aimed to expand the characterization
of the Pak1−/− mice, from the angle of incretin hormone production and glucose homeostasis. In
addition to confirming the defects in IPGTT, I demonstrated the defect in OGTT in the Pak1−/−
mice in the C57BL/6 background.
In my study, reduced brain gcg mRNA level was observed in the Pak1−/− mice. Because
brain GLP-1 signaling is known to affect insulin action in peripheral tissues including the liver
(225,496); hence, it will be interesting to determine whether deleting Pak1 specifically in the
brain would affect glucose disposal.
The Pak1−/− mice exhibited a significant reduction of distal ileum weight both at 8 wks
and at 4 months (Fig. 5.7), which points to a potential role of Pak1 in the production of GLP-2,
another gcg-encoded hormone involved in the growth of small intestines (120). Preliminary
results support this notion, and show that the Pak1−/− mice have reduced circulating GLP-2 levels
(details see Section 7.3.4 and Appendix 3).
In my study, the Pak1−/− mice did not exhibit a substantial defect in IPITT (Fig. 5.8) as
previously observed by Wang et al. (438). In my study, the Pak1−/− mice showed reduced serum
glucagon levels, both during fasting and at 30 min after feeding (Fig. 5.3B). This implicates that
Pak1 is potentially involved in pancreatic glucagon secretion, although reduced glucagon
secretion was not observed by Wang et al. in their ex vivo Pak1−/− islet study (438).
Alternatively, this may be due to a compensatory mechanism to maintain a proper circulating

132
insulin and glucagon ratio, as the Pak1−/− mice exhibited reduced serum insulin levels as well.
This yet-to-be-identified compensatory mechanism may undermine the relatively modest
metabolic defects observed in these Pak1−/− mice in the absence of a challenge. The reduction of
both serum insulin and glucagon levels at basal states would allow the Pak1−/− mice to maintain
euglycemia in the absence of oral glucose challenge.
Although gut gcg mRNA levels are reduced significantly in the Pak1−/− mice, we did not
see reduced levels of circulating total GLP-1, neither during fasting nor 5 min after an oral
glucose challenge. A potential explanation is the existence of compensatory mechanisms to
maintain blood GLP-1 at a desirable level. We, however, cannot eliminate the possibility that
current technology for GLP-1 detection is not sensitive enough for revealing the subtle
difference in the Pak1−/− mice vs. the wild-type controls. Indeed, plasma GLP-1 levels are within
the nanomolar range, which are much lower compared with that of insulin or glucagon. To date,
the measurement of plasma GLP-1 levels has not been developed as a diagnostic tool for
diabetes, although a few studies have reported that certain type 2 diabetes patients have reduced
plasma GLP-1 levels (497,498). In the insulin-resistant and hyperinsulinemic MKR mouse
model, elevated serum GLP-1 levels were observed during fasting, although feeding-stimulated
GLP-1 secretion was attenuated (480). In my study, the Pak1−/− mice did exhibit a reduced active
serum GLP-1 level after glucose gavage. Whether Pak1 signaling is involved in protecting active
GLP-1 from DPP-IV-mediated degradation is worth to be investigated.
Group 1 Paks may exert certain redundant functions in neurons or other cell types.
Knockout mice lacking either Pak1 or Pak3 were shown to bear no abnormalities in overall
neuronal morphology and brain development (499). On the contrary, mice lacking both Pak1 and
Pak3 exhibited severely impaired postnatal brain growth, resulting in a dramatic reduction in
133
brain volume (499). We present here that Pak1 depletion significantly reduced brain gcg
expression. This, along with the findings that both cAMP elevation and insulin treatment
increased β-cat Ser675 phosphorylation in brain neurons and that Pak1−/− neurons show
attenuated or blocked responses to cAMP and insulin stimulation, suggests that Pak1 mediates
the crosstalk between cAMP and Wnt signaling pathways as well as the crosstalk between
insulin and the Wnt signaling pathways in the brain. Functionally, this crosstalk is important for
brain gcg expression and GLP-1 production. Questions that remain to be answered include: 1)
whether the two other group I Paks (Pak2 and Pak3) are also involved in brain gcg expression
and 2) whether the brain insulin-Pak1 signaling cascade could provide therapeutic targets for
improving peripheral glucose homeostasis. Indeed, brain Pak1 is also controlled by the forkhead
box O (FOXO) signaling pathway, another downstream target of the insulin signaling (493).
Figure 5.9 summarizes our current understanding of the key roles of Pak1 in glucose
homeostasis. In muscle, Pak1 mediates the effect of insulin in stimulating GLUT4 translocation
(333,438). In the pancreas, Pak1 is required for the second phase of glucose-induced insulin
secretion, possibly via glucose-stimulated Erk1/2 activation (438). Since we show that Pak1-/-
mice exhibited reduced serum glucagon level, whether Pak1 mediates pancreatic glucagon
secretion needs to be further investigated. In this study, we have also shown that in the gut and
brain, Pak1 controls gcg expression and GLP-1 production. This is at least partially mediated by
the stimulation of Ser675 phosphorylation of β-cat, the major effector of the Wnt signaling
cascade. Impaired IPPTT in Pak1-/- mice observed in the current study could be an indirect effect
on liver gluconeogenesis, due to attenuated insulin signaling and reduced GLP-1 production.
Whether more severe abnormalities occur in the Pak1-/- mice after a high-fat diet challenge is
worth investigating. It will also be interesting and worthy to further assess the contribution of

134
Pak1 in metabolic homeostasis in mouse models with tissue-specific knockout approaches and to
determine the roles of the other two group I Paks in metabolic homeostasis.

Pak1
Cdc42/Rac1 Insulin
Glucose transport:
• Muscle (GLUT4)
Hormone gene expression:
• Gut (gcg)
• Brain (gcg)
Hormone secretion:
• Gut (GLP-1)
• Pancreas (insulin)
Fig. 5.9 Our current understanding of the role of Pak1 in glucose homeostasis. In the muscle, Pak1 is important for insulin-stimulated GLUT4 translocation together with Cdc42/Rac1 small GTPases. The current study shows the role of Pak1 in mediating the stimulatory effect of insulin on gut and brain gcg expression, involving the Wnt effector β-catenin. Furthermore, Pak1 plays a role in the secretion of metabolic hormones, including insulin and GLP-1.
135
β-cat

136
5.6 Acknowledgements
We thank Ms. Christina Li for technical assistance for the mouse blood collection, and Dr.
Jonathan Chernoff for providing the Pak1-/- mouse line.

137
6 The role of p21-activated protein kinase 1 in hepatic glucose production
Data presented in this chapter (except Fig. 6.9) have been included in a first-author manuscript
by Yu-ting Chiang et al (revised manuscript submitted, Endocrinology).
All experiments were performed and figures contributed by Yu-ting Chiang. The Pak1-/- mouse
line was provided by Dr. Jonathan Chernoff (Fox Chase Cancer Center).

138
6.1 Abstract
Pak1 plays a role in insulin secretion and GLP-1 production. Pak1-/- mice were found to
carry a defect in IPPTT, leading us to speculate whether Pak1 represses hepatic gluconeogenesis.
We show here that the defect in IPPTT became more severe in aged Pak1-/- mice. In primary
hepatocytes, IPA3, a potent inhibitor of group I Paks, reduced basal glucose production,
attenuated forskolin- or glucagon-stimulated glucose production, and attenuated the stimulation
of forskolin on the expression of Pck1 and G6pc. These in vitro observations imply that the
direct effect of Paks in hepatocytes is the stimulation of gluconeogenesis, and that the
impairment in IPPTT in Pak1-/- mice is due to the lack of Pak1 elsewhere. Consecutive i.p.
injection of forskolin for two weeks increased gut proglucagon gene (gcg) expression, associated
with improved IPPTT in aged Pak1-/- mice and wild-type controls. In addition, administration of
the DPP-IV inhibitor sitagliptin for 1 wk reversed the defect in IPPTT in aged Pak1-/- mice,
associated with increased plasma GLP-1 levels. Our observations indicate a potential role of
Pak1 in the gut/liver axis or gut-pancreas-liver axis in controlling glucose disposal, and affirmed
the therapeutic application of GLP-1 and DPP-IV inhibitors in attenuating hepatic
gluconeogenesis.
6.2 Introduction
Group I Paks function as critical effectors that link Rho GTPases (Rac1 and Cdc42) to
cytoskeleton reorganization, and hence are involved in regulating various important cellular
functions including cell survival, differentiation, proliferation, polarity and hormone secretion
(383,384,489,500,501). An early investigation in muscle cells revealed that insulin stimulates

139
Pak1 via a PI3K-dependent mechanism (333). This activation is likely responsible for muscle
cell GLUT4 translocation (425). The utilization of small interference RNA knockdown,
dominant negative Pak1 cDNA transfection and other approaches has also implicated the role of
Pak1 in mediating the second phase of glucose-stimulated insulin secretion (453) and the
secretion of the incretin hormone GLP-1 from intestinal endocrine L cells (480). Utilizing the
Pak1-/- mice, Wang and colleagues conducted an ex vivo study and reported that Pak1-/- islets
exhibited a substantial defect in second phase of insulin secretion (499).
As a serine and threonine protein kinase, Pak1 phosphorylates a battery of downstream
target proteins, including β-catenin (β-cat) (502,503), which forms a bipartite transcription factor
with a member of the TCF family in controlling Wnt pathway downstream target gene
expression. Our laboratory demonstrated that Pak1 acts as a downstream effector of insulin
signaling in the crosstalk with the Wnt signaling pathway in colon cancer cell lines (334). In the
gut endocrine L cells, however, this crosstalk leads to increased expression of the proglucagon
gene (gcg) and the synthesis of GLP-1 (468). Pak1-/- mice show reduced gut gcg mRNA
expression and reduced plasma GLP-1 levels upon glucose challenge (468). Pak1-/- mice were
also shown to carry a moderate impairment in response to pyruvate (468), a major substrate for
gluconeogenesis, leading us to wonder whether Pak1 exerts a repressive effect on hepatic
glucose production.
The liver is the major organ for glucose production during fasting as well as for the
conversion of glucose into glycogen after feeding. During fasting, elevation of glucagon levels
leads to the activation of key transactivators of gluconeogenic genes, while after feeding,
elevation of insulin leads to the inactivation of certain key transactivators such as FOXO
proteins. Glucagon and insulin also mediate the effect of stress and other signaling cascades in

140
regulating glucose homeostasis (499,503-506). Although the detailed underlying mechanism is
still unclear, GLP-1 was shown to repress hepatic gluconeogenesis in both insulin-dependent and
-independent manners (507,508). In the current study, we observed that aged Pak1-/- mice show
more profound intolerance in response to pyruvate challenge. Surprisingly, in vitro analysis with
primary hepatocytes indicated that group I Paks are likely positive regulators of gluconeogenesis,
suggesting that the defect in aged Pak1-/- mice in response to pyruvate challenge is due to the
lack of Pak1 in extra-hepatic organs. Activation of GLP-1 signaling through either i.p. forskolin
injection or the administration of the DPP-IV inhibitor sitagliptin increased gut gcg expression or
the plasma GLP-1 levels, along with the restoration of tolerance to i.p. pyruvate challenge. Our
observations indicate a potential role of Pak1 in controlling hepatic glucose production through
the gut-GLP-1-liver axis. These observations affirm the therapeutic application of GLP-1 and
DPP-IV inhibitors in attenuating hepatic gluconeogenesis.
6.3 Materials and methods
6.3.1 Mouse primary hepatocyte isolation
The protocol for mouse primary hepatocyte isolation was adapted from a published
protocol (509). The 6-10 weeks old C57BL/6 male mice were anesthetized using isoflurane,
followed by cannulation of the hepatic portal vein using a 23 G needle and the cutting of the
inferior vena cava (IVC). Perfusion of the liver was initiated with supplemented Hank’s
Balanced Salt Solution (HBSS, 5mM glucose, 0.5mM EGTA, 25mM HEPES at pH7.4) for 5-10
min, and then switched to digestion medium (DMEM with 5 mM glucose, 100 U/mL penicillin,
0.1 mg/mL streptomycin, 15 mM HEPES, 100 U/mL type IV collagenase) for an additional 5-

141
10min digestion. After digestion was complete, the liver was excised and transferred to a sterile
dish containing the same digestion medium. Primary hepatocytes obtained from the digested
liver were passed through a 74 μm cell strainer, followed by three cycles of washing and final
resuspension in isolation medium (DMEM with 25mM glucose, 100 U/mL penicillin, 0.1 mg/mL
streptomycin, 15mM HEPES, 100 nM dexamethasone, 10 % FBS). The viability and yield of the
cells were determined using trypan blue staining, and preparations achieving ≥ 90% viability
were used for experimental procedures.
6.3.2 Glucose production assay
Following mouse primary hepatocyte isolation, the hepatocytes were plated on collagen-
coated (5 μg/cm2 type I collagen) 12-well plates at 60-70% density and cells were incubated for
16-24h for attachment. The evening prior to glucose production assays, cells were changed to
serum-free and phenol red-free glucose production medium (GPM) (DMEM with 5 mM glucose,
44 mM NaHCO3, 2 mM L-glutamine, penicillin/streptomycin, 5 mM HEPES, 10 nM
dexamethasone). For glucose production, cells were washed and incubated in fresh GPM plus 10
nM of pyruvate/lactate substrate, followed by pretreatment of IPA3 or DMSO vehicle control for
1h. After 1h, treatment was initiated with various agents such as forskolin, glucagon, insulin, or
exendin-4. Medium was collected after 4 h and amount of glucose was measured using a glucose
assay kit from Sigma Aldrich (St. Louis, MO, USA). Cells were harvested in protein lysis buffer
to determine protein content, which was used to normalize glucose production measurements.

142
6.3.3 Real-time quantitative reverse-transcriptase PCR
DNA sequence information for oligonucleotide primer pairs utilized in this study is as
follows: Pck1 (5'-CAT AAC GGT CTG GAC TTC TCT GC-3', 5'-GAA TGG GAT GAC ATA
CAT GGT GCG-3'); G6pc (5'-CTC TGG GTG GCA GTG GTC GG-3', 5'-AGG ACC CAC
CAA TAC GGG CGT-3'); Gcg (5’-TGG ACT CCC GCC GTG CCC AA- 3’, 5’-CGA CTT CTT
CTG GGA AGT CTC GCC T- 3’);; 18s (5’-CGG ACA TCT AAG GGC ATC A-3’, 5’-AAG
ACG GAC CAG AGC GAA A-3’).
6.3.4 Intraperitoneal administration of forskolin and sitagliptin gavage in
mice
Forskolin was administered as daily ip injections (5 mg/kg per day) for the duration of
two weeks. Sitagliptin (Januvia®) was administered daily as oral gavage (dose 300 mg/kg per
day) for a total duration of 5 weeks. Prior to each gavage, a fresh sitagliptin working stock was
prepared by dissolving the tablets in the appropriate volume of saline buffer.
6.4 Results
6.4.1 Aged Pak1-/- mice exhibit more severe defects in IPPTT and GLP-
1 secretion response
We observed previously that compared to wild type littermates, Pak1-/- mice had
moderately elevated blood glucose levels in response to pyruvate injection (468). Hepatic

143
glucose production is controlled by multiple metabolic hormones in response to nutritional and
environmental changes. The three major hormones are glucagon, insulin and GLP-1, involving a
battery of transcription factors including FOXOs, the effectors of stress and ageing signaling
pathway. To assess whether the severity of the defect in IPPTT correlates with ageing, we
conducted pyruvate tolerance test in a set of Pak1-/- mice and age-matched control mice at the
age of 12 months. Although there was no appreciable difference between the knockout mice and
the control mice in fasting blood glucose levels, the aged Pak1-/- mice exhibited profound defect
in IPPTT, with a ~30% increase in blood glucose AUC0-120 (Fig. 6.1A). To assess the hormonal
responses of the aged Pak1-/- mice to glucose challenge, we measured plasma insulin, GLP-1,
and glucagon levels. The aged Pak1-/- mice had attenuated insulin levels at 15 min and 30 min
after i.p. glucose challenge (Fig. 6.1B), along with a ~50% reduction in circulating total GLP-1
levels at 5 min post oral glucose gavage (Fig. 6.1C). The plasma glucagon levels of the aged
Pak1-/- mice after an i.p. glucose challenge were comparable to the wild-type controls, with a
trend of lower basal glucagon level (Fig. 6.1D). The glucagon tolerance of the aged Pak1-/- mice
was similar to that of the wild-type controls (Fig. 6.1E). Together, a profound defect in IPPTT
was observed in the aged Pak1-/- mice, associated with a severe impairment in GLP-1 response,
along with impairment in insulin secretion, but no appreciable defect in glucagon secretion or
glucagon tolerance.
6.4.2 Inhibition of Group I Paks represses glucose production in primary
hepatocytes
We examined the direct effect of Pak kinases on glucose production in mouse primary
hepatocytes utilizing IPA3, a highly specific non-ATP-competitive chemical inhibitor of group I

144
Paks (365). Pretreating hepatocytes with IPA3 attenuated basal as well as glucagon- or forskolin-
stimulated glucose production (Fig. 6.2A). Ex-4 treatment generated no appreciable effect on
glucose production in this in vitro setting. However, IPA3 pretreatment prior to the addition of
Ex-4 significantly lowered glucose production (Fig. 6.2A). Fig. 6.2B shows that the repressive
effect of IPA3 on glucose production is dosage dependent. Since IPA3 inhibits all three members
of the group I Pak family (Pak1, Pak2, and Pak3) (365), we wondered whether ablation of Pak1
alone would attenuate the stimulation by forskolin or glucagon. Hence, we isolated hepatocytes
from Pak1-/- mice. As shown in Fig. 6.2C, Primary hepatocytes isolated from wild-type and
Pak1-/- mice were stimulated with glucagon or forskolin, in presence or absence of IPA3,
followed by glucose production measurements. In wild-type hepatocytes, IPA3 attenuated the
glucagon- and forskolin-stimulated glucose production. Pak1-/- hepatocytes have reduced basal
glucose production, and IPA3 blunted the stimulation of glucagon and forskolin on glucose
production, suggesting that IPA3 treatment had an additive effect with Pak1 ablation.
6.4.3 Inhibition of group I Paks represses gluconeogenic gene
expression in hepatocytes
To further determine the role of group I Paks in hepatic glucose production, we assessed
gluconeogenic gene expression in Pak1-/- mice and in mouse primary hepatocytes treated with
IPA3. Compared to livers of wild-type controls, liver tissues of aged Pak1-/- mice had increased
expression of Pck1 and G6pc, which encode PEPCK and G6P, respectively, two rate-limiting
enzymes for gluconeogenesis (Fig. 6.3A). Unlike in the aged mice, the livers of young Pak1-/-
mice had similar Pck1 and G6pc mRNA levels compared to wild-type controls (Fig. 6.3B). IPA3
on its own was observed to moderately increase the expression of Pck1 (Fig. 6.3C) and G6p

145
mRNA (Fig. 6.3D). However, IPA3 pre-treatment significantly attenuated the stimulatory effect
of forskolin on Pck1 mRNA expression in the presence or absence of insulin treatment (Fig.
6.3C). Similarly, a robust stimulation of G6pc expression by forskolin was observed in primary
hepatocytes, and this stimulation was significantly attenuated by IPA3 pre-treatment, in the
presence and absence of insulin treatment (Fig. 6.3D). These observations further support our
suggestion that in hepatocytes per se, group I Paks positively regulate gluconeogenic genes, and
that the elevated hepatic gluconeogenesis in aged Pak1-/- mice is likely due to the absence of
Pak1 elsewhere.
6.4.4 In vivo forskolin administration improves IPPTT and increases gut
gcg mRNA levels in aged Pak1-/- mice
GLP-1 is known to repress hepatic gluconeogenesis in vivo, and this effect was initially
attributed entirely to its role as an incretin (507). A few recent studies have suggested that GLP-1
can repress hepatic glucose production in an insulin-independent manner (508,510). Gcg
expression can be stimulated by PKA activation (173,195,485) and we have observed recently
that in vivo administration of forskolin, an activator of adenylyl cyclase, increased gut gcg
mRNA levels (511). To investigate whether the hepatic defect in the aged Pak1-/- mice is at least
partially due to reduced gut gcg expression, we tested the rescue ability of forskolin
administration (5 mg/kg/day). As shown in Fig. 6.4A, aged Pak1-/- mice and age-matched (14
months old) control mice were subjected to daily i.p. forskolin injection for 14 days. IPPTT was
performed before and after the forskolin administration. Nine mice utilized in the above IPPTT
as well as 10 additional age-matched mice (5 wild type mice and 5 Pak1-/- mice) which received
PBS injection were euthanized at the end of the treatment period for the collection of distal ileum

146
followed by the measurement of gut Gcg mRNA levels. During the two-week period, forskolin
injection generated no significant change in body weight (Fig. 6.5). As shown in Fig. 6.4B,
forskolin injection significantly improved IPPTT in both aged Pak1-/- mice and age-matched
wild-type control mice, although the aged Pak1-/- mice maintained a relatively worse phenotype.
Furthermore, forskolin injection lowered fasting plasma glucose levels in these aged mice (Fig.
6.4B). Forskolin injection also increased gut gcg mRNA levels in both aged wild-type control
mice and Pak1-/- mice. Notably, gut gcg levels in the aged Pak1-/- mice receiving forskolin
injection were even higher than that of wild-type controls receiving PBS injection (Fig. 6.4C).
Thus, although the in vitro effect of forskolin in isolated hepatocytes is the stimulation of
gluconeogenesis, it functions as the gcg transcriptional stimulatory agent when administrated in
vivo. The improvement of IPPTT in the aged Pak1-/- mice by forskolin administration suggests
that reduced gut gcg expression is among the underlying causes of the IPPTT defect in aged
Pak1-/- mice.
6.4.5 Sitagliptin gavage reverses the IPPTT defect and stimulates
plasma GLP-1 levels in aged Pak1-/- mice
We then tested whether the administration of the DPP-IV inhibitor sitagliptin would
improve IPPTT and OGTT. In this set of experiments, mice at the age of 46 wks were utilized.
As shown in Fig. 6.6A, aged Pak1-/- mice and wild-type controls were subjected to IPPTT after
receiving PBS or sitagliptin via daily oral gavage for one week (300 mg/kg per day). Following
the IPPTT, PBS or sitagliptin was continually administrated via daily gavage for 4 additional
wks. Within this period, other procedures were performed including blood collection for plasma
GLP-1 assessment, OGTT, IPITT, and GC. During the five wk period, the effect of PBS or

147
sitagliptin gavage did not generate a significant difference in mouse body weight change (Fig.
6.7). The overall effect of sitagliptin administration on mouse glucose disposal is summarized as
follows. Firstly, both aged wild-type and Pak1-/- mice that received sitagliptin daily gavage for
one week showed marked improvement in IPPTT compared to the respective PBS control
groups, and sitagliptin was able to almost completely normalize the defect in the aged Pak1-/-
mice (Fig. 6.6B). Secondly, sitagliptin administration for 2 weeks significantly improved OGTT
in aged wild-type as well as aged Pak1-/- mice (Fig. 6.6C). AUC0-120 in aged Pak1-/- mice after
sitagliptin gavage was comparable with that in age-matched control mice receiving PBS gavage
(Fig. 6.6C). Thirdly, in the aged Pak1-/- mice, sitagliptin treatment enhanced GLP-1 secretion, as
indicated by elevated circulating GLP-1 levels at basal and 5 min post oral glucose gavage (Fig.
6.6D). Finally, sitagliptin administration did not result in a noticeable change in insulin tolerance
(Fig. 6.6E) or glucagon tolerance (Fig. 6.6F) in the aged wild-type and Pak1-/- mice. Together,
these results suggest that sitagliptin administration significantly improved both IPPTT and
OGTT, associated with enhanced GLP-1 levels, while having no substantial effect on insulin or
glucagon sensitivity.
6.4.6 Aged Pak1-/- mice have reduced epididymal fat pad weight
At the time when the aged Pak1-/- mice were euthanized, organs including liver, distal
ileum 5 cm segment, and epididymal fat pad were dissected and weighed. The aged Pak1-/- mice
show modest yet significant reduction in body weight (Fig. 6.8A). The aged Pak1-/- mice
demonstrated no substantial abnormalities in liver and distal ileum weight (Fig. 6.8B and 6.8C),
but exhibited reduced epididymal fat pad weight (Fig. 6.8D). The weight measurements were
performed using both absolute weight as well as were normalized to body weight.

0
20
40
60
80
100
120
Glu
cago
n (p
g/m
L) *
15 min 30 min Basal
0
5
10
15
20
0 20 40 60 80 100 120 Bloo
d gl
ucos
e (m
mol
/L)
Time (min)
Wild-type Pak1-KO
**
** * *
A
B
Wild-type Pak1-KO
0
500
1000
1500
2000
AU
C
Wild-type Pak1-KO *
C
D
0.0
0.4
0.8
1.2
1.6
Insu
lin (n
g/m
L)
* **
ns
ns
Basal 15 min
30 min
Wild-type Pak1-KO
Basal 5 min 15 min
Wild-type Pak1-KO
0
20
40
60
80
100
120
GLP
-1 (p
g/m
L)
* *
* *
Fig. 6.1 Aged Pak1-/- mice show severe defect in IPPTT. Aged Pak1-/- (KO) mice exhibited a profound defect in response to i.p. pyruvate injection (IPPTT), associated with impaired insulin and GLP-1 secretion. (A) IPPTT. (B) Plasma insulin levels before and after glucose i.p. injection. (C) Plasma GLP-1 levels before and after glucose gavage. (D) Plasma glucagon levels before and after glucose i.p. injection. (E) Glucagon challenge (GC) test. Wild-type mice, n=5; Pak1-/- mice, n=5. Age-matched 12 months old mice were used for each set of experiment. * p < 0.05, ** p < 0.01, *** p < 0.001.
148
IPPTT
E
0
5
10
15
20
0 30 60 90 120
Bloo
d gl
ucos
e (m
mol
/L)
Time (min)
Wildtype Pak1-KO
Wild-type Pak1-KO
0
500
1000
1500
2000 A
UC
GC
E

Fig. 6.2 The group I Pak inhibitor IPA3 represses glucose production in primary hepatocytes. (A) IPA3 attenuated basal, as well as glucagon- or forskolin-stimulated glucose production in primary hepatocytes. (B) IPA3 dose-dependently attenuates basal and forskolin-stimulated glucose production in primary hepatocytes. (C) Primary hepatocytes isolated from wild-type and Pak1-/- mice were stimulated with glucagon or forskolin, in presence or absence of IPA3, and followed by glucose production assay. In wild-type hepatocytes, IPA3 attenuate the glucagon- and forskolin-stimulated glucose production. Pak1-/- hepatocytes have reduced basal glucose production, and IPA3 blunted the stimulation of glucagon and forskolin on glucose production. Each experiment was performed using triplicate wells, n = 3 experiments. * p < 0.05, ** p < 0.01, *** p < 0.001; # p < 0.05, # # p < 0.01, # #
# p < 0.001 which indicates the comparison to the basal level of each respective treatment in (C).
149
A
0
2
4
6
8
10
12
14
16
18
Basal Forskolin (1 μM) Forskolin (10 μM)
Glu
cose
pro
duct
ion
(µg/
mL
per
µg p
rote
in)
*
* *
*
* ** **
**
DMSO IPA3 (1 μM) IPA3 (20 μM) B
0
5
10
15
20
Basal Glucagon Forskolin EX4
Glu
cose
pro
duct
ion
(µg/
mL
per
µg p
rote
in)
*
*
* *
*
DMSO IPA3
*
C
0
5
10
15
20
Basal Glucagon Forskolin
Glu
cose
pro
duct
ion
(μg/mL pe
r ug
pro
tein
)
Wildtype, DMSO Wildtype, IPA3 Pak1-KO, DMSO Pak1-KO, IPA3
***
**
* *
*
# #
## #

0
10
20
30
40
DMSO IPA3
G6p
c (fo
ld c
hang
e) * *
* ***
Basal Forskolin Forskolin + Insulin
A B
C D
Wild-type Pak1-KO
0
1
2
3
4
Fold
chan
ge
***
**
Pck1 G6pc
Wild-type Pak1-KO
0
1
2
3
4
Fold
chan
ge
G6pc Pck1
Basal Forskolin Forskolin + Insulin
0
1
2
3
4
DMSO IPA3
Pck1
(fol
d ch
ange
)
* *
*
**
**
DMSO IPA3 DMSO IPA3
Fig. 6.3 IPA3 represses gluconeogenic gene expression in primary hepatocytes (A) Aged mice liver pck1 and g6pc mRNA levels (wild-type mice, n=4, Pak1-/- mice, n=5) (B) Young mice liver pck1 and g6pc mRNA levels (wild-type mice, n=6, Pak1-/- mice, n=6) (C) IPA3 attenuates forskolin-stimulated pck1 mRNA levels in mouse primary hepatocytes (D) IPA3 attenuate forskolin-stimulated g6pc mRNA levels in mouse primary hepatocytes. The aged mice were 14 months old and the young mice were10 weeks old. Age-matched wild-type and Pak1-/- mice were used within each set of experiment. For mouse primary hepatocyte studies, each experiment was performed using triplicate wells, n = 3 experiments. All target gene expression levels were normalized to ribosomal 18S mRNA levels. * p < 0.05, ** p < 0.01, *** p < 0.001.
150

Fig. 6.4 Forskolin injection improves IPPTT and increases gut gcg mRNA levels in aged Pak1-/- mice. (A) Schematic of forskolin injection regimen consisting of two weeks of daily i.p. forskolin injection (5mg/kg per day) (B) IPPTT of aged wild-type (n=5) and Pak1-/- mice (n=4) before and after forskolin injection (C) Mice distal ileum gcg expression levels. Nine mice utilized in above IPPTT as well as 10 additional age-matched mice (5 wild type mice and 5 Pak1-/- mice) receiving PBS injection were utilized in this assay. Gcg mRNA expression levels were normalized to ribosomal 18S mRNA levels. In the IPPTT, statistical significance is indicated as follows: * Wild-type mice before versus after treatment; & Pak1-/- mice before versus after forskolin treatment; # wild-type mice after treatment versus Pak1-/- mice after treatment. *,&,# p < 0.05, **,&&,## p < 0.01, ***,&&&,### p < 0.001.
151
0.0
0.5
1.0
1.5
2.0
2.5
PBS Forskolin
Gcg
(fol
d)
A
C Wild-type Pak1-KO
*
** *
ns
0
2
4
6
8
10
12
14
16
18
0 20 40 60 80 100 120
Bloo
d gl
ucos
e (m
mol
/L)
Time (min)
Wild-type pre-treatment Pak1-KO pre-treatment Wild-type post-treatment Pak1-KO post-treatment
*
* *
*** **
& &&
& & &
#
##
#
###
### ##
B
0
500
1000
1500
2000
AU
C
**
***
** **
Wild-type Pak1-KO
1 0 2
IPPTT IPPTT
Number of weeks (forskolin injection)
IPPTT

0
10
20
30
40
0 1 2
Body
wei
ght (
g)
Weeks (post forskolin injection)
Wild-type Pak1-KO
** *
A B
-3
-2
-1
0
Cha
nge i
n bo
dy w
eigh
t (g)
WT PAK1-KO
n.s.
Fig. 6.5 Forskolin injection for one week generated no effect on body weight in aged Pak1-/- mice and wild-type control mice. (A) Body weight measurement in 14 months old Pak1-/- (KO) and aged-matched wild-type (WT) control mice during the two week duration of forskolin injection. (B) Change in body weight in the aged Pak1-/- and wild-type control mice. n.s. indicates not statistically significant. * p < 0.05, ** p < 0.01, *** p < 0.001.
152

A
B
0
2
4
6
8
10
12
14
16
18
0 20 40 60 80 100 120
Bloo
d gl
ucos
e (m
mol
/L)
Time (min)
Wild-type, PBS Wild-type, sitagliptin Pak1-KO, PBS Pak1-KO, sitagliptin
** ** ***
&
&& &&
&
1 0 2 3 4 5
IPPTT
Blood
OGTT IPITT GC
Euthanasia
Number of weeks (sitagliptin gavage)
0
500
1000
1500
2000 * *
Wild-type Pak1-KO
PBS Sitagliptin
AU
C
Fig. 6.6 Sitagliptin rescues the IPPTT and OGTT impairments in aged Pak1-/- mice. (A) Schematic of sitagliptin oral gavage regimen consisting of daily gavages (300 mg/kg per day) for a total duration of 5 weeks. During the 5-week treatment period, aged wild-type and Pak1-/- mice receiving either PBS or sitagliptin underwent the tests described in B-F. (B) IPPTT. In the IPPTT, statistical significance is indicated as follows: * Wild-type mice receiving PBS vehicle versus sitagliptin; & Pak1-/- mice receiving PBS vehicle versus sitagliptin. Wild-type mice PBS group n=3, sitagliptin group n=3; Pak1-/- mice PBS group n=4, sitagliptin group n=5). *,&,#,$ p < 0.05, **,&&,##,$$ p < 0.01, ***,&&&,###,$$$ p < 0.001.
153
IPPTT

Fig. 6.6 Sitagliptin rescues the IPPTT and OGTT impairments in aged Pak1-/- mice (continued) (C) OGTT, (D) plasma GLP-1 levels at basal and 5 min post oral glucose challenge. In the IPPTT, statistical significance is indicated as follows: * Wild-type mice receiving PBS vehicle versus sitagliptin; & Pak1-/- mice receiving PBS vehicle versus sitagliptin; # wild-type mice receiving PBS versus Pak1-/- mice receiving PBS; $ wild-type mice with sitagliptin versus Pak1-/- mice with sitagliptin. Wild-type mice PBS group n=3, sitagliptin group n=3; Pak1-/- mice PBS group n=4, sitagliptin group n=5). *,&,#,$ p < 0.05, **,&&,##,$$ p < 0.01, ***,&&&,###,$$$ p < 0.001.
154
C
0
2
4
6
8
10
12
14
16
18
0 20 40 60 80 100 120
Bloo
d gl
ucos
e (m
mol
/L)
Time (min)
Wild-type, PBS Wild-type, sitagliptin Pak1-KO, PBS Pak1-KO, sitagliptin
** *
&&
&&& &&
&& &
#
#
$
0
500
1000
1500
2000
PBS Sitagliptin
AU
C
**
*** *
Wild-type Pak1-KO
D Basal 5min
*** **
*
0
50
100
150
200
250
PBS Sitagliptin
GLP
-1 (p
g/m
L)
OGTT

Fig. 6.6 Sitagliptin rescues the IPPTT and OGTT impairments in aged Pak1-/- mice (continued) (E) IPITT, (F) Glucagon challenge (GC). Wild-type mice PBS group n=3, sitagliptin group n=3; Pak1-/- mice PBS group n=4, sitagliptin group n=5.
155
0
500
1000
1500
PBS Sitagliptin
AU
C
Wild-type Pak1-KO
0
2
4
6
8
10
12
0 50 100
Blod
d gl
ucos
e (m
mol
/L)
Time (min)
Wild-type, PBS Wild-type, sitagliptin Pak1-KO, PBS Pak1-KO, sitaglliptin
0
500
1000
1500
PBS Sitagliptin
AU
C
Wild-type Pak1-KO
0
2
4
6
8
10
12
14
16
0 20 40 60 80 100 120
Bloo
d gl
ucos
e (m
mol
/L)
Time (min)
Wild-type, PBS Wild-type, sitagliptin Pak1-KO, PBS Pak1-KO, sitagliptin
E
F
IPITT
GC

Fig. 6.7 No changes in body weight during sitagliptin treatment in aged Pak1-/- mice. Sitagliptin was administered consecutively with daily gavages (300 mg/kg per day) for a total duration of 5 weeks. During this time period, body weight was recorded for all the treatment versus control mice groups. Wild-type mice PBS group n=3, sitagliptin group n=3; Pak1-/- mice PBS group n=4, sitagliptin group n=5.
0
5
10
15
20
25
30
35
40
0 1 2 3 4 5
Body
wei
ght (
g)
Weeks (post sitagliptin gavage)
Wild-type, PBS Wild-type, sitagliptin Pak1-KO, PBS Pak1-KO, sitagliptin
156

Fig. 6.8 Aged Pak1-/- mice exhibit smaller epididymal fat pads. (A) Body weight measurement. (B) Absolute and normalized liver weight (C) Absolute and normalized distal ileum weight (5 cm section) (D) Absolute and normalized epididymal fat pad weight. Male aged Pak1-/-
knockout (KO) mice were used along with age-matched wild-type (WT) controls. Normalized weights are calculated by adjusting the absolute organ weights with body weight of the animal. WT, n=4. KO, n=5.
157
0
0.01
0.02
0.03
0.04
0.05
Wei
ght/b
ody
wei
ght (
g)
0
0.001
0.002
0.003
0.004
Wei
ght/b
ody
wei
ght (
g)
B
C
D
0
0.01
0.02
0.03
0.04
0.05
Wei
ght/b
ody
wei
ght (
g) *
0
0.5
1
1.5
2
Wei
ght (
g)
**
0
0.05
0.1
0.15
Wei
ght (
g)
*
0
0.5
1
1.5
2
Wei
ght (
g)
* Liver Liver (normalized)
Distal ileum Distal ileum (normalized)
Epididymal fat Epididymal fat (normalized)
0
10
20
30
40
50
Body
wei
ght (
g) * A
WT KO
WT KO WT KO
WT KO WT KO
WT KO WT KO

158
6.5 Discussion
Although Pak1 is known to mediate insulin-stimulated glucose transport in muscle cells
(333), and its ablation affects the second phase of glucose-stimulated insulin secretion in vitro
and ex vivo (453,499), the metabolic defects in young Pak1-/- mice are relatively moderate,
especially in the absence of a challenge (468,499). We show here that aged Pak1-/- mice carry a
profound defect in IPPTT, which can be drastically improved by GLP-1 activation, either
through increasing its production or reducing its inactivation. These, along with the direct
repressive effect of IPA3 on glucose production in primary hepatocytes, revealed the important
physiological significance of Pak1 in regulating GLP-1 production, especially in aged mice. This
study also further supports the therapeutic application of GLP-1R agonists and DPP-IV inhibitors
in attenuating hepatic gluconeogenesis. Furthermore, we suggest that aged Pak1-/- mice may
serve as a novel model in studying the gut-liver axis or the gut-pancreas-liver axis in metabolic
homeostasis.
We found previously that gut gcg transcription and GLP-1 production can be positively
regulated by the Wnt ligand Wnt3a (468), as well as the Wnt pathway effector β-cat/TCF7L2
(295,296,479). Pak1 mediates the crosstalk between insulin and Wnt signaling pathways (334).
In the gut, insulin treatment activates Pak1 through stimulating its Thr423 phosphorylation (334).
This activation is associated with increased β-cat Ser675 phosphorylation (334). The interaction
between Pak1 and β-cat was also demonstrated to be required for the stimulation of β-cat
signaling by gastrins in a gastric mucosa cell line (503,512). Recently, Zhu et al reported that
Rac/Pak1 cascade controls β-cat activation in colon cancer cells, and that Pak1 directly
phosphorylates β-cat at the Ser675 residue (487). Furthermore, in mammary epithelial cells, the
loss of Pak1 leads to diminished β-cat and its target gene expression (513). We have

159
demonstrated previously that in young Pak1-/- mice, gut Gcg mRNA level was significantly
lower than in their control littermates; this was associated with reduced plasma GLP-1 and
insulin levels in response to oral glucose challenge (468). We suggest that the defect in gcg
expression and GLP-1 production is at least one of the underlying causes responsible for the
increased hepatic glucose production in aged Pak1-/- mice, as impaired IPPTT can be efficiently
reversed by either forskolin or sitagliptin treatments in vivo. Unlike the direct use of GLP-1
analogues, treatment with sitagliptin enabled us to measure plasma GLP-1 levels as the endpoint
and thereby to attribute any changes in GLP-1 levels to the drug treatment. Further studies
examining the effect of sitagliptin on hepatic gluconeogenic gene expression will be useful in
clarifying the role of DPP-IV inhibitors in suppressing hepatic glucose production. It is worth to
point out that forskolin or sitagliptin also significantly improved IPPTT in aged wild type mice,
supporting the notion that GLP-1 analogues and DPP-IV inhibitors can be utilized in reducing
hepatic gluconeogenesis (507,508).
Extensive studies during the past two decades have shown that the physiological
significance of GLP-1 reaches far beyond its role as an incretin hormone (246). Extra-pancreatic
functions of GLP-1 include the induction of satiety (227), reduction of gastric emptying (219),
cardiac protection (233), hepatic glycogen storage (225), and repression of hepatic glucose
production (510). However, the measurement of plasma GLP-1 level has not been recognized as
a diagnosis tool for any metabolic disorders. We suggest that this is at least partially due to the
fact that current GLP-1 detection methods are not sensitive enough to reveal subtle differences
among the subjects. Indeed, GLP-1 levels in plasma samples are within the pg range (5-20
pg/mL), much lower compared with that of glucagon and insulin. While conducting blood GLP-
1 measurements in the transgenic mice utilized in this study, data obtained from different batches
of experiments showed significant inter-assay variation.

160
We did not see appreciable defects in the Pak1-/- mice that are related to the extra-
pancreatic functions of GLP-1. Surprisingly, aged Pak1-/- mice (over 14 months old) show
significantly reduced body weight and epididymal fat when compared with age-matched wild
type control animals (Fig. 6.8A and 6.8D). As Pak1 can be activated by different signaling
cascades and has a large profile of downstream targets, it is possible that Pak1 exerts its multiple
metabolic regulatory effects in tissue specific manners. Some of these effects may be deleterious
while others may be beneficial, making the “net outcome” comparable, especially in the absence
of a nutritional challenge. To further dissect the metabolic regulatory function of Pak1, cell-type
specific gain-of-function as well as loss-of-function approaches will be needed. Furthermore, the
three group I Pak members may exert redundant functions. We found that IPA3 inhibited both
basal and glucagon- or forskolin-stimulated glucose production in primary hepatocytes of wild
type animals. Pak1-/- hepatocytes, however, showed normal response to forskolin and glucagon
activation on glucose production, indicating that the functional inactivation of all three Pak
members is required to block the stimulatory effect of forskolin or glucagon on hepatic
gluconeogenic gene expression. The involvement of Pak2 and Pak3 in gut gcg expression and
GLP-1 production, as well as in regulating glucose production in response to glucagon
stimulation in hepatocytes per se, are worth further investigation.
Glucagon and insulin are two major metabolic hormones that control hepatic
gluconeogenesis in response to fasting and feeding, respectively. Glucagon also mediates stress
signaling in up-regulating hepatic glucose production (503,506). The stimulatory effect of
glucagon is mainly mediated by cAMP/PKA activation, followed by increased phosphorylation
of CREB and hepatic gluconeogenic gene expression. The repressive effect of insulin on hepatic
glucose production is at least partially achieved via inactivating FOXO, which is also among the
transactivators of gluconeogenic genes. As both insulin signaling and FOXO signaling may alter

161
during ageing, we aimed to examine whether aged Pak1-/- mice would show more deleterious
metabolic defects compared to young animals. Based on the tolerance tests we have conducted,
we have principally eliminated the possibility that defect of elevated hepatic gluconeogenesis is
due to increased levels of glucagon or sensitivity of hepatocytes to glucagon signaling. We have
also ruled out the possibility that elevated hepatic gluconeogenesis is due to reduced sensitivity
of hepatocytes to insulin signaling. Thus, we suggest that the defect lies, at least partially, in the
gut/liver axis or the gut/pancreas/liver axis. Whether the defect is due to impaired insulin-
dependent effect of GLP-1, or impaired insulin-independent effect of GLP-1, or both, needs to be
further investigated.
Significant effort has been made to verify whether GLP-1 possesses an insulin-
independent effect on hepatic glucose production. An early report revealed that infusion of GLP-
1 resulted in lower rates of hepatic glucose production in human subjects (507). This effect was,
at that time, attributed to the incretin effect. A few studies had claimed the difficulty in
determining the existence of insulin-independent effects of GLP-1 on peripheral glucose
turnover (514-516). However, a very recent pancreatic clamp study in human subjects
demonstrated that infusion of physiological post-prandial levels of GLP-1 led to reduced hepatic
glucose production by 27%, while no appreciable effect on whole-body glucose disposal was
observed (508). We tested here the effect of sitagliptin, which has been shown to attenuate diet-
induced adipose tissue inflammation and liver steatosis in a mouse study (517). The beneficial
effect of sitagliptin on the liver in glucose homeostasis is worthy of further investigation in
human subjects.
As the link between Rho GTPases (Rac1 and Cdc42) and cytoskeleton reorganization,
Fig. 6.9 presents a summary of the metabolic functions of Pak1, as well as our interpretation of

162
the phenotypes observed in the aged Pak1-/- mice. In pancreas, Cdc42/Pak1/Rac is involved in
glucose-stimulated insulin secretion. In muscle cells, Pak1 mediates the stimulatory effect of
insulin on GLUT4 membrane translocation and glucose uptake. In intestinal L cells, Pak1 is
required for insulin-stiumulated gcg expression and GLP-1 production. The direct effect of Pak1,
and potentially group I Paks in general, is to positively regulate gluconeogenesis. Both insulin
and GLP-1 are known to suppress hepatic glucose production. In aged Pak1-/- mice, reduced gut
gcg expression and lower circulating GLP-1 levels contribute to the elevation of hepatic glucose
production, potentially by overriding the direct effects of Pak.
Aged Pak1 knockout mice may serve as a novel tool for dissecting the gut/pancreas/liver
axis in hepatic glucose production, as well as for the testing of GLP-1 based therapeutics.
6.6 Acknowledgements
Technical assistance for using the plate reader for mouse plasma GLP-1 measurements
was provided by Dr. Manuel Gil-Lozano and Dr. Patricia Brubaker, and equipment for detection
was supported by the 3D (Diet, Digestive Tract and Disease) Centre funded by the Canadian
Foundation for Innovation and Ontario Research Fund (project number 19442). Technical
assistance and hepatocyte isolation pump was kindly provided by Dr. Khosrow Adeli. Technical
assistance for mouse primary hepatocyte isolation was provided by Wilfred Ip.

Fig. 6.9 Summary of the role of Pak1 in metabolic homeostasis and the phenotypes of Pak1-/- mice. In pancreas, Cdc42/Pak1/Rac is involved in glucose-stimulated insulin secretion. In muscle cells, Pak1 mediates the stimulatory effect of insulin on GLUT4 membrane translocation and glucose uptake. In intestinal L cells, Pak1 is required for insulin- and forskolin-stiumulated gcg expression and GLP-1 production. The direct effect of Pak1, and potentially group I Paks in general, is to positively regulate gluconeogenesis. Both insulin and GLP-1 are known to suppress hepatic glucose production. In aged Pak1-/- mice, reduced gut gcg expression and lower circulating GLP-1 levels contribute at least partially to the elevation of hepatic glucose production, potentially through indirect mechanisms.
163
Pak1
p21 GTPases Insulin signaling
Glucose uptake Insulin secretion GLP-1 production Glucose production
PKA signaling

164
7 General discussions, conclusion, and future directions

165
7.1 General discussions
7.1.1 The crosstalk between insulin and Wnt signaling pathways and its
effect on GLP-1 production
Gcg encodes several peptide hormones that are involved in glucose homeostasis, among
many other functions. Tissue-specific cleavage of the pre-hormone proglucagon by PC1/3 leads
to the production of GLP-1 in the intestinal endocrine L cells and in certain neuronal cells in the
brain. The transcriptional regulation of gcg involves multiple signaling pathways and their
components. Our laboratory has showed that insulin stimulated gcg expression and GLP-1
production in the intestinal L cells (479). Similarly, treatment with the Wnt activator LiCl
induced gcg expression and GLP-1 synthesis, both of which were attenuated by the expression of
a dominant negative TCF7L2 (295,296,479). Insulin treatment also enhanced the binding of β-
cat/TCF7L2 to the G2 enhancer element of the gcg promoter, and overexpression of β-cat
stimulated gcg promoter activity (479). These observations collectively indicate that the crosstalk
between insulin and Wnt pathways is involved in regulating gut gcg expression and GLP-1
production.
The concept that Pak1 can serve as an effector of insulin/IGF-1 signaling has been
exemplified in multiple cell types. In nematodes, Pak1 was shown to act downstream of
insulin/IGF-1-PI3K signaling in regulating neuronal migration, a process that also involved
FOXO transcription factors (518). In myeloma cells, HGF and IGF-1 induced cell migration was
positively correlated with Pak1/2 activation; IGF-1 stimulated Pak1 Thr423 phosphorylation; and
Pak1/2 depletion resulted in reduced migration (467). Previous research from our group showed
that insulin stimulated Pak1 activation in intestinal cancer cells and mouse tissues including the

166
intestine (334). In the current study, I found that insulin stimulated Pak1 Thr423 phosphorylation
in intestinal and brain gcg-expressing cells. Treatment with the Wnt ligand Wnt3a activated gcg
promoter activity and endogenous gcg mRNA expression in the intestinal L cells, and this
activation was abolished in the presence of the Pak inhibitor IPA3.
The cAMP-PKA signaling was known to stimulate β-cat Ser675 phosphorylation in
several cell lineages (255,256). Our group further identified that insulin/IGF-1signaling is able to
stimulate β-cat activation in intestinal cell lineages (334,519). The phenomenon of insulin/IGF-
1-mediated β-cat activation has been reported in multiple other cell types. Insulin and IGF-1
activated β-cat signaling and promoted carcinogenesis in hepatocytes (261). IGF-1 was found to
elevate β-cat levels and augment androgen-mediated gene transcription in prostate cancer cells
(520). In pancreatic β cells, insulin stimulated β-cat mRNA production, total cellular β-cat
protein levels, and its nuclear translocation (521). In the current study, I found that insulin-
stimulated β-cat activation is at least partially mediated through the linker Pak1, where treatment
with IPA3 attenuated insulin-mediated β-cat Ser675 phosphorylation. Two very recent studies
demonstrated that β-cat can be directly phosphorylated by Pak1 at Ser675 residue in the in vitro
setting (487,513), thereby further supporting my hypothesis of the presence of the
insulin/Pak1/β-cat axis in the crosstalk.
In the intestinal endocrine L cell line GLUTag, Pak1 has been verified to be the target of
Cdc42 (522). Both Cdc42 and Pak1 were required for insulin-induced actin remodeling, the
mechanism underlying GLP-1 secretion (522). Chemical reagents disrupting filamentous actin
potentiated insulin-induced GLP-1 secretion, whereas depletion of either Cdc42 or Pak1 is
sufficient to attenuate actin remodeling and GLP-1 secretion following insulin treatment (522).
Consistent with my study, insulin was found to induce Pak1 Thr423 phosphorylation (522).

167
Cdc42/Pak1 mediated the insulin stimulation through a MEK/Erk-dependent mechanism in
potentiating GLP-1 secretion in intestinal L cells (522), in line with the reported role of
MEK/Erk as Pak effectors. These findings suggest that Cdc42/Pak1 is involved in insulin-
stimulated GLP-1 secretion in intestinal L cell lines; however, the physiological significance of
the Cdc42/Pak1 signaling cascade in mediating GLP-1 secretion in vivo remains to be addressed.
7.1.2 The in vivo role of Pak1 deficiency
The Pak1-/- mice were generated using target disruption of the Pak1 allele in embryonic
stem cells, resulting in an allele that contains a neomycin cassette and that lacks a 2kb genomic
DNA encoding the p21-binding domain (404). These mice are viable and fertile, have normal life
span, and reproduce at the predicted Mendelian frequency. Hematopoietic analysis showed that
Pak1-/- mice have normal peripheral blood indices and cell counts (404).
In this study, I hypothesized that Pak1 participates in the crosstalk between insulin and
Wnt signaling pathways in regulating gcg transcription. I first examined this hypothesis using
gcg-expressing cell lines: two intestinal cell lines (GLUTag and STC-1) and a hypothalamic
neuronal cell line (mHypoE-20/2). I then investigated the in vivo role of Pak1 in regulating gcg
expression and GLP-1 production using the Pak1-/- mouse model. The Pak1-/- mice exhibited
drastically reduced intestinal gcg mRNA levels, decreased distal ileum GLP-1 content, and lower
circulating levels of active GLP-1. Although the difference in basal plasma total GLP-1 levels
was not substantial, this may be partially due to the technical challenges in GLP-1 detection. In
my study, I observed that the quantification of plasma GLP-1 levels is challenging, due to: 1) the
relatively low levels of GLP-1 in the circulation as a result of the rapid DPP-IV mediated

168
degradation, and 2) the range of sensitivity of the RIA assay is often not sufficient to detect
minute changes in GLP-1 concentrations. Clinical studies have conducted simultaneous
measurements of GLP-1 and GLP-2, and the changes in plasma GLP-1 and GLP-2 levels were
shown to correlate with each other (523,524). Hence, GLP-2 assay may be a useful
supplementary method to confirm changes in plasma GLP-1 concentrations; in my study, the
reduced circulating GLP-2 levels indirectly support the presence of GLP-1 defect. Furthermore,
GLP-1 measurements in the latter parts of my study (in Chapter 5) were conducted using the
more sensitive ELISA method.
GLP-1 and GLP-2 are co-secreted in a 1:1 ratio, and both are targets of DPP-IV-mediated
degradation. I was able to show the concomitant reduction of plasma GLP-2 levels in the Pak1-/-
mice, which indirectly supports the notion of reduced GLP-1 production and secretion in these
mice (details described in Section 7.3.4).
Gcg is known to be expressed in certain neuronal cells within the brainstem and
hypothalamus. I showed that Pak1-/- mice have reduced brainstem gcg mRNA levels, and brain
neurons isolated from Pak1-/- mice lack the response of insulin-stimulated β-cat Ser675
phosphorylation. My findings collectively suggest that the insulin/Pak1/β-cat crosstalk
mechanism regulates gcg expression in both the gut and the brain. The localized impairments in
gcg expression and GLP-1 production in the Pak1-/- mice were associated with intolerance to
both ip and oral glucose administration, as well as impaired tolerance to pyruvate challenge,
demonstrating that Pak1 deficiency leads to global defects in glucose homeostasis.
In addition to metabolic homeostasis, a number of recent reports demonstrate the in vivo
role of Pak1 in mast cell immune responses, muscle glucose uptake, pancreatic insulin secretion,
synaptic plasticity, and cardiac functions (404,438,525-527).

169
Following the generation of the Pak1-/- mice, closer examinations have revealed that
genetic deletion of Pak1 resulted in subtle immune defects (404,528). Wild-type mice bone
marrow-derived mast cells (BMMCs), which are a type of granulated cells in the bone marrow,
showed normal granule release in response to antigen stimulation. BMMCs from Pak1-/- mice,
however, exhibited lack of granule response after IgE challenge, accompanied by an inability to
disassemble F-actin (404). These defects in allergen-stimulated granule release and in
cytoskeleton reorganization were recapitulated in vivo. Passive cutaneous anaphylaxis (PCA) is a
localized allergic reaction where mice are injected with intradermal IgE followed by allergen
sensitization and dye administration. Dye extravasation can be quantified and represents
allergen-induced IgE crosslinking. The Pak1-/- mice show reduced dye quantity and intensity,
confirming the in vivo role of Pak1 in mast cell-mediated PCA reaction (404).
The in vitro requirement of Pak1 in GLUT4 vesicle translocation was shown in isolated
mouse myotubes almost two decades ago (333). Insulin stimulated Pak1 Thr423 phosphorylation
in myocytes, and this stimulation was mediated through Cdc42/Rac and involving the MAPK
pathway (333). The in vivo role of Pak1 in glucose uptake was demonstrated in a recent study by
Wang et al. (438). Wild-type and Pak1-/- mice were injected with insulin or control vehicle
solution, followed by isolation of skeletal muscle tissue (438). Insulin was confirmed to
stimulate Pak1 Thr423 phosphorylation and activation in mouse skeletal muscle (438). Muscle
tissue homogenates from Pak1-/- mice showed reduced GLUT4 vesicles in the plasma fraction,
indicating a defect in insulin-stimulated GLUT4 vesicle translocation (438). The reduction of
GLUT4 was correlated with attenuated insulin-stimulated Erk activation, but not Akt activation,
suggesting that Pak1 ablation selectively impairs the downstream pathways of insulin signaling
after its bifurcation. A previous study by our group showed similar selectivity, where insulin-
mediated Pak1 activation in the intestine was PI3K- and Erk-dependent, but Akt-independent

170
(334). Related to my own study, whether the same selective activation of downstream insulin
signaling pathways occurs in insulin-stimulated Pak1 activation in intestinal L cells can be
examined further. The use of specific inhibitors against PI3K, MEK, Erk, and Akt will be useful
in conducting this line of investigation.
The importance of Cdc42/Pak1/Rac signaling in the second phase of insulin release in
pancreatic β cell lines and mouse islets has been demonstrated (453). The GEF protein Cool/PIX,
a regulator of Pak1, has also been identified to be expressed in pancreatic β cells and to regulate
insulin secretion (529,530). The in vivo role of Cdc42/Pak1 in insulin secretion and glucose
homeostasis was recently identified by Wang et al (438). In their study, siRNA-mediated Cdc42
depletion inhibited the second phase of GSIS and Pak1 activation in human islets, and IPA3
attenuated the second phase of GSIS in human islets and MIN-6 cell line (438). Assessment of
the Pak1-/- mice showed impaired glucose tolerance and insulin tolerance, and islets isolated
from Pak1-/- had reduced second phase insulin secretion in response to glucose stimulation (438).
In my study, the Pak1-/- mice exhibited impaired ip glucose tolerance, and I further revealed the
defect in oral glucose tolerance (468). However, I did not observe an appreciable defect in
insulin tolerance as reported by Wang et al. A plausible explanation is the substantial age
difference of the mice utilized in the two studies. Insulin intolerance is known to worsen with
age progression, and since the mice utilized in my study were much younger (7 wks versus 4-6
mo by Wang et al.) this may have been a contributing factor to the discrepancy. Wang et al.
showed that Pak1-/- mice islets bear no abnormalities in islet architecture, including islet density,
size, and β cell mass (438). Similarly, I showed that Pak1-/- islets had comparable islet density,
size, α cell and β cell mass (468). In their study, Wang et al. showed that Pak1-/- mice islets have
comparable pancreatic insulin content, glucagon content, and glucagon release (438). My

171
functional assessment of the Pak1-/- mice demonstrated that glucose challenge failed to elicit an
insulin response, and basal plasma glucagon level was reduced (468).
Rac/Pak1 signaling has been implicated in neuronal and brain development. The Pak1-/-
mice have normal gross brain structure, and at the cellular level, neurons from Pak1-/- mice show
normal synaptic and spine structures (526). However, synaptic plasticity, as assessed by long-
term potential (LTP) and long-term depression (LTD), is notably altered in Pak1-/- neurons (526).
The Pak1-/- neurons showed reduced polymerized F-actin in dendritic spines and misregulated
cofilin phosphorylation, suggesting that Pak1 may play a role in synaptic function (526). In my
study, Pak1-/- brain neurons lack the response of β-cat activation in response to insulin
stimulation, suggesting that Pak1 ablation results in molecular defects in brain neurons.
GLP-1 is known to act centrally in appetite suppression and regulation of energy
homeostasis, and it has been suggested that neuronal GLP-1 signaling in the brainstem and
hypothalamus mediate these effects (43,226,227,531). In parallel, a substantial body of evidence
suggest that insulin as well as GLP-1 exert neuroprotective effects, and that GLP-1 based
therapeutics are potential candidates for the treatment of neurological diseases (253,532,533). In
my study, the Pak1-/- brain neurons exhibited impaired insulin signaling; however, the Pak1-/-
mice did not have abnormalities in body weight gain. Expanding the current study to assess
potential functional impairments of the Pak1-/- mice, such as reduced brain GLP-1 production,
changes in appetite regulation and energy expenditure, and neurological defects, is worth
pursuing.
The involvement of Pak1 in cardiac function has been assessed in two different types of
Pak1-/- mice. Whole body ablation of Pak1 promoted chronic stress-induced cardiac hypertrophy,
which was associated with increased Erk activation and reduced PP2A activation (534). A

172
different group used a conditional gene deletion system to specifically knockout Pak1 in
cardiomyocytes (Pak1cko) (527). The Pak1cko mice had enlarged cardiomyocyte cross-section and
increased interstitial fibrosis (527). Transverse aortic constriction is a methodology to examine
stress-induced cardiac failure. The Pak1cko mice exhibited several stress-induced heart defects
including increased heart weight to tibia ratio, decreased contraction, and cardiohypertrophy, and
cardiomyocytes from Pak1cko mice have impaired JNK signaling (527).
My investigations, along with those made by others, have demonstrated the essential
requirement for Pak1 in multiple cell types and organs. Pak1 deficiency leads to molecular,
cellular, functional, and physiological defects in vivo, and is linked to pathophysiological
manifestations in mouse models.
7.1.3 The gut/liver axis or gut/pancreas/liver axis
To date, studies evaluating the existence of direct effect of GLP-1 on hepatocytes have
been conflicting, and the question of whether GLP-1R is expressed in hepatocytes has been
controversial. An early study showed that GLP-1 at physiological concentrations can stimulate
the formation of glycogen in isolated rat hepatocytes (535). The binding of GLP-1(7-36)amide to
the plasma membrane has been reported in rat liver and hepatocytes (536). GLP-1R expressed on
nerve terminals in the hepatic portal vein were shown to mediate the hepatic effects of GLP-
1(537), and peripheral GLP-1 infusion into the hepatic portal region suppressed appetite (538).
The expression of GLP-1R mRNA and protein has been reported in rat liver tissues (539).
However, other studies do not support a direct role for GLP-1 in hepatocytes. Earlier
examination of the tissue distribution of rat GLP-1R mRNA showed that it was not within the

173
detection level in hepatocytes (215). In one study, GLP-1 failed to repress glucose output in
isolated and perfused rat liver (540). In another study, GLP-1 did not block the gluconeogenic
action of glucagon in isolated rat hepatocytes (541). In assessing the glycogenic effects of GLP-
1(7-36)amide, insulin but not GLP-1(7-36)amide was shown to stimulate the incorporation of
glucose into glycogen in isolated rat hepatocytes (542).
In my study, Ex-4 treatment alone did not reduce glucose output in isolated mouse
hepatocytes. However, it is worth pointing out that recent studies from another group and from
our team have demonstrated the function of the nonapeptide GLP-1(28-36) amide in vitro and in
vivo. Ip et al. from our laboratory has demonstrated the direct repressive effect of GLP-1(28-36)
amide on glucose output in isolated mouse hepatocytes (543). Ip et al. then further demonstrated
that GLP-1(28-36) amide repressed hepatic glucose production in mice (543). Another group
showed that GLP-1(28-36) amide inhibited weight gain and reduced hepatic TG stores in high fat
diet fed mice (128). Thus, the GLP-1 metabolite GLP-1(28-36) amide, previously assumed to be
inactive, exerts physiological functions and may do so via an alternate GLP-1R. Comparison of
the effects of Ex-4 versus various GLP-1 cleavage products, including the recently identified
GLP-1(28-36) amide, on hepatic glucose production can be further pursued.
Clinical studies in assessing the pancreatic and extra-pancreatic effect of GLP-1 resulted
in conflicting conclusions. GLP-1 administration enhanced insulin-independent glucose disposal
in healthy subjects (544) and in elderly T2D patients (545). The insulinomimetic effect of GLP-1
was demonstrated through GLP-1 infusion in obese T2D patients, where GLP-1 augmented
insulin-mediated glucose clearance (546). On the contrary, a number of other studies
contradicted the direct beneficial effect of GLP-1 in men. Infusion of GLP-1 at physiological
levels in healthy subjects did not acutely improve insulin sensitivity (547), and it did not

174
augment insulin-mediated glucose uptake in healthy subjects (548,549). Alternatively, reported
beneficial effects of GLP-1 on glucose elimination were proposed to be dependent on its action
on pancreatic glucoregulatory hormones (514). Specifically, the suppressive effect of GLP-1 on
hepatic glucose production was attributed to the indirect regulation via insulin and glucagon
(515).
A handful of recent studies generated evidence supporting the direct role of GLP-1 in
hepatocytes and the suppression of hepatic glucose production in humans. GLP-1R was found to
be expressed in human hepatocytes (550), and was shown to internalize upon GLP-1 stimulation
in human hepatocyte cell lines as well as human primary hepatocytes (218). In men, infusion of
GLP-1 during pancreatic clamp reduced endogenous glucose production, confirming the
presence of an extra-pancreatic effect in vivo (510). Infusion of GLP-1(9-36)amide during
euglycemic clamp potently inhibited hepatic glucose production in healthy human subjects (551).
In my study, the aged Pak1-/- mice exhibited impaired tolerance to ip pyruvate challenge
(IPPTT), suggesting that Pak1 is involved in hepatic glucose metabolism. Treatment with IPA3
led to a reduction in gluconeogenic gene expression and glucose production in isolated mouse
hepatocytes, implicating group I Paks as positive regulators of glucose production. Consecutive
injection of forskolin, a gcg-stimulating agent, ameliorated the defect in pyruvate intolerance.
Similarly, treatment with the DPP-IV inhibitor sitagliptin completely reversed the defect in
IPPTT. Both these findings support the notion that the impaired IPPTT in aged Pak1-/- mice is at
least partially caused by defective gut gcg expression and GLP-1 production. I showed that the
aged Pak1-/- mice also exhibited reduced insulin response following glucose challenge. Hence, it
is difficult to distinguish between the pancreatic versus extra-pancreatic effects of GLP-1 in my
study. However, considering the controversies revolving GLP-1 on hepatic glucose production,
175
my study provided a foundational assessment of the role of Pak1 in GLP-1 production and
hepatic glucose metabolism. The generation of tissue-specific Pak1-/- mice can be utilized as
mouse models to study direct versus indirect Pak1 and GLP-1 effects in future studies.
Furthermore, specific deletion of Pak1 in gut endocrine L cells, or the expression of a
dominant negative Pak1 construct in the gut endocrine L cells, will be useful in vivo models in
assessing tissue-specific function of Pak1.
7.1.4 Redundant functions of group I Paks
The group I Pak inhibitor IPA3 is an allosteric non-ATP-competitive inhibitor against
Paks 1-3, while having no effect on the more distantly-related Paks 4-6 (365). In my
investigation, IPA3 treatment attenuated insulin-stimulated gcg expression in intestinal L cells.
However, one cannot rule out the possibility that Paks 1-3 may act in a redundant manner in
vitro, and more importantly, in vivo as well. Considering this functional redundancy, the
physiological significance of the insulin/Pak1/β-cat axis in gut GLP-1 production may have been
undermined in the Pak1-/- mice. To examine overall group I Pak function, knockout mouse
models lacking multiple Pak isoforms can be generated.
Notably, I have shown that the intestinal endocrine L cell line GLUTag expresses all
three members of the group I Paks. In addition to pharmacological approaches (i.e. the use of
IPA3), I also utilized dominant negative Pak1, which leads to the functional knockdown Pak1
only (without affecting Pak2 and Pak3). In order to further identify the actions of each Pak
member in the in vitro setting, more sophisticated knockdown approaches are required. There is
strong interest in the development of Pak inhibitors as anti-cancer drugs. However, currently

176
there are no reported effective Pak inhibitors for clinical use; and for research purposes, no
compound has been identified that targets a single Pak isoform (552). Hence, one may turn to
genetic approaches, such as small interference RNA (siRNA) or small hairpin RNA (shRNA)
based methods. In expanding the current study, one can knockdown the expression of each of the
three Paks in vitro, and determine whether the knockdown affects basal as well as insulin- or
PKA-stimulated gcg expression and GLP-1 production.
The functional redundancies of group I Pak isoforms have been reported in vivo. The
Pak1-/- mice do not exhibit phenotypic abnormalities, but closer examination reveals defects in
synaptic transmission (526). The Pak3-/- mice are healthy, fertile, and possess normal locomotor
functions (415). However, Pak3-/- mice have significantly reduced late phase LTP, and display
deficient memory retention in taste aversion tests, both of which are events associated with
mental retardation (415). Notably, a lesion in PAK3 gene is associated with X-linked
nonsyndromic mental retardation in humans (383). Unlike the relatively subtle deficits observed
in Pak1-/- mice and Pak3-/- mice, the Pak1-/-;Pak3-/- double-knockout (DKO) mice have drastic
loss of brain volume (499). The DKO mice also exhibited functional synaptic defects, including
altered cofilin activation and actin filament properties, and behavioral defects, such as memory
retention deficits and hyperactivity (499).
Using isolated mouse hepatocytes, I showed that IPA3 pretreatment attenuated the
stimulatory effect of glucagon or forskolin on gluconeogenic gene expression. Combined with
the observation that the Pak1-/- mice have worsened tolerance to ip pyruvate, one may conclude
that the defect in hepatic glucose homeostasis is not due to the lack of Pak1 in the liver. My
study demonstrates that the direct effect of group I Paks on hepatocytes is to function as positive
regulators for gluconeogenesis. As hepatocytes isolated from Pak1-/- mice showed normal

177
response to glucagon or forskolin treatment, I speculate that either Pak2, or Pak3, or both Pak2
and Pak3, are positive regulators of hepatic gluconeogenesis and can compensate for the lack of
Pak1. To verify this speculation, the siRNA or shRNA knockdown approaches can be utilized.
7.1.5 Pak1-/- mice as a novel model for metabolic and aging studies
As outlined in the previous sections, functional metabolic defects were observed in
multiple organs in the Pak1-/- mice. Ablation of Pak1 led to attenuated insulin-stimulated glucose
uptake in skeletal muscle and impaired second phase of GSIS in the pancreas. Expanding the
investigation into the gut and liver, my studies demonstrated that Pak1-/- exhibited reduced levels
of circulating active GLP-1, glucose intolerance, and aberrant hepatic glucose production.
Altogether, these observations corroboratively present Pak1-/- mice as a suitable model for
examining metabolic homeostasis.
In my study, the defective GLP-1 production underscoring oral glucose intolerance and
dysregulated hepatic glucose production was observed in significantly aged Pak1-/- mice. Aging
is associated with multiple dimensions of the metabolic syndrome, including T2D, hypertension,
and macrovascular diseases (553). Aging is a known risk factor for deteriorating glycemic
control, and is associated with a progressive increase in T2D prevalence (554,555). This
correlation was originally simply attributed to impaired β cell function and insulin response
(556,557). As the incretin effect is centrally involved in regulating glucose homeostasis, it stands
to reason that GLP-1 production and/or function may be involved in age-related T2D
pathophysiology.

178
In humans, aging was suggested to be associated with a modest slowing of gastric
emptying (558,559), which is a major determinant in postprandial timing and intensity of GLP-1
release. The GLP-1 response following a mixed meal was shown to be reduced in T2D patients
(560), and a longitudinal study demonstrated the correlation between reduced plasma GLP-1
levels and impaired glucose tolerance in elderly T2D men (497).
My study showed that aged Pak1-/- mice exhibited blunted insulin response following
glucose challenge, and this may be due to reduced β cell mass. Supporting this line of thinking,
age-dependent loss of β cell regeneration has been documented in mice (561,562) and in human
(563). I also showed that the aged Pak1-/- mice have lower basal glucagon levels, with no further
reduction following glucose challenge. This is consistent with a previous study, where
pancreases from young versus aged Zucker rats were perfused to examine age-related changes in
pancreatic glucagon secretion (564). High glucose treatment suppressed glucagon secretion in
pancreas from young rats, whereas basal glucagon secretion was lower and glucose did not elicit
any response in pancreas from aged rats (564). Together, these observations imply that there may
be age-dependent overall deterioration in pancreatic hormone production.
Wistar rats develop glucose intolerance and diminished insulin response as they progress
with age (565,566). Notably, GLP-1 delivery via osmotic pumps or direct infusion in aged
Wistar rats resulted in improved glucose tolerance and enhanced insulin response to glucose
challenge, suggesting that exogenous GLP-1 administration is able to reverse age-related glucose
intolerance (567,568). The same phenomenon was observed in mice, where administration of a
long-acting GLP-1R agonist led to improved glycemic response, elevated GSIS, and enhanced
insulin sensitivity (569).

179
In line with these observations, my study provided extended evidence for the beneficial
role of GLP-1 in regulating glucose homeostasis in aged animals. I showed that administration of
forskolin in aged Pak1-/- mice lead to increased gcg expression associated with improved
pyruvate tolerance. More importantly, administration of sitagliptin resulted in the concurrent
improvement of pyruvate tolerance and oral glucose tolerance in the aged Pak1-/- mice. The
effectiveness of sitagliptin utilized in my study was demonstrated by the significantly elevated
circulating GLP-1 levels in the aged Pak1-/- mice receiving this treatment.
The majority of aging-related clinical studies focus on the pancreatic effects of GLP-1,
and it has been demonstrated that the β cell response to GLP-1 is impaired in healthy elderly
subjects (570,571). However, it has also been suggested that age-dependent loss of glycemic
control may be in part due to alterations in hepatic glucose production (553). As noted
previously, the potential beneficial effects of GLP-1 on hepatic glucose homeostasis in humans is
being actively investigated. In my study, I examined the role of GLP-1 in hepatic glucose
homeostasis using the aged Pak1-/- mice as a novel mouse model. My study reaffirms the clinical
importance of GLP-1 based therapeutics as a glucose-lowering agent, particularly in elderly T2D
patients.
7.2 Overall importance of study and conclusion
The overall summary of this study is illustrated in Fig. 7.1. In examining the proliferative
role of insulin, our group has previously reported the role of Pak1 mediating the crosstalk
between insulin and Wnt signaling pathways in the context of colorectal cancer. In this study, we
aimed to investigate the function of Pak1 in incretin hormone production and glucose

180
homeostasis. We demonstrated the novel role of Pak1 as a central linker in the crosstalk between
insulin and Wnt signaling pathways; and as a regulator of gcg expression in gut and brain gcg-
expressing cells.
Ablation of Pak1 in mice led to reduced intestinal gcg expression and lower circulating
postprandial GLP-1 and insulin levels, and culminated in glucose intolerance even in the absence
of challenge. In aged Pak1-/- mice, a defect in elevated hepatic glucose production was observed
by more severe intolerance to intraperitoneal pyruvate injection, which was accompanied by
reduced plasma GLP-1 levels. However, treatment with IPA led to reduced gluconeogenic gene
expression and glucose production in mouse primary hepatocytes, suggesting that the direct
effect of Pak is to stimulate glucose production. It is plausible that the impairment in pyruvate
tolerance may be due to the secondary effect of defective GLP-1 production, which is known to
suppress hepatic glucose output. Overall, the Pak1-/- mice exhibit phenotypes that depict a clear
picture of aberrant glucose homeostasis. Together with the known essential function of Pak1 in
muscle glucose uptake and pancreatic insulin secretion, the findings of this study reiterate and
also expand the important role of Pak1 in glucose homeostasis in exerting its effects in multiple
organs.

Fig. 7.1 Overall summary and significance of study. (A) This study identified the role of Pak1 as a regulator of gcg expression, GLP-1 production, and as a linker in the crosstalk between insulin and Wnt signaling pathways. Ablation of Pak1 in mice led to reduced intestinal and brain gcg expression, and lower circulating postprandial GLP-1 and insulin levels, culminating in glucose intolerance. In aged Pak1-/- mice, a defect in hepatic glucose production is associated with and implicated to be caused by reduced plasma GLP-1 levels. (B) Our characterization of the Pak1-/- mice present a combination of defects: impaired glucose tolerance, reduced circulating insulin and GLP-1 levels, and aberrant hepatic glucose production, a potential secondary phenomenon due to the defect in GLP-1. Overall, these phenotypes depict a clear picture of dysfunctional glucose homeostasis. Together with the known functions of Pak1 in muscle glucose uptake and insulin secretion, the findings of this study reiterate the important role of Pak1 in glucose metabolism and homeostasis in the physiological context.
Glucose uptake
Hormone gene expression
Hepatic glucose production
Glucose homeostasis
Hormone production
Pak1
A
B
181
GPCR RTK 7-TMR
cAMP
PKA
PI3K GSK3β
β-cat
Peptide hormones Insulin Wnt
TCF/β-cat CREB
gcg
GLP-1
Hepatic glucose
production
Pak1

182
7.3 Future work
7.3.1 Liver-specific Pak1 knockout mice
My interpretation of the observations made in the aged Pak1-/- mice is that reduced GLP-
1 contributes to elevated hepatic glucose production. I further demonstrated that enhancement of
GLP-1 levels, either through stimulating gcg expression, or through attenuating GLP-1
degradation, was correlated with significant amelioration of the hepatic defect in the aged Pak1-/-
mice. Concurrent with the reduction in circulating GLP-1 levels, an attenuated insulin response
following glucose challenge was observed in the aged Pak1-/- mice. In order to examine the
direct in vivo effect of Pak1 in the liver, while circumventing the contributions of GLP-1 and
insulin, the generation of liver-specific Pak1-/- (L-Pak1-/-) mice will be required. The transgenic
mouse line that expresses Cre recombinase under the liver-specific albumin promoter (Alb-Cre)
is commercially available, and crossing the Alb-Cre line with the Pak1-/- mouse line would
produce the L-Pak1-/- mouse line required for these further studies. Based on the suppressive
effect of IPA3 on glucose production in mouse primary hepatocytes (as described in Aim III), I
speculate that the L-Pak1-/- mice would exhibit reduced hepatic glucose production and improved
IPPTT.
7.3.2 IPA3 as a potential glucose-lowering drug
The currently identified Pak inhibitors are classified into two major categories: ATP-
competitive inhibitors and allosteric inhibitors. The ATP-competitive inhibitors were the first
ones to be discovered, and consist of chemical compounds that target the ATP-binding pocket

183
within the catalytic domain of all Paks (572). In recent years, a group of compounds have been
identified that interact with Pak outside of its catalytic domain, and hence are non-ATP-
competitive.
IPA3 was discovered as a potent, non-ATP-competitive, allosteric inhibitor that targets
group I Paks (365). It is a symmetric dimer joined by a disulfide bond, which targets the PBD of
Paks. IPA3 binds covalently to the Pak1 regulatory domain and prevents its binding to activator
Cdc42, thereby directly inhibiting Cdc42-induced Pak1 auto-phosphorylation at Thr423.
However, pre-activated Pak1 neither binds to nor is inhibited by IPA3. When screened against a
kinetome, IPA3 exhibited high kinase specificity, where less than 4% of the kinases were shown
to be inhibited by IPA3.
My study demonstrated that IPA3 potently attenuated forskolin- and glucagon-stimulated
glucose production in isolated mouse hepatocytes. The standard concentration of IPA3 used in
this study was 10-20 μM;; however, I also found that IPA3 elicited comparable responses at the
much lower dose of 1 μM. A previous study showed that the IC50 of IPA3 was 2.5 μM, and that
IPA3 at a concentration of 10μM was able to inhibit ~95% of Pak1 kinase activity (365).
Therefore, the potency and selectivity of IPA3 makes it an ideal candidate for clinical use,
including in the treatment of cancer or potentially metabolic diseases.
Based on my finding of the glucose-lowering ability of IPA3 on isolated hepatocytes,
one would need to further assess the effect of IPA3 in vivo. Currently, there are no reports on the
metabolic effects of IPA3 in vivo, although a few reports exist in the literature on the effect of
Pak inhibitors in rodent models. One study showed that administration of IPA3 reduced airway
responsiveness in mice, indicating its potential use as a hyper-ventilative treatment (573).
FRAX486, another group I Pak inhibitor, rescued seizures and behavioral abnormalities when

184
administered to a mental retardation mouse model (574). Another related compound, the group I
Pak inhibitor FRAX597, was found to inhibit tumorigenesis of NF2-associated schwannomas in
immune-compromised mouse models (575).
In expanding my research to study the effect of IPA3 in vivo, and in order to examine
liver-specific effects of IPA3, targeted delivery of IPA3 to the liver will be needed. Extensive
research is underway to design liposome-based and polymer-based targeted drug delivery to the
diseased liver. In mice, injection into tail vein has been used to deliver and target nucleic acid
based substances to the liver (576). This approach may be used to target IPA3 to the liver in
mice, and to examine whether IPA3 administration leads to reduced hepatic glucose production
in vivo. In addition to IPPTT, other more sophisticated techniques would include directly
assessing endogenous/hepatic glucose production using pancreatic clamp techniques. Ultimately,
the clinical potential of IPA3 as a glucose-lowering drug can only be fully realized if a suitable
route of administration can be found, if the effective pharmaceutical dosage can be achieved and
sustained, and if the drug has tolerable toxicity in the liver and the body overall. As noted
previously, there is currently very active interest in developing Pak inhibitors as anti-cancer
drugs, and hence their therapeutic potential in the treatment of metabolic disorders can be
investigated in parallel.
7.3.3 The role of Pak1 and Wnt signaling in adipogenesis
The role of the Wnt pathway in adipogenesis has been recognized for over a decade.
Adipogenesis is the process where preadipocytes differentiate into adipocytes, which is the major
cell type for lipid storage and metabolism. The transcriptional cascade for adipogenesis has been

185
well characterized, with peroxisome proliferator-activated receptor γ (PPARγ) and the
CCAAT/enhancer binding protein α (C/EBPα) being chief regulators of the adipogenic program.
PPARγ is both necessary and sufficient for adipocyte differentiation(577), while C/EBPα is
implicated in regulating adipocyte insulin sensitivity (578). For a few recent reviews please refer
to (191,577,579). Adipogenesis is regulated by external stimuli, one of which is the recently
identified involvement of the Wnt signaling pathway. In addition to adipogenesis, the Wnt
signaling has also been implicated in regulating adipocyte function (580-584).
In preadipocyte cell lines, expression of Wnt1, an activator of Wnt signaling, potently
represses adipogenesis (580,584). Administration of pharmacological Wnt activators produce
similar results (580,581). Conversely, inhibiting Wnt signaling in preadipocytes stimulates
differentiation (580,581,585-587). Preadipocytes produce endogenous Wnts, one of them being
Wnt10b. Overexpression of Wnt10b induces cytosolic β-cat accumulation and the inhibition of
adipogenesis (580). The mechanisms underlying Wnt-mediated repression of adipogenesis is not
entirely understood;; however, it has been suggested that β-cat is the central mechanism for
inhibiting adipogenesis. For example, Cby, a nuclear β-cat antagonist, was found to be expressed
in adipose tissues. Ectopic Cby expression led to induced differentiation of the preadipocyte cell
line 3T3-L1, while Cby depletion resulted in enhanced β-cat activity and inhibition of 3T3-L1
cell differentiation (585). Similarly, expression of another inhibitor of Wnt/β-cat signaling,
Dickkopf-1, promoted 3T3-L1 cell differentiation (587). The in vivo role of Wnt signaling is
beginning to be elucidated. Overexpression of Wnt10b in mice leads to about 50% reduction in
adiposity, and these mice are resistant to diet-induced and genetic obesity (582,583). Mice
expressing the Wnt10b transgene also exhibit improved glucose homeostasis and enhanced
insulin sensitivity (582,583).

186
In line with the observations that modulators of β-cat are integral in regulating
adipogenesis, and considering my previous studies on identifying Pak1 as a regulator of β-cat in
multiple cell types and organs, it is probable that Pak1/β-cat signaling is involved in regulating
adipocygenesis. In my previous studies, organ weight measurements showed that aged Pak1-/-
mice have reduced epididymal fat pad weights (Fig. 6.8D), suggesting that ablation of Pak1 may
lead to abnormal fat pad distribution.
To determine whole-body adiposity, I performed magnetic resonance imaging (MRI) in
the same animals used for organ weight measurements. Appendix 1A (page 242) shows the
whole-body fat volume measurements of the two groups of mice, where the aged Pak1-/- mice
show about 25% reduction in whole-body fat volume. Appendix 1B (page 242) depicts
representative MRI serial scans of one wild-type mouse (Mouse 3, top) and one knockout mouse
(Mouse 4, bottom). The reduction of epididymal fat pad and whole-body fat in the aged Pak1-/-
mice would implicate that Pak1 is a positive regulator of adipogenesis.
In order to specifically examine the levels of intra-hepatic fat, spectral analysis was
performed during the MRI scanning. Appendix 2 (page 243) shows that the hepatic fat content
was comparable between the aged Pak1-/- mice and wild-type control mice. These preliminary
data suggest that Pak1 ablation primarily causes manifestations in abdominal and subcutaneous
fat, while having no substantial effect on visceral fat depots.
Based on the current literature, Wnt signaling is commonly viewed as a negative
regulator of adipogenesis. As Pak1 has been identified as a stimulator of β-cat activity in
multiple cell types and organs by our group and others, one would predict that Pak1 ablation
would lead to an increased adiposity in mice. Potentially, our observation that the aged Pak1-/-

187
mice have reduced and not elevated adiposity could be due to the defective gcg expression and
GLP-1 production.
GLP-1 has been reported to function as an intestinal signal in adipocyte biology.
Treatment with GLP-1 or its long-lasting analog Liraglutide were shown to dose-dependently
activate GLP-1R/Erk/PKC/Akt in 3T3-L1 cells, and injection of Liraglutide in mice led to
increased adipocyte numbers (588). Conversely, GLP-1R depletion resulted in reduced
adipogenesis (588). In another study, GLP-1 treatment stimulated PPARg protein levels and
C/EBPa gene transcription, accompanied by increased numbers of small adipocytes in 3T3-L1
cells, suggesting that GLP-1 promotes adipogenesis (589). Hence, defective gut gcg expression
resulting in reduced circulating GLP-1 levels in the Pak1-/- mice could lead to impaired
adipogenesis.
In order to assess the direct effect of Pak1 inhibition or ablation on adipogenesis, further
studies will need to be conducted. The use of the Pak inhibitor IPA3 in preadipocyte cell lines
may elucidate the direct effect of Pak on adipocyte formation and differentiation, including the
examinations of the effect of IPA3 on adipogenic gene expression and on PPARγ and C/EBPα
expression and activity. Further assessment of the Pak1-/- mouse model, utilizing GLP-1
enhancing agents such as sitagliptin or direct GLP-1 analog administration, would further
confirm whether the observed phenotypes of reduced epididymal fat pad and whole-body
adiposity can be rescued and hence are indeed due to the defect in GLP-1. Due to the scope of
my current study and its limitations, these experiments will be treated as future directions.

188
7.3.4 GLP-2 as an intestinotrophic factor and as a treatment for
intestinal diseases
GLP-2 was initially identified as a trophic factor of the intestine based on case reports of
patients with PDGF-secreting tumors with associated small bowl mucosal hypertrophy
(120,590,591). GLP-2 is a 33 aa single-chain polypeptide, produced by PC2-mediated cleavage
of proglucagon in intestinal L cells. To date, the major reported physiological function of GLP-2
is the stimulation of intestinal crypt cell proliferation (592,593), although GLP-2 has also been
shown to regulate intestinal lipoprotein metabolism (594). The intestinotropic effect of GLP-2
was demonstrated in rodent species (595), and elevated expression of GLP-2 receptor was
observed in gastrointestinal tumors such as Crohn’s disease (596). Treatment with GLP-2 in
mice resulted in tropic and anti-apoptotic effects, as observed through increased cellularity of the
intestinal epithelial layer and intestinal weight (120,597). The effect of GLP-2 on gut lipoprotein
metabolism was demonstrated in a hamster model, where intravenous administration of GLP-2
led to reduced apolipoprotein B48 and TG levels, while administration of GLP-1 resulted in
opposite effects, implicating the two glucagon-like peptides as opposing factors in regulating
intestinal lipoprotein production (594).
Teduglutide is a GLP-2 analog with a glycine-to-alanine substitution at position 2,
rendering it more resistant to DPP-IV mediated degradation and hence possessing a longer half-
life than native GLP-2 (598). Teduglutide has been regarded as a promising treatment for short
bowel syndrome, a type of malabsorption disorder caused by inflammatory bowel disease or
intestinal resections (598,599). Several studies have examined the role of GLP-2 in cancer
initiation or progression, and have suggested that the proliferative function of GLP-2 involves
Wnt signaling and the PI3K/Akt pathways (593,600,601).

189
In my study, the aged Pak1-/- mice have reduced distal ileum weight; importantly, this
was associated with lower circulating GLP-2 levels (Appendix 3, page 244). This finding
implicates the causative relationship between GLP-2 levels and intestinal growth in the aged
Pak1-/- mice. To further verify reduced GLP-2 levels, one can quantify intestinal GLP-2 content
using immunostaining techniques. To further identify the intestinal defects, one can examine
morphological abnormalities of the intestinal tissues, measure crypt-villus height of the IECs,
and quantify cell proliferation within the various intestinal cell layers using markers such as Ki67
staining.

190
8 References

191
1. Alberti KG, Zimmet PZ. Definition, diagnosis and classification of diabetes mellitus and its complications. Part 1: diagnosis and classification of diabetes mellitus provisional report of a WHO consultation. Diabet Med. 1998;15(7):539-553.
2. Coustan DR. Gestational diabetes mellitus. Clin Chem. 2013;59(9):1310-1321.
3. Kavvoura FK, Owen KR. Maturity onset diabetes of the young: clinical characteristics, diagnosis and management. Pediatr Endocrinol Rev. 2012;10(2):234-242.
4. Naik RG, Brooks-Worrell BM, Palmer JP. Latent autoimmune diabetes in adults. J Clin Endocrinol Metab. 2009;94(12):4635-4644.
5. Bremer AA, Jialal I. Adipose tissue dysfunction in nascent metabolic syndrome. J Obes. 2013;2013:393192.
6. Rahman R, Hammoud GM, Almashhrawi AA, Ahmed KT, Ibdah JA. Primary hepatocellular carcinoma and metabolic syndrome: An update. World J Gastrointest Oncol. 2013;5(9):186-194.
7. Ma X, Zhu S. Metabolic syndrome in the prevention of cardiovascular diseases and diabetes--still a matter of debate? Eur J Clin Nutr. 2013;67(5):518-521.
8. Gremese E, Ferraccioli G. The metabolic syndrome: the crossroads between rheumatoid arthritis and cardiovascular risk. Autoimmun Rev. 2011;10(10):582-589.
9. Ruderman NB, Carling D, Prentki M, Cacicedo JM. AMPK, insulin resistance, and the metabolic syndrome. J Clin Invest. 2013;123(7):2764-2772.
10. Beagley J, Guariguata L, Weil C, Motala AA. Global estimates of undiagnosed diabetes in adults for 2013 for the IDF Diabetes Atlas. Diabetes Res Clin Pract. 2013.
11. Bentley PJ. Endocrine pharmacology: physiological basis and therapeutic applications. CUP Archive; 1980.
12. Sakula A. Paul Langerhans (1847-1888): a centenary tribute. Journal of the Royal Society of Medicine. 1988;81(7):414-415.
13. Elayat AA, el-Naggar MM, Tahir M. An immunocytochemical and morphometric study of the rat pancreatic islets. Journal of anatomy. 1995;186 ( Pt 3):629-637.
14. Brissova M, Fowler MJ, Nicholson WE, Chu A, Hirshberg B, Harlan DM, Powers AC. Assessment of human pancreatic islet architecture and composition by laser scanning confocal microscopy. The journal of histochemistry and cytochemistry : official journal of the Histochemistry Society. 2005;53(9):1087-1097.
15. Benson DA, Karsch-Mizrachi I, Lipman DJ, Ostell J, Wheeler DL. GenBank. Nucleic acids research. 2006;34(Database issue):D16-20.

192
16. Weiss MA. Diabetes mellitus due to the toxic misfolding of proinsulin variants. FEBS Lett. 2013;587(13):1942-1950.
17. Volchuk A, Ron D. The endoplasmic reticulum stress response in the pancreatic β-cell. Diabetes, obesity & metabolism. 2010;12 Suppl 2:48-57.
18. Eizirik DL, Miani M, Cardozo AK. Signalling danger: endoplasmic reticulum stress and the unfolded protein response in pancreatic islet inflammation. Diabetologia. 2013;56(2):234-241.
19. Weir GC, Bonner-Weir S. Islet β cell mass in diabetes and how it relates to function, birth, and death. Ann N Y Acad Sci. 2013;1281:92-105.
20. Wang Q, Jin T. The role of insulin signaling in the development of β-cell dysfunction and diabetes. Islets. 2009;1(2):95-101.
21. Wang Z, Thurmond DC. Mechanisms of biphasic insulin-granule exocytosis - roles of the cytoskeleton, small GTPases and SNARE proteins. J Cell Sci. 2009;122(Pt 7):893-903.
22. MacDonald PE. Signal integration at the level of ion channel and exocytotic function in pancreatic β-cells. American journal of physiology Endocrinology and metabolism. 2011;301(6):E1065-1069.
23. Kwan EP, Gaisano HY. Rescuing the subprime meltdown in insulin exocytosis in diabetes. Ann N Y Acad Sci. 2009;1152:154-164.
24. Jewell JL, Oh E, Thurmond DC. Exocytosis mechanisms underlying insulin release and glucose uptake: conserved roles for Munc18c and syntaxin 4. Am J Physiol Regul Integr Comp Physiol. 2010;298(3):R517-531.
25. Lam PP, Ohno M, Dolai S, He Y, Qin T, Liang T, Zhu D, Kang Y, Liu Y, Kauppi M, Xie L, Wan WC, Bin NR, Sugita S, Olkkonen VM, Takahashi N, Kasai H, Gaisano HY. Munc18b is a major mediator of insulin exocytosis in rat pancreatic β-cells. Diabetes. 2013;62(7):2416-2428.
26. Xie L, Zhu D, Kang Y, Liang T, He Y, Gaisano HY. Exocyst sec5 regulates exocytosis of newcomer insulin granules underlying biphasic insulin secretion. PLoS One. 2013;8(7):e67561.
27. Xia F, Gao X, Kwan E, Lam PP, Chan L, Sy K, Sheu L, Wheeler MB, Gaisano HY, Tsushima RG. Disruption of pancreatic beta-cell lipid rafts modifies Kv2.1 channel gating and insulin exocytosis. The Journal of biological chemistry. 2004;279(23):24685-24691.
28. Xia F, Xie L, Mihic A, Gao X, Chen Y, Gaisano HY, Tsushima RG. Inhibition of cholesterol biosynthesis impairs insulin secretion and voltage-gated calcium channel function in pancreatic beta-cells. Endocrinology. 2008;149(10):5136-5145.

193
29. Thams P, Capito K. L-arginine stimulation of glucose-induced insulin secretion through membrane depolarization and independent of nitric oxide. European journal of endocrinology / European Federation of Endocrine Societies. 1999;140(1):87-93.
30. Li C, Najafi H, Daikhin Y, Nissim IB, Collins HW, Yudkoff M, Matschinsky FM, Stanley CA. Regulation of leucine-stimulated insulin secretion and glutamine metabolism in isolated rat islets. The Journal of biological chemistry. 2003;278(5):2853-2858.
31. Campfield LA, Smith FJ. Neural control of insulin secretion: interaction of norepinephrine and acetylcholine. The American journal of physiology. 1983;244(5):R629-634.
32. Proks P, Reimann F, Green N, Gribble F, Ashcroft F. Sulfonylurea stimulation of insulin secretion. Diabetes. 2002;51 Suppl 3:S368-376.
33. Fried M, Schwizer W, Beglinger C, Keller U, Jansen JB, Lamers CB. Physiological role of cholecystokinin on postprandial insulin secretion and gastric meal emptying in man. Studies with the cholecystokinin receptor antagonist loxiglumide. Diabetologia. 1991;34(10):721-726.
34. Ahren B, Havel PJ. Leptin increases circulating glucose, insulin and glucagon via sympathetic neural activation in fasted mice. International journal of obesity and related metabolic disorders : journal of the International Association for the Study of Obesity. 1999;23(6):660-665.
35. Kreymann B, Williams G, Ghatei MA, Bloom SR. Glucagon-like peptide-1 7-36: a physiological incretin in man. Lancet. 1987;2(8571):1300-1304.
36. Drucker DJ. The role of gut hormones in glucose homeostasis. The Journal of clinical investigation. 2007;117(1):24-32.
37. Di Guglielmo GM, Drake PG, Baass PC, Authier F, Posner BI, Bergeron JJ. Insulin receptor internalization and signalling. Molecular and cellular biochemistry. 1998;182(1-2):59-63.
38. Bergeron JJ, Di Guglielmo GM, Baass PC, Authier F, Posner BI. Endosomes, receptor tyrosine kinase internalization and signal transduction. Bioscience reports. 1995;15(6):411-418.
39. Duckworth WC, Bennett RG, Hamel FG. Insulin degradation: progress and potential. Endocrine reviews. 1998;19(5):608-624.
40. Schroeder WT, Lopez LC, Harper ME, Saunders GF. Localization of the human glucagon gene (GCG) to chromosome segment 2q36----37. Cytogenet Cell Genet. 1984;38(1):76-79.
41. Rouille Y, Martin S, Steiner DF. Differential processing of proglucagon by the subtilisin-like prohormone convertases PC2 and PC3 to generate either glucagon or glucagon-like peptide. The Journal of biological chemistry. 1995;270(44):26488-26496.

194
42. Kieffer TJ, Habener JF. The glucagon-like peptides. Endocrine reviews. 1999;20(6):876-913.
43. Larsen PJ, Tang-Christensen M, Holst JJ, Orskov C. Distribution of glucagon-like peptide-1 and other preproglucagon-derived peptides in the rat hypothalamus and brainstem. Neuroscience. 1997;77(1):257-270.
44. Ramnanan CJ, Edgerton DS, Kraft G, Cherrington AD. Physiologic action of glucagon on liver glucose metabolism. Diabetes, obesity & metabolism. 2011;13 Suppl 1:118-125.
45. Gerich JE, Karam JH, Forsham PH. Stimulation of glucagon secretion by epinephrine in man. The Journal of clinical endocrinology and metabolism. 1973;37(3):479-481.
46. Gerich JE, Charles MA, Grodsky GM. Characterization of the effects of arginine and glucose on glucagon and insulin release from the perfused rat pancreas. The Journal of clinical investigation. 1974;54(4):833-841.
47. Porcellati F, Pampanelli S, Rossetti P, Busciantella Ricci N, Marzotti S, Lucidi P, Santeusanio F, Bolli GB, Fanelli CG. Effect of the amino acid alanine on glucagon secretion in non-diabetic and type 1 diabetic subjects during hyperinsulinaemic euglycaemia, hypoglycaemia and post-hypoglycaemic hyperglycaemia. Diabetologia. 2007;50(2):422-430.
48. Quesada I, Tuduri E, Ripoll C, Nadal A. Physiology of the pancreatic alpha-cell and glucagon secretion: role in glucose homeostasis and diabetes. The Journal of endocrinology. 2008;199(1):5-19.
49. Verspohl EJ, Ammon HP. Cholecystokinin (CCK8) regulates glucagon, insulin, and somatostatin secretion from isolated rat pancreatic islets: interaction with glucose. Pflugers Arch. 1987;410(3):284-287.
50. Maruyama H, Hisatomi A, Orci L, Grodsky GM, Unger RH. Insulin within islets is a physiologic glucagon release inhibitor. The Journal of clinical investigation. 1984;74(6):2296-2299.
51. Strowski MZ, Parmar RM, Blake AD, Schaeffer JM. Somatostatin inhibits insulin and glucagon secretion via two receptors subtypes: an in vitro study of pancreatic islets from somatostatin receptor 2 knockout mice. Endocrinology. 2000;141(1):111-117.
52. Gerich JE, Langlois M, Schneider V, Karam JH, Noacco C. Effects of alternations of plasma free fatty acid levels on pancreatic glucagon secretion in man. The Journal of clinical investigation. 1974;53(5):1284-1289.
53. Herold KC, Jaspan JB. Hepatic glucagon clearance during insulin induced hypoglycemia. Hormone and metabolic research = Hormon- und Stoffwechselforschung = Hormones et metabolisme. 1986;18(7):431-435.

195
54. Mighiu PI, Yue JT, Filippi BM, Abraham MA, Chari M, Lam CK, Yang CS, Christian NR, Charron MJ, Lam TK. Hypothalamic glucagon signaling inhibits hepatic glucose production. Nature medicine. 2013.
55. Tan TM, Field BC, McCullough KA, Troke RC, Chambers ES, Salem V, Gonzalez Maffe J, Baynes KC, De Silva A, Viardot A, Alsafi A, Frost GS, Ghatei MA, Bloom SR. Coadministration of glucagon-like peptide-1 during glucagon infusion in humans results in increased energy expenditure and amelioration of hyperglycemia. Diabetes. 2013;62(4):1131-1138.
56. Habegger KM, Stemmer K, Cheng C, Muller TD, Heppner KM, Ottaway N, Holland J, Hembree JL, Smiley D, Gelfanov V, Krishna R, Arafat AM, Konkar A, Belli S, Kapps M, Woods SC, Hofmann SM, D'Alessio D, Pfluger PT, Perez-Tilve D, Seeley RJ, Konishi M, Itoh N, Kharitonenkov A, Spranger J, Dimarchi RD, Tschop MH. Fibroblast growth factor 21 mediates specific glucagon actions. Diabetes. 2013;62(5):1453-1463.
57. Crunkhorn S. Metabolic disorders: FGF21 analogue shows promise in the clinic. Nat Rev Drug Discov. 2013;12(11):825.
58. Xiao C, Pavlic M, Szeto L, Patterson BW, Lewis GF. Effects of acute hyperglucagonemia on hepatic and intestinal lipoprotein production and clearance in healthy humans. Diabetes. 2011;60(2):383-390.
59. Patel GK, Whalen GE, Soergel KH, Wu WC, Meade RC. Glucagon effects on the human small intestine. Digestive diseases and sciences. 1979;24(7):501-508.
60. Taylor I, Duthie HL, Cumberland DC, Smallwood R. Glucagon and the colon. Gut. 1975;16(12):973-978.
61. Meier JJ, Kjems LL, Veldhuis JD, Lefebvre P, Butler PC. Postprandial suppression of glucagon secretion depends on intact pulsatile insulin secretion: further evidence for the intraislet insulin hypothesis. Diabetes. 2006;55(4):1051-1056.
62. Jamison RA, Stark R, Dong J, Yonemitsu S, Zhang D, Shulman GI, Kibbey RG. Hyperglucagonemia precedes a decline in insulin secretion and causes hyperglycemia in chronically glucose-infused rats. American journal of physiology Endocrinology and metabolism. 2011;301(6):E1174-1183.
63. Unger RH, Cherrington AD. Glucagonocentric restructuring of diabetes: a pathophysiologic and therapeutic makeover. The Journal of clinical investigation. 2012;122(1):4-12.
64. Krulich L, Dhariwal AP, McCann SM. Stimulatory and inhibitory effects of purified hypothalamic extracts on growth hormone release from rat pituitary in vitro. Endocrinology. 1968;83(4):783-790.
65. Brazeau P, Vale W, Burgus R, Ling N, Butcher M, Rivier J, Guillemin R. Hypothalamic polypeptide that inhibits the secretion of immunoreactive pituitary growth hormone. Science. 1973;179(4068):77-79.

196
66. Pelletier G, Dubé D, Puviani R. Somatostatin: electron microscope immunohistochemical localization in secretory neurons of rat hypothalamus. Science. 1977;196(4297):1469-1470.
67. Reisine T, Bell GI. Molecular biology of somatostatin receptors. Endocrine reviews. 1995;16(4):427-442.
68. Patel YC. Somatostatin and its receptor family. Front Neuroendocrinol. 1999;20(3):157-198.
69. Csaba Z, Dournaud P. Cellular biology of somatostatin receptors. Neuropeptides. 2001;35(1):1-23.
70. Barnett P. Somatostatin and somatostatin receptor physiology. Endocrine. 2003;20(3):255-264.
71. Culler MD, Oberg K, Arnold R, Krenning EP, Sevilla I, Díaz JA. Somatostatin analogs for the treatment of neuroendocrine tumors. Cancer Metastasis Rev. 2011;30 Suppl 1:9-17.
72. Sidéris L, Dubé P, Rinke A. Antitumor effects of somatostatin analogs in neuroendocrine tumors. Oncologist. 2012;17(6):747-755.
73. Kimmel JR, Pollock HG, Hazelwood RL. Isolation and characterization of chicken insulin. Endocrinology. 1968;83(6):1323-1330.
74. Kimmel JR, Hayden LJ, Pollock HG. Isolation and characterization of a new pancreatic polypeptide hormone. The Journal of biological chemistry. 1975;250(24):9369-9376.
75. Lonovics J, Devitt P, Watson LC, Rayford PL, Thompson JC. Pancreatic polypeptide. A review. Arch Surg. 1981;116(10):1256-1264.
76. Batterham RL, Le Roux CW, Cohen MA, Park AJ, Ellis SM, Patterson M, Frost GS, Ghatei MA, Bloom SR. Pancreatic polypeptide reduces appetite and food intake in humans. The Journal of clinical endocrinology and metabolism. 2003;88(8):3989-3992.
77. Ueno N, Inui A, Iwamoto M, Kaga T, Asakawa A, Okita M, Fujimiya M, Nakajima Y, Ohmoto Y, Ohnaka M, Nakaya Y, Miyazaki JI, Kasuga M. Decreased food intake and body weight in pancreatic polypeptide-overexpressing mice. Gastroenterology. 1999;117(6):1427-1432.
78. Asakawa A, Inui A, Yuzuriha H, Ueno N, Katsuura G, Fujimiya M, Fujino MA, Niijima A, Meguid MM, Kasuga M. Characterization of the effects of pancreatic polypeptide in the regulation of energy balance. Gastroenterology. 2003;124(5):1325-1336.
79. Kojima S, Ueno N, Asakawa A, Sagiyama K, Naruo T, Mizuno S, Inui A. A role for pancreatic polypeptide in feeding and body weight regulation. Peptides. 2007;28(2):459-463.

197
80. Zipf WB, O'Dorisio TM, Cataland S, Sotos J. Blunted pancreatic polypeptide responses in children with obesity of Prader-Willi syndrome. The Journal of clinical endocrinology and metabolism. 1981;52(6):1264-1266.
81. Glaser B, Zoghlin G, Pienta K, Vinik AI. Pancreatic polypeptide response to secretin in obesity: effects of glucose intolerance. Hormone and metabolic research = Hormon- und Stoffwechselforschung = Hormones et metabolisme. 1988;20(5):288-292.
82. Asakawa A, Inui A, Ueno N, Fujimiya M, Fujino MA, Kasuga M. Mouse pancreatic polypeptide modulates food intake, while not influencing anxiety in mice. Peptides. 1999;20(12):1445-1448.
83. Schmidt PT, Näslund E, Grybäck P, Jacobsson H, Holst JJ, Hilsted L, Hellström PM. A role for pancreatic polypeptide in the regulation of gastric emptying and short-term metabolic control. The Journal of clinical endocrinology and metabolism. 2005;90(9):5241-5246.
84. Parker RM, Herzog H. Regional distribution of Y-receptor subtype mRNAs in rat brain. Eur J Neurosci. 1999;11(4):1431-1448.
85. Clark JT, Kalra PS, Crowley WR, Kalra SP. Neuropeptide Y and human pancreatic polypeptide stimulate feeding behavior in rats. Endocrinology. 1984;115(1):427-429.
86. Friedman JM. Leptin at 14 y of age: an ongoing story. Am J Clin Nutr. 2009;89(3):973S-979S.
87. Flier JS, Maratos-Flier E. Lasker lauds leptin. Cell. 2010;143(1):9-12.
88. Nazarians-Armavil A, Menchella JA, Belsham DD. Cellular insulin resistance disrupts leptin-mediated control of neuronal signaling and transcription. Mol Endocrinol. 2013;27(6):990-1003.
89. Coppari R, Bjørbæk C. Leptin revisited: its mechanism of action and potential for treating diabetes. Nat Rev Drug Discov. 2012;11(9):692-708.
90. Halaas JL, Gajiwala KS, Maffei M, Cohen SL, Chait BT, Rabinowitz D, Lallone RL, Burley SK, Friedman JM. Weight-reducing effects of the plasma protein encoded by the obese gene. Science. 1995;269(5223):543-546.
91. Farooqi IS, Jebb SA, Langmack G, Lawrence E, Cheetham CH, Prentice AM, Hughes IA, McCamish MA, O'Rahilly S. Effects of recombinant leptin therapy in a child with congenital leptin deficiency. N Engl J Med. 1999;341(12):879-884.
92. Farooqi IS, O'Rahilly S. Leptin: a pivotal regulator of human energy homeostasis. Am J Clin Nutr. 2009;89(3):980S-984S.
93. Heymsfield SB, Greenberg AS, Fujioka K, Dixon RM, Kushner R, Hunt T, Lubina JA, Patane J, Self B, Hunt P, McCamish M. Recombinant leptin for weight loss in obese and

198
lean adults: a randomized, controlled, dose-escalation trial. JAMA. 1999;282(16):1568-1575.
94. Hukshorn CJ, Saris WH, Westerterp-Plantenga MS, Farid AR, Smith FJ, Campfield LA. Weekly subcutaneous pegylated recombinant native human leptin (PEG-OB) administration in obese men. The Journal of clinical endocrinology and metabolism. 2000;85(11):4003-4009.
95. Fujikawa T, Chuang JC, Sakata I, Ramadori G, Coppari R. Leptin therapy improves insulin-deficient type 1 diabetes by CNS-dependent mechanisms in mice. Proc Natl Acad Sci U S A. 2010;107(40):17391-17396.
96. Yu X, Park BH, Wang MY, Wang ZV, Unger RH. Making insulin-deficient type 1 diabetic rodents thrive without insulin. Proc Natl Acad Sci U S A. 2008;105(37):14070-14075.
97. Park JY, Chong AY, Cochran EK, Kleiner DE, Haller MJ, Schatz DA, Gorden P. Type 1 diabetes associated with acquired generalized lipodystrophy and insulin resistance: the effect of long-term leptin therapy. The Journal of clinical endocrinology and metabolism. 2008;93(1):26-31.
98. Huo L, Gamber K, Greeley S, Silva J, Huntoon N, Leng XH, Bjørbaek C. Leptin-dependent control of glucose balance and locomotor activity by POMC neurons. Cell Metab. 2009;9(6):537-547.
99. Cummings BP, Bettaieb A, Graham JL, Stanhope KL, Dill R, Morton GJ, Haj FG, Havel PJ. Subcutaneous administration of leptin normalizes fasting plasma glucose in obese type 2 diabetic UCD-T2DM rats. Proc Natl Acad Sci U S A. 2011;108(35):14670-14675.
100. Morton GJ, Gelling RW, Niswender KD, Morrison CD, Rhodes CJ, Schwartz MW. Leptin regulates insulin sensitivity via phosphatidylinositol-3-OH kinase signaling in mediobasal hypothalamic neurons. Cell Metab. 2005;2(6):411-420.
101. Coppari R, Ichinose M, Lee CE, Pullen AE, Kenny CD, McGovern RA, Tang V, Liu SM, Ludwig T, Chua SC, Lowell BB, Elmquist JK. The hypothalamic arcuate nucleus: a key site for mediating leptin's effects on glucose homeostasis and locomotor activity. Cell Metab. 2005;1(1):63-72.
102. Mittendorfer B, Horowitz JF, DePaoli AM, McCamish MA, Patterson BW, Klein S. Recombinant human leptin treatment does not improve insulin action in obese subjects with type 2 diabetes. Diabetes. 2011;60(5):1474-1477.
103. Moon HS, Matarese G, Brennan AM, Chamberland JP, Liu X, Fiorenza CG, Mylvaganam GH, Abanni L, Carbone F, Williams CJ, De Paoli AM, Schneider BE, Mantzoros CS. Efficacy of metreleptin in obese patients with type 2 diabetes: cellular and molecular pathways underlying leptin tolerance. Diabetes. 2011;60(6):1647-1656.

199
104. Shimomura I, Hammer RE, Ikemoto S, Brown MS, Goldstein JL. Leptin reverses insulin resistance and diabetes mellitus in mice with congenital lipodystrophy. Nature. 1999;401(6748):73-76.
105. Petersen KF, Oral EA, Dufour S, Befroy D, Ariyan C, Yu C, Cline GW, DePaoli AM, Taylor SI, Gorden P, Shulman GI. Leptin reverses insulin resistance and hepatic steatosis in patients with severe lipodystrophy. The Journal of clinical investigation. 2002;109(10):1345-1350.
106. Oral EA, Simha V, Ruiz E, Andewelt A, Premkumar A, Snell P, Wagner AJ, DePaoli AM, Reitman ML, Taylor SI, Gorden P, Garg A. Leptin-replacement therapy for lipodystrophy. N Engl J Med. 2002;346(8):570-578.
107. Simha V, Subramanyam L, Szczepaniak L, Quittner C, Adams-Huet B, Snell P, Garg A. Comparison of efficacy and safety of leptin replacement therapy in moderately and severely hypoleptinemic patients with familial partial lipodystrophy of the Dunnigan variety. The Journal of clinical endocrinology and metabolism. 2012;97(3):785-792.
108. Rahmouni K, Haynes WG. Leptin and the cardiovascular system. Recent Prog Horm Res. 2004;59:225-244.
109. Bowker SL, Majumdar SR, Veugelers P, Johnson JA. Increased cancer-related mortality for patients with type 2 diabetes who use sulfonylureas or insulin. Diabetes Care. 2006;29(2):254-258.
110. Mithieux G, Rajas F, Gautier-Stein A. A novel role for glucose 6-phosphatase in the small intestine in the control of glucose homeostasis. The Journal of biological chemistry. 2004;279(43):44231-44234.
111. Gerich JE, Meyer C, Woerle HJ, Stumvoll M. Renal gluconeogenesis: its importance in human glucose homeostasis. Diabetes Care. 2001;24(2):382-391.
112. Bayliss WM, Starling EH. The mechanism of pancreatic secretion. J Physiol. 1902;28(5):325-353.
113. Cho YM, Kieffer TJ. K-cells and glucose-dependent insulinotropic polypeptide in health and disease. Vitam Horm. 2010;84:111-150.
114. Dupre J, Ross SA, Watson D, Brown JC. Stimulation of insulin secretion by gastric inhibitory polypeptide in man. The Journal of clinical endocrinology and metabolism. 1973;37(5):826-828.
115. Brown JC, Dryburgh JR, Ross SA, Dupre J. Identification and actions of gastric inhibitory polypeptide. Recent Prog Horm Res. 1975;31:487-532.
116. Ross SA, Brown JC, Dupre J. Hypersecretion of gastric inhibitory polypeptide following oral glucose in diabetes mellitus. Diabetes. 1977;26(6):525-529.

200
117. Bell GI, Santerre RF, Mullenbach GT. Hamster preproglucagon contains the sequence of glucagon and two related peptides. Nature. 1983;302(5910):716-718.
118. Scott J, Selby M, Urdea M, Quiroga M, Bell GI, Rutter WJ. Isolation and nucleotide sequence of a cDNA encoding the precursor of mouse nerve growth factor. Nature. 1983;302(5908):538-540.
119. Hansotia T, Drucker DJ. GIP and GLP-1 as incretin hormones: lessons from single and double incretin receptor knockout mice. Regul Pept. 2005;128(2):125-134.
120. Drucker DJ, Erlich P, Asa SL, Brubaker PL. Induction of intestinal epithelial proliferation by glucagon-like peptide 2. Proc Natl Acad Sci U S A. 1996;93(15):7911-7916.
121. Nikolaidis LA, Elahi D, Hentosz T, Doverspike A, Huerbin R, Zourelias L, Stolarski C, Shen YT, Shannon RP. Recombinant glucagon-like peptide-1 increases myocardial glucose uptake and improves left ventricular performance in conscious dogs with pacing-induced dilated cardiomyopathy. Circulation. 2004;110(8):955-961.
122. Zhao T, Parikh P, Bhashyam S, Bolukoglu H, Poornima I, Shen YT, Shannon RP. Direct effects of glucagon-like peptide-1 on myocardial contractility and glucose uptake in normal and postischemic isolated rat hearts. J Pharmacol Exp Ther. 2006;317(3):1106-1113.
123. Ban K, Hui S, Drucker DJ, Husain M. Cardiovascular consequences of drugs used for the treatment of diabetes: potential promise of incretin-based therapies. J Am Soc Hypertens. 2009;3(4):245-259.
124. Noyan-Ashraf MH, Momen MA, Ban K, Sadi AM, Zhou YQ, Riazi AM, Baggio LL, Henkelman RM, Husain M, Drucker DJ. GLP-1R agonist liraglutide activates cytoprotective pathways and improves outcomes after experimental myocardial infarction in mice. Diabetes. 2009;58(4):975-983.
125. Ban K, Kim KH, Cho CK, Sauve M, Diamandis EP, Backx PH, Drucker DJ, Husain M. Glucagon-like peptide (GLP)-1(9-36)amide-mediated cytoprotection is blocked by exendin(9-39) yet does not require the known GLP-1 receptor. Endocrinology. 2010;151(4):1520-1531.
126. Cho YM, Kieffer TJ. New aspects of an old drug: metformin as a glucagon-like peptide 1 (GLP-1) enhancer and sensitiser. Diabetologia. 2011;54(2):219-222.
127. Habener JF, Stanojevic V, Brindamour LJ, Liu Z. GLP-1-Derived Nonapeptide GLP-1(28-36)amide Protects Pancreatic Beta Cells From Gluco-lipotoxicity. The Journal of endocrinology. 2012.
128. Tomas E, Wood JA, Stanojevic V, Habener JF. GLP-1-derived nonapeptide GLP-1(28-36)amide inhibits weight gain and attenuates diabetes and hepatic steatosis in diet-induced obese mice. Regul Pept. 2011;169(1-3):43-48.

201
129. Unger RH, Eisentraut AM. Entero-insular axis. Arch Intern Med. 1969;123(3):261-266.
130. Holst JJ. On the physiology of GIP and GLP-1. Hormone and metabolic research = Hormon- und Stoffwechselforschung = Hormones et metabolisme. 2004;36(11-12):747-754.
131. Vilsbøll T, Krarup T, Madsbad S, Holst JJ. Both GLP-1 and GIP are insulinotropic at basal and postprandial glucose levels and contribute nearly equally to the incretin effect of a meal in healthy subjects. Regul Pept. 2003;114(2-3):115-121.
132. Elliott RM, Morgan LM, Tredger JA, Deacon S, Wright J, Marks V. Glucagon-like peptide-1 (7-36)amide and glucose-dependent insulinotropic polypeptide secretion in response to nutrient ingestion in man: acute post-prandial and 24-h secretion patterns. The Journal of endocrinology. 1993;138(1):159-166.
133. Rask E, Olsson T, Soderberg S, Johnson O, Seckl J, Holst JJ, Ahren B. Impaired incretin response after a mixed meal is associated with insulin resistance in nondiabetic men. Diabetes Care. 2001;24(9):1640-1645.
134. Wideman RD, Kieffer TJ. Mining incretin hormone pathways for novel therapies. Trends Endocrinol Metab. 2009;20(6):280-286.
135. White JR, Campbell RK. Medications for the treatment of diabetes. American Diabetes Association; 2008.
136. Bell GI, Sanchez-Pescador R, Laybourn PJ, Najarian RC. Exon duplication and divergence in the human preproglucagon gene. Nature. 1983;304(5924):368-371.
137. Heinrich G, Gros P, Lund PK, Bentley RC, Habener JF. Pre-proglucagon messenger ribonucleic acid: nucleotide and encoded amino acid sequences of the rat pancreatic complementary deoxyribonucleic acid. Endocrinology. 1984;115(6):2176-2181.
138. Lund PK, Goodman RH, Dee PC, Habener JF. Pancreatic preproglucagon cDNA contains two glucagon-related coding sequences arranged in tandem. Proc Natl Acad Sci U S A. 1982;79(2):345-349.
139. Dalvi PS, Erbiceanu FD, Irwin DM, Belsham DD. Direct regulation of the proglucagon gene by insulin, leptin, and cAMP in embryonic versus adult hypothalamic neurons. Mol Endocrinol. 2012;26(8):1339-1355.
140. Karlsson O, Thor S, Norberg T, Ohlsson H, Edlund T. Insulin gene enhancer binding protein Isl-1 is a member of a novel class of proteins containing both a homeo- and a Cys-His domain. Nature. 1990;344(6269):879-882.
141. Vallejo M, Penchuk L, Habener JF. Somatostatin gene upstream enhancer element activated by a protein complex consisting of CREB, Isl-1-like, and alpha-CBF-like transcription factors. The Journal of biological chemistry. 1992;267(18):12876-12884.

202
142. Wang M, Drucker DJ. The LIM domain homeobox gene isl-1 is a positive regulator of islet cell-specific proglucagon gene transcription. The Journal of biological chemistry. 1995;270(21):12646-12652.
143. Peng SY, Wang WP, Meng J, Li T, Zhang H, Li YM, Chen P, Ma KT, Zhou CY. ISL1 physically interacts with BETA2 to promote insulin gene transcriptional synergy in non-beta cells. Biochim Biophys Acta. 2005;1731(3):154-159.
144. Pfaff SL, Mendelsohn M, Stewart CL, Edlund T, Jessell TM. Requirement for LIM homeobox gene Isl1 in motor neuron generation reveals a motor neuron-dependent step in interneuron differentiation. Cell. 1996;84(2):309-320.
145. Ritz-Laser B, Estreicher A, Gauthier B, Philippe J. The paired homeodomain transcription factor Pax-2 is expressed in the endocrine pancreas and transactivates the glucagon gene promoter. The Journal of biological chemistry. 2000;275(42):32708-32715.
146. Flock G, Drucker DJ. Pax-2 activates the proglucagon gene promoter but is not essential for proglucagon gene expression or development of proglucagon-producing cell lineages in the murine pancreas or intestine. Mol Endocrinol. 2002;16(10):2349-2359.
147. Habener JF, Kemp DM, Thomas MK. Minireview: transcriptional regulation in pancreatic development. Endocrinology. 2005;146(3):1025-1034.
148. Trinh DK, Zhang K, Hossain M, Brubaker PL, Drucker DJ. Pax-6 activates endogenous proglucagon gene expression in the rodent gastrointestinal epithelium. Diabetes. 2003;52(2):425-433.
149. Ritz-Laser B, Estreicher A, Klages N, Saule S, Philippe J. Pax-6 and Cdx-2/3 interact to activate glucagon gene expression on the G1 control element. The Journal of biological chemistry. 1999;274(7):4124-4132.
150. Sander M, Neubüser A, Kalamaras J, Ee HC, Martin GR, German MS. Genetic analysis reveals that PAX6 is required for normal transcription of pancreatic hormone genes and islet development. Genes Dev. 1997;11(13):1662-1673.
151. Jin T, Drucker DJ. Activation of proglucagon gene transcription through a novel promoter element by the caudal-related homeodomain protein cdx-2/3. Mol Cell Biol. 1996;16(1):19-28.
152. Jin T, Trinh DK, Wang F, Drucker DJ. The caudal homeobox protein cdx-2/3 activates endogenous proglucagon gene expression in InR1-G9 islet cells. Mol Endocrinol. 1997;11(2):203-209.
153. Laser B, Meda P, Constant I, Philippe J. The caudal-related homeodomain protein Cdx-2/3 regulates glucagon gene expression in islet cells. The Journal of biological chemistry. 1996;271(46):28984-28994.

203
154. Chawengsaksophak K, James R, Hammond VE, Köntgen F, Beck F. Homeosis and intestinal tumours in Cdx2 mutant mice. Nature. 1997;386(6620):84-87.
155. Xu F, Li H, Jin T. Cell type-specific autoregulation of the Caudal-related homeobox gene Cdx-2/3. The Journal of biological chemistry. 1999;274(48):34310-34316.
156. Hussain MA, Lee J, Miller CP, Habener JF. POU domain transcription factor brain 4 confers pancreatic alpha-cell-specific expression of the proglucagon gene through interaction with a novel proximal promoter G1 element. Mol Cell Biol. 1997;17(12):7186-7194.
157. Wang H, Maechler P, Ritz-Laser B, Hagenfeldt KA, Ishihara H, Philippe J, Wollheim CB. Pdx1 level defines pancreatic gene expression pattern and cell lineage differentiation. The Journal of biological chemistry. 2001;276(27):25279-25286.
158. Heller RS, Stoffers DA, Liu A, Schedl A, Crenshaw EB, Madsen OD, Serup P. The role of Brn4/Pou3f4 and Pax6 in forming the pancreatic glucagon cell identity. Dev Biol. 2004;268(1):123-134.
159. Wang P, Liu T, Li Z, Ma X, Jin T. Redundant and synergistic effect of Cdx-2 and Brn-4 on regulating proglucagon gene expression. Endocrinology. 2006;147(4):1950-1958.
160. Liu T, Branch DR, Jin T. Pbx1 is a co-factor for Cdx-2 in regulating proglucagon gene expression in pancreatic A cells. Mol Cell Endocrinol. 2006;249(1-2):140-149.
161. Kim SK, Selleri L, Lee JS, Zhang AY, Gu X, Jacobs Y, Cleary ML. Pbx1 inactivation disrupts pancreas development and in Ipf1-deficient mice promotes diabetes mellitus. Nat Genet. 2002;30(4):430-435.
162. Wilson ME, Scheel D, German MS. Gene expression cascades in pancreatic development. Mech Dev. 2003;120(1):65-80.
163. Sussel L, Kalamaras J, Hartigan-O'Connor DJ, Meneses JJ, Pedersen RA, Rubenstein JL, German MS. Mice lacking the homeodomain transcription factor Nkx2.2 have diabetes due to arrested differentiation of pancreatic beta cells. Development. 1998;125(12):2213-2221.
164. Doyle MJ, Loomis ZL, Sussel L. Nkx2.2-repressor activity is sufficient to specify alpha-cells and a small number of beta-cells in the pancreatic islet. Development. 2007;134(3):515-523.
165. Muhr J, Andersson E, Persson M, Jessell TM, Ericson J. Groucho-mediated transcriptional repression establishes progenitor cell pattern and neuronal fate in the ventral neural tube. Cell. 2001;104(6):861-873.
166. Sorenson RL, Brelje TC. Adaptation of islets of Langerhans to pregnancy: beta-cell growth, enhanced insulin secretion and the role of lactogenic hormones. Hormone and metabolic research = Hormon- und Stoffwechselforschung = Hormones et metabolisme. 1997;29(6):301-307.

204
167. Schisler JC, Jensen PB, Taylor DG, Becker TC, Knop FK, Takekawa S, German M, Weir GC, Lu D, Mirmira RG, Newgard CB. The Nkx6.1 homeodomain transcription factor suppresses glucagon expression and regulates glucose-stimulated insulin secretion in islet beta cells. Proc Natl Acad Sci U S A. 2005;102(20):7297-7302.
168. Schisler JC, Fueger PT, Babu DA, Hohmeier HE, Tessem JS, Lu D, Becker TC, Naziruddin B, Levy M, Mirmira RG, Newgard CB. Stimulation of human and rat islet beta-cell proliferation with retention of function by the homeodomain transcription factor Nkx6.1. Mol Cell Biol. 2008;28(10):3465-3476.
169. Nelson SB, Schaffer AE, Sander M. The transcription factors Nkx6.1 and Nkx6.2 possess equivalent activities in promoting beta-cell fate specification in Pdx1+ pancreatic progenitor cells. Development. 2007;134(13):2491-2500.
170. Schaffer AE, Yang AJ, Thorel F, Herrera PL, Sander M. Transgenic overexpression of the transcription factor Nkx6.1 in β-cells of mice does not increase β-cell proliferation, β-cell mass, or improve glucose clearance. Mol Endocrinol. 2011;25(11):1904-1914.
171. Sander M, Sussel L, Conners J, Scheel D, Kalamaras J, Dela Cruz F, Schwitzgebel V, Hayes-Jordan A, German M. Homeobox gene Nkx6.1 lies downstream of Nkx2.2 in the major pathway of beta-cell formation in the pancreas. Development. 2000;127(24):5533-5540.
172. Drucker DJ, Brubaker PL. Proglucagon gene expression is regulated by a cyclic AMP-dependent pathway in rat intestine. Proc Natl Acad Sci U S A. 1989;86(11):3953-3957.
173. Drucker DJ, Jin T, Asa SL, Young TA, Brubaker PL. Activation of proglucagon gene transcription by protein kinase-A in a novel mouse enteroendocrine cell line. Mol Endocrinol. 1994;8(12):1646-1655.
174. Philippe J, Drucker DJ, Habener JF. Glucagon gene transcription in an islet cell line is regulated via a protein kinase C-activated pathway. The Journal of biological chemistry. 1987;262(4):1823-1828.
175. Knepel W, Chafitz J, Habener JF. Transcriptional activation of the rat glucagon gene by the cyclic AMP-responsive element in pancreatic islet cells. Mol Cell Biol. 1990;10(12):6799-6804.
176. Drucker DJ, Campos R, Reynolds R, Stobie K, Brubaker PL. The rat glucagon gene is regulated by a protein kinase A-dependent pathway in pancreatic islet cells. Endocrinology. 1991;128(1):394-400.
177. Schwaninger M, Lux G, Blume R, Oetjen E, Hidaka H, Knepel W. Membrane depolarization and calcium influx induce glucagon gene transcription in pancreatic islet cells through the cyclic AMP-responsive element. The Journal of biological chemistry. 1993;268(7):5168-5177.
178. Diedrich T, Knepel W. Interaction of the transcription factor CREB with pancreatic islet cell-specific enhancer elements. Biol Chem Hoppe Seyler. 1995;376(1):39-44.

205
179. Wang J, Cao Y, Steiner DF. Regulation of proglucagon transcription by activated transcription factor (ATF) 3 and a novel isoform, ATF3b, through the cAMP-response element/ATF site of the proglucagon gene promoter. The Journal of biological chemistry. 2003;278(35):32899-32904.
180. Brubaker PL. Control of glucagon-like immunoreactive peptide secretion from fetal rat intestinal cultures. Endocrinology. 1988;123(1):220-226.
181. Brubaker PL, Schloos J, Drucker DJ. Regulation of glucagon-like peptide-1 synthesis and secretion in the GLUTag enteroendocrine cell line. Endocrinology. 1998;139(10):4108-4114.
182. Gajic D, Drucker DJ. Multiple cis-acting domains mediate basal and adenosine 3',5'-monophosphate-dependent glucagon gene transcription in a mouse neuroendocrine cell line. Endocrinology. 1993;132(3):1055-1062.
183. Furstenau U, Schwaninger M, Blume R, Jendrusch EM, Knepel W. Characterization of a novel calcium response element in the glucagon gene. The Journal of biological chemistry. 1999;274(9):5851-5860.
184. Gevrey JC, Malapel M, Philippe J, Mithieux G, Chayvialle JA, Abello J, Cordier-Bussat M. Protein hydrolysates stimulate proglucagon gene transcription in intestinal endocrine cells via two elements related to cyclic AMP response element. Diabetologia. 2004;47(5):926-936.
185. Chen L, Wang P, Andrade CF, Zhao IY, Dubé PE, Brubaker PL, Liu M, Jin T. PKA independent and cell type specific activation of the expression of caudal homeobox gene Cdx-2 by cyclic AMP. FEBS J. 2005;272(11):2746-2759.
186. Kawasaki H, Springett GM, Mochizuki N, Toki S, Nakaya M, Matsuda M, Housman DE, Graybiel AM. A family of cAMP-binding proteins that directly activate Rap1. Science. 1998;282(5397):2275-2279.
187. de Rooij J, Zwartkruis FJ, Verheijen MH, Cool RH, Nijman SM, Wittinghofer A, Bos JL. Epac is a Rap1 guanine-nucleotide-exchange factor directly activated by cyclic AMP. Nature. 1998;396(6710):474-477.
188. Richards JS. New signaling pathways for hormones and cyclic adenosine 3',5'-monophosphate action in endocrine cells. Mol Endocrinol. 2001;15(2):209-218.
189. Holz GG, Holz G. New insights concerning the glucose-dependent insulin secretagogue action of glucagon-like peptide-1 in pancreatic beta-cells. Hormone and metabolic research = Hormon- und Stoffwechselforschung = Hormones et metabolisme. 2004;36(11-12):787-794.
190. Lotfi S, Li Z, Sun J, Zuo Y, Lam PP, Kang Y, Rahimi M, Islam D, Wang P, Gaisano HY, Jin T. Role of the exchange protein directly activated by cyclic adenosine 5'-monophosphate (Epac) pathway in regulating proglucagon gene expression in intestinal endocrine L cells. Endocrinology. 2006;147(8):3727-3736.

206
191. Prestwich TC, Macdougald OA. Wnt/beta-catenin signaling in adipogenesis and metabolism. Curr Opin Cell Biol. 2007;19(6):612-617.
192. Jin T. Mechanisms underlying proglucagon gene expression. The Journal of endocrinology. 2008;198(1):17-28.
193. Welters HJ, Kulkarni RN. Wnt signaling: relevance to beta-cell biology and diabetes. Trends Endocrinol Metab. 2008;19(10):349-355.
194. Jin T, Liu L. The Wnt signaling pathway effector TCF7L2 and type 2 diabetes mellitus. Mol Endocrinol. 2008;22(11):2383-2392.
195. Jin T. The WNT signalling pathway and diabetes mellitus. Diabetologia. 2008;51(10):1771-1780.
196. Schinner S, Willenberg HS, Schott M, Scherbaum WA. Pathophysiological aspects of Wnt-signaling in endocrine disease. European journal of endocrinology / European Federation of Endocrine Societies. 2009;160(5):731-737.
197. Schinner S. Wnt-signalling and the metabolic syndrome. Hormone and metabolic research = Hormon- und Stoffwechselforschung = Hormones et metabolisme. 2009;41(2):159-163.
198. Liu Z, Habener JF. Wnt signaling in pancreatic islets. Adv Exp Med Biol. 2010;654:391-419.
199. Xiong X, Shao W, Jin T. New insight into the mechanisms underlying the function of the incretin hormone glucagon-like peptide-1 in pancreatic β-cells: the involvement of the Wnt signaling pathway effector β-catenin. Islets. 2012;4(6):359-365.
200. Chiang YT, Ip W, Jin T. The role of the Wnt signaling pathway in incretin hormone production and function. Frontiers in physiology. 2012;3:273.
201. Thorens B. Expression cloning of the pancreatic beta cell receptor for the gluco-incretin hormone glucagon-like peptide 1. Proc Natl Acad Sci U S A. 1992;89(18):8641-8645.
202. MacDonald PE, Salapatek AM, Wheeler MB. Glucagon-like peptide-1 receptor activation antagonizes voltage-dependent repolarizing K(+) currents in beta-cells: a possible glucose-dependent insulinotropic mechanism. Diabetes. 2002;51 Suppl 3:S443-447.
203. Light PE, Manning Fox JE, Riedel MJ, Wheeler MB. Glucagon-like peptide-1 inhibits pancreatic ATP-sensitive potassium channels via a protein kinase A- and ADP-dependent mechanism. Mol Endocrinol. 2002;16(9):2135-2144.
204. Kwan EP, Gao X, Leung YM, Gaisano HY. Activation of exchange protein directly activated by cyclic adenosine monophosphate and protein kinase A regulate common and distinct steps in promoting plasma membrane exocytic and granule-to-granule fusions in rat islet beta cells. Pancreas. 2007;35(3):e45-54.

207
205. Fehmann HC, Habener JF. Insulinotropic hormone glucagon-like peptide-I(7-37) stimulation of proinsulin gene expression and proinsulin biosynthesis in insulinoma beta TC-1 cells. Endocrinology. 1992;130(1):159-166.
206. Komatsu R, Matsuyama T, Namba M, Watanabe N, Itoh H, Kono N, Tarui S. Glucagonostatic and insulinotropic action of glucagonlike peptide I-(7-36)-amide. Diabetes. 1989;38(7):902-905.
207. D'Alessio DA, Fujimoto WY, Ensinck JW. Effects of glucagonlike peptide I-(7-36) on release of insulin, glucagon, and somatostatin by rat pancreatic islet cell monolayer cultures. Diabetes. 1989;38(12):1534-1538.
208. Xu G, Stoffers DA, Habener JF, Bonner-Weir S. Exendin-4 stimulates both beta-cell replication and neogenesis, resulting in increased beta-cell mass and improved glucose tolerance in diabetic rats. Diabetes. 1999;48(12):2270-2276.
209. Tourrel C, Bailbe D, Meile MJ, Kergoat M, Portha B. Glucagon-like peptide-1 and exendin-4 stimulate beta-cell neogenesis in streptozotocin-treated newborn rats resulting in persistently improved glucose homeostasis at adult age. Diabetes. 2001;50(7):1562-1570.
210. Li Y, Hansotia T, Yusta B, Ris F, Halban PA, Drucker DJ. Glucagon-like peptide-1 receptor signaling modulates beta cell apoptosis. The Journal of biological chemistry. 2003;278(1):471-478.
211. Buteau J, El-Assaad W, Rhodes CJ, Rosenberg L, Joly E, Prentki M. Glucagon-like peptide-1 prevents beta cell glucolipotoxicity. Diabetologia. 2004;47(5):806-815.
212. Shao W, Yu Z, Fantus IG, Jin T. Cyclic AMP signaling stimulates proteasome degradation of thioredoxin interacting protein (TxNIP) in pancreatic beta-cells. Cell Signal. 2010;22(8):1240-1246.
213. Chen J, Couto FM, Minn AH, Shalev A. Exenatide inhibits beta-cell apoptosis by decreasing thioredoxin-interacting protein. Biochem Biophys Res Commun. 2006;346(3):1067-1074.
214. Yu Z, Jin T. New insights into the role of cAMP in the production and function of the incretin hormone glucagon-like peptide-1 (GLP-1). Cell Signal. 2010;22(1):1-8.
215. Bullock BP, Heller RS, Habener JF. Tissue distribution of messenger ribonucleic acid encoding the rat glucagon-like peptide-1 receptor. Endocrinology. 1996;137(7):2968-2978.
216. Pedersen J, Holst JJ. Glucagon like-peptide 1 receptor and the liver. Liver Int. 2011;31(9):1243-1245.
217. Ding X, Saxena NK, Lin S, Gupta NA, Anania FA. Exendin-4, a glucagon-like protein-1 (GLP-1) receptor agonist, reverses hepatic steatosis in ob/ob mice. Hepatology. 2006;43(1):173-181.

208
218. Gupta NA, Mells J, Dunham RM, Grakoui A, Handy J, Saxena NK, Anania FA. Glucagon-like peptide-1 receptor is present on human hepatocytes and has a direct role in decreasing hepatic steatosis in vitro by modulating elements of the insulin signaling pathway. Hepatology. 2010;51(5):1584-1592.
219. Meier JJ, Gallwitz B, Salmen S, Goetze O, Holst JJ, Schmidt WE, Nauck MA. Normalization of glucose concentrations and deceleration of gastric emptying after solid meals during intravenous glucagon-like peptide 1 in patients with type 2 diabetes. The Journal of clinical endocrinology and metabolism. 2003;88(6):2719-2725.
220. Wettergren A, Schjoldager B, Mortensen PE, Myhre J, Christiansen J, Holst JJ. Truncated GLP-1 (proglucagon 78-107-amide) inhibits gastric and pancreatic functions in man. Digestive diseases and sciences. 1993;38(4):665-673.
221. Holst JJ. Glucagon-like Peptide 1 (GLP-1): An Intestinal Hormone, Signalling Nutritional Abundance, with an Unusual Therapeutic Potential. Trends Endocrinol Metab. 1999;10(6):229-235.
222. Zander M, Madsbad S, Madsen JL, Holst JJ. Effect of 6-week course of glucagon-like peptide 1 on glycaemic control, insulin sensitivity, and beta-cell function in type 2 diabetes: a parallel-group study. Lancet. 2002;359(9309):824-830.
223. Hayes MR, Skibicka KP, Grill HJ. Caudal brainstem processing is sufficient for behavioral, sympathetic, and parasympathetic responses driven by peripheral and hindbrain glucagon-like-peptide-1 receptor stimulation. Endocrinology. 2008;149(8):4059-4068.
224. Hayes MR, Bradley L, Grill HJ. Endogenous hindbrain glucagon-like peptide-1 receptor activation contributes to the control of food intake by mediating gastric satiation signaling. Endocrinology. 2009;150(6):2654-2659.
225. Knauf C, Cani PD, Perrin C, Iglesias MA, Maury JF, Bernard E, Benhamed F, Gremeaux T, Drucker DJ, Kahn CR, Girard J, Tanti JF, Delzenne NM, Postic C, Burcelin R. Brain glucagon-like peptide-1 increases insulin secretion and muscle insulin resistance to favor hepatic glycogen storage. The Journal of clinical investigation. 2005;115(12):3554-3563.
226. Knauf C, Cani PD, Ait-Belgnaoui A, Benani A, Dray C, Cabou C, Colom A, Uldry M, Rastrelli S, Sabatier E, Godet N, Waget A, Penicaud L, Valet P, Burcelin R. Brain glucagon-like peptide 1 signaling controls the onset of high-fat diet-induced insulin resistance and reduces energy expenditure. Endocrinology. 2008;149(10):4768-4777.
227. Turton MD, O'Shea D, Gunn I, Beak SA, Edwards CM, Meeran K, Choi SJ, Taylor GM, Heath MM, Lambert PD, Wilding JP, Smith DM, Ghatei MA, Herbert J, Bloom SR. A role for glucagon-like peptide-1 in the central regulation of feeding. Nature. 1996;379(6560):69-72.
228. Heo KS, Fujiwara K, Abe J. Glucagon-like peptide-1 and its cardiovascular effects. Curr Atheroscler Rep. 2012;14(5):422-428.

209
229. Koska J. Incretins and preservation of endothelial function. Cardiovasc Hematol Agents Med Chem. 2012;10(4):295-308.
230. Scheen AJ. Cardiovascular effects of gliptins. Nat Rev Cardiol. 2013;10(2):73-84.
231. Simsek S, de Galan BE. Cardiovascular protective properties of incretin-based therapies in type 2 diabetes. Curr Opin Lipidol. 2012;23(6):540-547.
232. Sokos GG, Nikolaidis LA, Mankad S, Elahi D, Shannon RP. Glucagon-like peptide-1 infusion improves left ventricular ejection fraction and functional status in patients with chronic heart failure. J Card Fail. 2006;12(9):694-699.
233. Arnés L, González N, Tornero-Esteban P, Sancho V, Acitores A, Valverde I, Delgado E, Villanueva-Peñacarrillo ML. Characteristics of GLP-1 and exendins action upon glucose transport and metabolism in type 2 diabetic rat skeletal muscle. Int J Mol Med. 2008;22(1):127-132.
234. Delgado E, Luque MA, Alcántara A, Trapote MA, Clemente F, Galera C, Valverde I, Villanueva-Peñacarrillo ML. Glucagon-like peptide-1 binding to rat skeletal muscle. Peptides. 1995;16(2):225-229.
235. Kim Chung lT, Hosaka T, Yoshida M, Harada N, Sakaue H, Sakai T, Nakaya Y. Exendin-4, a GLP-1 receptor agonist, directly induces adiponectin expression through protein kinase A pathway and prevents inflammatory adipokine expression. Biochem Biophys Res Commun. 2009;390(3):613-618.
236. Sancho V, Trigo MV, González N, Valverde I, Malaisse WJ, Villanueva-Peñacarrillo ML. Effects of glucagon-like peptide-1 and exendins on kinase activity, glucose transport and lipid metabolism in adipocytes from normal and type-2 diabetic rats. J Mol Endocrinol. 2005;35(1):27-38.
237. Hsieh J, Adeli K. Regulation of intestinal chylomicron production by glucagon-like peptides. Cardiovasc Hematol Disord Drug Targets. 2012;12(2):92-97.
238. Klonoff DC, Buse JB, Nielsen LL, Guan X, Bowlus CL, Holcombe JH, Wintle ME, Maggs DG. Exenatide effects on diabetes, obesity, cardiovascular risk factors and hepatic biomarkers in patients with type 2 diabetes treated for at least 3 years. Curr Med Res Opin. 2008;24(1):275-286.
239. D'Alessio D, Vahl T, Prigeon R. Effects of glucagon-like peptide 1 on the hepatic glucose metabolism. Hormone and metabolic research = Hormon- und Stoffwechselforschung = Hormones et metabolisme. 2004;36(11-12):837-841.
240. Orskov C. Glucagon-like peptide-1, a new hormone of the entero-insular axis. Diabetologia. 1992;35(8):701-711.
241. Drucker DJ. Biological actions and therapeutic potential of the glucagon-like peptides. Gastroenterology. 2002;122(2):531-544.

210
242. Lam NT, Kieffer TJ. The multifaceted potential of glucagon-like peptide-1 as a therapeutic agent. Minerva Endocrinol. 2002;27(2):79-93.
243. Brubaker PL, Drucker DJ. Minireview: Glucagon-like peptides regulate cell proliferation and apoptosis in the pancreas, gut, and central nervous system. Endocrinology. 2004;145(6):2653-2659.
244. Drucker DJ. The biology of incretin hormones. Cell Metab. 2006;3(3):153-165.
245. Holst JJ. The physiology of glucagon-like peptide 1. Physiol Rev. 2007;87(4):1409-1439.
246. Baggio LL, Drucker DJ. Biology of incretins: GLP-1 and GIP. Gastroenterology. 2007;132(6):2131-2157.
247. Holst JJ, Deacon CF, Vilsbøll T, Krarup T, Madsbad S. Glucagon-like peptide-1, glucose homeostasis and diabetes. Trends Mol Med. 2008;14(4):161-168.
248. Williams DL. Minireview: finding the sweet spot: peripheral versus central glucagon-like peptide 1 action in feeding and glucose homeostasis. Endocrinology. 2009;150(7):2997-3001.
249. Brubaker PL. Minireview: update on incretin biology: focus on glucagon-like peptide-1. Endocrinology. 2010;151(5):1984-1989.
250. Treiman M, Elvekjaer M, Engstrøm T, Jensen JS. Glucagon-like peptide 1--a cardiologic dimension. Trends Cardiovasc Med. 2010;20(1):8-12.
251. Trapp S, Hisadome K. Glucagon-like peptide 1 and the brain: central actions-central sources? Auton Neurosci. 2011;161(1-2):14-19.
252. Ussher JR, Drucker DJ. Cardiovascular biology of the incretin system. Endocrine reviews. 2012;33(2):187-215.
253. Salcedo I, Tweedie D, Li Y, Greig NH. Neuroprotective and neurotrophic actions of glucagon-like peptide-1: an emerging opportunity to treat neurodegenerative and cerebrovascular disorders. Br J Pharmacol. 2012;166(5):1586-1599.
254. Dailey MJ, Moran TH. Glucagon-like peptide 1 and appetite. Trends Endocrinol Metab. 2013;24(2):85-91.
255. Taurin S, Sandbo N, Qin Y, Browning D, Dulin NO. Phosphorylation of beta-catenin by cyclic AMP-dependent protein kinase. The Journal of biological chemistry. 2006;281(15):9971-9976.
256. Hino S, Tanji C, Nakayama KI, Kikuchi A. Phosphorylation of beta-catenin by cyclic AMP-dependent protein kinase stabilizes beta-catenin through inhibition of its ubiquitination. Mol Cell Biol. 2005;25(20):9063-9072.

211
257. Fang D, Hawke D, Zheng Y, Xia Y, Meisenhelder J, Nika H, Mills GB, Kobayashi R, Hunter T, Lu Z. Phosphorylation of beta-catenin by AKT promotes beta-catenin transcriptional activity. The Journal of biological chemistry. 2007;282(15):11221-11229.
258. He XC, Yin T, Grindley JC, Tian Q, Sato T, Tao WA, Dirisina R, Porter-Westpfahl KS, Hembree M, Johnson T, Wiedemann LM, Barrett TA, Hood L, Wu H, Li L. PTEN-deficient intestinal stem cells initiate intestinal polyposis. Nat Genet. 2007;39(2):189-198.
259. Jin T. Why diabetes patients are more prone to the development of colon cancer? Med Hypotheses. 2008;71(2):241-244.
260. Playford MP, Bicknell D, Bodmer WF, Macaulay VM. Insulin-like growth factor 1 regulates the location, stability, and transcriptional activity of beta-catenin. Proc Natl Acad Sci U S A. 2000;97(22):12103-12108.
261. Desbois-Mouthon C, Cadoret A, Blivet-Van Eggelpoël MJ, Bertrand F, Cherqui G, Perret C, Capeau J. Insulin and IGF-1 stimulate the beta-catenin pathway through two signalling cascades involving GSK-3beta inhibition and Ras activation. Oncogene. 2001;20(2):252-259.
262. Castrop J, van Norren K, Clevers H. A gene family of HMG-box transcription factors with homology to TCF-1. Nucleic acids research. 1992;20(3):611.
263. Duval A, Busson-Leconiat M, Berger R, Hamelin R. Assignment of the TCF-4 gene (TCF7L2) to human chromosome band 10q25.3. Cytogenet Cell Genet. 2000;88(3-4):264-265.
264. Reynisdottir I, Thorleifsson G, Benediktsson R, Sigurdsson G, Emilsson V, Einarsdottir AS, Hjorleifsdottir EE, Orlygsdottir GT, Bjornsdottir GT, Saemundsdottir J, Halldorsson S, Hrafnkelsdottir S, Sigurjonsdottir SB, Steinsdottir S, Martin M, Kochan JP, Rhees BK, Grant SF, Frigge ML, Kong A, Gudnason V, Stefansson K, Gulcher JR. Localization of a susceptibility gene for type 2 diabetes to chromosome 5q34-q35.2. Am J Hum Genet. 2003;73(2):323-335.
265. Duggirala R, Blangero J, Almasy L, Dyer TD, Williams KL, Leach RJ, O'Connell P, Stern MP. Linkage of type 2 diabetes mellitus and of age at onset to a genetic location on chromosome 10q in Mexican Americans. Am J Hum Genet. 1999;64(4):1127-1140.
266. Grant SF, Thorleifsson G, Reynisdottir I, Benediktsson R, Manolescu A, Sainz J, Helgason A, Stefansson H, Emilsson V, Helgadottir A, Styrkarsdottir U, Magnusson KP, Walters GB, Palsdottir E, Jonsdottir T, Gudmundsdottir T, Gylfason A, Saemundsdottir J, Wilensky RL, Reilly MP, Rader DJ, Bagger Y, Christiansen C, Gudnason V, Sigurdsson G, Thorsteinsdottir U, Gulcher JR, Kong A, Stefansson K. Variant of transcription factor 7-like 2 (TCF7L2) gene confers risk of type 2 diabetes. Nat Genet. 2006;38(3):320-323.
267. Cauchi S, Meyre D, Choquet H, Dina C, Born C, Marre M, Balkau B, Froguel P. TCF7L2 variation predicts hyperglycemia incidence in a French general population: the

212
data from an epidemiological study on the Insulin Resistance Syndrome (DESIR) study. Diabetes. 2006;55(11):3189-3192.
268. Chang YC, Chang TJ, Jiang YD, Kuo SS, Lee KC, Chiu KC, Chuang LM. Association study of the genetic polymorphisms of the transcription factor 7-like 2 (TCF7L2) gene and type 2 diabetes in the Chinese population. Diabetes. 2007;56(10):2631-2637.
269. Alibegovic AC, Sonne MP, Hojbjerre L, Hansen T, Pedersen O, van Hall G, Holst JJ, Stallknecht B, Dela F, Vaag A. The T-allele of TCF7L2 rs7903146 associates with a reduced compensation of insulin secretion for insulin resistance induced by 9 days of bed rest. Diabetes. 2010;59(4):836-843.
270. Cornelis MC, Qi L, Kraft P, Hu FB. TCF7L2, dietary carbohydrate, and risk of type 2 diabetes in US women. Am J Clin Nutr. 2009;89(4):1256-1262.
271. da Silva Xavier G, Loder MK, McDonald A, Tarasov AI, Carzaniga R, Kronenberger K, Barg S, Rutter GA. TCF7L2 regulates late events in insulin secretion from pancreatic islet beta-cells. Diabetes. 2009;58(4):894-905.
272. Dabelea D, Dolan LM, D'Agostino R, Jr., Hernandez AM, McAteer JB, Hamman RF, Mayer-Davis EJ, Marcovina S, Lawrence JM, Pihoker C, Florez JC. Association testing of TCF7L2 polymorphisms with type 2 diabetes in multi-ethnic youth. Diabetologia. 2011;54(3):535-539.
273. Duan QL, Dube MP, Frasure-Smith N, Barhdadi A, Lesperance F, Theroux P, St-Onge J, Rouleau GA, McCaffery JM. Additive effects of obesity and TCF7L2 variants on risk for type 2 diabetes among cardiac patients. Diabetes Care. 2007;30(6):1621-1623.
274. Florez JC. The new type 2 diabetes gene TCF7L2. Curr Opin Clin Nutr Metab Care. 2007;10(4):391-396.
275. Florez JC. Newly identified loci highlight beta cell dysfunction as a key cause of type 2 diabetes: where are the insulin resistance genes? Diabetologia. 2008;51(7):1100-1110.
276. Florez JC, Jablonski KA, Bayley N, Pollin TI, de Bakker PI, Shuldiner AR, Knowler WC, Nathan DM, Altshuler D. TCF7L2 polymorphisms and progression to diabetes in the Diabetes Prevention Program. N Engl J Med. 2006;355(3):241-250.
277. Gjesing AP, Kjems LL, Vestmar MA, Grarup N, Linneberg A, Deacon CF, Holst JJ, Pedersen O, Hansen T. Carriers of the TCF7L2 rs7903146 TT genotype have elevated levels of plasma glucose, serum proinsulin and plasma gastric inhibitory polypeptide (GIP) during a meal test. Diabetologia. 2011;54(1):103-110.
278. Gloyn AL, Braun M, Rorsman P. Type 2 diabetes susceptibility gene TCF7L2 and its role in beta-cell function. Diabetes. 2009;58(4):800-802.
279. Gonzalez-Sanchez JL, Martinez-Larrad MT, Zabena C, Perez-Barba M, Serrano-Rios M. Association of variants of the TCF7L2 gene with increases in the risk of type 2 diabetes

213
and the proinsulin:insulin ratio in the Spanish population. Diabetologia. 2008;51(11):1993-1997.
280. Groop L. Open chromatin and diabetes risk. Nat Genet. 2010;42(3):190-192.
281. Groves CJ, Zeggini E, Minton J, Frayling TM, Weedon MN, Rayner NW, Hitman GA, Walker M, Wiltshire S, Hattersley AT, McCarthy MI. Association analysis of 6,736 U.K. subjects provides replication and confirms TCF7L2 as a type 2 diabetes susceptibility gene with a substantial effect on individual risk. Diabetes. 2006;55(9):2640-2644.
282. Lyssenko V, Jonsson A, Almgren P, Pulizzi N, Isomaa B, Tuomi T, Berglund G, Altshuler D, Nilsson P, Groop L. Clinical risk factors, DNA variants, and the development of type 2 diabetes. N Engl J Med. 2008;359(21):2220-2232.
283. Lyssenko V, Lupi R, Marchetti P, Del Guerra S, Orho-Melander M, Almgren P, Sjogren M, Ling C, Eriksson KF, Lethagen AL, Mancarella R, Berglund G, Tuomi T, Nilsson P, Del Prato S, Groop L. Mechanisms by which common variants in the TCF7L2 gene increase risk of type 2 diabetes. The Journal of clinical investigation. 2007;117(8):2155-2163.
284. Ng MC, Park KS, Oh B, Tam CH, Cho YM, Shin HD, Lam VK, Ma RC, So WY, Cho YS, Kim HL, Lee HK, Chan JC, Cho NH. Implication of genetic variants near TCF7L2, SLC30A8, HHEX, CDKAL1, CDKN2A/B, IGF2BP2, and FTO in type 2 diabetes and obesity in 6,719 Asians. Diabetes. 2008;57(8):2226-2233.
285. Pilgaard K, Jensen CB, Schou JH, Lyssenko V, Wegner L, Brons C, Vilsboll T, Hansen T, Madsbad S, Holst JJ, Volund A, Poulsen P, Groop L, Pedersen O, Vaag AA. The T allele of rs7903146 TCF7L2 is associated with impaired insulinotropic action of incretin hormones, reduced 24 h profiles of plasma insulin and glucagon, and increased hepatic glucose production in young healthy men. Diabetologia. 2009;52(7):1298-1307.
286. Schafer SA, Tschritter O, Machicao F, Thamer C, Stefan N, Gallwitz B, Holst JJ, Dekker JM, t Hart LM, Nijpels G, van Haeften TW, Haring HU, Fritsche A. Impaired glucagon-like peptide-1-induced insulin secretion in carriers of transcription factor 7-like 2 (TCF7L2) gene polymorphisms. Diabetologia. 2007;50(12):2443-2450.
287. Shu L, Matveyenko AV, Kerr-Conte J, Cho JH, McIntosh CH, Maedler K. Decreased TCF7L2 protein levels in type 2 diabetes mellitus correlate with downregulation of GIP- and GLP-1 receptors and impaired beta-cell function. Hum Mol Genet. 2009;18(13):2388-2399.
288. Shu L, Sauter NS, Schulthess FT, Matveyenko AV, Oberholzer J, Maedler K. Transcription factor 7-like 2 regulates beta-cell survival and function in human pancreatic islets. Diabetes. 2008;57(3):645-653.
289. Grant SF. Understanding the elusive mechanism of action of TCF7L2 in metabolism. Diabetes. 2012;61(11):2657-2658.

214
290. Rulifson IC, Karnik SK, Heiser PW, ten Berge D, Chen H, Gu X, Taketo MM, Nusse R, Hebrok M, Kim SK. Wnt signaling regulates pancreatic beta cell proliferation. Proc Natl Acad Sci U S A. 2007;104(15):6247-6252.
291. Liu Z, Habener JF. Glucagon-like peptide-1 activation of TCF7L2-dependent Wnt signaling enhances pancreatic beta cell proliferation. The Journal of biological chemistry. 2008;283(13):8723-8735.
292. Fujino T, Asaba H, Kang MJ, Ikeda Y, Sone H, Takada S, Kim DH, Ioka RX, Ono M, Tomoyori H, Okubo M, Murase T, Kamataki A, Yamamoto J, Magoori K, Takahashi S, Miyamoto Y, Oishi H, Nose M, Okazaki M, Usui S, Imaizumi K, Yanagisawa M, Sakai J, Yamamoto TT. Low-density lipoprotein receptor-related protein 5 (LRP5) is essential for normal cholesterol metabolism and glucose-induced insulin secretion. Proc Natl Acad Sci U S A. 2003;100(1):229-234.
293. Schinner S, Ulgen F, Papewalis C, Schott M, Woelk A, Vidal-Puig A, Scherbaum WA. Regulation of insulin secretion, glucokinase gene transcription and beta cell proliferation by adipocyte-derived Wnt signalling molecules. Diabetologia. 2008;51(1):147-154.
294. Murtaugh LC, Law AC, Dor Y, Melton DA. Beta-catenin is essential for pancreatic acinar but not islet development. Development. 2005;132(21):4663-4674.
295. Ni Z, Anini Y, Fang X, Mills G, Brubaker PL, Jin T. Transcriptional activation of the proglucagon gene by lithium and beta-catenin in intestinal endocrine L cells. The Journal of biological chemistry. 2003;278(2):1380-1387.
296. Yi F, Brubaker PL, Jin T. TCF-4 mediates cell type-specific regulation of proglucagon gene expression by beta-catenin and glycogen synthase kinase-3beta. The Journal of biological chemistry. 2005;280(2):1457-1464.
297. Manser E, Leung T, Salihuddin H, Zhao ZS, Lim L. A brain serine/threonine protein kinase activated by Cdc42 and Rac1. Nature. 1994;367(6458):40-46.
298. Martin GA, Bollag G, McCormick F, Abo A. A novel serine kinase activated by rac1/CDC42Hs-dependent autophosphorylation is related to PAK65 and STE20. EMBO J. 1995;14(17):4385.
299. Knaus UG, Morris S, Dong HJ, Chernoff J, Bokoch GM. Regulation of human leukocyte p21-activated kinases through G protein--coupled receptors. Science. 1995;269(5221):221-223.
300. Bagrodia S, Taylor SJ, Creasy CL, Chernoff J, Cerione RA. Identification of a mouse p21Cdc42/Rac activated kinase. The Journal of biological chemistry. 1995;270(39):22731-22737.
301. Abo A, Qu J, Cammarano MS, Dan C, Fritsch A, Baud V, Belisle B, Minden A. PAK4, a novel effector for Cdc42Hs, is implicated in the reorganization of the actin cytoskeleton and in the formation of filopodia. EMBO J. 1998;17(22):6527-6540.

215
302. Callow MG, Clairvoyant F, Zhu S, Schryver B, Whyte DB, Bischoff JR, Jallal B, Smeal T. Requirement for PAK4 in the anchorage-independent growth of human cancer cell lines. The Journal of biological chemistry. 2002;277(1):550-558.
303. Yang F, Li X, Sharma M, Zarnegar M, Lim B, Sun Z. Androgen receptor specifically interacts with a novel p21-activated kinase, PAK6. The Journal of biological chemistry. 2001;276(18):15345-15353.
304. Jaffer ZM, Chernoff J. p21-activated kinases: three more join the Pak. Int J Biochem Cell Biol. 2002;34(7):713-717.
305. Pandey A, Dan I, Kristiansen TZ, Watanabe NM, Voldby J, Kajikawa E, Khosravi-Far R, Blagoev B, Mann M. Cloning and characterization of PAK5, a novel member of mammalian p21-activated kinase-II subfamily that is predominantly expressed in brain. Oncogene. 2002;21(24):3939-3948.
306. Galisteo ML, Chernoff J, Su YC, Skolnik EY, Schlessinger J. The adaptor protein Nck links receptor tyrosine kinases with the serine-threonine kinase Pak1. The Journal of biological chemistry. 1996;271(35):20997-21000.
307. Bokoch GM, Wang Y, Bohl BP, Sells MA, Quilliam LA, Knaus UG. Interaction of the Nck adapter protein with p21-activated kinase (PAK1). The Journal of biological chemistry. 1996;271(42):25746-25749.
308. Puto LA, Pestonjamasp K, King CC, Bokoch GM. p21-activated kinase 1 (PAK1) interacts with the Grb2 adapter protein to couple to growth factor signaling. The Journal of biological chemistry. 2003;278(11):9388-9393.
309. Manser E, Loo TH, Koh CG, Zhao ZS, Chen XQ, Tan L, Tan I, Leung T, Lim L. PAK kinases are directly coupled to the PIX family of nucleotide exchange factors. Mol Cell. 1998;1(2):183-192.
310. Leeuw T, Wu C, Schrag JD, Whiteway M, Thomas DY, Leberer E. Interaction of a G-protein beta-subunit with a conserved sequence in Ste20/PAK family protein kinases. Nature. 1998;391(6663):191-195.
311. Wang J, Frost JA, Cobb MH, Ross EM. Reciprocal signaling between heterotrimeric G proteins and the p21-stimulated protein kinase. The Journal of biological chemistry. 1999;274(44):31641-31647.
312. Lei M, Lu W, Meng W, Parrini MC, Eck MJ, Mayer BJ, Harrison SC. Structure of PAK1 in an autoinhibited conformation reveals a multistage activation switch. Cell. 2000;102(3):387-397.
313. Manser E, Huang HY, Loo TH, Chen XQ, Dong JM, Leung T, Lim L. Expression of constitutively active alpha-PAK reveals effects of the kinase on actin and focal complexes. Mol Cell Biol. 1997;17(3):1129-1143.

216
314. Gatti A, Huang Z, Tuazon PT, Traugh JA. Multisite autophosphorylation of p21-activated protein kinase gamma-PAK as a function of activation. The Journal of biological chemistry. 1999;274(12):8022-8028.
315. Zhao ZS, Manser E, Chen XQ, Chong C, Leung T, Lim L. A conserved negative regulatory region in alphaPAK: inhibition of PAK kinases reveals their morphological roles downstream of Cdc42 and Rac1. Mol Cell Biol. 1998;18(4):2153-2163.
316. Yu JS, Chen WJ, Ni MH, Chan WH, Yang SD. Identification of the regulatory autophosphorylation site of autophosphorylation-dependent protein kinase (auto-kinase). Evidence that auto-kinase belongs to a member of the p21-activated kinase family. Biochem J. 1998;334 ( Pt 1):121-131.
317. Benner GE, Dennis PB, Masaracchia RA. Activation of an S6/H4 kinase (PAK 65) from human placenta by intramolecular and intermolecular autophosphorylation. The Journal of biological chemistry. 1995;270(36):21121-21128.
318. Chong C, Tan L, Lim L, Manser E. The mechanism of PAK activation. Autophosphorylation events in both regulatory and kinase domains control activity. The Journal of biological chemistry. 2001;276(20):17347-17353.
319. Knaus UG, Wang Y, Reilly AM, Warnock D, Jackson JH. Structural requirements for PAK activation by Rac GTPases. The Journal of biological chemistry. 1998;273(34):21512-21518.
320. Mira JP, Benard V, Groffen J, Sanders LC, Knaus UG. Endogenous, hyperactive Rac3 controls proliferation of breast cancer cells by a p21-activated kinase-dependent pathway. Proc Natl Acad Sci U S A. 2000;97(1):185-189.
321. Benard V, Bohl BP, Bokoch GM. Characterization of rac and cdc42 activation in chemoattractant-stimulated human neutrophils using a novel assay for active GTPases. The Journal of biological chemistry. 1999;274(19):13198-13204.
322. Aronheim A, Broder YC, Cohen A, Fritsch A, Belisle B, Abo A. Chp, a homologue of the GTPase Cdc42Hs, activates the JNK pathway and is implicated in reorganizing the actin cytoskeleton. Curr Biol. 1998;8(20):1125-1128.
323. Neudauer CL, Joberty G, Tatsis N, Macara IG. Distinct cellular effects and interactions of the Rho-family GTPase TC10. Curr Biol. 1998;8(21):1151-1160.
324. Tao W, Pennica D, Xu L, Kalejta RF, Levine AJ. Wrch-1, a novel member of the Rho gene family that is regulated by Wnt-1. Genes Dev. 2001;15(14):1796-1807.
325. Tay HG, Ng YW, Manser E. A vertebrate-specific Chp-PAK-PIX pathway maintains E-cadherin at adherens junctions during zebrafish epiboly. PLoS One. 2010;5(4):e10125.
326. Stanley FM. Insulin-increased prolactin gene expression requires actin treadmilling: potential role for p21 activated kinase. Endocrinology. 2007;148(12):5874-5883.

217
327. Wang D, Paria BC, Zhang Q, Karpurapu M, Li Q, Gerthoffer WT, Nakaoka Y, Rao GN. A role for Gab1/SHP2 in thrombin activation of PAK1: gene transfer of kinase-dead PAK1 inhibits injury-induced restenosis. Circ Res. 2009;104(9):1066-1075.
328. Yang Y, Du J, Hu Z, Liu J, Tian Y, Zhu Y, Wang L, Gu L. Activation of Rac1-PI3K/Akt is required for epidermal growth factor-induced PAK1 activation and cell migration in MDA-MB-231 breast cancer cells. J Biomed Res. 2011;25(4):237-245.
329. Rhee S, Grinnell F. P21-activated kinase 1: convergence point in PDGF- and LPA-stimulated collagen matrix contraction by human fibroblasts. J Cell Biol. 2006;172(3):423-432.
330. Yuan L, Santi M, Rushing EJ, Cornelison R, MacDonald TJ. ERK activation of p21 activated kinase-1 (Pak1) is critical for medulloblastoma cell migration. Clin Exp Metastasis. 2010;27(7):481-491.
331. Mazumdar A, Kumar R. Estrogen regulation of Pak1 and FKHR pathways in breast cancer cells. FEBS Lett. 2003;535(1-3):6-10.
332. Qiao M, Shapiro P, Kumar R, Passaniti A. Insulin-like growth factor-1 regulates endogenous RUNX2 activity in endothelial cells through a phosphatidylinositol 3-kinase/ERK-dependent and Akt-independent signaling pathway. J Biol Chem. 2004;279(41):42709-42718.
333. Tsakiridis T, Taha C, Grinstein S, Klip A. Insulin activates a p21-activated kinase in muscle cells via phosphatidylinositol 3-kinase. The Journal of biological chemistry. 1996;271(33):19664-19667.
334. Sun J, Khalid S, Rozakis-Adcock M, Fantus IG, Jin T. P-21-activated protein kinase-1 functions as a linker between insulin and Wnt signaling pathways in the intestine. Oncogene. 2009;28(35):3132-3144.
335. Xia C, Ma W, Stafford LJ, Marcus S, Xiong WC, Liu M. Regulation of the p21-activated kinase (PAK) by a human Gbeta -like WD-repeat protein, hPIP1. Proc Natl Acad Sci U S A. 2001;98(11):6174-6179.
336. Kissil JL, Wilker EW, Johnson KC, Eckman MS, Yaffe MB, Jacks T. Merlin, the product of the Nf2 tumor suppressor gene, is an inhibitor of the p21-activated kinase, Pak1. Mol Cell. 2003;12(4):841-849.
337. Deguchi A, Miyoshi H, Kojima Y, Okawa K, Aoki M, Taketo MM. LKB1 suppresses p21-activated kinase-1 (PAK1) by phosphorylation of Thr109 in the p21-binding domain. The Journal of biological chemistry. 2010;285(24):18283-18290.
338. Talukder AH, Meng Q, Kumar R. CRIPak, a novel endogenous Pak1 inhibitor. Oncogene. 2006;25(9):1311-1319.
339. Alahari SK, Reddig PJ, Juliano RL. The integrin-binding protein Nischarin regulates cell migration by inhibiting PAK. EMBO J. 2004;23(14):2777-2788.

218
340. Koh CG, Tan EJ, Manser E, Lim L. The p21-activated kinase PAK is negatively regulated by POPX1 and POPX2, a pair of serine/threonine phosphatases of the PP2C family. Curr Biol. 2002;12(4):317-321.
341. Reddy SD, Ohshiro K, Rayala SK, Kumar R. MicroRNA-7, a homeobox D10 target, inhibits p21-activated kinase 1 and regulates its functions. Cancer Res. 2008;68(20):8195-8200.
342. Zou J, Li WQ, Li Q, Li XQ, Zhang JT, Liu GQ, Chen J, Qiu XX, Tian FJ, Wang ZZ, Zhu N, Qin YW, Shen B, Liu TX, Jing Q. Two functional microRNA-126s repress a novel target gene p21-activated kinase 1 to regulate vascular integrity in zebrafish. Circ Res. 2011;108(2):201-209.
343. Rennefahrt UE, Deacon SW, Parker SA, Devarajan K, Beeser A, Chernoff J, Knapp S, Turk BE, Peterson JR. Specificity profiling of Pak kinases allows identification of novel phosphorylation sites. The Journal of biological chemistry. 2007;282(21):15667-15678.
344. Eswaran J, Lee WH, Debreczeni JE, Filippakopoulos P, Turnbull A, Fedorov O, Deacon SW, Peterson JR, Knapp S. Crystal Structures of the p21-activated kinases PAK4, PAK5, and PAK6 reveal catalytic domain plasticity of active group II PAKs. Structure. 2007;15(2):201-213.
345. Eswaran J, Li DQ, Shah A, Kumar R. Molecular pathways: targeting p21-activated kinase 1 signaling in cancer--opportunities, challenges, and limitations. Clin Cancer Res. 2012;18(14):3743-3749.
346. Kumar R, Gururaj AE, Barnes CJ. p21-activated kinases in cancer. Nat Rev Cancer. 2006;6(6):459-471.
347. Ong CC, Jubb AM, Zhou W, Haverty PM, Harris AL, Belvin M, Friedman LS, Koeppen H, Hoeflich KP. p21-activated kinase 1: PAK'ed with potential. Oncotarget. 2011;2(6):491-496.
348. Balasenthil S, Vadlamudi RK. Functional interactions between the estrogen receptor coactivator PELP1/MNAR and retinoblastoma protein. The Journal of biological chemistry. 2003;278(24):22119-22127.
349. Aoki H, Yokoyama T, Fujiwara K, Tari AM, Sawaya R, Suki D, Hess KR, Aldape KD, Kondo S, Kumar R, Kondo Y. Phosphorylated Pak1 level in the cytoplasm correlates with shorter survival time in patients with glioblastoma. Clin Cancer Res. 2007;13(22 Pt 1):6603-6609.
350. Liu Y, Xiao H, Tian Y, Nekrasova T, Hao X, Lee HJ, Suh N, Yang CS, Minden A. The pak4 protein kinase plays a key role in cell survival and tumorigenesis in athymic mice. Mol Cancer Res. 2008;6(7):1215-1224.
351. Ching YP, Leong VY, Lee MF, Xu HT, Jin DY, Ng IO. P21-activated protein kinase is overexpressed in hepatocellular carcinoma and enhances cancer metastasis involving c-

219
Jun NH2-terminal kinase activation and paxillin phosphorylation. Cancer Res. 2007;67(8):3601-3608.
352. O'Sullivan GC, Tangney M, Casey G, Ambrose M, Houston A, Barry OP. Modulation of p21-activated kinase 1 alters the behavior of renal cell carcinoma. Int J Cancer. 2007;121(9):1930-1940.
353. Mahlamäki EH, Kauraniemi P, Monni O, Wolf M, Hautaniemi S, Kallioniemi A. High-resolution genomic and expression profiling reveals 105 putative amplification target genes in pancreatic cancer. Neoplasia. 2004;6(5):432-439.
354. Parsons DW, Wang TL, Samuels Y, Bardelli A, Cummins JM, DeLong L, Silliman N, Ptak J, Szabo S, Willson JK, Markowitz S, Kinzler KW, Vogelstein B, Lengauer C, Velculescu VE. Colorectal cancer: mutations in a signalling pathway. Nature. 2005;436(7052):792.
355. Carter JH, Douglass LE, Deddens JA, Colligan BM, Bhatt TR, Pemberton JO, Konicek S, Hom J, Marshall M, Graff JR. Pak-1 expression increases with progression of colorectal carcinomas to metastasis. Clin Cancer Res. 2004;10(10):3448-3456.
356. Ito M, Nishiyama H, Kawanishi H, Matsui S, Guilford P, Reeve A, Ogawa O. P21-activated kinase 1: a new molecular marker for intravesical recurrence after transurethral resection of bladder cancer. J Urol. 2007;178(3 Pt 1):1073-1079.
357. Brown LA, Kalloger SE, Miller MA, Shih IM, McKinney SE, Santos JL, Swenerton K, Spellman PT, Gray J, Gilks CB, Huntsman DG. Amplification of 11q13 in ovarian carcinoma. Genes Chromosomes Cancer. 2008;47(6):481-489.
358. Schraml P, Schwerdtfeger G, Burkhalter F, Raggi A, Schmidt D, Ruffalo T, King W, Wilber K, Mihatsch MJ, Moch H. Combined array comparative genomic hybridization and tissue microarray analysis suggest PAK1 at 11q13.5-q14 as a critical oncogene target in ovarian carcinoma. Am J Pathol. 2003;163(3):985-992.
359. Davidson B, Shih IM, Wang TL. Different clinical roles for p21-activated kinase-1 in primary and recurrent ovarian carcinoma. Hum Pathol. 2008;39(11):1630-1636.
360. Goc A, Al-Azayzih A, Abdalla M, Al-Husein B, Kavuri S, Lee J, Moses K, Somanath PR. P21 activated kinase-1 (Pak1) promotes prostate tumor growth and microinvasion via inhibition of transforming growth factor β expression and enhanced matrix metalloproteinase 9 secretion. The Journal of biological chemistry. 2013;288(5):3025-3035.
361. Mao X, Onadim Z, Price EA, Child F, Lillington DM, Russell-Jones R, Young BD, Whittaker S. Genomic alterations in blastic natural killer/extranodal natural killer-like T cell lymphoma with cutaneous involvement. J Invest Dermatol. 2003;121(3):618-627.
362. Dummler B, Ohshiro K, Kumar R, Field J. Pak protein kinases and their role in cancer. Cancer Metastasis Rev. 2009;28(1-2):51-63.

220
363. Nheu TV, He H, Hirokawa Y, Tamaki K, Florin L, Schmitz ML, Suzuki-Takahashi I, Jorissen RN, Burgess AW, Nishimura S, Wood J, Maruta H. The K252a derivatives, inhibitors for the PAK/MLK kinase family selectively block the growth of RAS transformants. Cancer J. 2002;8(4):328-336.
364. Maksimoska J, Feng L, Harms K, Yi C, Kissil J, Marmorstein R, Meggers E. Targeting large kinase active site with rigid, bulky octahedral ruthenium complexes. J Am Chem Soc. 2008;130(47):15764-15765.
365. Deacon SW, Beeser A, Fukui JA, Rennefahrt UE, Myers C, Chernoff J, Peterson JR. An isoform-selective, small-molecule inhibitor targets the autoregulatory mechanism of p21-activated kinase. Chemistry & biology. 2008;15(4):322-331.
366. Viaud J, Peterson JR. An allosteric kinase inhibitor binds the p21-activated kinase autoregulatory domain covalently. Mol Cancer Ther. 2009;8(9):2559-2565.
367. Li F, Adam L, Vadlamudi RK, Zhou H, Sen S, Chernoff J, Mandal M, Kumar R. p21-activated kinase 1 interacts with and phosphorylates histone H3 in breast cancer cells. EMBO Rep. 2002;3(8):767-773.
368. Zhao ZS, Lim JP, Ng YW, Lim L, Manser E. The GIT-associated kinase PAK targets to the centrosome and regulates Aurora-A. Mol Cell. 2005;20(2):237-249.
369. Maroto B, Ye MB, von Lohneysen K, Schnelzer A, Knaus UG. P21-activated kinase is required for mitotic progression and regulates Plk1. Oncogene. 2008;27(36):4900-4908.
370. Lee SR, Ramos SM, Ko A, Masiello D, Swanson KD, Lu ML, Balk SP. AR and ER interaction with a p21-activated kinase (PAK6). Mol Endocrinol. 2002;16(1):85-99.
371. Dadke D, Fryer BH, Golemis EA, Field J. Activation of p21-activated kinase 1-nuclear factor kappaB signaling by Kaposi's sarcoma-associated herpes virus G protein-coupled receptor during cellular transformation. Cancer Res. 2003;63(24):8837-8847.
372. Beeser A, Jaffer ZM, Hofmann C, Chernoff J. Role of group A p21-activated kinases in activation of extracellular-regulated kinase by growth factors. The Journal of biological chemistry. 2005;280(44):36609-36615.
373. Tang Y, Chen Z, Ambrose D, Liu J, Gibbs JB, Chernoff J, Field J. Kinase-deficient Pak1 mutants inhibit Ras transformation of Rat-1 fibroblasts. Mol Cell Biol. 1997;17(8):4454-4464.
374. Frost JA, Steen H, Shapiro P, Lewis T, Ahn N, Shaw PE, Cobb MH. Cross-cascade activation of ERKs and ternary complex factors by Rho family proteins. EMBO J. 1997;16(21):6426-6438.
375. Tran NH, Frost JA. Phosphorylation of Raf-1 by p21-activated kinase 1 and Src regulates Raf-1 autoinhibition. The Journal of biological chemistry. 2003;278(13):11221-11226.

221
376. King AJ, Sun H, Diaz B, Barnard D, Miao W, Bagrodia S, Marshall MS. The protein kinase Pak3 positively regulates Raf-1 activity through phosphorylation of serine 338. Nature. 1998;396(6707):180-183.
377. Jin S, Zhuo Y, Guo W, Field J. p21-activated Kinase 1 (Pak1)-dependent phosphorylation of Raf-1 regulates its mitochondrial localization, phosphorylation of BAD, and Bcl-2 association. The Journal of biological chemistry. 2005;280(26):24698-24705.
378. Cotteret S, Jaffer ZM, Beeser A, Chernoff J. p21-Activated kinase 5 (Pak5) localizes to mitochondria and inhibits apoptosis by phosphorylating BAD. Mol Cell Biol. 2003;23(16):5526-5539.
379. Frost JA, Swantek JL, Stippec S, Yin MJ, Gaynor R, Cobb MH. Stimulation of NFkappa B activity by multiple signaling pathways requires PAK1. The Journal of biological chemistry. 2000;275(26):19693-19699.
380. Friedland JC, Lakins JN, Kazanietz MG, Chernoff J, Boettiger D, Weaver VM. alpha6beta4 integrin activates Rac-dependent p21-activated kinase 1 to drive NF-kappaB-dependent resistance to apoptosis in 3D mammary acini. J Cell Sci. 2007;120(Pt 20):3700-3712.
381. Vadlamudi RK, Bagheri-Yarmand R, Yang Z, Balasenthil S, Nguyen D, Sahin AA, den Hollander P, Kumar R. Dynein light chain 1, a p21-activated kinase 1-interacting substrate, promotes cancerous phenotypes. Cancer Cell. 2004;5(6):575-585.
382. Daniels RH, Bokoch GM. p21-activated protein kinase: a crucial component of morphological signaling? Trends Biochem Sci. 1999;24(9):350-355.
383. Arias-Romero LE, Chernoff J. A tale of two Paks. Biol Cell. 2008;100(2):97-108.
384. Bokoch GM. Biology of the p21-activated kinases. Annu Rev Biochem. 2003;72:743-781.
385. Edwards DC, Sanders LC, Bokoch GM, Gill GN. Activation of LIM-kinase by Pak1 couples Rac/Cdc42 GTPase signalling to actin cytoskeletal dynamics. Nat Cell Biol. 1999;1(5):253-259.
386. Dan C, Kelly A, Bernard O, Minden A. Cytoskeletal changes regulated by the PAK4 serine/threonine kinase are mediated by LIM kinase 1 and cofilin. The Journal of biological chemistry. 2001;276(34):32115-32121.
387. Yang N, Higuchi O, Ohashi K, Nagata K, Wada A, Kangawa K, Nishida E, Mizuno K. Cofilin phosphorylation by LIM-kinase 1 and its role in Rac-mediated actin reorganization. Nature. 1998;393(6687):809-812.
388. Leberer E, Dignard D, Harcus D, Thomas DY, Whiteway M. The protein kinase homologue Ste20p is required to link the yeast pheromone response G-protein beta gamma subunits to downstream signalling components. EMBO J. 1992;11(13):4815-4824.

222
389. Wu C, Lytvyn V, Thomas DY, Leberer E. The phosphorylation site for Ste20p-like protein kinases is essential for the function of myosin-I in yeast. The Journal of biological chemistry. 1997;272(49):30623-30626.
390. Lechler T, Shevchenko A, Li R. Direct involvement of yeast type I myosins in Cdc42-dependent actin polymerization. J Cell Biol. 2000;148(2):363-373.
391. Crawford JM, Su Z, Varlamova O, Bresnick AR, Kiehart DP. Role of myosin-II phosphorylation in V12Cdc42-mediated disruption of Drosophila cellularization. Eur J Cell Biol. 2001;80(3):240-244.
392. Bisson N, Islam N, Poitras L, Jean S, Bresnick A, Moss T. The catalytic domain of xPAK1 is sufficient to induce myosin II dependent in vivo cell fragmentation independently of other apoptotic events. Dev Biol. 2003;263(2):264-281.
393. Ramos E, Wysolmerski RB, Masaracchia RA. Myosin phosphorylation by human cdc42-dependent S6/H4 kinase/gammaPAK from placenta and lymphoid cells. Recept Signal Transduct. 1997;7(2):99-110.
394. Chew TL, Masaracchia RA, Goeckeler ZM, Wysolmerski RB. Phosphorylation of non-muscle myosin II regulatory light chain by p21-activated kinase (gamma-PAK). J Muscle Res Cell Motil. 1998;19(8):839-854.
395. Van Eyk JE, Arrell DK, Foster DB, Strauss JD, Heinonen TY, Furmaniak-Kazmierczak E, Côté GP, Mak AS. Different molecular mechanisms for Rho family GTPase-dependent, Ca2+-independent contraction of smooth muscle. The Journal of biological chemistry. 1998;273(36):23433-23439.
396. Zhang H, Webb DJ, Asmussen H, Niu S, Horwitz AF. A GIT1/PIX/Rac/PAK signaling module regulates spine morphogenesis and synapse formation through MLC. J Neurosci. 2005;25(13):3379-3388.
397. Buss F, Kendrick-Jones J, Lionne C, Knight AE, Côté GP, Paul Luzio J. The localization of myosin VI at the golgi complex and leading edge of fibroblasts and its phosphorylation and recruitment into membrane ruffles of A431 cells after growth factor stimulation. J Cell Biol. 1998;143(6):1535-1545.
398. Sanders LC, Matsumura F, Bokoch GM, de Lanerolle P. Inhibition of myosin light chain kinase by p21-activated kinase. Science. 1999;283(5410):2083-2085.
399. Goeckeler ZM, Masaracchia RA, Zeng Q, Chew TL, Gallagher P, Wysolmerski RB. Phosphorylation of myosin light chain kinase by p21-activated kinase PAK2. The Journal of biological chemistry. 2000;275(24):18366-18374.
400. Wu JN, Koretzky GA. The SLP-76 family of adapter proteins. Semin Immunol. 2004;16(6):379-393.
401. Smith SD, Jaffer ZM, Chernoff J, Ridley AJ. PAK1-mediated activation of ERK1/2 regulates lamellipodial dynamics. J Cell Sci. 2008;121(Pt 22):3729-3736.

223
402. Wang D, Sai J, Carter G, Sachpatzidis A, Lolis E, Richmond A. PAK1 kinase is required for CXCL1-induced chemotaxis. Biochemistry. 2002;41(22):7100-7107.
403. Li Z, Hannigan M, Mo Z, Liu B, Lu W, Wu Y, Smrcka AV, Wu G, Li L, Liu M, Huang CK, Wu D. Directional sensing requires G beta gamma-mediated PAK1 and PIX alpha-dependent activation of Cdc42. Cell. 2003;114(2):215-227.
404. Allen JD, Jaffer ZM, Park SJ, Burgin S, Hofmann C, Sells MA, Chen S, Derr-Yellin E, Michels EG, McDaniel A, Bessler WK, Ingram DA, Atkinson SJ, Travers JB, Chernoff J, Clapp DW. p21-activated kinase regulates mast cell degranulation via effects on calcium mobilization and cytoskeletal dynamics. Blood. 2009;113(12):2695-2705.
405. Agopian K, Wei BL, Garcia JV, Gabuzda D. A hydrophobic binding surface on the human immunodeficiency virus type 1 Nef core is critical for association with p21-activated kinase 2. J Virol. 2006;80(6):3050-3061.
406. Linnemann T, Zheng YH, Mandic R, Peterlin BM. Interaction between Nef and phosphatidylinositol-3-kinase leads to activation of p21-activated kinase and increased production of HIV. Virology. 2002;294(2):246-255.
407. Wolf D, Witte V, Laffert B, Blume K, Stromer E, Trapp S, d'Aloja P, Schürmann A, Baur AS. HIV-1 Nef associated PAK and PI3-kinases stimulate Akt-independent Bad-phosphorylation to induce anti-apoptotic signals. Nature medicine. 2001;7(11):1217-1224.
408. Van den Broeke C, Radu M, Deruelle M, Nauwynck H, Hofmann C, Jaffer ZM, Chernoff J, Favoreel HW. Alphaherpesvirus US3-mediated reorganization of the actin cytoskeleton is mediated by group A p21-activated kinases. Proc Natl Acad Sci U S A. 2009;106(21):8707-8712.
409. Amstutz B, Gastaldelli M, Kälin S, Imelli N, Boucke K, Wandeler E, Mercer J, Hemmi S, Greber UF. Subversion of CtBP1-controlled macropinocytosis by human adenovirus serotype 3. EMBO J. 2008;27(7):956-969.
410. Liberali P, Kakkonen E, Turacchio G, Valente C, Spaar A, Perinetti G, Böckmann RA, Corda D, Colanzi A, Marjomaki V, Luini A. The closure of Pak1-dependent macropinosomes requires the phosphorylation of CtBP1/BARS. EMBO J. 2008;27(7):970-981.
411. Singh RR, Song C, Yang Z, Kumar R. Nuclear localization and chromatin targets of p21-activated kinase 1. The Journal of biological chemistry. 2005;280(18):18130-18137.
412. Zhang S, Han J, Sells MA, Chernoff J, Knaus UG, Ulevitch RJ, Bokoch GM. Rho family GTPases regulate p38 mitogen-activated protein kinase through the downstream mediator Pak1. The Journal of biological chemistry. 1995;270(41):23934-23936.
413. Brown JL, Stowers L, Baer M, Trejo J, Coughlin S, Chant J. Human Ste20 homologue hPAK1 links GTPases to the JNK MAP kinase pathway. Curr Biol. 1996;6(5):598-605.

224
414. Jakobi R, McCarthy CC, Koeppel MA, Stringer DK. Caspase-activated PAK-2 is regulated by subcellular targeting and proteasomal degradation. The Journal of biological chemistry. 2003;278(40):38675-38685.
415. Meng J, Meng Y, Hanna A, Janus C, Jia Z. Abnormal long-lasting synaptic plasticity and cognition in mice lacking the mental retardation gene Pak3. J Neurosci. 2005;25(28):6641-6650.
416. Barnes CJ, Vadlamudi RK, Mishra SK, Jacobson RH, Li F, Kumar R. Functional inactivation of a transcriptional corepressor by a signaling kinase. Nat Struct Biol. 2003;10(8):622-628.
417. Vadlamudi RK, Manavathi B, Singh RR, Nguyen D, Li F, Kumar R. An essential role of Pak1 phosphorylation of SHARP in Notch signaling. Oncogene. 2005;24(28):4591-4596.
418. Yang Z, Rayala S, Nguyen D, Vadlamudi RK, Chen S, Kumar R. Pak1 phosphorylation of snail, a master regulator of epithelial-to-mesenchyme transition, modulates snail's subcellular localization and functions. Cancer Res. 2005;65(8):3179-3184.
419. Tan W, Palmby TR, Gavard J, Amornphimoltham P, Zheng Y, Gutkind JS. An essential role for Rac1 in endothelial cell function and vascular development. FASEB J. 2008;22(6):1829-1838.
420. Kiosses WB, Daniels RH, Otey C, Bokoch GM, Schwartz MA. A role for p21-activated kinase in endothelial cell migration. J Cell Biol. 1999;147(4):831-844.
421. Hood JD, Frausto R, Kiosses WB, Schwartz MA, Cheresh DA. Differential alphav integrin-mediated Ras-ERK signaling during two pathways of angiogenesis. J Cell Biol. 2003;162(5):933-943.
422. Buchner DA, Su F, Yamaoka JS, Kamei M, Shavit JA, Barthel LK, McGee B, Amigo JD, Kim S, Hanosh AW, Jagadeeswaran P, Goldman D, Lawson ND, Raymond PA, Weinstein BM, Ginsburg D, Lyons SE. pak2a mutations cause cerebral hemorrhage in redhead zebrafish. Proc Natl Acad Sci U S A. 2007;104(35):13996-14001.
423. Tian Y, Lei L, Cammarano M, Nekrasova T, Minden A. Essential role for the Pak4 protein kinase in extraembryonic tissue development and vessel formation. Mech Dev. 2009;126(8-9):710-720.
424. JeBailey L, Wanono O, Niu W, Roessler J, Rudich A, Klip A. Ceramide- and oxidant-induced insulin resistance involve loss of insulin-dependent Rac-activation and actin remodeling in muscle cells. Diabetes. 2007;56(2):394-403.
425. Chiu TT, Jensen TE, Sylow L, Richter EA, Klip A. Rac1 signalling towards GLUT4/glucose uptake in skeletal muscle. Cell Signal. 2011;23(10):1546-1554.
426. Sun Y, Bilan PJ, Liu Z, Klip A. Rab8A and Rab13 are activated by insulin and regulate GLUT4 translocation in muscle cells. Proc Natl Acad Sci U S A. 2010;107(46):19909-19914.

225
427. Rudich A, Klip A. Putting Rac1 on the path to glucose uptake. Diabetes. 2013;62(6):1831-1832.
428. Sylow L, Kleinert M, Pehmøller C, Prats C, Chiu TT, Klip A, Richter EA, Jensen TE. Akt and Rac1 signalling are jointly required for insulin-stimulated glucose uptake in skeletal muscle and downregulated in insulin resistance. Cell Signal. 2013.
429. Sylow L, Jensen TE, Kleinert M, Højlund K, Kiens B, Wojtaszewski J, Prats C, Schjerling P, Richter EA. Rac1 signaling is required for insulin-stimulated glucose uptake and is dysregulated in insulin-resistant murine and human skeletal muscle. Diabetes. 2013;62(6):1865-1875.
430. Brozinick JT, Hawkins ED, Strawbridge AB, Elmendorf JS. Disruption of cortical actin in skeletal muscle demonstrates an essential role of the cytoskeleton in glucose transporter 4 translocation in insulin-sensitive tissues. J Biol Chem. 2004;279(39):40699-40706.
431. Tsakiridis T, Vranic M, Klip A. Disassembly of the actin network inhibits insulin-dependent stimulation of glucose transport and prevents recruitment of glucose transporters to the plasma membrane. J Biol Chem. 1994;269(47):29934-29942.
432. Tsakiridis T, Tong P, Matthews B, Tsiani E, Bilan PJ, Klip A, Downey GP. Role of the actin cytoskeleton in insulin action. Microsc Res Tech. 1999;47(2):79-92.
433. Tong P, Khayat ZA, Huang C, Patel N, Ueyama A, Klip A. Insulin-induced cortical actin remodeling promotes GLUT4 insertion at muscle cell membrane ruffles. J Clin Invest. 2001;108(3):371-381.
434. Kotani K, Yonezawa K, Hara K, Ueda H, Kitamura Y, Sakaue H, Ando A, Chavanieu A, Calas B, Grigorescu F. Involvement of phosphoinositide 3-kinase in insulin- or IGF-1-induced membrane ruffling. EMBO J. 1994;13(10):2313-2321.
435. Tsakiridis T, Vranic M, Klip A. Phosphatidylinositol 3-kinase and the actin network are not required for the stimulation of glucose transport caused by mitochondrial uncoupling: comparison with insulin action. Biochem J. 1995;309 ( Pt 1):1-5.
436. Ueda S, Kataoka T, Satoh T. Activation of the small GTPase Rac1 by a specific guanine-nucleotide-exchange factor suffices to induce glucose uptake into skeletal-muscle cells. Biol Cell. 2008;100(11):645-657.
437. Ueda S, Kitazawa S, Ishida K, Nishikawa Y, Matsui M, Matsumoto H, Aoki T, Nozaki S, Takeda T, Tamori Y, Aiba A, Kahn CR, Kataoka T, Satoh T. Crucial role of the small GTPase Rac1 in insulin-stimulated translocation of glucose transporter 4 to the mouse skeletal muscle sarcolemma. FASEB J. 2010;24(7):2254-2261.
438. Wang Z, Oh E, Clapp DW, Chernoff J, Thurmond DC. Inhibition or ablation of p21-activated kinase (PAK1) disrupts glucose homeostatic mechanisms in vivo. The Journal of biological chemistry. 2011;286(48):41359-41367.

226
439. Delorme V, Machacek M, DerMardirossian C, Anderson KL, Wittmann T, Hanein D, Waterman-Storer C, Danuser G, Bokoch GM. Cofilin activity downstream of Pak1 regulates cell protrusion efficiency by organizing lamellipodium and lamella actin networks. Dev Cell. 2007;13(5):646-662.
440. Huang H, Lee DH, Zabolotny JM, Kim YB. Metabolic actions of Rho-kinase in periphery and brain. Trends Endocrinol Metab. 2013.
441. Chun KH, Araki K, Jee Y, Lee DH, Oh BC, Huang H, Park KS, Lee SW, Zabolotny JM, Kim YB. Regulation of glucose transport by ROCK1 differs from that of ROCK2 and is controlled by actin polymerization. Endocrinology. 2012;153(4):1649-1662.
442. Nozaki S, Ueda S, Takenaka N, Kataoka T, Satoh T. Role of RalA downstream of Rac1 in insulin-dependent glucose uptake in muscle cells. Cell Signal. 2012;24(11):2111-2117.
443. Podkowa M, Christova T, Zhao X, Jian Y, Attisano L. p21-Activated kinase (PAK) is required for Bone Morphogenetic Protein (BMP)-induced dendritogenesis in cortical neurons. Mol Cell Neurosci. 2013;57C:83-92.
444. Staser K, Shew MA, Michels EG, Mwanthi MM, Yang FC, Clapp DW, Park SJ. A Pak1-PP2A-ERM signaling axis mediates F-actin rearrangement and degranulation in mast cells. Exp Hematol. 2013;41(1):56-66.e52.
445. Kundumani-Sridharan V, Singh NK, Kumar S, Gadepalli R, Rao GN. Nuclear factor of activated T cells c1 mediates p21-activated kinase 1 activation in the modulation of chemokine-induced human aortic smooth muscle cell F-actin stress fiber formation, migration, and proliferation and injury-induced vascular wall remodeling. J Biol Chem. 2013;288(30):22150-22162.
446. Gu S, Kounenidakis M, Schmidt EM, Deshpande D, Alkahtani S, Alarifi S, Föller M, Alevizopoulos K, Lang F, Stournaras C. Rapid activation of FAK/mTOR/p70S6K/PAK1-signaling controls the early testosterone-induced actin reorganization in colon cancer cells. Cell Signal. 2013;25(1):66-73.
447. Ijuin T, Takenawa T. Regulation of insulin signaling by the phosphatidylinositol 3,4,5-triphosphate phosphatase SKIP through the scaffolding function of Pak1. Mol Cell Biol. 2012;32(17):3570-3584.
448. Ijuin T, Takenawa T. Regulation of insulin signaling and glucose transporter 4 (GLUT4) exocytosis by phosphatidylinositol 3,4,5-trisphosphate (PIP3) phosphatase, skeletal muscle, and kidney enriched inositol polyphosphate phosphatase (SKIP). J Biol Chem. 2012;287(10):6991-6999.
449. Ijuin T, Mochizuki Y, Fukami K, Funaki M, Asano T, Takenawa T. Identification and characterization of a novel inositol polyphosphate 5-phosphatase. J Biol Chem. 2000;275(15):10870-10875.
450. Ijuin T, Takenawa T. SKIP negatively regulates insulin-induced GLUT4 translocation and membrane ruffle formation. Mol Cell Biol. 2003;23(4):1209-1220.

227
451. GOLDSTEIN MS, MULLICK V, HUDDLESTUN B, LEVINE R. Action of muscular work on transfer of sugars across cell barriers; comparison with action of insulin. Am J Physiol. 1953;173(2):212-216.
452. Sylow L, Jensen TE, Kleinert M, Mouatt JR, Maarbjerg SJ, Jeppesen J, Prats C, Chiu TT, Boguslavsky S, Klip A, Schjerling P, Richter EA. Rac1 is a novel regulator of contraction-stimulated glucose uptake in skeletal muscle. Diabetes. 2013;62(4):1139-1151.
453. Wang Z, Oh E, Thurmond DC. Glucose-stimulated Cdc42 signaling is essential for the second phase of insulin secretion. The Journal of biological chemistry. 2007;282(13):9536-9546.
454. Orci L, Gabbay KH, Malaisse WJ. Pancreatic beta-cell web: its possible role in insulin secretion. Science. 1972;175(4026):1128-1130.
455. Aunis D, Bader MF. The cytoskeleton as a barrier to exocytosis in secretory cells. J Exp Biol. 1988;139:253-266.
456. van Obberghen E, Somers G, Devis G, Vaughan GD, Malaisse-Lagae F, Orci L, Malaisse WJ. Dynamics of insulin release and microtubular-microfilamentous system. I. Effect of cytochalasin B. J Clin Invest. 1973;52(5):1041-1051.
457. Kowluru A. Small G proteins in islet beta-cell function. Endocr Rev. 2010;31(1):52-78.
458. Li J, Luo R, Kowluru A, Li G. Novel regulation by Rac1 of glucose- and forskolin-induced insulin secretion in INS-1 beta-cells. Am J Physiol Endocrinol Metab. 2004;286(5):E818-827.
459. Asahara S, Shibutani Y, Teruyama K, Inoue HY, Kawada Y, Etoh H, Matsuda T, Kimura-Koyanagi M, Hashimoto N, Sakahara M, Fujimoto W, Takahashi H, Ueda S, Hosooka T, Satoh T, Inoue H, Matsumoto M, Aiba A, Kasuga M, Kido Y. Ras-related C3 botulinum toxin substrate 1 (RAC1) regulates glucose-stimulated insulin secretion via modulation of F-actin. Diabetologia. 2013;56(5):1088-1097.
460. Kalwat MA, Yoder SM, Wang Z, Thurmond DC. A p21-activated kinase (PAK1) signaling cascade coordinately regulates F-actin remodeling and insulin granule exocytosis in pancreatic β cells. Biochem Pharmacol. 2013;85(6):808-816.
461. Kalwat MA, Thurmond DC. Signaling mechanisms of glucose-induced F-actin remodeling in pancreatic islet β cells. Exp Mol Med. 2013;45:e37.
462. Arous C, Rondas D, Halban PA. Non-muscle myosin IIA is involved in focal adhesion and actin remodelling controlling glucose-stimulated insulin secretion. Diabetologia. 2013;56(4):792-802.
463. Alessi DR, Sakamoto K, Bayascas JR. LKB1-dependent signaling pathways. Annual review of biochemistry. 2006;75:137-163.

228
464. Inoue E, Mochida S, Takagi H, Higa S, Deguchi-Tawarada M, Takao-Rikitsu E, Inoue M, Yao I, Takeuchi K, Kitajima I, Setou M, Ohtsuka T, Takai Y. SAD: a presynaptic kinase associated with synaptic vesicles and the active zone cytomatrix that regulates neurotransmitter release. Neuron. 2006;50(2):261-275.
465. Nie J, Sun C, Faruque O, Ye G, Li J, Liang Q, Chang Z, Yang W, Han X, Shi Y. Synapses of amphids defective (SAD-A) kinase promotes glucose-stimulated insulin secretion through activation of p21-activated kinase (PAK1) in pancreatic β-Cells. J Biol Chem. 2012;287(31):26435-26444.
466. Kichina JV, Goc A, Al-Husein B, Somanath PR, Kandel ES. PAK1 as a therapeutic target. Expert Opin Ther Targets. 2010;14(7):703-725.
467. Rø TB, Holien T, Fagerli UM, Hov H, Misund K, Waage A, Sundan A, Holt RU, Børset M. HGF and IGF-1 synergize with SDF-1α in promoting migration of myeloma cells by cooperative activation of p21-activated kinase. Exp Hematol. 2013;41(7):646-655.
468. Chiang YA, Shao W, Xu XX, Chernoff J, Jin T. P21-activated protein kinase 1 (Pak1) mediates the cross talk between insulin and β-catenin on proglucagon gene expression and its ablation affects glucose homeostasis in male C57BL/6 mice. Endocrinology. 2013;154(1):77-88.
469. Belsham DD, Cai F, Cui H, Smukler SR, Salapatek AM, Shkreta L. Generation of a phenotypic array of hypothalamic neuronal cell models to study complex neuroendocrine disorders. Endocrinology. 2004;145(1):393-400.
470. Tang Y, Zhou H, Chen A, Pittman RN, Field J. The Akt proto-oncogene links Ras to Pak and cell survival signals. The Journal of biological chemistry. 2000;275(13):9106-9109.
471. Sinclair EM, Drucker DJ. Proglucagon-derived peptides: mechanisms of action and therapeutic potential. Physiology (Bethesda). 2005;20:357-365.
472. Kieffer TJ. Gastro-intestinal hormones GIP and GLP-1. Ann Endocrinol (Paris). 2004;65(1):13-21.
473. Philippe J, Drucker DJ, Chick WL, Habener JF. Transcriptional regulation of genes encoding insulin, glucagon, and angiotensinogen by sodium butyrate in a rat islet cell line. Mol Cell Biol. 1987;7(1):560-563.
474. Katz LS, Gosmain Y, Marthinet E, Philippe J. Pax6 regulates the proglucagon processing enzyme PC2 and its chaperone 7B2. Mol Cell Biol. 2009;29(8):2322-2334.
475. Jin T, George Fantus I, Sun J. Wnt and beyond Wnt: multiple mechanisms control the transcriptional property of beta-catenin. Cell Signal. 2008;20(10):1697-1704.
476. Philippe J. Insulin regulation of the glucagon gene is mediated by an insulin-responsive DNA element. Proc Natl Acad Sci U S A. 1991;88(16):7224-7227.

229
477. Philippe J. Glucagon gene transcription is negatively regulated by insulin in a hamster islet cell line. The Journal of clinical investigation. 1989;84(2):672-677.
478. Schinner S, Barthel A, Dellas C, Grzeskowiak R, Sharma SK, Oetjen E, Blume R, Knepel W. Protein kinase B activity is sufficient to mimic the effect of insulin on glucagon gene transcription. The Journal of biological chemistry. 2005;280(8):7369-7376.
479. Yi F, Sun J, Lim GE, Fantus IG, Brubaker PL, Jin T. Cross talk between the insulin and Wnt signaling pathways: evidence from intestinal endocrine L cells. Endocrinology. 2008;149(5):2341-2351.
480. Lim GE, Huang GJ, Flora N, LeRoith D, Rhodes CJ, Brubaker PL. Insulin regulates glucagon-like peptide-1 secretion from the enteroendocrine L cell. Endocrinology. 2009;150(2):580-591.
481. Kim CH, Pennisi P, Zhao H, Yakar S, Kaufman JB, Iganaki K, Shiloach J, Scherer PE, Quon MJ, LeRoith D. MKR mice are resistant to the metabolic actions of both insulin and adiponectin: discordance between insulin resistance and adiponectin responsiveness. American journal of physiology Endocrinology and metabolism. 2006;291(2):E298-305.
482. Hofmann C, Shepelev M, Chernoff J. The genetics of Pak. J Cell Sci. 2004;117(Pt 19):4343-4354.
483. Manser E, Chong C, Zhao ZS, Leung T, Michael G, Hall C, Lim L. Molecular cloning of a new member of the p21-Cdc42/Rac-activated kinase (PAK) family. The Journal of biological chemistry. 1995;270(42):25070-25078.
484. Brubaker PL, Drucker DJ, Greenberg GR. Synthesis and secretion of somatostatin-28 and -14 by fetal rat intestinal cells in culture. The American journal of physiology. 1990;258(6 Pt 1):G974-981.
485. Lu F, Jin T, Drucker DJ. Proglucagon gene expression is induced by gastrin-releasing peptide in a mouse enteroendocrine cell line. Endocrinology. 1996;137(9):3710-3716.
486. Garcia-Martinez JM, Chocarro-Calvo A, Moya CM, Garcia-Jimenez C. WNT/beta-catenin increases the production of incretins by entero-endocrine cells. Diabetologia. 2009;52(9):1913-1924.
487. Zhu G, Wang Y, Huang B, Liang J, Ding Y, Xu A, Wu W. A Rac1/PAK1 cascade controls beta-catenin activation in colon cancer cells. Oncogene. 2012;31(8):1001-1012.
488. Konrad D, Bilan PJ, Nawaz Z, Sweeney G, Niu W, Liu Z, Antonescu CN, Rudich A, Klip A. Need for GLUT4 activation to reach maximum effect of insulin-mediated glucose uptake in brown adipocytes isolated from GLUT4myc-expressing mice. Diabetes. 2002;51(9):2719-2726.
489. Kowluru A. Small G proteins in islet beta-cell function. Endocrine reviews. 2010;31(1):52-78.

230
490. Kowluru A, Veluthakal R, Rhodes CJ, Kamath V, Syed I, Koch BJ. Protein farnesylation-dependent Raf/extracellular signal-related kinase signaling links to cytoskeletal remodeling to facilitate glucose-induced insulin secretion in pancreatic beta-cells. Diabetes. 2010;59(4):967-977.
491. Grant SF, Hakonarson H, Schwartz S. Can the genetics of type 1 and type 2 diabetes shed light on the genetics of latent autoimmune diabetes in adults? Endocrine reviews. 2010;31(2):183-193.
492. Schinner S. Wingless-type MMTV integration site family (WNT) signalling in pancreatic beta cells-more complex than expected. Diabetologia. 2010;53(9):2073-2075.
493. de la Torre-Ubieta L, Gaudilliere B, Yang Y, Ikeuchi Y, Yamada T, DiBacco S, Stegmuller J, Schuller U, Salih DA, Rowitch D, Brunet A, Bonni A. A FOXO-Pak1 transcriptional pathway controls neuronal polarity. Genes Dev. 2010;24(8):799-813.
494. Lauffer LM, Iakoubov R, Brubaker PL. GPR119 is essential for oleoylethanolamide-induced glucagon-like peptide-1 secretion from the intestinal enteroendocrine L-cell. Diabetes. 2009;58(5):1058-1066.
495. Weinstein DE. Isolation and purification of primary rodent astrocytes. Curr Protoc Neurosci. 2001;Chapter 3:Unit 3 5.
496. Burmeister MA, Ferre T, Ayala JE, King EM, Holt RM. Acute activation of central GLP-1 receptors enhances hepatic insulin action and insulin secretion in high-fat-fed, insulin resistant mice. American journal of physiology Endocrinology and metabolism. 2012;302(3):E334-343.
497. Nathanson D, Zethelius B, Berne C, Holst JJ, Sjoholm A, Nystrom T. Reduced plasma levels of glucagon-like peptide-1 in elderly men are associated with impaired glucose tolerance but not with coronary heart disease. Diabetologia. 2010;53(2):277-280.
498. Vilsboll T, Krarup T, Deacon CF, Madsbad S, Holst JJ. Reduced postprandial concentrations of intact biologically active glucagon-like peptide 1 in type 2 diabetic patients. Diabetes. 2001;50(3):609-613.
499. Mao T, Shao M, Qiu Y, Huang J, Zhang Y, Song B, Wang Q, Jiang L, Liu Y, Han JD, Cao P, Li J, Gao X, Rui L, Qi L, Li W. PKA phosphorylation couples hepatic inositol-requiring enzyme 1alpha to glucagon signaling in glucose metabolism. Proc Natl Acad Sci U S A. 2011;108(38):15852-15857.
500. Sells MA, Knaus UG, Bagrodia S, Ambrose DM, Bokoch GM, Chernoff J. Human p21-activated kinase (Pak1) regulates actin organization in mammalian cells. Curr Biol. 1997;7(3):202-210.
501. Guo D, Tan YC, Wang D, Madhusoodanan KS, Zheng Y, Maack T, Zhang JJ, Huang XY. A Rac-cGMP signaling pathway. Cell. 2007;128(2):341-355.

231
502. Aaboe K, Knop FK, Vilsboll T, Deacon CF, Holst JJ, Madsbad S, Krarup T. Twelve weeks treatment with the DPP-4 inhibitor, sitagliptin, prevents degradation of peptide YY and improves glucose and non-glucose induced insulin secretion in patients with type 2 diabetes mellitus. Diabetes, obesity & metabolism. 2010;12(4):323-333.
503. Chen Z, Sheng L, Shen H, Zhao Y, Wang S, Brink R, Rui L. Hepatic TRAF2 regulates glucose metabolism through enhancing glucagon responses. Diabetes. 2012;61(3):566-573.
504. Cheng KK, Iglesias MA, Lam KS, Wang Y, Sweeney G, Zhu W, Vanhoutte PM, Kraegen EW, Xu A. APPL1 potentiates insulin-mediated inhibition of hepatic glucose production and alleviates diabetes via Akt activation in mice. Cell Metab. 2009;9(5):417-427.
505. Vu V, Liu Y, Sen S, Xu A, Sweeney G. Delivery of adiponectin gene to skeletal muscle using ultrasound targeted microbubbles improves insulin sensitivity and whole body glucose homeostasis. American journal of physiology Endocrinology and metabolism. 2013;304(2):E168-175.
506. Sheng L, Zhou Y, Chen Z, Ren D, Cho KW, Jiang L, Shen H, Sasaki Y, Rui L. NF-kappaB-inducing kinase (NIK) promotes hyperglycemia and glucose intolerance in obesity by augmenting glucagon action. Nature medicine. 2012.
507. Hvidberg A, Nielsen MT, Hilsted J, Orskov C, Holst JJ. Effect of glucagon-like peptide-1 (proglucagon 78-107amide) on hepatic glucose production in healthy man. Metabolism. 1994;43(1):104-108.
508. Seghieri M, Rebelos E, Gastaldelli A, Astiarraga BD, Casolaro A, Barsotti E, Pocai A, Nauck M, Muscelli E, Ferrannini E. Direct effect of GLP-1 infusion on endogenous glucose production in humans. Diabetologia. 2013;56(1):156-161.
509. Zhang W, Sargis RM, Volden PA, Carmean CM, Sun XJ, Brady MJ. PCB 126 and other dioxin-like PCBs specifically suppress hepatic PEPCK expression via the aryl hydrocarbon receptor. PLoS One. 2012;7(5):e37103.
510. Prigeon RL, Quddusi S, Paty B, D'Alessio DA. Suppression of glucose production by GLP-1 independent of islet hormones: a novel extrapancreatic effect. American journal of physiology Endocrinology and metabolism. 2003;285(4):E701-707.
511. Shao W, Wang D, Chiang YT, Ip W, Zhu L, Xu F, Columbus J, Belsham DD, Irwin DM, Zhang H, Wen X, Wang Q, Jin T. The Wnt signaling pathway effector TCF7L2 controls gut and brain proglucagon gene expression and glucose homeostasis. Diabetes. 2013;62(3):789-800.
512. He H, Shulkes A, Baldwin GS. PAK1 interacts with beta-catenin and is required for the regulation of the beta-catenin signalling pathway by gastrins. Biochim Biophys Acta. 2008;1783(10):1943-1954.

232
513. Arias-Romero LE, Villamar-Cruz O, Huang M, Hoeflich KP, Chernoff J. Pak1 kinase links ErbB2 to β-catenin in transformation of breast epithelial cells. Cancer Res. 2013;73(12):3671-3682.
514. Toft-Nielson M, Madsbad S, Holst JJ. The effect of glucagon-like peptide I (GLP-I) on glucose elimination in healthy subjects depends on the pancreatic glucoregulatory hormones. Diabetes. 1996;45(5):552-556.
515. Larsson H, Holst JJ, Ahren B. Glucagon-like peptide-1 reduces hepatic glucose production indirectly through insulin and glucagon in humans. Acta Physiol Scand. 1997;160(4):413-422.
516. Orskov C, Wettergren A, Holst JJ. Biological effects and metabolic rates of glucagonlike peptide-1 7-36 amide and glucagonlike peptide-1 7-37 in healthy subjects are indistinguishable. Diabetes. 1993;42(5):658-661.
517. Shirakawa J, Fujii H, Ohnuma K, Sato K, Ito Y, Kaji M, Sakamoto E, Koganei M, Sasaki H, Nagashima Y, Amo K, Aoki K, Morimoto C, Takeda E, Terauchi Y. Diet-induced adipose tissue inflammation and liver steatosis are prevented by DPP-4 inhibition in diabetic mice. Diabetes. 2011;60(4):1246-1257.
518. Kennedy LM, Pham SC, Grishok A. Nonautonomous Regulation of Neuronal Migration by Insulin Signaling, DAF-16/FOXO, and PAK-1. Cell Rep. 2013.
519. Sun J, Wang D, Jin T. Insulin alters the expression of components of the Wnt signaling pathway including TCF-4 in the intestinal cells. Biochim Biophys Acta. 2010;1800(3):344-351.
520. Verras M, Sun Z. Beta-catenin is involved in insulin-like growth factor 1-mediated transactivation of the androgen receptor. Mol Endocrinol. 2005;19(2):391-398.
521. Kim MH, Hong SH, Lee MK. Insulin receptor-overexpressing β-cells ameliorate hyperglycemia in diabetic rats through Wnt signaling activation. PLoS One. 2013;8(7):e67802.
522. Lim GE, Xu M, Sun J, Jin T, Brubaker PL. The rho guanosine 5'-triphosphatase, cell division cycle 42, is required for insulin-induced actin remodeling and glucagon-like peptide-1 secretion in the intestinal endocrine L cell. Endocrinology. 2009;150(12):5249-5261.
523. Akıncı A, Aydın Ö, Özerol H. Glucagon-like peptide-1 and-2 levels in children with diabetic ketoacidosis. J Clin Res Pediatr Endocrinol. 2009;1(3):144-150.
524. Byrne MM, McGregor GP, Barth P, Rothmund M, Göke B, Arnold R. Intestinal proliferation and delayed intestinal transit in a patient with a GLP-1-, GLP-2- and PYY-producing neuroendocrine carcinoma. Digestion. 2001;63(1):61-68.
525. Kelly ML, Chernoff J. Mouse models of PAK function. Cell Logist. 2012;2(2):84-88.

233
526. Asrar S, Meng Y, Zhou Z, Todorovski Z, Huang WW, Jia Z. Regulation of hippocampal long-term potentiation by p21-activated protein kinase 1 (PAK1). Neuropharmacology. 2009;56(1):73-80.
527. Liu W, Zi M, Naumann R, Ulm S, Jin J, Taglieri DM, Prehar S, Gui J, Tsui H, Xiao RP, Neyses L, Solaro RJ, Ke Y, Cartwright EJ, Lei M, Wang X. Pak1 as a novel therapeutic target for antihypertrophic treatment in the heart. Circulation. 2011;124(24):2702-2715.
528. McDaniel AS, Allen JD, Park SJ, Jaffer ZM, Michels EG, Burgin SJ, Chen S, Bessler WK, Hofmann C, Ingram DA, Chernoff J, Clapp DW. Pak1 regulates multiple c-Kit mediated Ras-MAPK gain-in-function phenotypes in Nf1+/- mast cells. Blood. 2008;112(12):4646-4654.
529. Kepner EM, Yoder SM, Oh E, Kalwat MA, Wang Z, Quilliam LA, Thurmond DC. Cool-1/βPIX functions as a guanine nucleotide exchange factor in the cycling of Cdc42 to regulate insulin secretion. American journal of physiology Endocrinology and metabolism. 2011;301(6):E1072-1080.
530. Tsushima RG. Second-phase insulin secretion gets cool. American journal of physiology Endocrinology and metabolism. 2011;301(6):E1070-1071.
531. Suzuki K, Simpson KA, Minnion JS, Shillito JC, Bloom SR. The role of gut hormones and the hypothalamus in appetite regulation. Endocr J. 2010;57(5):359-372.
532. Hölscher C. The role of GLP-1 in neuronal activity and neurodegeneration. Vitam Horm. 2010;84:331-354.
533. Holst JJ, Burcelin R, Nathanson E. Neuroprotective properties of GLP-1: theoretical and practical applications. Curr Med Res Opin. 2011;27(3):547-558.
534. Taglieri DM, Monasky MM, Knezevic I, Sheehan KA, Lei M, Wang X, Chernoff J, Wolska BM, Ke Y, Solaro RJ. Ablation of p21-activated kinase-1 in mice promotes isoproterenol-induced cardiac hypertrophy in association with activation of Erk1/2 and inhibition of protein phosphatase 2A. J Mol Cell Cardiol. 2011;51(6):988-996.
535. Valverde I, Morales M, Clemente F, López-Delgado MI, Delgado E, Perea A, Villanueva-Peñacarrillo ML. Glucagon-like peptide 1: a potent glycogenic hormone. FEBS Lett. 1994;349(2):313-316.
536. Villanueva-Peñacarrillo ML, Delgado E, Trapote MA, Alcántara A, Clemente F, Luque MA, Perea A, Valverde I. Glucagon-like peptide-1 binding to rat hepatic membranes. The Journal of endocrinology. 1995;146(1):183-189.
537. Vahl TP, Tauchi M, Durler TS, Elfers EE, Fernandes TM, Bitner RD, Ellis KS, Woods SC, Seeley RJ, Herman JP, D'Alessio DA. Glucagon-like peptide-1 (GLP-1) receptors expressed on nerve terminals in the portal vein mediate the effects of endogenous GLP-1 on glucose tolerance in rats. Endocrinology. 2007;148(10):4965-4973.

234
538. Kim DH, D'Alessio DA, Woods SC, Seeley RJ. The effects of GLP-1 infusion in the hepatic portal region on food intake. Regul Pept. 2009;155(1-3):110-114.
539. Barakat GM, Moustafa ME, Bikhazi AB. Effects of selenium and exendin-4 on glucagon-like peptide-1 receptor, IRS-1, and Raf-1 in the liver of diabetic rats. Biochem Genet. 2012;50(11-12):922-935.
540. Murayama Y, Kawai K, Suzuki S, Ohashi S, Yamashita K. Glucagon-like peptide-1(7-37) does not stimulate either hepatic glycogenolysis or ketogenesis. Endocrinol Jpn. 1990;37(2):293-297.
541. Blackmore PF, Mojsov S, Exton JH, Habener JF. Absence of insulinotropic glucagon-like peptide-I(7-37) receptors on isolated rat liver hepatocytes. FEBS Lett. 1991;283(1):7-10.
542. Nakagawa Y, Kawai K, Suzuki H, Ohashi S, Yamashita K. Glucagon-like peptide-1(7-36) amide and glycogen synthesis in the liver. Diabetologia. 1996;39(10):1241-1242.
543. Ip W, Shao W, Chiang YT, Jin T. GLP-1-derived nonapeptide GLP-1(28-36)amide represses hepatic gluconeogenic gene expression and improves pyruvate tolerance in high-fat diet-fed mice. Am J Physiol Endocrinol Metab. 2013;305(11):E1348-1358.
544. D'Alessio DA, Kahn SE, Leusner CR, Ensinck JW. Glucagon-like peptide 1 enhances glucose tolerance both by stimulation of insulin release and by increasing insulin-independent glucose disposal. The Journal of clinical investigation. 1994;93(5):2263-2266.
545. Meneilly GS, McIntosh CH, Pederson RA, Habener JF, Gingerich R, Egan JM, Finegood DT, Elahi D. Effect of glucagon-like peptide 1 on non-insulin-mediated glucose uptake in the elderly patient with diabetes. Diabetes Care. 2001;24(11):1951-1956.
546. Egan JM, Meneilly GS, Habener JF, Elahi D. Glucagon-like peptide-1 augments insulin-mediated glucose uptake in the obese state. The Journal of clinical endocrinology and metabolism. 2002;87(8):3768-3773.
547. Orskov L, Holst JJ, Møller J, Orskov C, Møller N, Alberti KG, Schmitz O. GLP-1 does not not acutely affect insulin sensitivity in healthy man. Diabetologia. 1996;39(10):1227-1232.
548. Ryan AS, Egan JM, Habener JF, Elahi D. Insulinotropic hormone glucagon-like peptide-1-(7-37) appears not to augment insulin-mediated glucose uptake in young men during euglycemia. The Journal of clinical endocrinology and metabolism. 1998;83(7):2399-2404.
549. Vella A, Shah P, Reed AS, Adkins AS, Basu R, Rizza RA. Lack of effect of exendin-4 and glucagon-like peptide-1-(7,36)-amide on insulin action in non-diabetic humans. Diabetologia. 2002;45(10):1410-1415.

235
550. Svegliati-Baroni G, Saccomanno S, Rychlicki C, Agostinelli L, De Minicis S, Candelaresi C, Faraci G, Pacetti D, Vivarelli M, Nicolini D, Garelli P, Casini A, Manco M, Mingrone G, Risaliti A, Frega GN, Benedetti A, Gastaldelli A. Glucagon-like peptide-1 receptor activation stimulates hepatic lipid oxidation and restores hepatic signalling alteration induced by a high-fat diet in nonalcoholic steatohepatitis. Liver Int. 2011;31(9):1285-1297.
551. Elahi D, Egan JM, Shannon RP, Meneilly GS, Khatri A, Habener JF, Andersen DK. GLP-1 (9-36) amide, cleavage product of GLP-1 (7-36) amide, is a glucoregulatory peptide. Obesity (Silver Spring). 2008;16(7):1501-1509.
552. Crawford JJ, Hoeflich KP, Rudolph J. p21-Activated kinase inhibitors: a patent review. Expert Opin Ther Pat. 2012;22(3):293-310.
553. Elahi D, Muller DC, Egan JM, Andres R, Veldhuist J, Meneilly GS. Glucose tolerance, glucose utilization and insulin secretion in ageing. Novartis Found Symp. 2002;242:222-242; discussion 242-226.
554. Harris MI, Flegal KM, Cowie CC, Eberhardt MS, Goldstein DE, Little RR, Wiedmeyer HM, Byrd-Holt DD. Prevalence of diabetes, impaired fasting glucose, and impaired glucose tolerance in U.S. adults. The Third National Health and Nutrition Examination Survey, 1988-1994. Diabetes Care. 1998;21(4):518-524.
555. Chang AM, Halter JB. Aging and insulin secretion. American journal of physiology Endocrinology and metabolism. 2003;284(1):E7-12.
556. Chang AM, Smith MJ, Galecki AT, Bloem CJ, Halter JB. Impaired beta-cell function in human aging: response to nicotinic acid-induced insulin resistance. The Journal of clinical endocrinology and metabolism. 2006;91(9):3303-3309.
557. Meneilly GS, Ryan AS, Veldhuis JD, Elahi D. Increased disorderliness of basal insulin release, attenuated insulin secretory burst mass, and reduced ultradian rhythmicity of insulin secretion in older individuals. The Journal of clinical endocrinology and metabolism. 1997;82(12):4088-4093.
558. Horowitz M, Maddern GJ, Chatterton BE, Collins PJ, Harding PE, Shearman DJ. Changes in gastric emptying rates with age. Clin Sci (Lond). 1984;67(2):213-218.
559. Kao CH, Lai TL, Wang SJ, Chen GH, Yeh SH. Influence of age on gastric emptying in healthy Chinese. Clin Nucl Med. 1994;19(5):401-404.
560. Toft-Nielsen MB, Damholt MB, Madsbad S, Hilsted LM, Hughes TE, Michelsen BK, Holst JJ. Determinants of the impaired secretion of glucagon-like peptide-1 in type 2 diabetic patients. The Journal of clinical endocrinology and metabolism. 2001;86(8):3717-3723.
561. Rankin MM, Kushner JA. Adaptive beta-cell proliferation is severely restricted with advanced age. Diabetes. 2009;58(6):1365-1372.

236
562. Tschen SI, Dhawan S, Gurlo T, Bhushan A. Age-dependent decline in beta-cell proliferation restricts the capacity of beta-cell regeneration in mice. Diabetes. 2009;58(6):1312-1320.
563. Reers C, Erbel S, Esposito I, Schmied B, Büchler MW, Nawroth PP, Ritzel RA. Impaired islet turnover in human donor pancreata with aging. European journal of endocrinology / European Federation of Endocrine Societies. 2009;160(2):185-191.
564. Hiramatsu S, Inoue K, Sako Y, Umeda F, Nawata H. Secretion of insulin and glucagon by the perfused pancreas of genetically obese (fa/fa) Zucker rats and its alteration with aging. Endocr J. 1995;42(4):563-567.
565. Nadiv O, Cohen O, Zick Y. Defects of insulin's signal transduction in old rat livers. Endocrinology. 1992;130(3):1515-1524.
566. Elahi D, Muller DC, Andersen DK, Tobin JD, Andres R. The effect of age and glucose concentration on insulin secretion by the isolated perfused rat pancreas. Endocrinology. 1985;116(1):11-16.
567. Wang Y, Perfetti R, Greig NH, Holloway HW, DeOre KA, Montrose-Rafizadeh C, Elahi D, Egan JM. Glucagon-like peptide-1 can reverse the age-related decline in glucose tolerance in rats. The Journal of clinical investigation. 1997;99(12):2883-2889.
568. De Ore K, Greig NH, Holloway HW, Wang Y, Perfetti R, Egan JM. The effects of GLP-1 on insulin release in young and old rats in the fasting state and during an intravenous glucose tolerance test. J Gerontol A Biol Sci Med Sci. 1997;52(5):B245-249.
569. Irwin N, McClean PL, Harriott P, Flatt PR. Beneficial effects of sub-chronic activation of glucagon-like peptide-1 (GLP-1) receptors on deterioration of glucose homeostasis and insulin secretion in aging mice. Exp Gerontol. 2007;42(4):296-300.
570. Elahi D, McAloon-Dyke M, Fukagawa NK, Meneilly GS, Sclater AL, Minaker KL, Habener JF, Andersen DK. The insulinotropic actions of glucose-dependent insulinotropic polypeptide (GIP) and glucagon-like peptide-1 (7-37) in normal and diabetic subjects. Regul Pept. 1994;51(1):63-74.
571. Ranganath L, Sedgwick I, Morgan L, Wright J, Marks V. The ageing entero-insular axis. Diabetologia. 1998;41(11):1309-1313.
572. Li X, Liu F, Li F. PAK as a therapeutic target in gastric cancer. Expert Opin Ther Targets. 2010;14(4):419-433.
573. Hoover WC, Zhang W, Xue Z, Gao H, Chernoff J, Clapp DW, Gunst SJ, Tepper RS. Inhibition of p21 activated kinase (PAK) reduces airway responsiveness in vivo and in vitro in murine and human airways. PLoS One. 2012;7(8):e42601.
574. Dolan BM, Duron SG, Campbell DA, Vollrath B, Shankaranarayana Rao BS, Ko HY, Lin GG, Govindarajan A, Choi SY, Tonegawa S. Rescue of fragile X syndrome

237
phenotypes in Fmr1 KO mice by the small-molecule PAK inhibitor FRAX486. Proc Natl Acad Sci U S A. 2013;110(14):5671-5676.
575. Licciulli S, Maksimoska J, Zhou C, Troutman S, Kota S, Liu Q, Duron S, Campbell D, Chernoff J, Field J, Marmorstein R, Kissil JL. FRAX597, a small molecule inhibitor of the p21-activated kinases, inhibits tumorigenesis of NF2-associated schwannomas. The Journal of biological chemistry. 2013.
576. Eggenhofer E, Doenecke A, Renner P, Slowik P, Piso P, Geissler EK, Schlitt HJ, Dahlke MH, Popp FC. High volume naked DNA tail-vein injection restores liver function in Fah-knock out mice. J Gastroenterol Hepatol. 2010;25(5):1002-1008.
577. Rosen ED, Walkey CJ, Puigserver P, Spiegelman BM. Transcriptional regulation of adipogenesis. Genes Dev. 2000;14(11):1293-1307.
578. Wu Z, Rosen ED, Brun R, Hauser S, Adelmant G, Troy AE, McKeon C, Darlington GJ, Spiegelman BM. Cross-regulation of C/EBP alpha and PPAR gamma controls the transcriptional pathway of adipogenesis and insulin sensitivity. Mol Cell. 1999;3(2):151-158.
579. Farmer SR. Transcriptional control of adipocyte formation. Cell Metab. 2006;4(4):263-273.
580. Ross SE, Hemati N, Longo KA, Bennett CN, Lucas PC, Erickson RL, MacDougald OA. Inhibition of adipogenesis by Wnt signaling. Science. 2000;289(5481):950-953.
581. Bennett CN, Ross SE, Longo KA, Bajnok L, Hemati N, Johnson KW, Harrison SD, MacDougald OA. Regulation of Wnt signaling during adipogenesis. The Journal of biological chemistry. 2002;277(34):30998-31004.
582. Longo KA, Wright WS, Kang S, Gerin I, Chiang SH, Lucas PC, Opp MR, MacDougald OA. Wnt10b inhibits development of white and brown adipose tissues. The Journal of biological chemistry. 2004;279(34):35503-35509.
583. Wright WS, Longo KA, Dolinsky VW, Gerin I, Kang S, Bennett CN, Chiang SH, Prestwich TC, Gress C, Burant CF, Susulic VS, MacDougald OA. Wnt10b inhibits obesity in ob/ob and agouti mice. Diabetes. 2007;56(2):295-303.
584. Moldes M, Zuo Y, Morrison RF, Silva D, Park BH, Liu J, Farmer SR. Peroxisome-proliferator-activated receptor gamma suppresses Wnt/beta-catenin signalling during adipogenesis. Biochem J. 2003;376(Pt 3):607-613.
585. Li FQ, Singh AM, Mofunanya A, Love D, Terada N, Moon RT, Takemaru K. Chibby promotes adipocyte differentiation through inhibition of beta-catenin signaling. Mol Cell Biol. 2007;27(12):4347-4354.
586. Waki H, Park KW, Mitro N, Pei L, Damoiseaux R, Wilpitz DC, Reue K, Saez E, Tontonoz P. The small molecule harmine is an antidiabetic cell-type-specific regulator of PPARgamma expression. Cell Metab. 2007;5(5):357-370.

238
587. Christodoulides C, Laudes M, Cawthorn WP, Schinner S, Soos M, O'Rahilly S, Sethi JK, Vidal-Puig A. The Wnt antagonist Dickkopf-1 and its receptors are coordinately regulated during early human adipogenesis. J Cell Sci. 2006;119(Pt 12):2613-2620.
588. Challa TD, Beaton N, Arnold M, Rudofsky G, Langhans W, Wolfrum C. Regulation of adipocyte formation by GLP-1/GLP-1R signaling. The Journal of biological chemistry. 2012;287(9):6421-6430.
589. Yang J, Ren J, Song J, Liu F, Wu C, Wang X, Gong L, Li W, Xiao F, Yan F, Hou X, Chen L. Glucagon-like peptide 1 regulates adipogenesis in 3T3-L1 preadipocytes. Int J Mol Med. 2013;31(6):1429-1435.
590. Gleeson MH, Bloom SR, Polak JM, Henry K, Dowling RH. Endocrine tumour in kidney affecting small bowel structure, motility, and absorptive function. Gut. 1971;12(10):773-782.
591. Stevens FM, Flanagan RW, O'Gorman D, Buchanan KD. Glucagonoma syndrome demonstrating giant duodenal villi. Gut. 1984;25(7):784-791.
592. Rowland KJ, Brubaker PL. Life in the crypt: a role for glucagon-like peptide-2? Mol Cell Endocrinol. 2008;288(1-2):63-70.
593. Rowland KJ, Brubaker PL. The "cryptic" mechanism of action of glucagon-like peptide-2. Am J Physiol Gastrointest Liver Physiol. 2011;301(1):G1-8.
594. Hein GJ, Baker C, Hsieh J, Farr S, Adeli K. GLP-1 and GLP-2 as yin and yang of intestinal lipoprotein production: evidence for predominance of GLP-2-stimulated postprandial lipemia in normal and insulin-resistant states. Diabetes. 2013;62(2):373-381.
595. Trivedi S, Wiber SC, El-Zimaity HM, Brubaker PL. Glucagon-like peptide-2 increases dysplasia in rodent models of colon cancer. Am J Physiol Gastrointest Liver Physiol. 2012;302(8):G840-849.
596. Körner M, Rehmann R, Reubi JC. GLP-2 receptors in human disease: high expression in gastrointestinal stromal tumors and Crohn's disease. Mol Cell Endocrinol. 2012;364(1-2):46-53.
597. Dubé PE, Forse CL, Bahrami J, Brubaker PL. The essential role of insulin-like growth factor-1 in the intestinal tropic effects of glucagon-like peptide-2 in mice. Gastroenterology. 2006;131(2):589-605.
598. Jeppesen PB. Teduglutide, a novel glucagon-like peptide 2 analog, in the treatment of patients with short bowel syndrome. Therap Adv Gastroenterol. 2012;5(3):159-171.
599. Blonski W, Buchner AM, Aberra F, Lichtenstein G. Teduglutide in Crohn's disease. Expert Opin Biol Ther. 2013;13(8):1207-1214.

239
600. Liu X, Murali SG, Holst JJ, Ney DM. Enteral nutrients potentiate the intestinotrophic action of glucagon-like peptide-2 in association with increased insulin-like growth factor-I responses in rats. Am J Physiol Regul Integr Comp Physiol. 2008;295(6):R1794-1802.
601. Kannen V, Garcia SB, Stopper H, Waaga-Gasser AM. Glucagon-like peptide 2 in colon carcinogenesis: possible target for anti-cancer therapy? Pharmacol Ther. 2013;139(1):87-94.

240
9 Appendices

241
9.1 Aged Pak1-/- mice exhibit reduced whole body fat
This is described in Appendix 1, on page 242.
9.2 Aged Pak1-/- mice have comparable hepatic fat content This is described in Appendix 2, on page 243.
9.3 Aged Pak1-/- mice have reduced circulating GLP-2 levels This is described in Appendix 3, on page 244.

Appendix 1 Aged Pak1-/- mice exhibit reduced whole body fat. (A) Magnetic resonance imaging (MRI) was performed in aged mice. Adipose tissue was measured and was used to calculate whole-body fat volume. The Pak1-/- (KO) mice have moderately reduced whole-body fat volume (B) Serial MRI scans of one representative wild-type (Mouse 3, top) and one Pak1-/-animal (Mouse 4, bottom) are shown. WT, n=4. KO, n=5.
242
A
B
0
2000
4000
6000
8000
10000
Who
le-b
ody
fat v
olum
e (m
m^3
) *
Pak1-KO
Mou
se 3
(wild
-type
) M
ouse
4 (P
ak1-
KO
)
Wild-type

Appendix 2 Aged Pak1-/- mice have comparable hepatic fat content. Magnetic resonance imaging (MRI) was performed in aged mice, followed by spectral analysis of hepatic fat content and liver triglyceride measurement. (A) Hepatic fat content of aged wild-type (WT) and Pak1-/- (KO) mice, (B) Representative spectral analyses of one WT mouse (Mouse 3, top) and one KO mouse (Mouse 4, bottom), (C) Liver triglyceride content. WT, n=4. KO, n=5.
Mouse 3 (wild-type)
Mouse 4 (Pak1-KO)
3E7
0
2E7
1E7
10 5 7.5 0 2.5 Frequency (ppm)
1 1.5 0.5
2E5
-2E5
0
Frequency (ppm)
0
2E7
1E7
10 5 7.5 0 2.5 Frequency (ppm)
3E5
0
1.5E5
1 1.5 0.5 Frequency (ppm)
0
0.5
1
1.5
2
2.5
3
Hep
atic
fat c
onte
nt (%
)
MRI hepatic fat
Wild-type Pak1-KO
0
1
2
3
4
5
6
Trig
lyce
ride
co
ncen
trat
ion
(m
g/dL
per
ug
prot
ein)
Liver triglyceride
Wild-type Pak1-KO
A
C
B
243

Appendix 3 Aged Pak1-/- mice have reduced circulating GLP-2 levels. Fasting plasma GLP-2 levels were measured using Yanaihara ELISA kit (YK142). Wild-type, n=10; Pak1-/-, n=12.
0.0
0.5
1.0
1.5
Plas
ma
GLP
-2 (n
g/m
L)
Wild-type
Pak1-/-
*
244