Improving clustering with metabolic pathway data
10
Milone et al. BMC Bioinformatics 2014, 15:101 http://www.biomedcentral.com/1471-2105/15/101 RESEARCH ARTICLE Open Access Improving clustering with metabolic pathway data Diego H Milone 1*† , Georgina Stegmayer 1† , Mariana López 2 , Laura Kamenetzky 2 and Fernando Carrari 2 Abstract Background: It is a common practice in bioinformatics to validate each group returned by a clustering algorithm through manual analysis, according to a-priori biological knowledge. This procedure helps finding functionally related patterns to propose hypotheses for their behavior and the biological processes involved. Therefore, this knowledge is used only as a second step, after data are just clustered according to their expression patterns. Thus, it could be very useful to be able to improve the clustering of biological data by incorporating prior knowledge into the cluster formation itself, in order to enhance the biological value of the clusters. Results: A novel training algorithm for clustering is presented, which evaluates the biological internal connections of the data points while the clusters are being formed. Within this training algorithm, the calculation of distances among data points and neurons centroids includes a new term based on information from well-known metabolic pathways. The standard self-organizing map (SOM) training versus the biologically-inspired SOM (bSOM) training were tested with two real data sets of transcripts and metabolites from Solanum lycopersicum and Arabidopsis thaliana species. Classical data mining validation measures were used to evaluate the clustering solutions obtained by both algorithms. Moreover, a new measure that takes into account the biological connectivity of the clusters was applied. The results of bSOM show important improvements in the convergence and performance for the proposed clustering method in comparison to standard SOM training, in particular, from the application point of view. Conclusions: Analyses of the clusters obtained with bSOM indicate that including biological information during training can certainly increase the biological value of the clusters found with the proposed method. It is worth to highlight that this fact has effectively improved the results, which can simplify their further analysis. The algorithm is available as a web-demo at http://fich.unl.edu.ar/sinc/web-demo/bsom-lite/. The source code and the data sets supporting the results of this article are available at http://sourceforge.net/projects/sourcesinc/files/bsom. Keywords: Clustering, SOM training, Pathway data Background In the biology field, clustering is implemented under the guilt-by-association principle [1], that is to say, the assumption that compounds involved in a biological pro- cess behave similarly under the control of the same regu- latory networks [2]. It is assumed that if a metabolic com- pound with unknown function varies in a similar fashion with a known metabolite from a defined metabolic path- way, it can be inferred that the unknown element is also *Correspondence: [email protected] † Equal contributors 1 Research Center for Signals, Systems and Computational Intelligence, sinc(i), FICH-UNL, CONICET, Ciudad Universitaria UNL, (3000) Santa Fe, Argentina Full list of author information is available at the end of the article likely to be involved in the same pathway [3]. Therefore, one cluster that groups some metabolites indicates that they can be connected within common metabolic path- ways. This pathway-based approach to identify metabolic traits results in more biological information (hypothe- sis) that has to be tested through the design of biological experiments (wet experiments) [4]. From this perspective, it could be useful to perform a detailed inspection of the patterns inside a cluster to determine memberships to known metabolic pathways. Due to the limitations of traditional algorithms, com- putational intelligence has been recently applied to bioin- formatics with promising results [5,6]. For example, self-organizing maps (SOMs) [7] are a special class of neu- ral networks that use competitive learning. SOMs can © 2014 Milone et al.; licensee BioMed Central Ltd. This is an Open Access article distributed under the terms of the Creative Commons Attribution License (http://creativecommons.org/licenses/by/2.0), which permits unrestricted use, distribution, and reproduction in any medium, provided the original work is properly credited.
-
Upload
independent -
Category
Documents
-
view
1 -
download
0
Transcript of Improving clustering with metabolic pathway data

Milone et al. BMC Bioinformatics 2014, 15:101http://www.biomedcentral.com/1471-2105/15/101
RESEARCH ARTICLE Open Access
Improving clustering with metabolic pathwaydataDiego H Milone1*†, Georgina Stegmayer1†, Mariana López2, Laura Kamenetzky2 and Fernando Carrari2
Abstract
Background: It is a common practice in bioinformatics to validate each group returned by a clustering algorithmthrough manual analysis, according to a-priori biological knowledge. This procedure helps finding functionally relatedpatterns to propose hypotheses for their behavior and the biological processes involved. Therefore, this knowledge isused only as a second step, after data are just clustered according to their expression patterns. Thus, it could be veryuseful to be able to improve the clustering of biological data by incorporating prior knowledge into the clusterformation itself, in order to enhance the biological value of the clusters.
Results: A novel training algorithm for clustering is presented, which evaluates the biological internal connections ofthe data points while the clusters are being formed. Within this training algorithm, the calculation of distances amongdata points and neurons centroids includes a new term based on information from well-known metabolic pathways.The standard self-organizing map (SOM) training versus the biologically-inspired SOM (bSOM) training were testedwith two real data sets of transcripts and metabolites from Solanum lycopersicum and Arabidopsis thaliana species.Classical data mining validation measures were used to evaluate the clustering solutions obtained by both algorithms.Moreover, a new measure that takes into account the biological connectivity of the clusters was applied. The results ofbSOM show important improvements in the convergence and performance for the proposed clustering method incomparison to standard SOM training, in particular, from the application point of view.
Conclusions: Analyses of the clusters obtained with bSOM indicate that including biological information duringtraining can certainly increase the biological value of the clusters found with the proposed method. It is worth tohighlight that this fact has effectively improved the results, which can simplify their further analysis.The algorithm is available as a web-demo at http://fich.unl.edu.ar/sinc/web-demo/bsom-lite/. The source code andthe data sets supporting the results of this article are available at http://sourceforge.net/projects/sourcesinc/files/bsom.
Keywords: Clustering, SOM training, Pathway data
BackgroundIn the biology field, clustering is implemented underthe guilt-by-association principle [1], that is to say, theassumption that compounds involved in a biological pro-cess behave similarly under the control of the same regu-latory networks [2]. It is assumed that if a metabolic com-pound with unknown function varies in a similar fashionwith a known metabolite from a defined metabolic path-way, it can be inferred that the unknown element is also
*Correspondence: [email protected]†Equal contributors1Research Center for Signals, Systems and Computational Intelligence, sinc(i),FICH-UNL, CONICET, Ciudad Universitaria UNL, (3000) Santa Fe, ArgentinaFull list of author information is available at the end of the article
likely to be involved in the same pathway [3]. Therefore,one cluster that groups some metabolites indicates thatthey can be connected within common metabolic path-ways. This pathway-based approach to identify metabolictraits results in more biological information (hypothe-sis) that has to be tested through the design of biologicalexperiments (wet experiments) [4]. From this perspective,it could be useful to perform a detailed inspection of thepatterns inside a cluster to determine memberships toknown metabolic pathways.Due to the limitations of traditional algorithms, com-
putational intelligence has been recently applied to bioin-formatics with promising results [5,6]. For example,self-organizing maps (SOMs) [7] are a special class of neu-ral networks that use competitive learning. SOMs can
© 2014 Milone et al.; licensee BioMed Central Ltd. This is an Open Access article distributed under the terms of the CreativeCommons Attribution License (http://creativecommons.org/licenses/by/2.0), which permits unrestricted use, distribution, andreproduction in any medium, provided the original work is properly credited.

Milone et al. BMC Bioinformatics 2014, 15:101 Page 2 of 10http://www.biomedcentral.com/1471-2105/15/101
represent complex high-dimensional input patterns intoa simpler low-dimensional discrete map, with prototypevectors that can be visualized in a two-dimensional latticestructure, while preserving the proximity relationships ofthe original data as much as possible. SOMs have beenused for unsupervised clustering of transcriptome pro-files [8,9] as well as metabolites [10]. For example in [11]SOM clustering was used for the analysis of Arabidopsisthaliana datasets, helping in the hypothesis validation ofa metabolic mechanism responding to sulfur deficiency.SOMs have been recently proposed also for the integra-tion and knowledge discovery of coordinated variationsin transcriptomics and metabolomics data [12], and asoftware tool for SOM application has been designed togive support to the data mining task of datasets derivedfrom different databases, providing user-friendly inter-face and several visualization tools easy to understand bynon-expert users [13].When evaluating a clustering solution, it is a common
(and necessary) practice to validate each group returnedby a clustering algorithm through manual analysis andvisual inspection, according to a-priori biological knowl-edge. Traditionally, the known annotations are used onlyas a second step, after data have been clustered accordingto their variation patterns. Only those clusters in whichmany genes (and proteins/metabolites) are annotatedwithin the same category (for example, the sameMapManBIN [14] or Gene Ontology (GO) terms [15]), are thenselected for further analysis [16-19]. For each pattern, itsannotations and memberships to well-known metabolicpathways are generally assessed. The results obtained afterinspection of each cluster, by hand, may indicate function-ally related patterns. Automatic pos-clustering validationproposals like “gene set enrichment analysis” [20] focus ongroups of genes that share common biological function,chromosomal location or regulation. Similarly, Protein-Protein-Interactions (PPI) derived metrics can be usedin combination with genomic data to validate clusterswith respect to their biological relevance [21]. These met-rics, however, can only be applied to clusters of genes.Recently, a biologically inspired validity measure that canbe applied not only to groups of genes but also to genesand metabolites together has been proposed [22].Actually, there is a growing interest in improving the
cluster analysis of biological data by incorporating suchprior basic knowledge into the clustering itself, in orderto increase the biological meaning of the clusters that aresubjected to later scrutiny. In the past few years, severalmethods have been introduced with that aim, since inte-grating a biological similarity measure or biological infor-mation into a clustering method can lead to the potentialenhancement in the performance of the clustering, as aresult of the good correlation between biological similar-ity and gene co-expression levels [23,24]. For example, the
distance function built by [25] combines information fromexpression data and the proximity of the proteins in ametabolic pathway network. In [26] a similar approach ispresented, where a graph is used based on the GO struc-ture. The work of [27] proposed shrinking the distancesbetween pairs of genes sharing a common annotation. Infact, the distancemeasure between two genes can bemod-ified to be a linear combination of the similarity of theirexpression profiles and their functional similarity [28-30].Moreover, a classical clustering method can be modifiedto work with such a newly defined metric, for example, byslicing a hierarchical clustering tree obtained from a genedataset to get clusters that are as consistent as possiblewith well-known gene annotations [31]. Another exam-ple of using heterogeneous genomic data into a clusteringalgorithm is proposed by [32], with the aim of identify-ing highly correlated genes more effectively than usingonly expression data or a single data source. Most of theseclustering methods utilize only the annotations providedby the GO ontology or its hierarchical structure throughthe use of similarity measures between terms. AlthoughGO is heavily used in systems biology, redundancy andproblems with stability over time have been recently indi-cated [33]. Besides, this information, cannot be associatedto other molecular entities such as metabolites. It canbe used for genes and their products only. Addition-ally, there are many genes that are currently unannotatedand this situation is generally handled by excluding themfrom the analysis or by considering them as exceptionalcases.In summary, it can be anticipated that the integration
of -omics measurements with additional relevant bio-logical information is expected to improve the qualityand the biological significance of unsupervised clustering.This paper proposes and illustrates this integrative prin-ciple, not only for genomic data but also for metabolicand integrated datasets. We present a novel training algo-rithm that combines biological similarities derived frommetabolic pathways information and demonstrate that itsapplication improves the quality of the clustering. Thisnew approach weights the biological connectivity of thepatterns (genes and/or metabolites) during training of theclustering method. This can be achieved through the useof a new term for the biological assessment of the clus-ters while they are being formed. The algorithm takesinto account not only the classical Euclidean distancebetween patterns, but also a biological term assessed bymeans of the number of common pathways. The pro-posed approach was tested on a set of transcriptomeand metabolome data from Solanum lycopersicum andArabidopsis thaliana, showing improved clusters forma-tion when using the proposed biologically inspired SOM(bSOM), in comparison to the standard SOM train-ing (sSOM). This improvement is demonstrated by the

Milone et al. BMC Bioinformatics 2014, 15:101 Page 3 of 10http://www.biomedcentral.com/1471-2105/15/101
increase of biological connections in the clusters found bybSOM and the biological analysis of the clusters found.
MethodsIn the following section we explain in detail the newbiologically-inspired algorithm for SOM training. Afterthat, the validation measures used for performance com-parison among training algorithms are presented. Finally,the datasets used for SOM training are described.
Improved SOM training usingmetabolic pathwaysSOM clustering is based on nodes (neurons) that competein response to a given input. Inputs are fully connectedto the output nodes. Each output node corresponds toa cluster and is associated with a prototype or synapticweight vector [34]. Given an input pattern, competitionamong neurons takes place, when their similarity (or dis-tance) to the input is computed. Thus, the neurons in theoutput layer compete with each other, and only the closestto the input becomes activated or fired. The weight vectorof this winning neuron is further moved towards (closerto) the input pattern. This competitive learning paradigmallows learning for the neuron that best matches the giveninput pattern and it is also known as winner-takes-alllearning [35].When competition among the neurons is complete,
SOM updates not only the weight vector of the winningneuron but also a set of weights within its neighborhood,according to a neighborhood function �. This functiondefines the neurons that will be affected by the changes inthe winning neuron. We have used the standard squaredneighborhood. Thus for example, if the radius of theneighborhood is 1, all the 8 neurons in touch with thewinning one will be updated as well. At the beginning oftraining, � has a radius equal to a quarter of the size ofthe map. During training, this radius is reduced linearlywith training epochs, until reaching 0 (that is to say, at thispoint only the winning neuron is updated). The rate ofthe modifications at different neurons is a monotonicallydecreasing scalar function of the training epochs. Its formis not so important as long as its value is large at the begin-ning of the process, gradually reducing it to a fraction of itin successive steps [7].The goal of SOMs is to represent complex high-
dimensional input patterns into a simpler low-dimensional discrete map, with prototype vectors that canbe located in a two-dimensional lattice structure, whilepreserving the proximity relationships of the originaldata as much as possible [36]. SOM structures the outputnodes (neurons) in such a way that nodes in closer prox-imity are more similar to each other than to other nodesthat are farther apart. Having finished the training, inputpatterns are projected into the lattice, corresponding toadjacent neurons connected to each other through the
neighborhood function, giving a clear topology of how thenetwork fits into the input space [35]. In this projection,an input pattern is associated to a neuron (cluster) simplyaccording to minimum distance to all neuron prototypes.In Algorithm 1 we present a new algorithm for SOM
training over biological datasets (bSOM). The followingnotation is used: X is the dataset formed by x� data sam-ples; �m is the set of samples that have been grouped inthe cluster m and W is the set of the wm centroids ofthe clusters. We propose the use of a combination of theclassical Euclidean distance among patterns and the neu-rons centroids, plus an additional term that measures theinternal biological connectivity of the patterns groupedin a cluster (line 7). The distance is computed using theweighted sum
d�m = (1 − α) ε�m + α b�m, (1)where α is a regularization parameter that can be var-ied between 0 and 1 and controls the weight given to thebiological distance during training; ε�m = ‖x� − wm‖2
Algorithm 1: SOM training using metabolic pathways(bSOM).Inputs :
X: training setn: map size (n× n)α: biological weightρ: matrix of metabolic pathway connections
Outputs:�: clustersW : centroids
beginN = |X|k = n× nDefine neurons neighborhood function �
Initialize the map by choosing random weightsvalues wm� ∈[−0.5,+0.5]repeat
Select a pattern at random x� Calculate thebiological contribution:
��∈m = �m ∪ x�, π�∈m = 2∑∀i,j/xi ,xj∈��∈m ρij
|��∈m|2−|��∈m|��/∈m = �m − x�, π�/∈m = 2
∑∀i,j/xi ,xj∈��/∈m ρij
|��/∈m|2−|��/∈m|b�m = π�/∈m−π�∈m
max{π�/∈m,π�∈m}Search for the winning neuron:m∗ = argmin∀m
{(1− α) ε�m + α b�m}Adapt weights wm of neurons in theneighborhood �m∗Update �
until no significative changes in wm;�m ← x�/(1−α) ε�m+α b�m < (1−α) ε�q+α b�q ,
∀q �= m, 0 < q ≤ kend

Milone et al. BMC Bioinformatics 2014, 15:101 Page 4 of 10http://www.biomedcentral.com/1471-2105/15/101
is the standard Euclidean distance between a pattern �
and a neuron prototype wm; and b�m is the biologicalcontribution of a pattern � to a clusterm, computed as
b�m = π�/∈m − π�∈mmax {π�/∈m,π�∈m} , (2)
where π�/∈m is the average number of biological connec-tions among all the patterns clustered in the neuronm notincluding the pattern �; and π�∈m is the average numberof biological connections among all the patterns clusteredin the neuron m including the pattern �. The averagebiological connections are calculated using a metabolicpathways connection matrix ρ, where each element ρij hasthe number of metabolic pathways that involve both pat-tern in row i and pattern in column j. This is calculated bysimply counting the number of pathways in common, fol-lowing the same procedure for metabolites as well as fortranscripts.The biological term b�m measures how close (or distant)
is a pattern � to a neuron m, in terms of improvement ofthe average number of common pathways in that cluster.When a pattern has b�m > 0 with respect to neuron m, itmeans that if the pattern � were assigned to the neuronm,the average number of common pathways among all the
data patterns clustered in that neuronwould be decreased.Instead, if b�m < 0, the assignment of the pattern � to theneuron m would certainly increment the number of aver-age common pathways, clearly increasing the biologicalvalue of that cluster. The parameter α is used to balancebetween the two goals: when α = 0, d�m becomes the clas-sical Euclidean distance and the algorithm becomes thestandard SOM clustering (sSOM); and when α = 1 thealgorithm completely disregards the expression measuresand groups data only according to biological connections.In principle, it cannot be stated that there is any optimumα, it depends on the weight that is given to the relatedbiological information in the final analysis.An artificial “toy-example” data set has been used to
illustrate the new algorithm. It is shown in Figure 1. Theset consists of four groups of 100 data points each, fol-lowing Gaussian distributions. In Figure 1a) the ρ matrixcorresponding to this data set is shown. For simplicitypurposes, the matrix is stored as upper triangular. Thecolor of the pixels indicate the existence of biological con-nections among elements. In this artificial example, fourgroups biologically connected can be distinguished bylooking at the main diagonal (black pixels). The rest ofthe data points do not have pathways in common (white
100 200 300 400
50
a b
c d
100
150
200
250
300
350
4000 0.05 0.1 0.15 0.2
0
0.05
0.1
0.15
0.2α = 0 .00
1234
0 0.05 0.1 0.15 0.20
0.05
0.1
0.15
0.2α = 0 .50
1234
0 0.05 0.1 0.15 0.20
0.05
0.1
0.15
0.2α = 1 .00
1234
Figure 1 Example of SOM training using metabolic pathways (bSOM) with an artificial data set. a) ρ matrix; b) α = 0.00; c) α = 0.50;d) α = 1.00 (the two dimensions in this simplified example could represent measures for two different treatments in real data). Each cluster foundby the algorithm is indicated with a different color (red, green, cyan and purple). Groups of biologically related points are indicated with differentmarkers (squares, diamonds, circles and triangles).

Milone et al. BMC Bioinformatics 2014, 15:101 Page 5 of 10http://www.biomedcentral.com/1471-2105/15/101
pixels). In the remaining sub-figures, the data points dis-tribution is shown, as well as the groups and the centroidsof each cluster (black dots) obtained for n = 2 (that is, 4neurons). Each cluster found by the algorithm is indicatedwith a different color. The points located at the extremesof the groups are biologically related among them, as indi-cated with different markers (squares, diamonds, circlesand triangles) which correspond to the four groups ofhigh biological connections present in the ρ matrix. InFigure 1b), α = 0.00 is used (equivalent to sSOM). It canbe seen that the neurons centroids are located approx-imately in the euclidean center of each distribution. Inthe case of α = 0.50, shown in Figure 1c), the Euclideandistance as well as the biological connections are usedto form the clusters. It can be noticed that the centroidshere have been moved in order to group in the same clus-ter some of the patterns biologically connected. At theextreme, with α = 1.00 in Figure 1d), only the groupsthat have common pathways among their elements forma cluster and determine the centroids location. As it canbe clearly seen from this example, when α is increasedthe biological connections among elements increase theirdirect influence on the clustering results.
ValidationmeasuresAfter the application of an unsupervised mining tech-nique, it is quite difficult to validate the obtained results. Aset of objective measures can be used to quantify the qual-ity of the clusters obtained by different available methods[34]. A new kind of biological measure is presented aswell, that evaluates the metabolic connections existing inthe clustering partition found. The work of [37] presentsa summary of different types of validation measures thatcan be used to qualify a clustering solution. In this studywe have used:
CompactnessIt measures intracluster compactness or homogeneity asCj = 1/|�j|∑∀xi∈�j ‖xi − wj‖2, For a global measure ofcompactness, the average over all k clusters is calculatedas C = 1/k
∑j Cj. Values of C close to 0 indicate more
compact clusters.
SeparationIt quantifies the degree of separation between individualclusters, measuring the mean Euclidean distance amongcluster centroids as S = 2/
(k2 − k
)∑ki=1
∑kj=i+1 ‖wi −
wj‖2, where S close to 1 indicates more separated clusters.
Davies-Bouldin indexThis is a combination of the previous two measures anda popular metric for evaluating clustering algorithms [38].DB index is a function of the ratio of the sum of within-cluster scatter to between-cluster separation. This is an
indication of clusters overlap, thereforeDB close to 0 indi-cates that the clusters are compact and far from eachother.
Dunn indexIt combines dissimilarity between clusters and their diam-eters, based on the idea of identifying cluster sets thatare compact and well separated. D index measures inter-cluster distances (separation) over intra-cluster distances(compactness). If a clustering partition contains well-separated clusters, the distances among them are usuallylarge and their diameter is expected to be small. Therefore,a larger D value means better cluster configuration.
Biological internal connectivityFor the evaluation of the clusters from the viewpoint oftheir biological meaning, we use a measure defined asfollows:
P = − log
⎛⎝1k
k∑m=1
pmpm∗
⎞⎠ , (3)
where
pm = 1+∑∀i/xi∈�m∀j/xj∈�m
j �=i
ρij
is the number of common pathways among patternsgrouped in cluster m, with ρij the number of pathways incommon between patterns i and j, and
pm∗ = 1+∑∀i/xi∈�m∀j �=i
ρij,
is the number of all the possible shared pathways amongpatterns grouped in cluster m and any other pattern inthe dataset. A P value close to 0 indicates more biologi-cally significant clusters. For this measure, non empty andannotated clusters are taken into account.
Global Measure for Linked Clustering (GMLC)For evaluating both coherence and biological significanceof clusters found over biological datasets, we have used theG measure which is a biologically-inspired validity mea-sure for comparison of clustering methods over metabolicdatasets [22]. It is defined as the sum of H , which is a mea-sure of the flatness of the distribution of patterns alongclusters, that indicates if the data samples have beencoherently grouped when having a sign-inverted value,and P which evaluated biological internal connectivity, aspreviously explained.
DatasetsIn this subsection, the datasets used for SOM trainingare described. The Kyoto Encyclopedia of Genes andGenomes (KEGG) [39,40] pathway database was used for
Milone et al. BMC Bioinformatics 2014, 15:101 Page 6 of 10http://www.biomedcentral.com/1471-2105/15/101
calculation of the biological connectivity. All pathwaysin which the measured elements participated have beenconsidered.
Solanum lycopersicum datasetThe first biological dataset used in this paper involvesmetabolic and transcriptional profiles from IntrogressionLines (ILs) of Solanum lycopersicum. The ILs harbor,at certain chromosomes segments, introgressed por-tions of the wild species (Solanum pennellii). After log-transforming the expression values over the entire dataset,genes with no significant change were discarded fromfurther analysis. As a result of the pre-processing andselection steps, 1159 genes were selected. The metabolicdata were obtained analyzing polar extracts of tomatofruits, through Gas Chromatography coupled to MassSpectrometry (GC-MS). The metabolite profiling tech-nique used allows the identification of approximately 80primary metabolic compounds. For each metabolite ineach IL, the log ratio of the mean of the replicates was cal-culated. In the selection step only 70 metabolites (havinglog ratio greater than 0.1) were kept for data integrationand cluster analysis. Further details on data selection canbe found on [12]. This data set has a size of 1229 datapoints.
Arabidopsis thaliana datasetThe second biological dataset comprises primarymetabo-lites and transcripts measured in Arabidopsis thalianaleaves. The integrated analysis of this data is aimed atstudying the effects of the cold on circadian regulatedgenes in this plant [41]. In this study we included metabo-lites and transcripts under light-dark cycles at two controltemperatures (20°C and 4°C). Genes involved in diurnalcycle and cold-stress responses were selected for fur-ther study. More details on how the data were processed,filtered and normalized can be found in [41]. A total of
1549 genes and 51metabolites were used in the integratedanalysis, resulting in a total of 1600 data patterns.
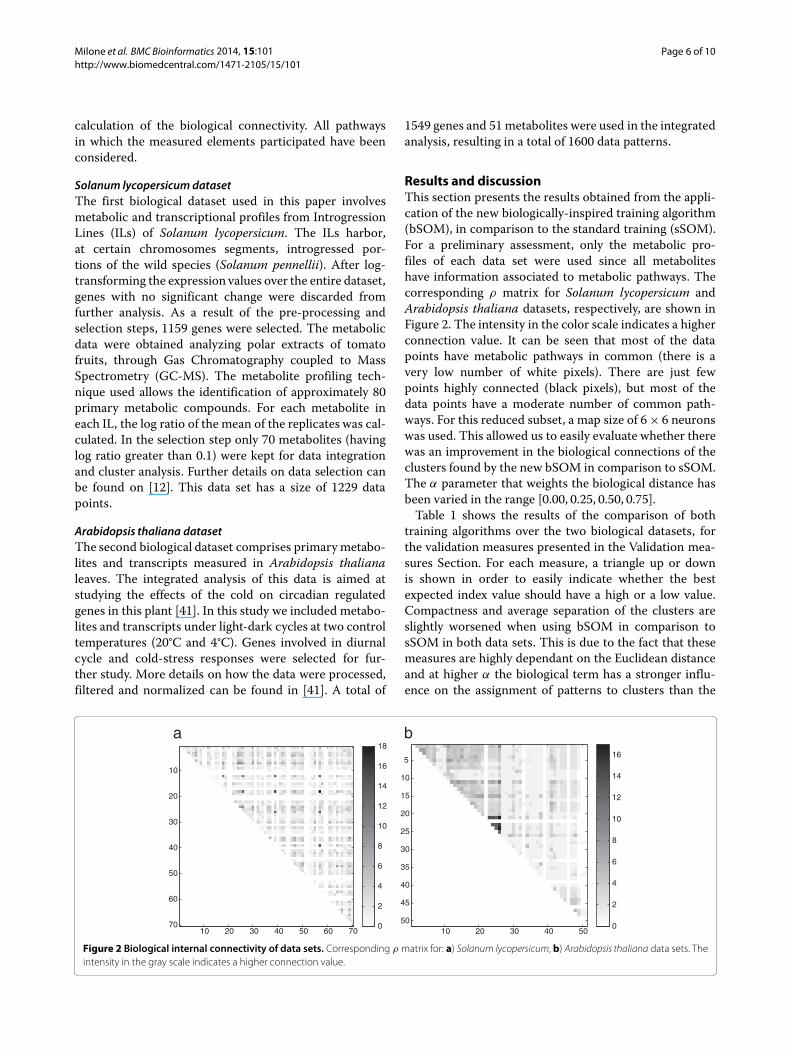
Results and discussionThis section presents the results obtained from the appli-cation of the new biologically-inspired training algorithm(bSOM), in comparison to the standard training (sSOM).For a preliminary assessment, only the metabolic pro-files of each data set were used since all metaboliteshave information associated to metabolic pathways. Thecorresponding ρ matrix for Solanum lycopersicum andArabidopsis thaliana datasets, respectively, are shown inFigure 2. The intensity in the color scale indicates a higherconnection value. It can be seen that most of the datapoints have metabolic pathways in common (there is avery low number of white pixels). There are just fewpoints highly connected (black pixels), but most of thedata points have a moderate number of common path-ways. For this reduced subset, a map size of 6× 6 neuronswas used. This allowed us to easily evaluate whether therewas an improvement in the biological connections of theclusters found by the new bSOM in comparison to sSOM.The α parameter that weights the biological distance hasbeen varied in the range [0.00, 0.25, 0.50, 0.75].Table 1 shows the results of the comparison of both
training algorithms over the two biological datasets, forthe validation measures presented in the Validation mea-sures Section. For each measure, a triangle up or downis shown in order to easily indicate whether the bestexpected index value should have a high or a low value.Compactness and average separation of the clusters areslightly worsened when using bSOM in comparison tosSOM in both data sets. This is due to the fact that thesemeasures are highly dependant on the Euclidean distanceand at higher α the biological term has a stronger influ-ence on the assignment of patterns to clusters than the
10 20 30 40 50 60 70
10
20
30
40
50
60
70 0
2
4
6
8
10
12
14
16
18
10 20 30 40 50
5
ba
10
15
20
25
30
35
40
45
500
2
4
6
8
10
12
14
16
Figure 2 Biological internal connectivity of data sets. Corresponding ρ matrix for: a) Solanum lycopersicum, b) Arabidopsis thaliana data sets. Theintensity in the gray scale indicates a higher connection value.

Milone et al. BMC Bioinformatics 2014, 15:101 Page 7 of 10http://www.biomedcentral.com/1471-2105/15/101
Table 1 Validationmeasures for SOM training: standard(sSOM) versus biological (bSOM) formetabolic datasets
sSOM bSOMα → 0.00 0.25 0.50 0.75
Solanum lycopersicum
C�
0.65 0.69 0.73 0.79
S�
0.66 0.65 0.59 0.49
DB� 9.56 31.00 13.90 19.05
D� 0.59 0.40 0.40 0.37
P�
3.58 2.74 2.58 2.08
G� 0.87 0.90 0.83 0.87
Arabidopsis thaliana
C�
0.48 0.55 0.64 0.65
S�
0.81 0.79 0.79 0.71
DB� 10.45 8.86 490 60.66
D� 0.32 0.24 0.50 0.54
P�
3.84 2.93 2.17 1.56
G� 0.65 0.67 0.52 0.48
Euclidean distance. The DB measure does not improvewhen using bSOM in any case, on the contrary, it getsworst scores. This can be expected since, in fact, thismeasure is designed to better qualify well-separated andhighly compact clusters (in the Euclidean sense) and, asexplained above, compactness and separation are wors-ened as α increases. Similar behavior has the Dunn indexfor the first data set, although improving with bSOM andα = 0.5 and α = 0.75 for the second dataset. Althoughthese two measures are a combination of compactnessand separation into one single index (Dunn qualifies clus-ters taking into account the same general criteria as DB)they present contradictory results. While DB uses theEuclidean distance of data to centroids in a direct way,Dunn measures the distance to the global centroid of alldata and not between data and each cluster centroid.With respect to measures that take into account the
biological information associated to the clusters obtained,considering the P measure, it is clearly and consistentlyimproved as α increases for the proposed algorithmwhen compared to sSOM, for all configurations and bothdatasets. As can be expected, at low α the improvement isnot so important but when α increases, clusters are morebiologically connected which is directly reflected by thismeasure, reaching the best possible result for this index atthemaximum α here considered. The significance of theseresults has been statistically tested by performing 100 re-samplings of 90% of the metabolites in both datasets, forall the methods (sSOM vs. bSOM with different α). AnANOVA was performed to test the null hypothesis inwhich the difference among the clustering results for thebiological connectivity measure (P) with different training
methods is not significant. The analysis revealed that theresults in the table show significant differences (p <
0.001). Finally, the G measure, which evaluates in a sin-gle index not only clusters quality but also their biologicalcontent, remains almost unchanged or even improves. Forthe first data set, G has almost the same value in all con-figurations. As α is increased on bSOM,G values improvefor the second data set, even at maximum α. In general,it can be stated that while a balance between homogene-ity and coherence is maintained, an improvement in thebiological connectivity of the clusters can be achieved.Table 2 shows the results of the comparison of both
training algorithms over the two full biological datasets(transcripts and metabolites). The Gap Statistic [42],intended to estimate adequate cluster numbers from adataset [43], was used to select the number of clustersfor the comparisons among methods. The selected mapsize was 10 × 10 neurons. Comparisons between sSOMand other clustering algorithms for the datasets used inthis study have already been done in [22]. It is worthto highlight the fact that, although all metabolites wereannotated, only a low proportion of the genes (approxi-mately 10%) were associated to metabolic pathways in theKEGG database. In this case, with so many clusters with-out related biological information, one should expect thatit will be very hard to enhance the results, even usinghigh α values. However, the results obtained in both casesshow that bSOM can work well even in this situation,improving the biological connections of the clusters. Con-sidering the classical data mining measures in Table 2,the results do not vary significantly between methods andconfigurations tested. For example, compactness as well
Table 2 Validationmeasures for SOM training: standard(sSOM) and biological (bSOM) for the full datasets
sSOM bSOMα → 0.00 0.25 0.50 0.75
Solanum lycopersicum
C�
0.79 0.80 0.80 0.81
S�
0.68 0.67 0.66 0.64
DB� 8.80 9.07 9.12 10.64
D� 0.18 0.14 0.13 0.26
P�
3.32 2.65 2.38 1.80
G� 1.09 0.63 0.59 0.52
Arabidopsis thaliana
C�
0.51 0.52 0.51 0.51
S�
1.00 1.00 1.00 1.00
DB� 13.30 12.02 10.35 12.19
D� 0.16 0.15 0.16 0.13
P�
3.13 3.10 2.80 2.00
G� 0.68 0.41 0.43 0.32

Milone et al. BMC Bioinformatics 2014, 15:101 Page 8 of 10http://www.biomedcentral.com/1471-2105/15/101
as separation remain almost unchanged in all cases. TheDB index is particularly influenced in the case of largeα since the Euclidean distance is almost disregarded forgrouping data points and thus the clusters get closer andlarger, which is highly penalized by this measure. TheDunn index is slightly worsened in most cases, improvingonly in one case with a large α in the first data set.Taking into consideration now only the measures that
evaluate the biological quality of the solutions (P andG), both present better results and it can be stated that,in general, the biological connectivity of the clusters isreally improved when using bSOM compared to sSOM, inboth datasets. The biological connectivity of the clustersis effectively improved when using bSOM in comparisonto sSOM, which is even achieved when both distances(Euclidean and biological) are equally considered (α =0.5). TheGmeasure also consistently obtains better scoreswhen α increases, in all configurations tested for eachmap. This means that enhanced clustering results can beachieved when using bSOM rather than sSOM, not onlywith respect to clusters quality but also from a biologicalpoint of view.For the full Arabidopsis dataset, we have also calcu-
lated the biological homogeneity index (BHI) [44] forsSOM and bSOM, which measures how homogeneousare biologically the clusters obtained. BHI evaluates ifgenes in the same cluster are also part of the same func-tional classes according toGO annotations. The BHI scoreobtained for sSOMwas 6.49%. For bSOMwith the same α
values reported in Table 2, the BHI scores were 6.57, 6.68and 7.53%. As can be seen, this independent measure alsoindicates that better biological clusters can be obtainedwith the proposed algorithm.Finally, to show an illustrative example of how bSOM
obtains better clustering results from a biological pointof view, a pathways analysis and validation has been per-formed over neurons selected at random from a SOMmapon the first data set. Table 3 shows comparative resultsregarding the data points that where clustered in the neu-rons by both algorithms and the Solanum lycopersicumdataset. The full statistics for all clusters in both datasetshave been presented in the previous tables.From a quantitative point of view, it can be seen that in
general bSOM can increase the number of common path-ways in the clusters for the same number of elements. Inparticular, in Cluster A the number of common pathwaysamong cluster elements is maintained, although bSOMcan achieve that result with less cluster elements. In Clus-ter B, for the same number of elements a higher numberof common metabolic pathways was obtained. In Clus-ter C, a better grouping allows finding common biologicalinformation, which could not be achieved by using thestandard training algorithm. Finally, cluster D exempli-fies how, for the same number of elements with related
Table 3 Detail of patterns and common pathways forsSOM vs. bSOM
Algorithm→ sSOM bSOM
Cluster A Serine Serine
Threonine Threonine
Valine Valine
Glycine Isoleucine
Lysine
Common ko00260, ko00290 ko00260, ko00290
pathways ko00970, map1060 ko00970, map1060
ko02010 ko02010
ko00460 ko00966
Cluster B Arginine Arginine
β-alanine Glycine
GABA Lysine
Common ko00330, ko00410 ko00310, ko00970
pathways ko04080 map1060, map1064
ko02010
Cluster C LE31F17 LE31F17
LE30O12∗ LE16F20
LE26F02∗
Common - ko00052
pathways ko00511, ko00531
ko00600, ko00604
Cluster D Sucrose Sucrose
Aspartate Glutamate
5oxoproline Proline
LE23B16∗
LE23N08∗
Common ko02010 ko02010
pathways ko00330, ko00970*does not participate in a well-known pathway.Gene transcript codes. LE31F17: beta-galactosidase (GB acc# AAC25984);LE16F20: beta-galactosidase (GB acc# AAC25984); LE30O12: no data; LE26F02:component of oligomeric golgi complex, putative (GB acc# XP_00251994);LE23B16: CDPK-related protein kinase (GB acc# AAZ83348); LE23N08: no data.Pathway codes. ko00260: Glycine, serine and threonine metabolism; ko00290:Valine, leucine and isoleucine biosynthesis; ko00970: Aminoacyl-tRNAbiosynthesis; map01060: Biosynthesis of plant secondary metabolites; ko02010:ABC transporters; ko00460: Cyanoamino acid metabolism; ko00966:Glucosinolate biosynthesis; ko00330: Arginine and proline metabolism; ko00410:beta-Alanine metabolism; ko04080: Neuroactive ligand-receptor interaction;ko00310: Lysine degradation; map01064: Biosynthesis of alkaloids derived fromornithine, lysine and nicotinic acid; ko00052: Galactose metabolism; ko00511:Other glycan degradation; ko00531: Glycosaminoglycan degradation; ko00600:Sphingolipidmetabolism; ko00604: Glycosphingolipid biosynthesis.
biological information in a cluster, more common path-ways can be found by bSOM (note that although thecluster found by bSOM has 5 elements, only 3 of themparticipate in known pathways).

Milone et al. BMC Bioinformatics 2014, 15:101 Page 9 of 10http://www.biomedcentral.com/1471-2105/15/101
The previous examples suggest that bSOM is able tobetter group the amino acids glycine, serine, threonine,valine, leucine, isoleucine, lysine and arginine within clus-ters considering the number of biochemical pathwaysthey are involved in. For instance, bSOM grouped serine,threonine, valine and isoleucine within cluster A andglycine, arginine and lysine in a separate cluster (B). Inthis case, bSOM takes account of the possibility that co-variation of valine and isoleucine can also be affected bytheir degradative pathway (ko00280). Another example ofthe usefulness of bSOM is given by clusters C and D. Inthe first case, bSOM grouped two transcripts which bothencode for beta-galactosidase precursor. It is somehowhere expectable either because they are derived from thesame gene or from different loci. In cluster D, glutamate,proline and sucrose grouped together with two transcripts.One of these transcripts (LE23B16) encodes a putativecalcium-dependent protein kinase (CDPK). Although theexact mechanism by which this protein could be relatedto the variation of the above-mentioned metabolites isnot known, the role of different CDPKs in the con-trol of primary plant metabolism is well documented[45].
ConclusionsIn this paper we presented a new training algorithm forself-organizing maps (bSOM) over biological datasets.A new biologically-inspired term, considering commonpathways, is added in the calculation of the distancesamong data points and neurons centroids. This term eval-uates the internal connections of the data samples in termsof their belonging to known pathways. The proposedtraining algorithm was tested in two datasets involvingSolanum lycopersicum and Arabidopsis thaliana tran-scripts and metabolites. Classical data mining validationmeasures were used to qualify the clustering solutionsobtained when using both algorithms, as well as a newmeasure that takes into account biological significance ofthe clusters found. The new algorithm showed importantimprovements in performance in comparison to stan-dard SOM training. It is worth to highlight the fact thatthe inclusion of biological information implicitly duringtraining has effectively improved the results. This wouldcertainly increase the biological value of the clusters foundand would simplify their further analysis. Future work willinvolve the expansion of the range of additional biologicalsources that could be used in combination with clusteringalgorithms.
Availability• Project name: bSOM.• Web-demo: http://fich.unl.edu.ar/sinc/web-demo/
bsom-lite/
• Source code and data sets: http://sourceforge.net/projects/sourcesinc/files/bsom
• License: opensource, free for academic use.
Competing interestsThe authors declare no competing interests.
Authors contributionsDM and GS proposed and implemented the clustering algorithm, and wrotethe manuscript. ML, LK and FC have contributed with motivations and usefuldiscussions, provided the case study dataset and revise the manuscript. Allauthors read and approved the final manuscript.
AcknowledgementsThis work was supported by National Scientific and Technical ResearchCouncil [PIP 2013 #117], INTA [PNBIO #1131022], National University of Litoral[CAI+D 2011 #548] and National Agency for the Promotion of Science andTechnology [PICT 2011 #2440, PAE #37122, PICT 2011-1171].
Author details1Research Center for Signals, Systems and Computational Intelligence, sinc(i),FICH-UNL, CONICET, Ciudad Universitaria UNL, (3000) Santa Fe, Argentina.2Instituto de Biotecnología, Instituto Nacional de Tecnología Agropecuaria(IB-INTA), CONICET, PO Box 25, B1712WAA Castelar, Argentina.
Received: 30 April 2013 Accepted: 25 March 2014Published: 10 April 2014
References1. Wolfe CJ, Kohane IS, Butte AJ: Systematic survey reveals general
applicability of “guilt-by-association”within gene coexpressionnetworks. BMC Bioinformatics 2005, 6:227–237.
2. Lacroix V, Cottret L, Thebault P, Sagot MF: An Introduction to MetabolicNetworks and Their Structural Analysis. IEEE/ACMTrans Comput BiolBioinform 2008, 5(4):594–617.
3. Usadel B, Obayashi T, Mutwil M, Giorgi F, Bassel G, Tanimoto M, Chow A,Steinhauser D, Persson S, Provart N: Co-expression tools for plantbiology: opportunities for hypothesis generation and caveats.Plant, Cell & Environ 2009, 32(12):1633–1651.
4. Tohge T, Fernie A: Combining genetic diversity, informatics andmetabolomics to facilitate annotation of plant gene function.Nat Protoc 2010, 5(6):1210–1227.
5. Tasoulis D, Plagianakos V, Vrahatis M: Computational Intelligence inBioinformatics, Volume 94 of Studies in Computational Intelligence. Berlin:Springer; 2008.
6. Fogel G, Corne D, Pan Y: Computational Intelligence in Bioinformatics.Piscataway: Wiley-IEEE Press; 2007.
7. Kohonen T: Essentials of the self-organizingmap. Neural Netw 2013,37(37):52–65.
8. Tamayo P, Slonim D, Mesirov J, Zhu Q, Kitareewan S, Dmitrovsky E,Lander E, Golub T: Interpreting patterns of gene expression withself-organizingmaps: Methods and applications to hematopoieticdifferentiation. Proc Natl Acad Sci USA 1999, 96:2907–2912.
9. Wang J, Delabie J, Aasheim H, Smeland E, Myklebost O: Clustering of theSOM easily reveals distinct gene expression patterns: results of areanalysis of lymphoma study. BMC Bioinformatics 2002, 3:36–46.
10. Allen E, Moing A, Ebbels TM, Maucourt M, Tomos AD, Rolin D, Hooks MA:Correlation Network Analysis reveals a sequential reorganization ofmetabolic and transcriptional states during germination andgene-metabolite relationships in developing seedlings ofArabidopsis. BMC Syst Biol 2010, 4:62–72.
11. Hirai M, Klein M, Fujikawa Y, Yano M, Goodenowe D, Yamazaki Y, Kanaya S,Nakamura Y, Kitayama M, Suzuki H, Sakurai N, Shibata D, Tokuhisa J,Reichelt M, Gershenzon J, Saito K: Elucidation of gene-to-gene andmetabolite-to-gene networks in arabidopsis by integration ofmetabolomics and transcriptomics. J Biol Chem 2005,280(27):25590–25595.
12. Stegmayer G, Milone D, Kamenetzky L, Lopez M, Carrari F: NeuralNetwork Model for Integration and Visualization of IntrogressedGenome andMetabolite Data. In IEEE International Joint Conference on

Milone et al. BMC Bioinformatics 2014, 15:101 Page 10 of 10http://www.biomedcentral.com/1471-2105/15/101
Neural Networks. Piscataway: IEEE Computational Intelligence Society;2009:3177–3183.
13. Milone D, Stegmayer G, Kamenetzky L, Lopez M, Giovannoni J, Lee JM,Carrari F: *omeSOM: a software for integration, clustering andvisualization of transcriptional andmetabolite datamined frominterspecific crosses of crop plants. BMC Bioinformatics 2010,11:438–448.
14. Usadel B, Poree F, Nagel A, Lohse M, Czedik-Eysenberg A, Stitt M: A guideto usingMapMan to visualize and compare Omics data in plants: acase study in the crop species, Maize. Plant Cell Environ 2009,32:1211–1229.
15. Ashburner M: Gene ontology: tool for the unification of biology.Nat Genet 2000, 25:25–9.
16. Buehler E, Sachs J, Shao K, Bagchi A, Ungar L: The CRASSS plug-in forintegrating annotation data with hierarchical clustering results.Bioinformatics 2004, 20(17):3266–3269.
17. Curtis RK, Oresic M, Vidal-Puig A: Pathways to the analysis ofmicroarray data. Trends Biotechnol 2005, 23(8):429–435.
18. Doherty J, Carmichael L, Mills J: GOurmet: a tool for quantitativecomparison and visualization of gene expression profiles based ongene ontology (GO) distributions. BMC Bioinformatics 2006, 7:1–9.
19. Toronen P: Selection of informative clusters from hierarchical clustertree with gene classes. BMC Bioinformatics 2004, 5:32.
20. Subramanian A, Tamayo P, Mootha V, Mukherjee S, Ebert B, Gillette M,Paulovich A, Pomeroy S, Golub T, Lander E, Mesirov J: Gene setenrichment analysis: A knowledge-based approach for interpretinggenome-wide expression profiles. Proc Nat Acad Sci USA 2005,102(43):15545–15550.
21. Lanckriet GRG, Bie TD, Cristianini N, Jordan MI, Noble WS: A statisticalframework for genomic data fusion. Bioinformatics 2004,20(16):2626–2635.
22. Stegmayer G, Milone DH, Kamenetzky L, Lopez MG, Carrari F: Abiologically inspired validity measure for comparison of clusteringmethods over metabolic data sets. IEEE/ACMTrans Comput BiologyBioinform 2012, 9(3):706–716.
23. Dotan-Cohen D, Kasif S, Melkman AA: Seeing the forest for the trees:using the Gene Ontology to restructure hierarchical clustering.Bioinformatics 2009, 35(14):1789–1795.
24. Wang H, Azuaje F, Bodenreider O, Dopazo J: Gene expressioncorrelation and gene ontology-based similarity: an assessment ofquantitative relationships. In CIBCB ’04. Proceedings of the 2004 IEEESymposium on Computational Intelligence in Bioinformatics andComputational Biology. Piscataway: IEEE Press; 2004:25–31.
25. Hanisch D, Zien A, Zimmer R, Lengauer T: Co-clustering of biologicalnetworks and gene expression data. In ISMB (Supplement ofBioinformatics). Oxford: Oxford University Press; 2002:145–154.
26. Cheng J, Cline M, Martin J, Finkelstein D, Awad T, Kulp D, Siani-Rose MA:A knowledge-based clustering algorithm driven by gene ontology.J Biopharm Stat 2004, 14(3):687–700.
27. Huang D, Pan W: Incorporating biological knowledge intodistance-based clustering analysis of microarray gene expressiondata. Bioinformatics 2006, 22(10):1259–1268.
28. Speer N, Spieth C, Zell A: Amemetic co-clustering algorithm for geneexpression profiles and biological annotation. In Proc. of Congress onEvolutionary Computation (CEC), Volume 2. Piscataway: IEEE Press;2004:1631–8.
29. Kustra R, Zagdanski A: Data-fusion in clusteringmicroarray data:Balancing discovery and interpretability. IEEE/ACMTrans Comput BiolBioinform 2010, 7:50–63.
30. Diaz N, Ruiz J: GO-based functional dissimilarity of gene sets.BMC Bioinformatics 2011, 12:360+.
31. Dotan-Cohen D, Melkman AA, Kasif S: Hierarchical tree snipping:clustering guided by prior knowledge. Bioinformatics 2007,23(24):3335–3342.
32. Kasturi J, Acharya R: Clustering of diverse genomic data usinginformation fusion. Bioinformatics 2005, 21(4):423–429.
33. Gillis J, Pavlidis P: Assessing identity, redundancy and confounds inGene Ontology annotations over time. Bioinformatics 2013. http://dx.doi.org/10.1093/bioinformatics/bts727.
34. Xu R, Wunsch DC: Clustering. Piscataway: Wiley and IEEE Press; 2009.
35. Haykin S: Neural Networks: A Comprehensive Foundation (3rd Edition).Upper Saddle River, NJ, USA: Prentice-Hall, Inc; 2007.
36. Kohonen T, Schroeder MR, Huang TS: Self-Organizing Maps. New York, Inc.:Springer-Verlag; 2005.
37. Handl J, Knowles J, Kell DB: Computational cluster validation inpost-genomic data analysis. Bioinformatics 2005, 21(15):3201–3212.
38. Davies D, Bouldin D: A cluster separation measure. IEEE Trans PatternAnal Mach Intell 1979, 1(4):224–227.
39. KEGG PATHWAY Database. http://www.genome.jp/kegg/pathway.html.
40. Kanehisa M, Goto S: KEGG: Kyoto encyclopedia of genes andgenomes. Nucleic Acids Res 2000, 28:27–30.
41. Espinoza C, Degenkolbe T, Caldana C, Zuther E, Leisse A, Willmitzer L,Hincha D, Hannah M: Interaction with Diurnal and Circadianregulation results in dynamicmetabolic and transcriptional changesduring cold acclimation in Arabidopsis. PloS one 2010, 5(11):1–19.
42. Tibshirani R, Walther G, Hastie T: Estimating the number of clusters in adataset via the Gap statistic. J R Stat Soc B 2001, 63:411–423.
43. Rubel O, Weber G, Huang MY, Bethel EW, Biggin M, Fowlkes C, Hendriks CL,Keranen S, Eisen M, Knowles D, Malik J, Hagen H, Hamann B: Integratingdata clustering and visualization for the analysis of 3D geneexpression data. IEEE/ACMTrans Comput Biol Bioinform 2010, 7:64–79.
44. Datta S. Datta S: Methods for evaluating clustering algorithms for geneexpression data using a reference set of functional classes 2006, 7(7):397.
45. Plaxton WC, McManus MT, Moorhead GBG, Templeton GW, Tran HT: Roleof protein kinases, phosphatases and 14-3-3 proteins in the controlof primary plant metabolism. Ann Plant Rev 2007, 22:121–149.
doi:10.1186/1471-2105-15-101Cite this article as: Milone et al.: Improving clustering with metabolicpathway data. BMC Bioinformatics 2014 15:101.
Submit your next manuscript to BioMed Centraland take full advantage of:
• Convenient online submission
• Thorough peer review
• No space constraints or color figure charges
• Immediate publication on acceptance
• Inclusion in PubMed, CAS, Scopus and Google Scholar
• Research which is freely available for redistribution
Submit your manuscript at www.biomedcentral.com/submit