Experimental validation of metabolic pathway modeling
16
Experimental validation of metabolic pathway modeling An illustration with glycolytic segments from Entamoeba histolytica Rafael Moreno-Sa ´nchez, Rusely Encalada, Alvaro Marı´n-Herna ´ ndez and Emma Saavedra Departamento de Bioquı ´mica, Instituto Nacional de Cardiologı ´a, Mexico Keywords pathway reconstitution; metabolic control analysis; PP i inhibition; PP i activation; AMP modulation Correspondence E. Saavedra, Departamento de Bioquı ´mica, Instituto Nacional de Cardiologı ´a, Juan Badiano No. 1, Seccio ´ n XVI, Tlalpan, Mexico, D.F. 14080, Mexico Fax: +52 55 5573 0994 Tel: +52 55 5573 2911, ext. 1298, 1422 E-mail: [email protected] Database The mathematical models described here have been submitted to the Online Cellular Systems Modelling Database and can be accessed at http://jjj.biochem.sun.ac.za/ database/moreno1/index.html and http://jjj. biochem.sun.ac.za/database/moreno2/ index.html free of charge (Received 27 November 2007, revised 1 April 2008, accepted 6 May 2008) doi:10.1111/j.1742-4658.2008.06492.x In the search for new drug targets in the human parasite Entamoeba histolytica, metabolic control analysis was applied to determine, experimen- tally, flux control distribution of amebal glycolysis. The first (hexokinase, hexose-6-phosphate isomerase, pyrophosphate-dependent phosphofructo- kinase (PP i -PFK), aldolase and triose-phosphate isomerase) and final (3-phosphoglycerate mutase, enolase and pyruvate phosphate dikinase) gly- colytic segments were reconstituted in vitro with recombinant enzymes under near-physiological conditions of pH, temperature and enzyme pro- portion. Flux control was determined by titrating flux with each enzyme component. In parallel, both glycolytic segments were also modeled by using the rate equations and kinetic parameters previously determined. Because the flux control distribution predicted by modeling and that deter- mined by reconstitution were not similar, kinetic interactions among all the reconstituted components were experimentally revised to unravel the causes of the discrepancy. For the final segment, it was found that 3-phosphoglyc- erate was a weakly competitive inhibitor of enolase, whereas PP i was a moderate inhibitor of 3-phosphoglycerate mutase and enolase. For the first segment, PP i was both a strong inhibitor of aldolase and a nonessential mixed-type activator of amebal hexokinase; in addition, lower V max values for hexose-6-phosphate isomerase, PP i -PFK and aldolase were induced by PP i or ATP inhibition. It should be noted that PP i and other metabolites were absent from the 3-phosphoglycerate mutase and enolase or aldolase and hexokinase kinetics experiments, but present in reconstitution experi- ments. Only by incorporating these modifications in the rate equations, modeling predicted values of flux control distribution, flux rate and metab- olite concentrations similar to those experimentally determined. The experi- mentally validated segment models allowed ‘in silico experimentation’ to be carried out, which is not easy to achieve in in vivo or in vitro systems. The results predicted a nonsignificant effect on flux rate and flux control distri- bution by adding parallel routes (pyruvate kinase for the final segment and ATP-dependent PFK for the first segment), because of the much lower activity of these enzymes in the ameba. Furthermore, modeling predicted Abbreviations AK, adenylate kinase; ALDO, aldolase; C J Ei , flux control coefficient; DHAP, dihydroxiacetone phosphate; ENO, enolase; Fru(1,6)P 2, fructose- 1,6-bisphosphate; GAPDH, glyceraldehyde-3-phosphate dehydrogenase; Glc6P, glucose-6-phosphate; aGPDH, a-glycerophosphate dehydrogenase; HK, hexokinase; HPI, hexose-6-phosphate isomerase; Lac, L-lactate; LDH, L-lactate dehydrogenase; 2PG, 2-phosphoglycerate; 3PG, 3-phosphoglycerate; PGAM, 3-phosphoglycerate mutase; PFK, phosphofructokinase,; PPDK, pyruvate phosphate dikinase; P i , phosphate; PP i , pyrophosphate; PYK, pyruvate kinase; Pyr, pyruvate; TPI, triose-phosphate isomerase. 3454 FEBS Journal 275 (2008) 3454–3469 ª 2008 The Authors Journal compilation ª 2008 FEBS
-
Upload
cardiologia -
Category
Documents
-
view
1 -
download
0
Transcript of Experimental validation of metabolic pathway modeling

Experimental validation of metabolic pathway modeling
An illustration with glycolytic segments fromEntamoeba histolytica
Rafael Moreno-Sanchez, Rusely Encalada, Alvaro Marın-Hernandez and Emma Saavedra
Departamento de Bioquımica, Instituto Nacional de Cardiologıa, Mexico
Keywords
pathway reconstitution; metabolic control
analysis; PPi inhibition; PPi activation; AMP
modulation
Correspondence
E. Saavedra, Departamento de Bioquımica,
Instituto Nacional de Cardiologıa, Juan
Badiano No. 1, Seccion XVI, Tlalpan,
Mexico, D.F. 14080, Mexico
Fax: +52 55 5573 0994
Tel: +52 55 5573 2911, ext. 1298, 1422
E-mail: [email protected]
Database
The mathematical models described here
have been submitted to the Online Cellular
Systems Modelling Database and can be
accessed at http://jjj.biochem.sun.ac.za/
database/moreno1/index.html and http://jjj.
biochem.sun.ac.za/database/moreno2/
index.html free of charge
(Received 27 November 2007, revised
1 April 2008, accepted 6 May 2008)
doi:10.1111/j.1742-4658.2008.06492.x
In the search for new drug targets in the human parasite Entamoeba
histolytica, metabolic control analysis was applied to determine, experimen-
tally, flux control distribution of amebal glycolysis. The first (hexokinase,
hexose-6-phosphate isomerase, pyrophosphate-dependent phosphofructo-
kinase (PPi-PFK), aldolase and triose-phosphate isomerase) and final
(3-phosphoglycerate mutase, enolase and pyruvate phosphate dikinase) gly-
colytic segments were reconstituted in vitro with recombinant enzymes
under near-physiological conditions of pH, temperature and enzyme pro-
portion. Flux control was determined by titrating flux with each enzyme
component. In parallel, both glycolytic segments were also modeled by
using the rate equations and kinetic parameters previously determined.
Because the flux control distribution predicted by modeling and that deter-
mined by reconstitution were not similar, kinetic interactions among all the
reconstituted components were experimentally revised to unravel the causes
of the discrepancy. For the final segment, it was found that 3-phosphoglyc-
erate was a weakly competitive inhibitor of enolase, whereas PPi was a
moderate inhibitor of 3-phosphoglycerate mutase and enolase. For the first
segment, PPi was both a strong inhibitor of aldolase and a nonessential
mixed-type activator of amebal hexokinase; in addition, lower Vmax values
for hexose-6-phosphate isomerase, PPi-PFK and aldolase were induced by
PPi or ATP inhibition. It should be noted that PPi and other metabolites
were absent from the 3-phosphoglycerate mutase and enolase or aldolase
and hexokinase kinetics experiments, but present in reconstitution experi-
ments. Only by incorporating these modifications in the rate equations,
modeling predicted values of flux control distribution, flux rate and metab-
olite concentrations similar to those experimentally determined. The experi-
mentally validated segment models allowed ‘in silico experimentation’ to be
carried out, which is not easy to achieve in in vivo or in vitro systems. The
results predicted a nonsignificant effect on flux rate and flux control distri-
bution by adding parallel routes (pyruvate kinase for the final segment and
ATP-dependent PFK for the first segment), because of the much lower
activity of these enzymes in the ameba. Furthermore, modeling predicted
Abbreviations
AK, adenylate kinase; ALDO, aldolase; CJEi , flux control coefficient; DHAP, dihydroxiacetone phosphate; ENO, enolase; Fru(1,6)P2, fructose-
1,6-bisphosphate; GAPDH, glyceraldehyde-3-phosphate dehydrogenase; Glc6P, glucose-6-phosphate; aGPDH, a-glycerophosphate
dehydrogenase; HK, hexokinase; HPI, hexose-6-phosphate isomerase; Lac, L-lactate; LDH, L-lactate dehydrogenase; 2PG,
2-phosphoglycerate; 3PG, 3-phosphoglycerate; PGAM, 3-phosphoglycerate mutase; PFK, phosphofructokinase,; PPDK, pyruvate phosphate
dikinase; Pi, phosphate; PPi, pyrophosphate; PYK, pyruvate kinase; Pyr, pyruvate; TPI, triose-phosphate isomerase.
3454 FEBS Journal 275 (2008) 3454–3469 ª 2008 The Authors Journal compilation ª 2008 FEBS

The parasite Entamoeba histolytica is the causal agent
of human amebiasis, for which metronidazole is the
drug of choice for treatment. As metronidazole resis-
tance has been observed in amebas [1], identification of
new drug targets is necessary. E. histolytica relies solely
on glycolysis for ATP supply; because several of its
glycolytic enzymes display important differences com-
pared with their human enzyme counterparts, E. his-
tolytica glycolytic enzymes have therefore become a
point of focus in the search for new drug targets [2,3].
Metabolic control analysis [4] is a theoretical frame-
work that can be applied to identify the main flux con-
trol steps in amebal glycolysis. Once identified, the
enzymes involved in these flux control steps become
potential targets for pharmaceutical intervention, thus
affecting the functioning of this energetically important
pathway in the parasite.
To determine and understand the flux control distri-
bution of a metabolic pathway through metabolic con-
trol analysis, several different experimental approaches
have been developed [4,5]. For instance, to evaluate
flux control of glycolysis experimentally, pathway
shortening to the first segment [from glucose to dihy-
droxiacetone phosphate (DHAP)] [6–8] and reconstitu-
tion of the final segment [from 3-phosphoglycerate
mutase (3PG) to pyruvate (Pyr)] [9], have been carried
out by using cellular extracts and commercial enzymes.
Modeling metabolic pathways is another powerful
tool to determine the flux control distribution of a
metabolic pathway. Kinetic modeling identifies the
properties of a given pathway that may not be deduced
by simple inspection of the kinetic parameters of the
individual enzymes and that might be relevant for
understanding the biochemical mechanisms involved in
the control of the pathway. Modeling involves quanti-
tative consideration of the vast array of reported data
and the interactions typical of a biological system, thus
permitting an integrative view of disperse data to be
made and irrelevant observations to be disregarded.
Although models are oversimplifications of complex
cellular processes, they are useful for the deduction of
essential relationships. Modeling helps to design exper-
imental strategies for testing hypotheses on pathway
control and may help in detecting incompatibilities on
the kinetic parameters of the participating enzymes,
prompting experimental revision of the most critical
enzyme uncertainties.
The recent kinetic modeling of E. histolytica glycoly-
sis revealed that the glucose transporter (GluT), hexo-
kinase (HK) and 3-phosphoglycerate mutase (PGAM)
were the main controlling steps [10]. It should be noted
that the glycolytic pathway in this human parasite is
unique in the sense that the cooperative enzymes ATP-
dependent PFK-1 and pyruvate kinase (PYK) are
rather scarce [11,12]. Instead, E. histolytica glycolysis
has a predominant flux through PPi-dependent PFK
(PPi-PFK) and pyruvate phosphate dikinase (PPDK),
which replace ATP-PFK and PYK, respectively, and
they catalyze fully reversible reactions under near-
physiological conditions and have a noncooperative
kinetic behavior [13–15]. Moreover, E. histolytica HK
is not product inhibited by glucose 6-phosphate
(Glc6P) or ADP, like the human HK-1, -2 and -3,
although it is potently blocked by AMP [10,16]. In
consequence, the glycolytic pathway in E. histolytica
from glucose to pyruvate (Pyr) is completely reversible,
perhaps with the exception of the HK reaction.
Another consequence of this particular pathway design
is that, in addition to the information transfer between
enzymes through the reversibility of the reactions,
there is an AMP-mediated link between the first (HK)
and the final (PPDK) segments, which is very likely to
be modulated by adenylate kinase (AK) activity [10].
Modeling of a complex pathway might overlook
hidden, but important, interactions among metabolites
and enzymes, particularly regarding noncontrolling
enzymes. Kinetic data are usually determined with the
known substrates, products and modulators of the
individual enzymes; however, other pathway meta-
bolites, which are included in the in vitro reconstitution
and in the model, but are not present in the kinetic
assays, might affect the enzyme activity and thus the
pathway flux-control distribution. Hence, to avoid
uncertainties in the model and its discrepancies with
the in vivo behavior, it is desirable to analyze experi-
mentally the complete range of interactions among the
system components. Once these hidden interactions
have been revealed, identified and quantitatively deter-
mined, their incorporation into the kinetic model
should reduce the number of discrepancies with the
full flux-control by 3-phosphoglycerate mutase and hexokinase, in the pres-
ence of low physiological substrate and product concentrations. It is con-
cluded that the combination of in vitro pathway reconstitution with
modeling and enzyme kinetics experimentation permits a more comprehen-
sive understanding of the pathway behavior and control properties.
R. Moreno-Sanchez et al. Metabolic modeling validation
FEBS Journal 275 (2008) 3454–3469 ª 2008 The Authors Journal compilation ª 2008 FEBS 3455

observed system behavior. In return, a strongly vali-
dated model may predict, with a higher degree of accu-
racy, the pathway response towards an extended set of
situations, thus facilitating a full understanding of the
regulatory mechanisms operating in the metabolic
pathway under investigation.
In the present work, to identify experimentally poten-
tial drug targets of E. histolytica glycolysis, the flux rate,
the flux control distribution and the metabolite concen-
trations were determined in both in vitro-reconstituted
systems (with recombinant enzymes) and in silico-mod-
eled pathway segments (using the known kinetic data) at
pH values of 6 and 7. It should be noted that each
reconstituted segment contained one of the main con-
trolling enzymes, namely HK and PGAM [10]. As no
agreement was initially found between the in vitro recon-
stitution and modeling results, re-evaluation of the
kinetics of the participating enzymes [PGAM, enolase
(ENO), and PPDK for the final segment; and HK, hex-
ose-6-phosphate isomerase (HPI), PPi-PFK, aldolase
(ALDO) and triose-phosphate isomerase (TPI) for the
first segment] was undertaken. Thus, novel interactions
between enzymes and metabolites were unveiled, which
led to a better correlation between reconstitution and
modeling results.
The mathematical models described here have been
submitted to the Online Cellular Systems Modelling
Database and can be accessed at http://jjj.biochem.
sun.ac.za/database/moreno1/index.html and http://jjj.
biochem.sun.ac.za/database/moreno2/index.html free
of charge
Results
3PG fi Pyr segment
Pathway reconstitution
To reconstitute a pathway segment under near-physio-
logical conditions, the correct proportion of participat-
ing enzymes has to be present. The enzyme proportion
previously used for reconstitution of the final segment of
E. histolytica glycolysis at pH 7.0 [16] was slightly dif-
ferent from the proportion found in live trophozoites
[10]. By using the Vmax values of the forward reaction
determined in amebal cells, it was established that the
appropriate enzyme activity ratios were 1 PGAM : 5.8
ENO : 2.9 PPDK at pH 7.0; and 1 PGAM : 4
ENO : 2.6 PPDK at pH 6.0 (see table 1 of Ref. [10]).
A quasi steady-state flux to l-lactate (Lac) was
established by coupling the reconstituted pathway with
excess commercial lactate dehydrogenase (LDH), by
following the rate of NADH oxidation and by starting
the reaction upon the addition of 3PG (Fig. 1). After a
lag period (transition time) that was dependent on the
concentration of PGAM, a stable pseudo steady-state
flux was reached. In the range of PGAM activities
tested (50–100 mU), while maintaining constant the
enzyme proportion for ENO and PPDK at both pH
values, a quasi linear relationship with the flux rate
was obtained (Fig. 1, inset). At a lower PGAM activity
(£ 25 mU), the system was extremely slow in reaching
a stable pseudo steady state (> 2.5 min), which
resulted in less reliable data owing to the surge of
enzyme instability in highly diluted solutions; in addi-
tion, the relationship between flux and enzyme propor-
tion lost proportionality, suggesting enzyme
inactivation at low concentrations, perhaps because of
a change in the enzyme oligomerization state. At
higher PGAM activities (> 100 mU), and the corre-
sponding correct proportions of ENO and PPDK, the
system rapidly consumed the added NADH, which did
not allow the establishment of a stable and reliable
pseudo steady state (data not shown).
We are aware that a true steady state cannot be estab-
lished under the conditions described in Fig. 1 because
the concentrations of the substrates 3PG, AMP, PPi and
NADH, and those of the products ATP, Lac and
NAD+, do not remain constant throughout the reac-
tion. However, a quasi steady state, regarding a constant
flux rate (i.e. of Lac formation) and constant inter-
mediate metabolite concentrations [i.e. of 2-phospho-
glycerate (2PG), phosphoenolpyruvate and Pyr)], may
be sufficient to analyze the control properties of the
system [4].
Titration of flux using different activities of each
enzyme, keeping the rest of the system constant, was
carried out to determine the flux control coefficients
(CJEivalues) of the participating enzymes, in which the
slope of the tangent at the reference point was taken
to calculate its value (Fig. 2). The experimental points
fitted well to hyperbolic patterns, but did not fit sig-
moidal or parabolic patterns. A summary of the esti-
mated CJEi value under three different experimental
conditions is shown in Table 1. The pathway flux rate
was slightly higher at pH 6 than at pH 7 because the
optimal pH values for PGAM and PPDK activities are
approximately 6 [16].
The main flux control was exerted by PGAM at
both pH values. ENO was the enzyme with the highest
activity in the reconstituted system and it is also the
most efficient [16]. However, as its optimal pH is
approximately 7, ENO exerted significant flux control
at pH 6, whereas PPDK exerted the lowest flux con-
trol, being negligible at pH 6. In the presence of the
pathway products ATP and phosphate (Pi), the flux
rate was significantly diminished, whereas the PPDK
Metabolic modeling validation R. Moreno-Sanchez et al.
3456 FEBS Journal 275 (2008) 3454–3469 ª 2008 The Authors Journal compilation ª 2008 FEBS
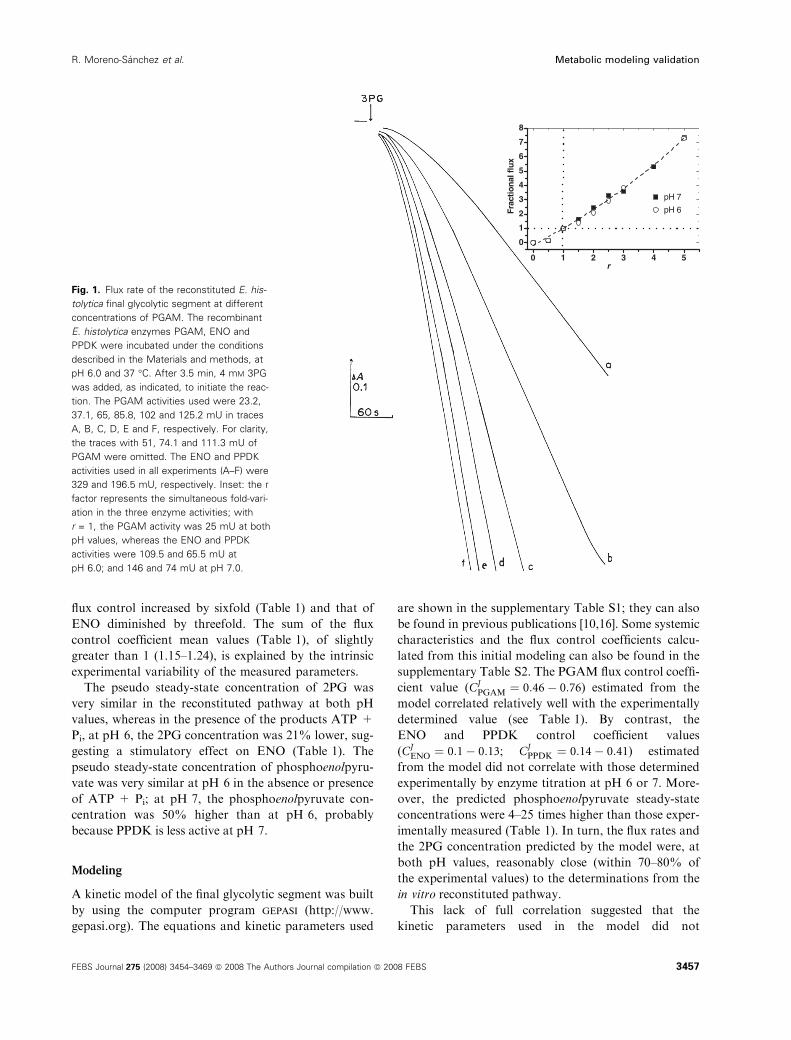
flux control increased by sixfold (Table 1) and that of
ENO diminished by threefold. The sum of the flux
control coefficient mean values (Table 1), of slightly
greater than 1 (1.15–1.24), is explained by the intrinsic
experimental variability of the measured parameters.
The pseudo steady-state concentration of 2PG was
very similar in the reconstituted pathway at both pH
values, whereas in the presence of the products ATP +
Pi, at pH 6, the 2PG concentration was 21% lower, sug-
gesting a stimulatory effect on ENO (Table 1). The
pseudo steady-state concentration of phosphoenolpyru-
vate was very similar at pH 6 in the absence or presence
of ATP + Pi; at pH 7, the phosphoenolpyruvate con-
centration was 50% higher than at pH 6, probably
because PPDK is less active at pH 7.
Modeling
A kinetic model of the final glycolytic segment was built
by using the computer program gepasi (http://www.
gepasi.org). The equations and kinetic parameters used
are shown in the supplementary Table S1; they can also
be found in previous publications [10,16]. Some systemic
characteristics and the flux control coefficients calcu-
lated from this initial modeling can also be found in the
supplementary Table S2. The PGAM flux control coeffi-
cient value (CJPGAM ¼ 0:46� 0:76) estimated from the
model correlated relatively well with the experimentally
determined value (see Table 1). By contrast, the
ENO and PPDK control coefficient values
(CJENO ¼ 0:1� 0:13; CJ
PPDK ¼ 0:14� 0:41) estimated
from the model did not correlate with those determined
experimentally by enzyme titration at pH 6 or 7. More-
over, the predicted phosphoenolpyruvate steady-state
concentrations were 4–25 times higher than those exper-
imentally measured (Table 1). In turn, the flux rates and
the 2PG concentration predicted by the model were, at
both pH values, reasonably close (within 70–80% of
the experimental values) to the determinations from the
in vitro reconstituted pathway.
This lack of full correlation suggested that the
kinetic parameters used in the model did not
0 1 2 3 4 5
0
1
2
3
4
5
6
7
8
pH 7
pH 6Frac
tion
al fl
ux
r
Fig. 1. Flux rate of the reconstituted E. his-
tolytica final glycolytic segment at different
concentrations of PGAM. The recombinant
E. histolytica enzymes PGAM, ENO and
PPDK were incubated under the conditions
described in the Materials and methods, at
pH 6.0 and 37 �C. After 3.5 min, 4 mM 3PG
was added, as indicated, to initiate the reac-
tion. The PGAM activities used were 23.2,
37.1, 65, 85.8, 102 and 125.2 mU in traces
A, B, C, D, E and F, respectively. For clarity,
the traces with 51, 74.1 and 111.3 mU of
PGAM were omitted. The ENO and PPDK
activities used in all experiments (A–F) were
329 and 196.5 mU, respectively. Inset: the r
factor represents the simultaneous fold-vari-
ation in the three enzyme activities; with
r = 1, the PGAM activity was 25 mU at both
pH values, whereas the ENO and PPDK
activities were 109.5 and 65.5 mU at
pH 6.0; and 146 and 74 mU at pH 7.0.
R. Moreno-Sanchez et al. Metabolic modeling validation
FEBS Journal 275 (2008) 3454–3469 ª 2008 The Authors Journal compilation ª 2008 FEBS 3457

completely represent the behavior of ENO and PPDK
in the reconstituted system, indicating that other,
not-so-apparent, factors and interactions may affect
the activity of these two enzymes. Moreover, in the ini-
tial model, a simplified rate equation for PPDK (Bi Bi
Ping Pong reversible mechanism) was used, in which
phosphoenolpyruvate and PPi transform to Pyr and Pi,
by considering that AMP and ATP are present in the
intracellular milieu at saturating concentrations [10].
The much more complex kinetic mechanism of PPDK
(Uni Uni Bi Bi Ping Pong-Ordered) yields a rate equa-
tion that is exceedingly complex [17].
To understand the lack of correlation between
enzyme titration and modeling results, the effects of
Pyr, Lac, AMP, 3PG and PPi were assayed on ENO
activity. According to the pathway model, the
steady-state Pyr concentration was below the limit of
detection (< 5 nmolÆmL)1) owing to the presence of
excess LDH. ENO activity was unaffected by the pres-
ence of 0.1–1 mm Pyr, 0.1–1 mm Lac, or 0.5 mm AMP.
However, PPi (Fig. 3B) and 3PG (data not shown)
behaved as competitive inhibitors of the ENO forward
reaction. Furthermore, PPi also competitively inhibited
the PGAM forward reaction (Fig. 3A); the addition of
0.05–2.5% glycerol (derived from the enzyme prepara-
tions) did not affect the PGAM activity. Moreover, the
presence of 10 mm Pi + 3 mm ATP diminished the
ENO Vmax value by 40% (pH 6; n = 3) and 26%
(pH 7; n = 4), whereas the ENO Km 2PG was increased
by threefold (data not shown); ATP alone inhibited
ENO activity by 16% (pH 6; n = 2) and 10% (pH 7;
n = 3). Ammonium (7–13 mm) did not affect the
reverse activities of PGAM, ENO or PPDK.
By introducing a double-competitive inhibition (PPi
and 3PG) in the ENO rate equation and a PPi compet-
itive inhibition in the PGAM rate equation (see
Scheme 1; see also the supplementary Doc. S1. for
equations), together with an empirical PPDK rate
equation with six ligands (three substrates, three prod-
ucts; see rate equations in supplementary Doc. S1),
a re-evaluation of the pathway model was carried out.
The PGAM and ENO flux control coefficients, now
estimated using the modified model, correlated better
(Table 2) with the experimentally determined values
(see Table 1), although the predicted flux control
0 20 40 60 80 10005
1015202530 *
Flu
x (n
mo
l·min
–1)
PGAM (mU)
0 50 100 150 20005
1015202530
*
PPDK (mU)
0 100 200 300 40005
10152025
*
ENO (mU)
Fig. 2. Enzyme titration of flux in the reconstituted final glycolytic
segment. The final pathway segment was reconstituted with
75 mU PGAM, 328.5 mU ENO and 196.5 mU PPDK
(1 PGAM : 4.38 ENO : 2.62 PPDK) at pH 6.0 and 37 �C and in the
presence of 3 mM ATP and 10 mM Pi. Only one enzyme activity
was varied, as indicated, maintaining constant the other enzyme
activities at the above-mentioned values. The solid lines represent
the fitting to the Michaelis–Menten equation, which was carried
out by using the computer program MICROCAL ORIGIN 5.0. The aster-
isks indicate the point at which the slope of the tangent to the
curve was calculated. The flux control coefficients estimated for
this particular experiment by using the expression [4] CJEi ¼ dJ
dEi� Eo
Jo
were 0.55, 0.15 and 0.22 for PGAM, ENO and PPDK, respectively.
The slope value is dJdEi
, whereas Eo and Jo are the reference, control
values of enzyme activity and flux rate, respectively.
Table 1. Flux control of the in vitro reconstituted final segment of
Entamoeba histolytica glycolysis. The enzyme activity proportions
were PGAM 1 (50 mU), ENO 4.75 ± 0.82 (n = 4) and PPDK
2.64 ± 0.17 (n = 4) at pH 6.0; PGAM 1 (75 mU), ENO 4.37 ± 0.02
(n = 3), PPDK 2.62 (n = 2) at pH 6.0 + 3 mM ATP + 10 mM Pi; and
PGAM 1 (50 mU), ENO 6.4 ± 1.5 (n = 5), PPDK 2.8 ± 0.38 (n = 5)
at pH 7.0. The values shown represent the mean ± standard devia-
tion of the flux control coefficients (CJEi ) calculated from experi-
ments similar to those shown in Fig. 1. The number of different
preparations assayed is included in parentheses. For determination
of the metabolite concentrations, aliquots were withdrawn from
the reconstituted system at two different time-points when the flux
rate achieved a constant value; because the two concentration val-
ues were within a 10% difference, they were averaged for each
preparation and experimental condition. PEP, phosphoenolpyruvate.
pH 6.0
pH 6.0 +
ATP + Pi pH 7.0
Flux rate,
(nmolÆmin)1)
43 ± 10 (5) 27 ± 7 (5) 31 ± 10 (6)
CJPGAM 0.75 ± 0.15 (5) 0.72 ± 0.24 (4) 0.62 ± 0.22 (6)
CJENO 0.37 ± 0.17 (4) 0.11 ± 0.03 (3) 0.33 ± 0.05 (5)
CJPPDK 0.03 ± 0.06 (4) 0.13 (2) 0.29 ± 0.12 (5)
2PG, lM 73 ± 27 (3) 58 ± 29 (4) 77 ± 7 (3)
PEP, lM 38.5 ± 5 (3) 37 ± 16 (4) 57 ± 26 (3)
Metabolic modeling validation R. Moreno-Sanchez et al.
3458 FEBS Journal 275 (2008) 3454–3469 ª 2008 The Authors Journal compilation ª 2008 FEBS

exerted by PPDK still showed no correlation with the
experimental value. The predicted steady-state concen-
trations of 2PG and phosphoenolpyruvate, as well as
the predicted flux rate (Table 2), were now closer to
the experimental values (Table 1), particularly at pH 7.
Thus, incorporation of the PPi and 3PG inhibition on
ENO activity, and of the PPi inhibition on PGAM
activity, improved the predictive value of the model. In
turn, replacing the PPDK trireactant equation with the
Bi Bi Ping Pong equation, as in the initial model, the
predicted PPDK flux control approached the experi-
mentally determined values (CJPPDK ¼ 0:02 at pH 6.0;
and 0.37 at pH 7.0, although at the expense of PGAM
losing control, CJPGAM ¼ 0:46). Hence, further refine-
ment of the PPDK rate equation is required.
The elasticity coefficients for the substrates of the
three enzymes were similar (Table 2); however, lower
elasticity coefficients were obtained for products and
inhibitors of PGAM and ENO, explaining why these
enzymes have higher flux control coefficients. The
enzyme concentration control coefficients (Table 2) did
not vary at the two pH values.
The model predictions were not significantly modi-
fied by variations in either the PPDK Km values of
substrates and products or the Keq of the PPDK reac-
tion from 0.73 [17] to 36.5, probably because of the
low flux control exerted by this enzyme. The improved
model was also relatively insensitive to changes in the
ENO Km for phosphoenolpyruvate. However, the
model was slightly susceptible to diminution in the Km
for 3PG and 2PG and in the Ki for PPi of PGAM;
and moderately sensitive to changes in the ENO Km
for 2PG (see supplementary Fig. S1) and in the ENO
Ki for PPi (data not shown). This last observation
prompted experimental revision of the PGAM and
ENO Km values of the respective substrates (see sup-
plementary Table S1). For the PGAM Km value for
3PG, it was noted that the previously determined value
[16] was accompanied by high experimental dispersion,
which was, in part, related to the presence of contami-
nating 2PG (1–2%) in the 3PG stock solutions and to
the way the assay is performed, with the prior estab-
lishment of a baseline in the presence of coupling com-
mercial ENO (which is contaminated with PGAM)
and the subsequent addition of recombinant PGAM.
In the case of the ENO Km for 2PG, the value deter-
mined here was very similar to that previously
reported [16], although for the model, the Km 2PG with
the highest value improved fitting (supplementary
Table S1). For instance, increasing the ENO Km 2PG
from 86.4 to 130 lm induced a 6–13% diminution in
CJPGAM, rate flux and [phosphoenolpyruvate], and an
increase of 31–39% in CJENO and [2PG]; whereas
decreasing the ENO Km 2PG to 40 lm provoked an
increase of 12–13% in CJPGAM, rate flux and
[phosphoenolpyruvate], and a diminution of 40–47%
in CJENO and [2PG] (supplementary Fig. S1).
0.0 0.2 0.4 0.6 0.8 1.00
10
20
30
40
50E
hP
GA
M a
ctiv
ity
mU
(m
g p
rote
in)–
1 ×
103
Eh
EN
O a
ctiv
ity
mU
(m
g p
rote
in)–
1 ×
103
3PG (mM)
0.0 0.1 0.2 0.3 0.40
25
50
75
100
125
2PG (mM)
A
B
Fig. 3. PPi inhibition of PGAM (A) and ENO (B) activities at pH 7.
The reaction at 37 �C was started by adding 0.55 lg of PGAM or
0.9 lg of ENO. The PPi concentration (mM) was: 0 (closed squares),
0.5 (open circles) or 2.0 (open triangles). The solid lines represent
the fitting to the Michaelis–Menten equation with simple competi-
tive inhibition calculated using the ORIGIN MICROCAL software. Eh,
E. histolytica.
Scheme 1. Metabolic-enzyme interactions in the E.histolytica (Eh)
final glycolytic segment.
R. Moreno-Sanchez et al. Metabolic modeling validation
FEBS Journal 275 (2008) 3454–3469 ª 2008 The Authors Journal compilation ª 2008 FEBS 3459

Modeling experimentation
With this experimentally validated model (at pH 6
with competitive inhibition by PPi and 3PG), several
questions that are not easily resolved through ‘wet’
experimentation can be examined. For instance, to
reach a stable pseudo steady state, saturating concen-
trations of 3PG and PPi (4 and 2 mm, respectively)
were used in the in vitro experiments (Fig. 1; Table 1)
because lower, more physiological concentrations were
insufficient to establish a stable pseudo steady state.
Hence, to achieve a more physiological description of
the control structure in the final glycolytic segment,
the modeling was carried out at 0.45 mm PPi and
0.4 mm 3PG, together with physiological concentra-
tions of ATP, AMP and Pi [10] (Table 3). Under these
conditions, the model was highly robust to changes in
ATP, AMP and Pi: a 50% variation in these meta-
bolites brought about a change of only 10–20% in
CJPGAM, CJ
ENO, [2PG] and flux (data not shown); a
large variation in Pi concentration (2.5–10 mm) did not
alter the control coefficients, metabolites and flux.
Changes in 3PG (0.2–1 mm) drastically affected metab-
olite concentrations and flux, but did not affect the
control coefficient distribution. By contrast, the
improved model showed that all systemic characteris-
tics, including CJPPDK, were sensitive to PPi variation
(Fig. 4). At 0.45 mm PPi, PGAM was the main con-
trolling step (Table 3), but PPDK emerged as a con-
trolling step at PPi concentrations of 0.2 mm or lower.
In turn, the flux rate exhibited a biphasic pattern with
a maximum at about 0.1 mm PPi (Fig. 4). Modeling
also showed that a large AMP variation (0.8–3.2 mm)
promoted a negligible change in all systemic properties
(data not shown).
Another question that cannot be experimentally ana-
lyzed at present because of a lack of the recombinant
amebal enzyme, is the effect of the presence of PYK as
an alternative, parallel, route on flux control and rate.
Recently, in addition to the well-described role of
PPDK in synthesizing Pyr (and ATP) from
phosphoenolpyruvate, it was established that PYK
activity was also present in amebas [12]. The PYK
activity in amebal extracts was strongly stimulated by
Table 2. Control analysis in the modeled final segment of E. his-
tolytica glycolysis with 3PG and PPi inhibition on ENO and PGAM,
and a ter-reactant PPDK rate equation. PEP, phosphoenolpyruvate.
The following metabolites were fixed: 3PG (3.7 mM); AMP
(0.2 mM); PPi (1.7 mM); Lac (0.3 mM); ATP (0.3 mM); Pi (0.3 mM).
These values were reached in the reconstituted system around the
middle of the pseudo-steady state duration (see Fig. 1).
pH 6.0 pH 7.0
Flux rate, nmolÆmin)1
(50 mU PGAM)
16.6 24.7
2PG, lM 139.8 142
PEP, lM 6.1 24.5
CJPGAM 0.79 0.74
CJENO 0.21 0.24
CJPPDK 0.002 0.02
Elasticity (eEiM ) and concentration-control (CM
Ei ) coefficients
eEiM at pH 6.0 eEi
M at pH 7.0
PGAM ENO PPDK PGAM ENO PPDK
3PG 0.78 )0.29 0.58 )0.48
2PG )0.24 0.93 )0.31 0.96
PEP )0.01 0.87 )0.07 0.83
AMP 0.87 0.83
PPi )0.49 )0.58 0.87 )0.20 )0.36 0.83
ATP )0.63 )0.26
CMEi at pH 6.0 CM
Ei at pH 7.0
PGAM ENO PPDK PGAM ENO PPDK
2PG 0.86 )0.85 )0.01 0.84 )0.78 )0.06
PEP 0.90 0.24 )1.14 0.89 0.29 )1.18
Table 3. Control analysis in the modeled final segment of E. his-
tolytica glycolysis with 3PG and PPi inhibition at pH 6, physiological
metabolite concentrations, and the presence of PYK. The rate equa-
tion for the PYK reaction was assumed to be that describing a
steady-state Bi Bi ordered reversible mechanism (see the supple-
mentary material). For this equation, in addition to the Keq, it also
required a value for the maximal rate in the reverse reaction, Vr,
which was taken as 0.061 of the Vf value. The PPDK ⁄ PYK activity
ratio was set at 10. The Km values for PEP and ADP were 18 and
1050 lM [12], whereas the Km values for the products Pyr and ATP
were both assumed to be 1000 lM; this last value was also
assigned to KiA, KiP and KiQ. The ADP concentration was fixed at
3.3 mM. The systemic properties and the flux control distribution
were insensitive to changes in the Keq value for the PYK reaction
from 100 to 1000.
0.4 mM 3PG;
0.45 mM PPi;
5.4 mM Pi; 5 mM
ATP; 1.6 mM AMP
0.4 mM 3PG;
0.45 mM PPi;
5.4 mM Pi; 5 mM
ATP; 1.6 mM AMP + PYK
Flux rate,
nmolÆmin)1
7.4 7.4
2PG, lM 19.1 18.8
PEP, lM 20.2 18.9
CJPGAM 0.77 0.77
CJENO 0.18 0.18
CJPPDK 0.05 0.04
CJPYK 0.003
Metabolic modeling validation R. Moreno-Sanchez et al.
3460 FEBS Journal 275 (2008) 3454–3469 ª 2008 The Authors Journal compilation ª 2008 FEBS

fructose 1,6-bisphosphate [Fru(1,6)P2]; the Fru(1,6)
P2-stimulated PYK activity was, however, 3-10-fold
lower than that of PPDK [12,16]. Therefore, with the
experimentally validated model at pH 6, the effect of
including and varying the PYK activity in the relevant
range, keeping the PPDK activity constant, was exam-
ined at physiological concentrations of 3PG, PPi,
AMP, ATP and Pi. Thus, the apparently simple
sequence of reactions for the E. histolytica glycolytic
segment from 3PG to Pyr became a more complex
structure (Scheme 1). By adding PYK to set a
PPDK ⁄PYK activity ratio of 10, the system properties
(flux, metabolites and control coefficients) did not
change significantly with respect to the pathway lack-
ing PYK (Table 3), except for the transfer of some
PPDK flux control to PYK. In turn, at a PPDK ⁄PYK
ratio of 2, under which the phosphoenolpyruvate
concentration decreased by 31.5% owing to a higher
phosphoenolpyruvate–Pyr flux, CJPPDKand CJ
PYK were
0.04 and 0.03, but other systemic properties remained
unchanged.
Glucose fi DHAP segment
Pathway reconstitution
A pseudo steady-state flux from glucose to a-glycero-phosphate was established by coupling amebal recom-
binant HK, HPI, PPi-PFK, ALDO and TPI with
excess commercial a-glycerophosphate dehydrogenase
(aGPDH), following the rate of NADH oxidation and
starting the reaction by adding glucose (data not
shown). Reconstitution of the first pathway segment
with an HK activity range from 25 to 100 mU, main-
taining constant the enzyme proportion for the other
four enzymes (supplementary Fig. S2A), yielded a
near-linear relationship with the flux rate. In the
absence of added TPI, the flux rate lost linearity after
a few seconds; it should be noted, however, that in the
reconstituted first segment coupled to aGPDH, the
TPI reaction functioned in the reverse glycolytic direc-
tion (see Scheme 2).
As expected from amebal ALDO class II proper-
ties [16], in the absence of added CoCl2, the flux
control of the reconstituted system resided entirely in
the ALDO step (supplementary Fig. S2B), as shown
by its extremely low Vmax values (57 mUÆmg)1 pro-
tein at pH 7 and zero at pH 6) [10]. However, an
intracellular concentration of 23 lm for total Co2+
was detected in amebal cells [10]. Moreover, other
heavy metals that also activate ALDO were detected
at significant concentrations (1.6 mm Zn2+, 120 lm
Cu2+; [10]). Therefore, titration of flux in the first
glycolytic segment with different enzyme activities
(Fig. 5) was carried out in the presence of saturating
Co2+; glucose, ATP, PPi and NADH concentrations
were also saturating. The titration curves for each
enzyme activity yielded hyperbolic curves (Fig. 5).
The calculated CJEi at two pH values is shown in
Table 4.
A higher pathway flux rate at pH 7 than at pH 6 is
related to the optimal pH values for HK and ALDO
activities (i.e. around pH 7 [16]), but also to the higher
enzyme proportion used (50 mU HK at pH 7 versus
30–40 mU HK at pH 6). There was no particular
5
10
50
100
150
200
[PPi] (µM)
[PEP]
[2PG]
Flux
Flu
x (n
mo
l·min
–1);
Met
abo
lite
(µM
)
0 200 400 600 800 1000
0 200 400 600 800 1000
0.0
0.1
0.2
0.3
0.4
0.5
0.6
0.7
0.8
PPDK
ENO
PGAM
Flu
x co
ntr
ol c
oef
fici
ent
Fig. 4. Effect of varying the PPi concentra-
tion on pathway parameters of the final gly-
colytic segment. See the legend to Table 3
for modeling details. The dotted line repre-
sents the PPi physiological concentration of
amebal cells.
R. Moreno-Sanchez et al. Metabolic modeling validation
FEBS Journal 275 (2008) 3454–3469 ª 2008 The Authors Journal compilation ª 2008 FEBS 3461

reason for using different enzyme proportions between
pH 6 and 7; it was just a matter of enzyme availability
at the time when the experiments were performed. The
data are comparable because these enzyme proportions
are within the quasi linear relationship with flux (sup-
plementary Fig. S2A). The main flux control was
exerted by HK at both pH values but, somewhat sur-
prisingly, HPI, together with PPi-PFK, and ALDO,
also exerted significant flux control, whereas TPI was a
noncontrolling step (Table 4). The flux control exerted
by HK was enhanced by the addition of AMP, a con-
dition under which HK became the rate-limiting step
(data not shown). The effect of the strong mixed-type
inhibition of AMP (Ki AMP = 24 lm at pH 7 [16]) on
HK flux control was evident in the reconstituted
system only when a high AMP concentration was
used, because the assay normally contained 3 mm ATP
(Km ATP = 77 lm [16] or 89 lm, as redetermined in
the present work; supplementary Table S3). With the
addition of 1.5 mm AMP, and in the presence of 3 mm
ATP at pH 7, the flux of the reconstituted system
decreased by 55.4 ± 12% (n = 3) and the CJHKvalue
increased to 0.89 ± 0.18.
Reconstitution of the first glycolytic segment, includ-
ing amebal glyceraldehyde-3-phosphate dehydrogenase
(GAPDH) and 3-phosphoglycerate kinase was unsuc-
cessful, as recombinant GAPDH has not yet been
maintained in a satisfactorily stable way. Moreover,
reconstitution of the middle segment of glycolysis with
amebal ALDO, TPI, GAPDH and 3-phosphoglycerate
kinase yielded no hyperbolic patterns during enzyme
titrations, which made it difficult to evaluate path-
way behavior and calculate flux control coefficients.
Scheme 2. Metabolic-enzyme interactions in the E.histolytica (Eh)
first glycolytic segment.
0 10 20 30 40 50 60
0
5
10
15
20
25
30
*
Flu
x (n
mo
l·min
–1)
Flu
x (n
mo
l·min
–1)
HK (mU)0 20 40 60 80
0 20 40 60 80
100 120 140
0
5
10
15
20
25
30
*
HPI (mU)
0 20 40 60 80 100 120 140PFK (mU)
0
5
10
15
20
25
30
*
0
5
10
15
20
25
30
*
ALDO (mU)
Fig. 5. Enzyme titration of flux in the recon-
stituted first glycolytic segment The glyco-
lytic reactions from glucose to DHAP were
reconstituted with 40 mU HK, 98 mU HPI,
89.6 mU PPi-PFK, 67.2 mU ALDO, and
1836 mU TPI (1 HK : 2.45 HPI : 2.24 PPi-
PFK : 1.68 ALDO : 45.9 TPI) at pH 6.0 and
37 �C, and in the presence of 3 mM ATP,
1 mM PPi and 0.5 mM CoCl2. The solid lines
represent the fitting of the experimental
points to the irreversible Michaelis–Menten
equation. The calculated CJEi values for this
particular experiment were 0.37, 0.19, 0.28
and 0.08 for HK, HPI, PPi-PFK and ALDO,
respectively.
Metabolic modeling validation R. Moreno-Sanchez et al.
3462 FEBS Journal 275 (2008) 3454–3469 ª 2008 The Authors Journal compilation ª 2008 FEBS

Negligible flux control of glycolysis by the middle-seg-
ment enzymes, as well as other NADH ⁄NAD+-utiliz-
ing steps, has been predicted by the entire pathway
model [10]; hence, the NADH ⁄NAD+ ratio does not
seem to have an important role in the control of ame-
bal glycolytic flux.
Modeling
The kinetic model of the first glycolytic segment was
also built. The equations and kinetic parameters used
are shown in the supplementary Table S3; they can
also be found in previous publications [10,16]. With
the kinetic parameters experimentally determined for
the five enzymes, including those of the reverse reac-
tions, the model predicted that flux was fully con-
trolled by HK (CJHK ¼ 0:99). Such a flux-control
distribution did not correlate with that experimentally
determined by enzyme titration at pH 6 and 7
(Table 4). In consequence, once again, there must be
interactions among the enzymes and metabolites in the
reconstituted pathway that were not apparent in the
enzyme kinetics studies.
Therefore, the effects of ATP, Mg2+, glucose, PPi, Pi
and Co2+ were assayed on the activities of the enzymes
that do not use these metabolites. Glucose (1–10 mm)
did not affect the activities of HPI, PPi-PFK, ALDO or
TPI; Mg2+ (5–10 mm) did not affect the activities of
HPI, ALDO or TPI; and Co2+ (0.5 mm) did not affect
the activities of HK, HPI, PPi-PFK or TPI. On the
other hand, PPi was a competitive inhibitor of ALDO,
with Ki values in the physiological concentration range
(Fig. 6) and, surprisingly, PPi was also a nonessential
mixed-type activator of HK (Fig. 6). The PPi-activating
effect on the recombinant amebal HK became evident
when either Glc6P phosphate dehydrogenase (Fig. 6)
or PYK ⁄LDH (data not shown) were used as coupling
enzymes. Furthermore, PPi also induced a potent acti-
vating effect on the native amebal HK and on the com-
mercially available yeast HK, but had no significant
effect on the HK of rat and human tumor cell (see sup-
plementary Table S4). As the PPi activating effect on
amebal HK was dependent on the protein concentra-
tion added to the assay (at lower protein concentrations
a greater PPi activation is attained) and on the time of
pre-incubation (the enzyme incubated without PPi
becomes inactivated in a time-dependent manner,
whereas the enzyme incubated with PPi maintains an
initial high activity for at least 10 min; data not shown),
the amount of protein added from each biological
source has to be indicated, as well as the specific HK
activity, to be able to make a more rigorous compari-
son (supplementary Table S4).
The HPI activity at pH 7 was not altered by 3 mm
ATP, 1 mm PPi or 1 mm Pi; however, at higher Pi
concentrations (5–10 mm), its activity decreased by
16–41%. Furthermore, the combination of 1 mm
Pi + 1 mm PPi lowered the HPI Vmax by 8–13%. The
presence of 3 mm ATP induced a diminution of 26%
in the PPi-PFK Vmax, whereas 10 mm Mg2+ + 1 mm
PPi decreased, by 19.4%, the ALDO Vmax. Ammo-
nium (7–13 mm) did not affect PPi-PFK activity.
A re-evaluation of the pathway modeling was carried
out by incorporating the PPi effect on ALDO and HK
(see the supplementary Doc. S1 for the rate equation)
activities (see Scheme 2), together with diminished Vmax
(and corresponding Vmax) values for HPI, PPi-PFK and
ALDO, and by using the metabolite concentrations
determined in the pseudo steady-state conditions of the
reconstitution experiments. Other adjustments to the
model are detailed in the legend to Table 5.
With the enhanced HK activity and lower HPI,
PPi-PFK and ALDO activities, the model flux control
distribution correlated better with the experimentally
determined values (Table 4). However, the model
metabolite concentrations were two to three orders of
magnitude higher than those determined experimentally,
indicating that something in the model was still missing,
perhaps a branching reaction as a contaminant of one of
the recombinant enzymes used for the pathway reconsti-
tution. Indeed, by adding a Glc6P branching reaction to
the modified model, it was possible to attain closer val-
ues for flux, metabolite concentrations and flux control
distribution to those directly measured (data not
shown); however, a contaminating Glc6P dehydroge-
nase activity was not detected.
Table 4. Flux control of the in vitro reconstituted first segment of
E. histolytica glycolysis. The Vmax values of the forward reaction
determined in amebal cells (see Table S3; see also table 1 of Ref.
[10]) were used to establish the correct enzyme activity ratios: HK
1 (50 mU): HPI 2.44 (122 mU): PPi-PFK 2.39 (119.5 mU): ALDO
2.95 (147.5 mU): TPI 36.1 (1805 mU) at pH 7.0; and HK 1 (30–
40 mU): HPI 2.45 (73.5–98 mU): PPi-PFK 2.24 (67.2–89.6 mU):
ALDO 1.68 (50.4–67.2 mU): TPI 45.9 (1377–1836 mU) at pH 6.0.
See legend to Table 1 for other experimental details. Fru6P, fruc-
tose 6-phosphate.
pH 6.0 pH 7.0
Flux rate,
nmolÆmin)1
20–25 (30–40 mU HK) 30–50 (50 mU HK)
Glc6P, mM 0.56 ± 0.08 (5) 0.28 ± 0.15 (5)
Fru6P, mM 0.08 ± 0.01 (5) 0.04 ± 0.01 (5)
CJHK 0.46 ± 0.16 (3) 0.48 ± 0.13 (6)
CJHPI 0.18 ± 0.08 (4) 0.23 ± 0.09 (5)
CJPPi�PFK 0.21 ± 0.06 (3) 0.13 ± 0.11 (5)
CJALDO 0.14 ± 0.05 (3) 0.12 ± 0.07 (5)
CJTPI 0 0
R. Moreno-Sanchez et al. Metabolic modeling validation
FEBS Journal 275 (2008) 3454–3469 ª 2008 The Authors Journal compilation ª 2008 FEBS 3463

Modeling experimentation
With the experimentally validated model at pH 7
modified by the PPi effect, it became possible to
examine several questions not easily resolved through
experimentation. In particular, lower and physiologi-
cal glucose and PPi concentrations, which are insuffi-
cient for establishing an experimentally stable pseudo
steady state, could be evaluated. Thus, at 2 mm
glucose and 0.45 mm PPi, together with physiological
concentrations of ATP, ADP, AMP and Pi [10], the
improved model predicted, with high accuracy, the
flux rate and metabolite concentrations (Table 6)
found in live parasites [10], whereas the flux control
resided exclusively in the HK reaction. To explore
whether the high flux control exerted by HK was
caused by the potent inhibition of AMP, flux rate
was analyzed in the experimentally reconstituted first
glycolytic segment (Fig. 7A) and by modeling
(Fig. 7B) at different AMP concentrations. In both
systems, the AMP inhibition of flux was similar,
which added further validation to the glycolysis in
the improved model. The model permitted estimation
of variation in the flux control exerted by HK
(Fig. 7B); at AMP concentrations higher than
0.25 mm [and 2.5 mm ATP (i.e. at ATP ⁄AMP ratios
lower than 10)], HK reached full flux control. Model-
ing also showed that variation in the PPi concentra-
tion (0.1–2 mm) did not affect the HK flux control,
although large changes (9–910% of values at 0.45 mm
PPi) were attained for metabolite concentrations and
flux rate (data not shown).
Another question analyzed in silico was the effect on
flux control of the presence of the ATP-PFK as an
alternative, parallel route. In addition to the well-
described PPi-PFK role in generating Fru(1,6)P2 from
fructose 6-phosphate, the presence of a nontypical
ATP-PFK activity has been established in amebas [11].
The complete reaction sequence for the E. histolytica
glycolytic segment from glucose to DHAP is shown in
Scheme 2. The ATP-PFK activity in amebas corre-
sponds to approximately 7% of the PPi-PFK activity
[10]. Incorporation of this parallel route did not
modify any of the model properties (metabolite con-
centrations, flux or flux-control distribution; data not
shown) and hence HK was the only flux control step.
Discussion
Reconstitution of a pathway segment under
near-physiological conditions
In previous studies with the first glycolytic segment, it
was concluded that either liver HK or glucokinase
(CJHK ¼ 0:77� 0:83) and PFK-1 (CJ
PFK�1 ¼ 0:17� 0:24)
were the main flux control steps, whereas HPI, ALDO
0.0 0.2 0.4 0.6 0.8
0.0 0.2 0.4 0.6
0.0 0.2 0.4 0.6
0.8 1.0
0
100
200
300
400
500
[PPi] (mM)0.250.100.05
0.00
KA(PPi) = 0.05 mM
β = 1.63α = 1.20
HK
act
ivit
y, m
U (
mg
pro
tein
)–1
× 10
3
0
20
40
60
80
100
120pH 6.0
AL
DO
act
ivit
y, m
U (
mg
pro
tein
)–1
x 10
3
0
50
100
150
200 pH 7.0
FBP (mM)
[ATP] (mM)
Fig. 6. PPi activation of amebal HK and PPi inhibition of amebal ALDO. The reaction at 37 �C was started by adding 0.085 lg of HK or
0.36 lg of ALDO. For the HK plot (at pH 7) the solid lines represent the best fit to nonessential mixed-type activation (see the supplemen-
tary Doc. S1 for the rate equation); the values of a (the factor affecting ATP binding to the enzyme–PPi complex), b (the factor affecting
Vmax), and Kact PPi (the activation constant) refer only to this particular experiment. The mean values are shown in the legend to Table 5. For
ALDO experiments, the PPi concentrations (mM) were: closed squares, 0; open circles, 0.3; and open triangles, 1. The lines represent the
best fit to a competitive inhibition-type equation. The Vmax [mU · (mg protein)1)], Km (mM) and Ki (mM) values were: 118, 0.085 and 0.21 at
pH 6.0; and 213, 0.029 and 0.42 at pH 7.0, respectively.
Metabolic modeling validation R. Moreno-Sanchez et al.
3464 FEBS Journal 275 (2008) 3454–3469 ª 2008 The Authors Journal compilation ª 2008 FEBS

and TPI exerted no control [6–8]. For the final reconsti-
tuted segment from 3PG to Pyr, Giersch [9] showed that
PYK (CJPYK ¼ 0:8� 1:0) and ENO (CJ
ENO ¼ 0:16� 0:18)
controlled flux, with PGAM having negligible control.
Unfortunately, these studies were carried out under
nonphysiological conditions regarding temperature, pH,
ammonium concentration (this cation is a potent activa-
tor of PFK-1 at millimolar concentrations) or, perhaps
more importantly, at enzyme proportions that did not
correspond with those found in the respective biological
systems.
It may not be biologically relevant to identify one
given enzyme as the main controlling step by pathway
reconstitution experiments if the amount of added
enzyme is below the physiological level, thus imposing a
flux limitation where there should have been none. The
addition of arbitrary proportions of enzymes affects all
the system properties: flux rate, steady-state concentra-
tion of metabolites and flux control distribution.
For instance, in a previous work [16], the E. histoly-
tica final glycolytic segment was reconstituted at pH 7
with an enzyme proportion similar (1 PGAM; 10.6
ENO; 1.6 PPDK), but not identical, to that deter-
mined in amebas (1 PGAM; 5.8 ENO; 3 PPDK) [10].
With such higher ENO activity and lower PPDK activ-
ity, the flux control resided mostly in the PPDK
(CJPPDK ¼ 0:52), whereas at a lower PPDK active con-
tent (PPDK ⁄PGAM = 0.1–0.25), PPDK became a
typical rate-limiting step (CJPPDK ¼ 1:0). In contrast,
Table 6. Control analysis in the modeled first segment of
E. histolytica glycolysis at pH 7 and at physiological concentrations
of glucose, PPi, ATP, ADP, AMP and Pi. Fru6P, fructose 6-phos-
phate.
2 mM glucose; 0.45 mM
PPi; 5 mM ATP; 3.3 mM
ADP; 1.6 mM AMP; 5.4 mM Pi
Flux rate, nmolÆmin)1 25.6
Glc6P, mM 4.7
Fru6P, mM 0.67
Fru(1,6)P2, mM 0.052
CJHK 0.997
CJHPI 0.0006
CJPPi�PFK 0.0009
CJALDO 0.0014
CJTPI 0.000005
0.00.51.020
40
60
80
100
IC50 = 480 µM
CJ
HK
Flu
x (n
mo
l·min
–1)
[AMP] (µM)
0 500 15001000 2000
0 500 15001000 2000
0
5
10
15
20
IC50 = 300 µM
A
B
Fig. 7. Effect of varying the AMP concentration on flux of the first
glycolytic segment. (A) Reconstituted pathway. The line represents
the fitting of the experimental points to the first-order exponential
decay rate equation. (B) Modeled pathway. IC50, AMP concentra-
tion required to reach half-maximal inhibition.
Table 5. Control analysis in the modeled first segment of E. histo-
lytica glycolysis with PPi activation of HK and PPi inhibition of
ALDO. The values of the kinetic parameters used in the model are
shown in Table S3. The concentrations of ATP (2.5 mM), PPi
(0.5 mM), ADP (0.5 mM), AMP (0.03 mM) and Pi (0.5 mM) were
fixed. These values were reached in the reconstituted system
around the middle of the pseudo steady-state duration (data not
shown). The PPi activation in the HK rate equation involves, at
pH 7, a b value (factor affecting Vmax) of 1.6 ± 0.09 (n = 4), an a
value (factor affecting ATP binding to the enzyme–PPi complex) of
1.38 ± 0.25 (n = 4), and a Kact PPi of 67.5 ± 57 lM (n = 4); at pH 6
the same constants were 1.45, 1.2 and 150 lM, respectively. The
Vmax and Vmax values for HPI, PPi-PFK and ALDO were diminished
by 40, 25 and 40%, respectively, at pH 7, and by 40, 15 and 20%
at pH 6. Other changes were: for HK, the c value (the factor affect-
ing substrate binding induced by AMP) was 2.5 at pH 7 and 1.3 at
pH 6; for PPi-PFK, the a (the factor affecting binding of the second
substrate to the enzyme–first substrate complex) and b (the factor
affecting binding of the second product to the enzyme–first product
complex) values were 1.2 and 0.5 at pH 7, and 1 and 1 at pH 6,
respectively: for ALDO, instead of using the Ki PPi value of 430 lM
obtained experimentally at pH 7, the model required the diminution
of this value to 43 lM (at pH 6, the Ki PPi was unaltered), whereas
variation of the a value (the factor affecting binding of the second
product to the first product–enzyme complex) from 0.1 to 5 did not
alter any system or control property. Fru6P, fructose 6-phosphate.
pH 6.0 pH 7.0
Flux rate, nmolÆmin)1 105 (50 mU HK) 125.5 (50 mU HK)
Glc6P, mM 351 585
Fru6P, mM 47 9.2
Fru(1,6)P2, mM 0.9 0.83
CJHK 0.68 0.54
CJHPI 0.06 0.21
CJPPi�PFK 0.18 0.17
CJALDO 0.08 0.08
CJTPI 0.0002 0.0004
R. Moreno-Sanchez et al. Metabolic modeling validation
FEBS Journal 275 (2008) 3454–3469 ª 2008 The Authors Journal compilation ª 2008 FEBS 3465

with the correct enzyme proportion, PGAM was the
main controlling step (see Table 1). Giersch [9] recon-
stituted the final glycolytic segment of rabbit skeletal
muscle with an enzyme proportion of 1 PGAM; 1
ENO; 1 PYK, and at a pH of 7.6 and at room temper-
ature. Under such nonphysiological conditions, the
control of flux was exerted mainly by PYK. By using
the well-documented physiological enzyme proportion
found in skeletal muscle, of 1 PGAM; 1.6 ENO; and
3.8 PYK [18], it is expected that the PYK flux control
should diminish. Therefore, it is highly crucial in path-
way reconstitution analyses to use the correct, physio-
logical proportion of enzymes to draw biologically
meaningful conclusions about the pathway’s flux con-
trol distribution.
The physiological catalytic efficiency (Vmax ⁄Km)
sequence order for the final reconstituted segment is
PPDK>ENO�PGAM at both pH values of 6 and 7
(supplementary Table S1). However, a more rigorous
comparison of catalytic efficiencies was elaborated by
Heinrich & Rapoport [19], who considered the efficien-
cies for the forward as well as the reverse reactions in
their analysis of linear enzymatic chains. By using the
kinetic parameters reported in the previous publication
for the forward and reverse reactions of PGAM, ENO
and PPDK [16], it was possible to establish that the
net catalytic efficiency [(Vmax ⁄Km S) ) Vmax ⁄Km P)]
sequence order was identical to that described above
for the forward reaction. It should be noted that the
described expression for the net catalytic efficiency
only applies to enzymes with one substrate and one
product. For bireactant and ter-reactant enzymes, the
correct expression is: [Vmax ⁄ (Km S1 x Km S2 x ÆÆ) )Vmax ⁄ (Km P1 x Km P2 x ÆÆ)]. It should also be noted
that the catalytic efficiency is inversely related to the
flux control coefficient [20]. Both the experimentally
determined and the modeled flux control distribution
of the final glycolytic segment were in agreement with
the catalytic efficiency sequence (i.e. higher flux control
with lower catalytic efficiency) because the control
sequence was PGAM�ENO>PPDK. The higher flux
control exerted by ENO, in comparison to that exerted
by PPDK, is a result of the PPi (and 3PG) competitive
inhibition, which increases the Km value and hence
decreases the catalytic efficiency. Therefore, to have an
initial semiquantitative appreciation of flux control
distribution in a given pathway, it may be useful to
compare catalytic efficiencies.
Although the PPDK Km values for products were
determined in the present work, the rate equation for
this enzyme (Uni Uni Bi Bi Ping Pong-Ordered) [17],
contains several other kinetic constants (Ki A, Ki B,
Ki C, Ki P, Ki Q, Ki R), for which no experimental deter-
mination has been carried out. Simplifying the rate
equation for PPDK to Bi Bi Ping Pong might have
some validity under in vivo conditions because the total
concentrations of ATP and AMP are certainly present
at saturating conditions [10]; however, for the in vitro
reconstituted system, this logic does not apply because
the concentrations of ATP and AMP used were not
saturating. Therefore, an empirical rate equation that
included the six PPDK ligands substituted for the Uni
Uni Bi Bi Ping Pong-Ordered equation; however, the
six-ligands equation did not completely account for the
PPDK behavior in the reconstituted system. Moreover,
the refined model with PGAM and ENO inhibition by
PPi and with the PPDK simpler Bi Bi Ping Pong equa-
tion, simulated better the experimentally determined
flux control coefficient distribution. Therefore, further
refinement of the PPDK equation is still required.
Modeling of other pathways containing ter-reactant or
cooperative enzymes (e.g. GAPDH, ATP-PFK) has
also used simplified rate equations. It might be possible
to achieve better modeling results if not-so-simplified
rate equations are used.
The Vmax ⁄Km sequence order for the first glycolytic
reconstituted segment is ALDO>TPI�HK>>>PPi-
PFK>HPI (supplementary Table S3), whereas the
experimentally determined and modeled flux-control
distribution indicated the sequence HK>HPI,
PPi-PFK>ALDO�TPI (see Table 4). Hence, there
must be additional interactions of metabolites with HK
and ALDO that decrease their catalytic efficiencies. The
predominant HK flux-control is explained by the strong
AMP inhibition (see Fig. 7), under which even a small
contaminating concentration of AMP, derived from
added ATP, exerts a potent inhibition on HK, thus sur-
passing the PPi activation. In turn, ALDO was inhibited
by PPi. It might be of value to investigate the PPi modu-
lating effect on glycolytic enzymes in other organisms,
to identify relevant, but currently ignored, interactions
that might affect flux control.
The experimentally validated models of the final and
first glycolytic segments allowed simulation of the sys-
tem behavior under low, physiological concentrations
of metabolites and the incorporation of alternative,
parallel routes. The predictions from both models were
in agreement with the model of the complete pathway
[10]: HK and PGAM are the main controlling steps of
glycolysis.
Unveiling hidden interactions in a metabolic
pathway
The model for the final glycolytic segment at pH 6, with
PPi and 3PG inhibition on ENO activity, was robust
Metabolic modeling validation R. Moreno-Sanchez et al.
3466 FEBS Journal 275 (2008) 3454–3469 ª 2008 The Authors Journal compilation ª 2008 FEBS

regarding changes in the ENO Km phosphoenolpyruvate
and Ki PPi values and all PPDK Km values (for
phosphoenolpyruvate, PPi, AMP, Pyr, ATP and Pi), but
was less robust for variations in the ENO Km 2PG.
Certainly, Km 2PG is the kinetic parameter most affected
by other metabolites distinct from the substrate (double-
competitive inhibition exerted by PPi and 3PG). Thus,
it was relevant to re-evaluate the determination of this
parameter (see supplementary Table S1 for values);
however, no significant difference from the previously
reported value was found, although the slightly higher
ENO Km 2PG favored the model robustness. A more
robust model may be expected with the incorporation
of a greater number of reactions, as demonstrated in
previous work on the complete glycolytic pathway [10].
HK activity in E. histolytica is strongly modulated
by AMP [10,16]. However, at a high physiological
ATP concentration of 5 mm, the AMP inhibition may
be attenuated if micromolar inhibitor concentrations
are used. Thus, to overcome the presence of high con-
centrations of ATP, AMP also has to be present at
millimolar concentrations. Determination of the AMP
concentration in amebas under steady-state conditions
revealed that this metabolite was indeed at an unusu-
ally high concentration of 1.6 mm [10]. Therefore, the
effect of millimolar concentrations of AMP on flux
rate and flux control distribution of the reconstituted
first glycolytic segment may have physiological rele-
vance because at this high AMP concentration it is
expected that HK could be the main flux control step,
as demonstrated by modeling the complete glycolytic
amebal pathway [10].
The activation of HK by PPi has not been previously
described for HK from other sources. For human HKs,
the product Gluc6P acts as a potent inhibitor. It has
been described that the HK-binding site for Gluc6P can
be blocked by PPi [21], thus inducing de-inhibition or
pseudo-activation. As Gluc6P does not affect amebal
HK [10,16], it is probable that the PPi activation is
exerted through a different mechanism. Such an activa-
ting PPi effect was observed when the amebal recom-
binant HK activity was coupled to either Gluc6P
dehydrogenase (for Gluc6P generation) or PYK ⁄LDH
(for ADP formation), discarding an unspecific effect of
PPi on the coupling enzymes. Moreover, PPi activation
was also shown on native amebal and yeast HK
enzymes (see supplementary Table S4), but not on
tumor HK enzymes that are inhibited by Gluc6P.
In conclusion, the combination of enzyme titration
of the in vitro reconstituted pathway flux with model-
ing and enzyme kinetics allows for a better under-
standing of the pathway behavior and control
properties. Thus, considering the absence of cytosolic
pyrophosphatases, the low PPi concentration in troph-
ozoites, as well as the presence of PPi-dependent
enzymes in amebal metabolism [13] and the PPi modu-
lation of HK, ALDO, PGAM and ENO (this work), it
is suggested that PPi has a central regulatory function
in the parasite (modeling predicted that a relatively
small variation in the PPi concentration affects flux-
control distribution). AMP also appears as another
important regulatory metabolite in amebal glycolysis
as a substrate of the last glycolytic enzyme (PPDK)
and an inhibitor of the first enzyme (HK). Modeling
of the entire amebal glycolysis predicted negligible reg-
ulatory roles for the ATP ⁄ADP and NADH ⁄NAD+
ratios [10]. Therefore, with the replacement of the typi-
cal highly exergonic reactions of cooperative ATP-
PFK and PYK by the noncooperative (hyperbolic)
PPi-PFK and PPDK, it seems that the information
transfer and regulatory mechanisms of amebal glycoly-
sis are mediated by AMP and PPi.
Amebal PPi-dependent enzymes (PPi-PFK and
PPDK) have been traditionally considered as appropri-
ate drug targets for therapeutic intervention in amebia-
sis, because these enzymes are not present in the
human host [2,3,13]. Furthermore, some PPi analogs
that inhibit these enzymes indeed decrease parasite
growth [22–24] (although in these studies no measure-
ment of glycolytic fluxes or in vivo enzyme inhibition
was made to determine the specificity of glycolysis
blockade). By describing the enzyme kinetics of amebal
glycolytic enzymes [16] and by applying metabolic con-
trol analysis to kinetic modeling [10] and pathway
reconstitution (the present work), we found that PPi-
dependent enzymes are not the main flux control steps
of amebal glycolysis and, in consequence, highly spe-
cific and very potent inhibitors for these enzymes have
to be used in order to affect the glycolytic flux and
ATP level. By contrast, other enzymes not considered
therapeutically relevant have been revealed as potential
drug targets because of their high flux control coeffi-
cient (HK, PGAM and perhaps the glucose trans-
porter) or their divergence from the human host
(ALDO and PGAM). The PPi modulation of HK,
ALDO, PGAM and ENO found in the present work
may open new venues for drug target evaluation.
Materials and methods
Chemicals
3PG, AMP, PPi, ATP, NADH, glucose, MgCl2, CoCl2,
PYK, LDH, ALDO, Glc6P dehydrogenase, TPI and
aGPDH were from Roche (Mannheim, Germany) or Sigma
(St Louis, MO, USA).
R. Moreno-Sanchez et al. Metabolic modeling validation
FEBS Journal 275 (2008) 3454–3469 ª 2008 The Authors Journal compilation ª 2008 FEBS 3467

Enzyme preparation and storage
The over-expressed recombinant enzymes from E. histolytica
(i.e. PGAM, ENO, PPDK, HK, HPI, PPi-PFK, ALDO and
TPI) were prepared as previously described [16]. Thereafter,
the purified enzymes were concentrated by ultrafiltration and
centrifugation through Amicon filters (Millipore, Billerica,
MA, USA); glycerol was added to a final concentration of
50% and the concentrated enzymes were stored at )20 �C.The protein concentrations were 2–18 mgÆmL)1. Under these
storage conditions, the enzyme activities showed minimal loss
of activity for at least 6 months. In some enzymes, 50%
activity loss was observed only after 12 months.
Enzyme kinetics assays
To reconstitute the final and first glycolytic segments under
the correct enzyme proportions, the activities of PGAM,
ENO and PPDK (final segment) and of HK, HPI,
PPi-PFK, ALDO and TPI (first segment), were always
determined in the forward reaction prior to starting the
reconstitution experiment at both pH 6.0 and 7.0, and at
37 �C. The enzymatic assay conditions were as previously
described [16], using a buffer mixture of 50 mm imidazole,
10 mm acetate, 10 mm Mes and 10 mm Tris, adjusted to
pH 6.0 or 7.0. The stock solutions for enzymatic activities
and for reconstitution experiments (3PG, ATP, AMP,
glucose and PPi) were routinely calibrated.
Pathway reconstitution
Final segment
The reaction assay medium contained 10 mm MgCl2,
0.5 mm AMP, 0.15–0.2 mm NADH, 2 mm PPi, 10–15 units
(at pH 7) or 20–30 units (at pH 6) of LDH (suspension in
ammonium sulfate; activity as supplied by the manufac-
turer) and the E. histolytica recombinant enzymes PGAM,
ENO and PPDK at the indicated enzyme ratios and at
37 �C. When varying one enzyme concentration, the other
enzymes were kept at a constant ratio. Where indicated,
3 mm ATP + 10 mm Pi were included in the reaction med-
ium. To avoid precipitation, PPi, ATP and Pi were added
after mixing the reaction assay with the pH buffer mixture.
The reaction was initiated 3–4 min later by adding 4 mm
3PG. No NADH oxidation was attained in the absence of
either PPi or AMP in the presence of 3PG.
First segment
The reaction assay medium contained 10 mm MgCl2,
0.5 mm CoCl2, 0.15–0.2 mm NADH, 3 mm ATP, 1 mm PPi
and 7 (pH 7) or 10 (pH 6) units of aGPDH (ammonium
suspension; activity as supplied by the manufacturer) in the
pH buffer mixture at pH 6.0 or 7.0. The E. histolytica
recombinant enzymes HK, HPI, PPi-PFK, ALDO and TPI
were added at the indicated ratios and the reaction was
incubated at 37 �C. After a short pre-incubation of 3.5–
4 min, the reaction was started by adding 10 mm glucose.
With glucose added, no NADH oxidation was observed in
the absence of either ATP or PPi.
Determination of metabolites
The reconstituted final and first glycolytic segments were
allowed to reach a pseudo steady state. Then, aliquots were
withdrawn at two different time-points and mixed with 3%
(v ⁄ v) ice-cold perchloric acid in the presence of 1 mm
EDTA. The samples were centrifuged and the supernatant
was neutralized with a solution of 3 m KOH ⁄ 0.1 m Tris
and stored at )70 �C. The amounts of 2PG and
phosphoenolpyruvate (final segment) and of Glc6P and
fructose 6-phosphate (first segment) were determined by use
of standard enzymatic assays [16].
Acknowledgement
The present work was partially supported by grant
numbers 60517 and 46719-Q from CONACyT-Mexico.
References
1 Upcroft P & Upcroft JA (2001) Drug targets and mech-
anisms of resistance in the anaerobic protozoa. Clin
Microbiol Rev 14, 150–164.
2 Saavedra-Lira E & Perez-Montfort R (1996) Energy
production in Entamoeba histolytica: new
perspectives in rational drug design. Arch Med Res 27,
257–264.
3 Mansour TE (2002) Chemotherapeutic Targets in Para-
sites. Cambridge University Press, Cambridge. 226 pp.
4 Fell D (1997) Understanding the Control of Metabolism.
Portland Press, London. ISBN 1 85578 047 X.
5 Moreno-Sanchez R, Saavedra E, Rodrıguez-Enrıquez S
& Olın-Sandoval V (2008) Metabolic control analysis: a
tool for designing strategies to manipulate metabolic
pathways. J Biomed Biotechnol, in press.
6 Torres NV, Mateo F, Melendez-Hevia E & Kacser H
(1986) Kinetics of metabolic pathways. A system
in vitro to study the control of flux. Biochem J 234,
169–174.
7 Melendez-Hevia E, Mateo F & Torres NV (1992)
Control analysis of rat liver glycolysis under different
glucose concentrations. The substrate approach and
the role of glucokinase. Mol Cell Biochem 115, 1–9.
8 Puigjaner J, Rais B, Burgos M, Comin B, Ovadi J &
Cascante M (1997) Comparison of control analysis data
using different approaches: modelling and experiments
with muscle extract. FEBS Lett 418, 47–52.
Metabolic modeling validation R. Moreno-Sanchez et al.
3468 FEBS Journal 275 (2008) 3454–3469 ª 2008 The Authors Journal compilation ª 2008 FEBS

9 Giersch C (1995) Determining elasticities from multiple
measurements of flux rates and metabolite concentra-
tions. Application of the multiple modulation method to
a reconstituted pathway. Eur J Biochem 227, 194–201.
10 Saavedra E, Marın-Hernandez A, Encalada R, Olivos
A, Mendoza-Hernandez G & Moreno-Sanchez R (2007)
Kinetic modeling can describe in vivo glycolysis in
Entamoeba histolytica. FEBS J 274, 4922–4940.
11 Chi AS, Deng Z, Albach RA & Kemp RG (2001) The
two phosphofructokinase gene products of Entamoeba
histolytica. J Biol Chem 276, 19974–19981.
12 Saavedra E, Olivos A, Encalada R & Moreno-Sanchez
R (2004) Entamoeba histolytica: kinetic and molecular
evidence of a previously unidentified pyruvate kinase.
Exp Parasitol 106, 11–21.
13 Reeves RE (1984) Metabolism of Entamoeba histolytica
Schaudinn, 1903. Adv Parasitol 23, 105–142.
14 Deng Z, Huang M, Singh K, Albach RA, Latshaw SP,
Chang KP & Kemp RG (1998) Cloning and expression
of the gene for the active PPi-dependent phosphofructo-
kinase of Entamoeba histolytica. Biochem J 329, 659–
664.
15 Saavedra-Lira E, Ramırez-Silva L & Perez-Montfort R
(1998) Expression and characterization of recombinant
pyruvate phosphate dikinase from Entamoeba histo-
lytica. Biochim Biophys Acta 1382, 47–54.
16 Saavedra E, Encalada R, Pineda E, Jasso-Chavez R &
Moreno-Sanchez R (2005) Glycolysis in Entamoeba his-
tolytica. Biochemical characterization of recombinant
glycolytic enzymes and flux control analysis. FEBS J
272, 1767–1783.
17 Varela-Gomez M, Moreno-Sanchez R, Pardo JP &
Perez-Montfort R (2004) Kinetic mechanism and meta-
bolic role of pyruvate phosphate dikinase from Ent-
amoeba histolytica. J Biol Chem 279, 54124–54130.
18 Newsholme EA & Start C (1973) Regulation of Meta-
bolism. John Wiley & Sons, London.
19 Heinrich T & Rapoport TA (1974) A linear steady-state
treatment of enzymatic chains. General properties, con-
trol and effector strength. Eur J Biochem 42, 89–95.
20 Kacser H & Burns JA (1973) The control of flux. Symp
Soc Exp Biol 27, 65–104.
21 White TK & Wilson JE (1990) Binding of nucleoside
triphosphates, inorganic phosphate, and other
polyanionic ligands to the N-terminal region of rat
brain hexokinase: relationship to regulation of
hexokinase activity by antagonistic interactions between
glucose-6-phosphate and inorganic phosphate. Arch Bio-
chem Biophys 277, 26–34.
22 Eubank WB & Reeves RE (1982) Analog inhibitors for
the pyrophosphate-dependent phosphofructokinase of
Entamoeba histolytica and their effect on culture
growth. J Parasitol 68, 599–602.
23 Bruchhaus I, Jacobs T, Denart M & Tannich E (1996)
Pyrophosphate-dependent phosphofructokinase of Ent-
amoeba histolytica: molecular cloning, recombinant
expression and inhibition by pyrophosphate analogues.
Biochem J 316, 57–63.
24 Ghosh S, Chan JM, Lea CR, Meints GA, Lewis JC,
Tovian ZS, Flessner RM, Loftus TC, Bruchhaus I,
Kendrick H et al. (2004) Effects of bisphosphonates
on the growth of Entamoeba histolytica and Plasmo-
dium species in vitro and in vivo. J Med Chem 47,
175–187.
Supplementary material
The following supplementary material is available
online:
Doc. S1. Rate equations.
Fig. S1. Effect of varying the Km values on flux control
coefficient and, rate and metabolite concentrations at
pH 6.0.
Fig. S2. (A) Flux rate- enzyme proportion relationship
for the first glycolytic segment. (B) Flux control by
ALDO in the absence of added Co2+ in the reconsti-
tuted upper segment.
Table S1. Kinetic parameters of the enzymes in the
final E. histolytica glycolytic segment.
Table S2. Control analysis in the modeled final
segment of E. histolytica glycolysis.
Table S3. Kinetic parameters of the enzymes in the
first E. histolytica glycolytic segment.
Table S4. Effect of PPi on the HK activity from differ-
ent sources.
This material is available as part of the online article
from http://www.blackwell-synergy.com
Please note: Blackwell Publishing are not responsible
for the content or functionality of any supplementary
materials supplied by the authors. Any queries (other
than missing material) should be directed to the corre-
sponding author for the article.
R. Moreno-Sanchez et al. Metabolic modeling validation
FEBS Journal 275 (2008) 3454–3469 ª 2008 The Authors Journal compilation ª 2008 FEBS 3469