The prognostic significance of electrocardiographic changes in Chagas disease
6
The prognostic significance of electrocardiographic changes in Chagas disease Bruno Ramos Nascimento, MD, a, ⁎ Christiano Gonçalves Araújo, MD, a,b Manoel Otávio Costa Rocha, PhD, b José Darlan Pinheiro Domingues, MD, b Aline Braga Rodrigues, MD, b Márcio Vinicius Lins Barros, PhD, a Antonio Luiz Pinho Ribeiro, PhD a,b a Serviço de Cardiologia e Cirurgia Cardiovascular, Hospital das Clínicas da Universidade Federal de Minas Gerais, 30130-100, Belo Horizonte, Brazil b Programa de Pós-Graduação em Ciências da Saúde: Infectologia e Medicina Tropical, Faculdade de Medicina, Universidade Federal de Minas Gerais, 30130-100, Belo Horizonte, Brazil Received 24 November 2010 Abstract Introduction: The meaning of electrocardiographic changes appearing during the clinical follow-up of Chagas disease (ChD) is unknown. In this study, a patient cohort with ChD was followed to describe the electrocardiographic changes that may make it possible to identify patients whose left ventricular function has deteriorated. Methods: The study sample consisted of a prospective cohort followed since 1998 to 1999, involving 220 patients aged 15 to 55 years, 30 controls, and 190 with ChD, without other comorbidities. The group was reexamined between 2004 and 2006, and new electrocardiograms were obtained for 153 patients, 25 (83%) of 30 in the control group and 128 (72%) of 177 in the ChD group. Electrocardiographic variables associated with a significant decrease in ejection fraction (5% or more) were identified. Results: A significant decrease in ejection fraction was observed in 21 patients in the ChD group (18.7%) but in none of the non-ChD group (P = .024). Only the presence of a new electrocardiographic abnormality and an increase in QRS duration correlated with a decrease in an ejection fraction of 5% or more. QRS duration was correlated with both an increase in left ventricle diastolic diameter and a deterioration in the ejection fraction (r s = 0.225, P = .017, and r s = −0.300, P b .001). A QRS increase of 5 milliseconds had 77.8% sensitivity and 62.2% specificity for identifying patients with significant decrease in ejection fraction. Conclusion: The increase in the duration of the QRS complex and the appearance of new electrocardiographic alterations may help in identifying patients with a significant decrease (of 5% or more) in left ventricle ejection fraction. © 2011 Elsevier Inc. All rights reserved. Keywords: Chagas disease; Cardiomyopathy; Electrocardiography; Echocardiography; Prognosis Introduction Chagas disease (ChD) continues to be a serious health problem in the countries of Latin America. Approximately 8 million people are infected, of which 25% to 35% show cardiovascular abnormalities. Chagas cardiomyopathy (ChCM) is the most feared complication, making it important to detect possible changes in the clinical situation or in complementary examinations that indicate that closer moni- toring or specialized therapeutic interventions are necessary. 1,2 Chagas cardiomyopathy is the most common clinical manifestation in ChD and the greatest cause of morbidity and mortality. It may be asymptomatic or may appear in 3 clinical forms: with the signs and symptoms of heart failure, with the presence of complex arrhythmias, or with cardioembolic events. Heart failure begins with a predom- Available online at www.sciencedirect.com Journal of Electrocardiology xx (2011) xxx – xxx www.jecgonline.com Abbreviations: ECG, electrocardiogram; ChD, Chagas disease; ChCM, Chagas cardiomyopathy; QRS, QRS complex of the electrocardiogram; LVEF, left ventricular ejection fraction; IIF, indirect immunofluorescence; IHA, indirect hemagglutination; UFMG, Universidade Federal de Minas Gerais, Brazil. ⁎ Corresponding author. Rua Tenente Anastácio de Moura, 740/602, Belo Horizonte, 30240-390. MG, Brazil. E-mail address: [email protected] 0022-0736/$ – see front matter © 2011 Elsevier Inc. All rights reserved. doi:10.1016/j.jelectrocard.2011.04.011
-
Upload
independent -
Category
Documents
-
view
1 -
download
0
Transcript of The prognostic significance of electrocardiographic changes in Chagas disease

Available online at www.sciencedirect.com
Journal of Electrocardiology xx (2011) xxx–xxxwww.jecgonline.com
The prognostic significance of electrocardiographic changesin Chagas disease
Bruno Ramos Nascimento, MD,a,⁎ Christiano Gonçalves Araújo, MD,a,b
Manoel Otávio Costa Rocha, PhD,b José Darlan Pinheiro Domingues, MD,b
Aline Braga Rodrigues, MD,b Márcio Vinicius Lins Barros, PhD,a
Antonio Luiz Pinho Ribeiro, PhDa,b
aServiço de Cardiologia e Cirurgia Cardiovascular, Hospital das Clínicas da Universidade Federal de Minas Gerais, 30130-100, Belo Horizonte, BrazilbPrograma de Pós-Graduação em Ciências da Saúde: Infectologia e Medicina Tropical, Faculdade de Medicina, Universidade Federal de Minas Gerais,
30130-100, Belo Horizonte, Brazil
Received 24 November 2010
Abstract Introduction: The meaning of electrocardiographic changes appearing during the clinical follow-up
Abbreviations: ECChagas cardiomyopatLVEF, left ventricularIHA, indirect hemaggGerais, Brazil.
⁎ CorrespondingBelo Horizonte, 30240
E-mail address: ra
0022-0736/$ – see frodoi:10.1016/j.jelectroc
of Chagas disease (ChD) is unknown. In this study, a patient cohort with ChD was followed todescribe the electrocardiographic changes that may make it possible to identify patients whose leftventricular function has deteriorated.Methods: The study sample consisted of a prospective cohort followed since 1998 to 1999, involving220 patients aged 15 to 55 years, 30 controls, and 190 with ChD, without other comorbidities. Thegroup was reexamined between 2004 and 2006, and new electrocardiograms were obtained for 153patients, 25 (83%) of 30 in the control group and 128 (72%) of 177 in the ChD group.Electrocardiographic variables associated with a significant decrease in ejection fraction (5% or more)were identified.Results: A significant decrease in ejection fraction was observed in 21 patients in the ChD group(18.7%) but in none of the non-ChD group (P = .024). Only the presence of a newelectrocardiographic abnormality and an increase in QRS duration correlated with a decrease inan ejection fraction of 5% or more. QRS duration was correlated with both an increase in leftventricle diastolic diameter and a deterioration in the ejection fraction (rs = 0.225, P = .017, and rs =−0.300, P b .001). A QRS increase of 5 milliseconds had 77.8% sensitivity and 62.2% specificity foridentifying patients with significant decrease in ejection fraction.Conclusion: The increase in the duration of the QRS complex and the appearance of newelectrocardiographic alterations may help in identifying patients with a significant decrease (of 5% ormore) in left ventricle ejection fraction.© 2011 Elsevier Inc. All rights reserved.
Keywords: Chagas disease; Cardiomyopathy; Electrocardiography; Echocardiography; Prognosis
Introduction
Chagas disease (ChD) continues to be a serious healthproblem in the countries of Latin America. Approximately
G, electrocardiogram; ChD, Chagas disease; ChCM,hy; QRS, QRS complex of the electrocardiogram;ejection fraction; IIF, indirect immunofluorescence;lutination; UFMG, Universidade Federal de Minas
author. Rua Tenente Anastácio de Moura, 740/602,-390. MG, [email protected]
nt matter © 2011 Elsevier Inc. All rights reserved.ard.2011.04.011
8 million people are infected, of which 25% to 35% showcardiovascular abnormalities. Chagas cardiomyopathy(ChCM) is the most feared complication, making it importantto detect possible changes in the clinical situation or incomplementary examinations that indicate that closer moni-toring or specialized therapeutic interventions are necessary.1,2
Chagas cardiomyopathy is the most common clinicalmanifestation in ChD and the greatest cause of morbidity andmortality. It may be asymptomatic or may appear in 3clinical forms: with the signs and symptoms of heart failure,with the presence of complex arrhythmias, or withcardioembolic events. Heart failure begins with a predom-

2 B.R. Nascimento et al. / Journal of Electrocardiology xx (2011) xxx–xxx
inance of left ventricular dysfunction, progressing tobiventricular events, often associated with right ventriculardysfunction.3-6 The presence of complex ventricular ar-rhythmias, a peculiarity of this cardiomyopathy, translatesinto increased risk of sudden death and is a significantdetermining prognostic factor for survival.3,5,7 Echocardi-ography is an essential complementary method for evaluat-ing ChCM, making it possible to determine the state ofprogress and the seriousness of the cardiac impairment,giving an estimate of the degree of left ventricle (LV)dysfunction and hence supplying fundamental data to guidetherapy and prognosis.3,4,8-11 Standing out among theevaluated parameters are the presence of global systolicventricular dysfunction of the LV measured by the leftventricular ejection fraction (LVEF), the occurrence ofsegment abnormalities, the presence of LV apical aneu-rysms, and an increase in the size and dysfunction of theright ventricle.3,12
Several examinations can easily be performed on out-patients to provide valuable information about the prognosisof ChCM, the probability of the biventricular functiondeterioration, and the development of more serious condi-tions. These examinations correlate well with abnormalitiesin the echocardiogram. One of these methods is theelectrocardiogram (ECG), a routine, low-cost examinationthat may show a variety of abnormalities during follow-up.Several studies2 have presented clinically valuable data forcorrelating ECG with findings from complementary exam-inations and for composing the various scores used inprognosis.2,7,13 The medium-term prognosis of a personexperiencing ChD with a normal ECG is known to beexcellent. It is proposed that after the first nonspecificabnormalities are seen, the tendency is for increasinglycomplex abnormalities to appear, which occur mostfrequently in patients with more advanced cardiomyopathyand poorer prognosis.2,3,5,14-17
Hence, it is relevant to determine the significance ofelectrocardiographic changes when treating patients withChD, correlating the occurrence of new ECG abnormalitieswith possible deterioration in the echocardiographic param-eters. The objective of this study was to describe theelectrocardiographic changes during a period of up to 8 years(mean, 6.8 years) for ChD, correlating the abnormalitiesfound in this period with significant changes to theechocardiogram, with the aim of detecting possible relation-ships between these methods. This study tested thehypothesis that electrocardiographic changes may be relatedto a reduction of 5% or more in the LVEF.
Methods
Patients
This was a longitudinal prospective study involvingpatients recruited from January 1998 to July 1999 at theCentro de Treinamento e Referência em Doenças Infecciosase Parasitárias (Training and Reference Center for Infectiousand Parasitic Diseases) “Orestes Diniz” (Ambulatório deReferência em Doença de Chagas [Reference Clinic for
Chagas Disease]) of the University Hospital of theUniversidade Federal de Minas Gerais (Hospital das Clínicasda UFMG). Informed consent was obtained from eachpatient, and the study protocol conforms to the ethicalguidelines of the 1975 Declaration of Helsinki as reflected ina priori approval by the institution's (UFMG) humanresearch committee. Patients with and without ChD from15 to 55 years old who met the inclusion criteria and whoseinitial evaluation did not suggest the presence of othercardiac or significant systemic diseases were recruited.
Patients were submitted to a standardized protocol thatincluded a medical history, physical examination, laboratoryexaminations, ECG, and echocardiogram. The clinicalevaluation aimed to detect evidence of ChCM, as well asany other cardiomyopathy or pathologies that might preventthe follow-up procedures from being carried out on thepatient. A 12-lead ECGwas done on all of the patients using adigital electrocardiograph (model 2155; Fukuda Denshi CoLtd, Tokyo, Japan) and analyzed in a blind and standardizedway. The heart rate andmeasurements of the durations of the Pwave and QRS complex and the PR and QT intervals wereobtained from automatic measurements provided by theequipment. The latter was corrected for cardiac frequencyusing the Bazett formula. Morphology and rhythm abnormal-ities were specifically evaluated and classified in accordancewith the electrocardiographic diagnostic criteria for chronicChD.18 Tests were conducted at the Central Laboratory ofHospital das Clínicas da UFMG: blood count and measure-ment of blood levels of creatinine, urea, fasting glucose,potassium and sodium, thyroid stimulating hormone level,and serologic tests for infection by Trypanosoma cruzi by atleast 3 different methods. All echocardiogram examina-tions were performed by an experienced echocardiographer(M.V.L.B.) blind to other data. The equipment used was anHDI 5000 (ATL, Bothell, Washington, DC). Standardizedmeasurements of the diameter of the left atrium and LV atthe end of the diastole and the LVEF were made using theSimpson method, following the standardized echocardiog-raphy recommendations of the American Heart Associationand the American Society of Echocardiography.19
Individuals were considered to have ChD if they presentedpositive serology for T cruzi in 2 or more tests using differentmethods, including reaction to indirect immunofluorescence,indirect hemagglutination, and enzyme-linked immunosor-bent assay, conducted at the Central Laboratory of HC-UFMG or the Parasitology Laboratory of the Ezequiel DiasFoundation. The non-ChD ChD controls were selected fromamong individuals who did not present positive serologicreactions when at least 3 separate test methods were applied,nor significant alterations in the complementary examina-tions conducted at the same locations.
Exclusion criteria consisted of unavailability for partic-ipating in the study and other cardiac or systemic illnessesthat could be confounding factors: arterial hypertension,history of coronary artery disease, rheumatic fever,diabetes mellitus, hypothyroidism, renal failure, chronicobstructive pulmonary disease, significant electrolytedisturbances, anemia, other significant chronic systemicdiseases, or pregnancy.

Fig. 1. Distribution of the ChD group and controls in the study sample. The final sample was 152 patients.
Table 1Comparison of the baseline demographic, clinical, echocardiographic, andelectrocardiographic characteristics of the ChD and control groups
Non–ChD patients(n = 25)
ChD patients(n = 121)
P
Age (y) 39.1 (±11.4) 42.7 (±9.5) .096Male 16/25 (64.0%) 73/127 (56.7%) .658NYHA functionalclassificationI 24/24 (100.0%) 110/126 (87.3%) .182II 0/24 14/126 (11.1%)III 0/24 2/126 (1.6%)ECGQRS duration (ms) 83 (±90) 99 (±26) .006Heart rate (beats/min) 64 (60–69) 62 (57–68) .345Right bundle-branch block 0/24 35/127 (27.6%) .001Ventricular extrasystoles 0/24 8/127 (6.3%) .357EchocardiogramLVEF (%) 63.8 (±3.1) 59.4 (±8.4) .010LVEF b50% 0/25 20/127 (15.7%) b.001Apical aneurysm 0/25 21/127 (16.5%) .026
3B.R. Nascimento et al. / Journal of Electrocardiology xx (2011) xxx–xxx
Follow-up
The patients were followed after initial selection andrecruited for new examinations between August 2004 andJuly 2006. They were once more submitted to the clinicalprotocol, including history, physical examination, ECG, andechocardiogram. The echocardiograms were conducted bythe same initial observer, using the same equipment and thesame analysis parameters. A drop in the LVEF of 5% ormore in the follow-up examination in relation to the initialechocardiogram was considered to be a sign of significantdeterioration of LV function.
The ECG was analyzed using the criteria cited above18
under the supervision of one of the authors. In accordancewith previous studies2,5,10,15,20-25 and with the criteria forelectrocardiographic diagnosis of ChD,18 a new electrocar-diographic abnormality was understood to be the occurrenceof one of the following abnormalities in the follow-up, aslong as it was absent in the initial examination: intraventric-ular conduction disturbance, atrioventricular conductiondisturbance, presence of a pacemaker, atrial fibrillation,atrial flutter or ectopic atrial rhythm, frequent ventricularextrasystoles (≥2 per tracing), pathologic Q waves, lowperipheral voltage, left and right ventricular hypertrophy,significant changes in ventricular repolarization (negative Twave N1 mV or ST-segment deviations N1 mm). In addition,changes in heart rate were investigated, as were duration ofthe QRS complex and the QT interval, measured andcorrected by the Bazzet formula.
Statistical analysis
The clinical data and the data generated from theexaminations carried out were entered into a databaseusing the Epidata software, version 3.0. The data wereanalyzed using the SPSS statistical package for Windows,version 14 (SPSS, Chicago, IL). A value of P ≤ .05 wasconsidered to be statistically significant. The qualitativevariables are described by the frequency distribution, and thecontinuous quantitative variables by the mean and thestandard deviation or the median and the interquartileinterval. The ratios, means, and medians of the dependentand independent variables for the ChD and non-ChD ChDgroups were compared using appropriate statistical tests,including χ2, Student t test, and Kruskal-Wallis test. Thereceiver operating characteristic (ROC) curve was producedto obtain the best cutoff point for the QRS duration valuesand identify a decrease of 5% or more in the ejectionfraction. The sensitivity and specificity of an increase of 5milliseconds in the QRS duration were calculated. The
Spearman coefficient was used to evaluate the statisticalcorrelation between nonparametric continuous variables.
Results
The baseline sample initially consisted of 220 patientsmade up of 30 controls and 190 patients with ChD. Follow-up longer than 6 years was achieved for 29 (97%) of the 30controls and 184 (97%) of the 190 patients with ChD (P =1.00). There were 13 deaths, all among the ChD group (7.1%of the ChD group), and these were not included as part of thisstudy because the sample consisted solely of patients whohad survived and were subjected to a new ECG examination.
The final study sample group consisted of 152 patients, 25(83% follow-up) of 30 from the control group and 127 (72%follow-up) of 177 from the group who were serologicallypositive for ChD and had been subjected to a second ECGconducted between 2004 and 2006. The mean follow-upperiod was 6.8 ± 1.3 years (Fig. 1).
The study sample did not differ statistically from thepatient sample that did not have follow-up, excluding thosewho died (207 in total, a loss of 55 patients [28%]). Althoughthere was a significant loss of follow-up patients due to lossof contact or inability to carry out a new ECG, the groupswere very homogeneous. All the parameters (age, sex,presence of ChD, New York Heart Association [NYHA]functional classification, and electrocardiographic and echo-cardiographic variables) were statistically similar to those ofthe final sample group.
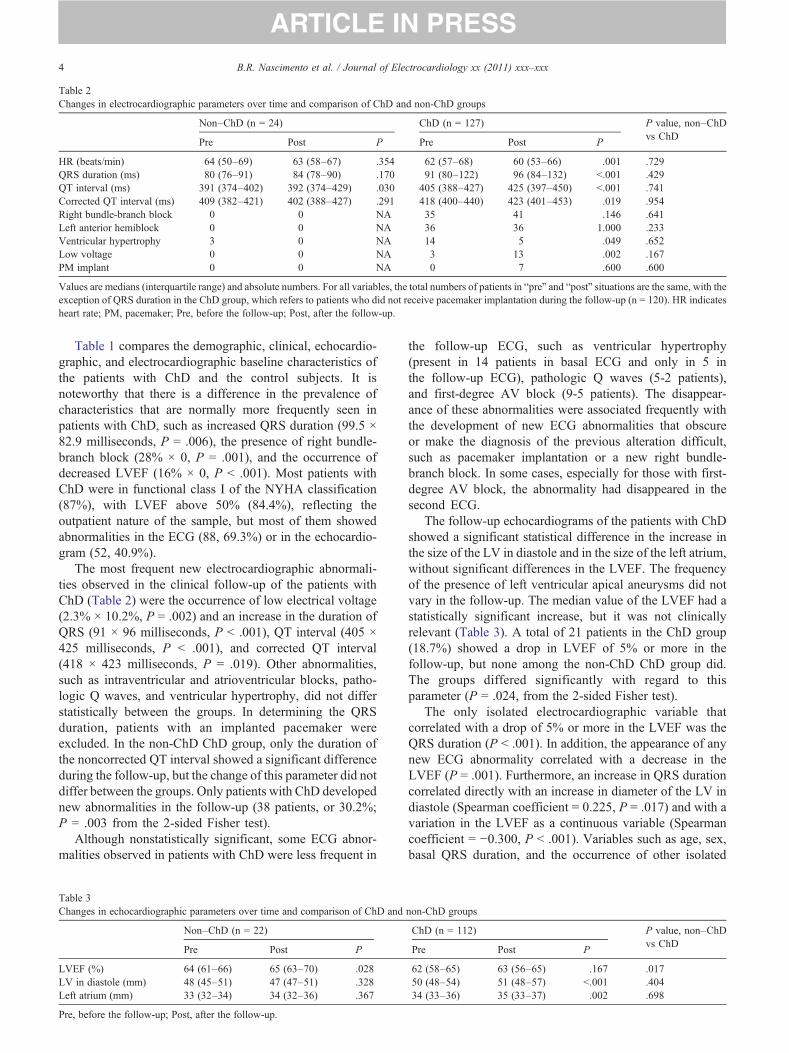
Table 2Changes in electrocardiographic parameters over time and comparison of ChD and non-ChD groups
Non–ChD (n = 24) ChD (n = 127) P value, non–ChDvs ChD
Pre Post P Pre Post P
HR (beats/min) 64 (50–69) 63 (58–67) .354 62 (57–68) 60 (53–66) .001 .729QRS duration (ms) 80 (76–91) 84 (78–90) .170 91 (80–122) 96 (84–132) b.001 .429QT interval (ms) 391 (374–402) 392 (374–429) .030 405 (388–427) 425 (397–450) b.001 .741Corrected QT interval (ms) 409 (382–421) 402 (388–427) .291 418 (400–440) 423 (401–453) .019 .954Right bundle-branch block 0 0 NA 35 41 .146 .641Left anterior hemiblock 0 0 NA 36 36 1.000 .233Ventricular hypertrophy 3 0 NA 14 5 .049 .652Low voltage 0 0 NA 3 13 .002 .167PM implant 0 0 NA 0 7 .600 .600
Values are medians (interquartile range) and absolute numbers. For all variables, the total numbers of patients in “pre” and “post” situations are the same, with theexception of QRS duration in the ChD group, which refers to patients who did not receive pacemaker implantation during the follow-up (n = 120). HR indicateheart rate; PM, pacemaker; Pre, before the follow-up; Post, after the follow-up.
4 B.R. Nascimento et al. / Journal of Electrocardiology xx (2011) xxx–xxx
Table 1 compares the demographic, clinical, echocardio-graphic, and electrocardiographic baseline characteristics ofthe patients with ChD and the control subjects. It isnoteworthy that there is a difference in the prevalence ofcharacteristics that are normally more frequently seen inpatients with ChD, such as increased QRS duration (99.5 ×82.9 milliseconds, P = .006), the presence of right bundle-branch block (28% × 0, P = .001), and the occurrence ofdecreased LVEF (16% × 0, P b .001). Most patients withChD were in functional class I of the NYHA classification(87%), with LVEF above 50% (84.4%), reflecting theoutpatient nature of the sample, but most of them showedabnormalities in the ECG (88, 69.3%) or in the echocardio-gram (52, 40.9%).
The most frequent new electrocardiographic abnormali-ties observed in the clinical follow-up of the patients withChD (Table 2) were the occurrence of low electrical voltage(2.3% × 10.2%, P = .002) and an increase in the duration ofQRS (91 × 96 milliseconds, P b .001), QT interval (405 ×425 milliseconds, P b .001), and corrected QT interval(418 × 423 milliseconds, P = .019). Other abnormalities,such as intraventricular and atrioventricular blocks, patho-logic Q waves, and ventricular hypertrophy, did not differstatistically between the groups. In determining the QRSduration, patients with an implanted pacemaker wereexcluded. In the non-ChD ChD group, only the duration ofthe noncorrected QT interval showed a significant differenceduring the follow-up, but the change of this parameter did notdiffer between the groups. Only patients with ChD developednew abnormalities in the follow-up (38 patients, or 30.2%;P = .003 from the 2-sided Fisher test).
Although nonstatistically significant, some ECG abnor-malities observed in patients with ChD were less frequent in
Table 3Changes in echocardiographic parameters over time and comparison of ChD and non-ChD groups
Non–ChD (n = 22) ChD (n = 112) P value, non–ChDvs ChD
Pre Post P Pre Post P
LVEF (%) 64 (61–66) 65 (63–70) .028 62 (58–65) 63 (56–65) .167 .017LV in diastole (mm) 48 (45–51) 47 (47–51) .328 50 (48–54) 51 (48–57) b.001 .404Left atrium (mm) 33 (32–34) 34 (32–36) .367 34 (33–36) 35 (33–37) .002 .698
Pre, before the follow-up; Post, after the follow-up.
s
the follow-up ECG, such as ventricular hypertrophy(present in 14 patients in basal ECG and only in 5 inthe follow-up ECG), pathologic Q waves (5-2 patients),and first-degree AV block (9-5 patients). The disappear-ance of these abnormalities were associated frequently withthe development of new ECG abnormalities that obscureor make the diagnosis of the previous alteration difficult,such as pacemaker implantation or a new right bundle-branch block. In some cases, especially for those with first-degree AV block, the abnormality had disappeared in thesecond ECG.
The follow-up echocardiograms of the patients with ChDshowed a significant statistical difference in the increase inthe size of the LV in diastole and in the size of the left atrium,without significant differences in the LVEF. The frequencyof the presence of left ventricular apical aneurysms did notvary in the follow-up. The median value of the LVEF had astatistically significant increase, but it was not clinicallyrelevant (Table 3). A total of 21 patients in the ChD group(18.7%) showed a drop in LVEF of 5% or more in thefollow-up, but none among the non-ChD ChD group did.The groups differed significantly with regard to thisparameter (P = .024, from the 2-sided Fisher test).
The only isolated electrocardiographic variable thatcorrelated with a drop of 5% or more in the LVEF was theQRS duration (P b .001). In addition, the appearance of anynew ECG abnormality correlated with a decrease in theLVEF (P = .001). Furthermore, an increase in QRS durationcorrelated directly with an increase in diameter of the LV indiastole (Spearman coefficient = 0.225, P = .017) and with avariation in the LVEF as a continuous variable (Spearmancoefficient = −0.300, P b .001). Variables such as age, sex,basal QRS duration, and the occurrence of other isolated
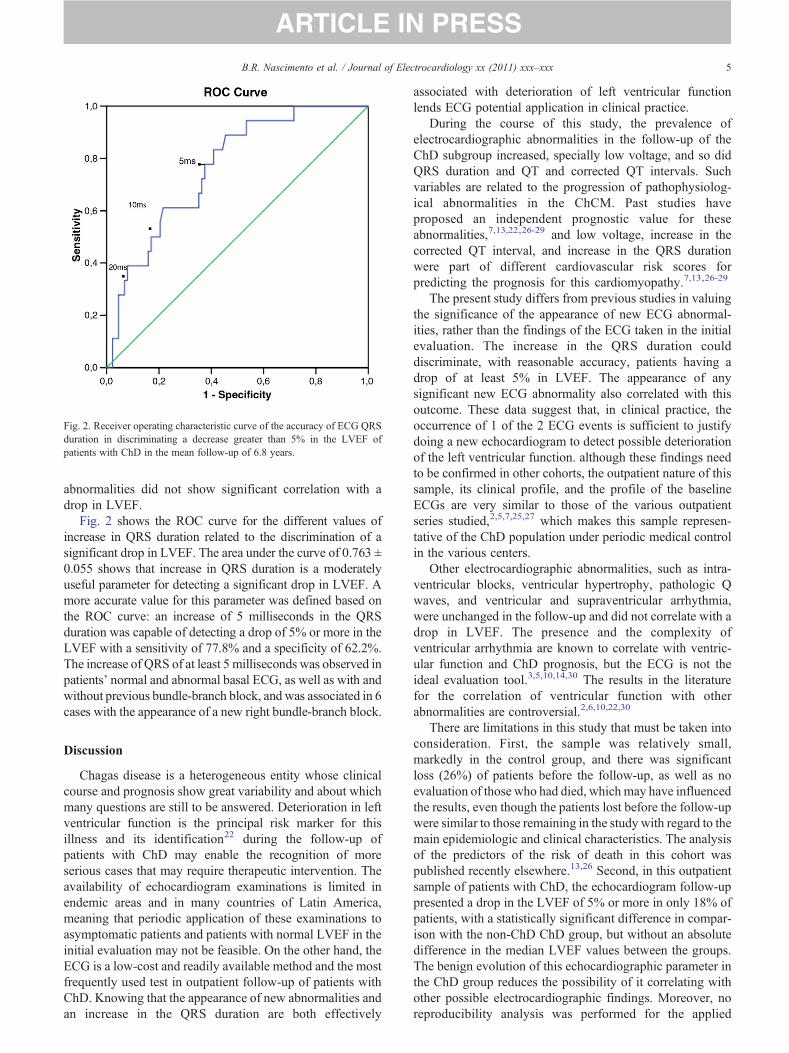
Fig. 2. Receiver operating characteristic curve of the accuracy of ECG QRSduration in discriminating a decrease greater than 5% in the LVEF ofpatients with ChD in the mean follow-up of 6.8 years.
5B.R. Nascimento et al. / Journal of Electrocardiology xx (2011) xxx–xxx
abnormalities did not show significant correlation with adrop in LVEF.
Fig. 2 shows the ROC curve for the different values ofincrease in QRS duration related to the discrimination of asignificant drop in LVEF. The area under the curve of 0.763 ±0.055 shows that increase in QRS duration is a moderatelyuseful parameter for detecting a significant drop in LVEF. Amore accurate value for this parameter was defined based onthe ROC curve: an increase of 5 milliseconds in the QRSduration was capable of detecting a drop of 5% or more in theLVEF with a sensitivity of 77.8% and a specificity of 62.2%.The increase of QRS of at least 5 milliseconds was observed inpatients' normal and abnormal basal ECG, as well as with andwithout previous bundle-branch block, and was associated in 6cases with the appearance of a new right bundle-branch block.
Discussion
Chagas disease is a heterogeneous entity whose clinicalcourse and prognosis show great variability and about whichmany questions are still to be answered. Deterioration in leftventricular function is the principal risk marker for thisillness and its identification22 during the follow-up ofpatients with ChD may enable the recognition of moreserious cases that may require therapeutic intervention. Theavailability of echocardiogram examinations is limited inendemic areas and in many countries of Latin America,meaning that periodic application of these examinations toasymptomatic patients and patients with normal LVEF in theinitial evaluation may not be feasible. On the other hand, theECG is a low-cost and readily available method and the mostfrequently used test in outpatient follow-up of patients withChD. Knowing that the appearance of new abnormalities andan increase in the QRS duration are both effectively
associated with deterioration of left ventricular functionlends ECG potential application in clinical practice.
During the course of this study, the prevalence ofelectrocardiographic abnormalities in the follow-up of theChD subgroup increased, specially low voltage, and so didQRS duration and QT and corrected QT intervals. Suchvariables are related to the progression of pathophysiolog-ical abnormalities in the ChCM. Past studies haveproposed an independent prognostic value for theseabnormalities,7,13,22,26-29 and low voltage, increase in thecorrected QT interval, and increase in the QRS durationwere part of different cardiovascular risk scores forpredicting the prognosis for this cardiomyopathy.7,13,26-29
The present study differs from previous studies in valuingthe significance of the appearance of new ECG abnormal-ities, rather than the findings of the ECG taken in the initialevaluation. The increase in the QRS duration coulddiscriminate, with reasonable accuracy, patients having adrop of at least 5% in LVEF. The appearance of anysignificant new ECG abnormality also correlated with thisoutcome. These data suggest that, in clinical practice, theoccurrence of 1 of the 2 ECG events is sufficient to justifydoing a new echocardiogram to detect possible deteriorationof the left ventricular function. although these findings needto be confirmed in other cohorts, the outpatient nature of thissample, its clinical profile, and the profile of the baselineECGs are very similar to those of the various outpatientseries studied,2,5,7,25,27 which makes this sample represen-tative of the ChD population under periodic medical controlin the various centers.
Other electrocardiographic abnormalities, such as intra-ventricular blocks, ventricular hypertrophy, pathologic Qwaves, and ventricular and supraventricular arrhythmia,were unchanged in the follow-up and did not correlate with adrop in LVEF. The presence and the complexity ofventricular arrhythmia are known to correlate with ventric-ular function and ChD prognosis, but the ECG is not theideal evaluation tool.3,5,10,14,30 The results in the literaturefor the correlation of ventricular function with otherabnormalities are controversial.2,6,10,22,30
There are limitations in this study that must be taken intoconsideration. First, the sample was relatively small,markedly in the control group, and there was significantloss (26%) of patients before the follow-up, as well as noevaluation of those who had died, which may have influencedthe results, even though the patients lost before the follow-upwere similar to those remaining in the study with regard to themain epidemiologic and clinical characteristics. The analysisof the predictors of the risk of death in this cohort waspublished recently elsewhere.13,26 Second, in this outpatientsample of patients with ChD, the echocardiogram follow-uppresented a drop in the LVEF of 5% or more in only 18% ofpatients, with a statistically significant difference in compar-ison with the non-ChD ChD group, but without an absolutedifference in the median LVEF values between the groups.The benign evolution of this echocardiographic parameter inthe ChD group reduces the possibility of it correlating withother possible electrocardiographic findings. Moreover, noreproducibility analysis was performed for the applied
6 B.R. Nascimento et al. / Journal of Electrocardiology xx (2011) xxx–xxx
approach, and finally, the possibility of intraobservervariability in the interpretation of the echocardiograms wasnot considered, nor was interobserver variability in theevaluation of the ECGs obtained in the study. Finally, a 5-millisecond increase in the duration of the QRS complex inseriated ECGs is a relatively small change, which could beattributed to intraobserver variability, especially duringmanual measurement.31 This increase, however, was shownto have clinical relevance in previous trials.32 In our study, weused automatic measurements provided by a reliableelectrocardiograph, reducing the error and variability attrib-uted to manual measurements.31
Conclusion
The study describes the follow-up of an outpatient sampleof patients with ChD, reinforcing the value of the ECG in theclinical management of these patients. This shows theimportance of the new onset of electrocardiographicabnormalities and reinforces the relevance of measuringthe QRS duration in the follow-up, because both parameterspresent significant correlation with the drop in LVEF of 5%or more, as well as with an increase in the diameter of the LVin diastole. The clinical relevance of these findings should beconfirmed in other prospective studies.
Acknowledgments
The authors declare that they have no financial ties orconflicts of interest regarding this paper. M.O. Rocha and A.L.Ribeiro are fellows of the Conselho Nacional de Desenvolvi-mento Científico e Tecnológico, and A.L. Ribeiro is alsosupported by the Programa Pesquisador Mineiro program ofthe Fundação de Amparo a Pesquisa de Minas Gerais.
References
1. Grupo de trabajo científico sobre la enfermedad de Chagas. BuenosAires, Argentina, 17 a 20 de abril de 2005, atualizado em julho de 2007.World Health Organization on behalf of the Special Programme forResearch and Training in Tropical Diseases; 2007.
2. Garzon SA, Lorga AM, Nicolau JC. Electrocardiography in Chagas'heart disease. Sao Paulo Med J 1995;113:802.
3. Rocha MO, Ribeiro AL, Teixeira MM. Clinical management of chronicChagas cardiomyopathy. Front Biosci 2003;8:e44.
4. Marin-Neto JA, Andrade ZA. Why is there predominance of right heartfailure in Chagas' disease? Arq Bras Cardiol 1991;57:181.
5. Marin Neto JA, Simoes MV, Sarabanda AV. Chagas' heart disease. ArqBras Cardiol 1999;72:247.
6. Mady C, Cardoso RH, Barretto AC, da Luz PL, Bellotti G, Pileggi F.Survival and predictors of survival in patients with congestive heartfailure due to Chagas' cardiomyopathy. Circulation 1994;90:3098.
7. Rassi Jr A, Rassi A, Little WC, et al. Development and validation of arisk score for predicting death in Chagas' heart disease. N Engl J Med2006;355:799.
8. Acquatella H, Schiller NB, Puigbo JJ, et al. M-mode and two-dimensional echocardiography in chronic Chages' heart disease. Aclinical and pathologic study. Circulation 1980;62:787.
9. Acquatella H, Schiller NB. Echocardiographic recognition of Chagas'disease and endomyocardial fibrosis. J Am Soc Echocardiogr1988;1:60.
10. Casado J, Davila DF, Donis JH, et al. Electrocardiographic abnormal-ities and left ventricular systolic function in Chagas' heart disease. Int JCardiol 1990;27:55.
11. Espinosa RA, Pericchi LR, Carrasco HA, Escalante A, Martinez O,Gonzalez R. Prognostic indicators of chronic chagasic cardiopathy. Int JCardiol 1991;30:195.
12. Nunes MC, Rocha MO, Ribeiro AL, et al. Right ventricular dysfunctionis an independent predictor of survival in patients with dilated chronicChagas' cardiomyopathy. Int J Cardiol 2008;127:372.
13. Ribeiro AL, Lombardi F, Colosimo EA, Nunes Mdo C, Rocha MO.Risk stratification in Chagas disease: further improvements are needed.J Cardiovasc Electrophysiol 2008;9:E41.
14. Carrasco HA, Guerrero L, Parada H, Molina C, Vegas E, Chuecos R.Ventricular arrhythmias and left ventricular myocardial function inchronic chagasic patients. Int J Cardiol 1990;28:35.
15. Maguire JH, Hoff R, Sherlock I, et al. Cardiac morbidity and mortalitydue to Chagas' disease: prospective electrocardiographic study of aBrazilian community. Circulation 1987;75:1140.
16. Ribeiro AL. Disfunçao autonômica e arritmia ventricular em chagásicossem cardiopatia aparente Departamento de Infectologia e MedicinaTropical da Faculdade de Medicina da Universidade Federal de MinasGerais; 1996.
17. Ribeiro AL, dos Reis AM, Barros MV, et al. Brain natriuretic peptideand left ventricular dysfunction in Chagas' disease. Lancet2002;360:461.
18. Criterios de diagnostico eletrocardiografico en la cardiopatia chagasicacronica. Buenos Aires, Argentina: Argentina: Ministerio de Salud eDesarrolo; 1985.
19. Lang RM, BierigM, Devereux RB, et al. Recommendations for chamberquantification: a report from the American Society of Echocardiogra-phy's Guidelines and Standards Committee and the Chamber Quanti-fication Writing Group, developed in conjunction with the EuropeanAssociation of Echocardiography, a branch of the European Society ofCardiology. J Am Soc Echocardiogr 2005;18:1440.
20. Dias JC, Kloetzel K. The prognostic value of the electrocardiographicfeatures of chronic Chagas' disease. Rev Inst Med Trop Sao Paulo 1968;10:158.
21. Maguire JH, Mott KE, Lehman JS, et al. Relationship of electrocar-diographic abnormalities and seropositivity to Trypanosoma cruziwithin a rural community in northeast Brazil. Am Heart J 1983;105:287.
22. Rassi Jr A, Rassi A, Rassi SG. Predictors of mortality in chronic Chagasdisease: a systematic review of observational studies. Circulation2007;115:1101.
23. Ribeiro AL, Rocha MO, Barros MV, Rodrigues AR, Machado FS. Anarrow QRS does not predict a normal left ventricular function inChagas' disease. Pacing Clin Electrophysiol 2000;23(11 Pt 2):2014.
24. Rosenbaum MB, Alvarez AJ. The electrocardiogram in chronicchagasic myocarditis. Am Heart J 1955;50:492.
25. Viotti R, Vigliano C, Armenti H, Segura E. Treatment of chronicChagas' disease with benznidazole: clinical and serologic evolution ofpatients with long-term follow-up. Am Heart J 1994;127:151.
26. Ribeiro AL, Cavalvanti PS, Lombardi F, Nunes MC, Barros MV, RochaMO. Prognostic value of signal-averaged electrocardiogram in Chagasdisease. J Cardiovasc Electrophysiol 2008;19:502.
27. Rocha MO, Ribeiro AL. A risk score for predicting death in Chagas'heart disease. N Engl J Med 2006;355:2488.
28. Salles G, Xavier S, Sousa A, Hasslocher-Moreno A, Cardoso C.Prognostic value of QT interval parameters for mortality riskstratification in Chagas' disease: results of a long-term follow-upstudy. Circulation 2003;108:305.
29. Rassi Jr A, Rassi A, Little WC, et al. Development and validation of arisk score for predicting mortality in Chagas heart disease. N Engl J Med2006;355:799.
30. Maciel BC, deAlmeida FilhoOC, Schmidt A,Marin-Neto JA.Ventricularfunction in Chagas' heart disease. Sao Paulo Med J 1995;113:814.
31. De Guillebon M, Thambo JB, Ploux S, et al. Reliability andreproducibility of QRS duration in the selection of candidates forcardiac resynchronization therapy. J Cardiovasc Electrophysiol2010;21:890.
32. Cintron G, Johnson G, Francis G, Cobb F, Cohn JN. Prognosticsignificance of serial changes in left ventricular ejection fraction inpatients with congestive heart failure. The V-HeFT VA CooperativeStudies Group. Circulation 1993;87(6 Suppl):VI17.