Comparison of Frequency of Significant Electrocardiographic Abnormalities in Endurance Versus...
7
Comparison of Frequency of Significant Electrocardiographic Abnormalities in Endurance Versus Nonendurance Athletes Maria Brosnan, MBBS a,b, *, Andre La Gerche, PhD, MBBS a,b , Jon Kalman, PhD, MBBS c , Wilson Lo, MBBS d , Kieran Fallon, MBBS e , Andrew MacIsaac, MD a , and David L. Prior, PhD, MBBS a,b Most data assessing the accuracy of electrocardiographic (ECG) screening in identifying cardiac pathology in athletes are derived from relatively unselected cohorts of subjects involved in competitive sports. We hypothesized that the prevalence of ECG abnormalities may be greater in athletes performing the greatest combination of exercise intensity and duration, namely professional endurance athletes. A total of 1,007 male and 254 female elite adult athletes underwent cardiovascular screening inclusive of an electrocardiogram, interpreted using the 2010 European Society of Cardiology guidelines. Training-related ECG changes (group 1) were more common in endurance athletes (EAs) than non- endurance athletes (NEAs; 90.8% vs 86.0%, p [ 0.04), as were multiple (‡2) training- related changes (78.9% vs 53.5%, p <0.0001). Group 2 ECG changes (previously considered uncommon and training unrelated) were seen in 18.1% of subjects and were twice as prevalent in EAs compared with NEAs (29.9% vs 15.1%, p <0.0001). Right ventricular hypertrophy (4.4% EAs vs 1.5% NEAs, p <0.005) and deep right precordial T-wave inversion (14.3% EAs vs 4.7% NEAs, p <0.0001) were 3 times as common in EAs. Both group 1 and group 2 changes were similarly prevalent among elite male and female athletes and were more common in EAs regardless of gender. In conclusion, ECG abnormalities are very common in elite athletes and are more common in EAs than NEAs. Right ventricular hypertrophy and deep right precordial T-wave inversion are particularly common in EAs, possibly because of increased structural and/or electrical right ventricular remodeling in this subgroup. The predictive value of ECG screening and criteria for abnormal findings in elite EAs requires specific appraisal. Ó 2014 Elsevier Inc. All rights reserved. (Am J Cardiol 2014;-:-e-) Current European Society of Cardiology (ESC) athlete electrocardiographic (ECG) interpretation guidelines classify ECG changes as either those which are common in athletes and thought to be training related (group 1) or those thought to be uncommon, training unrelated, and which warrant further investigation to exclude cardiac pathology (group 2). 1 These guidelines are derived from studies of unselected cohorts of young subjects involved in competitive sports without a defined threshold for the quantity or quality of athletic conditioning. In fact, most studies assessing the prevalence of abnormal ECG patterns have predominantly comprised male subelite nonendurance athletes (NEAs). 2e5 Thus, all “athletes” are considered equal in regard to ECG criteria, although there are abundant data demonstrating that cardiac remodeling (“athlete’s heart”) is determined by the volume and intensity of exercise exposure, with pure enduranceetrained athletes demonstrating larger cardiac dimensions than NEAs, and those competing at the highest level showing the most marked adaptations. 6e8 Therefore, we hypothesized that ECG changes, especially group 2 changes, would be more common in those performing the greatest combination of exercise intensity and duration, namely professional endurance athletes (EAs). Furthermore, we sought to test whether this hypothesis also applied to elite female athletes given that experience is even more limited for this group. Methods In 2011, the investigators contacted a variety of Austra- lian sporting organizations currently undertaking, or wishing to undertake, ECG screening and invited athletes to participate in this study. From June 2011 to June 2013, a total of 1,381 elite athletes underwent cardiovascular screening inclusive of a 12-lead electrocardiography at rest, clinical history and examination, and collection of morphometric and demographic data. Athletes aged from 16 to 35 years were included. In 23 athletes who underwent repeated screening during this period, only data from the first collection were considered, and 1 athlete with a known history of cardiac disease was excluded. A total of 228 athletes demonstrating group 2 ECG changes underwent a thorough repeat history analysis and examination and were referred for follow-up investigations as appropriate, most commonly transthoracic echocardiography. a Department of Cardiology, St Vincent’s Hospital, Melbourne, Victoria, Australia; b St Vincent’s Department of Medicine, University of Melbourne, Melbourne, Victoria, Australia; c Melbourne Heart Centre, Royal Melbourne Hospital, Melbourne, Victoria, Australia; d SportsMed ACT, Canberra, ACT, Australia; and e Australian Institute of Sport, Canberra, ACT, Australia. Manuscript received December 12, 2013; revised manuscript received and accepted January 22, 2014. See page 6 for disclosure information. *Corresponding author: Tel: (þ61) 3 9288 4423; fax: (þ61) 3 9288 4422. E-mail address: [email protected] (M. Brosnan). 0002-9149/14/$ - see front matter Ó 2014 Elsevier Inc. All rights reserved. www.ajconline.org http://dx.doi.org/10.1016/j.amjcard.2014.01.438
-
Upload
independent -
Category
Documents
-
view
6 -
download
0
Transcript of Comparison of Frequency of Significant Electrocardiographic Abnormalities in Endurance Versus...
Comparison of Frequency of Significant ElectrocardiographicAbnormalities in Endurance Versus Nonendurance Athletes
Maria Brosnan, MBBSa,b,*, Andre La Gerche, PhD, MBBSa,b, Jon Kalman, PhD, MBBSc,Wilson Lo, MBBSd, Kieran Fallon, MBBSe, Andrew MacIsaac, MDa, and David L. Prior, PhD, MBBSa,b
Most data assessing the accuracy of electrocardiographic (ECG) screening in identifying
aDepartment oAustralia; bSt VincMelbourne, VictorHospital, MelbouACT, Australia;Australia. Manuscreceived and acce
See page 6 for*Correspondin
4422.E-mail addres
0002-9149/14/$ -http://dx.doi.org/1
cardiac pathology in athletes are derived from relatively unselected cohorts of subjectsinvolved in competitive sports. We hypothesized that the prevalence of ECG abnormalitiesmay be greater in athletes performing the greatest combination of exercise intensity andduration, namely professional endurance athletes. A total of 1,007 male and 254 female eliteadult athletes underwent cardiovascular screening inclusive of an electrocardiogram,interpreted using the 2010 European Society of Cardiology guidelines. Training-relatedECG changes (group 1) were more common in endurance athletes (EAs) than non-endurance athletes (NEAs; 90.8% vs 86.0%, p [ 0.04), as were multiple (‡2) training-related changes (78.9% vs 53.5%, p <0.0001). Group 2 ECG changes (previously considereduncommon and training unrelated) were seen in 18.1% of subjects and were twice asprevalent in EAs compared with NEAs (29.9% vs 15.1%, p <0.0001). Right ventricularhypertrophy (4.4% EAs vs 1.5% NEAs, p <0.005) and deep right precordial T-waveinversion (14.3% EAs vs 4.7% NEAs, p <0.0001) were 3 times as common in EAs. Bothgroup 1 and group 2 changes were similarly prevalent among elite male and female athletesand were more common in EAs regardless of gender. In conclusion, ECG abnormalities arevery common in elite athletes and are more common in EAs than NEAs. Right ventricularhypertrophy and deep right precordial T-wave inversion are particularly common in EAs,possibly because of increased structural and/or electrical right ventricular remodeling in thissubgroup. The predictive value of ECG screening and criteria for abnormal findings in eliteEAs requires specific appraisal. � 2014 Elsevier Inc. All rights reserved. (Am J Cardiol2014;-:-e-)
Current European Society of Cardiology (ESC) athleteelectrocardiographic (ECG) interpretation guidelines classifyECG changes as either those which are common in athletesand thought to be training related (group 1) or those thoughtto be uncommon, training unrelated, and which warrantfurther investigation to exclude cardiac pathology (group 2).1
These guidelines are derived from studies of unselectedcohorts of young subjects involved in competitive sportswithout a defined threshold for the quantity or quality ofathletic conditioning. In fact, most studies assessing theprevalence of abnormal ECG patterns have predominantlycomprised male subelite nonendurance athletes (NEAs).2e5
Thus, all “athletes” are considered equal in regard to ECGcriteria, although there are abundant data demonstrating thatcardiac remodeling (“athlete’s heart”) is determined bythe volume and intensity of exercise exposure, with pure
f Cardiology, St Vincent’s Hospital, Melbourne, Victoria,ent’s Department of Medicine, University of Melbourne,ia, Australia; cMelbourne Heart Centre, Royal Melbournerne, Victoria, Australia; dSportsMed ACT, Canberra,and eAustralian Institute of Sport, Canberra, ACT,ript received December 12, 2013; revised manuscriptpted January 22, 2014.disclosure information.g author: Tel: (þ61) 3 9288 4423; fax: (þ61) 3 9288
s: [email protected] (M. Brosnan).
see front matter � 2014 Elsevier Inc. All rights reserved.0.1016/j.amjcard.2014.01.438
enduranceetrained athletes demonstrating larger cardiacdimensions than NEAs, and those competing at the highestlevel showing the most marked adaptations.6e8 Therefore,we hypothesized that ECG changes, especially group 2changes, would be more common in those performing thegreatest combination of exercise intensity and duration,namely professional endurance athletes (EAs). Furthermore,we sought to test whether this hypothesis also applied to elitefemale athletes given that experience is even more limited forthis group.
Methods
In 2011, the investigators contacted a variety of Austra-lian sporting organizations currently undertaking, orwishing to undertake, ECG screening and invited athletes toparticipate in this study. From June 2011 to June 2013, atotal of 1,381 elite athletes underwent cardiovascularscreening inclusive of a 12-lead electrocardiography atrest, clinical history and examination, and collection ofmorphometric and demographic data. Athletes aged from 16to 35 years were included. In 23 athletes who underwentrepeated screening during this period, only data from thefirst collection were considered, and 1 athlete with a knownhistory of cardiac disease was excluded.
A total of 228 athletes demonstrating group 2 ECGchanges underwent a thorough repeat history analysis andexamination and were referred for follow-up investigations asappropriate, most commonly transthoracic echocardiography.
www.ajconline.org
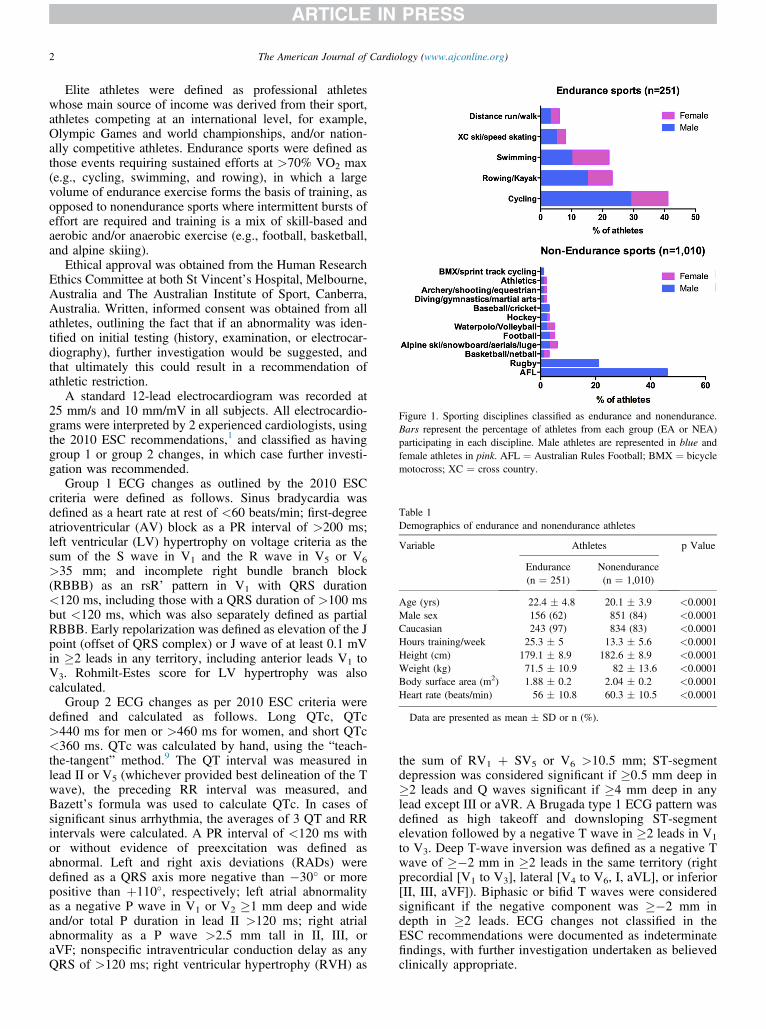
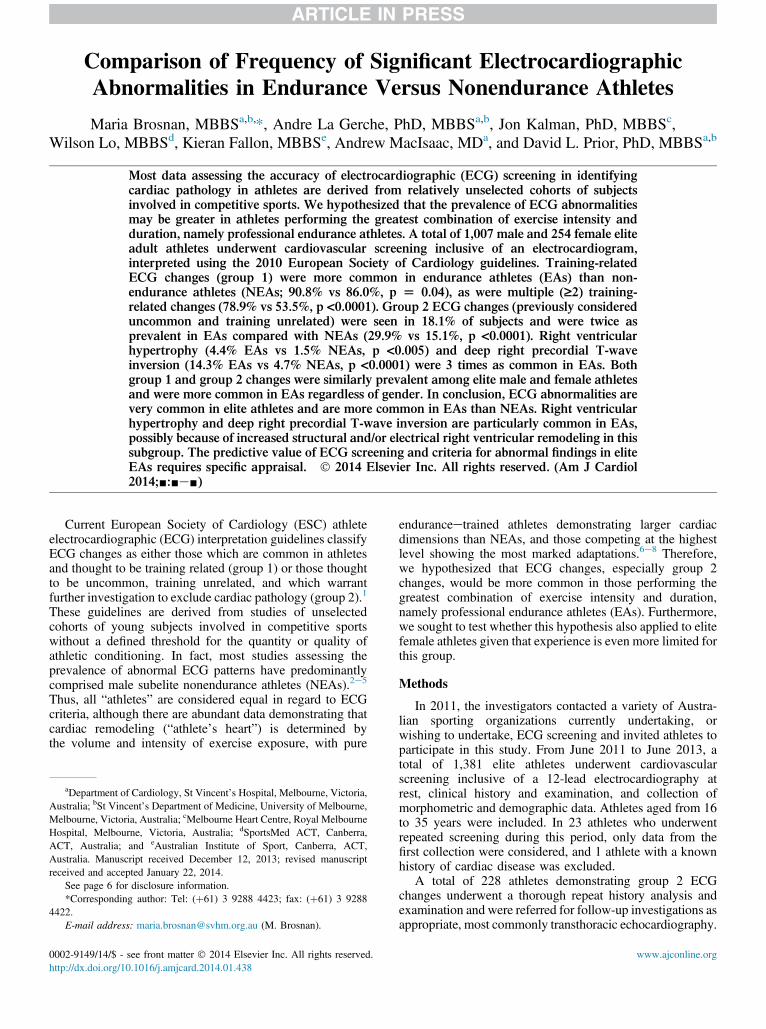
Figure 1. Sporting disciplines classified as endurance and nonendurance.Bars represent the percentage of athletes from each group (EA or NEA)participating in each discipline. Male athletes are represented in blue andfemale athletes in pink. AFL ¼ Australian Rules Football; BMX ¼ bicyclemotocross; XC ¼ cross country.
Table 1Demographics of endurance and nonendurance athletes
Variable Athletes p Value
Endurance(n ¼ 251)
Nonendurance(n ¼ 1,010)
Age (yrs) 22.4 � 4.8 20.1 � 3.9 <0.0001Male sex 156 (62) 851 (84) <0.0001Caucasian 243 (97) 834 (83) <0.0001Hours training/week 25.3 � 5 13.3 � 5.6 <0.0001Height (cm) 179.1 � 8.9 182.6 � 8.9 <0.0001Weight (kg) 71.5 � 10.9 82 � 13.6 <0.0001Body surface area (m2) 1.88 � 0.2 2.04 � 0.2 <0.0001Heart rate (beats/min) 56 � 10.8 60.3 � 10.5 <0.0001
Data are presented as mean � SD or n (%).
2 The American Journal of Cardiology (www.ajconline.org)
Elite athletes were defined as professional athleteswhose main source of income was derived from their sport,athletes competing at an international level, for example,Olympic Games and world championships, and/or nation-ally competitive athletes. Endurance sports were defined asthose events requiring sustained efforts at >70% VO2 max(e.g., cycling, swimming, and rowing), in which a largevolume of endurance exercise forms the basis of training, asopposed to nonendurance sports where intermittent bursts ofeffort are required and training is a mix of skill-based andaerobic and/or anaerobic exercise (e.g., football, basketball,and alpine skiing).
Ethical approval was obtained from the Human ResearchEthics Committee at both St Vincent’s Hospital, Melbourne,Australia and The Australian Institute of Sport, Canberra,Australia. Written, informed consent was obtained from allathletes, outlining the fact that if an abnormality was iden-tified on initial testing (history, examination, or electrocar-diography), further investigation would be suggested, andthat ultimately this could result in a recommendation ofathletic restriction.
A standard 12-lead electrocardiogram was recorded at25 mm/s and 10 mm/mV in all subjects. All electrocardio-grams were interpreted by 2 experienced cardiologists, usingthe 2010 ESC recommendations,1 and classified as havinggroup 1 or group 2 changes, in which case further investi-gation was recommended.
Group 1 ECG changes as outlined by the 2010 ESCcriteria were defined as follows. Sinus bradycardia wasdefined as a heart rate at rest of <60 beats/min; first-degreeatrioventricular (AV) block as a PR interval of >200 ms;left ventricular (LV) hypertrophy on voltage criteria as thesum of the S wave in V1 and the R wave in V5 or V6
>35 mm; and incomplete right bundle branch block(RBBB) as an rsR’ pattern in V1 with QRS duration<120 ms, including those with a QRS duration of >100 msbut <120 ms, which was also separately defined as partialRBBB. Early repolarization was defined as elevation of the Jpoint (offset of QRS complex) or J wave of at least 0.1 mVin �2 leads in any territory, including anterior leads V1 toV3. Rohmilt-Estes score for LV hypertrophy was alsocalculated.
Group 2 ECG changes as per 2010 ESC criteria weredefined and calculated as follows. Long QTc, QTc>440 ms for men or >460 ms for women, and short QTc<360 ms. QTc was calculated by hand, using the “teach-the-tangent” method.9 The QT interval was measured inlead II or V5 (whichever provided best delineation of the Twave), the preceding RR interval was measured, andBazett’s formula was used to calculate QTc. In cases ofsignificant sinus arrhythmia, the averages of 3 QT and RRintervals were calculated. A PR interval of <120 ms withor without evidence of preexcitation was defined asabnormal. Left and right axis deviations (RADs) weredefined as a QRS axis more negative than �30� or morepositive than þ110�, respectively; left atrial abnormalityas a negative P wave in V1 or V2 �1 mm deep and wideand/or total P duration in lead II >120 ms; right atrialabnormality as a P wave >2.5 mm tall in II, III, oraVF; nonspecific intraventricular conduction delay as anyQRS of >120 ms; right ventricular hypertrophy (RVH) as
the sum of RV1 þ SV5 or V6 >10.5 mm; ST-segmentdepression was considered significant if �0.5 mm deep in�2 leads and Q waves significant if �4 mm deep in anylead except III or aVR. A Brugada type 1 ECG pattern wasdefined as high takeoff and downsloping ST-segmentelevation followed by a negative T wave in �2 leads in V1
to V3. Deep T-wave inversion was defined as a negative Twave of ��2 mm in �2 leads in the same territory (rightprecordial [V1 to V3], lateral [V4 to V6, I, aVL], or inferior[II, III, aVF]). Biphasic or bifid T waves were consideredsignificant if the negative component was ��2 mm indepth in �2 leads. ECG changes not classified in theESC recommendations were documented as indeterminatefindings, with further investigation undertaken as believedclinically appropriate.
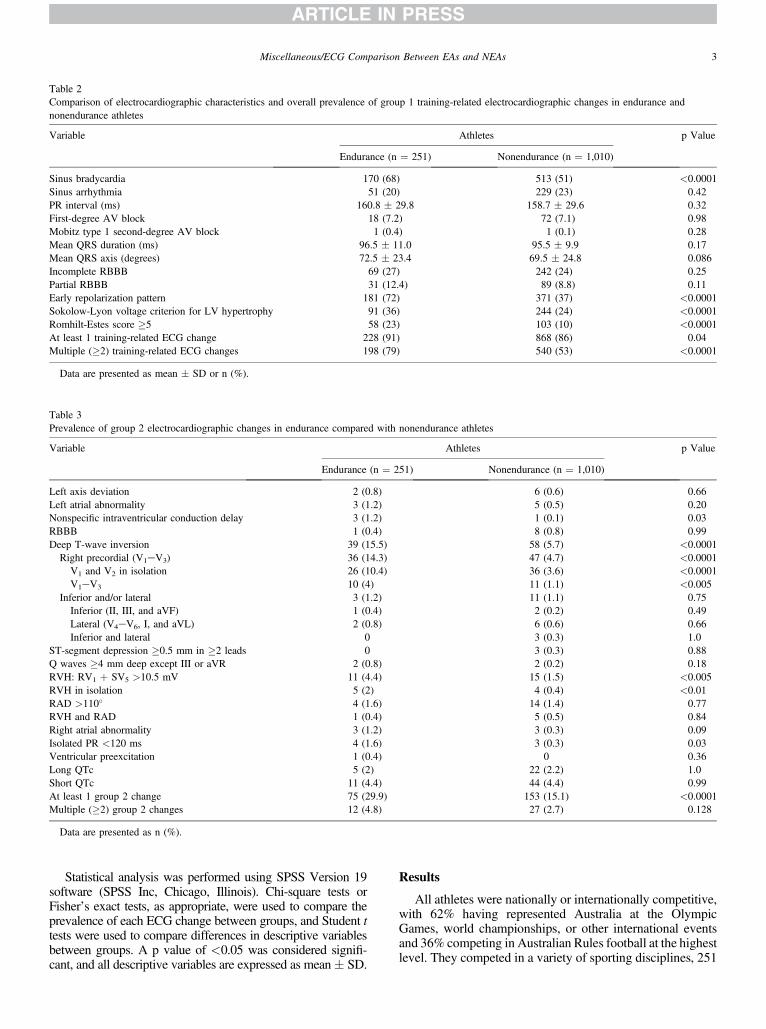
Table 2Comparison of electrocardiographic characteristics and overall prevalence of group 1 training-related electrocardiographic changes in endurance andnonendurance athletes
Variable Athletes p Value
Endurance (n ¼ 251) Nonendurance (n ¼ 1,010)
Sinus bradycardia 170 (68) 513 (51) <0.0001Sinus arrhythmia 51 (20) 229 (23) 0.42PR interval (ms) 160.8 � 29.8 158.7 � 29.6 0.32First-degree AV block 18 (7.2) 72 (7.1) 0.98Mobitz type 1 second-degree AV block 1 (0.4) 1 (0.1) 0.28Mean QRS duration (ms) 96.5 � 11.0 95.5 � 9.9 0.17Mean QRS axis (degrees) 72.5 � 23.4 69.5 � 24.8 0.086Incomplete RBBB 69 (27) 242 (24) 0.25Partial RBBB 31 (12.4) 89 (8.8) 0.11Early repolarization pattern 181 (72) 371 (37) <0.0001Sokolow-Lyon voltage criterion for LV hypertrophy 91 (36) 244 (24) <0.0001Romhilt-Estes score �5 58 (23) 103 (10) <0.0001At least 1 training-related ECG change 228 (91) 868 (86) 0.04Multiple (�2) training-related ECG changes 198 (79) 540 (53) <0.0001
Data are presented as mean � SD or n (%).
Table 3Prevalence of group 2 electrocardiographic changes in endurance compared with nonendurance athletes
Variable Athletes p Value
Endurance (n ¼ 251) Nonendurance (n ¼ 1,010)
Left axis deviation 2 (0.8) 6 (0.6) 0.66Left atrial abnormality 3 (1.2) 5 (0.5) 0.20Nonspecific intraventricular conduction delay 3 (1.2) 1 (0.1) 0.03RBBB 1 (0.4) 8 (0.8) 0.99Deep T-wave inversion 39 (15.5) 58 (5.7) <0.0001Right precordial (V1eV3) 36 (14.3) 47 (4.7) <0.0001
V1 and V2 in isolation 26 (10.4) 36 (3.6) <0.0001V1eV3 10 (4) 11 (1.1) <0.005
Inferior and/or lateral 3 (1.2) 11 (1.1) 0.75Inferior (II, III, and aVF) 1 (0.4) 2 (0.2) 0.49Lateral (V4eV6, I, and aVL) 2 (0.8) 6 (0.6) 0.66Inferior and lateral 0 3 (0.3) 1.0
ST-segment depression �0.5 mm in �2 leads 0 3 (0.3) 0.88Q waves �4 mm deep except III or aVR 2 (0.8) 2 (0.2) 0.18RVH: RV1 þ SV5 >10.5 mV 11 (4.4) 15 (1.5) <0.005RVH in isolation 5 (2) 4 (0.4) <0.01RAD >110� 4 (1.6) 14 (1.4) 0.77RVH and RAD 1 (0.4) 5 (0.5) 0.84Right atrial abnormality 3 (1.2) 3 (0.3) 0.09Isolated PR <120 ms 4 (1.6) 3 (0.3) 0.03Ventricular preexcitation 1 (0.4) 0 0.36Long QTc 5 (2) 22 (2.2) 1.0Short QTc 11 (4.4) 44 (4.4) 0.99At least 1 group 2 change 75 (29.9) 153 (15.1) <0.0001Multiple (�2) group 2 changes 12 (4.8) 27 (2.7) 0.128
Data are presented as n (%).
Miscellaneous/ECG Comparison Between EAs and NEAs 3
Statistical analysis was performed using SPSS Version 19software (SPSS Inc, Chicago, Illinois). Chi-square tests orFisher’s exact tests, as appropriate, were used to compare theprevalence of each ECG change between groups, and Student ttests were used to compare differences in descriptive variablesbetween groups. A p value of <0.05 was considered signifi-cant, and all descriptive variables are expressed as mean� SD.
Results
All athletes were nationally or internationally competitive,with 62% having represented Australia at the OlympicGames, world championships, or other international eventsand 36% competing in Australian Rules football at the highestlevel. They competed in a variety of sporting disciplines, 251

Figure 2. Examples of electrocardiograms demonstrating observed patterns of right precordial T-wave inversion (leads V1 to V3). (A) Deep, symmetricalT-wave inversion in V1 and V2 (male EA, left) and V1 to V3 (female NEA, right). (B) Biphasic T-wave inversion preceded by concave ST-segment elevation inV1 and V2 (male NEA, left) and V1 to V3 (male NEA, right). (C) Deep, bifid T waves in V1 and V2 (male EA, left) and V1 to V3 (male EA, right). This patternwas seen almost exclusively in EAs.
4 The American Journal of Cardiology (www.ajconline.org)
(20%) classified as endurance and 1,010 (80%) as non-endurance (Figure 1). Of the 1,261 athletes, 254 (21.1%) werewomen. A total of 1,078 (85.5%) were Caucasian, 149(11.8%) of indigenous Australian, Torres Strait Islander,Pacific Islander, orMaori descent, 16 (1.2%) Asian, 11 (0.9%)African, and 7 (0.6%) South American. All but 5 femaleathletes (Asian) were Caucasian. The mean age was 20.6 �4.22 years (range 16 to 35). Mean body surface area was 2.01� 0.21 m2 (range 1.47 to 2.67 m2) and average training timeper week was 15.7 � 7.3 hours (range 4 to 40). Demographicdifferences between EAs and NEAs are outlined in Table 1.
Group 1 training-related ECG changes were very com-mon, with at least 1 group 1 change seen in 87% of athletesand �2 changes in 59%. Compared with NEAs, EAs had agreater prevalence of sinus bradycardia, early repolarization,and voltage criteria for LV hypertrophy (Table 2).
Unspecified rhythm changes occurred with a similarprevalence in EAs and NEAs: low atrial rhythm (1.2 vs 1.3%,p ¼ 1.0), isorhythmic dissociation (1.2 vs 1%, p ¼ 0.73), andjunctional rhythm (0.4 vs 0.4%, p ¼ 1.0), respectively.
Group 1 ECG changes were also common in femaleathletes, seen in 83.9% versus 87.7% of male athletes (p ¼0.83); however, these changes were less often multiple(43.3% women vs 62.4% men, p <0.0001). Female athletesdemonstrated a similar prevalence of sinus bradycardia(50% women vs 55.2% men, p ¼ 0.156), sinus arrhythmia(25.6% vs 21.4%, p ¼ 0.83), incomplete RBBB (28% vs25.8%, p ¼ 0.541), and first-degree AV block (4.33% vs7.84%, p ¼ 0.071) as male athletes; however, LV hyper-trophy (8.2% vs 31.2%, p <0.0001) and early repolarization(28.7% vs 47.6%, p <0.0001) were less prevalent in femalethan male athletes.
Group 2 ECG abnormalities were seen in 228 athletes(18.1%) and were nearly twice as common in EAs thanNEAs (Table 3).
There were no significant differences between EAs andNEAs in the prevalence of axis deviations, atrial abnor-malities, Q waves, ST-segment depression, long or shortQTc, or preexcitation, but isolated short PR interval(<120 ms) and intraventricular conduction delay were morecommon in EAs. No athlete demonstrated left bundle branchblock or a Brugada type 1 ECG pattern.
RVH on Sokolow-Lyon voltage criteria was more prev-alent in EAs.
Right precordial T-wave inversion was nearly 3 timesmore common in EAs than NEAs, and accounted for most ofthe difference in prevalence of group 2 ECG changesbetween groups (Table 3). Both deep T-wave inversionsisolated to V1 and V2 and extending beyond V2 into V3 werearound 3 times more common in EAs (Table3). Deep,symmetrical T-wave inversion isolated to V1 and V2 wasseen in 18 of 251 EAs (7.2%) and 28 of 1,010 NEAs (2.8%;p ¼ 0.001). However, deep, symmetrical T-wave inversionin all 3 leads from V1 to V3 was rare, seen in only 2 athletes(2 NEAs [0.2%] vs no EAs, p ¼ 1.0; Figure 2). A pattern ofbiphasic T-wave inversion extending into V2 or V3, precededby concave ST-segment elevation, was observed in 17 of allathletes (1.4%), with no predilection for either group (14NEAs [1.4%] and 3 EAs [1.2%], p ¼ 1.0; Figure 2).Conversely, a pattern of bifid T waves with deep, negativenotching in V2 and/or V3 was seen almost exclusively in EAs(15 EAs [6%] vs 1 NEA [<0.1%], p <0.0001; Figure 2).
Bifid T waves with a small positive notch in �1 leadsfrom V2 to V4 were observed in 18 athletes but for thepurpose of this analysis were not classified as “abnormal”(Figure 3). Again, this pattern was significantly more com-mon in EAs than NEAs (12 [4.8%] vs 6 [0.6%], p <0.0001).
Deep T-wave inversion in the inferior and/or lateral leadswas rare and seen with similar prevalence in both groups. Ofnote, only 3 athletes demonstrated diffuse deep T-wave
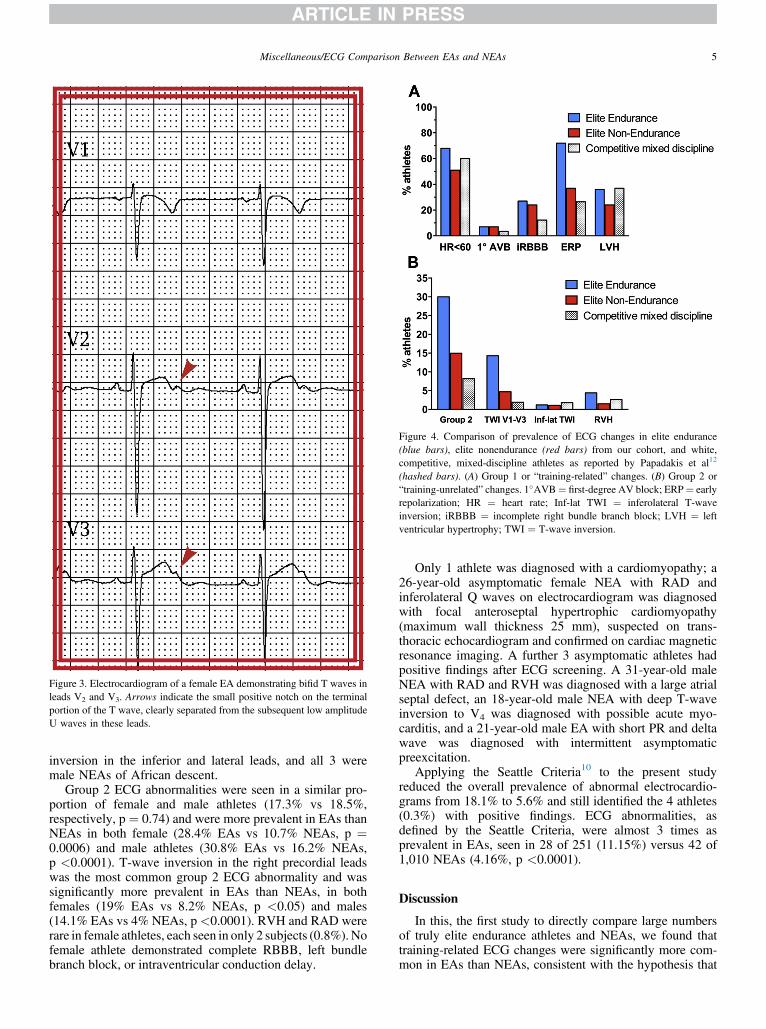
Figure 3. Electrocardiogram of a female EA demonstrating bifid T waves inleads V2 and V3. Arrows indicate the small positive notch on the terminalportion of the T wave, clearly separated from the subsequent low amplitudeU waves in these leads.
Figure 4. Comparison of prevalence of ECG changes in elite endurance(blue bars), elite nonendurance (red bars) from our cohort, and white,competitive, mixed-discipline athletes as reported by Papadakis et al12
(hashed bars). (A) Group 1 or “training-related” changes. (B) Group 2 or“training-unrelated” changes. 1�AVB¼ first-degree AV block; ERP¼ earlyrepolarization; HR ¼ heart rate; Inf-lat TWI ¼ inferolateral T-waveinversion; iRBBB ¼ incomplete right bundle branch block; LVH ¼ leftventricular hypertrophy; TWI ¼ T-wave inversion.
Miscellaneous/ECG Comparison Between EAs and NEAs 5
inversion in the inferior and lateral leads, and all 3 weremale NEAs of African descent.
Group 2 ECG abnormalities were seen in a similar pro-portion of female and male athletes (17.3% vs 18.5%,respectively, p ¼ 0.74) and were more prevalent in EAs thanNEAs in both female (28.4% EAs vs 10.7% NEAs, p ¼0.0006) and male athletes (30.8% EAs vs 16.2% NEAs,p <0.0001). T-wave inversion in the right precordial leadswas the most common group 2 ECG abnormality and wassignificantly more prevalent in EAs than NEAs, in bothfemales (19% EAs vs 8.2% NEAs, p <0.05) and males(14.1% EAs vs 4% NEAs, p<0.0001). RVH and RAD wererare in female athletes, each seen in only 2 subjects (0.8%).Nofemale athlete demonstrated complete RBBB, left bundlebranch block, or intraventricular conduction delay.
Only 1 athlete was diagnosed with a cardiomyopathy; a26-year-old asymptomatic female NEA with RAD andinferolateral Q waves on electrocardiogram was diagnosedwith focal anteroseptal hypertrophic cardiomyopathy(maximum wall thickness 25 mm), suspected on trans-thoracic echocardiogram and confirmed on cardiac magneticresonance imaging. A further 3 asymptomatic athletes hadpositive findings after ECG screening. A 31-year-old maleNEA with RAD and RVH was diagnosed with a large atrialseptal defect, an 18-year-old male NEA with deep T-waveinversion to V4 was diagnosed with possible acute myo-carditis, and a 21-year-old male EA with short PR and deltawave was diagnosed with intermittent asymptomaticpreexcitation.
Applying the Seattle Criteria10 to the present studyreduced the overall prevalence of abnormal electrocardio-grams from 18.1% to 5.6% and still identified the 4 athletes(0.3%) with positive findings. ECG abnormalities, asdefined by the Seattle Criteria, were almost 3 times asprevalent in EAs, seen in 28 of 251 (11.15%) versus 42 of1,010 NEAs (4.16%, p <0.0001).
Discussion
In this, the first study to directly compare large numbersof truly elite endurance athletes and NEAs, we found thattraining-related ECG changes were significantly more com-mon in EAs than NEAs, consistent with the hypothesis that

6 The American Journal of Cardiology (www.ajconline.org)
more profound physiological cardiac adaptation (athlete’sheart) in response to endurance exercise may be reflected onthe electrocardiogram. Group 1 ECG changes were presentin the vast majority of sportsmen and sportswomen and wereboth more prevalent and more frequently multiple in EAs.Although difficult to compare directly with other cohorts,given differing ECG criteria and demographic differences inage and athletic status, the overall prevalence of sinusbradycardia, first-degree AV block, and incomplete RBBBwas similar to that described in 1,005 elite Italian athletes ofsimilar age,11 and the greater prevalence of these changes inEAs was concordant with their observation that endurance-trained athletes were more likely to have abnormal ECGpatterns, the definition of which included LV hypertrophy.Compared with a younger cohort of white athletes frommixed sporting disciplines and varied levels of competition,first-degree AV block, incomplete RBBB, and early repo-larization were more common in our elite adult athletes,suggesting that training volume and duration may contributeto these ECG changes12 (Figure 4). However, it should benoted that the definitions of incomplete RBBB and earlyrepolarization frequently differ and may have contributed tothe variability in incidence reported by investigators. LVhypertrophy was observed more frequently in the previouslymentioned study, possibly because of the inclusion ofjuvenile athletes in whom LV hypertrophy on voltagecriteria is common, even in nonathletic subjects.12,13
More surprising, however, was the frequency with which“training-unrelated” ECG changes were observed (almost 1in 5 athletes of either gender). This was substantially morethan previous studies in which group 2 ECG changes wereobserved in <10% of white competitive athletes5,12
(Figure 4) and contrary to previous reports of the rarity ofECG abnormalities in female athletes.11,14 This cohort rep-resents a group of refined elite athletes in whom electrical,structural, and functional cardiac remodeling could beexpected to be the most profound. Our finding that some ofthe group 2 changes are more prevalent in those with thegreatest exercise-induced cardiac remodeling suggeststhat they are not exclusively training unrelated. In accor-dance with our recently published data,15 using the SeattleCriteria for athlete ECG interpretation reduced the preva-lence of ECG abnormalities, although still identifying the4 athletes with pathology. In our cohort, group 2 changeswere significantly more common in endurance- than non-endurance-trained athletes of both genders (w1 in 3 vs w1in 6), the differences largely due to findings suggestive ofright ventricular pathology, namely RVH and right pre-cordial T-wave inversion.
Although it is tempting to postulate that greater rightventricular dimensions as a result of endurance training mayhave accounted for the greater prevalence of voltage criteriafor RVH in EAs versus NEAs, 2 recent publications havedemonstrated poor correlation between ECG criteria andmagnetic resonance imaging and echocardiographic mea-surements of right ventricular dimensions in healthy adultsand athletes alike.16,17 The explanation for the greaterprevalence of RVH in EAs in our cohort is not clear, andalthough it is difficult to draw conclusions about patho-genesis, the findings are in support of physiologicalremodeling.
Right precordial T-wave inversion, previously observedin <2% of other Caucasian athletic cohorts of either gen-der,12e14 was seen in just over 14% of endurance athletes.Importantly, 4% of EAs had biphasic or bifid T-waveinversion extending into lead V3, thereby manifesting asa major criteria for the diagnosis of arrhythmogenic rightventricular cardiomyopathy.18 However, subsequent as-sessment including comprehensive cardiac imaging wasunable to identify any overt features of arrhythmogenic rightventricular cardiomyopathy in this group of athletes. Ourfindings suggest that these repolarization anomalies may benormal manifestations of intensive endurance training,possibly due to chronic right ventricular overload. It shouldbe noted, however, that deep, symmetrical anterior T-waveinversion extending beyond lead V2 was rare and did notappear to be influenced by endurance training. Similarly,deep T-wave inversions in the inferior and/or lateral leads,suggestive of hypertrophic cardiomyopathy, occurred with aprevalence of just over 1% in both EAs and NEAs,remarkably similar to the 1% to 1.5% of white adult andjuvenile athletes in other series.11e13,19,20 ST-segmentdepressions and Q waves were very rare in both EAs andNEAs, and 1 of only 4 athletes with Q waves was diagnosedwith hypertrophic cardiomyopathy, highlighting the needfor clinical suspicion in any athlete with these ECG findings.
Some limitations need to be considered. First, althoughthis represents one of the largest cohorts of elite femaleathletes studied to date, they are greatly underrepresented,making up only 20% of the cohort. This is reflective of elitesports participation in Australia, with male-dominated sportssuch as football having the highest participation rates. Sec-ondly, transthoracic echocardiography was not performedfor all athletes, being reserved for those with group 2 ECGabnormalities or another indication for cardiac imaging suchas sporting federation requirement. Thus, an exhaustivecomparison between echocardiographic measures in EAsversus NEAs was beyond the scope of this study.
Acknowledgment: The authors thank the following peoplefor their interest and invaluable organizational assistanceduring this study: Dr Anik Shawdon, MBBS, Dr LarissaTrease, MBBS, Dr Geoffrey Verrall, MBBS, and Dr DavidT. Martin, PhD.
Disclosures
The authors have no conflicts of interest to declare.
1. Corrado D, Heidbuchel H, Sharma S, Link M, Biffi A, Buja G, DeliseP, Gussac I, Borjesson M, Bjørnstad H, Carre` F, Dugmore D, FagardR, Hoogsteen, Panhuyzen-Goedkoop N, Solberg E, Vanhees L, EstesM, Iliceto S, Maron B, Pediro R, Schwartz P, Stein R, Thiene G,Zepelli P, McKenna W. Recommendations for interpretation of 12-leadelectrocardiogram in the athlete. Eur Heart J 2010;31:243e259.
2. Sharma S, Whyte G, Elliott P, Padula M, Kaushal R, Mahon N,McKenna W. Electrocardiographic changes in 1000 highly trainedjunior elite athletes. Br J Sports Med 1999;33:319e324.
3. Bessem B, Groot FP, Nieuwland W. The Lausanne recommendations: aDutch experience. Br J Sports Med 2009;43:708e715.
4. Pelliccia A, Culasso F, Di Paolo FM, Accettura D, Cantore R, CastagnaW, Ciacciarelli A, Costini G, Cuffari B, Drago E, Federici V, GribaudoC, Iacovelli G, Landolfi L, Menichetti G, Atzeni U, Parisi, Pizzi A,Rosa M, Santelli F, Santilio F, Vagnini A, Casasco M, Di Luigi L.

Miscellaneous/ECG Comparison Between EAs and NEAs 7
Prevalence of abnormal electrocardiograms in a large, unselectedpopulation undergoing pre-participation cardiovascular screening. EurHeart J 2007;28:2006e2010.
5. Weiner R, Hutter A, Wang F, Kim H, Wood M, Wang T, Picard M,Baggish A. Performance of the 2010 European Society of Cardiologycriteria for ECG interpretation in athletes. Heart 2011;97:1573e1577.
6. Prior DL, La Gerche A. The athlete’s heart. Heart 2012;98:947e955.7. La Gerche A, Heidbuchel H, Burns AT, Mooney DJ, Taylor AJ,
Pfluger HB, Inder W, MacIsaac A, Prior D. Disproportionate exerciseload and remodeling of the athlete’s right ventricle. Med Sci SportsExerc 2011;43:974e981.
8. Baggish A, Weiner R, Wang F, Demes R, Picard M, Hagerman F,Wood M. Differences in cardiac parameters among elite rowers andsubelite rowers. Med Sci Sports Exerc 2010;42:1215e1220.
9. Postema PG, De Jong JS, Van der Bilt IA, Wilde AA. Accurate elec-trocardiographic assessment of the QT interval: teach the tangent.Heart Rhythm 2008;5:1015e1018.
10. Drezner JA, Ackerman MJ, Anderson J, Ashkey E, Asplund CA,Baggish AL, Borjesson M, Cannon BC, Corrado D, DiFioro JP,Fischbach P, Froelicher V, Harmon KG, Heidbuchel H, Marek J, OwensDS, Paul S, Pellicia A, Prutkin JM, Salerno JC, Schmied CM, Sharma S,Stein R, Vetter VL, Wilson MG. Electrocardiographic interpretation inathletes: the “Seattle Criteria”. Br J Sports Med 2013;47:122e124.
11. Pelliccia A, Maron BJ, Culasso F, Di Paolo FM, Spataro A, Biffi A,Caselli G, Piovano P. Clinical significance of abnormal electrocardio-graphic patterns in trained athletes. Circulation 2000;102:278e284.
12. Papadakis MCF, Kervio G, Rawlins J, Panoulas VF, Chandra N,Basavarajaiah S, Carby L, Fonseca T, Sharma S. The prevalence,distribution, and clinical outcomes of electrocardiographic repolariza-tion patterns in male athletes of African/Afro-Caribbean origin. EurHeart J 2011;32:2304e2313.
13. Papadakis M, Basavarajaiah S, Rawlins J, Edwards C, Makan J, Fir-oozi S, Carby L, Sharma S. Prevalence and significance of T-waveinversions in predominantly Caucasian adolescent athletes. Eur Heart J2009;30:1728e1735.
14. Rawlins J, Carre F, Kervio G, Papadakis M, Chandra N, Edwards C,Whyte G, Sharma S. Ethnic differences in physiological cardiacadaptation to intense physical exercise in highly trained female athletes.Circulation 2010;121:1078e1085.
15. BrosnanM,LaGercheA,Kalman J, LoW,FallonK,MacisaacA, PriorD.The Seattle Criteria increase the specificity of preparticipation ECGscreening among elite athletes. Br J Sports Med 2013 June 27 (Epubahead of print).
16. Whitman I, Patel VV, Soliman EZ, Bluemke DA, Praestgaard A,Jain A, Herrington D, Lima J, Kawut S. Validity of the SurfaceElectrocardiogram Criteria for Right Ventricular Hypertrophy:the MESA-RV Study (Multi-Ethnic Study of Atherosclerosis-RightVentricle). J Am Coll Cardiol 2013;63:672e681.
17. Zaidi A, Ghani S, Sheikh N, Gati S, Bastiaenen R, Madden B,Papadakis M, Raju H, Reed M, Sharma R, Behr E, Sharma S. Clinicalsignificance of electrocardiographic right ventricular hypertrophy inathletes: comparison with arrhythmogenic right ventricular cardio-myopathy and pulmonary hypertension. Eur Heart J 2013;34:3649e3656.
18. Marcus FI, McKenna WJ, Sherrill D, Basso C, Bauce B, Bluemke DA,CAlkins H, Corrado D, Cox MG, Daubert JP, Fontaine G, Gear K,Hauer R, Nava A, Picard MH, Prontonotarios N, Saffitz JE, SanbornDM, Steinberg JS, Tandri H, Thiene G, Towbin JA, Tsatopoulou A,Wichter T, Zareba W. Diagnosis of arrhythmogenic right ventricularcardiomyopathy: proposed modification of the task force criteria.Circulation 2010;121:1533e1541.
19. Zaidi A, Ghani S, Sharma R, Oxborough D, Panoulas VF, Sheikh N,Gati S, Papadakis M, Sharma S. Physiological right ventricular adap-tation in elite athletes of African and Afro-Caribbean origin. Circula-tion 2013;127:1783e1792.
20. Migliore FZA, Michieli P, Perazzolo Marra M, Siciliano M, Rigato I,Bauce B, Basso C, Toazza D, Schiavon M, Iliceto S, Thiene G, CorradoD. Prevalence of cardiomyopathy in Italian asymptomatic children withelectrocardiographic T-wave inversion at preparticipation screening.Circulation 2012;125:529e538.