The Magic of Pension Accounting - doc .credit -suisse .com
168
Equity Research 27 September 2002 Americas/United States Accounting & Tax The Magic of Pension Accounting THE DECLINE IN EQUITY MARKETS AND RECORD-LOW INTEREST RATES HAVE HAD A NEGATIVE IMPACT ON THE HEALTH OF DEFINED BENEFIT PENSION PLANS. CONFUSING ACCOUNTING, COMPLICATED FUNDING REQUIREMENTS, AND PENSION OBLIGATIONS WITH UNKNOWN FUTURE CASH FLOWS FURTHER CONTRIBUTE TO INVESTOR ANXIETY. THIS REPORT ADDRESSES THOSE CONCERNS BY FOCUSING ON THE DEFINED BENEFIT PENSION PLANS OF COMPANIES IN THE S&P 500. TO BETTER UNDERSTAND ACTUAL EXPOSURE FOR THOSE COMPANIES, WE REPLACE THE MAGIC OF PENSION ACCOUNTING WITH EACH PLAN’S ECONOMIC REALITY. WE IDENTIFY VARYING DEGREES OF EXPOSURE TO PENSION ISSUES ACROSS INDUSTRIES AND COMPANIES WHILE EVALUATING THE ASSOCIATED RISKS. Investors should assume that CSFB is seeking or will seek investment banking or other business from the covered companies. research team David Zion, CFA, CPA 212 538 4837 [email protected] Bill Carcache, CPA 212 325 6418 [email protected] Source: CSFB Research.
-
Upload
khangminh22 -
Category
Documents
-
view
5 -
download
0
Transcript of The Magic of Pension Accounting - doc .credit -suisse .com

Equity Research
27 September 2002Americas/United StatesAccounting & Tax
The Magic of PensionAccountingTHE DECLINE IN EQUITY MARKETS AND RECORD-LOW INTERESTRATES HAVE HAD A NEGATIVE IMPACT ON THE HEALTH OFDEFINED BENEFIT PENSION PLANS. CONFUSING ACCOUNTING,COMPLICATED FUNDING REQUIREMENTS, AND PENSIONOBLIGATIONS WITH UNKNOWN FUTURE CASH FLOWS FURTHERCONTRIBUTE TO INVESTOR ANXIETY. THIS REPORT ADDRESSESTHOSE CONCERNS BY FOCUSING ON THE DEFINED BENEFITPENSION PLANS OF COMPANIES IN THE S&P 500.
TO BETTER UNDERSTAND ACTUAL EXPOSURE FOR THOSECOMPANIES, WE REPLACE THE MAGIC OF PENSION ACCOUNTINGWITH EACH PLAN’S ECONOMIC REALITY.
WE IDENTIFY VARYING DEGREES OF EXPOSURE TO PENSIONISSUES ACROSS INDUSTRIES AND COMPANIES WHILEEVALUATING THE ASSOCIATED RISKS.
Investors should assume that CSFB is seeking or will seek investment banking or otherbusiness from the covered companies.
research team
David Zion, CFA, CPA212 538 [email protected]
Bill Carcache, CPA212 325 [email protected]
Sou
rce:
CS
FB
Res
earc
h.

The Magic of Pension Accounting 27 September 2002
2
Table of Contents
Executive Summary ..........................................................................................................4Conclusion.....................................................................................................................8
Our Key Findings ..............................................................................................................9
The “Magic of Pension Accounting” ................................................................................13
Who Has Exposure? .......................................................................................................16Defined Benefit versus Defined Contribution ..............................................................16Shareholders’ Exposure ..............................................................................................18Pension Report Card ...................................................................................................20
Forecasting .....................................................................................................................24Pension-Forecasting Model.........................................................................................24Our S&P 500 Forecast ................................................................................................25
Funding Requirements....................................................................................................33Analyzing the Funding Status......................................................................................33Our S&P 500 Forecast ................................................................................................35
Pension Accounting Should Be Simple...........................................................................37Pension Accounting History ........................................................................................37
Three Steps to Strip Out Accounting Magic....................................................................40Step 1—Report the Pension Plan Assets and Obligation on the Balance Sheet .......40Step 2—Calculate “Real” Pension Expense or Income: Show Me the Volatility.........45Step 3—Divide Pension Expense/Income into Three Buckets ...................................51Summary .....................................................................................................................56
Funded Status.................................................................................................................57Underfunded................................................................................................................59Overfunded..................................................................................................................61Measuring the Pension Plan Relative to Equity Market Capitalization .......................63Measuring the Pension Plan Relative to the Balance Sheet.......................................68Relationship between Funded Status and Earnings ...................................................69
Quality of Earnings..........................................................................................................73A Few Questions .........................................................................................................73Net Pension Cost for the S&P 500 ..............................................................................73Net Income ..................................................................................................................75Operating Income........................................................................................................77Summary .....................................................................................................................79
Analysis of Assumptions .................................................................................................80Overview......................................................................................................................80The Big Picture ............................................................................................................80Expected Rate of Return on Plan Assets ....................................................................82Discount Rate ..............................................................................................................88Are Assumptions Aggressive or Conservative? ..........................................................91Salary Inflation Rate ....................................................................................................93

The Magic of Pension Accounting 27 September 2002
3
Appendix A: 140 Companies in the S&P 500 with No Pension Problems......................94
Appendix B: A Walk through the Pension Footnote........................................................95
Appendix C: Projected and Historical Funded Status for the S&P 500 ........................101
Appendix D: Pension Cost—Income/(Expense) for the S&P 500 ................................111
Appendix E: Treating the Pension Plan as if It Were an Investment Subsidiary ..........121
Appendix F: Calculating the “Real” Pension Expense ..................................................122
Appendix G: Reporting the Funded Status on the Balance Sheet ...............................123
Appendix H: Our Pension-Forecasting Model ..............................................................125
Appendix I: Off-Balance-Sheet Assets and Liabilities for the S&P 500 ........................131
Appendix J: Adjusted Net Income/(Loss) for the S&P 500 ...........................................141
Appendix K: Adjusted Operating Income/(Loss) for the S&P 500 ................................151
Glossary ........................................................................................................................161

The Magic of Pension Accounting 27 September 2002
4
Executive SummaryIf you bring up the topic of pension accounting, most people will roll their eyes, some willrun the other way as fast as they can, and a few people will even fall fast asleep right onthe spot. The problem: The accounting in FAS No. 87, “Employers’ Accounting forPensions,” is convoluted, complicated, misleading, and for many it just doesn’t makeany sense. The terminology alone is enough to make your head spin—unrecognizedgains and losses, service cost, prior service cost, projected benefit obligation, minimumpension liability, curtailment, settlements, etc. What does it all mean? Add theenormously complicated rules from Section 412 of the tax code that determine when acompany has to contribute to its pension plan (if you think that pension accounting istough, try reading Section 412); mix in a pension obligation with unknown future cashflows; and you have a recipe for confusion.
Now on top of that confusion, add the decline in equity markets over the past threeyears and interest rates at record lows, and investors grow anxious as pension assetsdrop in value while the pension obligations continue to grow. Concern is rising that thesmoothing mechanisms in FAS No. 87, originally designed to reduce reported earningsvolatility, have led to misleading financial statements. Investors want to know whichcompanies and industries have the most exposure to defined benefit pension plans,how large of a claim does the pension plan have on their stake in the company, and towhat extent does the exposure to the pension plan affect earnings and balance sheets.In addition, investors are concerned about the increases in cash contributions that thecompanies would have to make to their pension plan if their funded status continues todecline. Standard & Poor’s is evaluating the potential credit-rating implications, and in aworst-case scenario, some companies could be forced into bankruptcy.
Our report addresses these concerns by focusing on the companies in the S&P 500. Wefirst divide the companies into two camps: those that have defined benefit plans andthose that don’t. We estimate that approximately 360 companies (72%) have definedbenefit pension plans in the S&P 500. In other words, the 140 companies (28%) thatdon’t have such plans have no pension issues at all. Check Appendix A: If you only owncompanies on this list, you can stop reading right now. Otherwise . . . read on.
Next, we dig into the companies with defined benefit plans, analyzing the data from anumber of different angles, including forecasting future results using our pensionforecast model, which is extremely sensitive to the assumptions chosen. To answer thesimple question—Who has the most exposure to pension issues?—we focus on fourtypes of exposure: shareholder, balance sheet, earnings, and cash flow exposure.
Shareholders’ Exposure
We start by determining the pension plans that could end up with the largest claim onthe shareholders’ stake in the sponsoring company. To do this, we simply compare theeconomic value of the pension plan—its funded status—with the value of theshareholders’ stake in the company—the equity market capitalization. Using our basicpension-forecasting model (assuming that the fair value of plan assets drops by 9.45%and discount rates fall 50 basis points, along with many other simplifying assumptions),we estimate that the 30 companies in Exhibit 5 will have defined benefit pension plansat the end of 2002 that are underfunded by at least 25% of the current equity market

The Magic of Pension Accounting 27 September 2002
5
capitalization. In other words, the pension plans may have a claim on over one-quarterof the shareholders’ stakes in these companies.
On the other hand, we estimate that 212 companies in the S&P 500 will have definedbenefit plans at the end of 2002 that are underfunded by less than 5% of the currentmarket capitalization, with 33 companies overfunded, including the 6 companies inExhibit 6, where the amount overfunded exceeds 5% of the current equity marketcapitalization.
Next, we identify the companies that appear to be the most leveraged to their pensionplans, by comparing the projected benefit obligation (PBO) to the equity marketcapitalization. We estimate that the 31 companies in Exhibit 7 will have a PBO at theend of 2002 that exceeds the current equity market capitalization, exhibiting the largestpotential exposure to their defined benefit pension plans. For 94 companies, thereappears to be minimal exposure, as the estimated PBO at the end of 2002 couldrepresent less than 5% of the current equity market capitalization.
We explore shareholders’ exposure in more detail in the “Who Has Exposure?” and“Forecasting” sections of the report. We include an estimate of the 2002 funded statusfor each company in the S&P 500 in Appendix C. In the “Funded Status” section of thereport, we examine the shareholders’ exposure to the pension plan from a historicalperspective.
Balance Sheet Exposure
Pension plan assets and liabilities can vanish off balance sheet. We estimate that thecompanies in the S&P 500 carried $992 billion in off-balance-sheet pension liabilitiesand $900 billion in off-balance-sheet pension assets at the end of 2001. The realleverage to the pension plan is hidden in the footnotes. The 10 companies in Exhibit 21each had an off-balance-sheet pension liability in excess of $15 billion at the end of2001, accounting for over one-third of the total off-balance-sheet pension liability for theS&P 500.
To get a better idea of the real balance sheet exposure to the pension plan, we treat theplan as an investment subsidiary. For each company in the S&P 500, we put the planassets on the asset side of the balance sheet and the PBO on the liability side. In theaggregate, placing the pension plan assets on the balance sheet would increase totalassets for the S&P 500 by 5% in 2001. Total assets would increase by over 50% for the17 companies in Exhibit 22. If we were to treat the PBO as debt, aggregate debt for theS&P 500 would increase by 16%. Debt would more than double for 71 companies, andmore than triple for 36 companies, including the 16 companies in Exhibit 23 that hadover $1 billion in debt outstanding. (See Appendix I.)
Using a few actuarial rules of thumb, we estimate that the 26 companies in Exhibit 14might have to record a charge to equity in 2002 that would be greater than 25% of theirtotal shareholders’ equity at the end of 2001. The charge would reflect something calledthe minimum pension liability on the balance sheet. For example, General Motors took a$9.5 billion charge to equity in 2001 to reflect this adjustment. Standard & Poor’s isevaluating the potential impact that this charge to equity could have on debt covenantsand credit ratings. On the other hand, we estimate that over half the companies in theS&P 500 would incur no such charge in 2002.

The Magic of Pension Accounting 27 September 2002
6
We explore balance sheet exposure in more detail in the “Three Steps to Strip OutAccounting Magic,” “Funded Status,” and “Forecasting” sections of this report.
Earnings Exposure
We expect companies to begin announcing that they will be taking down their expectedreturn assumptions for 2003. As the median rate falls from the current 9.2%, the illusoryearnings shield created by the magic of pension accounting should become evident. Ifwe were to take the expected rate of return down 50 basis points for 2003, which weview as a likely scenario, aggregate pension cost for the S&P 500 would increase byabout $5 billion. We recommend using our pension-forecasting model to perform what-ifscenarios. For example, if the expected rate of return dropped 100 basis points,aggregate pension cost would rise by $10 billion; and if we were to drop the rates all theway down to 6.5% (as suggested by Warren Buffet), aggregate pension cost wouldjump by more than $30 billion. The 10 companies that would experience the largestincrease in pension cost per share from dropping the expected rate of returnassumption are included in Exhibit 15.
As pension plans become more and more underfunded, we would not be surprised ifcompanies began taking down numbers for 2003. We estimate that the aggregatebenefit to earnings for the S&P 500 from the pension plan will dry up in 2002. For 2003,we estimate that the companies in the S&P 500 will record net pension expense of $15billion.
We forecast the net pension cost for the next three years for each company in the S&P500. (See Appendix D.) To measure whether a change in pension cost is meaningful toa particular company’s future earnings, we compare our estimated per share change inpension cost between 2002 and 2003 to the First Call consensus earnings estimate for2003. The increase in pension cost represents at least 10% of the consensus earningsestimate for the 27 companies in Exhibit 11. The key question to ask is whether theconsensus earnings estimate incorporates the potential increase in pension cost; we arenot sure of the answer.
For each company in the S&P 500, we replace the smoothing mechanisms from FASNo. 87 with what actually happened in the pension plan. We calculate what we refer toas “real” pension expense or income by taking the expected return on plan assets andamortization amounts and throwing them out the window (that’s one way to eliminatethe debate surrounding the expected rates of return), replacing them with the actualreturn on the plan assets and the actuarial gains and losses on the PBO. Making ouradjustments would drop the aggregate earnings for the S&P 500 by 69% in 2001 and by10% in 2000 but would increase earnings by 26% in 1999. We estimate earnings woulddecline by 50% or more for 82 companies. Net income would become a net loss for 41companies (see Appendix J); 30 companies would see earnings decline by over $1billion, including the 7 companies in Exhibit 32, where earnings would drop more than$5 billion.
We divide net pension cost into three buckets: compensation, financing, and investing;only the compensation component remains in operating income. Currently, companiesrecord net pension cost wherever they record labor cost in the income statement,somewhere in operating income. For each company in the S&P 500, we eliminate thepension cost recorded in operating income (as defined by Compustat) and replace it

The Magic of Pension Accounting 27 September 2002
7
with service cost (compensation). We then compare the reported operating income andmargins with our modified operating income. Operating income for the S&P 500 woulddecline by 4% in 2001, 4% in 2000, and 3% in 1999 after making our adjustments. (SeeAppendix K.) For 59 companies, operating income would decline by 10% or more in2001. The 9 companies in Exhibit 36 would experience a decline of over 50%.Operating margins would drop by over 100 basis points for 62 companies; the 7companies in Exhibit 39 would experience a decline of over 400 basis points. Operatingmargins improve for 69 companies, including the 5 companies in Exhibit 40 that wouldshow improvement of more than 100 basis points. We adjust EBITDA in a similarmanner and calculate adjusted EV/EBITDA multiples for each company in the S&P 500.The EV/EBITDA multiple would increase by 10% or more for 44 companies; 20% ormore for 17 companies; and more than 30% for the 7 companies in Exhibit 42.
Last, we analyze the historical data to focus on quality-of-earnings issues. For example:What percentage of net income is from the pension plan, and how much of the growth inearnings is from rising pension income or declining pension expense? We estimate thatpension income accounted for 2% of aggregate net income for the S&P 500 in both2000 and 2001. For 37 companies, pension income represented at least 10% ofearnings; the 19 companies in Exhibit 72 relied on pension income for 20% or more oftheir net income in 2001. Exhibit 73 highlights the 11 companies where over 20% of thegrowth in net income between 2000 and 2001 can be attributed to either the rise inpension income or the decline in pension expense.
We explore earnings exposure in more detail in the “Forecasting,” “Three Steps to StripOut Accounting Magic,” and “Quality of Earnings” sections of this report.
Cash Flow Exposure
The declining health of defined benefit pension plans may result in companies divertingcash from the providers of capital into the pension plans. We estimate that the cashcontributions for the S&P 500 will rise from $15 billion in 2001 to $29 billion in 2003. Weattempt to forecast the potential cash contributions that each company in the S&P 500will have to make to their defined benefit pension plans according to the ERISArequirements over the next three years. We estimate that the required contributions for38 companies in 2003 will exceed the actual 2001 contributions by more than $100million. We estimate that the 2003 required contribution for the 10 companies in Exhibit17 will have the largest increases over their 2001 pension plan contributions.
We explore cash flow exposure in more detail in the “Forecasting” section of this report.
Assumptions Analysis
We devote an entire section of the report to analyzing the assumptions that thecompanies use in their defined benefit plans. We focus on whether the assumptionsappear aggressive or conservative.
Forecasting Model
To provide investors with a tool to help them answer some of these pension questions,we developed a model (with the help of an actuary) that estimates pension cost, fundedstatus, and required contributions for each of the next three years. This is the samemodel we use to analyze each company in the S&P 500. Due to all the simplifying

The Magic of Pension Accounting 27 September 2002
8
assumptions that we make in the model, actual pension results may vary considerablyfrom our forecasts. An individual company model is available to clients on the CSFBWeb site (http://www.csfb.com/equity/presentations/pension_forecast_model.xls), sothat you may apply your own set of assumptions or investigate companies that areoutside the S&P 500. We recommend using the model and our forecast as a startingpoint for further investigation and analysis.
The Basics of Pension Accounting
For those brave enough, Appendix B explains the nuts and bolts of pension accountingby walking through each line of the pension footnote disclosure for Procter & Gamble.
ConclusionWe created a simple report card, grading the exposure to defined benefit pension plansfor each industry group in the S&P 500 on the basis of key historical metrics that wefocus on in this report. Many of the 360 companies in the S&P 500 with defined benefitpension plans have either low or moderate exposure to their pension plans; however,there is a select group of companies where the exposure is significant. We divide thosewith significant exposure into two groups:
1. Overfunded pension plans. These companies have income statement issues: Howmuch will earnings decline due to falling pension income? How much of the bottomline is coming from the pension plan? Industries at the top of this list includeDiversified Telecommunications, Paper & Forest Products, and IndustrialConglomerates.
2. Underfunded pension plans. These companies attract more troublesome balancesheet and cash flow questions: Will companies have to divert the cash that theyhave set aside to grow the business, buy back stock, pay down debt, or paydividends and pour it into the pension plan? Will these companies have difficultymeeting their funding requirements, in a worst-case scenario, forcing some intobankruptcy? How does ongoing deterioration in the health of the pension plan affectthe balance sheet, and does it have credit rating implications? This group is led bythe Airlines, Automobiles, and Auto Components industries.
We again note that companies that offer only defined contribution plans to theiremployees have no pension problem, but the declining health of defined benefit pensionplans is becoming an important issue for a select group of companies and industries.This group of generally old-line, heavily unionized companies could experience adecline in earnings, a deterioration in the balance sheet, and for some, a drain on cashflow as their pension plans become less funded. In addition, as companies becomemore underfunded, the shareholders have to share more of their stake in the companywith the pension plans.

The Magic of Pension Accounting 27 September 2002
9
Our Key Findings• The combination of a decline in equity markets over the past three years and interest
rates at record lows have resulted in a double whammy for defined benefit pensionplans. The economic value of the pension plan, its funded status, has deteriorated asplan assets have dropped in value and pension obligations have climbed higher.Throw on top a pension obligation with unknown future cash flows, complicatedaccounting, and even more complicated funding requirements, and investors growconcerned and confused.
• We estimate that the aggregate defined benefit pension plan for the companies in theS&P 500 could be as much as $243 billion underfunded at the end of 2002, the firsttime it will be underfunded since 1993. The number of companies with underfundeddefined benefit pension plans had jumped to 240 at the end of 2001, the highest levelin the last 10 years. We estimate there may be as many as 325 companies withunderfunded plans at the end of 2002.
• We estimate that the 30 companies in Exhibit 5 will have defined benefit plans at theend of 2002 that are underfunded by at least 25% of the current equity marketcapitalization. It is for this group of companies that the pension plan appears to havethe largest claim on the shareholders’ stake in the company. The estimates are theresult of applying our basic pension-forecasting model to all the companies in the S&P500 with defined benefit pension plans; we assume that the fair value of plan assetsdrops by about 9% in 2002 and discount rates fall by 50 basis points, along with manyother simplifying assumptions. The funded status is extremely sensitive to changes indiscount rate; for each 50-basis-point change in rate, we assume that the aggregatefunded status for the S&P 500 changes by $60 billion.
• On the other hand, we estimate that 212 companies in the S&P 500 will have definedbenefit plans at the end of 2002 that are underfunded by less than 5% of the currentequity market capitalization.
• We estimate that the 31 companies in Exhibit 7 will have pension plans with aprojected benefit obligation at the end of 2002 that exceeds the current equity marketcapitalization. It is with this group of companies that the shareholders appear to havethe largest potential exposure to defined benefit pension plans. On the other hand, weestimate that 94 companies with defined benefit pension plans in the S&P 500 willhave a PBO at the end of 2002 that is less than 5% of their market capitalization.
• We list the 140 companies in the S&P 500 that appear to have no pension problem inAppendix A. These companies appear to use defined contribution plans only. Definedcontribution plans involve straightforward accounting that properly reflects the simpleeconomics and costs of those plans.
• Many of the 360 companies in the S&P 500 with defined benefit plans have either lowor moderate exposure to their pension plans. We divide those with significantexposure into two groups:
Overfunded pension plans. For these companies, the risks are limited toearnings (Will pension income decline?) and earnings quality (How much of the

The Magic of Pension Accounting 27 September 2002
10
bottom line is from the pension plan?). Industries at the top of this list includeDiversified Telecom, Paper & Forest Products, and Industrial Conglomerates.
Underfunded pension plans. For these companies, the exposure to the pensionplan is more troublesome; the risks are to earnings (Will pension cost rise?), tothe balance sheet, and most important, to cash flow. This group is led by theAirlines, Automobiles, and Auto Components industries.
• The declining health of defined benefit pension plans may result in companiesdiverting the cash that they have set aside to grow the business, buy back stock, paydown debt, or pay dividends and pour it into the pension plan. We estimate that thecash contributions for the S&P 500 will rise from $15 billion in 2001 to $29 billion in2003.
• As pension plans become more and more underfunded, we estimate that theaggregate benefit to earnings for the S&P 500 from the pension plan will dry up in2002. For 2003, we estimate that the companies in the S&P 500 will report netpension expense of $15 billion.
• We estimate the increase in pension cost between 2002 and 2003 will represent atleast 10% of the 2003 First Call consensus earnings estimate for the 26 companies inExhibit 11. The key question to ask is whether the consensus earnings estimateincorporates the potential increase in pension cost; we are not sure of the answer.
• As the health of a defined benefit pension plan deteriorates, some companies mighthave to adjust their balance sheets to reflect their minimum pension liabilities. Thatadjustment could result in a charge to shareholders’ equity, depending upon thestatus of the pension plan at the end of 2002. According to our estimates, the 26companies in Exhibit 14 might have to record a charge to equity that would be greaterthan 25% of their total equity in 2001. On the other hand, we estimate that over halfthe companies in the S&P 500 would incur no such charge.
• We expect companies to begin announcing that they will be taking down theirexpected return assumptions for 2003. As the median rate falls from the current 9.2%,the illusory earnings shield created by the magic of pension accounting shouldbecome evident. If we were to take the expected return assumptions down 50 basispoints for 2003, which we view as a likely scenario, aggregate pension cost for theS&P 500 would increase by about $5 billion.
• Of the 55 different industry groups within the S&P 500, 35 were underfunded by atotal of $57 billion at the end of 2001. Five industry groups—Automobiles, AutoComponents, Oil & Gas, Pharmaceuticals, and Airlines—accounted for 70% of thetotal underfunded amount. (See Exhibit 48 for the breakdown.)
• Concern is rising that the smoothing mechanisms in FAS No. 87, originally designedto reduce reported earnings volatility, have led to misleading financial statements. In2001, the magic of pension accounting transformed a $90 billion loss on pension planassets for the S&P 500 into income of $104 billion. In addition, we estimate thatcompanies in the S&P 500 carried $992 billion in off-balance-sheet pension liabilitiesand $900 billion in off-balance-sheet pension assets at the end of 2001.
• To further understand the actual exposure of the 360 companies with defined benefitplans, where all the investment risk falls on the employer, we replace the magic of

The Magic of Pension Accounting 27 September 2002
11
pension accounting with each plan’s economic reality, treating the plan as if it were aninvestment subsidiary. We simplify the accounting through a three-step process. Wethen examine the impact on the income statement and the balance sheet, a summaryof which is presented in Exhibit 1. It would not surprise us if the FASB were to takeanother look at pension accounting.
Exhibit 1: Summary Impact of Applying our Three-Step Framework—Aggregate S&P 5002001 2000
Off-Balance-Sheet Asset (US$ in billions) $900 $1,041
Off-Balance-Sheet Liability (US$ in billions) $992 $922
Increase in Assets 5% 7%
Increase in Debt 17% 17%
Change in Equity (2%) 3%
Decrease in Earnings (69%) (10%)
Source: Company data, CSFB estimates.
• The difficult economic environment has diminished profitability for the S&P 500, butthe smoothing mechanisms of FAS No. 87 have alleviated some of the pressure onthe bottom line. Replacing these mechanisms with what actually happened in thepension plans would drop the aggregate earnings for the S&P 500 by 69% in 2001and 10% in 2000 but would increase earnings by 26% in 1999. Earnings would be cutby at least half for 14 industry groups and for 82 companies in 2001; earnings wouldnot be affected for 140 companies, and would actually increase for 12 companies; theaggregate return on equity would drop from 8% to 2%.
• We estimate that after-tax net pension income was 2% of the aggregate net incomefor the S&P 500 in both 2001 and 2000; 150 companies reported net pension incomein 2001 and 206 reported net pension expense. The 9 industries in Exhibit 71generated at least 5% of profits from the pension plan, and the 19 companies inExhibit 72 generated lower-quality earnings by relying on pension income for at least20% of the bottom line in 2001.
• We devote an entire section of the report to analyzing the assumptions that thecompanies use in their defined benefit plans. We focus on whether the assumptionsappear aggressive or conservative and on the impact that changes in the assumptionswould have on earnings and the funded status.
• To provide investors with a tool to help them answer some of these pensionquestions, we developed a model (with the help of an actuary) that estimates pensioncost for each of the next three years. Using the information from the pension footnoteand a number of assumptions about the future, the model calculates both a FAS No.87 “pension accounting cost” and our “real pension cost.” In addition, the modelprovides an estimate of the pension plan’s funded status for the next three years andthe required contributions that the company might have to make to the pension plan.We use this model for each company in the S&P 500. The individual company modelis available to clients on the CSFB Web site (http://www.csfb.com/equity/presentations/pension_forecast_model.xls), so that you may apply your own set ofassumptions or investigate companies that are outside the S&P 500.
• We base our analysis on the companies comprising the S&P 500 index, reflectingchanges to the index through July 31, 2002.

The Magic of Pension Accounting 27 September 2002
12
• In addition, we analyze the defined benefit pension plan data from a number ofdifferent angles, including our simple Pension Report Card. (See Exhibit 2 for someinteresting summary statistics.)
Exhibit 2: Some Interesting Summary Statistics for the S&P 500Pension Plan Stats 2002E 2001 2000 1999
Number of Companies Overfunded 33 118 229 261
Number of Companies Underfunded 325 240 118 81
Plan Assets (US$ in billions) $904 $1,069 $1,192 $1,149
Projected Benefit Obligation (PBO) (US$ in billions) $1,147 $1,064 $972 $897
Funded Status $ (US$ in billions) (Under) Over ($243) $4 $220 $252
Funded Status % 79% 100% 123% 128%
# of Companies – Pretax Pension Income 117 150 155 102
# of Companies – Pretax Pension Expense 242 206 188 234
After-Tax Pension Income % of Net Income 0% 2% 2% 0%
Median Expected Rate of Return on Plan Assets 9.20% 9.20% 9.20%
Median Discount Rate 7.25% 7.50% 7.50%
Median Salary Inflation Rate 4.50% 4.50% 4.50%
Actual Return (7.50%) 4.94% 17.31%
Source: Company data, CSFB estimates.

The Magic of Pension Accounting 27 September 2002
13
The “Magic of Pension Accounting”How else do you explain when a decline in the value of pension plan assets is replacedby income in the form of the expected return on plan assets? For the S&P 500, weestimate this magic transformed a $90 billion loss on plan assets during 2001 into $104billion of income. Pension assets and liabilities can also vanish off balance sheet. Weestimate that companies in the S&P 500 carried $992 billion in off-balance-sheetpension liabilities and $900 billion in off-balance-sheet pension assets at the end of2001. This reflects the very powerful smoothing mechanisms in FAS No. 87,“Employers’ Accounting for Pensions,” that were built to protect the balance sheet andreduce earnings volatility; gains and losses are deferred with the hope that over timethey would offset each other. The end result: misleading financial statements that do notreflect the decaying economic reality of the pension plan.
The combination of a decline in equity markets over the past three years and interestrates at record lows have resulted in a double whammy for defined benefit pensionplans. The economic value of the pension plan—its funded status—has deteriorated asplan assets have dropped in value, and pension obligations have climbed higher. Forthe S&P 500, pension plan assets have declined by $78 billion, while the projectedbenefit obligation (PBO) has increased by $170 billion, taking the pension plan from$252 billion overfunded at the end of 1999 to only $4 billion overfunded by the end of2001, leaving the aggregate pension plan for the S&P 500 with approximately $1 trillionin plan assets and a $1 trillion obligation. We estimate that the aggregate pension planfor the companies in the S&P 500 may be as much as $243 billion underfunded at theend of 2002, the first time it is underfunded since 1993, as depicted in Exhibit 3.
Exhibit 3: Funded Status of Defined Benefit Pension Plans for the S&P 500
1991A1992A
1993A1994A
1995A1996A
1997A1998A
1999A2000A
2001A2002E
2003E2004E
70%
80%
90%
100%
110%
120%
130%
Per
cen
tF
un
ded
Historical Evenly Funded Forecast
Source: Company data, CSFB estimates.
The deteriorating health of defined benefit pension plans, combined with misleadingaccounting, enormously complicated funding requirements, and a pension obligationwith unknown future cash flows, has left investors dazed and confused.

The Magic of Pension Accounting 27 September 2002
14
The Most Popular QuestionsThe accounting rules erase much of the real volatility and exposure inherent in thepension plan from the financial statements. It is the pension disclosure that is buried inthe footnotes that helps to shed some light on the complicated economics of a definedbenefit plan. Throw on top a set of funding requirements that were written inhieroglyphics and involve an entirely separate set of assumptions and calculations todetermine how much cash the company has to put in its pension plan, and you canunderstand why we have been inundated with questions about pension accounting forquite some time.
Typical questions that we have been getting recently include, “I don’t get it, the pensionplan assets declined in value last year, but the expected return on plan assets movedhigher.” Or, “If the pension plan is underfunded, why does the company report a pensionasset on its balance sheet?” That’s the magic of pension accounting.
In the late 1990s, most of the questions we received on pension accounting (yes,people did ask accounting questions in the late 1990s) were geared toward the qualityof earnings: How much of the bottom line was coming from the pension plan? Now,everyone wants to know if defined benefit pension plans are a time bomb waiting toexplode. The fears and questions in the market include:
• Are there certain industries/companies that are more exposed to defined benefitpension plans?
• What is the real exposure for the sponsoring company to a defined benefit pensionplan?
• How large of a claim does the pension plan have on my stake in the company?
• What companies will have difficulty meeting their funding requirements, in a worst-case scenario, forcing some into bankruptcy?
• As equity returns continue to falter, will pension plans rotate out of equity into fixedincome to try and protect what is left of the pension plans’ funded status, furtherdepressing the stock market?
• To meet funding requirements, will companies have to divert the cash they have setaside to grow the business, buy back stock, pay down debt, or pay dividends and pourit into the pension plan?
• At what point will companies have to increase the contributions that they make to thepension plan?
• When will earnings be negatively affected by accelerating pension expense ordeclining pension income?
• What will happen to the funded status of the pension plan and how does it affect thebalance sheet?
• Do the assumptions that companies use make sense? In particular, are the expectedreturn assumptions too high? What happens if companies have to bring them down?
• As to quality of earnings, how much of the bottom line and margins are a result of thepension plan?

The Magic of Pension Accounting 27 September 2002
15
We are issuing this research report to help investors answer these questions andprovide a better understanding of the investment implications of pension accounting.
We want to make clear that this report is not taking up the topic of other postretirementbenefits (OPEB). The accounting in FAS No. 106, “Employers’ Accounting forPostretirement Benefits Other Than Pensions,” is virtually the same as FAS No. 87.However, the economics are dramatically different, as many companies don’t fund theirOPEB plans, because (1) they don’t have to and (2) they don’t get preferential taxtreatment. When analyzing OPEB plans, we apply the same methodology that wedescribe in this report. We do not combine the OPEB plans with the pension plans, asthey are entirely separate obligations.

The Magic of Pension Accounting 27 September 2002
16
Who Has Exposure?
Defined Benefit versus Defined ContributionTo determine whether a company has exposure to pension issues, we first need toidentify what type of pension plan the company offers to its employees. There are twobasic types of pension plans: defined benefit and defined contribution. The differencebetween the two is a function of what the employer has promised to its employees.
Defined contribution plans (401k’s) generally promise that the employer will makecertain contributions on behalf of the employee; future benefits will depend upon theinvestment returns in the employee’s retirement account. Therefore, all investment risklies with the employee. The employer has no obligation beyond the contributions madeeach period. The accounting for a defined contribution plan is straightforward. Expenseis recognized when the employer makes a contribution on behalf of the employee. Theeconomics are simple, as the accounting properly reflects the economics, whichtranslates into no pension problem for the 140 companies included in Appendix A.
It is defined benefit plans that keep actuaries employed, give investors headaches, andare the focus of our report. Defined benefit plans promise a future retirement benefitdetermined by a benefit formula. For example, a company may promise to pay anemployee a retirement benefit of $20 per month for each year of service; or it mayguarantee the employee an annual retirement benefit of 50% of the last year’s salary.No matter what the benefit formula, the employer is obligated to pay a benefit at somepoint in the future, the ultimate cost of which is unknown. Therefore, all the investmentrisk falls on the employer. We estimate that approximately 360 companies have varyingdegrees of exposure to defined benefit pension plans in the S&P 500. Defined benefitpension plans are more common with old-line, industrialized, unionized types ofcompanies; they are generally not found with newer companies, especially thosefounded post ERISA, 1974. Exhibit 4 lists the concentrations of defined benefit pensionplans by industry.

The Magic of Pension Accounting 27 September 2002
17
Exhibit 4: Percentage of Companies with Defined Benefit Pension Plans by IndustryIndustry % Industry % Industry %
Aerospace & Defense 100.0% Paper & Forest Products 100.0% Electronic Equipment & Instruments 60.0%
Air Freight & Logistics 100.0% Road & Rail 100.0% Commercial Services & Supplies 57.9%
Auto Components 100.0% Tobacco 100.0% Multiline Retail 53.8%
Automobiles 100.0% Diversified Telecom Services 88.9% Health Care Providers & Services 50.0%
Beverages 100.0% Metals & Mining 87.5% Trading Companies & Distributors 50.0%
Building Products 100.0% Oil & Gas 87.5% Computers & Peripherals 45.5%
Chemicals 100.0% Insurance 83.3% Hotels Restaurants & Leisure 45.5%
Construction & Engineering 100.0% Multi-Utilities & Unregulated Power 83.3% Biotechnology 40.0%
Construction Materials 100.0% Banks 82.8% Textiles Apparel & Luxury Goods 40.0%
Containers & Packaging 100.0% Diversified Financials 78.3% Communications Equipment 38.5%
Electric Utilities 100.0% Household Durables 76.9% Specialty Retail 33.3%
Energy Equipment & Services 100.0% Pharmaceuticals 76.9% Real Estate 25.0%
Food Products 100.0% Food & Drug Retailing 75.0% Semiconductor Equipment & Products 19.0%
Gas Utilities 100.0% Health Care Equipment & Supplies 75.0% Software 5.9%
Household Products 100.0% IT Consulting & Services 75.0% Internet & Catalog Retail 0.0%
Industrial Conglomerates 100.0% Electrical Equipment 71.4% Internet Software & Services 0.0%
Leisure Equipment & Products 100.0% Airlines 66.7% Wireless Telecommunication Services 0.0%
Machinery 100.0% Personal Products 66.7%
Office Electronics 100.0% Media 62.5%
Source: Company data, CSFB estimates.
Over time, we expect the significance of defined benefit plans to decline as morecompanies shift employees to defined contribution plans only.
Defined Benefit PlansThe calculations behind the scenes, the assumptions in actuarial tables, thedemographic data, and mortality predictions are all part of the wonderful world of anactuary and are extremely complicated. They should be complicated. With a definedbenefit pension plan the sponsoring company has entered into an obligation where theultimate cash flows are unknown. It is the unknown that spooks investors and is onereason why pension accounting gets so much attention.
However, once past the intricate calculations, there are only two components to adefined benefit pension plan: plan assets and an obligation. We think of a definedbenefit pension plan as an investment subsidiary with a collection of assets (equity,fixed income, real estate, private equity, venture capital, etc.) and an obligation (thepromise to pay retirement benefits to the employees in the future, similar to a series ofzero coupon bonds). The most relevant information about this investment subsidiary isthe fair value of the assets (the market value of the stocks, bonds, real estate and otherassets that are in the portfolio) and the fair value (present value) of the obligation, theprojected benefit obligation. We have reasonable estimates of each. If the assets aregreater than the obligation, the pension plan is overfunded. If the obligation is largerthan the assets, then the pension plan is underfunded.
The funded status represents the economic value of the pension plan. An overfundedpension plan is an economic asset for the sponsoring company, one that is difficult tomonetize, however, still an asset. Capital that would have been allocated to the pensionplan can now be put to other uses—reinvestment, share repurchases, debt paydown,dividends, etc. On the other hand, an underfunded plan can be considered an economic

The Magic of Pension Accounting 27 September 2002
18
liability that could increase future contributions to the pension plan from the company,drawing capital away from other parts of the business.
Shareholders’ ExposureWe start by determining the defined benefit pension plans that could have the largestclaim on the shareholders’ stake in the company. To do this we simply compare theeconomic value of the pension plan, its funded status, with the value of theshareholders’ stake in the company, the equity market capitalization. We estimate thatthe 30 companies in Exhibit 5 may have defined benefit pension plans at the end of2002 that are underfunded by more than 25% of their current equity marketcapitalization as of September 24, 2002. In other words, the pension plan may have aclaim on over one-quarter of the shareholders’ stake in the company.
Exhibit 5: Companies with Pension Plans Estimated Underfunded at the end of 2002 by
More than 25% Equity Market CapitalizationUS$ in millions
Company Ticker
2002EUnderfunded
Amount
CurrentMarket
Capitalization
2002EUnderfunded/
Market Capitalization
AMR Corp AMR $ 3,367 $ 560 601%
Delta Air Lines Inc DAL 4,376 1,240 353%
Avaya Inc AV 703 485 145%
Goodyear Tire & Rubber Co GT 1,965 1,386 142%
General Motors Corp GM 29,428 21,421 137%
McDermott Intl Inc MDR 448 333 134%
Delphi Corp DPH 4,245 4,811 88%
Navistar International NAV 1,093 1,249 88%
Ford Motor Co F 14,273 17,026 84%
Cummins Inc CUM 729 902 81%
CMS Energy Corp CMS 590 1,108 53%
Xerox Corp XRX 2,297 4,352 53%
Visteon Corp VC 651 1,297 50%
Hercules Inc HPC 477 954 50%
Allegheny Technologies Inc ATI 237 500 47%
Boise Cascade Corp BCC 613 1,356 45%
United States Steel Corp X 515 1,170 44%
Lucent Technologies Inc LU 1,466 3,364 44%
Williams Cos Inc WMB 392 909 43%
Dana Corp DCN 848 2,001 42%
Maytag Corp MYG 638 1,800 35%
Georgia-Pacific Corp GP 1,141 3,235 35%
NCR Corp NCR 729 2,110 35%
Corning Inc GLW 523 1,556 34%
Unisys Corp UIS 750 2,230 34%
AES Corp AES 380 1,210 31%
Raytheon Co RTN 3,612 12,651 29%
Goodrich Corp GR 561 1,993 28%
Electronic Data Systems Corp EDS 1,540 5,610 27%
Boeing Co BA 6,846 27,936 25%
Source: Company data, CSFB estimates.

The Magic of Pension Accounting 27 September 2002
19
On the other hand, we estimate that 212 companies in the S&P 500 may have definedbenefit pension plans at the end of 2002 that are underfunded by less than 5% of theircurrent equity market capitalization. We estimate that 33 companies may haveoverfunded pension plans at the end of 2002, including the 6 companies in Exhibit 6,where we estimate that the amount overfunded exceeds 5% of the current equity marketcapitalization.
Exhibit 6: Four Plans Estimated Overfunded at End of 2002 by 5% or More of the Equity
Market CapitalizationUS$ in millions
Company Ticker2002E Funded
StatusCurrent Market
Capitalization2002E Funded Status/Market Capitalization
Meadwestvaco Corp MWV $ 733 $ 4,035 18%
FPL Group Inc FPL 730 9,316 8%
Nicor Inc GAS 91 1,195 8%
Sherwin-Williams Co SHW 259 3,494 7%
Xcel Energy Inc XEL 190 3,437 6%
People’s Energy Corp PGL 57 1,177 5%
Source: Company data, CSFB estimates.
Next, we evaluate which companies have the largest potential exposure, the highestleverage, to defined benefit pension plans by comparing the pension obligation to theequity market capitalization. We estimate that the 31 companies in Exhibit 7 may haveprojected benefit obligations at the end of 2002 that exceed their current equity marketcapitalization. For 94 companies with defined benefit plans, the estimated PBOs at theend of 2002 could represent less than 5% of their current equity market capitalization.

The Magic of Pension Accounting 27 September 2002
20
Exhibit 7: Projected Benefit Obligation Equity Market CapitalizationUS$ in millions
Company Ticker 2002E PBOCurrent Market
Capitalization2002E PBO/
MarketCapitalization
AMR Corp AMR $8,313 $560 1483%
Delta Air Lines Inc DAL 11,713 1,240 945%
Lucent Technologies Inc LU 30,775 3,364 915%
United States Steel Corp X 7,516 1,170 642%
McDermott Intl Inc MDR 1,987 333 597%
Avaya Inc AV 2,748 485 567%
General Motors Corp GM 90,829 21,421 424%
Goodyear Tire & Rubber Co GT 5,512 1,386 398%
Allegheny Technologies Inc ATI 1,926 500 386%
Ford Motor Co F 55,184 17,026 324%
Navistar International NAV 3,515 1,249 281%
Cummins Inc CUM 2,234 902 248%
Unisys Corp UIS 5,156 2,230 231%
Qwest Communication Intl Inc Q 9,325 4,372 213%
Delphi Corp DPH 9,778 4,811 203%
NCR Corp NCR 3,900 2,110 185%
Xerox Corp XRX 8,003 4,352 184%
PG&E Corp PCG 6,752 3,948 171%
Hercules Inc HPC 1,535 954 161%
Pactiv Corp PTV 3,604 2,622 137%
Dana Corp DCN 2,728 2,001 136%
Georgia-Pacific Corp GP 4,240 3,235 131%
Dynegy Inc DYN 575 443 130%
Boeing Co BA 35,498 27,936 127%
Williams Cos Inc WMB 1,127 909 124%
CMS Energy Corp CMS 1,361 1,108 123%
Visteon Corp VC 1,550 1,297 120%
Corning Inc GLW 1,853 1,556 119%
Boise Cascade Corp BCC 1,611 1,356 119%
TRW Inc TRW 7,975 7,546 106%
Goodrich Corp GR 2,053 1,993 103%
Source: Company data, CSFB estimates.
Pension Report CardThroughout this report, we analyze defined benefit pension plan data for the S&P 500companies from a number of different angles. We do this to try and answer the simplequestion: Who has exposure to defined benefit pension plans? We have created asimple report card, grading the exposure to defined benefit pension plans for eachindustry group in the S&P 500 on the basis of key historical metrics that we focus on inthis report. Exhibit 8 aggregates by industry select portions of the data that we’veexamined and provides a weighted-average score for each. We arrive at a weighted-average score by selecting three key metrics to include in a simple test:
1. Plan Assets/Projected Benefit Obligation—Focuses on funded status over the pastfive years in relation to a 90% funding threshold, applying a score based on howoverfunded or underfunded a particular industry is with respect to its peers. As arule of thumb, 90% represents a useful hurdle rate for determining the adequacy of

The Magic of Pension Accounting 27 September 2002
21
a company’s funded status (i.e., companies less than 90% funded may be requiredto make contributions to their pension plans). We cover this topic in greater detail inthe “Funding Requirements” section.
2. Pension Cost/Operating Income—Focuses on whether the profitability of an industryhas been significantly affected by pensions, applying a score based on whether anindustry has posted significant pension income or pension expense as a percentageof operating income over the past five years.
3. Funded Status/Market Capitalization—Focuses on the size of the claim that thepension plan has on the shareholders’ stake in the company, applying a scorebased on how large the over- or underfunded status is as a percentage of marketcapitalization. To do this we simply compare the economic value of the pensionplan, its funded status, with the value of the shareholders’ stake in the company, theequity market capitalization.
These are critical metrics for evaluating an industry’s exposure to defined benefitpension plans, but we have a problem combining them in our analysis because eachmetric is unique (i.e., metric 1 focuses on funded status, metric 2 focuses on operatingincome, and metric 3 focuses on market value). We turn to a useful statistical tool toovercome this hurdle: the Z-score. Z-scores help to “standardize” each metric withrespect to the others. Once we have Z-scores across each key metric, we can combinethem to come up with one overall score for each industry. As we consider each metricequally important, we apply equal 33% weights to each. Quite simply, the Z-scorefocuses on the average. In our report card, average industries receive a Z-score of zero,while above-average industries receive a positive score and below-average industriesreceived a negative score. We can then rank the industries by their combined Z-scores.
Let’s walk through an example from Exhibit 8 to demonstrate. Media is “middle-of-the-road” and, for this reason, gets a Z-score close to zero across every metric. We interpretthis by stating that, compared with other industries, Media is neither significantly over- orunderfunded, does not report significant pension income or expense, and does not havea funded status that is significant relative to its market capitalization. Let’s now shift tothe upper extreme: the Diversified Telecom industry. This industry receives a very high(positive) Z-score because again, compared with other industries, it is very overfunded,reports substantial pension income, and has a large overfunded pension plan relative toits market capitalization. Finally, we move to the lower extreme: the Airlines industry.Airlines receive a very low (negative) Z-score because it is significantly underfunded,incurs high pension cost as a percentage of operating income, and is underfunded by alarge percentage of its market capitalization.
As Exhibit 8 shows, scores ranged between plus 1.80 to minus 2.54; 30 out of 50industries scored between plus or minus 0.6, highlighting the insignificance of theirexposure. (We excluded 5 industries for which defined benefit pension plans wereimmaterial—Internet & Catalog Retail, Internet Software & Services, Wireless TelecomServices, Software, and Biotechnology.) Another 11 industries ranked on the high endof our report card. Although these industries don’t currently face any funding problemsor cash flow constraints with respect to their plans, they do face high exposure toearnings (Will pension income decline?) and quality of earnings (How much of thebottom line is from the pension plan?) issues, given their significant levels of

The Magic of Pension Accounting 27 September 2002
22
overfunding. Finally, 9 industries ranked on the low end of our scale, facing highexposure to earnings (Will pension expense increase?) issues, the need to possiblycommit cash flows to their pension plans, and potential pressure regarding their creditstandings. Although we exercise judgment in selecting the metrics we use to arrive ateach industry’s Z-score, the calculation itself and the corresponding rankings areobjective. As a result, we believe that this report card effectively highlights industrieswith the greatest degrees of exposure to the pension accounting issues that we addressin this report.

The Magic of Pension Accounting 27 September 2002
23
Exhibit 8: Pension Report Card
Industry1 Metrics Weighted Totals
NamePlan Assets /
PBOPension Cost/
Operating IncomeFunded Status/
Mkt. CapZ-Score
Diversified Telecom Services 2.05 1.65 1.69 1.80Industrial Conglomerates 2.11 1.44 0.73 1.43Paper & Forest Products 1.18 1.83 0.79 1.27Communications Equipment 1.69 1.19 0.66 1.18Metals & Mining 0.73 1.65 0.62 1.00Gas Utilities 1.11 0.55 1.05 0.90Specialty Retail 2.16 0.08 0.22 0.82Construction Materials 1.70 0.09 0.55 0.78Aerospace & Defense 0.49 1.44 0.27 0.73Containers & Packaging 0.43 1.40 0.31 0.71Electric Utilities 0.83 0.52 0.55 0.63Construction & Engineering 0.31 1.33 0.07 0.57Computers & Peripherals 0.23 1.14 0.20 0.52Banks 0.87 0.12 0.26 0.41Trading Companies & Dstrbtrs. 0.52 0.33 0.27 0.37Leisure Equipment & Products (0.08) 0.71 0.48 0.37Food & Drug Retailing 0.58 (0.05) 0.21 0.24Tobacco 0.37 0.06 0.12 0.19Commercial Serv. & Suppl. 0.06 0.06 0.21 0.11Chemicals (0.15) 0.44 0.01 0.10Road & Rail (0.06) 0.12 0.11 0.05Diversified Financials (0.10) 0.04 0.20 0.04Insurance (0.03) (0.04) 0.20 0.04Media (0.01) (0.11) 0.19 0.02Real Estate (0.34) 0.06 0.20 (0.03)Household Durables (0.05) (0.11) 0.07 (0.03)Food Products (0.14) (0.31) 0.19 (0.09)Textiles Apparel & Lux. Goods (0.34) (0.10) 0.16 (0.09)Multiline Retail (0.42) (0.17) 0.16 (0.14)Energy Equipment & Serv. (0.03) (0.49) 0.09 (0.15)Electrical Equipment (0.34) (0.24) 0.11 (0.16)Multi-Utilities & Unreg. Power (0.13) (0.30) (0.10) (0.17)Health Care Providers & Serv, (0.47) (0.22) 0.14 (0.19)Hotels Restaurants & Leisure (0.78) 0.01 0.19 (0.19)Health Care Equip. & Suppl. (0.62) (0.28) 0.16 (0.25)Air Freight & Logistics 0.37 (1.39) 0.27 (0.25)IT Consulting & Services (0.02) (0.97) 0.13 (0.29)Machinery (0.29) (0.42) (0.18) (0.30)Beverages (0.80) (0.42) 0.12 (0.37)Pharmaceuticals (0.76) (0.49) 0.11 (0.38)Household Products (1.32) (0.44) 0.08 (0.56)Electronic Equip. & Instrumnts. (0.95) (1.00) (0.06) (0.67)Personal Products (1.24) (0.81) 0.03 (0.67)Building Products (1.47) (0.87) (0.09) (0.81)Semiconductor Equip. & Prod. (2.46) (0.23) 0.16 (0.85)Oil & Gas (1.56) (0.86) (0.13) (0.85)Office Electronics (0.59) (0.93) (1.50) (1.00)Auto Components (0.52) (1.95) (1.90) (1.46)Automobiles (0.71) (1.28) (3.64) (1.88)Airlines (1.00) (1.92) (4.70) (2.54)1 Excludes Internet & Catalog Retail, Internet Software & Services, and Wireless Telecom Services, which are not applicable. Also excludes
Software and Biotechnology because the number of companies in each industry and their totals are not significant.
HighExposure withRisks Limitedto EarningsQuality
LowExposure withNo SignificantRisks
High Exposurewith SignificantRisks toEarnings, CashFlows, andBalance Sheet
Source: Company data, CSFB estimates.

The Magic of Pension Accounting 27 September 2002
24
ForecastingYou’ve got to be very careful if you don’t know where you’re going, because you mightnot get there – Yogi Berra
Many of the questions that we get regarding pension accounting are forward looking.Investors are concerned about the potential impact that the low interest rateenvironment and poor equity returns could have on defined benefit pension plans. Forexample:
• At what point will companies have to increase their contributions to the pension plans,and by what amount? (We tackle this topic in the “Funding Requirements” section.)
• When will earnings be negatively affected by accelerating pension expense ordeclining pension income, and by what amount?
• What will happen to the funded status of the pension plan, and how will it impact thebalance sheet?
• What impact will changes in assumptions, in particular taking down the expected rateof return, have on pension cost?
Pension-Forecasting ModelAll the twists and turns of pension accounting make answering these questionsextremely difficult. To provide investors with a tool to help them answer some ofthese questions, we developed a model (with the help of an actuary) that estimatespension cost, funded status, and required contributions for each of the next three years.Using the information from pension footnotes and a number of assumptions about thefuture, the model calculates both a FAS No. 87 “pension accounting cost” and our “realpension cost.” We applied the model to each company in the S&P 500. The model isavailable to clients on the CSFB Web site (http://www.csfb.com/equity/presentations/pension_forecast_model.xls) so that you can apply your own set of assumptions orexamine companies that are outside the S&P 500.
A word of caution when using the model: It is an extremely simple approach toforecasting pension results; an entire profession, the actuary, is devoted to calculatingand forecasting this information with extremely powerful, intricate models. The modelhas its limitations; for example, we use the aggregated data for each company in theS&P 500 that is provided in the pension footnotes. In the real world, companies performthe calculations on each and every pension plan that they make available to theiremployees. Our model also does not factor in the various other assumptions thatcompanies make; for example, mortality, time to retirement, etc. In addition, we assumethe same mix of assets for all the plans and we forecast the same returns on thoseassets for each company in the S&P 500.
In addition, this is just one of countless methodologies that companies could use tocalculate their pension results. For example, to calculate the expected return on planassets, companies can multiply the expected rate of return by something called the“market-related value” of plan assets; the market-related value can be either the fairvalue of the pension plan assets or a smoothed, calculated value. The calculated valuecan be derived in a number of different ways; think five-year moving average of the plan

The Magic of Pension Accounting 27 September 2002
25
assets fair value. The expected return on plan assets will be much more volatile for acompany that has decided to use fair value.
With plan assets dropping so dramatically over the last few years, companies havebeen approaching the SEC about switching from fair value to the calculated valuemethod, and we understand that the SEC has turned them down. For a company tomake a change in accounting method, it must justify that it is making a change to apreferable method. It appears as if the SEC did not accept the argument that calculatedvalue was a preferable method simply because it reduced earnings volatility.
Our model chooses from two of the many methods used to calculate the expectedreturn—either the fair value of plan assets or a smoothed, moving average of planassets (described in FAS No. 87). According to the July 2001 “Survey of AssetValuation Methods for Defined Benefit Pension Plans,” submitted by The Society ofActuaries’ Committee on Retirement Systems Research, 42.1% of pension plans withassets over $100 million use the fair value of plan assets to calculate the expectedreturn for accounting purposes and the remaining 57.9% use a calculated value.
Our model also calculates the impact of changes in discount rate on the projectedbenefit obligation using a simple duration approach. We back into the portion of theobligation associated with retirees and assign an actuarial rule-of-thumb 8-yearduration; we assume the remaining obligation is related to active employees and weassign a longer 15-year duration. For each 100-basis-point change in rates, we simplyassume the obligation will change between 8% and 15%, depending upon theproportion of retirees and actives in the plan. Clearly, there can be a significantdifference in the sensitivity to discount rates from one plan to the next; age of workforceand number of retirees will have an impact on the duration of the PBO. Clients canadjust the model we make available for different duration levels.
In addition, our model does not factor in the impact of forecast, mergers andacquisitions, terminations, spinoffs, reductions in workforce, amendments, earlyretirement windows, etc. We recommend using our model and our S&P 500 forecast toperform sensitivity analysis. It should be the starting point for further investigation andanalysis. Due to all the simplifying assumptions that we make in the model, actualpension results may vary considerably from our forecasts. We describe the model inmore detail in Appendix H.
Our S&P 500 ForecastFor our base case forecast for the S&P 500, we assume plan assets decline 9.45% for2002 based on a 65% equity/35% fixed income mix of plan assets. We arrived at ourplan asset mix based on a Greenwich Associates survey of 1,445 U.S.-based corporatepension funds, public pension funds, and endowments, conducted in August andSeptember 2001. According to the survey, U.S. pension plan portfolios held 66.7%equity (49.5% domestic stocks, 11.2% international stocks, 3.0% equity real estate, and3.0% private equity) and 26.3% fixed income. The remaining 7% was invested in cashand other asset classes. To keep things simple, we split the portfolio 65/35. We assumethat the equity component declines 18.85% in 2002 after factoring in the year-to-datereturns for the S&P 500 and EAFE Index. With the average bond fund up 8% year todate in 2002, we view an 8% return for the fixed income component of our mock

The Magic of Pension Accounting 27 September 2002
26
portfolio as appropriate. For 2003 and 2004, we use the historical (back to 1926) equity(10%) and fixed income (5.50%) rates of return according to Ibbotson.
We arrive at the 50-basis-point decline in discount rates for 2002 by comparing theaverage yield for the Moody’s Aa corporate bond index from the end of 2001, 7.19%, tothe yield on September 20, 2002, 6.59%. We use the Moody’s Aa as a proxy, as thediscount rates used to calculate the PBO are based on high-grade corporate bonds.(For further discussion, refer to “Discount Rate” section on page 88.) We assumediscount rates will rise 25 basis points in 2003 and 25 basis points in 2004 from thecurrent historically low levels. We keep the expected rate of return and salary inflationrate assumptions at 2001 levels. Exhibit 9 summarizes the key assumptions andaggregate findings for our base case. This is just one of the endless scenarios that canbe run through the model.
Exhibit 9: Summary of Base Case Assumptions and Aggregate Findings
US$ in billions, unless otherwise stated
2001A 2002E 2003E 2004E
BASE CASE
Plan Assets
Equities—65% (18.85%) 10.00% 10.00%
Fixed Income—35% 8.00% 5.50% 5.50%
Actual Return (7.50%) (9.45%) 8.43% 8.43%
Projected Discount Rate Change (bps) (50) 25 25
Inflation 3% 3% 3%
Aggregate Findings S&P 500
Percent Funded 100% 79% 82% 86%
Funded Status $ $4 ($243) ($206) ($154)
Accounting Pension Income/(Expense) $7 ($1) ($15) ($19)
Real Pension Income/(Expense) ($224) ($259) $7 $7
Cash Contributions $15 $10 $29 $44
Source: Company data, CSFB estimates.
Impact on EarningsAs pension plans become more and more underfunded, we estimate that the aggregatebenefit to earnings for the S&P 500 from the pension plan will dry up in 2002. In theaggregate, we estimate a decline in net pension cost from $7 billion of income in 2001to $1 billion of expense in 2002, generating net pension expense for the first time since1998. For 2003, we estimate that the S&P 500 will report net pension expense of $15billion.
As 2002 is almost over, we focus our attention on 2003. We estimate that 337companies will experience an increase in pension cost, reducing earnings, between2002 and 2003. Pension cost may decline for 22 companies. We estimate that the 9companies in Exhibit 10 will experience increases in pension cost between 2002 and2003 of at least $250 million.

The Magic of Pension Accounting 27 September 2002
27
Exhibit 10: Estimated Pension Cost Increase of at Least $250 Million between 2002 and
2003
US$ in millions
Company Ticker
2002EPension (Income)/
Expense
2003EPension (Income)/
Expense Increase
General Motors Corp GM $ 2,767 $ 4,990 $ 2,223
Verizon Communications VZ (1,759) (1,337) 423
Delta Air Lines Inc DAL 358 710 352
SBC Communications Inc SBC (1,010) (659) 351
Intl Business Machines Corp IBM (1,253) (946) 307
Bank Of America Corp BAC 84 382 298
Du Pont (E I) De Nemours DD (237) 42 279
Ford Motor Co F 187 441 254
Dow Chemical DOW 26 278 252
Source: Company data, CSFB estimates.
To measure whether a change in pension cost is meaningful to a particular company’sfuture earnings, we compare our estimated per share (using a constant share count)change in pension cost between 2002 and 2003 to the First Call consensus earningsestimate for 2003. The increase in pension cost represents at least 10% of theconsensus earnings estimate for the 27 companies in Exhibit 11. The key question iswhether the consensus estimate has taken into account the potential increase inpension cost; we are not sure whether or not it has.

The Magic of Pension Accounting 27 September 2002
28
Exhibit 11: Significance of Increases in Pension Cost per Share between 2002E and 2003E
as a Percentage of 2003E First Call Consensus Earnings Estimates
Company Ticker
APension Cost/Share
Increase between 2002Eand 2003E
B2003E First Call
ConsensusA/B
Percentage
Avaya Inc AV $0.30 $0.01 2,966%
Allegheny Technologies Inc ATI 0.58 0.39 150%
Navistar International NAV 0.63 0.84 75%
Goodyear Tire & Rubber Co GT 0.53 0.74 72%
Citizens Communications Co CZN 0.03 0.06 51%
General Motors Corp GM 2.60 6.30 41%
Georgia-Pacific Corp GP 0.76 2.97 25%
Boise Cascade Corp BCC 0.44 2.04 22%
Fedex Corp FDX 0.54 3.12 17%
Agilent Technologies Inc A 0.05 0.28 17%
Northrop Grumman Corp NOC 1.04 6.63 16%
Ryder System Inc R 0.33 2.16 15%
Visteon Corp VC 0.12 0.76 15%
TRW Inc TRW 0.59 4.06 14%
McDermott Intl Inc MDR 0.10 0.78 13%
Ford Motor Co F 0.09 0.72 13%
PG&E Corp PCG 0.26 2.03 13%
Raytheon Co RTN 0.26 2.09 12%
United States Steel Corp X 0.26 2.32 11%
Cooper Tire & Rubber CTB 0.21 1.93 11%
Brunswick Corp BC 0.19 1.76 11%
Pactiv Corp PTV 0.15 1.44 10%
Delphi Corp DPH 0.12 1.14 10%
Hercules Inc HPC 0.09 0.92 10%
PPG Industries Inc PPG 0.36 3.59 10%
Cummins Inc CUM 0.23 2.33 10%
NCR Corp NCR 0.19 1.95 10%
Source: Company data, CSFB estimates.
Impact on Funded StatusThe continued decline in equity markets and interest rates at record lows could drive theaggregate defined benefit pension plan for the S&P 500 to as much as $243 billionunderfunded at the end of 2002; the first time it will be underfunded since 1993, asdepicted in Exhibit 12.

The Magic of Pension Accounting 27 September 2002
29
Exhibit 12: Funded Status of Defined Benefit Pension Plans for the S&P 500
1991A1992A
1993A1994A
1995A1996A
1997A1998A
1999A2000A
2001A2002E
2003E2004E
70%
80%
90%
100%
110%
120%
130%
Per
cen
tF
un
ded
Historical Evenly Funded Forecast
Source: Company data, CSFB estimates.
The number of companies with underfunded pension plans in the S&P 500 jumped to240 at the end of 2001, the highest level in the last 10 years. We estimate that as manyas 325 companies could have underfunded plans at the end of 2002. We estimate thatthe 10 companies on the left hand side of Exhibit 13 will experience the most significantdeterioration in the funded status of their pension plan in terms of the percentage of thePBO that is funded and the 10 companies on the right hand side will experience thelargest dollar decline in funded status.
Exhibit 13: Most Significant Deterioration in Funded Status
US$ in millionsLargest Decline in Percent Funded Largest Dollar Decline in Funded Status
Company Ticker% Funded
2002E% Funded
2001Change
Company Ticker$ Over (Under)Funded 2002E
$ Over (Under)Funded 2001 Change
Moodys Corp MCO 139% 193% (54%) General Motors Corp GM ($29,428) ($12,671) ($16,757)
Bank Of New York Co Inc BK 177% 223% (46%) Intl Business Machines Corp IBM (13,265) 686 (13,951)
Sherwin-Williams Co SHW 220% 264% (44%) Ford Motor Co F (14,273) (2,460) (11,813)
FPL Group Inc FPL 149% 188% (39%) Verizon Communications VZ 2,698 12,167 (9,469)
Meadwestvaco Corp MWV 149% 187% (38%) General Electric Co GE 5,562 14,583 (9,021)
Mellon Financial Corp MEL 137% 175% (38%) Boeing Co BA (6,846) 1,117 (7,963)
Cincinnati Financial Corp CINF 105% 139% (34%) Lucent Technologies Inc LU (1,466) 5,689 (7,155)
McGraw-Hill Companies MHP 122% 155% (33%) SBC Communications Inc SBC 998 7,655 (6,657)
National City Corp NCC 116% 148% (33%) Lockheed Martin Corp LMT (4,409) 587 (4,996)
Automatic Data Proc. ADP 90% 123% (33%) Du Pont (E I) De Nemours DD (5,176) (846) (4,330)
Source: Company data, CSFB estimates.
Minimum Pension LiabilityThe smoothing mechanisms in FAS No. 87 prevent the funded status of a definedbenefit pension plan from being reported on the sponsoring company’s balance sheet.However, as the health of a defined benefit pension plan deteriorates, some companies

The Magic of Pension Accounting 27 September 2002
30
might have to adjust their balance sheets to reflect the minimum pension liability. Thatadjustment could result in a charge to shareholders’ equity, depending upon the statusof the pension plan at the end of 2002. Standard & Poor’s is evaluating the potentialimpact that this charge to equity could have on debt and loan covenants as it assessesthe credit-rating implications of the deteriorating health of defined benefit pension plans.
The FASB came up with the concept of the minimum pension liability, establishing afloor on the pension liability reported on the balance sheet. (See Appendix B for moredetail on this adjustment.) To ensure that the balance sheet was not totally misleadingas a result of all the smoothing mechanisms in FAS No 87, that floor is calculated as theexcess of the accumulated benefit obligation (ABO) over the fair value of the planassets. For example, if the ABO is $10 million and the fair value of the plan assets is $3million, the pension liability reported on the balance sheet must be at least $7 million.The difference between the ABO and PBO is that the ABO does not take salary inflationinto account.
Using a few actuarial rules of thumb (see Appendix H for our methodology), we estimatethe ABO at the end of 2002 (in general we reduce the PBO by approximately 25%) foreach company in the S&P 500, then compare it with our estimate of the plan assets toarrive at the minimum pension liability. Taking into account the minimum liabilityadjustments from prior years, prior service cost, any remaining transition obligation, andassuming a 35% tax rate, we arrive at an estimate of the after-tax charge to equity thatcompanies might have to make at the end of 2002. Based on these assumptions, weestimate that 48 companies will have to take a charge to equity over $500 million in2002; the 26 companies in Exhibit 14 might have to record a charge to equity that wouldbe 25% or more of their total equity at the end of 2001.

The Magic of Pension Accounting 27 September 2002
31
Exhibit 14: Estimated 2002 Minimum Pension Liability Charge to EquityUS$ in millions
Company Ticker 2002E Charge to Equity 2001 Equity % of Equity
Maytag Corp MYG $ 93 $ 24 397%
TRW Inc TRW 2,244 2,186 103%
United States Steel Corp X 1,612 2,506 64%
General Motors Corp GM 10,894 19,707 55%
Hercules Inc HPC 383 712 54%
Pactiv Corp PTV 837 1,689 50%
Allegheny Technologies Inc ATI 452 945 48%
Unisys Corp UIS 983 2,113 47%
Xerox Corp XRX 1,034 2,290 45%
Cummins Inc CUM 437 1,025 43%
Navistar International NAV 473 1,127 42%
Kellogg Co K 356 872 41%
Black & Decker Corp BDK 299 751 40%
Ford Motor Co F 3,005 7,786 39%
NCR Corp NCR 738 2,027 36%
Eastman Kodak Co EK 1,039 2,894 36%
Delta Air Lines Inc DAL 1,388 4,024 34%
ITT Industries Inc ITT 474 1,376 34%
Equifax Inc EFX 83 244 34%
Yum Brands Inc YUM 35 104 34%
Intl Business Machines Corp IBM 7,806 23,614 33%
Boeing Co BA 3,351 10,825 31%
Colgate-Palmolive Co CL 255 846 30%
Lockheed Martin Corp LMT 1,850 6,443 29%
Ball Corp BLL 132 504 26%
Raytheon Co RTN 2,795 11,290 25%
Source: Company data, CSFB estimates.
Sensitivity AnalysisWe expect companies to begin announcing that they will be reducing their expectedreturn assumptions for 2003. As the median rate falls from the current 9.2%, the illusoryearnings shield created by the magic of pension accounting should become evident. Ifwe were to take the expected return assumptions down 50 basis points for 2003, whichwe view as a likely scenario, aggregate pension cost would increase by about $5 billion.
We recommend using our model to perform what-if scenarios to gauge the potentialexposure of a company to its defined benefit pension plan. The model is available onour Web site (http://www.csfb.com/equity/presentations/pension_forecast_model.xls),and we leave it in your capable hands to come up with a variety of scenarios. However,we want to take you through one what-if scenario that has been a hot topic for sometime: the impact on earnings of a reduction in the expected rate of return assumption.Specifically, what would happen to pension cost in 2003 if all the companies in the S&P500 were to follow Warren Buffet’s lead and drop their expected return to 6.5%? Wealso look at the impact of taking the expected rate of return down 100 basis points.
Before we get into the application of the model to this question, here is a back-of-the-envelope approach to estimating the impact on earnings of changing the expectedreturn assumption. Simply multiply the change in the assumption by the fair value of the

The Magic of Pension Accounting 27 September 2002
32
pension plan assets. Then, tax effect the answer and that should get you in the ballpark.For example, a 100-basis-point decline in the expected rate of return for a pension planwith $1 billion in plan assets would increase pension cost by approximately $10 million.If we take into account income taxes, assuming a 35% tax rate, earnings would declineby about $6.5 million.
Our base case scenario for 2003 keeps the expected rate of return assumption at eachcompany’s 2001 level. If we drop the expected rate by 100 basis points, and then all theway to 6.5%, the aggregate pension cost for the S&P 500 would increase from $15billion in the base case to $25 billion at down 100 basis points, and to $44 billion at6.5%.
The companies that experience the largest increases in pension expense or decline inpension income from changing the expected rate of return would be the companies withthe largest pension plans. We calculate this impact on a per share basis to get a betteridea of the relative impact for each company. We assume a 35% tax rate for allcompanies and keep the share counts at 2001 levels.
Exhibit 15: Companies Experiencing Highest Increase in 2003E Pension Cost Per Share
from Drop in Expected Rate of ReturnPension (Income)/Expense per share
Company Ticker2003E—Base
Case2003E—Down 100
Basis Points2003E—Assuming
6.5%
Northrop Grumman Corp NOC $ (2.52) $ (1.34) $ 1.03
General Motors Corp GM 5.83 6.51 7.83
United States Steel Corp X (0.57) 0.05 0.91
TRW Inc TRW 0.04 0.47 1.10
Delta Air Lines Inc DAL 3.75 4.12 5.04
Lockheed Martin Corp LMT 0.02 0.35 1.01
Cummins Inc CUM 0.74 1.05 1.82
Boeing Co BA (0.18) 0.11 0.61
NCR Corp NCR (0.36) (0.08) 0.54
Navistar International NAV 1.24 1.49 2.08
Source: Company data, CSFB estimates.

The Magic of Pension Accounting 27 September 2002
33
Funding RequirementsThe funded status of a defined benefit pension plan is the key driver in determiningwhether or not a company will have to make a contribution to its pension plan. That iswhy the deterioration in the funded status has sparked a number of concerns; leadingthe list are potential real cash flow consequences, including:
• Will some companies have difficulty meeting their funding requirements, in a worst-case scenario, forcing some into bankruptcy?
• To meet funding requirements, will companies have to take the cash they have setaside to grow the business, buy back stock, pay down debt or pay dividends and pourit into the pension plan? How would this impact valuation?
• At what point will companies have to increase the contributions that they make to theirpension plans?
Investors want to know how much cash companies will have to fork over to their pensionplans in upcoming years. The funded status will determine the contribution to thepension plan. As we have the funded status in the pension footnote, it should be easy tocalculate the required contribution, but it is not. If it were, we would not be issuing thisreport, you would not be reading about this topic, and many actuaries would be out of ajob.
Analyzing the Funding StatusCompanies do not have to meet their funding requirements with cash contributions; theycan fund with other assets (common stock, debt investments, gold, etc.) as long as theassets are considered prudent investments. For example, a company can contribute itsown stock to the pension plan as long as the stock does not account for more than 10%of the total pension plan assets.
Companies are required by law to fund their defined benefit pension plans and paypremiums to the Pension Benefit Guaranty Corporation (PBGC). The fundingrequirements for U.S. pension plans are laid out in Section 412 of the tax code. If youthink that pension accounting is complicated, try reading Section 412 of the tax code.Determining the funded status under Section 412 involves an entirely separate set ofcalculations and assumptions, different from those used for financial reporting.Therefore, the funded status for funding purposes may differ dramatically from thefunded status calculated for accounting. The information needed to perform thosecalculations with certainty is not in the pension footnote. Exhibit 16 compares a few ofthe key differences in funded status as calculated for accounting purposes with thoseused for funding purposes.

The Magic of Pension Accounting 27 September 2002
34
Exhibit 16: Key Differences in Funded StatusAccounting Minimum Additional PBGC Variable
FAS No. 87 Contribution Contribution Premium
Plan Assets Fair Value Fair Value orCalculated Value
Fair Value orCalculated Value
Fair Value orCalculated Value
Pension Obligation Projected BenefitObligation (PBO)
Projected BenefitObligation (PBO)
Accumulated BenefitObligation (ABO)
Vested BenefitObligation (VBO)
Discount Rate High GradeCorporate Bonds -
Moody's Aa
Expected Return onAssets
30-Year U.S. LongBond – (4-year
weighted average)
30 Year U.S. LongBond (yield set
monthly by PBGC)Discount Rate Factor 105% - 120% 85% - 100%
Source: Company data, CSFB estimates.
One example of how the funded status can differ is that different discount rates are usedto compute the various obligations. For example, the yield on high-grade corporatebonds is used to determine the PBO for accounting purposes, compared with theadditional funding requirements where the 4-year weighted average 30-year Treasuryyield is used; that amount is then multiplied by a factor. For the next two years, thefactor is 120%; in 2004, it will most likely revert back to 105%. Another example: Theobligation is calculated differently for each funding requirement; for the minimumcontribution, it is a PBO; for the additional contribution, it is an accumulated benefitobligation (ABO); and to compute the PBGC variable premium, it is a vested benefitobligation (VBO).
The Funding Four-StepTo determine the annual pension funding requirements, each company will walk througha four-step process:
Step 1—Minimum funding requirement. Companies with overfunded pension plans donot have to make a contribution. Companies with underfunded pension plans contributethe normal cost (think compensation cost) plus the unfunded obligation amortized overfive to 30 years.
Step 2—Additional funding requirement. Companies with pension plans that are lessthan 90% funded must make an additional contribution to the plan. The unfundedliability has to be made up over a shorter period, between 3 to 5 years. The greater ofthe additional contribution or the minimum from Step 1 is the company’s requiredcontribution for the year. Congress is currently looking at potential changes in theadditional funding requirement.
Step 3—PBGC variable premium. The fixed PBGC premium is $19 per employee. ThePBGC variable premium is not paid if the company did not have to make a contributionin Steps 1 or 2. If a contribution is required, the variable premium is $9 per $1,000underfunded. Companies will often contribute more than the contribution required inSteps 1 and 2 to avoid having to pay the PBGC variable premium.
Step 4—Maximum contribution. The maximum contribution requirement was put inplace to limit the tax break that companies get from funding their pension plans.Companies can deduct allowable contributions that they make to their pension plans asan ordinary business expense on their tax returns, reducing taxable income and the taxbill. Companies with overfunded pension plans can’t deduct contributions to the plans.The maximum contribution for an underfunded pension plan is the amount that will

The Magic of Pension Accounting 27 September 2002
35
make the plan fully funded. Any contributions that exceed the maximum get hit with a10% excise tax.
Why Is 90% Important?The 90% threshold determines whether or not a company will have to make anadditional contribution to the pension plan. The additional contribution, if required, forcesthe company to make up the amount of the obligation that is unfunded over a shortertime frame, generally 3 to 5 years. Therefore, it can dramatically increase the requiredcontribution. As with most rules, there is an exception. Section 412 provides a graceperiod: If a plan is over 80% funded and was more than 90% funded for the past twoyears, then no additional contribution is required.
Our S&P 500 ForecastTo provide investors with an estimate of the potential contributions to the pension plan,we take the information in the pension footnote and transform it into the funded statusaccording to the funding requirements, using a few rules of thumb and some back of theenvelope calculations in our pension-forecasting model. (For more on the model andhow it works see Appendix H.)
We expect our result will differ from the company’s actual funding requirement, due to anumber of simplifying assumptions that we make. For example, we use the fair value ofpension plan assets; the funding requirements allow for a variety of different methods tocalculate asset values. We start with a projected benefit obligation that uses a differentdiscount rate and adjust to the various pension obligations for funding purposes. Wealso do not factor in the credit balance that the company may have accumulated tooffset any contribution requirements. The largest discrepancy will result from ourcombining both U.S. and non-U.S. plans to determine the contributions. The contributionrequirements that we described earlier only apply to U.S. plans. The fundingrequirements overseas can be very different. We also include nonqualified plans thatwould not be subject to these rules.
With all those caveats you may be asking yourself, Why should I use this model? Goodquestion. We recommend using our model as a screen: The estimated required cashcontribution is an educated guess; it gets you in the ballpark. For example, if the modelindicates a large potential cash outflow for a company relative to the cash that itsbusiness is generating, you may want to do some more digging, including getting yourhands on the publicly available form 5500 filing, which is the annual report for thepension plan filed with the IRS. (You can find these filings at www.freeerisa.com.)
We estimate that the contributions to the pension plan for the S&P 500 will rise from $15billion in 2001 to $29 billion in 2003. We estimate that the required contribution for 38companies in 2003 will exceed the actual 2001 contribution by more than $100 million.We estimate that the 10 companies in Exhibit 17 will have the largest increases overtheir 2001 contributions to their pension plans.

The Magic of Pension Accounting 27 September 2002
36
Exhibit 17: Largest Estimated Increase over 2001 Contributions to Pension PlansUS$ in millions
Company Ticker2001
Contribution2003E
Contribution $ Increase
General Motors Corp GM $191 $5,106 $4,915
Exxon Mobil Corp XOM 299 1,643 1,344
Delta Air Lines Inc DAL 50 947 897
United Technologies Corp UTX 51 875 824
Raytheon Co RTN 47 645 598
AMR Corp AMR 121 703 582
Delphi Corp DPH - 514 514
ChevronTexaco Corp CVX 28 537 509
Exelon Corp EXC 38 459 421
Pharmacia Corp PHA 76 443 367
Source: Company data, CSFB estimates.
Companies contribute to their pension plans to meet ERISA requirements and to avoidhaving to pay the PBGC variable premiums. We forecast those premiums for eachcompany in the S&P 500. We estimate that the PBGC variable premium could exceed$20 million in 2003 for the 7 companies in Exhibit 18. This may provide an incentive forthese companies to fund their pension plans, raising the level of funding to avoid payingthe PBGC variable premiums. Instead of giving the money to the PBGC, never to see itagain, we think the companies would rather keep the cash in house and drop it into thepension plan.
Exhibit 18: PBGC Variable Premiums Exceeding $20 million in 2003EUS$ in millions
Company Ticker2003E
Contribution2003E
PBGC Variable Premium
General Motors Corp GM $5,106 $190
Exxon Mobil Corp XOM 1,643 55
Delta Air Lines Inc DAL 947 32
United Technologies Corp UTX 875 31
Raytheon Co RTN 645 24
AMR Corp AMR 703 24
Delphi Corp DPH 514 21
Source: Company data, CSFB estimates.
In the past, some companies faced an interesting capital allocation decision: fund thepension plan or invest in the business. To the extent that a company could fund itspension plan, it would get a tax deduction on its tax return, reducing its tax bill. And itwould earn a guaranteed return in the income statement; the amount contributed to theplan would garner the expected return on plan assets. A company contributing $100million to a defined benefit pension plan at the beginning of the year, with an expectedreturn of 10%, would automatically increase its pretax income by $10 million. Nowcompare that with investing in the business, where the return is unknown and in manycases less than the expected return on plan assets. The deterioration in the fundedstatus of defined benefit pension plans may leave many companies with no choice; theymay be required to fund their pension plans.

The Magic of Pension Accounting 27 September 2002
37
Pension Accounting Should Be SimplePension accounting is where the worlds of the actuary and the accountant collide. Mostinvestors head for the hills when the topic is mentioned (or fall fast asleep). Theaccounting is extremely complicated and confusing, leaving the avid reader of pensionfootnotes with a headache. The accounting for a defined benefit pension plan, alongwith any analysis of the results, would be much less painful if the financial statementssimply reflected the economic reality of the pension plan. Instead we have FAS No. 87,“Employer’s Accounting for Pensions,” which was designed to protect the balance sheetand minimize earnings volatility while ignoring certain economic aspects of the pensioncommitment.
However, once past the intricate calculations, there are only two components to adefined benefit pension plan: plan assets and an obligation. Think of a defined benefitpension plan as an investment subsidiary with a collection of assets (equity, fixedincome, real estate, private equity, venture capital, etc.) and an obligation (the promiseto pay retirement benefits to the employees in the future, similar to a series of zerocoupon bonds). The most relevant information about this investment subsidiary is thefair value of the assets (the market value of the stocks, bonds, real estate, and otherassets that are in the portfolio) and the fair value (present value) of the projected benefitobligation (PBO). We have reasonable estimates of each. If the assets are greater thanthe obligation, the pension plan is overfunded. If the obligation is larger than the assets,then the pension plan is underfunded.
Exhibit 19: The Funded Status of Defined Benefit Pension Plans
Pension Plan Assets > Projected Benefit Obligation = Overfunded
Pension Plan Assets < Projected Benefit Obligation = Underfunded
From an analytical perspective, and if we were able to rewrite the accounting rules, wewould first report the pension plan assets as an asset on the balance sheet and theprojected benefit obligation as a liability. We would then report the changes in planassets (including actual returns) and the projected benefit obligation in the appropriateplace on the income statement. In “Three Steps to Strip Out Accounting Magic,” onpage 40, we lay out the simple, three-step framework we use to identify the underlyingeconomics of a defined benefit plan.
Pension Accounting HistoryTo put all of the twists and turns of pension accounting into perspective, we have to goback to 1974. The Employee Retirement Income Security Act (ERISA) became the lawof the land on Labor Day, September 2, 1974, and all of a sudden companies werelegally required to fund their defined benefit pension plans. Songs like Kung Fu Fightingand My Coo Ca Choo topped the charts, the Oakland A’s won their third consecutiveworld series, and the FASB added pension accounting to its active agenda. Elevenyears later, the FASB issued FAS No. 87.

The Magic of Pension Accounting 27 September 2002
38
In 1978, only 25% of large defined benefit pension plans were fully funded; over halfwere less than 75% funded, according to the Watson Wyatt 1983 Survey of ActuarialAssumptions and Funding. These low levels of funding provide the backdrop for whyFAS No. 87 became the ultimate compromise. Throughout the standard, the FASBmaintained that an employer with an underfunded pension plan has a liability, while onewith an overfunded plan has an asset, stating that the most relevant and reliableinformation about that liability or asset is based on the fair value of the plan assets andthe benefit obligation. Corporate America thought otherwise, leading the FASB toconclude that the recognition of those amounts in the financial statements would be toogreat a change from past practice. Each one of the compromises that we describebelow moved the economic reality of the pension plan further and farther away from thefinancial statements.
Compromise #1—Transition Asset or Liability
Initially, the FASB approached the project thinking that an unfunded pension obligationis a liability and an overfunded obligation is an asset; assets and liabilities should bereported on the balance sheet. Corporate America did not like that idea, as it was notfunding its pension plan until ERISA came into effect. The amount underfunded wouldhave been enormous for some companies; reporting the unfunded obligation wouldhave wiped out shareholders’ equity for many companies. The FASB came up with itsfirst compromise: Instead of reporting the initial obligation or asset, take it off thebalance sheet and amortize it over time as income if an asset, or as expense if anobligation.
Compromise #2—Prior Service Cost
Next, the FASB determined that if a company were to provide prior service benefits toits employees, the PBO would increase and that should be reflected in the balancesheet as an increased liability and as a loss in earnings. Corporate America did not likethat idea either and threatened that it would not provide many more prior servicebenefits to its employees if they entailed such a drastic impact on earnings and thebalance sheet. The FASB arrived at its next compromise: Take the prior service cost offbalance sheet and amortize it over time.
Compromise #3—Unrecognized Gains and Losses
The FASB thought that the fair value of the plan assets and the PBO were relevant;therefore, changes in both should be part of earnings. Corporate America said no way,as it has no control over the value of the plan assets or obligations and marking those tomarket through the income statement would result in too much earnings volatility. “Howwill I be able to explain that volatility to the shareholders?”, cried the companies. TheFASB arrived at its most significant compromise: Instead of reporting actual gains andlosses on the plan assets, report the expected return on plan assets. Any differencebetween the actual return and expected return and gains and losses in the PBO due tochanges in assumption can be pushed off balance sheet and amortized only when theyget huge. Corporate America then asked, “How do you define huge?” The response:When the unrecognized gain or loss grows larger than 10% of the plan assets or PBO,whichever is greater.

The Magic of Pension Accounting 27 September 2002
39
The FASB realized that after deferring all of this stuff, the balance sheet might be a bitmisleading. The legal liability that arose under ERISA may have been wiped off thebalance sheet with all the smoothing mechanisms. To ensure that the balance sheet isnot totally misleading, the FASB came up with the concept of the minimum pensionliability, establishing a floor on the pension liability that is reported in the balance sheet.For more on this adjustment, see Appendix B.
The delayed recognition allowed by FAS No. 87 excludes the most current and relevantinformation from the balance sheet. That information, however, is included in thefootnotes. The FASB believed that footnote disclosure would significantly assist users inunderstanding the economic events that occurred. Remember, good disclosure nevermakes up for bad accounting. The FASB believed it was taking a significant step, butnot the final step, in the evolution of good pension accounting.
The FASB initially thought that it might be a good idea if companies reported the fundedstatus on the balance sheet, as we propose in our methodology. Unacceptable volatilityand too great a change from past practice kept it from instituting the accounting that itbelieved in. The FASB identified two major problems with pension accounting going intothe project: Annual pension costs were inappropriately measured, and significant assetsand liabilities were omitted from the balance sheet. One could argue that neitherproblem was fixed by FAS No. 87.
We are mired in a crisis in confidence. Investors demand more transparency in financialreporting to better determine the real risks and rewards that flow from the companiesthat they invest in. As equity markets decline and interest rates fall, concern is rising thatthe smoothing mechanisms of FAS No. 87, originally designed to reduce reportedearnings volatility, have led to misleading financial statements that paint a rosy pictureas the health of defined benefit pension plans deteriorates. It would not surprise us if theFASB were to take another look at pension accounting, and take that final step towardreflecting what is actually going on with the pension plan in the financial statements.

The Magic of Pension Accounting 27 September 2002
40
Three Steps to Strip Out Accounting MagicTo eliminate pension accounting magic and reflect the underlying economics of adefined benefit pension plan in the financial statements, we treat the pension plan as aninvestment subsidiary and replace the amounts reported under FAS No. 87 with whatwe refer to as the “real” pension asset or liability and the “real” pension expense orincome. We applied our three-step process to each of the 360 companies in the S&P500 with defined benefit pension plans.
Step 1. Put the plan assets on the asset side of the balance sheet and the projectedbenefit obligation on the liability side. (In Appendix G, we present an alternative methodthat places the funded status on the balance sheet by reporting a pension asset if theplan is overfunded and a liability if it is underfunded.)
Step 2. Take the expected return on plan assets and amortization amounts and throwthem out the window. (That’s one way to eliminate the debate surrounding the expectedrates of return.) Replace them with the actual return on plan assets and gains andlosses on the pension obligation. Continue to record interest cost and service cost toarrive at the “real” pension expense or income.
Step 3. Divide pension cost into three buckets: (1) compensation, (2) financing, and (3)investing; only the compensation component (service cost) remains in operatingincome.
Step 1—Report the Pension Plan Assets and Obligationon the Balance SheetThe fair value of the plan assets and the projected benefit obligation for a definedbenefit pension plan are available in the footnotes; however, that is not what companiesreport on the balance sheet. Instead, the amount reported on the balance sheet as aprepaid pension asset or accrued pension liability represents the cumulative differencebetween the contributions made to the pension plan and the pension cost reported todate, adjusted if necessary to reflect the minimum pension liability. Not an especiallyuseful number to investors, or to anyone else for that matter.
One of many areas debated within pension accounting is the presentation of either netor gross amounts in the financial statements. The accounting standard requires a netpresentation for both the pension cost and the asset or liability on the balance sheet. Ifwe view the pension plan as similar to an investment subsidiary, then the plan assetsshould be reported on the balance sheet as assets and the PBO as a liability.
Nowhere else on the balance sheet are assets and liabilities combined and presentedas either a net asset or net liability. When FAS No. 87 was crafted, companies arguedthat presenting the pension plan assets as separate assets and the PBO as a separateliability would distort the balance sheet, as the assets of the pension plan can’t be put touse in the business other than in support of the pension obligation. We ask a simplequestion: Do the pension plan assets and PBO separately meet the definition of assetsand liabilities? The accounting definitions for each follow:
Assets. Probable future economic benefits obtained or controlled by a particular entityas a result of past transactions or events.

The Magic of Pension Accounting 27 September 2002
41
Liabilities. Probable future sacrifices of economic benefits arising from presentobligations of a particular entity to transfer assets or provide services to other entities inthe future as a result of past transactions or events.
The PBO passes the test with flying colors; it is an obligation of the company to providefuture retirement benefits to its employees. The probable future economic benefitprovided by the plan assets is that they can be used to settle the company’s obligationto its retirees. Another benefit, capital that would have been allocated to the pensionplan, can now be put to other uses: reinvestment, dividends, share repurchases, debtpaydown, etc.
Putting the plan assets and the projected benefit obligation on each side of the balancesheet better reflects the company’s exposure to the pension plan. For example, take twoidentical companies with identical balance sheets. Let’s assume that both have definedbenefit pension plans that are fully funded. The only difference between the two is thatthe plan assets and projected benefit obligation for Company A are $1 million and forCompany B they are $10 billion. If only the funded status is reported, both balancesheets will look exactly the same. Clearly, the exposure and leverage to the pensionplan for Company B is significantly greater than for Company A. This extreme exampleshows how a net approach could potentially mislead the user of the financialstatements, masking the true exposure to the pension plan.
Off-Balance-Sheet Pension Assets and LiabilitiesIf the plan assets are assets and the projected benefit obligation is a liability and theyare both not reported on the balance sheet, it sounds like we have off-balance-sheetassets and off-balance-sheet liabilities. We calculate the off-balance-sheet asset as thedifference between what companies currently report on the balance sheet as a prepaidpension asset and the plan assets. The off-balance-sheet liability is the differencebetween the accrued pension liability on the balance sheet and the PBO. We haveincluded some observations regarding the off-balance-sheet pension asset and liabilityfor the companies in the S&P 500.
• We estimate the off-balance-sheet pension liability for the S&P 500 was $992 billionat the end of 2001 and $920 billion for 2000. The off-balance-sheet pension asset forthe S&P 500 was $900 billion and $1,038 billion for 2001 and 2000, respectively.
• The 11 companies in Exhibit 20 had an off-balance-sheet pension asset in excess of$15 billion at the end of 2001.

The Magic of Pension Accounting 27 September 2002
42
Exhibit 20: Off-Balance-Sheet Pension Asset Greater Than $15 BillionUS$ in millions
Company Ticker Pension Plan Assets On-Balance-Sheet Asset Off-Balance-Sheet Asset
General Motors Corp GM $ 73,662 $ 13,758 $ 59,904
Intl Business Machines Corp IBM 61,096 8,404 52,692
Ford Motor Co F 48,754 4,782 43,972
Verizon Communications VZ 48,558 9,846 38,712
General Electric Co GE 45,006 13,740 31,266
Lucent Technologies Inc LU 35,539 5,085 30,454
Boeing Co BA 33,810 6,226 27,584
SBC Communications Inc SBC 32,715 7,337 25,378
Lockheed Martin Corp LMT 20,300 2,101 18,199
Du Pont (E I) De Nemours DD 17,923 1,818 16,105
AT&T Corp T 18,485 3,387 15,098
Source: Company data, CSFB estimates.
• The 10 companies in Exhibit 21 had an off-balance-sheet pension liability in excess of$15 billion at the end of 2001, accounting for over one-third of the total off-balance-sheet pension liability for the S&P 500. All the companies on this list also have an off-balance-sheet pension asset in excess of $15 billion.
Exhibit 21: Off-Balance-Sheet Pension Liability Greater Than $15 BillionUS$ in millions
Company Ticker PBO On-Balance-Sheet Liability Off-Balance-Sheet Liability
General Motors Corp GM $ 86,333 $ 10,822 $ 75,511
Intl Business Machines Corp IBM 60,410 462 59,948
Ford Motor Co F 51,214 4,135 47,079
Verizon Communications VZ 36,391 1,601 34,790
Boeing Co BA 32,693 1,300 31,393
Lucent Technologies Inc LU 29,850 75 29,775
General Electric Co GE 30,423 1,325 29,098
SBC Communications Inc SBC 25,060 0 25,060
Lockheed Martin Corp LMT 19,713 0 19,713
Du Pont (E I) De Nemours DD 18,769 437 18,332
Source: Company data, CSFB estimates.
Adjusting the Balance SheetFor each of the companies in the S&P 500, we removed the prepaid pension asset oraccrued pension liability from the balance sheet. Then we reported the pension planassets as an asset and the PBO as a liability on the balance sheet. To balance thebalance sheet, the other side of each adjustment was reported in shareholders’ equity.(See Appendix E where we walk through these adjustments using Phillip Morris as anexample.) We made these same adjustments to all the companies in the S&P 500 withdefined benefit pension plans, using a 35% tax rate to adjust for deferred taxes.
Many companies have more than one defined benefit pension plan. For example, theymay have a different plan for each overseas subsidiary. Each pension plan is accountedfor separately. However, the information provided in the pension footnote is for all of thecompany’s pension plans combined. (Some companies do provide a breakdown of thedata between domestic and overseas plans.) To simplify our analysis, we treat the

The Magic of Pension Accounting 27 September 2002
43
information in the pension footnote as if it were all one pension plan. The results couldbe very different if we applied our methodology to each individual pension plan.
In the aggregate, placing the pension plan assets on the balance sheet would increasetotal assets for the S&P 500 by 5% and 7%, respectively, for 2001 and 2000; treatingthe PBO as debt would increase aggregate debt for the S&P 500 by 16% and 17%. Thedifference between the increase in assets and the increase in liabilities would reducetotal equity for the S&P 500 by $60 billion or 2% at the end of 2001. Some specificimpacts include:
• Using 2001 data, total assets would increase by over 10% for 152 companies, by over25% for 46 companies, and by over 50% for the 17 companies in Exhibit 22. On anasset basis, some of these companies look like equal part operating company andpension plan.
Exhibit 22: Over 50% Increase in Total Assets by Adding Pension Plan AssetsUS$ in millions
Company Ticker Total Assets Adjustment Adjusted Assets % Change
Lucent Technologies Inc LU $ 33,664 $ 30,454 $ 64,118 90%
McDermott Intl Inc MDR 2,104 1,703 3,807 81%
United States Steel Corp X 8,337 6,376 14,713 76%
Unisys Corp UIS 5,769 4,278 10,047 74%
ITT Industries Inc ITT 4,508 3,292 7,800 73%
Pactiv Corp PTV 4,060 2,792 6,852 69%
Lockheed Martin Corp LMT 27,654 18,729 46,383 68%
Intl Business Machines Corp IBM 88,313 55,232 143,545 63%
Rockwell Collins Inc COL 2,628 1,628 4,256 62%
Boeing Co BA 48,343 28,917 77,260 60%
NCR Corp NCR 4,855 2,882 7,737 59%
Allegheny Technologies Inc ATI 2,643 1,520 4,163 57%
Eastman Kodak Co EK 13,362 7,330 20,692 55%
Avaya Inc AV 4,648 2,541 7,189 55%
3m Co MMM 14,606 7,840 22,446 54%
Northrop Grumman Corp NOC 20,886 11,193 32,079 54%
General Dynamics Corp GD 11,069 5,604 16,673 51%
Source: Company data, CSFB estimates.
• If the PBO is considered the equivalent of debt, debt increases by 10% or more for279 companies. Debt would more than double for 71 companies, and more than triplefor 36 companies, including the 16 companies in Exhibit 23 that had over $1 billion indebt outstanding.

The Magic of Pension Accounting 27 September 2002
44
Exhibit 23: Over 200% Increase in Total Debt by Adding PBO (>$1 Billion of Debt)US$ in millions
Company Ticker Total Debt Adjustment Adjusted Debt % Change
Lucent Technologies Inc LU $ 4,438 $ 29,850 $ 34,288 673%
United States Steel Corp X 1,466 7,358 8,824 502%
Fedex Corp FDX 1,806 6,227 8,033 345%
3m Co MMM 2,893 8,998 11,891 311%
Pactiv Corp PTV 1,218 3,390 4,608 278%
Du Pont (E I) De Nemours DD 6,814 18,769 25,583 275%
Boeing Co BA 12,265 32,693 44,958 267%
General Dynamics Corp GD 1,935 5,162 7,097 267%
Lockheed Martin Corp LMT 7,511 19,713 27,224 262%
Delphi Corp DPH 3,353 8,444 11,797 252%
United Technologies Corp UTX 4,959 12,354 17,313 249%
Eastman Kodak Co EK 3,200 7,439 10,639 232%
Northrop Grumman Corp NOC 5,491 12,404 17,895 226%
Intl Business Machines Corp IBM 27,151 60,410 87,561 222%
Aetna Inc AET 1,701 3,581 5,282 210%
Honeywell International Inc HON 5,270 10,952 16,222 208%
Source: Company data, CSFB estimates.
• If the funded status were reported on the balance sheet, equity would increase by 5%or more for 10 companies. Equity would decline by 5% or more for 83 companies,including the 15 companies in Exhibit 24 where equity would drop by 25% or more.
Exhibit 24: Reporting Funded Status Reduces Equity by 25% or MoreUS$ in millions
Company Ticker Total Equity Reduction Adjusted Equity % Change
Maytag Corp MYG $ 24 $ (132) $ (109) (561%)
Dow Jones & Co Inc DJ 42 (115) (74) (276%)
TRW Inc TRW 2,186 (1,427) 759 (65%)
General Motors Corp GM 19,707 (10,145) 9,562 (51%)
United States Steel Corp X 2,506 (950) 1,556 (38%)
Hercules Inc HPC 712 (265) 447 (37%)
Pactiv Corp PTV 1,689 (562) 1,127 (33%)
Yum Brands Inc YUM 104 (34) 70 (33%)
Delphi Corp DPH 2,312 (746) 1,566 (32%)
Delta Air Lines Inc DAL 4,024 (1,257) 2,767 (31%)
Black & Decker Corp BDK 751 (219) 532 (29%)
Allegheny Technologies Inc ATI 945 (261) 684 (28%)
Ford Motor Co F 7,786 (2,020) 5,766 (26%)
Kellogg Co K 872 (225) 647 (26%)
Unisys Corp UIS 2,113 (528) 1,585 (25%)
Source: Company data, CSFB estimates.
• Note that equity would fall by more than half for General Motors and TRW and wouldbe wiped out for Maytag and Dow Jones.
Reported Debt-to-Equity Versus Adjusted Debt-to-Equity Ratios
• The aggregate debt-to-equity ratio for the companies in the S&P 500 was 212% at theend of 2001 and 207% at the close of 2000. Calculating an adjusted debt-to-equity

The Magic of Pension Accounting 27 September 2002
45
ratio after factoring in the projected benefit obligation and the funded status of thepension plan would take the ratio up to 251% for 2001 and 236% for 2000.
• The debt-to-equity ratio would increase by over 1,000 basis points for 276 companies.We isolate the 12 companies in Exhibit 25 that appear to have little leverage on areported basis, with reported debt-to-equity ratios that are 50% or less. After adjustingthe balance sheet to reflect the economics of their pension plans, their debt-to-equityratios climb to over 100%.
Exhibit 25: Low Debt-to-Equity Ratio, Climbs Over 100%US$ in millions
Company Ticker Debt-to-Equity Ratio Adj. Debt-to-Equity Ratio Difference (bps)
Unisys Corp UIS 39% 356% 31,687
McDermott Intl Inc MDR 40% 304% 26,349
Lucent Technologies Inc LU 35% 258% 22,332
NCR Corp NCR 7% 231% 22,385
3m Co MMM 48% 220% 17,263
Rockwell Collins Inc COL 18% 200% 18,196
Du Pont (E I) De Nemours DD 47% 197% 14,958
General Dynamics Corp GD 43% 147% 10,465
Fedex Corp FDX 28% 135% 10,778
Lilly (Eli) & Co LLY 48% 110% 6,225
United Parcel Service UPS 50% 107% 5,691
Crane Co CR 47% 102% 5,486
Source: Company data, CSFB estimates.
Step 2—Calculate “Real” Pension Expense or Income:Show Me the VolatilityThe values of the pension plan assets and the projected benefit obligation are bothvolatile; that volatility is smoothed over by FAS No. 87. After extensive lobbying byCorporate America, arguing that investors could not handle the volatility in earnings,FAS No. 87 wrote the book on smoothing. Actual gains and losses on both the pensionplan assets and the projected benefit obligation are smoothed over long periods of time,under the premise that the pension plan is a long-term obligation, which it is.
Volatility is not necessarily a bad thing, unless it’s hidden. Pension accounting removesthe volatility in the pension plan from the financial statements, distorting both thebalance sheet and the income statement. The volatility that is inherent in the pensionplan is left for investors to discover when they read the pension footnotes. This makesthe process of understanding the economic status of the pension plan and thecompany’s exposure to the plan that much more difficult. Volatility is a fact of doingbusiness; financial statements that don’t reflect that volatility are misleading.
Investors, market pundits, accountants, and Corporate America are all obsessed withearnings and have strived to make earnings the ultimate measure of performance;clearly businesses are too complicated for that and so is the accounting. In particular,some assets and liabilities are reported on the balance sheet at fair value, while thechanges in fair value are flowing through the income statement into earnings. To take amark-to-market result and place a multiple on it makes little sense, since you know thefair value of the asset or liability, it is on the balance sheet. Instead its valuation should

The Magic of Pension Accounting 27 September 2002
46
be taken into account separately in a valuation analysis. Then we should evaluate theassumptions that management used to validate the valuation. If we want to isolate thevalue of the pension plan, that value is best represented by the funded status.
Expected ReturnsThe actual return on pension plan assets is not recognized in accounting for pensioncost; instead, it is replaced by the expected return on plan assets. The expected returnon plan assets is calculated by multiplying the company’s expected rate of returnassumption by something called the market-related value of plan assets. The market-related value can be either the fair value of plan assets or a calculated value of planassets. (A five-year moving average of the fair value of the plan assets would be thebest analogy.)
Using the expected return as opposed to the actual return is the equivalent of replacingrevenue on the income statement with budgeted revenue. In other words, “We only sold50 units this quarter; however, we budgeted for 100, so let’s recognize revenue as if wesold 100 units.” The difference between the actual return on plan assets and theexpected return, which we like to refer to as the “unexpected return” is moved offbalance sheet, along with gains and losses on the projected benefit obligation, wherethey are accumulated until they get so big they have to be recognized. (See Appendix Bfor further discussion on the amortization of unrecognized gains and losses.) We wouldsimply report the actual return on the income statement.
Unexpected ReturnsThe net actual loss on defined benefit pension plan assets for the S&P 500 was $90billion during 2001; 313 companies experienced an actual loss on plan assets and only33 companies had a gain. However, through the magic of pension accounting, S&P 500companies collectively recognized $104 billion of income during 2001 in the form of theexpected return on plan assets. In other words, the companies expected to see theirpension plan assets increase by $104 billion. Instead, they actually declined by $90billion, creating an unexpected loss of $194 billion. In 2000, the net actual gain on planassets was $57 billion (91 companies had a loss and 254 had a gain); however, theexpected return was $99 billion, resulting in an unexpected loss of $42 billion. 1999produced an unexpected gain of $84 billion based on an actual return of $171 billionversus an $87 billion expected return. Exhibit 26 compares the aggregate actual andexpected returns for the S&P 500.

The Magic of Pension Accounting 27 September 2002
47
Exhibit 26: Actual Versus Expected Return Dollar AmountsUS$ in billions
$171
$57
($90)
$87 $99 $105$84
($42)
($194)($200)
($150)
($100)
($50)
$0
$50
$100
$150
$200
1999 2000 2001R
etu
rnA
mo
un
t
Actual Return Expected Return Unexpected Gain/(Loss)
Source: Company data, CSFB estimates.
• Three hundred and thirty-nine companies had an unexpected loss in 2001. In otherwords, their expected return on plan assets was greater than their actual return onplan assets. The unexpected loss was over $500 million for 78 companies, and over$1 billion for 36 companies. The eight companies in Exhibit 27 had an unexpectedloss in excess of $5 billion during 2001. Only General Motors had an unexpected lossof over $5 billion in 2000.
Exhibit 27: Unexpected Losses of Over $5 billion in 2001US$ in millions
Company TickerActual
ReturnsExpected
ReturnsUnexpectedGain/(Loss)
ActualReturns
ExpectedReturns
UnexpectedGain/(Loss)
2001 2001 2001 2000 2000 2000
General Motors Corp GM $(4,835) $8,126 $(12,961) $1,455 $8,244 $(6,789)
Boeing Co BA (7,150) 3,452 (10,602) 6,022 3,117 2,905
Intl Business Machines Corp IBM (3,964) 6,264 (10,228) 1,199 5,944 (4,745)
Lucent Technologies Inc LU (6,830) 3,373 (10,203) 9,791 3,229 6,562
Verizon Communications VZ (3,063) 4,811 (7,874) 1,294 4,686 (3,392)
Ford Motor Co F (2,489) 4,881 (7,370) 1,212 4,443 (3,231)
General Electric Co GE (2,876) 4,327 (7,203) 1,287 3,754 (2,467)
SBC Communications Inc SBC (2,798) 3,515 (6,313) 95 3,149 (3,054)
Source: Company data, CSFB estimates.
Only the four companies in Exhibit 28 reported unexpected gains during 2001,compared with 113 companies in 2000 and 277 companies in 1999.

The Magic of Pension Accounting 27 September 2002
48
Exhibit 28: Unexpected Gains in 2001US$ in millions
Company TickerActual
ReturnsExpected
ReturnsUnexpectedGain/(Loss)
ActualReturns
ExpectedReturns
UnexpectedGain/(Loss)
2001 2001 2001 2000 2000 2000
Merrill Lynch & Co MER $ 188 $ 157 $ 31 $ 247 $ 150 $ 97
Loews Corp LTR 214 195 19 310 172 138
SLM Corp SLM 22 16 6 24 14 10
Plum Creek Timber Co Inc PCL 4 1 3 0 6 (6)
Source: Company data, CSFB estimates.
Calculating “Real” Pension CostTo calculate “real” pension cost, we replace the reported pension results with whatactually happened: the actual changes in the pension plan assets and PBO. We start byremoving the expected return on plan assets and amortization amounts from the incomestatement and replace them with the actual return on plan assets and the gains andlosses on the pension obligation. We continue to record interest cost and service cost toarrive at “real” pension cost. (For more on these components, see Step 3.) Exhibit 29 isa side-by-side comparison of the FAS No. 87 pension accounting cost and our “real”pension cost using Verizon as an example. (See Appendix F, where we walk throughthe adjustments in more detail.)
Exhibit 29: Side-by-Side Comparison, Pension Accounting Cost Versus “Real” Pension
Cost—VerizonUS$ in millions
Pension "Real" Pension
Footnote Expense/(Income)
2001 2001E
Service Cost $ 665 Service Cost $ 665
Interest Cost 2,490 Interest Cost 2,490
Expected Return on Plan Assets (4,811) Actual (Gain)/Loss on Plan Assets 3,063
Amortization of Transition Asset (112) Actuarial (Gain)/Loss on PBO 1,888
Amortization of Prior Service Cost (44)
Actuarial gain, net (878)
Net Pension Expense / (Income) $ (2,690) Net Pension Expense / (Income) $ 8,106
Source: Company data, CSFB estimates.
Applying this methodology to the companies in the S&P 500 would have cut aggregateearnings (net income from continuing operations) by approximately 69% for 2001 and10% in 2000. The combination of declining equity markets and low interest ratescaptured by our adjustments would have forced the earnings for the 14 industry groupsin Exhibit 30 to drop by at least 50% in 2001. Note the first nine industries where netearnings for the industry would become a net loss. Application of our methodology in1999 would have increased aggregate earnings by roughly 26%. In contrast to 2001,only two industry groups, Airlines and Electrical Equipment, would have reported lowerearnings in 1999 as a result of applying our methodology.

The Magic of Pension Accounting 27 September 2002
49
Exhibit 30: Reporting What Happened to the Pension Plan Cuts Net Income by Over 50% in
2001US$ in millions
Industry Reported Net Income Adjusted Net Income Difference (%)
Diversified Telecommunication Services $ 801 $ (18,078) (2,358%)
Metals & Mining 630 (1,448) (330%)
Aerospace & Defense 6,435 (13,892) (316%)
Leisure Equipment & Products 532 (605) (214%)
Construction & Engineering 107 (118) (210%)
Containers & Packaging 474 (511) (208%)
Machinery 2,937 (1,608) (155%)
Chemicals 5,317 (185) (103%
Gas Utilities 1,539 (7) (100%)
Computers & Peripherals 9,430 481 (95%)
IT Consulting & Services 1,927 542 (72%)
Air Freight & Logistics 3,169 965 (70%)
Household Durables 2,166 1,004 (54%)
Insurance 11,165 5,558 (50%)
Source: Company data, CSFB estimates.
• Earnings would decline by 50% or more for 82 companies. Net income would becomea net loss for 41 companies, including the 10 companies in Exhibit 31 where thedecline in net income is more than $1 billion in 2001.
Exhibit 31: Net Income Swings to Net Loss—Over $1 Billion Decline in 2001US$ in millions
Company Ticker Reported Net Income Adjusted Net Loss Dollar Decline
Boeing Co BA $ 2,826 $ (5,891) $ (8,717)
General Motors Corp GM 601 (7,064) (7,665)
Verizon Communications VZ 590 (5,880) (6,470)
Raytheon Co RTN 5 (3,009) (3,014)
Lockheed Martin Corp LMT 79 (2,501) (2,580)
United Technologies Corp UTX 1,938 (103) (2,041)
Northrop Grumman Corp NOC 427 (1,233) (1,660)
Caterpillar Inc CAT 805 (298) (1,103)
TRW Inc TRW 68 (993) (1,061)
Eastman Kodak Co EK 76 (926) (1,002)
Source: Company data, CSFB estimates.
• Thirty companies would see earnings decline by over $1 billion, including the sevencompanies in Exhibit 32 where earnings drop more than $5 billion in 2001.

The Magic of Pension Accounting 27 September 2002
50
Exhibit 32: Biggest Drop in Net Income—Over $5 Billion in 2001US$ in millions
Company Ticker Reported Net Income Adjusted Net Loss Dollar Decline
Boeing Co BA $ 2,826 $ (5,891) $ (8,717)
Intl Business Machines Corp IBM 7,723 19 (7,704)
General Motors Corp GM 601 (7,064) (7,665)
Verizon Communications VZ 590 (5,880) (6,470)
Lucent Technologies Inc LU (14,170) (20,290) (6,120)
General Electric Co GE 14,128 8,402 (5,726)
SBC Communications Inc SBC 7,260 1,958 (5,302)
Source: Company data, CSFB estimates.
• Earnings would not be affected for 140 companies and would actually increase for 12companies in 2001.
Reported Return on Equity Versus Adjusted Return on Equity
We extend our analysis to return on equity (ROE), comparing ROE using reported netincome and equity balances to an adjusted ROE using the adjusted net income andadjusted equity if the pension plan is properly factored in. In the aggregate, for 2001, wecalculate an adjusted ROE of 2% for the S&P 500 as compared with the ROE of 8%based on reported results.
• A positive ROE swings to a negative or zero ROE for 40 companies, including thecompanies in Exhibit 33 that had the largest basis-point declines in ROE.
Exhibit 33: Over 3,000-Basis-Point Decline in ROE Attributable to AdjustmentsUS$ in millions
Company Ticker Reported ROE Adjusted ROE Change (bps)
Dow Jones & Co Inc DJ 98% (912%) (100,987)
Maytag Corp MYG 137% (540%) (67,665)
Boeing Co BA 26% (46%) (7,228)
TRW Inc TRW 3% (66%) (6,917)
General Motors Corp GM 2% (52%) (5,411)
Pactiv Corp PTV 10% (37%) (4,718)
Lockheed Martin Corp LMT 1% (35%) (3,640)
Intl Business Machines Corp IBM 35% 0% (3,482)
NCR Corp NCR 12% (23%) (3,440)
Black & Decker Corp BDK 15% (17%) (3,226)
ITT Industries Inc ITT 17% (14%) (3,114)
Source: Company data, CSFB estimates.
• ROE would either increase or stay the same for 158 companies.
Show Me the VolatilityThey say a picture is worth a thousand words . . . Exhibit 34 displays the aggregate“real” pension cost for the S&P 500 from 1999 through our 2004 estimate as the dottedline. Now contrast that with the nice, smooth aggregate reported pension accountingcost for the same period.

The Magic of Pension Accounting 27 September 2002
51
Exhibit 34: Pension Accounting Cost Versus “Real” Pension CostUS$ in billions
($300)
($200)
($100)
$0
$100
1999A 2000A 2001A 2002E 2003E 2004E
Pen
sio
n(E
xpen
se)/
Inco
me Forecast
Real Pension Cost
Pension Accounting Cost
($300)
($200)
($100)
$0
$100
1999A 2000A 2001A 2002E 2003E 2004E
Pen
sio
n(E
xpen
se)/
Inco
me Forecast
Real Pension Cost
Pension Accounting Cost
Source: Company data, CSFB estimates.
Step 3—Divide Pension Expense/Income into ThreeBucketsNow that we have the real pension assets and liabilities on the balance sheet and theproper amounts reported in the income statement, we separate the pension expense orincome into three buckets: compensation, financing, and investing; only thecompensation component remains in operating income. We do this to help evaluate andvalue the different pieces of the business, maintaining the operating business separatefrom the financing and investing activity. Currently, companies report net pensionincome or expense wherever they report labor cost in the income statement. Most likely,it is being reported in cost of goods sold or selling, general and administrative; it couldbe part of research and development or any other line in operating income that includeslabor costs. The total pension cost is disclosed in the footnotes; however, its locationamong the various line items on the income statement is a mystery.
Pension Cost . . . Everything but the Kitchen SinkNet pension cost is currently made up of four components: service cost, interest cost,expected return on plan assets, and the amortization of this, that, and the other thing.Under our methodology, “real” pension cost is also made up of four components:service cost, interest cost, actual return on plan assets, and the actuarial gain or loss onthe PBO. We can divide this cost among three buckets—operating, investing, andfinancing—similar to the presentation on the cash flow statement.
The only item that is truly a compensation cost is service cost; it is the value of thefuture retirement benefits that the employees earned by working during the current year.Think of it as a form of deferred compensation. We record it wherever the companyreports labor cost. It is the only item of pension cost that we report as an operating cost.

The Magic of Pension Accounting 27 September 2002
52
Therefore, working with either our concept of real pension cost or with net pension costper FAS No. 87, the impact on operating income is the same.
We slice up the remaining items and put them somewhere else on the incomestatement. Interest cost can be thought of as a financing cost, and we record it as partof interest expense. Interest cost is the increase in the benefit obligation due to thepassage of time; it is similar in concept to the accretion on a zero coupon bond. Theactual return on plan assets results from changes in the market prices of the stocks,bonds, real estate, and whatever else is in the pension portfolio. The actuarial gain orloss on the PBO is also a mark-to-market concept; here the changes in value aregenerally due to changes in actuarial assumptions. We record them both wherever thecompany reports investment gains and losses (i.e., other income, etc.).
The FASB may help us here, as the board has a project on its agenda on financialperformance reporting. One of the topics of discussion has been pension accounting,and the location of pension cost on the income statement could be made clear, possiblybeing split apart as we propose. For full disclosure, I want to mention that I am on theFASB’s financial performance reporting task force. I would be interested in hearing anyfeedback that you have on this issue or on the overall structure of the financialstatements.
Adjusting Operating IncomeWe eliminate the pension cost reported in operating income (as defined by Compustat)for each of the companies in the S&P 500 and replace it with service cost. We thencompare the reported operating income and margins with our modified operatingincome.
If we strip out all the components of pension cost and leave behind service cost,operating income for the S&P 500 would decline by 4% in 2001, 4% in 2000, and 3% in1999. The 13 industry groups in Exhibit 35 would experience a decline in operatingincome of 10% or more.
Exhibit 35: Industry—Operating Income Decline of 10% or More Attributable to
Adjustments in 2001US$ in millions
IndustryOperating Income
AdjustedOperating Income
2001% Decline
Aerospace & Defense $ 17,076 $ 13,095 (26%)
Construction & Engineering 154 71 (23%)
Paper & Forest Products 6,563 5,946 (19%)
Computers & Peripherals 24,584 21,988 (18%)
Metals & Mining 5,090 4,425 (18%)
Chemicals 12,621 11,289 (16%)
Diversified Telecommunication Services 52,893 44,537 (14%)
Leisure Equipment & Products 3,329 3,023 (14%)
Automobiles 34,262 33,070 (13%)
Containers & Packaging 1,929 1,742 (12%)
Auto Components 5,961 5,436 (11%)
Industrial Conglomerates 29,108 26,198 (11%)
IT Consulting & Services 3,375 3,048 (11%)
Source: Company data, CSFB estimates.

The Magic of Pension Accounting 27 September 2002
53
• For 59 companies, operating income would decline by 10% or more. The ninecompanies in Exhibit 36 would experience a decline of over 50%; two of thecompanies on this list, Prudential Financial and Allegheny Technologies, would movefrom reporting operating income to an operating loss. Only three companies—NCR,Northrop, and Allegheny—show a decline of over 50% for each of the last three years.
Exhibit 36: Company—Over 50% Decline in Operating Income Attributable to Adjustments
in 2001US$ in millions
Company TickerReported
Operating Inc.Pension
Cost/(Benefit)Service Cost Adjusted
Operating Inc.%
Difference
Prudential Financial Inc PRU $ 420 $ (457) $ 167 $ (204) (149%)
Allegheny Technologies Inc ATI 67 (68) 23 (24) (136%)
McDermott Intl Inc MDR 50 (18) 26 6 (88%)
NCR Corp NCR 234 (124) 77 33 (86%)
Unisys Corp UIS 270 (170) 58 43 (84%)
Raytheon Co RTN 802 (286) 252 264 (67%)
Lockheed Martin Corp LMT 1,543 (354) 523 666 (57%)
Northrop Grumman Corp NOC 1,004 (337) 205 462 (54%)
Meadwestvaco Corp MWV 330 (135) 33 162 (51%)
Source: Company data, CSFB estimates.
• Operating income would increase for 24 companies in 2001. Operating income forHershey, Navistar, DTE Energy, Newmont Mining, Visteon, and Avaya would increaseby 10% or more.
• We compared the five-year compound annual growth rate in operating income withthe five-year CAGR for adjusted operating income. The growth rate would decline for243 companies, including the nine companies in Exhibit 37 that would experience adecline in excess of 750 basis points. The growth rate improves for 75 companies.
Exhibit 37: CAGR Decline of Over 750 Basis Points Attributable to Adjustments
Company TickerReported 5-Year
Operating Income CAGRAdjusted 5-Year
Operating Income CAGR Change (bps)NCR Corp NCR 5% (22%) (2,663)Unisys Corp UIS (3%) (29%) (2,560)Raytheon Co RTN (8%) (26%) (1,784)Lockheed Martin Corp LMT (10%) (22%) (1,202)Meadwestvaco Corp MWV (4%) (14%) (999)Boeing Co BA 28% 19% (920)Northrop Grumman Corp NOC 7% (2%) (865)Dana Corp DCN (27%) (36%) (834)TRW Inc TRW 3% (5%) (825)
Source: Company data, CSFB estimates.
• The impact on operating margins for the entire S&P 500 is minimal. The nine industrygroups in Exhibit 38 would experience a decline in operating margin of over 100 basispoints in 2001.

The Magic of Pension Accounting 27 September 2002
54
Exhibit 38: Operating Margin Decline of Over 100 Basis Points Attributable to Adjustments
in 2001
Industry Operating MarginAdjusted – Operating
Margin Difference (bps)Diversified Telecommunication Services 19% 17% (280)Aerospace & Defense 9% 7% (238)Industrial Conglomerates 17% 15% (180)Leisure Equipment & Products 9% 8% (134)Computers & Peripherals 7% 6% (132)Chemicals 8% 7% (131)Containers & Packaging 11% 10% (130)Metals & Mining 6% 5% (113)Paper & Forest Products 6% 5% (111)
Source: Company data, CSFB estimates.
• Operating margins would drop by over 100 basis points for 62 companies. The ninecompanies in Exhibit 39 experience a decline of 400 basis points or more in 2001.Only three companies, Northrop, Pactiv and Allegheny, would have had a more than400-basis-point decline for each of the past three years.
Exhibit 39: Over 400 Basis Point Declines in Operating Margin Attributable to Adjustments
in 2001
Company TickerReported Operating
MarginAdjusted Operating
Margin Change (bps)Pactiv Corp PTV 14% 9% (509)SBC Communications Inc SBC 24% 19% (436)Allegheny Technologies Inc ATI 3% -1% (429)Meadwestvaco Corp MWV 8% 4% (426)Consolidated Edison Inc ED 17% 12% (421)Bellsouth Corp BLS 29% 24% (417)Northrop Grumman Corp NOC 7% 3% (400)Pactiv Corp PTV 14% 9% (509)SBC Communications Inc SBC 24% 19% (436)
Source: Company data, CSFB estimates.
• Operating margins would improve for 69 companies, including the five companies inExhibit 40 with improvements of more than 100 basis points in 2001.
Exhibit 40: Over 100-Basis-Point Operating Margin Increase Attributable to Adjustments in
2001
Company TickerReported Operating
MarginAdjusted Operating
Margin Change (bps)
Newmont Mining Corp NEM 6% 8% 128
DTE Energy Co DTE 9% 10% 152
Hershey Foods Corp HSY 15% 17% 220
Lucent Technologies Inc LU (36%) (32%) 363
Avaya Inc AV 5% 11% 556
Source: Company data, CSFB estimates.
EV/EBITDA AnalysisWe adjust the EBITDA for the last fiscal year in a similar manner to operating income,removing pension cost and replacing it with service cost. We also increase enterprisevalue by treating the funded status of a defined benefit pension plan as net debt(enterprise value is as of the fiscal year end). We then compare EV/EBITDA multiples

The Magic of Pension Accounting 27 September 2002
55
on a reported basis with our adjusted multiples. The multiple for the S&P 500 using2001 historical results would rise from about 12.1 to 12.4 times, an increase ofapproximately 3%.
• The EV/EBITDA multiple would increase by at least 10% for the five industry groupsin Exhibit 41. The implication of this adjustment is simple: Investors may not alwaysbe getting what they think they’re paying for.
Exhibit 41: Industry EV/EBITDA Multiples Rising over 10% Due to AdjustmentsIndustry EV / EBITDA Adjusted EV / EBITDA % Change in Multiple
Airlines 46.13x 86.15x 87%
Aerospace & Defense 8.32x 10.16x 22%
Construction & Engineering 7.13x 8.19x 15%
Auto Components 5.93x 6.73x 14%
Chemicals 10.20x 11.22x 10%
Source: Company data, CSFB estimates.
• The EV/EBITDA multiple would increase by 10% or more for 44 companies; 20% ormore for 17 companies; and more than 30% for the seven companies in Exhibit 42.
Exhibit 42: Company EV/EBITDA Multiples Rising over 30% Due to AdjustmentsCompany Ticker EV / EBITDA Adjusted EV / EBITDA % Change in Multiple
Allegheny Technologies Inc ATI 10.97x 20.86x 90%
Raytheon Co RTN 14.05x 23.19x 65%
Lockheed Martin Corp LMT 10.34x 15.18x 47%
Unisys Corp UIS 7.51x 11.00x 47%
McDermott Intl Inc MDR 4.31x 5.96x 38%
NCR Corp NCR 5.24x 7.22x 38%
Northrop Grumman Corp NOC 9.58x 12.73x 33%
Source: Company data, CSFB estimates.
Next we compare the EV/EBITDA multiple for each company with the multiple for itsindustry group. We split the companies into two camps, those with premium multiplesversus the group and those with discounted multiples versus the group. We then splitthe companies into the same two camps using our adjusted EV/EBITDA multiple. Wecompare the two sets of results and find only 10 companies that switched camps.
• The EV/EBITDA multiple went from less than the industry average to greater than theindustry average for 5 companies (appearing more expensive than the group aftermaking our adjustments), and the multiple went from more than the industry averageto less than the industry average for another 5 companies (appearing less expensivethan the group).

The Magic of Pension Accounting 27 September 2002
56
Exhibit 43: Companies Trading below Group Multiple That Trade Higher after Adjustment
Company Ticker Industry GroupCo. EV /EBITDA
GroupMultiple
Adj. Co. EV /EBITDA
Adj. GroupMultiple
Ameren Corp AEE Electric Utilities 6.90x 7.02x 7.19x 7.18x
Consolidated Edison Inc ED Electric Utilities 7.01x 7.02x 8.26x 7.18x
Black & Decker Corp BDK Household Durables 7.72x 7.97x 8.36x 8.34x
Maytag Corp MYG Household Durables 7.93x 7.97x 8.69x 8.34x
Unisys Corp UIS IT Consulting & Services 7.51x 9.39x 11.00x 10.01x
Source: Company data, CSFB estimates.
Exhibit 44: Companies Trading above Group Multiple That Trade below after Adjustment
Company Ticker Industry GroupCo. EV /EBITDA
GroupMultiple
Adj. Co. EV /EBITDA
Adj. GroupMultiple
Honeywell International Inc HON Aerospace & Defense 8.49x 8.32x 9.80x 10.16x
Hershey Foods Corp HSY Food Products 11.49x 10.59x 10.45x 10.77x
Centex Corp CTX Household Durables 8.10x 7.97x 8.10x 8.34x
MBIA Inc MBI Insurance 16.73x 16.32x 16.73x 17.03x
Newmont Mining Corp NEM Metals & Mining 10.43x 9.86x 10.13x 10.49x
Source: Company data, CSFB estimates.
SummaryRemoving the smoothing mechanisms and stripping out what a company believesshould have happened with the pension plan and replacing it with what actually didhappen better reflects the company’s true exposure to its pension plan and theunderlying volatility in the financial statements. Following this methodology for the entireS&P 500 would reduce earnings by 69% in 2001 and 10% in 2000, while increasingearnings 26% in 1999. In the aggregate, placing the pension plan assets on the balancesheet would increase total assets for the S&P 500 by 5% and 7%, respectively, in 2001and 2000; treating the PBO as debt would increase aggregate debt for the S&P 500 by16% and 17%. The difference between the increase in assets and the increase inliabilities would reduce total equity for the S&P 500 by $60 billion, or 2%, at the end of2001.

The Magic of Pension Accounting 27 September 2002
57
Funded StatusThe combination of a declining stock market and record low interest rates has had anegative impact on the funded status of defined benefit pension plans. A decline in thefunded status could have negative cash flow, earnings and balance sheet implicationsfor companies with defined benefit pension plans. The potential credit rating implicationsforced Standard & Poor’s to ask companies with defined benefit plans for the mix andvalue of their pension plan assets as of June 30, 2002. “In considering the unfundedpension liability, Standard & Poor’s focuses on the ‘funded status’ as defined under FASNo. 87 and disclosed in the pension footnote. This amount can differ dramatically fromthat shown on the balance sheet.”
The funded status represents the economic value of the pension plan. An overfundedpension plan is an economic asset for the sponsoring company, one that is difficult tomonetize, however, still an asset. Capital that would have been allocated to the pensionplan can now be put to other uses—reinvestment, share repurchases, debt paydown,dividends, etc. On the other hand, an underfunded plan can be considered an economicliability that could result in increased future contributions to the pension plan from thecompany, drawing capital away from other parts of the business.
The funded status indicates the health of the pension plan; an overfunded plan is clearlyhealthier than an underfunded plan. We start by examining the health of defined benefitpension plans on a macro level. We combine the pension plan assets and the projectedbenefit obligation for each company in the S&P 500 with a defined benefit pension plan.We then determine the aggregate funded status for the S&P 500 for each of the last 10years, which is depicted in Exhibit 45.
Exhibit 45: Funded Status of the S&P 500US$ in billions
2001200019991998199719961995199419931992199190%
100%
110%
120%
130%
Per
cen
tF
un
ded
Percent Funded Evenly Funded Level
Plan Assets = $1trillionand PBO = $1trillion
S&P 500 Last Under-funded in 1993
2001200019991998199719961995199419931992199190%
100%
110%
120%
130%
Per
cen
tF
un
ded
Percent Funded Evenly Funded Level
Plan Assets = $1trillionand PBO = $1trillion
S&P 500 Last Under-funded in 1993
Source: Company data, CSFB estimates.

The Magic of Pension Accounting 27 September 2002
58
Key Observations
• In the aggregate, the defined benefit pension plans for the S&P 500 companies havenot been underfunded since 1993, when the funded status fell to $10 billionunderfunded.
• In 1994, net pretax pension expense for the S&P 500 reached its highest level in thepast decade ($11.9 billion from $9.9 billion in 1993), driven partly by the underfundingthat occurred in 1993.
• At the end of 2001, the S&P 500 was overfunded by just $4 billion with plan assets of$1,068 billion and a PBO of $1,064 billion. The 10 largest pension plans account for39% of the total plan assets and 36% of the total PBO for the S&P 500.
Exhibit 46: 10 Largest Defined Benefit Pension Plans in the S&P 500 Based on 2001 Plan
AssetsUS$ in millions
Company Ticker Plan Assets PBO Funded Status
General Motors Corp GM $ 73,662 $ 86,333 $ (12,671)
Intl Business Machines Corp IBM 61,096 60,410 686
Ford Motor Co F 48,754 51,214 (2,460)
Verizon Communications VZ 48,558 36,391 12,167
General Electric Co GE 45,006 30,423 14,583
Lucent Technologies Inc LU 35,539 29,850 5,689
Boeing Co BA 33,810 32,693 1,117
SBC Communications Inc SBC 32,715 25,060 7,655
Lockheed Martin Corp LMT 20,300 19,713 587
AT&T Corp T 18,485 14,035 4,450
Source: Company data, CSFB estimates.
• Defined benefit plans for the S&P 500 were overfunded by $252 billion in 1999 (128%funded) as compared with just $4 billion in 2001 (100% funded). An $78 billion drop inplan assets and a $170 billion rise in the projected benefit obligation caused thedecline. It appears as if the change in funded status over the last two years wasdriven more by low interest rates than by negative equity returns.
Exhibit 47 shows the number of companies in the S&P 500 with either over- orunderfunded defined benefit pension plans at the end of 2001.

The Magic of Pension Accounting 27 September 2002
59
Exhibit 47: Number of Companies with Over/Underfunded Defined Benefit Pension Plans
230261
190
227198
169189
240
171166170
144148139118
81
134109
143118
97119
0
50
100
150
200
250
300
20012000199919981997199619951994199319921991
# of Companies Overfunded # of Companies Underfunded
Source: Company data, CSFB estimates.
Key Observations
• Fewer companies were underfunded in 1999 than at any other time in the last 10years. However, since 1999 the pendulum has swung in the opposite direction; thenumber of underfunded companies has almost tripled from 81 to 240, leaving us atthe end of 2001 with the largest number of underfunded companies in the last 10years. In other words, 67% of the companies with defined benefit pension plans wereunderfunded.
• We have witnessed the same dramatic swing in the number of companies that areoverfunded, moving from 261 overfunded pension plans at the end of 1999, thehighest in the last 10 years, to only 118 companies overfunded at the end of 2001, thelowest number in the last 10 years.
UnderfundedOf the 55 different industry groups within the S&P 500, 35 were underfunded. The totalamount underfunded for these groups was $57 billion at the end of 2001. In Exhibit 48,we see that five industry groups accounted for 70% of the total underfunded amount.The only surprise appears to be Pharmaceuticals, with 10% of the total. All 10companies in the pharmaceutical group had underfunded pension plans, led by Pfizer,which was $1.3 billion underfunded. Exhibit 48 breaks out the amount underfunded foreach industry as a percentage of the $57 billion underfunded.

The Magic of Pension Accounting 27 September 2002
60
Exhibit 48: 2001 Breakout of Underfunded Industries as a % of $57 Billion Total
Oil & Gas18%Airlines
8%
Auto Components7%
Other (<4.3%)30%
Pharmaceuticals10%
Automobiles27%
Source: Company data, CSFB estimates.
The 13 companies in Exhibit 49 were underfunded by at least $1 billion at the end of2001, as compared with only 1 company in 2000 and 1 in 1999, Exxon Mobil, which hasover 57% of its defined benefit pension plan overseas, where the funding requirementsare dramatically different than in the U.S.
Exhibit 49: Companies with Defined Benefit Pension Plans Underfunded by at Least $1
Billion in 2001US$ in millions
2001 2000 1999
Company Ticker Underfunded % Funded Underfunded % Funded Underfunded % Funded
General Motors Corp GM ($12,671) 85% ($779) 99% $4,527 105%Exxon Mobil Corp XOM (7,249) 63% (4,139) 78% (3,006) 85%Ford Motor Co F (2,460) 95% 4,344 109% 8,236 117%Delphi Corp DPH (2,367) 72% (302) 96% (900) 85%Delta Air Lines Inc DAL (2,353) 78% 1,135 112% 148 102%United Technologies Corp UTX (2,329) 81% 887 107% 366 103%AMR Corp AMR (1,940) 74% (703) 89% (346) 94%Pfizer Inc PFE (1,308) 81% (211) 97% 117 103%Procter & Gamble Co PG (1,135) 56% (936) 64% (933) 63%ChevronTexaco Corp CVX (1,081) 85% 389 110% 696 118%Pharmacia Corp PHA (1,063) 73% (566) 86% (190) 92%Goodyear Tire & Rubber Co GT (1,039) 80% (302) 94% 301 106%Raytheon Co RTN (1,007) 91% 3,352 132% 2,893 127%
Source: Company data, CSFB estimates.
Of the 240 companies with underfunded defined benefit pension plans at the end of2001, 61 were less than 90% funded for two consecutive years. The companies with themost underfunded pension plans in terms of percent funded are included in Exhibit 50.

The Magic of Pension Accounting 27 September 2002
61
Exhibit 50: Most Underfunded Based on Plan Assets/Projected Benefit ObligationIndustry Ticker 2001 2000 1999
Countrywide Credit Ind Inc CCR 49% 75% 95%Tupperware Corp TUP 54% 60% 67%Cardinal Health Inc CAH 56% 65% 56%Franklin Resources Inc BEN 56% 0% 0%Procter & Gamble Co PG 56% 64% 63%Molex Inc MOLX 59% 59% 66%AFLAC Inc AFL 59% 77% 78%Phillips Petroleum Co P 60% 80% 94%AmerisourceBergen Corp ABC 60% 83% 82%
Source: Company data, CSFB estimates.
OverfundedOf the 55 different industry groups within the S&P 500, 20 were overfunded. The totalamount overfunded for these groups was $61 billion at the end of 2001. In Exhibit 51,we see that two industry groups, Diversified Telecom Services at 49% and IndustrialConglomerates at 22%, accounted for over 70% of the total overfunded amount. Twocompanies stand out at the top of the list for each group, Verizon at $12.1 billionoverfunded and General Electric at $14.6 billion.
Exhibit 51: 2001 Breakout of Overfunded Industries as a % of $61 Billion Total
IndustrialConglomerates
22%
Electric Utilities7%
Other (<3.6%)14%
Communic.Equip.
8%
DiversifiedTelecom Serv.
49%
Source: Company data, CSFB estimates.
The 16 companies in Exhibit 52 were overfunded by at least $1 billion at the end of2001 (compared with 39 companies in 2000 and 46 in 1999). The funded statusdeclined by over $10 billion between 2000 and 2001 for two companies on the list:Lucent Technologies, where the funded status dropped by $13.4 billion from $19.1billion to $5.7 billion; and Boeing, where the funded status dropped by $12.6 billion from$13.8 billion to $1.1 billion.

The Magic of Pension Accounting 27 September 2002
62
Exhibit 52: Companies Overfunded by at Least $1 Billion in 2001US$ in millions
2001 2000 1999
Company Ticker Overfunded % Funded Overfunded % Funded Overfunded % Funded
General Electric Co GE $14,583 148% $21,222 174% $24,721 197%Verizon Communications VZ 12,167 133% 22,089 167% 15,064 159%SBC Communications Inc SBC 7,655 131% 15,237 160% 20,273 179%Lucent Technologies Inc LU 5,689 119% 19,149 173% 13,666 150%Bellsouth Corp BLS 4,689 139% 7,142 158% 7,603 159%AT&T Corp T 4,450 132% 8,800 167% 8,264 164%Prudential Financial Inc PRU 2,022 131% 4,895 190% 4,038 174%Qwest Communication Intl Inc Q 1,496 116% 4,124 144% 5,716 164%Northrop Grumman Corp NOC 1,485 112% 2,642 129% 4,141 143%Southern Co SO 1,349 136% 2,911 190% 2,596 164%United States Steel Corp X 1,225 117% 2,391 135% 3,279 149%FPL Group Inc FPL 1,193 188% 1,545 228% 1,377 217%Meadwestvaco Corp MWV 1,181 187% 1,550 229% 1,491 233%United Parcel Service Inc UPS 1,149 121% 3,114 168% 1,311 131%Boeing Co BA 1,117 103% 13,754 147% 9,405 134%PG&E Corp PCG 1,088 118% 2,403 144% 3,346 170%
Source: Company data, CSFB estimates.
Of the 118 companies with overfunded defined benefit pension plans at the end of 2001,49 were over 120% funded; the top 10 most overfunded plans are included in Exhibit53. Sherwin-Williams has the highest percentage funded status in the S&P 500.
Exhibit 53: 10 Most Overfunded Based on Plan Assets / Projected Benefit ObligationIndustry Ticker 2001 2000 1999
Sherwin-Williams Co SHW 264% 285% 307%
Bank Of New York Co Inc BK 223% 401% 277%
Moodys Corp MCO 193% 271% 0%
FPL Group Inc FPL 188% 228% 217%
Meadwestvaco Corp MWV 187% 229% 233%
Manor Care Inc HCR 182% 199% 183%
Mellon Financial Corp MEL 175% 198% 218%
Nicor Inc GAS 168% 225% 207%
McGraw-Hill Companies MHP 155% 187% 220%
National City Corp NCC 148% 157% 157%
Source: Company data, CSFB estimates.
Change in Funded StatusThree hundred and forty-one companies experienced a deterioration in their fundedstatus between 2000 and 2001; 115 of these companies went from being overfunded in2000 to underfunded at the end of 2001. Exhibit 54 includes eight companies thatexperienced a deterioration in funded status of over $5 billion between 2000 and 2001.

The Magic of Pension Accounting 27 September 2002
63
Exhibit 54: Companies Reporting Unfavorable Change in 2001 Funded Status over $5
BillionUS$ in millions
Company Ticker 2001 Funded Status 2000 Funded Status 2000 – 2001 Change
Lucent Technologies Inc LU $ 5,689 $ 19,149 $ (13,460)
Boeing Co BA 1,117 13,754 (12,637)
General Motors Corp GM (12,671) (779) (11,892)
Intl Business Machines Corp IBM 686 10,738 (10,052)
Verizon Communications VZ 12,167 22,089 (9,922)
SBC Communications Inc SBC 7,655 15,237 (7,582)
Ford Motor Co F (2,460) 4,344 (6,804)
General Electric Co GE 14,583 21,222 (6,639)
Source: Company data, CSFB estimates.
Four companies were either underfunded or evenly funded in 2000 before becomingoverfunded in 2001. Only 16 companies, included in Exhibit 55, experienced a year-over-year improvement in the funded status of their defined benefit pension plans.
Exhibit 55: All Companies Reporting Favorable Change in 2001 Funded StatusUS$ in millions
Company Ticker 2001 Funded Status 2000 Funded Status 2000 – 2001 Change
El Paso Corp EP $513 $364 $149
DTE Energy Co DTE (36) (124) 88
Citizens Communications Co CZN 38 (33) 71
Waste Management Inc WMI (6) (59) 53
Sabre Hldgs Corp-Cl A TSG (57) (104) 48
General Mills Inc GIS 571 529 42
Loews Corp LTR (162) (187) 25
Bank Of America Corp BAC 129 107 22
Huntington Bancshares HBAN 14 (3) 17
Jones Apparel Group Inc JNY 7 - 7
American Greetings-Cl A AM (4) (9) 6
Guidant Corp GDT 4 - 4
JDS Uniphase Corp JDSU 0 (3) 3
SLM Corp SLM 41 38 2
Mirant Corp MIR (73) (75) 2
Molex Inc MOLX (27) (28) 2
Source: Company data, CSFB estimates.
• The favorable change in the funded status for some companies was driven at least inpart by a change in their assumptions. For instance, Waste Management increased itsdiscount rate by 166 basis points to 7.19% in 2001 from 5.53% in 2000. WasteManagement’s funded status improved by $53 million in 2001.
Measuring the Pension Plan Relative to Equity MarketCapitalizationIn the previous sections, we highlighted the companies that have the most over andunderfunded defined benefit plans in the S&P 500 as measured by both absolute dollarsand the percentage of the PBO that is funded. We now compare the PBO and fundedstatus of the pension plan as of 2001 to the company’s equity market capitalization as of

The Magic of Pension Accounting 27 September 2002
64
September 24, 2002 (as defined by Compustat) to gain greater perspective on therelative importance of a pension plan to a company and its shareholders.
Exhibit 56 plots the PBO/market capitalization and plan assets/market capitalizationratios for each of the 55 S&P 500 industries against one another to highlight the relativesignificance of pension assets and liabilities to each sector. The automobiles sector isthe most significant outlier, with a PBO/market capitalization ratio of 265% and a planassets/market capitalization ratio of 236%. Note that 36 out of the 55 industries that weexamined had PBO/market capitalization and plan asset/market capitalization ratiosbelow 25%.
Exhibit 56: Industry PBO/Market Capitalization Versus Plan Assets/Market Capitalization
0%
50%
100%
150%
200%
250%
300%
0% 50% 100% 150% 200% 250% 300%
Automobiles
Aerospace & Defense
Paper & Forest Products
Auto Components
Construction & Engineering
Office ElectronicsAirlines
Metals & Mining
36 industries with aPBO/market capitalizationand plan asset/marketcapitalization less than 25%
Source: Company data, CSFB estimates.
Exhibit 57 captures all 8 industries where the funded status/market capitalization ratio iseither greater or less than 4%. Note that the funded status of the other 47 industries inthe S&P 500 was between plus and minus 4%.

The Magic of Pension Accounting 27 September 2002
65
Exhibit 57: Industry Funded Status/Market Capitalization
(37.5%)
(29.4%)
(16.1%)(13.0%)
4.0% 4.5% 6.4%11.3%
(40%)
(30%)
(20%)
(10%)
0%
10%
20%
Fu
nd
edS
tatu
s/M
arke
tC
ap
Airlines
Autos
AutoComponents
OfficeElectronics
IndustrialConglom.
Paper &Forest
Products
GasUtilities
DiversifiedTelecomServicesOverfunded
Underfunded(37.5%)
(29.4%)
(16.1%)(13.0%)
4.0% 4.5% 6.4%11.3%
(40%)
(30%)
(20%)
(10%)
0%
10%
20%
Fu
nd
edS
tatu
s/M
arke
tC
ap
Airlines
Autos
AutoComponents
OfficeElectronics
IndustrialConglom.
Paper &Forest
Products
GasUtilities
DiversifiedTelecomServicesOverfunded
Underfunded
Source: Company data, CSFB estimates.
We now move from the industry level to the company level. Exhibit 58 shows the degreeof the PBO’s importance with respect to the market capitalization of S&P 500companies.
Exhibit 58: PBO/Market Capitalization
51 5938
128
29
195
0
50
100
150
200
250
0% - 2.5% 2.51% - 5% 5.1% - 10% 10.1% - 15% 15.1% - 100% 101% - 600%
PBO / Market Capitalization
#o
fC
om
pan
ies
PBO/Market Capitalization is lessthan 5% for 246 companies
51 5938
128
29
195
0
50
100
150
200
250
0% - 2.5% 2.51% - 5% 5.1% - 10% 10.1% - 15% 15.1% - 100% 101% - 600%
PBO / Market Capitalization
#o
fC
om
pan
ies
PBO/Market Capitalization is lessthan 5% for 246 companies
Source: Company data, CSFB estimates.
Key Observations
• Roughly half of the companies in the S&P 500 had a PBO that was less than 5% oftheir market capitalization; we estimate that 140 of these companies do not havedefined benefit pension plans.

The Magic of Pension Accounting 27 September 2002
66
• The 29 companies in Exhibit 59 had projected benefit obligations that were greaterthan their market capitalization. All 29 companies also have pension plan assets thatexceed their market capitalization.
Exhibit 59: PBO/Market Capitalization in Excess of 100%US$ in millions, unless otherwise stated
Company Ticker PBOMarket
CapitalizationPBO/Market
Capitalization
AMR Corp AMR $7,422 $560 1324%
Lucent Technologies Inc LU 29,850 3,364 887%
Delta Air Lines Inc DAL 10,657 1,240 859%
United States Steel Corp X 7,358 1,170 629%
McDermott Intl Inc MDR 1,833 333 551%
Avaya Inc AV 2,518 485 519%
General Motors Corp GM 86,333 21,421 403%
Goodyear Tire & Rubber Co GT 5,215 1,386 376%
Allegheny Technologies Inc ATI 1,816 500 363%
Ford Motor Co F 51,214 17,026 301%
Navistar International NAV 3,384 1,249 271%
Cummins Inc CUM 2,064 902 229%
Qwest Communication Intl Inc Q 9,625 4,372 220%
Unisys Corp UIS 4,816 2,230 216%
Delphi Corp DPH 8,444 4,811 175%
Xerox Corp XRX 7,606 4,352 175%
NCR Corp NCR 3,621 2,110 172%
Hercules Inc HPC 1,472 954 154%
PG&E Corp PCG 6,087 3,948 154%
Pactiv Corp PTV 3,390 2,622 129%
Dana Corp DCN 2,549 2,001 127%
Georgia-Pacific Corp GP 3,866 3,235 119%
Dynegy Inc DYN 524 443 118%
Boeing Co BA 32,693 27,936 117%
CMS Energy Corp CMS 1,268 1,108 114%
Williams Cos Inc WMB 1,023 909 113%
Corning Inc GLW 1,742 1,556 112%
Boise Cascade Corp BCC 1,472 1,356 109%
Visteon Corp VC 1,344 1,297 104%
Source: Company data, CSFB estimates.
We extend this analysis by comparing the funded status for each company in the S&P500 to their equity market capitalization in Exhibit 60.

The Magic of Pension Accounting 27 September 2002
67
Exhibit 60: Funded Status/Market Capitalization
12
65
154
206
33
9 417
0
50
100
150
200
250
<30% (30%)-(10.1%) (2.6%)-(10%) (2.5%)-(0.1%) 0%-2.5% 2.6%-10% 10.1%-30% >30%
Funded Status / Market Capitalization
#o
fC
om
pan
ies
OverfundedUnderfunded
12
65
154
206
33
9 417
0
50
100
150
200
250
<30% (30%)-(10.1%) (2.6%)-(10%) (2.5%)-(0.1%) 0%-2.5% 2.6%-10% 10.1%-30% >30%
Funded Status / Market Capitalization
#o
fC
om
pan
ies
OverfundedUnderfunded
Source: Company data, CSFB estimates.
Key Observations
• The funded status for 360 of the companies in the S&P 500 was insignificant whencompared to the market capitalization, as it falls between a positive and negative2.5%. We estimate that 140 of these companies do not have defined benefit pensionplans.
• The amount overfunded was greater than 30% of market capitalization for fourcompanies in the S&P 500 that have defined benefit pension plans, while ninecompanies were underfunded by more than 30% of their market capitalization. All 13companies are included in Exhibit 61
Exhibit 61: Overfunded/(Underfunded) Status Exceeding 25% of Market CapitalizationUS$ in millions, unless otherwise stated
Company Ticker Funded Status Market CapitalizationFunded Status/
Market CapitalizationOverfunded Status Exceeding 30%
Lucent Technologies Inc LU $5,689 $3,364 169%
United States Steel Corp X 1,225 1,170 105%
Allegheny Technologies Inc ATI 196 500 39%
Qwest Communication Intl Inc Q 1,496 4,372 34%
Underfunded Status Exceeding 30%
AMR Corp AMR (1,940) 560 (346%)
Delta Air Lines Inc DAL (2,353) 1,240 (190%)
Goodyear Tire & Rubber Co GT (1,039) 1,386 (75%)
General Motors Corp GM (12,671) 21,421 (59%)
Delphi Corp DPH (2,367) 4,811 (49%)
Cummins Inc CUM (380) 902 (42%)
Navistar International NAV (512) 1,249 (41%)
CMS Energy Corp CMS (423) 1,108 (38%)
Avaya Inc AV (147) 485 (30%)
Source: Company data, CSFB estimates.

The Magic of Pension Accounting 27 September 2002
68
Measuring the Pension Plan Relative to the Balance SheetWe take this analysis one step further by comparing the pension plan assets to the totalassets and the PBO to the total debt reported on the balance sheet at the end of 2001.We present the aggregate data for all the companies in the S&P 500 in Exhibit 62.
Exhibit 62: Magnitude of S&P 500 Pension Assets and LiabilitiesUS$ in billions
16%17%18%22%22%
25%27%26%
30%29%27%
6%7%8%8%10%10%10%9%10%10%11%
0%
5%
10%
15%
20%
25%
30%
35%
20012000199919981997199619951994199319921991
Plan Assets/Total Assets PBO/Total Debt
Source: Company data, CSFB estimates.
Key Observations
• As defined contribution plans have become more popular, the relative significance ofdefined benefit plans to the aggregate S&P 500 balance sheet has diminished.
• From a high of 30% in 1993, the PBO/Total debt ratio for S&P 500 companies steadilydeclined to 16% in 2001, while the Plan Assets/Total Assets ratio slowly dropped from11% in 1991 to 6% in 2001.
In the aggregate for the S&P 500, the impact on the balance sheet has diminished;however, the significance of the pension plan is still substantial for some individualcompanies. There were 71 companies where the PBO was greater than the company’stotal debt outstanding, including the 12 companies in Exhibit 63 with PBOs over $10billion.

The Magic of Pension Accounting 27 September 2002
69
Exhibit 63: 2001 PBO/Total Debt > 100% (PBO > $10 Billion)US$ in millions
Company Ticker PBO Total Debt PBO / Total DebtLucent Technologies Inc LU $29,850 $4,438 673%Du Pont (E I) De Nemours DD 18,769 6,814 275%Boeing Co BA 32,693 12,265 267%Lockheed Martin Corp LMT 19,713 7,511 262%United Technologies Corp UTX 12,354 4,959 249%Northrop Grumman Corp NOC 12,404 5,491 226%Intl Business Machines Corp IBM 60,410 27,151 222%Honeywell International Inc HON 10,952 5,270 208%Exxon Mobil Corp XOM 19,419 10,802 180%Raytheon Co RTN 11,171 9,096 123%Delta Air Lines Inc DAL 10,657 9,403 113%Dow Chemical DOW 11,341 10,883 104%
Source: Company data, CSFB estimates.
Examining the left hand side of the balance sheet, we find that the 12 companies inExhibit 64 had defined benefit pension plan assets over $10 billion, where the ratio ofplan assets to total assets was greater than 30%. For two companies in the S&P 500,Lucent Technologies and United States Steel, plan assets were greater than totalassets. (Note that United States Steel is not included in Exhibit 64 because its planassets totaled $9 billion at the end of 2001.)
Exhibit 64: Highest 2001 Plan Assets/Total Assets (Plan Assets > $10 Billion)US$ in millions
Company Ticker Plan Assets Total AssetsPlan Assets /Total Assets
Lucent Technologies Inc LU $35,539 $33,664 106%
Lockheed Martin Corp LMT 20,300 27,654 73%
Boeing Co BA 33,810 48,343 70%
Intl Business Machines Corp IBM 61,096 88,313 69%
Northrop Grumman Corp NOC 13,889 20,886 66%
Honeywell International Inc HON 11,051 24,226 46%
Du Pont (E I) De Nemours DD 17,923 40,319 44%
Raytheon Co RTN 10,164 26,636 38%
United Technologies Corp UTX 10,025 26,969 37%
SBC Communications Inc SBC 32,715 96,322 34%
Dow Chemical DOW 11,424 35,515 32%
Bellsouth Corp BLS 16,617 52,046 32%
Source: Company data, CSFB estimates.
Relationship between Funded Status and EarningsNow that we have poked and prodded at funded status, we ask ourselves a simplequestion: So what? For example, does it matter to earnings if a company’s pension planis over- or underfunded? We sought to identify whether there was a relationshipbetween the amount of net pension cost that companies report and the extent to whichthose companies are either over- or underfunded. Exhibit 65 provides a clear picture ofthe relationship between funded status and pension cost for 2001.

The Magic of Pension Accounting 27 September 2002
70
Exhibit 65: Funded Status of Companies Reporting 2001 Pretax Net Pension
Income/(Expense)
18
51 3
98
186
Overfunded with Pension Income
Underfunded with Pension Expense
Overfunded with Pension Expense
Underfunded with Pension Income
Over/Underfunded with no PensionIncome/(Expense)
Source: Company data, CSFB estimates.
Key Observations
• Close to 80% of the companies report pension cost that is in-line with the fundedstatus of their defined benefit pension plans; 186 underfunded companies reportedpension expense, while 98 overfunded companies reported pension income.
• Accordingly, interest cost appears to frequently dominate net pension cost forcompanies with defined benefit pension plans that are underfunded, resulting in netpension expense. Similarly, the expected return on plan assets appears to dominatenet pension cost for companies with a pension plan that is overfunded, resulting in netpension income.
• Based on data from January 1991 through December 2001, a positive correlationappears to exist between a company’s funded status and its propensity to reporteither pension income or expense. That is, pension income is likely to increase ascompanies become more overfunded, while pension income is likely to decrease ascompanies become less overfunded. Stated differently, pension expense has atendency to rise as companies become more underfunded, while pension expensedeclines as companies become less underfunded. The positive correlation is +0.7(perfect positive correlation is +1.0) and can be seen in Exhibit 66, where we plot thepension income or expense on the Y-axis and the amount that the pension plan isover or underfunded on the X-axis for each company in the S&P 500 with a definedbenefit pension plan.

The Magic of Pension Accounting 27 September 2002
71
Exhibit 66: Relationship between Funded Status and Pretax Net Pension Income/(Expense)US$ in millions
($3,500)
($2,500)
($1,500)
($500)
$500
$1,500
$2,500
$3,500
($25,000) ($20,000) ($15,000) ($10,000) ($5,000) $0 $5,000 $10,000 $15,000 $20,000 $25,000
(Underfunded)/Overfunded
Pen
sio
n(E
xpen
se)/
Inco
me
2000
20001999
General Electric (1997)
1999
20012001
General Motors (1999)
Ford (2001)
Ford (1996 to 1999)1997
1996
19981991
1992
1994
1993
General Motors(2001)
1995
General Motors
VerizonGeneral Electric
SBC (1999)
Source: Company data, CSFB estimates.
• We fit a least-squares linear regression or trend line to the data points plotted inExhibit 66, minimizing the distance between each observed data point and the trendline itself. We found that the slope of this line is +0.0741, suggesting that a $1increase in the S&P 500’s funded status is expected to result in $0.07 of pensionincome. Conversely, a $1 decrease in funded status is expected to result in $0.07 ofpension expense. However, the line is not a tight fit with respect to the data points.The R-squared value of this line is 0.5, highlighting that a company’s funded status isnot an ideal predictor of pension income (R-squared for a perfect predictor is equal to1.0), and users of this data should exercise caution when considering the aboveregression to make predictions about future pension income/(expense) amounts. Werecommend using our pension-forecasting model described earlier in our report, whichcan be found at: http://www.csfb.com/equity/presentations/pension_forecast_model.xls.
Exhibit 65 also highlights less typical cases where overfunded companies reportedpension expense, while underfunded companies reported pension income. In 2001, 18overfunded companies reported pension expense. Most of the 18 companies were onlyslightly overfunded with the exception of Lucent. In Lucent’s case, the companyreported approximately $2 billion of termination benefits related to both voluntary earlyretirement offers and involuntary terminations, causing the company to report netpension expense in 2001.
We also note in Exhibit 65 that 51 underfunded companies reported pension income in2001. The 10 companies in Exhibit 67 were underfunded and reported pension incomein excess of $50 million. Du Pont provides a good example of how an underfundedcompany may recognize pension income. Du Pont was actually overfunded by $3 billion

The Magic of Pension Accounting 27 September 2002
72
at the end of 2000, with plan assets of $20 billion and a projected benefit obligation of$17 billion. By the end of 2001, however, the fair value of Du Pont’s plan assetsdropped to $18 billion, while its projected benefit obligation increased to $19 billion,leaving Du Pont $846 million underfunded after a negative $4 billion swing in its fundedstatus. Nevertheless, the powerful smoothing mechanisms in pension accounting kickedin and Du Pont was able to recognize pension income of $374 million in 2001, versuspension income of $465 million in 2000.
Exhibit 67: Underfunded and Pension Income > $50 million in 2001
US$ in millions
Company Ticker Pension IncomeAmount
Underfunded
Du Pont (E I) De Nemours DD $374 ($846)
Raytheon Co RTN 286 (1,007)
Caterpillar Inc CAT 163 (130)
Philip Morris Cos Inc MO 138 (502)
Ford Motor Co F 115 (2,460)
Exelon Corp EXC 74 (822)
Delta Air Lines Inc DAL 73 (2,353)
U S Bancorp USB 65 (45)
Eaton Corp ETN 52 (20)
Keyspan Corp KSE 51 (16)
Source: Company data, CSFB estimates.

The Magic of Pension Accounting 27 September 2002
73
Quality of Earnings
A Few QuestionsAnother area of concern with defined benefit pension plans is the impact that they canhave on earnings. We have been inundated with questions about pension accountingand quality of earnings and attempt to answer a few of these questions by analyzing thelast 10 years of defined benefit pension plan data. The questions include:
• What percentage of net income is from the pension plan?
• What percentage of operating income is from the pension plan?
• How much of the growth in earnings is from rising pension income or decliningpension expense?
Net Pension Cost for the S&P 500Another reason why pension accounting causes so much confusion is that mostinvestors view a defined benefit pension plan as a retirement benefit provided to theemployees that has a cost to the company. Therefore, they believe that cost shouldresult in the company reporting an expense on its income statement. In the aggregate,companies in the S&P 500 reported net pension expense from 1991 through 1998. Thetide shifted in 1999 as S&P 500 companies started to, in aggregate, report pensionincome. We estimate that after-tax net pension income was 2% of net income in both2000 and 2001, while pretax net pension income was 1% of operating income for bothyears. Exhibit 68 shows the evolution of total pretax net pension cost over the pastdecade.
Exhibit 68: Pretax Net Pension Cost for the S&P 500US$ in billions
$7.1
$12.6
$2.3
($7.3)($9.9)($9.7)
($11.9)($9.9)
($7.9)($6.6) ($6.2)
($15)
($10)
($5)
$0
$5
$10
$1520
01
2000
1999
1998
1997
1996
1995
1994
1993
1992
1991
Pen
sion
Inco
me/(E
xpen
se)
Source: Company data, CSFB estimates.

The Magic of Pension Accounting 27 September 2002
74
Between 1999 and 2001, S&P 500 companies reported $22 billion of pretax net pensionincome between them.
Breakout of Companies Reporting Pretax Net Pension Income/(Expense)
Exhibit 69 breaks out the number of companies in the S&P 500 reporting pretax netpension income/(expense) over each of the last 10 years. As the chart shows, thenumber of companies reporting pretax net pension income has more than tripled from46 in 1994 to 150 in 2001. In 2001, pretax net pension income amounted to $17 billionfor 150 companies, while pretax net pension expense amounted to $10 billion for 206companies.
Exhibit 69: Breakout of Companies Reporting Pretax Net Pension Income/(Expense)
206188
234230243
255258262247237233
1029670
555446566155
150155
0
50
100
150
200
250
300
2001
2000
1999
1998
1997
1996
1995
1994
1993
1992
1991
# of Cos Reporting Pension Income # of Cos Reporting Pension Expense
Source: Company data, CSFB estimates.
The 10 companies with the largest amounts of pension income and the 10 with thelargest amounts of pension expense during 2001 are listed in Exhibit 70.
Exhibit 70: Companies Reporting the Largest Pretax Net Pension Income or Pension Expense in 2001US$ in millions
Pension Income Pension Expense
Company Ticker 2001 2000 1999 Company Ticker 2001 2000 1999
General Electric Co GE $2,095 $1,744 $1,380 Lucent Technologies Inc LU $(1,090) $971 $614
Verizon Communications VZ 1,848 3,489 1,357 General Motors Corp GM (550) (605) 1,668
Intl Business Machines Corp IBM 1,450 1,266 799 Avaya Inc AV (457) 0 0
SBC Communications Inc SBC 1,450 1,145 844 Exxon Mobil Corp XOM (451) (76) (706)
Boeing Co BA 920 428 125 AMR Corp AMR (268) (216) (177)
Bellsouth Corp BLS 797 693 421 Delphi Corp DPH (233) (164) (153)
Prudential Financial Inc PRU 457 362 117 Hewlett-Packard Co HPQ (226) (166) (202)
Du Pont (E I) De Nemours DD 374 465 164 Motorola Inc MOT (212) (186) (215)
Qwest Communication Intl Inc Q 360 319 151 ChevronTexaco Corp CVX (186) 125 (69)
Lockheed Martin Corp LMT 354 302 89 Pfizer Inc PFE (169) (199) (112)
Source: Company data, CSFB estimates.

The Magic of Pension Accounting 27 September 2002
75
Net Income
S&P 500 Industry Groups
Impact of After-Tax Net Pension Income on the Industry’s Bottom Line
For each industry group in the S&P 500, we estimate the after-tax pension cost using a35% tax rate for all companies. We then compare the after-tax pension cost to reportednet income from continuing operations (excludes discontinued operations, extraordinaryitems, and the cumulative effect of a change in accounting principle). The nineindustries in Exhibit 71 generated at least 5% of their net income from pension incomein 2001.
Exhibit 71: Industries Deriving at Least 5% of 2001 Net Income from After-Tax Net Pension
Income% of Net Income from Pensions
Industry 2001 2000 1999
Diversified Telecommunication Services 387% 14% 10%Aerospace & Defense 22% 14% 4%Leisure Equipment & Products 21% 6% 2%Metals & Mining 21% 12% 10%Containers & Packaging 19% 11% 11%Computers & Peripherals 9% 4% 3%Gas Utilities 7% 7% 3%Industrial Conglomerates 7% 6% 6%Chemicals 5% 6% 1%
Source: Company data, CSFB estimates.
Key Observations
• After-tax net pension income accounted for at least 10% of net income in the pastthree years for three industries: Diversified Telecommunication Services, Metals &Mining, and Containers & Packaging.
• The 387% figure for Diversified Telecommunications Services in 2001 is largelyattributable to a severe decline in net income, which fell to $801 million in 2001 from$31 billion in 2000.
• Eighteen industries reported net pension expense in 2001, including BuildingProducts and Personal Products, where it was approximately 4% of net income forboth groups.
S&P 500 Companies
Impact of After-Tax Net Pension Income on the Company’s Bottom Line
Applying the same methodology to individual companies, the 19 companies in Exhibit72 relied on pension income for 20% or more of their net income in 2001. Also in 2001,37 companies reported pension income representing at least 10% of their net income,while 143 companies reported pension expense.

The Magic of Pension Accounting 27 September 2002
76
Exhibit 72: Companies Deriving at Least 20% of 2001 Net Income from After-Tax Pension
Income% of Net Income from Pensions
Company Ticker 2001 2000 1999
Raytheon Co RTN 3,718% 24% 2%Lockheed Martin Corp LMT 291% NM 8%Verizon Communications VZ 204% 21% 21%TRW Inc TRW 164% 26% 18%Eastman Kodak Co EK 147% 6% 2%Whirlpool Corp WHR 134% 17% (4%)Meadwestvaco Corp MWV 99% 28% 48%El Paso Corp EP 52% 5% NMNorthrop Grumman Corp NOC 51% 48% 48%Pactiv Corp PTV 45% 62% NMWeyerhaeuser Co WY 43% 15% 11%Textron Inc TXT 38% 20% 2%NCR Corp NCR 36% 45% 12%Consolidated Edison Inc ED 29% 24% 0%Boeing Co BA 21% 13% 4%Norfolk Southern Corp NSC 21% 6% 24%Bellsouth Corp BLS 20% 11% 8%Eaton Corp ETN 20% 7% 1%Donnelley (RR) & Sons Co DNY 20% 6% 3%
Source: Company data, CSFB estimates.
Key Observations
• Six companies (Raytheon, Lockheed Martin, Verizon, TRW, Kodak, and Whirlpool)would not have reported net income in 2001 had after-tax net pension income beenexcluded from earnings. For example, TRW reported $112 million of after-tax netpension income in 2001 and net income of $68 million. TRW’s net income would drop164% if we stripped after-tax net pension income out of net income.
• Verizon, Meadwestvaco Corp, and Northrop derived over 20% of their net incomefrom their pension plans in each of the last three years.
Company Earnings Growth/(Decline) Attributable to After-Tax Net Pension
Income/(Expense)
We further assess the extent to which higher pension income or lower pension expensehas helped fuel the annual growth in company earnings. Between 2000 and 2001, netincome for the S&P 500 decreased by $213 billion. The $3 billion estimated after-taxdecline in net pension income contributed to the drop in earnings. If we look back, theS&P 500 reported $58 billion of net income growth between 1999 and 2000, whichincluded after-tax pension income growth of $7 billion. As a result, 12% of the S&P500’s net income growth between 1999 and 2000 was attributable to rising after-tax netpension income, representing the highest percentage benefit in the past 10 years.Exhibit 73 highlights specific companies where over 20% of the growth in net incomebetween 2000 and 2001 can be attributed to either the rise in pension income or thedecline in pension expense.

The Magic of Pension Accounting 27 September 2002
77
Exhibit 73: 2001 Year over Year Growth in Net Income Attributable to Decrease in Pension
Cost (from a Rise in Pension Income or a Decline in Pension Expense)US$ in millions, unless otherwise stated
Company Ticker(A)
Decline in Pension Cost(B)
Change in Net Income(A/B)
GrowthMeredith Corp MDP ($1) $0 293%
Vulcan Materials Co VMC (3) 3 94%
Consolidated Edison Inc ED (57) 99 58%
Boeing Co BA (320) 698 46%
General Dynamics Corp GD (15) 42 36%
Norfolk Southern Corp NSC (64) 190 34%
Progress Energy Inc PGN (21) 63 33%
IMS Health Inc RX (6) 22 28%
Dominion Resources Inc D (36) 129 28%
Tyco International Ltd TYC (33) 151 22%
Cinergy Corp CIN (8) 42 20%
Source: Company data, CSFB estimates.
Key Observations
• Let’s examine the figures for General Dynamics more closely to illustrate this analysis.General Dynamics reported net pension income increased to $21 million in 2001 from$6 million in 2000. That $15 million increase in pension income accounts forapproximately 36% of the $42 million year-over-year rise in net income. If pensionincome had remained constant at $6 million in 2001, net income would haveincreased by only $27 million, a 3.0% growth rate versus the 4.6% growth rate inreported earnings.
• It is not just companies that report pension income that can have a benefit to earningsfrom the pension plan. Companies that report pension expense can also benefit. Forexample, Cinergy’s net income increased by $42 million year over year. Its reportednet pension expense declined by $8 million, from $23 million in 2000 to $15 million in2001. If Cinergy’s pension expense remained at $23 million during 2001, its netincome would have increased by only $34 million. In other words, the decline inpension expense accounted for 20% of the growth in Cinergy’s net income.
Operating Income
S&P 500 Industries
Impact of Pretax Net Pension Income on the Industry’s Operating Income
Pension cost is reported in operating income wherever the company reports labor cost;for example, cost of goods sold or SG&A. In this section, we further examine the impactthat pension accounting has had on operating income (as defined by Compustat) for thecompanies in the S&P 500. Pension income accounted for 5% or more of 2001operating income in the nine industries in Exhibit 74.

The Magic of Pension Accounting 27 September 2002
78
Exhibit 74: Industries Deriving 5% or More of 2001 Operating Income from Pension Income
% of Operating Income from Pension Income
Industry 2001 2000 1999
Aerospace & Defense 13% 10% 3%Diversified Telecommunication Services 10% 12% 7%Paper & Forest Products 10% 6% 4%Computers & Peripherals 9% 5% 3%Containers & Packaging 8% 6% 5%Leisure Equipment & Products 7% 5% 1%Metals & Mining 7% 7% 6%Industrial Conglomerates 7% 6% 5%Chemicals 5% 4% 0%
Source: Company data, CSFB estimates.
Key Observations
• Diversified Telecommunications Services, Containers & Packaging, Metals & Mining,and Industrial Conglomerates relied on pension income for 5% or more of operatingincome over the past three years.
• Two industry groups stand out as somewhat surprising among the nine: Computers &Peripherals and Leisure Equipment & Products. In each case, it is one company thatcauses the industry group to appear on the list: IBM and Eastman Kodak,respectively.
• Twenty-one industries reported pension expense as a percentage of 2001 operatingincome.
S&P 500 Companies
Impact of Pretax Net Pension Income on a Company’s Operating Income
Exhibit 75 includes the 12 companies where 20% or more of operating income waspension related during 2001.
Exhibit 75: Companies Deriving 20% or More of 2001 Operating Income from Pension
Income% of Operating Income from Pension Income
Company Ticker 2001 2000 1999
Prudential Financial Inc PRU 109% 30% 5%Allegheny Technologies Inc ATI 102% 49% 51%Unisys Corp UIS 63% 25% 11%NCR Corp NCR 53% 46% 30%Meadwestvaco Corp MWV 41% 20% 26%McDermott Intl Inc MDR 36% 267% 7%Raytheon Co RTN 36% 11% 1%Northrop Grumman Corp NOC 34% 42% 36%Pactiv Corp PTV 28% 28% 27%Weyerhaeuser Co WY 26% 11% 8%Lockheed Martin Corp LMT 23% 19% 5%Boeing Co BA 20% 12% 4%
Source: Company data, CSFB estimates.

The Magic of Pension Accounting 27 September 2002
79
• Both Prudential Financial and Allegheny Technologies would have reported operatinglosses in 2001 if not for their pension income. For example, Allegheny Technologiesreported 2001 operating income of $67 million and pretax net pension income of $68million. By stripping pretax net pension income out of operating income, AlleghenyTechnologies is left with an operating loss of $1 million.
SummaryThe difficult economic environment has certainly diminished profitability for corporations,but the smoothing mechanisms inherent in the magic of pension accounting havecreated an illusory shield that has softened the blow to the bottom line at manycompanies.

The Magic of Pension Accounting 27 September 2002
80
Analysis of Assumptions
OverviewWith a defined benefit pension plan, the company has entered into an obligation wherethe future cash flows to the retirees are unknown. Therefore, the company and itsactuaries must make a number of assumptions about the future, including the discountrate and salary inflation assumptions. Among the assumptions that companies employfor accounting purposes, the expected rate of return on plan assets has received specialcriticism. Investors have questioned whether companies are overstating their earningsby keeping the expected return assumptions to high. Many auditors may also pressurecompanies to drop expected return rates. Some companies have already announcedplans to lower their expected return rates in 2002. Berkshire Hathaway has taken thedramatic step of decreasing its expected rate of return assumption from 8.3% to 6.5%,well below the 9.2% median expected return assumption for the S&P 500. (Note forcompanies that provide a range of assumptions in the pension footnote, we used themedian rate.)
The Big PictureA great deal of confusion surrounds the impact that the various pension assumptions(i.e., expected rate of return, discount rate, and salary inflation rate) can have on thecomponents of pension cost and the funded status. Exhibit 76 highlights key pensionaccounting assumptions and the corresponding impact of increases or decreases inthose assumptions on pension cost and the funded status.
Exhibit 76: Impact of Changes in Assumptions
Assumption ImpactOff-balance-sheet items Net Pension Cost Components
FMV of PlanAssets
ProjectedBenefitObligation
FundedStatus Service Cost
InterestCost
ExpectedReturn ($)
Net PensionCost
Discount RateIncrease None Decrease Favorable Decrease Increase None DecreaseDecrease None Increase Unfavorable Increase Decrease None Increase
Expected Rate of ReturnIncrease None None None None None Increase DecreaseDecrease None None None None None Decrease Increase
Salary Inflation RateIncrease None Increase Unfavorable Increase None None IncreaseDecrease None Decrease Favorable Decrease None None Decrease
Source: Company data, CSFB estimates.
The items discussed below highlight key points associated with Exhibit 76.
• Fair Market Value of Plan Assets. Note that only actual market performance affectsthe fair value of plan assets. None of the assumptions listed in Exhibit 76, includingthe expected rate of return, will cause a change in the fair value of plan assets.

The Magic of Pension Accounting 27 September 2002
81
Increases in plan asset values will have a favorable impact on a company’s fundedstatus. Conversely, a decline in the fair value of plan assets will have a negativeimpact.
• Projected Benefit Obligation (PBO). The PBO represents the present value of thefuture retirement benefits that will be paid to the employees in the future. In otherwords, the PBO represents the amount that the employer would need to invest todayat the discount rate to have sufficient funds available in the future to meet itsobligation to employees. Therefore, a lower discount rate will increase the PBO and ahigher discount rate will reduce the PBO, just like any other present value calculation.On the other hand, an increase in the salary inflation assumption will drive up theestimate of future retirement benefits, taking the PBO higher. The opposite will occurfor a decline in the salary inflation assumption. Increases in the PBO will have anunfavorable impact on a company’s funded status, while a decline in the PBO willhave a positive impact.
• Funded Status. A company’s funded status represents the difference between the fairmarket value of its plan assets and its projected benefit obligation. Changing pensionassumptions will drive the funded status up or down, depending upon their impact onthe PBO.
• Interest Cost. Interest cost is the increase in the PBO due to the passage of time. It iscalculated by multiplying the discount rate (from the prior year) by the PBO at thebeginning of the year. The impact of a change in the discount rate on interest cost iscompany specific, however, a decline in the discount rate will generally result in lowerinterest cost. An increase in the discount rate will generally result in higher interestcost. To the extent that the salary inflation assumption moves the PBO up or down,interest cost will move up or down.
• Service Cost. Service cost represents the present value of the future retirementbenefits that the employees have earned by working during the current year. Achange in the discount rate and salary inflation assumption will have the samedirectional impact as we described above for the PBO.
• Expected Return ($). Expected return is the surrogate for the actual return on thepension plan assets; it offsets pension cost. It represents the product of a company’sexpected return rate and the market-related value of the company’s plan assets at thebeginning of the period. Market-related value can either be the fair value of planassets or a calculated value that recognizes changes in fair value over a period nogreater than five years. The expected return amount does not affect a company’sfunded status. An increase in the expected return amount will lower pension cost,while a decrease in the expected return amount will raise pension cost.
• Net Pension Cost. Service cost, interest cost, and expected return ($) are allcomponents of net pension income/(expense). Net pension cost is either income orexpense, representing the net result of the aforementioned components and someamortization items. The impact on net pension cost of a change in the salary inflationrate and the expected rate of return on plan assets is clear.

The Magic of Pension Accounting 27 September 2002
82
Expected Rate of Return on Plan AssetsWith equity markets moving lower and fixed income yields remaining at historical lows,we expect companies to begin announcing that they will be taking down their expectedreturn assumptions for 2003. It would not surprise us to see drops of 50 to 100 basispoints. As the median rate falls from the current 9.2%, the illusory earnings shieldcreated by the magic of pension accounting should become evident.
Several companies had announced reductions in their 2002 expected returnassumptions, including General Electric, Dow Chemical, Whirlpool, and IBM. WarrenBuffet decided to take Berkshire Hathaway’s rate down to 6.5%. In Exhibit 81, we list theseven companies in the S&P 500 that reduced their expected return assumptions by100 basis points or more for 2001. Six companies in the S&P 500, listed in Exhibit 80,actually increased their expected return assumptions by 50 basis points or more for2001.
The expected rate of return assumption is supposed to be a long-term concept (10-plusyears) that will vary depending on a company’s belief about future market performance,its ability to generate rates of return either above or below those market levels, and itsmix of plan assets. The median expected rate of return assumption for the S&P 500historically has not moved: it was 9.2% in 1997 and has remained at that level eversince. The median expected rate of return was 9% from 1991 through 1996. However,the increase in pension plan assets during the 1990’s caused the expected return onplan assets to grow rather smoothly, at a rate of approximately $10 billion per yearduring each of the last three years (from $74.8 billion in 1998 to $104.5 billion in 2001).
Companies have a significant amount of discretion when setting their expected rates ofreturn. The highest rate of return used for 2001 belonged to Freeport McMoran at 12%.AFLAC and National Semiconductor held the distinction of having the lowest rate at5.75%. Exhibit 77 shows the distribution of expected rates of return across thecompanies in the S&P 500 during 2001.
Exhibit 77: 2001 Distribution of Expected Rates of Return across Companies
2 5
23
82
179
55
2 1-
40
80
120
160
200
Nu
mb
ero
fC
om
pan
ies
5.00-5.99 6.00-6.99 7.00-7.99 8.00-8.99 9.00-9.99 10.00-10.99 11.00-11.99 12.00-12.99
Conservative Aggressive
2 5
23
82
179
55
2 1-
40
80
120
160
200
Nu
mb
ero
fC
om
pan
ies
5.00-5.99 6.00-6.99 7.00-7.99 8.00-8.99 9.00-9.99 10.00-10.99 11.00-11.99 12.00-12.99
2 5
23
82
179
55
2 1-
40
80
120
160
200
Nu
mb
ero
fC
om
pan
ies
5.00-5.99 6.00-6.99 7.00-7.99 8.00-8.99 9.00-9.99 10.00-10.99 11.00-11.99 12.00-12.99
Conservative Aggressive
Source: Company data, CSFB estimates.

The Magic of Pension Accounting 27 September 2002
83
Key Observations
• Freeport McMoran Copper & Gold (12.00%), U.S. Bancorp (12.15%), andWeyerhaeuser (11.50%) had the highest expected rate of return in 2001, 2000, and1999, respectively. Note that Freeport McMoran Copper & Gold has an Indonesiandefined benefit pension plan covering most of its Indonesian workforce. As a result, itsexpected return rates are higher than those of other companies included in ouranalysis because its Indonesian plan has a significantly different risk profile.
• The maximum expected return rate for the universe of companies in the S&P 500remained at 11.50% from 1995 until 1999 (applied by Weyerhaeuser each year) andranged from 12.75% to 13.00% between 1991 and 1994. Exhibit 78 shows the 18companies with expected rates of return over 10% in 2001.
Exhibit 78: Companies Expecting Return Rates of over 10% in 2001Expected Return (%)
Company Ticker 2001 2000 1999
Freeport McMoran Copper & Gold FCX 12.00 12.00 NA
U S Bancorp USB 11.00 12.15 11.38
Weyerhaeuser Co WY 11.00 11.50 11.50
Fedex Corp FDX 10.90 10.90 10.90
PPG Industries Inc PPG 10.90 10.90 10.90
Lehman Brothers Holdings Inc LEH 10.81 10.88 9.19
Illinois Tool Works ITW 10.51 10.55 9.68
Bank Of New York Co Inc BK 10.50 10.50 10.50
Coors (Adolph)-Cl B RKY 10.50 10.50 10.50
Guidant Corp GDT 10.50 NA NA
Harley-Davidson Inc HDI 10.50 10.50 10.30
Kellogg Co K 10.50 10.40 10.40
Lilly (Eli) & Co LLY 10.50 10.50 10.50
Sysco Corp SYY 10.50 10.50 10.50
Darden Restaurants Inc DRI 10.40 10.40 10.40
General Mills Inc GIS 10.40 10.40 10.40
FirstEnergy Corp FE 10.25 10.25 10.25
Engelhard Corp EC 10.04 NA NA
Source: Company data, CSFB estimates.
In 2001, AFLAC and National Semiconductor employed the lowest expected rate ofreturn, 5.75%, in the S&P 500, while AFLAC alone held this distinction in 2000, at5.75%. Waste Management applied the lowest expected return rate in 1999, at 6.11%,but ratcheted that up to 9% for 2001. The lowest expected return rate hovered between3% and 4% from 1996 to 1998 and between 5% and 6% from 1991 to 1995. Exhibit 79shows the seven companies in the S&P 500 that used expected rates of return of lessthan 7% in 2001.

The Magic of Pension Accounting 27 September 2002
84
Exhibit 79: Companies Expecting Return Rates of Less Than 7% in 2001Expected Return (%)
Company Ticker 2001 2000 1999
AFLAC Inc AFL 5.75 5.75 6.75
National Semiconductor Corp NSM 5.75 6.00 9.00
Applera Corp Applied Biosys ABI 6.13 7.56 NA
Parametric Technology Corp PMTC 6.25 6.83 7.08
Nabors Industries Ltd NBR 6.50 6.50 6.50
Stryker Corp SYK 6.60 7.70 6.70
Merrill Lynch & Co MER 6.60 6.60 6.60
Source: Company data, CSFB estimates.
Changes in the Expected Rate of ReturnAn analysis of the history of expected return rate changes reveals some interestingpatterns:
• One hundred and thirteen companies changed their expected rates of return in 2001.Of these, 43 increased and 70 decreased the rate (the highest number of companiesdecreasing their expected rates of return in the last 10 years); this compares with 88companies that changed the expected rate of return in 2000, with 53 increasing and35 dropping.
• The number of companies changing their expected rates of return has increasedevery year since 1996, from 49 in 1996 to 113 in 2001.
• The number of companies increasing their expected return rates has grown from 10companies in 1993 to 43 in 2001.
• Two companies have increased their expected rates of return in each of the pastthree years, McDermott International and Loews Corp. Seven companies haveincreased their expected rates of return the past two years: 3M, C.R. Bard, JohnHancock Financial, Pfizer, Procter & Gamble, Unisys Corp, and Waste Management.
• Only one company, Ball Corp, has dropped its expected rate of return in each of thelast three years, with 13 companies decreasing their rates the past two years.
Exhibit 80 lists the six companies that increased their expected rate of return by over 50basis points year over year. SBC Communications explained the rationale and impact ofincreasing the expected return assumption by 100 basis points:
“ . . . For each of the three years ended 2001, our actual 10-year return oninvestments exceeded 10%, including the effect of the negative returns in 2001;this, along with future expectations, was the rationale behind the change in ourexpected long-term rate of return on plan assets from 8.5% to 9.5% in 2001. A0.25% change in the expected long-term rate of return causes a change ofapproximately $90 [million] in net pension benefit . . . ”

The Magic of Pension Accounting 27 September 2002
85
Exhibit 80: Increased Expected Return Rates by over 50 Basis Points in 2001Expected Return (%)
Company Ticker 2001 2000 Change (bps)
Waste Management Inc WMI 9.00 6.30 270
Biogen Inc BGEN 9.00 8.00 100
Mirant Corp MIR 9.50 8.50 100
SBC Communications Inc SBC 9.50 8.50 100
Consolidated Edison Inc ED 9.20 8.50 70
Transocean Inc RIG 9.24 8.69 55
Source: Company data, CSFB estimates.
Thirteen companies dropped their expected rates of return by over 50 basis points from2000 to 2001, including the seven companies in Exhibit 81 that dropped their rate byover 100 basis points.
Exhibit 81: Decreased Expected Return Rates By Over 100 Basis Points in 2001Expected Return (%)
Company Ticker 2001 2000 Change (bps)
BJ Services Co BJS 7.25 9.00 (175)
Applera Corp Applied Biosys ABI 6.13 7.56 (144)
Fortune Brands Inc FO 8.30 9.60 (130)
U S Bancorp USB 11.00 12.15 (115)
Merrill Lynch & Co MER 6.60 7.70 (110)
Bank One Corp ONE 8.50 9.50 (100)
Mattel Inc MAT 10.00 11.00 (100)
Source: Company data, CSFB estimates.
Are the Expected Rates of Return Reasonable?To assess the reasonableness of the expected rate of return assumptions, weconstructed the matrix in Exhibit 82, assuming a simplified portfolio allocation of 65%equity and 35% fixed income. We arrived at our plan asset mix based on a GreenwichAssociates survey of 1,445 U.S.-based corporate pension funds, public pension funds,and endowments, conducted in August and September 2001. According to the survey,U.S. pension plan portfolios hold 66.7% equity (49.5% domestic stocks, 11.2%international stocks, 3.0% equity real estate, and 3.0% private equity) and 26.3% fixedincome. The remaining 7% was invested in cash and other asset classes. The cellshighlighted in the matrix below represent the median, high, and low expected rates ofreturn for the entire S&P 500.

The Magic of Pension Accounting 27 September 2002
86
Exhibit 82: Expected Pension Plan Asset Portfolio Returns Associated with Different
Equity and Fixed Income Market Returns
Source: CSFB estimates; Greenwich Associates.
Comparing Actual Returns to Expected ReturnsThe actual return on plan assets for the S&P 500 was (7.50)% in 2001, 4.94% in 2000and 17.31% in 1999.
Exhibit 83 shows the top companies in terms of actual positive or negative returns for2001. Freeport McMoran Copper & Gold, Millipore, and Occidental Petroleum are threeof the companies in the S&P 500 with the highest positive spreads between actualreturns and expected returns in 2001; these companies also posted higher actualreturns in 2001 compared with 2000.
Exhibit 83: Highest Positive and Negative Actual Rates of Return in 2001Highest Positive Return Rates Highest Negative Return Rates
Company Ticker 2001 2000 Company Ticker 2001 2000
SLM Corp SLM 13.21% 18.19% Bank Of New York Co Inc BK (31.63%) 40.58%
Loews Corp LTR 8.61% 14.75% Harley-Davidson Inc HDI (25.46%) 38.34%
Freeport McMoran Copper & Gold FCX 8.43% 6.79% Allstate Corp ALL (23.27%) 12.07%
Southtrust Corp SOTR 8.24% 9.91% Gannett Co GCI (22.15%) 1.68%
Merrill Lynch & Co MER 7.90% 11.15% Schwab (Charles) Corp SCH (21.13%) 0.00%
Darden Restaurants Inc DRI 6.81% 17.06% Tyco International Ltd TYC (20.86%) 16.25%
Millipore Corp MIL 6.45% 3.44% Raytheon Co RTN (20.54%) 8.35%
Occidental Petroleum Corp OXY 5.51% 3.94% PepsiCo Inc. PEP (20.35%) 17.40%
Source: Company data, CSFB estimates.
11% 2% 4% 6% 8% 10% 12% 14% 16% 18%
10% 5% 6% 7% 9% 10% 11% 13% 14% 15%
9% 4% 6% 7% 8% 10% 11% 12% 14% 15%
8% 4% 5% 7% 8% 9% 11% 12% 13% 15%
7% 4% 5% 6% 8% 9% 10% 12% 13% 14%
6% 3% 5% 6% 7% 9% 10% 11% 13% 14%
5% 3% 4% 6% 7% 8% 10% 11% 12% 13%
4% 3% 4% 5% 7% 8% 9% 11% 12% 13%
3% 2% 4% 5% 6% 8% 9% 10% 11% 13%
2% 2% 3% 5% 6% 7% 9% 10% 11% 12%
= = =
S&P Median S&P High S&P Low
Act
ual
Fix
edIn
com
eM
arke
tR
etu
rn
Actual Equity Market Return

The Magic of Pension Accounting 27 September 2002
87
The vast majority of defined benefit plans lost value in 2001. Only 32 companies earnedpositive actual rates of return in 2001. A total of 82 companies lost more than 10% oftheir plan asset values in 2001. Exhibit 84 shows the distribution of actual rates of returnacross the companies in the S&P 500 during 2001.
Exhibit 84: 2001 Distribution of Actual Rates of Return across Companies
45
129
257
23911 26
-
50
100
150
200
250
300N
um
ber
of
Co
mp
anie
s
(19.9%)-(15%) (14.9%)-(10%) (9.9%)-(5%) (4.9%)-0 0.1%-5% Above 5%Below (20%)
45
129
257
23911 26
-
50
100
150
200
250
300N
um
ber
of
Co
mp
anie
s
(19.9%)-(15%) (14.9%)-(10%) (9.9%)-(5%) (4.9%)-0 0.1%-5% Above 5%Below (20%)
Source: Company data, CSFB estimates.
Exhibit 85 shows the companies that experienced the widest positive and negativedifferences or spreads between actual and expected returns in 2001. Only threecompanies earned actual rates of return on plan assets in excess of their expectedreturn rates in 2001. Seven out of the 10 companies with the widest negative spreads in2001 actually earned positive spreads in 2000.
Exhibit 85: Widest Positive and Negative Spreads Between Expected Return Rates and Actual Return Rates in 2001Widest Positive Spreads (%) Widest Negative Spreads (%)
Company Ticker Expected Rateof Return
Actual Return Company Ticker Expected Rate ofReturn
Actual Return
SLM Corp SLM 10.00% 13.21% Bank Of New York Co Inc BK 10.50% (31.63%)
Merrill Lynch & Co MER 6.60% 7.90% Harley-Davidson Inc HDI 10.50% (25.46%)
Loews Corp LTR 8.25% 8.61% Allstate Corp ALL 9.50% (23.27%)
Gannett Co GCI 10.00% (22.15%)
PepsiCo Inc PEP 9.80% (20.35%)
Schwab (Charles) Corp SCH 9.00% (21.13%)
Raytheon Co RTN 9.50% (20.54%)
Source: Company data, CSFB estimates.

The Magic of Pension Accounting 27 September 2002
88
Discount Rate
OverviewThe health of a defined benefit pension plan, its funded status, is extremely sensitive tochanges in the discount rate assumption. For example, depending upon the duration ofthe PBO, a 100-basis-point swing in the discount rate could easily move the PBO by10% or more. The discount rate drives the value of the projected benefit obligation,which in turn affects the funded status and is used to calculate interest cost and servicecost. The discount rate is also the assumption that management has the least controlover, as it must represent the yield on high-quality corporate bonds. The SEC clarifiedthis point in a 1993 letter to the EITF. Upset that discount rate assumptions were notreflecting market yields for interest rates, which at that point were at 10-year lows. TheSEC made clear that the discount rate should reflect the current level of interest rates.The SEC staff specifically suggested using high-quality corporate debt yields, “ . . . forexample, a fixed-income security that receives a rating of Aa or higher from Moody’swould be considered high quality.” Ever since this letter, the median discount rate for theS&P 500 has tracked very closely with the Moody’s Aa yield as seen in Exhibit 86; withthe spread between the two rates never widening more than 55 basis points over thepast 10 years. The SEC was seeking to achieve consistency in the way that companiesmeasure their pension liabilities, ensuring that pension obligation calculations not beinfluenced by lack of uniformity in the choice of a discount rate.
Exhibit 86: Moody's Aa Corporate Bond Rate Versus S&P 500’s Median Discount Rate
5.00%
5.50%
6.00%
6.50%
7.00%
7.50%
8.00%
8.50%
9.00%
9.50%
20012000199919981997199619951994199319921991
Rat
e
-
10
20
30
40
50
60
Dif
fere
nce
(bp
s)
Difference (bps) Median Discount Rate
Moodys Aa Corporate Bond Yield 30-year UST Rate
Source: Company data, CSFB estimates.
Exhibit 87 shows the distribution of discount rates across companies in the S&P 500.We see some variation in the discount rates across companies for several reasons:
• Different fiscal year-ends would result in companies choosing different discount rates.In addition, the pension plan is allowed to have a different fiscal year-end than thecorporation, as long as it is within the 90 days prior to the corporation’s year-end.

The Magic of Pension Accounting 27 September 2002
89
• Ages of the workforce can differ. A company with an older workforce would generallyuse a lower discount rate than a company with a younger workforce due to the term oftheir respective obligations.
• Companies with international pension plans will use different discount rates. Thediscount rate used in Japan, for example, will be lower than the discount rate used onthe pension plan in Turkey, and that discount rate will differ from the U.S. plan.
Exhibit 87: 2001 Distribution of Discount Rates across Companies
6 12 11
71
260
-
50
100
150
200
250
300
Nu
mb
ero
fC
om
pan
ies
5.00-5.99 6.00-6.99 7.00-7.99 8.00-8.99 11.00-11.994.00-4.99
Conservative Aggressive
6 12 11
71
260
-
50
100
150
200
250
300
Nu
mb
ero
fC
om
pan
ies
5.00-5.99 6.00-6.99 7.00-7.99 8.00-8.99 11.00-11.994.00-4.99
6 12 11
71
260
-
50
100
150
200
250
300
Nu
mb
ero
fC
om
pan
ies
5.00-5.99 6.00-6.99 7.00-7.99 8.00-8.99 11.00-11.994.00-4.99
Conservative Aggressive
Source: Company data, CSFB estimates.
Key Observations
• The median discount rate for the S&P 500 was 7.3% at the end of 2001, comparedwith 7.5% in both 2000 and 1999. The median discount rate reached its lowest level in1998 at 6.8%.
• Freeport McMoran Copper & Gold, at 11.00%, had the highest discount rate in 2001and 2000. Note that Freeport McMoran Copper & Gold has an Indonesian definedbenefit pension plan covering most of its Indonesian workforce. As a result, itsdiscount rates are higher than those of other companies included in our analysisbecause its Indonesian plan has a significantly different risk profile.
Exhibit 88 lists the three companies that used discount rates of 8% in 2001.
Exhibit 88: Companies Employing Discount Rates of 8% or Higher in 2001Discount Rates (%)
Company Ticker 2001 2000 1999
Freeport McMoran Copper & Gold FCX 11.00 11.00 NA
Mirant Corp MIR 8.25 7.50 NA
Whirlpool Corp WHR 8.15 8.15 8.15
Source: Company data, CSFB estimates.

The Magic of Pension Accounting 27 September 2002
90
In 2001, AFLAC and National Semiconductor employed the lowest discount rate in theS&P 500 at 4.75%, while National Semiconductor alone held this distinction in 2000.Both AFLAC and National Semiconductor employed the lowest discount rate in 1999 at5.00%. Exhibit 89 lists the 13 companies that used discount rates less than 6% in 2001.
Exhibit 89: Companies Employing Discount Rates of Less Than 6% in 2001Discount Rates (%)
Company Ticker 2001 2000 1999
AFLAC Inc AFL 4.75 5.00 5.00
National Semiconductor Corp NSM 4.75 4.75 5.00
Applera Corp Applied Biosys ABI 5.13 6.19 NA
Molex Inc MOLX 5.63 6.00 NA
Agilent Technologies Inc A 5.75 6.13 5.95
Hewlett-Packard Co HPQ 5.75 6.13 5.98
Texas Instruments Inc TXN 5.75 5.81 NA
Pitney Bowes Inc PBI 5.88 6.25 NA
Procter & Gamble Co PG 5.90 6.10 6.00
BJ Services Co BJS 5.94 7.35 7.25
Goldman Sachs Group Inc GS 5.95 6.10 6.05
Tupperware Corp TUP 5.95 6.10 NA
Exxon Mobil Corp XOM 5.98 6.25 NA
Source: Company data, CSFB estimates.
Discount Rate ChangesWe analyze the changes in the discount rate assumption in light of the changes in theMoody’s Aa yield. Changes in the discount rate that move counter to the changes inmarket yields should be investigated.
• Three hundred and five companies changed their discount rate assumptions in 2001.Of these, 292 decreased their discount rates. Exhibit 90 lists 13 companies thatincreased their discount rates in 2001, and these increases are of particular interestgiven the declining interest rate environment during 2001, when the Moody’s Aa ratemoved from 7.48% to 7.19%.
Exhibit 90: All Companies that Increased Discount Rates in 2001Discount Rate (%)
Company Ticker 2001 2000 Change (bps)
Waste Management Inc WMI 7.19 5.53 166
American Greetings-Cl A AM 7.25 6.25 100
Thermo Electron Corp TMO 6.10 5.30 80
Conagra Foods Inc CAG 7.50 6.75 75
Mirant Corp MIR 8.25 7.50 75
Chiron Corp CHIR 6.00 5.75 25
Peoples Energy Corp PGL 8.00 7.75 25
St Paul Cos SPC 7.00 6.75 25
Clorox Co CLX 7.25 7.13 13
Fluor Corp FLR 7.00 6.88 13
Halliburton Co HAL 6.88 6.75 13
First Data Corp FDC 6.91 6.79 12
Transocean Inc RIG 7.45 7.36 9
Source: Company data, CSFB estimates.

The Magic of Pension Accounting 27 September 2002
91
Exhibit 91 lists the five companies that took their discount rates down by at least 100basis points year-over-year.
Exhibit 91: Companies that Decreased Discount Rates by 100 Basis Points or More in 2001Expected Return (%)
Company Ticker 2001 2000 Change (bps)
BJ Services Co BJS 5.94 7.35 (142)
Applera Corp Applied Biosys ABI 5.13 6.19 (106)
Allstate Corp ALL 7.25 8.25 (100)
Bank Of New York Co Inc BK 7.25 8.25 (100)
Sears Roebuck & Co S 7.25 8.25 (100)
Source: Company data, CSFB estimates.
Are Assumptions Aggressive or Conservative?Many investors focus on the absolute level of the pension assumptions to determinewhether they are aggressive or conservative. For example, a high rate of returnassumption is considered aggressive. The problem with this approach is that the netpension cost that a company reports is made up of many moving parts. An alternativeapproach to evaluating the assumptions is to examine the spread between the discountrate and the expected rate of return on plan assets. Whether a pension plan is over- orunderfunded generally determines when a company reports pension income or pensionexpense. If the pension plan is underfunded, then interest cost dominates, typicallyresulting in pension expense. If the plan is overfunded, then the expected return willtake over and the result is pension income. By keeping the spread between theexpected rate of return and the discount rate wide, earnings will benefit more from anoverfunded plan and will be penalized less by an underfunded plan. Exhibit 92compares the median expected rates of return and discount rates for the companies inthe S&P 500 during the last decade.

The Magic of Pension Accounting 27 September 2002
92
Exhibit 92: S&P 500 Median Expected Return Rate and Discount Rates
%
9.29.29.29.29.29.09.09.09.09.09.08.5 8.3
7.3
8.47.3 7.5 7.3 6.8
7.5 7.5 7.3
0.5 0.81.7
0.6
1.8 1.5 1.9 2.51.7 1.7 2.0
-
2
4
6
8
10
20012000199919981997199619951994199319921991
Expected Return Rate Discount Rate Excess Return (Spread)
Source: Company data, CSFB estimates.
Key Observations
• Median discount rates for the S&P 500 have fluctuated between 6.8% and 8.5% overthe last 10 years, reflecting the movement in market yields. Meanwhile, the expectedrate of return on plan assets is very stable; from 1991-1996, it was 9% and then itmoved up to 9.2% in 1997 and has remained at that level since.
• There are 162 companies in the S&P 500 where the spreads between the expectedreturn and discount rates are more aggressive than the 200-basis-point medianspread for the S&P 500, and 150 where the spreads are less aggressive. Exhibit 93lists the companies with the widest and narrowest spreads for 2001.
Exhibit 93: Widest and Narrowest Spreads Between Expected Rates of Return and Discount Rates in 2001Spread Greater than 300 bps Spread of 50 bps or Lower
Company Ticker 2001 2000 1999 Company Ticker 2001 2000 1999
Lehman Brothers Holdings Inc LEH 392 346 194 Entergy Corp ETR (25) (25) 150
PPG Industries Inc PPG 390 360 310 Parametric Technology Corp PMTC (25) (13) 13
Fedex Corp FDX 380 320 240 Merrill Lynch & Co MER (10) 60 20
Weyerhaeuser Co WY 375 375 375 American Greetings-Cl A AM 0 100 NA
Kellogg Co K 350 340 320 Nabors Industries Ltd NBR 0 0 0
U S Bancorp USB 350 440 480 Fluor Corp FLR 25 38 NA
Illinois Tool Works ITW 346 336 249 May Department Stores Co MAY 25 25 25
Lilly (Eli) & Co LLY 330 310 310 Motorola Inc MOT 25 0 NA
Bank Of New York Co Inc BK 325 225 250 MGIC Investment Corp MTG 50 0 0
Coors (Adolph)-Cl B RKY 325 275 250 Stryker Corp SYK 50 40 60
Guidant Corp GDT 325 NA NA! Whirlpool Corp WHR 50 50 50
Source: Company data, CSFB estimates.
• There are three companies with negative spreads: Parametric, Entergy, and MerrillLynch. These companies all project that their PBOs will grow faster than their pension

The Magic of Pension Accounting 27 September 2002
93
plan assets. For example, Merrill Lynch reported an expected rate of return in 2001 of6.6% compared to its discount rate of 6.7%.
Salary Inflation RateThe salary inflation rate assumption is used to project the growth in employeecompensation when calculating the service cost component of pension cost the PBO. Itis an important assumption when the benefit formula is based on future compensationlevels; for example, the average of the last three years’ salary prior to retirement. Ahigher salary inflation rate assumption will result in a higher PBO, reducing the fundedstatus and increasing pension cost. Exhibit 94 displays the distribution of salary inflationrate assumptions among the companies in the S&P 500.
Exhibit 94: 2001 Distribution of Salary Inflation Rates across Companies
2
42
203
73
8-
50
100
150
200
250
Nu
mb
ero
fC
om
pan
ies
Below 4.00 4.00-4.99 5.00-5.99 6.00-6.99 7.00-9.00
ConservativeAggressive
2
42
203
73
8-
50
100
150
200
250
Nu
mb
ero
fC
om
pan
ies
Below 4.00 4.00-4.99 5.00-5.99 6.00-6.99 7.00-9.00
2
42
203
73
8-
50
100
150
200
250
Nu
mb
ero
fC
om
pan
ies
Below 4.00 4.00-4.99 5.00-5.99 6.00-6.99 7.00-9.00
ConservativeAggressive
Source: Company data, CSFB estimates.
Key Observations
• Freeport McMoran Copper & Gold (9.00%) had the highest salary inflation rateassumptions in 2001 and 2000. Wendy’s used the highest salary inflation rateassumption from 1994 to 1999 (8%).
• American Standard used the lowest salary inflation rate assumption from 1999 to2001 (1.7%).
• The median salary inflation rate has fluctuated between 4.5% and 6.0% over the lastdecade.

The Magic of Pension Accounting 27 September 2002
94
Appendix A
Exhibit 95: 140 Companies in the S&P 500 with No Pension ProblemsCompany Ticker Company Ticker Company Ticker
Ace Limited ACE Equity Office Properties Tr EOP Oracle Corp ORCL
ADC Telecommunications Inc ADCT Equity Residential EQR Palm Inc PALM
Adobe Systems Inc. ADBE Family Dollar Stores FDO Paychex Inc PAYX
Advanced Micro Devices AMD Fiserv Inc FISV Peoplesoft Inc PSFT
Alberto-Culver Co -Cl B ACV Forest Laboratories -Cl A FRX PMC-Sierra Inc PMCS
Altera Corp ALTR Gap Inc GPS Power-One Inc PWER
American Pwr Cnvrsion APCC Gateway Inc GTW Price (T. Rowe) Group TROW
Amgen Inc AMGN Genzyme Corp GENZ Progressive Corp-Ohio PGR
Andrew Corp ANDW Golden West Financial Corp GDW Providian Financial Corp PVN
Apache Corp APA Grainger (W W) Inc GWW Pulte Homes Inc PHM
Apollo Group Inc -Cl A APOL Harrahs Entertainment Inc HET Qlogic Corp QLGC
Apple Computer Inc AAPL HCA Inc HCA Qualcomm Inc QCOM
Applied Materials Inc AMAT Health Management Assoc HMA Quintiles Transnational Corp QTRN
Applied Micro Circuits Corp AMCC Healthsouth Corp HRC Radioshack Corp RSH
AT&T Wireless Services Inc AWE Home Depot Inc HD Rational Software Corp RATL
Autodesk Inc ADSK Humana Inc HUM Reebok International Ltd RBK
Bear Stearns Companies Inc BSC Intel Corp INTC Robert Half Intl Inc RHI
Bed Bath & Beyond Inc BBBY Intl Game Technology IGT Sanmina-Sci Corp SANM
Best Buy Co Inc BBY Intuit Inc INTU Siebel Systems Inc SEBL
Biomet Inc BMET Jabil Circuit Inc JBL Simon Property Group Inc SPG
Block H & R Inc HRB JDS Uniphase Corp JDSU Solectron Corp SLR
BMC Software Inc BMC KB Home KBH Southwest Airlines LUV
Boston Scientific Corp BSX King Pharmaceuticals Inc KG St Jude Medical Inc STJ
Broadcom Corp -Cl A BRCM KLA-Tencor Corp KLAC Staples Inc SPLS
Calpine Corp CPN Kohls Corp KSS Starbucks Corp SBUX
Capital One Finl Corp COF Limited Brands Inc LTD Stilwell Finl Inc SV
Carnival Corp CCL Linear Technology Corp LLTC Sun Microsystems Inc SUNW
Centex Corp CTX Liz Claiborne Inc LIZ Sungard Data Systems Inc SDS
Charter One Finl Inc CF Lowes Cos LOW Synovus Financial Cp SNV
Ciena Corp CIEN LSI Logic Corp LSI Tellabs Inc TLAB
Cintas Corp CTAS Marriott Intl Inc MAR Tenet Healthcare Corp THC
Cisco Systems Inc CSCO Marshall & Ilsley Corp MI TMP Worldwide Inc TMPW
Citrix Systems Inc CTXS Maxim Integrated Products MXIM Toys R Us Inc TOY
Clear Channel Communications CCU MBIA Inc MBI Union Planters Corp UPC
Comcast Corp -Cl A Spl CMCSK McDonalds Corp MCD UnitedHealth Group Inc UNH
Computer Associates Intl Inc CA Medimmune Inc MEDI Univision Communications Inc UVN
Compuware Corp CPWR Mercury Interactive Corp MERQ Veritas Software Co VRTS
Comverse Technology Inc CMVT Micron Technology Inc MU Vitesse Semiconductor Corp VTSS
Concord EFS Inc CEFT Microsoft Corp MSFT Walgreen Co WAG
Costco Wholesale Corp COST Network Appliance Inc NTAP Wal-Mart Stores WMT
Dell Computer Corp DELL Nextel Communications NXTL Watson Pharmaceuticals Inc WPI
Deluxe Corp DLX Nike Inc -Cl B NKE Winn-Dixie Stores Inc WIN
Dillards Inc -Cl A DDS Novell Inc NOVL Xilinx Inc XLNX
Dollar General Corp DG Novellus Systems Inc NVLS Xl Capital Ltd XL
eBay Inc EBAY Nucor Corp NUE Yahoo Inc YHOO
Electronic Arts Inc ERTS Nvidia Corp NVDA
EOG Resources Inc EOG Office Depot Inc ODP
Omnicom Group OMC
(NOTE: List also includes companies with defined benefit plans for which no public information is available.)Source: Company data, CSFB estimates.

The Magic of Pension Accounting 27 September 2002
95
Appendix BWe find that a walk through the pension footnote is an effective and relatively painlessapproach to explain the nuts and bolts of pension accounting. That is what we set out todo below; we use Procter & Gamble’s pension footnote disclosure, and we walk youthrough each line of the tables that are included in the footnote. The footnote in thisAppendix is taken directly from P&G’s 10-K disclosure, while our commentary ishighlighted in italics.
Procter & Gamble Company and Subsidiaries—Pension Footnote(Footnote disclosure obtained from P&G’s 06/30/01 10-K filing. Amounts exclude other retiree benefits. Allfigures are stated in millions of US dollars.)
NOTE 9 POSTRETIREMENT BENEFITS
The Company offers various postretirement benefits to its employees.
DEFINED CONTRIBUTION RETIREMENT PLANS
Within the U.S., the most significant retirement benefit is the defined contribution profitsharing plan described in Note 8.
OTHER RETIREE BENEFITS
The Company also provides certain health care and life insurance benefits forsubstantially all U.S. employees who become eligible for these benefits when they meetminimum age and service requirements. Generally, the health care plans requirecontributions from retirees and pay a stated percentage of expenses, reduced bydeductibles and other coverages. Retiree contributions change annually in line withhealth care cost trends. These benefits are partially funded by an ESOP, as well ascertain other assets contributed by the Company.
Certain other employees, primarily outside the U.S., are covered by local defined benefitpension, health care and life insurance plans.
The elements of the net amount recognized for the Company’s postretirement plans aresummarized below:
Years ended June 30Pension Benefits
2001 2000CHANGE IN BENEFIT OBLIGATIONBenefit obligation at beginning of year $2,627 $2,488Service cost 115 120Interest cost 149 151Participants' contributions 4 4Amendments (10) 9Actuarial loss (gain) 86 35Acquisitions/(Divestitures) 47 (5)Curtailments and settlements (22) (20)Currency exchange (232) (79)Benefit payments (136) (128)Benefit obligation at end of year 2,567 2,627
• A word of caution: The benefit obligation totals do not add up for P&G. We arrive at anend-of-year obligation of $2,628 million in 2001, versus the $2,567 million shown inthe reconciliation ($61 million difference), and an obligation of $2,575 million in 2000,compared with $2,627 million ($52 million difference).
Projected BenefitObligation (PBO)—This
section reconciles thechange in the PBO
between 2000 and 2001.

The Magic of Pension Accounting 27 September 2002
96
• Projected Benefit Obligation. The pension obligation is the promise to pay retirementbenefits to employees in the future; it is similar to a series of zero coupon bonds. It isthe present value of all the future retirement benefits earned and not yet paid to date,factoring in future salary inflation.
• Service Cost. As employees earn their future retirement benefits each year the PBOgrows larger.
• Interest Cost. As the sponsoring company gets closer to paying the obligation it growslarger due to the passage of time.
• Participants Contributions. Employee contributions to the pension plan increase boththe PBO and plan assets.
• Amendments. An amendment is a change in the pension plan that will either increaseor reduce future retirement benefits for work performed in prior periods. Anamendment that increases future retirement benefits to employees for serviceprovided in prior periods will cause the PBO to rise in value and create a prior servicecost. An amendment that reduces future benefits for service previously provided willcause the PBO to fall resulting in a prior service benefit.
• Actuarial loss (gain). A number of assumptions go into determining the PBO, includingthe discount rate, salary inflation, mortality, time to retirement etc. A change in anyone of those assumptions will change the value of the PBO. For example, as the PBOis a present value calculation, a decline in the discount rate will cause the PBO to risein value; an obligation increasing in value results in an actuarial loss for thesponsoring company. The actuarial gains and losses are not recognized immediately;instead, they are accumulated as part of the unrecognized actuarial gain or lossbalance.
• Acquisitions/Divestitures. Changes in the PBO associated with buying and sellingcompanies that have defined benefit pension plans.
• Curtailments. Usually if a plant closes or employees are laid-off, a curtailment hasoccurs. It is an event that significantly reduces the future benefits or expected years ofservice for the current employees.
• Settlements. Generally making a lump-sum, cash payment to pension planparticipants or buying an annuity contract to cover vested benefits will result in asettlement. It is an irrevocable transaction that relieves the sponsoring company fromthe primary responsibility for the pension obligation.
• Currency Exchange. Exchange rate fluctuations associated with foreign pensionobligations.
• Benefits Payments. Retirement benefits paid by the pension plan or directly by thecompany.

The Magic of Pension Accounting 27 September 2002
97
Years ended June 30
Pension Benefits
2001 2000
CHANGE IN PLAN ASSETS
Fair value of plan assets at beg. of year $1,691 $1,555
Actual return on plan assets (88) 198
Acquisitions/(Divestitures) (19) 28
Employer contributions 81 73
Participants' contributions 4 4
Settlements (3) (2)
Currency exchange (98) (37)
Benefit payments (136) (128)
Fair value of plan assets at end of year 1,432 1,691
• Fair Value of Plan Assets. The market value of the stocks, bonds, real estate, andother assets that are in the pension portfolio.
• Actual Return on Plan Assets. The change in value of the plan assets due to marketprice fluctuations on the assets in the portfolio; includes dividends and interestincome.
• Employer Contribution. Contributions made by the sponsoring company to thepension plan. Can be in the form of cash or other assets as long as they can beconsidered prudent investments. For example, the company stock can comprise up to10% of the pension portfolio.
• Benefit Payments. Retirement benefits paid directly from the pension plan.
Years ended June 30
Pension Benefits
2001 2000
FUNDED STATUS
Funded Status at end of year ($1,135) ($936)
Unrecognized net actuarial loss (gain) 243 (30)
Unrecognized transition amount 17 21
Unrecognized prior service cost 20 39
Net amount recognized (855) (906)
• Funded Status. The economic value of the pension plan—when plan assets exceedthe PBO, the plan is considered to be overfunded; if the PBO is greater than the planassets, the plan is underfunded.
• Unrecognized net actuarial gain loss. Also referred to as the unrecognized gain orloss, it is the result of smoothing mechanisms in FAS No. 87—it represents actualchanges in the value of the PBO and plan assets that have not yet been recognized ineither the balance sheet or income statement. It is the cumulative actuarial gain orloss on the PBO, plus the cumulative difference between the expected return on planassets and the actual return on plan assets that has not yet been recognized in thefinancial statements. For example, an unrecognized gain will occur when the actualreturn on plan assets exceeds the expected return and an unrecognized loss occurswhen the actual return is less than the expected return.
Plan Assets—This sectionreconciles the change inthe pension plan assetsbetween 2000 and 2001.
Funded Status—Thissection reconciles the
pension reality, the fundedstatus, to the pension
accounting fiction, the netamount recognized on the
balance sheet. Thedifference between the two
is a series of actualchanges in the value of the
pension plan assets andthe PBO that have notbeen recognized in the
financial statements.

The Magic of Pension Accounting 27 September 2002
98
• Unrecognized transition amount. When FAS No. 87 went into effect (1987 for calendaryear companies), companies were required to determine the funded status of thepension plan. Instead of recognizing the funded status in the financial statementsimmediately, the FASB allowed it to be recognized over the remaining service life ofthe active employees or 15 years. If the pension plan were overfunded, the companyhad a transition asset; an underfunded plan resulted in a transition liability.
• Unrecognized prior service cost. The cumulative prior service costs and benefits fromamendments (described above) to the pension plan that have not yet been recognizedin the financial statements.
Years ended June 30
Pension Benefits
2001 2000
Prepaid benefit cost $75 $59
Accrued benefit cost (1,006) (990)
Intangible asset 16 0
Accumulated other comprehensive inc. 60 25
Total (855) (906)
• Prepaid Benefit Cost. The pension asset that is recognized on the balance sheet; itwill increase when pension income is recognized and the sponsoring company makescontributions to the plan, and it will decline if the company reports pension expense.
• Accrued Benefit Cost. The pension liability that is recognized on the balance sheet; itwill increase when pension expense is recognized, and it will decline when thesponsoring company makes contributions to the plan and when the company reportspension income.
• Intangible Asset. This is the other side of the minimum pension liability adjustment;this has to be the lowest-quality asset on the balance sheet.
• Accumulated Other Comprehensive Loss. This is the other side of the minimumpension liability adjustment, resulting in a charge to shareholders’ equity.
• Minimum Pension Liability Adjustment. To ensure that the balance sheet was nottotally misleading after applying all of its smoothing mechanisms, the FASB in FASNo. 87 established a floor on the pension liability that is reported in the balance sheet.The minimum pension liability is calculated as the excess of the accumulated benefitobligation (ABO) over the fair value of the plan assets. For example, if the ABO is $10million and the fair value of the plan assets is $3 million, the pension liability reportedon the balance sheet must be at least $7 million. The minimum liability is compared tothe accrued benefit liability; if the minimum liability is greater, than an additionalliability is reported on the balance sheet. The other side of the accounting entry is anintangible asset to the extent that the company has unrecognized prior service cost oran unrecognized transition obligation. If the company has neither, or if the additionalliability is greater than both those amounts, then the other side of the entry is a chargeto accumulated other comprehensive income, reducing shareholders’ equity. If thepension plan assets and the PBO were simply reported on the balance sheet, wewould not have to deal with this.
Balance Sheet—Providesa breakdown of thepension related amountsrecognized on the balancesheet.

The Magic of Pension Accounting 27 September 2002
99
• Accumulated Benefit Obligation (ABO). Difference between the PBO and the ABO isthat the ABO does not take into account salary inflation.
Years ended June 30
Pension Benefits
COMPONENTS OF NET PERIODICBENEFIT COST
2001 2000 1999
Service cost $115 $120 $111
Interest cost 149 151 140
Expected return on plan assets (127) (122) (105)
Amortization of prior service cost 5 7 8
Amortization of prior transition amount 3 4 3
Settlement loss (gain) 6 (6) 0
Curtailment gain (13) (3) 0
Recognized net actuarial loss (gain) 3 4 4
Net periodic benefit cost 141 155 161
• Service Cost. Deferred compensation cost—it is the present value of the futureretirement benefits earned by the employees for the work performed (service) duringthe current year.
• Interest Cost. Financing cost—the increase in the projected benefit obligation due tothe passage of time. It is similar to the accretion on a zero coupon bond.
• Expected Return on Plan Assets. Investment return—an estimate of whatmanagement expects to earn on the pension plan assets; it reduces net pension cost.It is calculated by multiplying the expected rate of return on plan assets by the“market-related” value of plan assets. The market-related value can either be the fairvalue of plan assets or a smoothed calculated value.
• Amortization of Prior Service Cost. Amortized over the remaining service life of theactive employees, typically 12-15 years. Amortizing a prior service cost will increasenet pension cost, amortizing a prior service benefit will reduce net pension cost.
• Amortization of Transition Amount. Most companies have fully amortized the transitionasset or obligation. Amortizing a transition obligation will increase net pension cost;amortizing a transition asset will reduce net pension cost (could represent the lowest-quality earnings in the income statement). The transition amounts are amortized overthe remaining service life of active employees, or 15 years if the remaining service lifeis less than 15 years.
• Settlement Loss (Gain). The recognition of previously unrecognized gains and losseswhen the sponsoring company settles the pension obligation.
• Curtailment Loss (Gain). The recognition of previously unrecognized prior service costand unrecognized gains and losses when the sponsoring company curtails thepension obligation.
• Recognized Net Actuarial Loss (Gain). Can be amortized in a number of differentways. However, minimum amortization must occur when the unrecognized netactuarial gain/loss exceeds 10% of the market-related value of plan assets or theprojected benefit obligation, whichever is larger. The amount over this threshold istypically amortized over the remaining service life of the active employees. The
Pension Cost

The Magic of Pension Accounting 27 September 2002
100
minimum amortization is commonly referred to as the corridor approach. Recognizinga gain will reduce net pension cost; recognizing a loss will increase net pension cost.
• Net Periodic Benefit Cost. The combination of the 8 items noted above—this netamount is reported in the income statement wherever the company reports laborcosts.
The Company’s stock comprised $1,335 and $1,123 of other retiree plan assets, net ofSeries B ESOP debt, as of June 30, 2001 and 2000, respectively. Assumptions for thepostretirement benefit calculations are as follows:
Years ended June 30
Pension Benefits
WEIGHTED AVG. ASSUMPTIONS 2001 2000
Discount rate 5.9% 6.1%
Expected return on plan assets 8.3% 8.1%
Rate of compensation increase 4.1% 4.5%
• Discount Rate. Should reflect the yield on high-grade corporate bonds—for example,Moody’s Aa. The rate disclosed in the current year is used to calculate the PBO andwill be used to calculate the interest cost and service cost in the following year.
• Expected Rate of Return on Plan Assets. The expected long-term (10+ years) rate ofreturn on the pension assets. The rate disclosed in the current year is used tocalculate the expected return on plan assets for the current year.
• Salary Inflation Assumption. Used to calculate the PBO and service cost, when thebenefit formula is based upon salary in future periods. For example, the benefitformula may promise the employees one-half of the salary paid in the final year ofemployment throughout each year of their retirement.
The projected benefit obligation, accumulated benefit obligation and fair value of planassets for the pension plans with accumulated benefit obligations in excess of planassets were $1,414, $1,124 and $230, respectively, as of June 30, 2001, and $1,368,$1,073 and $189, respectively, as of June 30, 2000.
Assumptions

The Magic of Pension Accounting 27 September 2002
101
Appendix C
Exhibit 96: Projected and Historical Funded Status for the S&P 500US$ in millions
Ticker Over (Under) Funded
Company Name Symbol 2002E 2001A 2000A 1999A
3M Co MMM $(3,098) ($990) $692 $1,137
Abbott Laboratories ABT (1,437) (597) 257 840
Ace Limited ACE - - - -
ADC Telecommunications Inc ADCT - - - -
Adobe Systems Inc. ADBE - - - -
Advanced Micro Devices AMD - - - -
AES Corp. (The) AES (380) (265) (95) 30
Aetna Inc AET (1,146) (279) 645 447
AFLAC Inc AFL (82) (60) (34) (30)
Agilent Technologies Inc A (763) (326) 56 (24)
Air Products & Chemicals Inc APD (691) (385) (42) (67)
Alberto-Culver Co-Cl B ACV - - - -
Albertsons Inc ABS (209) (101) 42 159
Alcoa Inc AA (2,074) (54) 1,520 737
Allegheny Energy Inc AYE (244) (49) 152 126
Allegheny Technologies Inc ATI (237) 196 759 976
Allergan Inc AGN (124) (65) (44) (41)
Allied Waste Inds Inc AW (59) 36 117 55
Allstate Corp ALL (1,225) (693) 693 817
Alltel Corp AT (139) 40 204 275
Altera Corp ALTR - - - -
Ambac Financial Gp ABK (6) (2) (1) 2
Amerada Hess Corp AHC (266) (128) (46) 32
Ameren Corp AEE (489) (193) (3) 170
American Electric Power AEP (889) 119 861 823
American Express AXP (758) (351) 77 (33)
American Greetings-Cl A AM (20) (4) (9) -
American International Group AIG (1,087) (402) (353) (212)
American Pwr Cnvrsion APCC - - - -
American Standard Cos Inc ASD (516) (356) (181) (74)
Amerisourcebergen Corp ABC (47) (34) (11) (10)
Amgen Inc AMGN - - - -
AMR Corp/De AMR (3,367) (1,940) (703) (346)
Amsouth Bancorporation ASO (98) 43 171 174
Anadarko Petroleum Corp APC (165) (79) 19 (19)
Analog Devices ADI (26) (11) 7 11
Andrew Corp ANDW - - - -
Anheuser-Busch Cos Inc BUD (717) (217) 397 320
Anthem Inc ATH (207) (88) 83 86
AOL Time Warner Inc AOL (473) (262) - -
AON Corp AOC (1,082) (348) 104 113
Apache Corp APA - - - -
Apollo Group Inc-Cl A APOL - - - -
Apple Computer Inc AAPL - - - -
Applera Corp Applied Biosys ABI (155) (32) 8 7
Applied Materials Inc AMAT - - - (39)
Applied Micro Circuits Corp AMCC - - - -
Archer-Daniels-Midland Co ADM (323) (165) (55) (81)

The Magic of Pension Accounting 27 September 2002
102
Ticker Over (Under) Funded
Company Name Symbol 2002E 2001A 2000A 1999A
Ashland Inc ASH (447) (300) (176) (188)
AT&T Corp T 713 4,450 8,800 8,264
AT&T Wireless Services Inc AWE - - - -
Autodesk Inc ADSK - - - -
Automatic Data Processing ADP (46) 87 169 98
Autozone Inc AZO (38) (18) (0) (10)
Avaya Inc AV (703) (147) - -
Avery Dennison Corp AVY (54) 85 164 193
Avon Products AVP (434) (283) (115) (59)
Baker-Hughes Inc BHI (11) 49 103 89
Ball Corp BLL (197) (95) 12 17
Bank Of America Corp BAC (1,813) 129 107 1,811
Bank Of New York Co Inc BK 478 691 1,408 879
Bank One Corp ONE (157) 450 886 1,150
Bard (C.R.) Inc BCR (52) (17) 14 4
Bausch & Lomb Inc BOL (101) (49) (3) 7
Baxter International Inc BAX (563) (162) 252 380
BB&T Corp BBT (189) (94) 4 (29)
Bear Stearns Companies Inc BSC - - - -
Becton Dickinson & Co BDX (344) (216) (62) (16)
Bed Bath & Beyond Inc BBBY - - - -
Bellsouth Corp BLS 1,565 4,689 7,142 7,603
Bemis Co BMS (104) (11) 85 125
Best Buy Co Inc BBY - - - -
Big Lots Inc BLI (23) (16) (10) (8)
Biogen Inc BGEN (17) (11) (9) (4)
Biomet Inc BMET - - - -
BJ Services Co BJS (39) (12) 9 (1)
Black & Decker Corp BDK (328) (44) 284 245
Block H & R Inc HRB - - - -
BMC Software Inc BMC - - - -
Boeing Co BA (6,846) 1,117 13,754 9,405
Boise Cascade Corp BCC (613) (323) (115) 33
Boston Scientific Corp BSX - - - -
Bristol Myers Squibb BMY (1,396) (406) 229 353
Broadcom Corp -Cl A BRCM - - - -
Brown-Forman -Cl B BF.B (80) 29 150 188
Brunswick Corp BC (302) (110) (11) 140
Burlington Northern Santa Fe BNI (484) (162) 158 143
Burlington Resources Inc BR (73) (26) (4) 10
Calpine Corp CPN - - - -
Campbell Soup Co CPB (248) 122 418 335
Capital One Finl Corp COF - - - -
Cardinal Health Inc CAH (63) (47) (35) (43)
Carnival Corp CCL - - - -
Caterpillar Inc CAT (2,138) (130) 1,401 1,964
Cendant Corp CD (115) (96) (3) 2
Centex Corp CTX - - - -
Centurytel Inc CTL (58) 12 80 114
Charter One Finl Inc CF - - - -
Chevrontexaco Corp CVX (2,342) (1,081) 389 696
Chiron Corp CHIR (8) (9) (9) (9)
Chubb Corp CB (306) (126) 5 56
Ciena Corp CIEN - - - -

The Magic of Pension Accounting 27 September 2002
103
Ticker Over (Under) Funded
Company Name Symbol 2002E 2001A 2000A 1999A
Cigna Corp CI (1,101) (432) 134 783
Cincinnati Financial Corp CINF 6 41 72 73
Cinergy Corp CIN (426) (208) (21) (56)
Cintas Corp CTAS - - - -
Circuit City Str Crct Cty Gp CC (79) (44) (18) 6
Cisco Systems Inc CSCO - - - -
Citigroup Inc C (2,765) (65) 723 1,678
Citizens Communications Co CZN (155) 38 (33) 11
Citrix Systems Inc CTXS - - - -
Clear Channel Communications CCU - - - -
Clorox Co/De CLX (65) 2 74 77
CMS Energy Corp CMS (590) (423) (145) 70
Coca-Cola Co KO (746) (414) (264) 52
Coca-Cola Enterprises CCE (699) (361) (52) (31)
Colgate-Palmolive Co CL (541) (268) (107) 70
Comcast Corp-Cl A Spl CMCSK - - - -
Comerica Inc. CMA (255) (85) 40 142
Computer Associates Intl Inc CA - - - -
Computer Sciences Corp CSC (622) (278) (62) 99
Compuware Corp CPWR - - - -
Comverse Technology Inc CMVT - - - -
Conagra Foods Inc CAG (344) 68 163 (25)
Concord Efs Inc CEFT - - - -
Conoco Inc COC (839) (530) (231) (135)
Consolidated Edison Inc ED (794) 729 1,717 -
Constellation Energy Grp Inc CEG (533) (305) (15) 68
Convergys Corp CVG (83) (39) 5 41
Cooper Industries Ltd CBE (197) (52) 32 50
Cooper Tire & Rubber CTB (285) (87) (51) (17)
Coors (Adolph)-Cl B RKY (273) (132) (36) 79
Corning Inc GLW (523) (114) 262 287
Costco Wholesale Corp COST - - - -
Countrywide Credit Ind Inc CCR (49) (38) (12) (2)
Crane Co CR (39) 62 119 133
CSX Corp CSX (559) (207) 9 64
Cummins Inc CUM (729) (380) 40 57
CVS Corp CVS (112) (65) (33) (6)
Dana Corp DCN (848) (266) 275 506
Danaher Corp DHR (66) 19 99 65
Darden Restaurants Inc DRI (6) 23 33 19
Deere & Co DE (1,994) (489) 1,773 677
Dell Computer Corp DELL - - - -
Delphi Corp DPH (4,245) (2,367) (302) (900)
Delta Air Lines Inc DAL (4,376) (2,353) 1,135 148
Deluxe Corp DLX - - - -
Devon Energy Corp DVN (94) (54) (10) 17
Dillards Inc-Cl A DDS - - - -
Disney (Walt) Co DIS (303) 319 948 432
Dollar General Corp DG - - - -
Dominion Resources Inc D 33 759 1,253 208
Donnelley (R R) & Sons Co DNY (183) 233 500 473
Dover Corp DOV (98) (37) 64 78
Dow Chemical DOW (2,639) 83 1,275 1,777
Dow Jones & Co Inc DJ - - - -

The Magic of Pension Accounting 27 September 2002
104
Ticker Over (Under) Funded
Company Name Symbol 2002E 2001A 2000A 1999A
DTE Energy Co DTE (551) (36) (124) 128
Du Pont (E I) De Nemours DD (5,176) (846) 2,551 4,142
Duke Energy Corp DUK (688) (58) 452 675
Dynegy Inc DYN (76) 60 179 1
Eastman Chemical Co EMN (492) (365) (51) 34
Eastman Kodak Co EK (1,221) 503 1,879 1,554
Eaton Corp ETN (467) (20) 447 632
Ebay Inc EBAY - - - -
Ecolab Inc ECL (170) (86) (30) 29
Edison International EIX (266) 368 848 991
El Paso Corp EP (6) 513 364 299
Electronic Arts Inc ERTS - - - -
Electronic Data Systems Corp EDS (1,540) (358) 310 24
EMC Corp/Ma EMC (121) (63) (20) 18
Emerson Electric Co EMR (495) 16 174 43
Engelhard Corp EC (155) (70) 73 40
Entergy Corp ETR (412) (34) 240 466
EOG Resources Inc EOG - - - -
Equifax Inc EFX (71) 21 140 113
Equity Office Properties Tr EOP - - - -
Equity Residential EQR - - - -
Exelon Corp EXC (2,413) (822) 305 928
Exxon Mobil Corp XOM (9,397) (7,249) (4,139) (3,006)
Family Dollar Stores FDO - - - -
Fannie Mae FNM (153) (82) (2) 77
Federal Home Loan Mortg Corp FRE (79) (40) (10) (4)
Federated Dept Stores FD (434) (97) 158 401
Fedex Corp FDX (2,510) (717) 238 1,234
Fifth Third Bancorp FITB (65) 2 92 86
First Data Corp FDC (263) (90) 35 (20)
First Tennessee Natl Corp FTN (14) 52 112 85
Firstenergy Corp FE (914) (64) 200 413
Fiserv Inc FISV - - - -
Fleetboston Financial Corp FBF (406) 152 575 819
Fluor Corp FLR (126) (12) 66 207
Ford Motor Co F (14,273) (2,460) 4,344 8,236
Forest Laboratories -Cl A FRX - - - -
Fortune Brands Inc FO (264) (72) 20 42
FPL Group Inc FPL 730 1,193 1,545 1,377
Franklin Resources Inc BEN (20) (15) - -
Freeprt Mcmor Cop&Gld -Cl B FCX (20) (14) (10) (10)
Gannett Co GCI (738) (192) 264 293
Gap Inc GPS - - - -
Gateway Inc GTW - - - -
General Dynamics Corp GD (450) 945 1,586 1,329
General Electric Co GE 5,562 14,583 21,222 24,721
General Mills Inc GIS 1 571 529 621
General Motors Corp GM (29,428) (12,671) (779) 4,527
Genuine Parts Co GPC (135) 45 129 96
Genzyme Corp GENZ - - - -
Georgia-Pacific Corp GP (1,141) (155) - 590
Gillette Co G (771) (332) (83) 96
Golden West Financial Corp GDW - - - -
Goldman Sachs Group Inc GS (91) (22) (7) 12

The Magic of Pension Accounting 27 September 2002
105
Ticker Over (Under) Funded
Company Name Symbol 2002E 2001A 2000A 1999A
Goodrich Corp GR (561) (118) 144 296
Goodyear Tire & Rubber Co GT (1,965) (1,039) (302) 301
Grainger (W W) Inc GWW - - - -
Great Lakes Chemical Corp GLK (76) (27) 40 8
Guidant Corp GDT (9) 4 - -
Halliburton Co HAL (675) (151) 518 440
Hancock John Finl Svcs Inc JHF (222) 283 630 509
Harley-Davidson Inc HDI (240) (161) 5 (27)
Harrahs Entertainment Inc HET - - - -
Hartford Finl Svcs Grp Inc HIG (861) (397) (41) 206
Hasbro Inc HAS (70) (24) 54 55
Hca Inc HCA - - - -
Health Management Assoc HMA - - - -
Healthsouth Corp HRC - - - -
Heinz (H J) Co HNZ (491) (121) (53) 200
Hercules Inc HPC (477) (188) 141 389
Hershey Foods Corp HSY (356) (150) (52) 23
Hewlett-Packard Co HPQ (1,476) (846) (60) (35)
Hilton Hotels Corp HLT (23) 1 27 34
Home Depot Inc HD - - - -
Honeywell International Inc HON (2,503) 99 2,132 3,084
Household International Inc HI (13) 182 504 379
Humana Inc HUM - - - -
Huntington Bancshares HBAN (43) 14 (3) (33)
Illinois Tool Works ITW (310) 0 415 220
IMS Health Inc RX (58) (15) (3) 29
Ingersoll-Rand Co Ltd IR (566) 14 269 312
Intel Corp INTC - - - -
Interpublic Group Of Cos IPG (154) (95) (69) (49)
Intl Business Machines Corp IBM (13,265) 686 10,738 17,223
Intl Flavors & Fragrances IFF (204) (57) 51 84
Intl Game Technology IGT - - - -
Intl Paper Co IP (1,449) 83 934 1,289
Intuit Inc INTU - - - -
ITT Industries Inc ITT (1,192) (384) 210 769
J P Morgan Chase & Co JPM (933) 41 416 459
Jabil Circuit Inc JBL - - - -
JDS Uniphase Corp JDSU - - (3) -
Jefferson-Pilot Corp JP 14 94 145 127
Johnson & Johnson JNJ (1,941) (671) 292 1,048
Johnson Controls Inc JCI (721) (304) (167) 45
Jones Apparel Group Inc JNY 4 7 - 6
KB Home KBH - - - -
Kellogg Co K (671) (193) 24 228
Kerr-Mcgee Corp KMG 37 309 544 676
Keycorp KEY (128) 88 346 282
Keyspan Corp KSE (479) (16) 257 519
Kimberly-Clark Corp KMB (1,212) (293) 239 778
Kinder Morgan Inc KMI (30) 9 38 33
King Pharmaceuticals Inc KG - - - -
Kla-Tencor Corp KLAC - - - -
Knight-Ridder Inc KRI (377) (45) 134 262
Kohls Corp KSS - - - -
Kroger Co KR (450) (82) 275 265
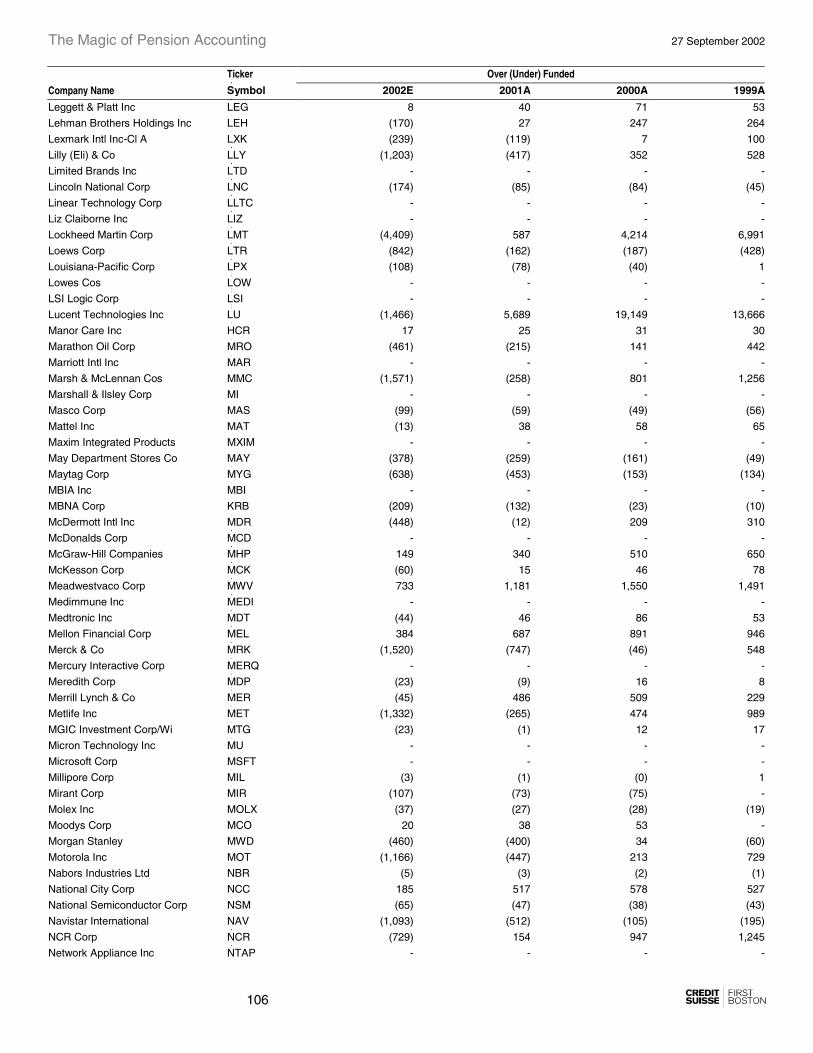
The Magic of Pension Accounting 27 September 2002
106
Ticker Over (Under) Funded
Company Name Symbol 2002E 2001A 2000A 1999A
Leggett & Platt Inc LEG 8 40 71 53
Lehman Brothers Holdings Inc LEH (170) 27 247 264
Lexmark Intl Inc-Cl A LXK (239) (119) 7 100
Lilly (Eli) & Co LLY (1,203) (417) 352 528
Limited Brands Inc LTD - - - -
Lincoln National Corp LNC (174) (85) (84) (45)
Linear Technology Corp LLTC - - - -
Liz Claiborne Inc LIZ - - - -
Lockheed Martin Corp LMT (4,409) 587 4,214 6,991
Loews Corp LTR (842) (162) (187) (428)
Louisiana-Pacific Corp LPX (108) (78) (40) 1
Lowes Cos LOW - - - -
LSI Logic Corp LSI - - - -
Lucent Technologies Inc LU (1,466) 5,689 19,149 13,666
Manor Care Inc HCR 17 25 31 30
Marathon Oil Corp MRO (461) (215) 141 442
Marriott Intl Inc MAR - - - -
Marsh & McLennan Cos MMC (1,571) (258) 801 1,256
Marshall & Ilsley Corp MI - - - -
Masco Corp MAS (99) (59) (49) (56)
Mattel Inc MAT (13) 38 58 65
Maxim Integrated Products MXIM - - - -
May Department Stores Co MAY (378) (259) (161) (49)
Maytag Corp MYG (638) (453) (153) (134)
MBIA Inc MBI - - - -
MBNA Corp KRB (209) (132) (23) (10)
McDermott Intl Inc MDR (448) (12) 209 310
McDonalds Corp MCD - - - -
McGraw-Hill Companies MHP 149 340 510 650
McKesson Corp MCK (60) 15 46 78
Meadwestvaco Corp MWV 733 1,181 1,550 1,491
Medimmune Inc MEDI - - - -
Medtronic Inc MDT (44) 46 86 53
Mellon Financial Corp MEL 384 687 891 946
Merck & Co MRK (1,520) (747) (46) 548
Mercury Interactive Corp MERQ - - - -
Meredith Corp MDP (23) (9) 16 8
Merrill Lynch & Co MER (45) 486 509 229
Metlife Inc MET (1,332) (265) 474 989
MGIC Investment Corp/Wi MTG (23) (1) 12 17
Micron Technology Inc MU - - - -
Microsoft Corp MSFT - - - -
Millipore Corp MIL (3) (1) (0) 1
Mirant Corp MIR (107) (73) (75) -
Molex Inc MOLX (37) (27) (28) (19)
Moodys Corp MCO 20 38 53 -
Morgan Stanley MWD (460) (400) 34 (60)
Motorola Inc MOT (1,166) (447) 213 729
Nabors Industries Ltd NBR (5) (3) (2) (1)
National City Corp NCC 185 517 578 527
National Semiconductor Corp NSM (65) (47) (38) (43)
Navistar International NAV (1,093) (512) (105) (195)
NCR Corp NCR (729) 154 947 1,245
Network Appliance Inc NTAP - - - -

The Magic of Pension Accounting 27 September 2002
107
Ticker Over (Under) Funded
Company Name Symbol 2002E 2001A 2000A 1999A
New York Times Co-Cl A NYT (487) (328) (103) (108)
Newell Rubbermaid Inc NWL (307) (90) 147 150
Newmont Mining Corp NEM (99) (65) (31) (5)
Nextel Communications NXTL - - - -
Nicor Inc GAS 91 162 272 231
Nike Inc-Cl B NKE - - - -
Nisource Inc NI (340) 108 492 236
Noble Corp NE (34) (17) (5) (3)
Nordstrom Inc JWN (30) (40) - -
Norfolk Southern Corp NSC 128 474 687 1,014
North Fork Bancorporation NFB 6 28 43 (1)
Northern Trust Corp NTRS (62) 9 107 64
Northrop Grumman Corp NOC (1,602) 1,485 2,642 4,141
Novell Inc NOVL - - - -
Novellus Systems Inc NVLS - - - -
Nucor Corp NUE - - - -
Nvidia Corp NVDA - - - -
Occidental Petroleum Corp OXY (149) (83) (41) (7)
Office Depot Inc ODP - - - -
Omnicom Group OMC - - - -
Oracle Corp ORCL - - - -
Paccar Inc PCAR (253) (134) (66) 15
Pactiv Corp PTV (622) 171 1,313 981
Pall Corp PLL (102) (57) (6) (9)
Palm Inc PALM - - - -
Parametric Technology Corp PMTC (41) (27) (10) (9)
Parker-Hannifin Corp PH (655) (326) (37) 414
Paychex Inc PAYX - - - -
Penney (J C) Co JCP (665) 10 863 1,054
Peoples Energy Corp PGL 57 180 314 314
Peoplesoft Inc PSFT - - - -
Pepsi Bottling Group Inc PBG (335) (182) 1 (50)
Pepsico Inc PEP (1,339) (427) (76) (257)
Perkinelmer Inc PKI (108) (42) (11) (8)
Pfizer Inc PFE (2,892) (1,308) (211) 117
PG&E Corp PCG (538) 1,088 2,403 3,346
Pharmacia Corp PHA (1,595) (1,063) (566) (190)
Phelps Dodge Corp PD (301) (66) 81 109
Philip Morris Cos Inc MO (3,309) (502) 2,233 3,161
Phillips Petroleum Co P (934) (736) (280) (84)
Pinnacle West Capital PNW (339) (116) (21) 37
Pitney Bowes Inc PBI (409) (102) 143 363
Plum Creek Timber Co Inc PCL (22) (5) 7 12
PMC-Sierra Inc PMCS - - - -
PNC Financial Svcs Group Inc PNC (226) 8 96 99
Power-One Inc PWER - - - -
PPG Industries Inc PPG (563) 9 390 718
PPL Corp PPL (36) 338 602 593
Praxair Inc PX (378) (149) (23) 24
Price (T. Rowe) Group TROW - - - -
Principal Financial Grp Inc PFG (146) 97 318 327
Procter & Gamble Co PG (1,531) (1,135) (936) (933)
Progress Energy Inc PGN (86) 287 467 259
Progressive Corp-Ohio PGR - - - -

The Magic of Pension Accounting 27 September 2002
108
Ticker Over (Under) Funded
Company Name Symbol 2002E 2001A 2000A 1999A
Providian Financial Corp PVN - - - -
Prudential Financial Inc PRU 194 2,022 4,895 4,038
Public Service Entrp PEG (1,071) (448) (118) 142
Pulte Homes Inc PHM - - - -
Qlogic Corp QLGC - - - -
Qualcomm Inc QCOM - - - -
Quintiles Transnational Corp QTRN - - - -
Qwest Communication Intl Inc Q (825) 1,496 4,124 5,716
Radioshack Corp RSH - - - -
Rational Software Corp RATL - - - -
Raytheon Co RTN (3,612) (1,007) 3,352 2,893
Reebok International Ltd RBK - - - -
Regions Finl Corp RF (75) (7) 63 58
Reliant Energy Inc REI (430) (114) 99 281
Robert Half Intl Inc RHI - - - -
Rockwell Automation ROK (451) (91) 427 270
Rockwell Collins Inc COL (530) (86) 205 (52)
Rohm & Haas Co ROH (116) 321 625 746
Rowan Cos Inc RDC (101) (54) (15) 4
Ryder System Inc R (272) (40) 173 352
Sabre Hldgs Corp-Cl A TSG (120) (57) (104) (76)
Safeco Corp SAFC (45) (22) (17) (3)
Safeway Inc SWY 101 496 775 1,034
Sanmina-Sci Corp SANM - - - -
Sara Lee Corp SLE (966) (256) 79 (88)
SBC Communications Inc SBC 998 7,655 15,237 20,273
Schering-Plough SGP (335) (27) 232 331
Schlumberger Ltd SLB (566) (301) 173 388
Schwab (Charles) Corp SCH (39) 33 158 -
Scientific-Atlanta Inc SFA (33) (16) 3 0
Sealed Air Corp SEE (22) (9) 12 -
Sears Roebuck & Co S (1,272) (742) (28) (159)
Sempra Energy SRE (80) 439 883 1,465
Sherwin-Williams Co SHW 259 334 360 353
Siebel Systems Inc SEBL - - - -
Sigma-Aldrich SIAL (20) 11 21 35
Simon Property Group Inc SPG - - - -
SLM Corp SLM 1 41 38 26
Snap-On Inc SNA (175) (32) 55 35
Solectron Corp SLR - - - -
Southern Co SO 269 1,349 2,911 2,596
Southtrust Corp SOTR (80) (43) (29) (21)
Southwest Airlines LUV - - - -
Sprint Fon Group FON (696) (9) 742 -
Sprint Pcs Group PCS - - - -
St Jude Medical Inc STJ - - - -
St Paul Cos SPC (211) 41 245 449
Stanley Works SWK 41 137 167 157
Staples Inc SPLS - - - -
Starbucks Corp SBUX - - - -
Starwood Hotels & Resorts Wrld HOT (51) (19) (3) 12
State Street Corp STT (203) (140) (78) (42)
Stilwell Finl Inc SV - - - -
Stryker Corp SYK (32) (21) (12) (7)

The Magic of Pension Accounting 27 September 2002
109
Ticker Over (Under) Funded
Company Name Symbol 2002E 2001A 2000A 1999A
Sun Microsystems Inc SUNW - - - -
Sungard Data Systems Inc SDS - - - -
Sunoco Inc SUN (376) (155) 62 250
Suntrust Banks Inc STI (88) 183 293 308
Supervalu Inc SVU (182) (71) (3) 13
Symbol Technologies SBL (11) (12) (11) (10)
Synovus Financial Cp SNV - - - -
Sysco Corp SYY (301) (160) (42) (63)
Target Corp TGT (323) (34) 103 120
Teco Energy Inc TE (59) 46 114 152
Tektronix Inc TEK (190) (84) 3 75
Tellabs Inc TLAB - - - -
Temple-Inland Inc TIN (127) 38 224 129
Tenet Healthcare Corp THC - - - -
Teradyne Inc TER (100) (66) (25) (13)
Texas Instruments Inc TXN (933) (682) (478) (473)
Textron Inc TXT (462) 572 1,229 1,677
Thermo Electron Corp TMO (21) (5) 3 18
Thomas & Betts Corp TNB (124) (78) (41) (5)
Tiffany & Co TIF (54) (34) (11) 10
TJX Companies Inc TJX (100) (38) (27) 0
TMP Worldwide Inc TMPW - - - -
Torchmark Corp TMK (29) 5 25 28
Toys R Us Inc TOY - - - -
Transocean Inc RIG (97) (32) (16) -
Tribune Co TRB 55 342 720 153
TRW Inc TRW (1,379) 420 1,885 3,212
Tupperware Corp TUP (51) (41) (34) (28)
TXU Corp TXU (898) (77) 535 802
Tyco International Ltd TYC (1,658) (899) 104 (141)
U S Bancorp USB (457) (45) 356 156
Union Pacific Corp UNP (876) (390) 119 484
Union Planters Corp UPC - - - -
Unisys Corp UIS (750) 399 1,483 1,670
United Parcel Service Inc UPS (418) 1,149 3,114 1,311
United States Steel Corp X (515) 1,225 2,391 3,279
United Technologies Corp UTX (4,737) (2,329) 887 366
Unitedhealth Group Inc UNH - - - -
Univision Communications Inc UVN - - - -
Unocal Corp UCL (250) (39) 277 378
Unumprovident Corp UNM (14) 93 211 320
UST Inc UST (170) (101) (54) (13)
Veritas Software Co VRTS - - - -
Verizon Communications VZ 2,698 12,167 22,089 15,064
VF Corp VFC (247) (97) 105 81
Viacom Inc -Cl B VIA.B (1,479) (534) (93) 179
Visteon Corp VC (651) (327) 50 285
Vitesse Semiconductor Corp VTSS - - - -
Vulcan Materials Co VMC (13) 96 202 179
Wachovia Corp WB (1,240) (362) 669 215
Walgreen Co WAG - - - -
Wal-Mart Stores WMT - - - -
Washington Mutual Inc WM (216) (44) - -
Waste Management Inc WMI (65) (6) (59) (226)

The Magic of Pension Accounting 27 September 2002
110
Ticker Over (Under) Funded
Company Name Symbol 2002E 2001A 2000A 1999A
Waters Corp WAT (17) (10) (5) 0
Watson Pharmaceuticals Inc WPI - - - -
Wellpoint Hlth Netwrk-Cl A WLP (74) (30) (15) (6)
Wells Fargo & Co WFC (930) (173) 614 352
Wendy's International Inc WEN (20) (2) 10 9
Weyerhaeuser Co WY 47 830 1,852 1,645
Whirlpool Corp WHR (263) 143 658 959
Williams Cos Inc WMB (392) (137) 27 301
Winn-Dixie Stores Inc WIN - - - -
Worthington Industries WOR (4) (3) (0) (1)
Wrigley (Wm) Jr Co WWY (139) (42) 29 69
Wyeth WYE (1,205) (577) (395) (70)
Xcel Energy Inc XEL 190 858 1,435 1,171
Xerox Corp XRX (2,297) (566) 371 353
Xilinx Inc XLNX - - - -
Xl Capital Ltd XL - - - -
Yahoo Inc YHOO - - - -
Yum Brands Inc YUM (212) (129) (38) (25)
Zimmer Hldgs Inc ZMH (21) (23) - -
Zions Bancorporation ZION (54) (16) 2 33
Totals (243,417) $4,177 $220,661 $252,369
Source: Company data, CSFB estimates.

The Magic of Pension Accounting 27 September 2002
111
Appendix D
Exhibit 97: Pension Cost—Income/(Expense) for the S&P 500US$ in millions
Ticker Pension Cost—Income/(Expense)
Company Name Symbol 2004E 2003E 2002E 2001A 2000A
3m Co MMM (154) (97) (37) ($98) ($56)
Abbott Laboratories ABT (156) (146) (111) (82) (54)
Ace Limited ACE - - - - -
ADC Telecommunications Inc ADCT - - - - -
Adobe Systems Inc. ADBE - - - - -
Advanced Micro Devices AMD - - - - -
AES Corp. (The) AES (47) (40) (26) (39) (78)
Aetna Inc AET (96) (97) (58) 37 1
AFLAC Inc AFL (11) (11) (9) (8) (8)
Agilent Technologies Inc A (148) (146) (113) (94) (77)
Air Products & Chemicals Inc APD (57) (57) (42) (60) (51)
Alberto-Culver Co-Cl B ACV - - - - -
Albertsons Inc ABS (16) (22) (9) 9 8
Alcoa Inc AA (92) (93) (72) 33 (17)
Allegheny Energy Inc AYE (34) (36) (12) 5 5
Allegheny Technologies Inc ATI (56) (61) 11 68 126
Allergan Inc AGN (18) (19) (17) (11) (11)
Allied Waste Inds Inc AW 6 11 15 17 17
Allstate Corp ALL (62) (43) (6) 6 152
Alltel Corp AT (9) (7) 1 (8) 23
Altera Corp ALTR - - - - -
Ambac Financial Gp ABK (1) (1) (1) (0) (1)
Amerada Hess Corp AHC (36) (40) (22) (14) (11)
Ameren Corp AEE (40) (38) (31) (4) (3)
American Electric Power AEP (15) 18 41 65 65
American Express AXP (106) (105) (82) (73) (64)
American Greetings-Cl A AM (0) (0) (0) 0 0
American International Group AIG (275) (189) (82) (66) (76)
American Pwr Cnvrsion APCC - - - - -
American Standard Cos Inc ASD (64) (72) (55) (33) (27)
Amerisourcebergen Corp ABC (7) (7) (6) (5) (5)
Amgen Inc AMGN - - - - -
AMR Corp/De AMR (525) (585) (389) (268) (216)
Amsouth Bancorporation ASO (22) (23) (3) 12 19
Anadarko Petroleum Corp APC (18) (19) (16) (11) (10)
Analog Devices ADI (5) (5) (5) (3) (3)
Andrew Corp ANDW - - - - -
Anheuser-Busch Cos Inc BUD (34) (27) (7) (12) (7)
Anthem Inc ATH (25) (21) (15) (11) (12)
AOL Time Warner Inc AOL (171) (107) (36) (64) -
AON Corp AOC (71) (50) (10) 11 6
Apache Corp APA - - - - -
Apollo Group Inc-Cl A APOL - - - - -
Apple Computer Inc AAPL - - - - -
Applera Corp Applied Biosys ABI (0) 4 13 (5) (3)
Applied Materials Inc AMAT - - - - -
Applied Micro Circuits Corp AMCC - - - - -
Archer-Daniels-Midland Co ADM (53) (55) (30) (26) (30)

The Magic of Pension Accounting 27 September 2002
112
Ticker Pension Cost—Income/(Expense)
Company Name Symbol 2004E 2003E 2002E 2001A 2000A
Ashland Inc ASH (61) (61) (49) (46) (50)
AT&T Corp T 301 293 363 246 767
AT&T Wireless Services Inc AWE - - - - -
Autodesk Inc ADSK - - - - -
Automatic Data Processing ADP (28) (24) (17) (15) (17)
Autozone Inc AZO (12) (12) (10) (9) (9)
Avaya Inc AV (323) (213) (84) (457) -
Avery Dennison Corp AVY 3 5 7 13 12
Avon Products AVP (59) (61) (51) (47) (42)
Baker-Hughes Inc BHI (5) (6) 2 8 5
Ball Corp BLL (30) (34) (20) (4) (9)
Bank Of America Corp BAC (397) (382) (84) (24) 49
Bank Of New York Co Inc BK 90 88 92 98 62
Bank One Corp ONE (52) (30) 0 14 11
Bard (C.R.) Inc BCR (8) (8) (6) (5) (7)
Bausch & Lomb Inc BOL (17) (16) (14) (12) (9)
Baxter International Inc BAX (73) (76) (25) 24 -
BB&T Corp BBT (35) (34) (27) (20) (13)
Bear Stearns Companies Inc BSC - - - - -
Becton Dickinson & Co BDX (37) (33) (27) (21) (13)
Bed Bath & Beyond Inc BBBY - - - - -
Bellsouth Corp BLS 444 514 709 797 693
Bemis Co BMS (3) (0) 5 13 12
Best Buy Co Inc BBY - - - - -
Big Lots Inc BLI (6) (6) (5) (4) (3)
Biogen Inc BGEN (4) (4) (4) (4) (4)
Biomet Inc BMET - - - - -
BJ Services Co BJS (3) (2) (0) (1) (2)
Black & Decker Corp BDK (23) (12) 6 10 8
Block H & R Inc HRB - - - - -
BMC Software Inc BMC - - - - -
Boeing Co BA 67 230 385 920 428
Boise Cascade Corp BCC (76) (87) (47) (11) (4)
Boston Scientific Corp BSX - - - - -
Bristol Myers Squibb BMY (251) (269) (128) (77) (65)
Broadcom Corp -Cl A BRCM - - - - -
Brown-Forman -Cl B BF.B (3) 2 8 12 11
Brunswick Corp BC (41) (45) (19) (10) 7
Burlington Northern Santa Fe BNI 5 5 13 (10) 13
Burlington Resources Inc BR (11) (10) (8) (6) (7)
Calpine Corp CPN - - - - -
Campbell Soup Co CPB (13) (8) 5 12 1
Capital One Finl Corp COF - - - - -
Cardinal Health Inc CAH (8) (8) (7) (6) (6)
Carnival Corp CCL - - - - -
Caterpillar Inc CAT 4 56 96 163 180
Cendant Corp CD (9) (12) (15) - -
Centex Corp CTX - - - - -
Centurytel Inc CTL (1) 2 5 8 18
Charter One Finl Inc CF - - - - -
Chevrontexaco Corp CVX (521) (402) (218) (186) 125
Chiron Corp CHIR (1) (1) (1) (1) (1)
Chubb Corp CB (29) (28) (19) (14) (10)
Ciena Corp CIEN - - - - -

The Magic of Pension Accounting 27 September 2002
113
Ticker Pension Cost—Income/(Expense)
Company Name Symbol 2004E 2003E 2002E 2001A 2000A
Cigna Corp CI (100) (101) (74) (69) (48)
Cincinnati Financial Corp CINF (2) (1) 3 2 3
Cinergy Corp CIN (32) (34) (29) (24) (36)
Cintas Corp CTAS - - - - -
Circuit City Str Crct Cty Gp CC (18) (17) (14) (12) (10)
Cisco Systems Inc CSCO - - - - -
Citigroup Inc C (234) (171) (61) (102) (66)
Citizens Communications Co CZN (0) 7 21 (7) (12)
Citrix Systems Inc CTXS - - - - -
Clear Channel Communications CCU - - - - -
Clorox Co/De CLX (2) (1) 2 6 8
CMS Energy Corp CMS (52) (52) (45) (31) (22)
Coca-Cola Co KO (62) (61) (52) (62) (39)
Coca-Cola Enterprises CCE (114) (123) (79) (42) (38)
Colgate-Palmolive Co CL (52) (48) (33) (39) (19)
Comcast Corp-Cl A Spl CMCSK - - - - -
Comerica Inc. CMA (15) (8) 1 1 8
Computer Associates Intl Inc CA - - - - -
Computer Sciences Corp CSC (116) (117) (104) (89) (60)
Compuware Corp CPWR - - - - -
Comverse Technology Inc CMVT - - - - -
Conagra Foods Inc CAG (36) (33) (26) (38) (53)
Concord Efs Inc CEFT - - - - -
Conoco Inc COC (89) (79) (56) (57) (55)
Consolidated Edison Inc ED 53 81 120 310 222
Constellation Energy Grp Inc CEG (44) (46) (36) (21) (20)
Convergys Corp CVG (20) (18) (14) (12) (8)
Cooper Industries Ltd CBE (20) (16) (10) (12) 2
Cooper Tire & Rubber CTB (46) (52) (29) (27) (23)
Coors (Adolph)-Cl B RKY (20) (20) (14) (12) (7)
Corning Inc GLW (81) (88) (36) (66) (27)
Costco Wholesale Corp COST - - - - -
Countrywide Credit Ind Inc CCR (14) (15) (14) (11) (6)
Crane Co CR (1) 0 2 7 7
CSX Corp CSX (77) (85) (34) (14) (9)
Cummins Inc CUM (35) (44) (30) (24) (22)
CVS Corp CVS 1 0 (0) (1) (2)
Dana Corp DCN (62) (50) (26) (7) (32)
Danaher Corp DHR 1 3 6 9 2
Darden Restaurants Inc DRI (3) (3) 2 3 2
Deere & Co DE (50) (19) 9 (85) (13)
Dell Computer Corp DELL - - - - -
Delphi Corp DPH (294) (273) (172) (233) (164)
Delta Air Lines Inc DAL (604) (710) (358) 73 4
Deluxe Corp DLX - - - - -
Devon Energy Corp DVN (9) (9) (6) (7) (5)
Dillards Inc-Cl A DDS - - - - -
Disney (Walt) Co DIS (145) (241) (312) 24 3
Dollar General Corp DG - - - - -
Dominion Resources Inc D 17 38 78 62 6
Donnelley (R R) & Sons Co DNY 3 10 19 8 23
Dover Corp DOV (4) (3) (0) 1 (2)
Dow Chemical DOW (523) (278) (26) 95 45
Dow Jones & Co Inc DJ - - - - -

The Magic of Pension Accounting 27 September 2002
114
Ticker Pension Cost—Income/(Expense)
Company Name Symbol 2004E 2003E 2002E 2001A 2000A
DTE Energy Co DTE (3) 28 54 (159) (9)
Du Pont (E I) De Nemours DD (214) (42) 237 374 465
Duke Energy Corp DUK (36) (18) 7 9 (3)
Dynegy Inc DYN (1) 3 9 4 11
Eastman Chemical Co EMN (41) (47) (39) (20) (24)
Eastman Kodak Co EK 62 104 178 172 138
Eaton Corp ETN (34) (19) 5 52 40
Ebay Inc EBAY - - - - -
Ecolab Inc ECL (26) (25) (20) (17) (15)
Edison International EIX (78) (79) (23) (25) (11)
El Paso Corp EP (152) (32) 88 54 45
Electronic Arts Inc ERTS - - - - -
Electronic Data Systems Corp EDS (374) (372) (213) (152) (143)
EMC Corp/Ma EMC (9) (11) (5) 0 2
Emerson Electric Co EMR (19) 5 36 16 14
Engelhard Corp EC 1 (0) 3 (8) (7)
Entergy Corp ETR (57) (47) (8) (2) 5
EOG Resources Inc EOG - - - - -
Equifax Inc EFX 2 4 8 11 11
Equity Office Properties Tr EOP - - - - -
Equity Residential EQR - - - - -
Exelon Corp EXC (30) (31) (1) 74 109
Exxon Mobil Corp XOM (465) (494) (417) (451) (76)
Family Dollar Stores FDO - - - - -
Fannie Mae FNM (9) (20) (28) (14) (5)
Federal Home Loan Mortg Corp FRE (17) (18) (14) (10) (7)
Federated Dept Stores FD (9) (11) (2) (1) -
Fedex Corp FDX (459) (494) (244) (149) (60)
Fifth Third Bancorp FITB (23) (16) (7) (2) 27
First Data Corp FDC 0 2 6 7 5
First Tennessee Natl Corp FTN (1) (0) 1 4 2
Firstenergy Corp FE 61 76 89 24 43
Fiserv Inc FISV - - - - -
Fleetboston Financial Corp FBF (89) (51) (1) 15 21
Fluor Corp FLR (48) (39) (24) (20) (18)
Ford Motor Co F (723) (441) (187) 115 (177)
Forest Laboratories -Cl A FRX - - - - -
Fortune Brands Inc FO (41) (37) (28) (7) (12)
FPL Group Inc FPL 78 82 101 110 112
Franklin Resources Inc BEN (3) (4) (4) (1) -
Freeprt Mcmor Cop&Gld -Cl B FCX (3) (4) (4) (2) (2)
Gannett Co GCI (31) (15) 29 14 16
Gap Inc GPS - - - - -
Gateway Inc GTW - - - - -
General Dynamics Corp GD (85) (64) (16) 33 10
General Electric Co GE 907 994 1,198 2,095 1,744
General Mills Inc GIS 102 129 155 85 69
General Motors Corp GM (4,458) (4,990) (2,767) (550) (605)
Genuine Parts Co GPC (27) (28) (3) 10 12
Genzyme Corp GENZ - - - - -
Georgia-Pacific Corp GP (621) (402) (137) (17) -
Gillette Co G (67) (57) (32) (46) (23)
Golden West Financial Corp GDW - - - - -
Goldman Sachs Group Inc GS (40) (40) (18) (32) (27)

The Magic of Pension Accounting 27 September 2002
115
Ticker Pension Cost—Income/(Expense)
Company Name Symbol 2004E 2003E 2002E 2001A 2000A
Goodrich Corp GR (8) (7) 2 (8) (2)
Goodyear Tire & Rubber Co GT (307) (342) (211) (138) (64)
Grainger (W W) Inc GWW - - - - -
Great Lakes Chemical Corp GLK (9) (8) (6) (3) (6)
Guidant Corp GDT (6) (3) 1 3 -
Halliburton Co HAL (87) (113) (116) (47) 6
Hancock John Finl Svcs Inc JHF (28) (34) 28 76 66
Harley-Davidson Inc HDI (31) (33) (29) (27) (18)
Harrahs Entertainment Inc HET - - - - -
Hartford Finl Svcs Grp Inc HIG (78) (80) (59) (57) (48)
Hasbro Inc HAS (12) (13) (7) 3 4
Hca Inc HCA - - - - -
Health Management Assoc HMA - - - - -
Healthsouth Corp HRC - - - - -
Heinz (H J) Co HNZ (33) (19) 2 2 (15)
Hercules Inc HPC (25) (20) (5) 3 23
Hershey Foods Corp HSY (34) (29) (20) (130) (15)
Hewlett-Packard Co HPQ (305) (293) (255) (226) (166)
Hilton Hotels Corp HLT (1) (6) (11) - -
Home Depot Inc HD - - - - -
Honeywell International Inc HON (23) 74 149 310 380
Household International Inc HI (6) 4 19 38 33
Humana Inc HUM - - - - -
Huntington Bancshares HBAN (4) (1) 2 0 (6)
Illinois Tool Works ITW (23) (12) (0) 15 18
IMS Health Inc RX (7) (7) (5) (5) (15)
Ingersoll-Rand Co Ltd IR (43) (18) 1 (4) 9
Intel Corp INTC - - - - -
Interpublic Group Of Cos IPG (23) (30) (34) (13) (10)
Intl Business Machines Corp IBM 351 946 1,253 1,450 1,266
Intl Flavors & Fragrances IFF (13) (11) (7) (8) (7)
Intl Game Technology IGT - - - - -
Intl Paper Co IP 1 59 129 141 101
Intuit Inc INTU - - - - -
ITT Industries Inc ITT (34) (30) (1) 9 0
J P Morgan Chase & Co JPM (44) (221) (362) (163) (121)
Jabil Circuit Inc JBL - - - - -
JDS Uniphase Corp JDSU 0 0 0 - (1)
Jefferson-Pilot Corp JP (3) (0) 4 4 3
Johnson & Johnson JNJ (233) (216) (150) (74) (52)
Johnson Controls Inc JCI (78) (73) (51) (27) (16)
Jones Apparel Group Inc JNY (2) (2) (2) 0 -
KB Home KBH - - - - -
Kellogg Co K (7) 25 44 11 6
Kerr-Mcgee Corp KMG 7 18 33 44 36
Keycorp KEY (26) (16) (4) 5 4
Keyspan Corp KSE (58) (64) (17) 51 51
Kimberly-Clark Corp KMB (136) (157) (34) 20 85
Kinder Morgan Inc KMI (6) (6) (2) 2 (1)
King Pharmaceuticals Inc KG - - - - -
Kla-Tencor Corp KLAC - - - - -
Knight-Ridder Inc KRI (82) (77) (57) (35) (8)
Kohls Corp KSS - - - - -
Kroger Co KR (56) (53) (34) (29) 1

The Magic of Pension Accounting 27 September 2002
116
Ticker Pension Cost—Income/(Expense)
Company Name Symbol 2004E 2003E 2002E 2001A 2000A
Leggett & Platt Inc LEG (0) (1) 2 7 4
Lehman Brothers Holdings Inc LEH (23) (26) 1 32 34
Lexmark Intl Inc-Cl A LXK (13) (10) (2) 2 8
Lilly (Eli) & Co LLY (128) (125) (72) (45) (32)
Limited Brands Inc LTD - - - - -
Lincoln National Corp LNC (21) (25) (13) (16) (10)
Linear Technology Corp LLTC - - - - -
Liz Claiborne Inc LIZ - - - - -
Lockheed Martin Corp LMT (156) (15) 137 354 302
Loews Corp LTR (125) (136) (51) (68) (89)
Louisiana-Pacific Corp LPX (21) (21) (18) (15) (15)
Lowes Cos LOW - - - - -
LSI Logic Corp LSI - - - - -
Lucent Technologies Inc LU 507 603 775 (1,090) 971
Manor Care Inc HCR 3 3 3 3 3
Marathon Oil Corp MRO (66) (61) (42) (25) (30)
Marriott Intl Inc MAR - - - - -
Marsh & McLennan Cos MMC (69) (40) 2 49 37
Marshall & Ilsley Corp MI - - - - -
Masco Corp MAS (16) (17) (13) (12) (12)
Mattel Inc MAT (1) (1) 6 6 9
Maxim Integrated Products MXIM - - - - -
May Department Stores Co MAY (71) (77) (59) (62) (41)
Maytag Corp MYG (62) (63) (50) (42) (41)
MBIA Inc MBI - - - - -
MBNA Corp KRB (45) (44) (38) (34) (36)
McDermott Intl Inc MDR (24) (22) (12) 18 40
McDonalds Corp MCD - - - - -
McGraw-Hill Companies MHP 27 30 39 52 40
McKesson Corp MCK (3) (3) 7 10 6
Meadwestvaco Corp MWV 102 106 123 135 108
Medimmune Inc MEDI - - - - -
Medtronic Inc MDT 10 10 12 (9) (12)
Mellon Financial Corp MEL 68 73 81 120 101
Merck & Co MRK (253) (256) (203) (148) (116)
Mercury Interactive Corp MERQ - - - - -
Meredith Corp MDP (6) (6) (5) (2) (3)
Merrill Lynch & Co MER (34) (27) (19) (6) (8)
Metlife Inc MET (210) (228) (92) (29) 53
MGIC Investment Corp/Wi MTG (8) (8) (6) (4) (3)
Micron Technology Inc MU - - - - -
Microsoft Corp MSFT - - - - -
Millipore Corp MIL 0 (0) 0 0 0
Mirant Corp MIR (12) (11) (7) (15) (6)
Molex Inc MOLX (8) (8) (7) (6) (5)
Moodys Corp MCO (0) 0 1 1 0
Morgan Stanley MWD (21) (42) (65) (68) (74)
Motorola Inc MOT (262) (245) (205) (212) (186)
Nabors Industries Ltd NBR (0) (0) (0) (0) (0)
National City Corp NCC 39 41 54 66 56
National Semiconductor Corp NSM (7) (8) (6) (5) (6)
Navistar International NAV (87) (114) (56) (46) (49)
NCR Corp NCR 35 55 84 124 124
Network Appliance Inc NTAP - - - - -

The Magic of Pension Accounting 27 September 2002
117
Ticker Pension Cost—Income/(Expense)
Company Name Symbol 2004E 2003E 2002E 2001A 2000A
New York Times Co-Cl A NYT (37) (38) (36) (37) (21)
Newell Rubbermaid Inc NWL (51) (55) (23) 3 8
Newmont Mining Corp NEM (17) (16) (12) (29) (6)
Nextel Communications NXTL - - - - -
Nicor Inc GAS 3 2 13 22 28
Nike Inc-Cl B NKE - - - - -
Nisource Inc NI (26) (18) (2) 9 (1)
Noble Corp NE (7) (7) (6) (6) (4)
Nordstrom Inc JWN (3) (3) (3) (6) -
Norfolk Southern Corp NSC 72 79 98 116 17
North Fork Bancorporation NFB 0 1 2 2 3
Northern Trust Corp NTRS (14) (14) (10) (11) (11)
Northrop Grumman Corp NOC 233 331 467 337 460
Novell Inc NOVL - - - - -
Novellus Systems Inc NVLS - - - - -
Nucor Corp NUE - - - - -
Nvidia Corp NVDA - - - - -
Occidental Petroleum Corp OXY (19) (22) (15) (14) (4)
Office Depot Inc ODP - - - - -
Omnicom Group OMC - - - - -
Oracle Corp ORCL - - - - -
Paccar Inc PCAR (33) (32) (29) (26) (26)
Pactiv Corp PTV 37 59 96 113 108
Pall Corp PLL (13) (12) (11) (8) (9)
Palm Inc PALM - - - - -
Parametric Technology Corp PMTC (3) (3) (2) (2) (2)
Parker-Hannifin Corp PH (61) (42) (24) (25) 17
Paychex Inc PAYX - - - - -
Penney (J C) Co JCP (102) (232) (347) - -
Peoples Energy Corp PGL 3 4 6 20 38
Peoplesoft Inc PSFT - - - - -
Pepsi Bottling Group Inc PBG (34) (34) (24) (22) (25)
Pepsico Inc PEP (296) (226) (106) (83) (89)
Perkinelmer Inc PKI (9) (7) (4) (2) (5)
Pfizer Inc PFE (307) (276) (168) (169) (199)
PG&E Corp PCG (162) (184) (40) 125 308
Pharmacia Corp PHA (131) (141) (119) (73) (96)
Phelps Dodge Corp PD (7) (5) 1 13 1
Philip Morris Cos Inc MO (127) (6) 79 138 213
Phillips Petroleum Co P (101) (98) (80) (79) (31)
Pinnacle West Capital PNW (43) (49) (19) (12) (3)
Pitney Bowes Inc PBI (14) (2) 8 1 2
Plum Creek Timber Co Inc PCL (1) (3) (5) (3) (1)
PMC-Sierra Inc PMCS - - - - -
PNC Financial Svcs Group Inc PNC (26) (12) 6 (2) (6)
Power-One Inc PWER - - - - -
PPG Industries Inc PPG (104) (110) (16) 53 86
PPL Corp PPL 35 41 63 57 8
Praxair Inc PX (23) (23) (16) (9) (7)
Price (T. Rowe) Group TROW - - - - -
Principal Financial Grp Inc PFG (20) (15) (2) 33 11
Procter & Gamble Co PG (167) (175) (159) (141) (155)
Progress Energy Inc PGN (32) (35) 17 47 15
Progressive Corp-Ohio PGR - - - - -

The Magic of Pension Accounting 27 September 2002
118
Ticker Pension Cost—Income/(Expense)
Company Name Symbol 2004E 2003E 2002E 2001A 2000A
Providian Financial Corp PVN - - - - -
Prudential Financial Inc PRU 179 289 338 457 362
Public Service Entrp PEG (153) (174) (98) (58) (35)
Pulte Homes Inc PHM - - - - -
Qlogic Corp QLGC - - - - -
Qualcomm Inc QCOM - - - - -
Quintiles Transnational Corp QTRN - - - - -
Qwest Communication Intl Inc Q 81 139 180 360 319
Radioshack Corp RSH - - - - -
Rational Software Corp RATL - - - - -
Raytheon Co RTN (144) (52) 92 286 186
Reebok International Ltd RBK - - - - -
Regions Finl Corp RF (17) (18) (9) (1) 1
Reliant Energy Inc REI (73) (85) (40) (41) 37
Robert Half Intl Inc RHI - - - - -
Rockwell Automation ROK 146 84 33 (10) (27)
Rockwell Collins Inc COL (18) (12) (1) 5 (5)
Rohm & Haas Co ROH (11) 2 23 50 49
Rowan Cos Inc RDC (14) (16) (10) (5) (4)
Ryder System Inc R (47) (49) (18) 4 44
Sabre Hldgs Corp-Cl A TSG (12) (11) (8) (13) (15)
Safeco Corp SAFC (5) (10) (15) (5) -
Safeway Inc SWY (65) (69) (21) 27 77
Sanmina-Sci Corp SANM - - - - -
Sara Lee Corp SLE (143) (157) (71) (44) (48)
SBC Communications Inc SBC 308 659 1,010 1,450 1,145
Schering-Plough SGP (35) (15) 2 1 2
Schlumberger Ltd SLB 93 105 121 (44) (8)
Schwab (Charles) Corp SCH (7) (6) (4) 12 10
Scientific-Atlanta Inc SFA (6) (6) (5) (4) (1)
Sealed Air Corp SEE (4) (7) (10) (2) -
Sears Roebuck & Co S (125) (135) (113) (68) (116)
Sempra Energy SRE (5) 13 46 15 49
Sherwin-Williams Co SHW 22 19 32 29 30
Siebel Systems Inc SEBL - - - - -
Sigma-Aldrich SIAL (8) (8) (3) (3) (2)
Simon Property Group Inc SPG - - - - -
SLM Corp SLM (8) (7) (1) (1) 1
Snap-On Inc SNA (10) (5) 0 6 8
Solectron Corp SLR - - - - -
Southern Co SO 54 66 119 124 130
Southtrust Corp SOTR (16) (16) (13) (12) (8)
Southwest Airlines LUV - - - - -
Sprint Fon Group FON 81 108 141 66 122
Sprint Pcs Group PCS - - - (18) -
St Jude Medical Inc STJ - - - - -
St Paul Cos SPC (47) (47) (10) 7 42
Stanley Works SWK 8 10 12 43 18
Staples Inc SPLS - - - - -
Starbucks Corp SBUX - - - - -
Starwood Hotels & Resorts Wrld HOT (5) (9) (11) 15 9
State Street Corp STT (47) (48) (44) (36) (27)
Stilwell Finl Inc SV - - - - -
Stryker Corp SYK (6) (6) (5) (5) (4)

The Magic of Pension Accounting 27 September 2002
119
Ticker Pension Cost—Income/(Expense)
Company Name Symbol 2004E 2003E 2002E 2001A 2000A
Sun Microsystems Inc SUNW - - - - -
Sungard Data Systems Inc SDS - - - - -
Sunoco Inc SUN (25) (20) (14) (5) (14)
Suntrust Banks Inc STI (54) (55) (15) (8) 4
Supervalu Inc SVU (30) (33) (17) (7) (6)
Symbol Technologies SBL (2) (2) (2) (3) (2)
Synovus Financial Cp SNV - - - - -
Sysco Corp SYY (60) (64) (44) (30) (30)
Target Corp TGT (60) (55) (34) (32) (38)
Teco Energy Inc TE (1) 1 8 9 8
Tektronix Inc TEK (2) 0 8 8 12
Tellabs Inc TLAB - - - - -
Temple-Inland Inc TIN (25) (25) (4) 18 9
Tenet Healthcare Corp THC - - - - -
Teradyne Inc TER (11) (12) (10) (10) (8)
Texas Instruments Inc TXN (130) (134) (122) (85) (84)
Textron Inc TXT (22) 4 39 96 84
Thermo Electron Corp TMO (2) (2) (2) (2) (0)
Thomas & Betts Corp TNB (11) (11) (8) (7) 0
Tiffany & Co TIF (7) (7) (6) (7) (5)
TJX Companies Inc TJX (23) (25) (17) (16) (9)
TMP Worldwide Inc TMPW - - - - -
Torchmark Corp TMK (4) (4) (3) (3) (3)
Toys R Us Inc TOY - - - - -
Transocean Inc RIG (16) (18) (15) (10) (9)
Tribune Co TRB 23 42 64 4 61
TRW Inc TRW (74) (7) 106 172 177
Tupperware Corp TUP (6) (7) (7) (5) (5)
TXU Corp TXU (62) (65) (41) 16 23
Tyco International Ltd TYC (78) (49) (16) 26 (24)
U S Bancorp USB (179) (102) (6) 65 39
Union Pacific Corp UNP (28) (28) (12) 23 27
Union Planters Corp UPC - - - - -
Unisys Corp UIS 89 146 173 170 139
United Parcel Service Inc UPS (30) (9) 25 30 (71)
United States Steel Corp X 7 78 114 120 273
United Technologies Corp UTX (190) (163) (79) (78) (40)
Unitedhealth Group Inc UNH - - - - -
Univision Communications Inc UVN - - - - -
Unocal Corp UCL (20) (22) (13) 1 19
Unumprovident Corp UNM (12) (14) 1 17 165
UST Inc UST (16) (17) (14) (13) (8)
Veritas Software Co VRTS - - - - -
Verizon Communications VZ 1,101 1,337 1,759 1,848 3,489
VF Corp VFC (44) (48) (28) (20) (15)
Viacom Inc -Cl B VIA.B (61) (61) (48) (26) (1)
Visteon Corp VC (78) (73) (49) (143) (134)
Vitesse Semiconductor Corp VTSS - - - - -
Vulcan Materials Co VMC (6) (2) 6 9 5
Wachovia Corp WB (201) (220) (98) (2) (88)
Walgreen Co WAG - - - - -
Wal-Mart Stores WMT - - - - -
Washington Mutual Inc WM (85) (58) (25) (24) -
Waste Management Inc WMI (13) (9) (4) (2) (24)

The Magic of Pension Accounting 27 September 2002
120
Ticker Pension Cost—Income/(Expense)
Company Name Symbol 2004E 2003E 2002E 2001A 2000A
Waters Corp WAT (4) (3) (3) (3) (2)
Watson Pharmaceuticals Inc WPI - - - - -
Wellpoint Hlth Netwrk-Cl A WLP (13) (11) (7) (12) (8)
Wells Fargo & Co WFC (223) (238) (135) 49 (49)
Wendy's International Inc WEN (5) (4) (3) (2) 1
Weyerhaeuser Co WY 131 140 176 234 193
Whirlpool Corp WHR (48) (27) 17 70 98
Williams Cos Inc WMB (24) (23) (8) (12) (26)
Winn-Dixie Stores Inc WIN - - - - -
Worthington Industries WOR (1) (1) (1) (1) (1)
Wrigley (Wm) Jr Co WWY (13) (13) (8) (9) (5)
Wyeth WYE (101) (99) (66) (75) (45)
Xcel Energy Inc XEL 60 85 132 77 61
Xerox Corp XRX (102) (80) (40) (99) (44)
Xilinx Inc XLNX - - - - -
Xl Capital Ltd XL - - - - -
Yahoo Inc YHOO - - - - -
Yum Brands Inc YUM (26) (27) (21) (21) (19)
Zimmer Hldgs Inc ZMH (3) (3) (3) (3) -
Zions Bancorporation ZION (13) (14) (9) (6) (2)
Totals (18,610) (14,643) (613) $7,121 $12,619
Source: Company data, CSFB estimates.

The Magic of Pension Accounting 27 September 2002
121
Appendix EIn this Appendix, we walk through the process of treating the pension plan as if it werean investment subsidiary by adding the pension plan assets and the PBO to the balancesheet of Philip Morris. Philip Morris has both U.S. and non-U.S. plans that we havecombined for our analysis. Note that at the end of 2001, the pension plan for PhilipMorris had a projected benefit obligation of $12.2 billion and plan assets of $11.7 billion,and it was $502 million underfunded. However, the balance sheet reflected a $1.3 billionpension asset, the result of $1.8 billion in losses that have not yet been recognized. Inour analysis, we eliminate the $1.3 billion net pension asset and replace it with assets of$11.7 billion and liabilities of $12.2 billion.
Exhibit 98: Adjusting the Balance Sheet—Philip Morris
US$ in millions
Pension “Real” PensionFootnote Asset/(Liability)
2001 2001Plan Assets $ 11,720 (3) Pension Asset $ 11,720Projected Benefit Obligation (PBO) (12,222) (4) Pension Liability (12,222)Funded Status (502)
Unrecognized actuarial loss 1,539Unrecognized prior service cost 256Unrecognized transition obligation 6Total Unrecognized Loss 1,801
Prepaid Pension Asset 2,700 (1)Accrued Pension Liability (1,400) (2)Net Prepaid Pension Asset $ 1,300
Adjustments (Ignoring Taxes) Assets Liabilities EquityIncrease/(Decrease) Increase/(Decrease) Increase/(Decrease)
(1) Eliminate prepaid pension asset (2,700) (2,700)(2) Eliminate accrued pension liability (1,400) 1,400(3) Report pension plan assets 11,720 11,720(4) Report PBO 12,222 (12,222)
Off Balance Sheet 9,020 10,822 (1,802)
Source: Company data, CSFB estimates.
The specific adjustments (ignoring income taxes) that we make to “get the balancesheet right” are:
1. Reduce assets by $2.7 billion and equity by $2.7 billion, eliminating the prepaidpension asset.
2. Reduce liabilities by $1.4 billion and increase equity by $1.4 billion to eliminate theaccrued pension liability.
3. Increase assets by $11.7 billion and equity by $11.7 billion to recognize the pensionplan assets.
4. Increase liabilities by $12.2 billion and reduce equity by $11.7 billion to report theprojected benefit obligation.

The Magic of Pension Accounting 27 September 2002
122
Appendix FIn this Appendix, we walk through the process of stripping out the smoothingmechanisms from pension accounting and reporting on the income statement whatactually happened to the pension plan, using Verizon Communications as an example.Exhibit 99 compares the components of net pension income for Verizon with ourcalculation of Verizon’s “real” pension expense for 2001. The service cost and theinterest cost remain the same; the expected return on plan assets and amortizationamounts are eliminated. In their place are the actual loss on plan assets of $3.1 billionand the actuarial loss on the projected benefit obligation of $1.9 billion, both obtainedfrom the pension footnote. The result is an $8.1 billion pension expense, compared with$2,690 million of pension income that Verizon reported in its income statement. Forpurposes of our analysis, we ignored settlement gains and losses and prior service cost;we generally think of these items as nonrecurring charges that we would record in thecurrent period and ignore when evaluating the current-period results. Clearly, whenforecasting future results, we would take them into account in our estimates, as they willhave an impact on the future retirement benefits that the employees will earn.
Exhibit 99: Calculating the “Real” Pension Expense—VerizonPension "Real" Pension
Footnote Expense / (Income)
2001 2001
Service Cost $ 665 Service Cost $ 665
Interest Cost 2,490 Interest Cost 2,490
Expected Return on Plan Assets (4,811) Actual (Gain)/Loss on Plan Assets 3,063
Amortization of Transition Asset (112) Actuarial (Gain)/Loss on PBO 1,888
Amortization of Prior Service Cost (44)
Actuarial gain, net (878)
Net Pension Expense / (Income) $ (2,690) Net Pension Expense / (Income) $ 8,106
Source: Company data, CSFB estimates.

The Magic of Pension Accounting 27 September 2002
123
Appendix G
Reporting the Funded Status on the Balance SheetSince pension accounting presents information on a net basis and the argument that thepension plan assets can only be used to support the pension obligation is a valid one,we present a second methodology in this Appendix for adjusting the balance sheet on anet basis.
Here we view an overfunded pension plan as an asset for the sponsoring company, onethat is difficult to monetize; however, still an asset. Capital that would have beenallocated to the pension plan can now be put to other uses: reinvestment, sharerepurchases, debt paydown, etc. On the other hand, an underfunded plan can beconsidered a liability that will result in increased future contributions to the pension planfrom the company, drawing capital away from other parts of the business.
The pension footnote reconciles the funded status to the prepaid pension asset oraccrued pension liability on the balance sheet. The difference between the two is eitheran unrecognized gain or an unrecognized loss. These are the actual changes in thepension plan’s funded status that have not yet been reported in the financial statements,as a result of all the smoothing mechanisms in FAS No. 87. Therefore, the amountreported on the balance sheet does not reflect the economic status of the pension plan.For example, IBM’s balance sheet as of December 31, 2001, reflected a net prepaidpension asset of approximately $8 billion; however, IBM’s pension plan was only $786million overfunded. Unrecognized losses caused IBM’s assets to be overstated by over$7 billion. The concept, that an unrecognized loss can create an asset, leaves manyinvestors dumbfounded.
Unrecognized gains are an improvement in the funded status of the pension plan thathas yet to be recognized in the financial statements. Unrecognized losses are a declinein the funded status that has not yet made its way to the balance sheet. (A word ofcaution: Unrecognized losses can be partially recognized on the balance sheet by wayof the minimum pension liability adjustment. They are still referred to as unrecognized,as they have not yet made their way through earnings.) Exhibit 100 displays the variousways in which a company ends up with an unrecognized gain or loss.

The Magic of Pension Accounting 27 September 2002
124
Exhibit 100: How Companies End up with Unrecognized Gains or Losses
Funded Status
Net Pension Asset orLiability Recognized onBalance Sheet
Unrecognized Gain orLoss
Overfunded Accrued Pension Liability = Unrecognized Gain
Overfunded > Prepaid Pension Asset = Unrecognized Gain
Overfunded < Prepaid Pension Asset = Unrecognized Loss
Underfunded > Accrued Pension Liability = Unrecognized Loss
Underfunded < Accrued Pension Liability = Unrecognized Gain
Underfunded Prepaid Pension Asset = Unrecognized Loss
To report the funded status on the balance sheet, we simply remove the prepaidpension asset or accrued pension liability and replace it with the pension plan’s fundedstatus. We applied this methodology to each of the 360 companies in the S&P 500 witha defined benefit pension plan (taking into account the tax impact). The impact in theaggregate on assets and liabilities is minimal. Shareholders’ equity for the S&P 500 isreduced by $60 billion or 2% at the end of 2001.
Key Observations
• Assets would decline by 5% or more for 15 companies if the funded status werereported on the balance sheet
• There are 44 companies where assets would increase and 264 that would experiencea decline in assets at the end of 2001, compared with 166 and 141 companies,respectively, at the end of 2000.
• If the underfunded amount were considered the equivalent of debt, debt wouldincrease by 10% or more for 75 companies. Debt would increase by 25% or more for28 companies, including the 11 companies that had over $1 billion in debtoutstanding.
• The aggregate debt-to-equity ratio for the companies in the S&P 500 was 212% at theend of 2001 and 207% at the close of 2000. Calculating an adjusted to debt-to-equityratio after factoring in the funded status of the pension plan would take the ratio up to218% for 2001 and down to 202% for 2000.
• There are 96 companies where the debt-to-equity ratio would increase by over 1,000basis points, compared with 8 companies where the debt-to-equity ratio would declineby over 1,000 basis points

The Magic of Pension Accounting 27 September 2002
125
Appendix HIn this appendix, we briefly walk through the mechanics of our pension-forecastingmodel, using Lucent Technologies as an example. We have made the individualcompany model available on our web site (http://www.csfb.com/equity/presentations/pension_forecast_model.xls). Please do not hesitate to give us a call if you have anyquestions while making your way through the model. We recommend customizing themodel to your own set of assumptions and using it to perform sensitivity analysis. Due toall of the simplifying assumptions that we make in the model, actual pension results mayvary considerably from our forecasts. The purpose of the model is to highlight potentialareas for further investigation.
AssumptionsWe made the following assumptions in our base case forecast.
Exhibit 101: Model AssumptionsAssumptions: 2000 2001 2002 2003 2004
Discount rate 7.50% 7.00% 6.50% 6.75% 7.00%
Expected rate of return 9.00% 9.00% 9.00% 9.00% 9.00%
Compensation inflation 4.50% 4.50% 4.50% 4.50% 4.50%
Plan Assets Mix
Equity – 65% (18.85%) 10.00% 10.00%
Fixed Income – 35% 8.00% 5.50% 5.50%
Actual return 23.84% (15.09%) (9.45%) 8.43% 8.43%
Employee contribution growth 3.00% 3.00% 3.00%
Inflation assumption 3.00% 3.00% 3.00%
Duration - actives 15 15 15
Duration - retirees 8 8 8
Source: Company data, CSFB estimates.
Forecast Net Pension CostOur forecast of Lucent’s net pension cost for the next three years is included in Exhibit102.
Exhibit 102: Forecasting Net Pension Cost—Lucent Technologies
US$ in millions
Actual Estimate
2000 2001 2002 2003 2004
Pension Cost / (Income)
Service cost $ 478 $ 316 $ 349 $ 386 $ 383
Interest cost 1,915 1,926 1,989 1,904 1,879
Expected return on plan assets (3,229) (3,373) (3,278) (3,183) (3,059)
Amortization of transition (asset) / liability (300) (222) (103) - -
Amortization of prior service cost / (benefit) 362 326 291 291 291
Recognized actuarial (gain) / loss (197) (387) (22) - -
Net pension cost / (income) (971) (1,414) (775) (603) (507)
Curtailments, settlements and other - 2,504 - - -
Total pension cost / (income) $ (971) $ 1,090 $ (775) $ (603) $ (507)
Source: Company data, CSFB estimates.

The Magic of Pension Accounting 27 September 2002
126
The calculations for each component of our 2002 net pension cost estimate are asfollows (US$ in millions, unless otherwise stated):
Service Cost = Prior Year Service Cost x (1 + Inflation Assumption + % Change Due toChange in Discount Rate) = $316 x (1 + 3% + 7.5%) = $349. Note that we are not usingthe salary inflation assumption to inflate forecasted service cost since we are assumingthat the employee population remains in a steady state.
Interest Cost = (Beginning Projected Benefit Obligation (PBO) – (.5 x Estimated BenefitsPaid)) x Prior Year Discount Rate = ($29,850 – (.5 x $2,872)) x 7% = $1,989.
Expected Return on Plan Assets = (Market-Related Value of Plan Assets – (.5 xEstimated Benefits Paid)) x Expected Rate of Return on Plan Assets = ($37,863 – (.5 x$2,872)) x 9% = $(3,278).
Our market-related value is either the fair value of the plan assets or a calculated value(calculated in accordance with Illustration 4 from Appendix B of FAS No. 87). Thedetermination is based upon a comparison of the estimated market-related value fromthe prior two years to the fair value of plan assets. If the market-related value is within5% of the fair value in both years we use the fair value, if not we default to thecalculated value.
Amortization of Transition (Asset) = Min (Prior Year Transition Amortization,Unrecognized Transition Asset) = Min ($222, $103) = $(103).
Amortization of Prior Service Cost = (Prior Year Amortization + Amortization of PriorService Cost Arising During Year) = $326 + $(35) = $291.
Recognized Actuarial (Gain) = ((Prior Year Unrecognized Gain/(Loss) – UnrecognizedMarket-Related Value) – Corridor) / Estimated Service Life of Active Employees =(($(1,790) - $2,324) - $3,786)) / 15 = $(22).
Curtailments, Settlements, Other—Not forecasted.
Forecast Projected Benefit ObligationOur forecast of Lucent’s projected benefit obligation for the next three years is includedin Exhibit 103.
Exhibit 103: Forecast Projected Benefit Obligation—Lucent TechnologiesUS$ in millions
Actual Estimate
2000 2001 2002 2003 2004
Change in Benefit Obligation
Benefit obligation at beginning of year $ 27,401 $ 26,113 $ 29,850 $ 30,775 $ 29,355
Service cost 478 316 349 386 383
Interest cost 1,915 1,926 1,989 1,904 1,879
Employee contribution - - - - -
Amendments (1) 9 - - -
Actuarial (gain)/loss 370 1,434 1,458 (752) (717)
Benefits paid (2,294) (2,788) (2,872) (2,958) (3,047)
Net acquisitions / divestitures (1,756) 174 - - -
Curtailments, settlements, terminations and other - 2,666 - - -
Benefit obligation at end of year $ 26,113 $ 29,850 $ 30,775 $ 29,355 $ 27,853
Source: Company data, CSFB estimates.

The Magic of Pension Accounting 27 September 2002
127
Next, we take you through the calculations to forecast the projected benefit obligationfor 2002 (US$ in millions, unless otherwise stated):
Service Cost = Net pension cost forecast above.
Interest Cost = Net pension cost forecast above.
Employee Contributions = Prior Year Employee Contributions x (1 + EmployeeContribution Growth Rate) = $0 x (1 + 3%) = $0.
Amendments = Not forecasted.
Actuarial (Gain)/Loss = (Estimated Obligation to Retirees x % Change Due to Change inDiscount Rate) + (Estimated Obligation to Active Employees x % Change Due toChange in Discount Rate) = ($22,995 x 4%) + ($7,780 x 7.5%) = $1,458.
We estimate the obligation to retirees by multiplying the prior year benefits paid by theestimated duration of the obligation associated with retirees, eight years. The estimatedobligation to actives is simply the total PBO less the estimated obligation to retirees. Thepercentage change due to changes in the discount rate is simply the change in thediscount rate multiplied by the estimated duration, 8 years for retirees and 15 years foractives.
Benefits Paid = Prior Year Benefits Paid x (1 + Inflation Assumption) = $(2,788) x (1 +3%) = $(2,872).
Net Acquisitions/Divestitures = Not forecasted.
Curtailments/Settlements/Terminations/Other = Not forecasted.
Forecast Plan AssetsOur forecast of Lucent’s pension plan assets for the next three years is included inExhibit 104.
Exhibit 104: Forecast Plan Assets—Lucent TechnologiesUS$ in millions
Actual Estimate
2000 2001 2002 2003 2004
Change in Plan Assets
Fair value of plan assets at beginningof year
$ 41,067 $ 45,262 $ 35,539 $ 29,308 $ 28,819
Actual return on plan assets 9,791 (6,830) (3,359) 2,469 2,428
Company contribution 19 25 - - -
Employee contribution - - - - -
Benefits paid (2,294) (2,788) (2,872) (2,958) (3,047)
Net acquisitions / divestitures (2,984) 259
Settlements and other (337) (389)
Fair value of plan assets at end of year $ 45,262 $ 35,539 $ 29,308 $ 28,819 $ 28,201
Source: Company data, CSFB estimates.
Next, we take you through the calculations to forecast the plan assets at the end of2002 (US$ in millions, unless otherwise stated):
Actual Return on Plan Assets = Beginning Plan Assets x (Estimated Actual Rate ofReturn on Plan Assets) = $35,539 x (9.45%) = $(3,359).

The Magic of Pension Accounting 27 September 2002
128
Company Contributions = Forecasted in next section.
Employee Contributions = Prior Year Employee Contributions x (1 + EmployeeContribution Growth Rate) = $0 x (1 + 3%) = $0.
Benefits Paid = Prior Year Benefits Paid x (1 + Inflation Assumption) = $(2,788) x (1 +3%) = $(2,872).
Net Acquisitions/Divestitures = Not forecasted.
Settlements and Other = Not forecasted.
Forecast Contribution Requirements
We expect that our result will differ from the company’s actual funding requirement dueto a number of simplifying assumptions that we make. For example, we use the fairvalue of pension plan assets; the funding requirements allow for a variety of differentmethods to calculate asset values. We start with a projected benefit obligation that usesa different discount rate and adjust to the various pension obligations for fundingpurposes. We also do not factor in the credit balance that the company may haveaccumulated to offset any contribution requirements. The largest discrepancy will resultfrom our combining both U.S. and non-U.S. plans to determine the contributions. Thecontribution requirements that we described earlier only apply to U.S. plans. Thefunding requirements overseas can be very different. We also include nonqualified plansthat would not be subject to these rules.
Minimum Contribution Requirement
Step 1—Estimate PBO for Minimum Funding Purposes = (Estimated Obligation toRetirees x (1+ % Change Due to Change in Discount Rate)) + (Estimated Obligation toActive Employees x (1 + % Change Due to Change in Discount Rate)) = ($22,995 x (1 +(20%))) + ($7,780 x (1 + (37.5%))) = $23,258.
Change in the discount rate is the result of using the expected return on assets as thediscount rate to calculate the PBO for the minimum funding requirement.
Step 2—Determine Funded Status Using Funding PBO = Estimated Fair Value of PlanAssets – Funding PBO = $29,308 - $23,258 = $6,050 overfunded.
Step 3—If overfunded, stop; no minimum contribution required. If underfunded proceedto Step 4
Step 4—Estimate Minimum Funding Requirement = (Unfunded PBO / AmortizationPeriod) + Service Cost = To simplify for the various amortization periods available weassume a 10-year straight-line amortization period.
Additional Funding Requirement
Step 1—Estimate Accumulated Benefit Obligation (ABO) for Additional FundingPurposes = (Estimated ABO to Retirees x (1+ % Change Due to Change in DiscountRate)) + (Estimated ABO to Active Employees x (1 + % Change Due to Change inDiscount Rate)) = ($22,995 x (1 + (0.80%))) + ($5,865 x (1 + (1.50%))) = $28,587
We walk through our estimate of the accounting ABO in the minimum pension liabilitysection below. The change in discount rate is the result of using the four year weighted

The Magic of Pension Accounting 27 September 2002
129
average yield on the 30-year U.S. long bond multiplied by 120% as the discount rate tocalculate the ABO for the additional funding requirement.
Step 2—Calculate Percentage of ABO Funded = Estimated Fair Value of Plan Assets /Funding ABO = $29,308 / $28,587 = 103% overfunded.
Step 3—If over 90% funded, stop; no additional contribution required. If less than 90%funded, proceed to Step 4.
Step 4—If over 80% funded, then determine whether over 90% funded in either of twoprevious years. If yes, then no additional contribution required; if no, then proceed toStep 5.
Step 5—Determine Funded Status Using Funding ABO = Estimated Fair Value of PlanAssets – Funding ABO = $29,308 - $28,587 = $721 overfunded.
Step 6—Estimate Additional Funding Requirement = Unfunded ABO x Amortization %
Amortization % = 30% – ((% of ABO Funded – 60%) x 40%). Note if percentage of ABOfunded is less than 60%, then use 30% for the amortization %. We did not make thispart up; it comes to us courtesy of Section 412 from the tax code.
Total Required Contribution = Max (Minimum Contribution Requirement, AdditionalFunding Requirement) = Max (0,0) = We estimate no contribution required for Lucent in2002.
Forecast PBGC Variable Premium
If no contribution is required, then the company does not have to pay a variablepremium to the PBGC. We take you through the steps that we use to estimate thepotential PBGC variable premium in our model.
Step 1—Estimate ABO for PBGC Variable Premium = (Estimated ABO to Retirees x (1+ % Change Due to Change in Discount Rate)) + (Estimated ABO to Active Employeesx (1 + % Change Due to Change in Discount Rate)) = ($22,995 x (1 + 8%)) + ($5,865 x(1 + 15%) = $31,579.
We walk through our estimate of the accounting ABO in the minimum pension liabilitysection below. The change in discount rate is the result of using the yield on the 30-yearU.S. long bond multiplied by 100% as the discount rate to calculate the ABO whenforecasting the PBGC variable premium.
Step 2—Estimate Vested Benefit Obligation (VBO) for PBGC Variable Premium =Estimated PBGC ABO x 90% = $31,579 x 90% = $28,421.
We use 90% as an actuarial rule of thumb to get us from our estimated ABO to anestimate of the vested benefit obligation.
Step 3—Determine Funded Status Using PBGC VBO = Estimated Fair Value of PlanAssets – PBGC VBO = $29,308 - $28,421 = $887 overfunded.
Step 4—If overfunded, stop; no PBGC variable premium required. If underfunded,proceed to Step 4.
Step 5—Estimate PBGC Variable Premium = Amount Underfunded x 0.9% = Thevariable premium is $9 per each $1,000 that the plan is underfunded.

The Magic of Pension Accounting 27 September 2002
130
Forecast Minimum Pension Liability(US$ in millions, unless otherwise stated)
Using a few actuarial rules of thumb, we estimate the ABO at the end of 2002 (ingeneral we reduce the PBO by approximately 25%) for each company in the S&P 500,then compare it with our estimate of the plan assets to arrive at the minimum pensionliability. Taking into account the minimum liability adjustments from prior years, priorservice cost, and any remaining transition obligation, we arrive at an estimate of theafter-tax charge to equity that companies might have to make at the end of 2002 basedon the assumptions that we described above.
Step 1—Estimate the Accumulated Benefit Obligation (ABO) = Obligation to Actives x (1– Actuarial Rule of Thumb%) + Obligation to Retirees = $7,780 x (1 – 25%) + $22,995 =$28,859.
Step 2—Determine Funded Status Using ABO = Estimated Fair Value of Plan Assets –ABO = $29,308 - $28,859 = $449 overfunded.
Step 3—Calculate Minimum Pension Liability. If overfunded, stop; no additionaladjustment necessary. If underfunded, the amount underfunded is the minimum pensionliability (MPL); proceed to Step 4.
Step 4—Compare MPL to net prepaid (accrued) on balance sheet. If net accrued isgreater than MPL, stop; no additional adjustment is necessary. If net prepaid, or if netaccrued, is less than MPL, proceed to Step 5.
Step 5—Calculate Additional Pension Liability Adjustment. Difference between MPL andnet prepaid/(accrued) is the additional pension liability (APL) adjustment.
Step 6—If APL is less than unrecognized prior service cost and the transition obligation,report the additional liability and an intangible asset. Otherwise proceed to Step 7.
Step 7—APL in excess of unrecognized prior service cost and the transition obligation isreported as a liability, and we tax effect that amount using a 35% tax rate to arrive at anestimate of the charge to shareholders’ equity in accumulated other comprehensiveincome.

The Magic of Pension Accounting 27 September 2002
131
Appendix I
Exhibit 105:Off-Balance-Sheet Assets and Liabilities for the S&P 500US$ in millions
2001 Off-Balance-Sheet Amounts
Company NameTickerSymbol
Pension PlanAssets
On-Balance-Sheet
Asset 1Off-BalanceSheet Asset PBO
On-Balance Sheet
Liability 2Off-Balance-Sheet
Liability3m Co MMM $8,008 $537 $7,471 $8,998 $473 $8,525
Abbott Laboratories ABT 2,644 0 2,644 3,241 287 2,954
Ace Limited ACE 0 0 0 0 0 0
ADC Telecommunications Inc ADCT 0 0 0 0 0 0
Adobe Systems Inc. ADBE 0 0 0 0 0 0
Advanced Micro Devices AMD 0 0 0 0 0 0
AES Corp. (The) AES 604 0 604 869 210 659
Aetna Inc AET 3,302 201 3,101 3,581 0 3,581
AFLAC Inc AFL 88 0 88 148 20 128
Agilent Technologies Inc A 1,197 107 1,090 1,523 114 1,409
Air Products & Chemicals Inc APD 1,091 117 973 1,476 293 1,183
Alberto-Culver Co-Cl B ACV 0 0 0 0 0 0
Albertsons Inc ABS 466 92 374 567 166 401
Alcoa Inc AA 8,434 552 7,882 8,488 568 7,920
Allegheny Energy Inc AYE 762 32 730 811 0 811
Allegheny Technologies Inc ATI 2,012 633 1,379 1,816 36 1,780
Allergan Inc AGN 186 0 186 251 7 244
Allied Waste Inds Inc AW 305 100 205 270 0 270
Allstate Corp ALL 2,532 410 2,122 3,225 151 3,074
Alltel Corp AT 711 95 616 672 38 634
Altera Corp ALTR 0 0 0 0 0 0
Ambac Financial Gp ABK 13 0 13 14 1 14
Amerada Hess Corp AHC 495 0 495 623 47 576
Ameren Corp AEE 1,225 0 1,225 1,418 88 1,330
American Electric Power AEP 4,510 271 4,239 4,391 67 4,324
American Express AXP 1,190 18 1,172 1,541 359 1,182
American Greetings-Cl A AM 82 0 82 85 11 74
American International Group AIG 2,385 616 1,769 2,787 630 2,157
American Pwr Cnvrsion APCC 0 0 0 0 0 0
American Standard Cos Inc ASD 712 107 606 1,068 371 697
Amerisourcebergen Corp ABC 51 2 50 85 17 68
Amgen Inc AMGN 0 0 0 0 0 0
AMR Corp/De AMR 5,482 286 5,196 7,422 663 6,759
Amsouth Bancorporation ASO 564 122 441 521 21 500
Anadarko Petroleum Corp APC 338 54 284 417 51 366
Analog Devices ADI 58 2 56 69 8 62
Andrew Corp ANDW 0 0 0 0 0 0
Anheuser-Busch Cos Inc BUD 1,834 232 1,602 2,051 0 2,051
Anthem Inc ATH 495 67 428 583 7 576
AOL Time Warner Inc AOL 1,463 132 1,331 1,725 50 1,675
AON Corp AOC 2,624 212 2,412 2,972 204 2,768
Apache Corp APA 0 0 0 0 0 0
Apollo Group Inc-Cl A APOL 0 0 0 0 0 0
Apple Computer Inc AAPL 0 0 0 0 0 0
Applera Corp Applied Biosys ABI 557 1 556 589 26 564
Applied Materials Inc AMAT 0 0 0 0 0 0
Applied Micro Circuits Corp AMCC 0 0 0 0 0 0
Archer-Daniels-Midland Co ADM 619 87 532 784 113 6711 Includes prepaid pension asset and intangible asset.2 Includes accrued liability and minimum pension liability.

The Magic of Pension Accounting 27 September 2002
132
2001 Off-Balance-Sheet Amounts
Company NameTickerSymbol
Pension PlanAssets
On-Balance-Sheet
Asset 1Off-BalanceSheet Asset PBO
On-Balance Sheet
Liability 2Off-Balance-Sheet
LiabilityAshland Inc ASH 518 6 512 818 144 674
AT&T Corp T 18,485 3,387 15,098 14,035 648 13,387
AT&T Wireless Services Inc AWE 0 0 0 0 0 0
Autodesk Inc ADSK 0 0 0 0 0 0
Automatic Data Processing ADP 469 133 336 383 0 383
Autozone Inc AZO 74 0 74 92 2 90
Avaya Inc AV 2,371 (170) 2,541 2,518 0 2,518
Avery Dennison Corp AVY 614 140 474 530 65 465
Avon Products AVP 717 168 549 999 231 769
Baker-Hughes Inc BHI 278 144 134 229 50 179
Ball Corp BLL 416 119 297 510 32 479
Bank Of America Corp BAC 8,264 2,080 6,184 8,135 381 7,754
Bank Of New York Co Inc BK 1,253 681 572 562 0 562
Bank One Corp ONE 2,747 630 2,117 2,297 0 2,297
Bard (C.R.) Inc BCR 112 6 106 129 0 129
Bausch & Lomb Inc BOL 215 5 210 264 31 234
Baxter International Inc BAX 1,530 320 1,210 1,692 142 1,550
BB&T Corp BBT 378 12 366 472 37 435
Bear Stearns Companies Inc BSC 0 0 0 0 0 0
Becton Dickinson & Co BDX 491 17 474 707 115 593
Bed Bath & Beyond Inc BBBY 0 0 0 0 0 0
Bellsouth Corp BLS 16,617 2,435 14,182 11,928 89 11,839
Bemis Co BMS 359 20 339 370 0 370
Best Buy Co Inc BBY 0 0 0 0 0 0
Big Lots Inc BLI 25 0 25 42 5 37
Biogen Inc BGEN 19 0 19 30 7 23
Biomet Inc BMET 0 0 0 0 0 0
BJ Services Co BJS 103 13 90 115 20 95
Black & Decker Corp BDK 1,177 406 771 1,221 113 1,108
Block H & R Inc HRB 0 0 0 0 0 0
BMC Software Inc BMC 0 0 0 0 0 0
Boeing Co BA 33,810 6,226 27,584 32,693 1,300 31,393
Boise Cascade Corp BCC 1,149 93 1,056 1,472 268 1,204
Boston Scientific Corp BSX 0 0 0 0 0 0
Bristol Myers Squibb BMY 3,508 666 2,842 3,914 314 3,600
Broadcom Corp -Cl A BRCM 0 0 0 0 0 0
Brown-Forman -Cl B BF.B 431 112 319 402 30 372
Brunswick Corp BC 711 129 582 821 101 719
Burlington Northern Santa Fe BNI 1,345 42 1,303 1,507 50 1,457
Burlington Resources Inc BR 155 0 155 181 4 177
Calpine Corp CPN 0 0 0 0 0 0
Campbell Soup Co CPB 1,621 396 1,225 1,499 0 1,499
Capital One Finl Corp COF 0 0 0 0 0 0
Cardinal Health Inc CAH 58 0 58 105 26 79
Carnival Corp CCL 0 0 0 0 0 0
Caterpillar Inc CAT 8,481 1,262 7,219 8,611 745 7,866
Cendant Corp CD 306 0 306 402 0 402
Centex Corp CTX 0 0 0 0 0 0
Centurytel Inc CTL 283 42 241 271 0 271
Charter One Finl Inc CF 0 0 0 0 0 0
Chevrontexaco Corp CVX 5,947 1,164 4,783 7,028 863 6,165
Chiron Corp CHIR 0 0 0 9 8 2
Chubb Corp CB 539 0 539 665 111 554
Ciena Corp CIEN 0 0 0 0 0 01 Includes prepaid pension asset and intangible asset.2 Includes accrued liability and minimum pension liability.

The Magic of Pension Accounting 27 September 2002
133
2001 Off-Balance-Sheet Amounts
Company NameTickerSymbol
Pension PlanAssets
On-Balance-Sheet
Asset 1Off-BalanceSheet Asset PBO
On-Balance Sheet
Liability 2Off-Balance-Sheet
LiabilityCigna Corp CI 2,500 0 2,500 2,932 263 2,669
Cincinnati Financial Corp CINF 147 5 142 106 0 106
Cinergy Corp CIN 875 0 875 1,084 261 822
Cintas Corp CTAS 0 0 0 0 0 0
Circuit City Str Crct Cty Gp CC 125 0 125 169 11 158
Cisco Systems Inc CSCO 0 0 0 0 0 0
Citigroup Inc C 10,323 1,623 8,700 10,388 955 9,433
Citizens Communications Co CZN 798 134 665 760 0 760
Citrix Systems Inc CTXS 0 0 0 0 0 0
Clear Channel Communications CCU 0 0 0 0 0 0
Clorox Co/De CLX 285 27 258 283 7 276
CMS Energy Corp CMS 845 0 845 1,268 114 1,154
Coca-Cola Co KO 1,492 166 1,326 1,906 387 1,519
Coca-Cola Enterprises CCE 1,117 145 972 1,478 289 1,189
Colgate-Palmolive Co CL 1,117 233 884 1,386 226 1,160
Comcast Corp-Cl A Spl CMCSK 0 0 0 0 0 0
Comerica Inc. CMA 609 74 535 693 0 693
Computer Associates Intl Inc CA 0 0 0 0 0 0
Computer Sciences Corp CSC 1,369 27 1,342 1,647 127 1,519
Compuware Corp CPWR 0 0 0 0 0 0
Comverse Technology Inc CMVT 0 0 0 0 0 0
Conagra Foods Inc CAG 1,644 0 1,644 1,576 194 1,382
Concord Efs Inc CEFT 0 0 0 0 0 0
Conoco Inc COC 1,185 70 1,115 1,715 266 1,449
Consolidated Edison Inc ED 6,634 675 5,959 5,904 40 5,864
Constellation Energy Grp Inc CEG 954 133 821 1,259 306 953
Convergys Corp CVG 170 0 170 210 28 182
Cooper Industries Ltd CBE 570 104 466 622 73 549
Cooper Tire & Rubber CTB 707 53 654 794 81 712
Coors (Adolph)-Cl B RKY 527 70 457 659 62 597
Corning Inc GLW 1,628 75 1,553 1,742 0 1,742
Costco Wholesale Corp COST 0 0 0 0 0 0
Countrywide Credit Ind Inc CCR 36 0 36 74 12 61
Crane Co CR 443 43 400 382 18 363
CSX Corp CSX 1,493 239 1,254 1,700 243 1,457
Cummins Inc CUM 1,684 168 1,516 2,064 285 1,779
CVS Corp CVS 218 0 218 283 67 216
Dana Corp DCN 2,283 138 2,145 2,549 299 2,250
Danaher Corp DHR 353 66 287 334 0 334
Darden Restaurants Inc DRI 120 46 74 97 3 95
Deere & Co DE 5,951 672 5,279 6,440 473 5,967
Dell Computer Corp DELL 0 0 0 0 0 0
Delphi Corp DPH 6,077 827 5,250 8,444 2,046 6,398
Delta Air Lines Inc DAL 8,304 19 8,285 10,657 438 10,219
Deluxe Corp DLX 0 0 0 0 0 0
Devon Energy Corp DVN 156 (8) 164 210 33 177
Dillards Inc-Cl A DDS 0 0 0 0 0 0
Disney (Walt) Co DIS 2,450 357 2,093 2,131 156 1,975
Dollar General Corp DG 0 0 0 0 0 0
Dominion Resources Inc D 3,352 1,523 1,829 2,593 89 2,504
Donnelley (R R) & Sons Co DNY 1,734 347 1,387 1,500 70 1,430
Dover Corp DOV 216 37 178 253 0 253
Dow Chemical DOW 11,424 833 10,591 11,341 768 10,573
Dow Jones & Co Inc DJ 0 0 0 0 0 01 Includes prepaid pension asset and intangible asset.2 Includes accrued liability and minimum pension liability.

The Magic of Pension Accounting 27 September 2002
134
2001 Off-Balance-Sheet Amounts
Company NameTickerSymbol
Pension PlanAssets
On-Balance-Sheet
Asset 1Off-BalanceSheet Asset PBO
On-Balance Sheet
Liability 2Off-Balance-Sheet
LiabilityDTE Energy Co DTE 2,183 435 1,748 2,219 0 2,219
Du Pont (E I) De Nemours DD 17,923 1,818 16,105 18,769 437 18,332
Duke Energy Corp DUK 2,470 313 2,157 2,528 0 2,528
Dynegy Inc DYN 584 174 410 524 5 519
Eastman Chemical Co EMN 697 0 697 1,062 343 719
Eastman Kodak Co EK 7,942 662 7,280 7,439 16 7,423
Eaton Corp ETN 1,836 437 1,399 1,856 121 1,735
Ebay Inc EBAY 0 0 0 0 0 0
Ecolab Inc ECL 311 0 311 397 6 391
Edison International EIX 2,768 267 2,501 2,400 0 2,400
El Paso Corp EP 2,479 761 1,718 1,966 0 1,966
Electronic Arts Inc ERTS 0 0 0 0 0 0
Electronic Data Systems Corp EDS 3,585 234 3,351 3,943 325 3,618
EMC Corp/Ma EMC 229 0 229 291 59 232
Emerson Electric Co EMR 2,046 432 1,614 2,030 0 2,030
Engelhard Corp EC 383 75 308 453 54 398
Entergy Corp ETR 1,687 0 1,687 1,720 67 1,653
EOG Resources Inc EOG 0 0 0 0 0 0
Equifax Inc EFX 413 86 328 392 0 392
Equity Office Properties Tr EOP 0 0 0 0 0 0
Equity Residential EQR 0 0 0 0 0 0
Exelon Corp EXC 6,279 0 6,279 7,101 334 6,767
Exxon Mobil Corp XOM 12,170 361 11,809 19,419 6,301 13,118
Family Dollar Stores FDO 0 0 0 0 0 0
Fannie Mae FNM 237 0 237 319 0 319
Federal Home Loan Mortg Corp FRE 139 0 139 179 34 145
Federated Dept Stores FD 1,480 236 1,244 1,577 135 1,442
Fedex Corp FDX 5,510 425 5,085 6,227 202 6,025
Fifth Third Bancorp FITB 264 90 175 263 47 216
First Data Corp FDC 733 0 733 823 19 803
First Tennessee Natl Corp FTN 273 76 197 221 0 221
Firstenergy Corp FE 3,484 247 3,237 3,548 0 3,548
Fiserv Inc FISV 0 0 0 0 0 0
Fleetboston Financial Corp FBF 2,304 649 1,655 2,152 182 1,970
Fluor Corp FLR 504 111 393 516 0 516
Ford Motor Co F 48,754 4,782 43,972 51,214 4,135 47,079
Forest Laboratories -Cl A FRX 0 0 0 0 0 0
Fortune Brands Inc FO 695 99 596 767 70 697
FPL Group Inc FPL 2,546 493 2,053 1,353 0 1,353
Franklin Resources Inc BEN 19 0 19 35 0 35
Freeprt Mcmor Cop&Gld -Cl B FCX 22 1 21 36 7 29
Gannett Co GCI 1,990 462 1,529 2,182 93 2,090
Gap Inc GPS 0 0 0 0 0 0
Gateway Inc GTW 0 0 0 0 0 0
General Dynamics Corp GD 6,107 503 5,604 5,162 0 5,162
General Electric Co GE 45,006 13,740 31,266 30,423 1,325 29,098
General Mills Inc GIS 2,671 1,001 1,670 2,100 50 2,050
General Motors Corp GM 73,662 13,758 59,904 86,333 10,822 75,511
Genuine Parts Co GPC 707 186 521 663 0 663
Genzyme Corp GENZ 0 0 0 0 0 0
Georgia-Pacific Corp GP 3,711 584 3,127 3,866 272 3,594
Gillette Co G 1,618 108 1,510 1,950 99 1,851
Golden West Financial Corp GDW 0 0 0 0 0 0
Goldman Sachs Group Inc GS 302 42 260 324 0 3241 Includes prepaid pension asset and intangible asset.2 Includes accrued liability and minimum pension liability.

The Magic of Pension Accounting 27 September 2002
135
2001 Off-Balance-Sheet Amounts
Company NameTickerSymbol
Pension PlanAssets
On-Balance-Sheet
Asset 1Off-BalanceSheet Asset PBO
On-Balance Sheet
Liability 2Off-Balance-Sheet
LiabilityGoodrich Corp GR 1,843 265 1,578 1,961 164 1,797
Goodyear Tire & Rubber Co GT 4,176 1,139 3,038 5,215 1,215 4,000
Grainger (W W) Inc GWW 0 0 0 0 0 0
Great Lakes Chemical Corp GLK 196 10 186 223 9 215
Guidant Corp GDT 61 18 43 57 0 57
Halliburton Co HAL 1,957 94 1,863 2,108 46 2,062
Hancock John Finl Svcs Inc JHF 2,293 540 1,753 2,010 232 1,778
Harley-Davidson Inc HDI 290 113 177 451 222 229
Harrahs Entertainment Inc HET 0 0 0 0 0 0
Hartford Finl Svcs Grp Inc HIG 1,711 0 1,711 2,108 85 2,023
Hasbro Inc HAS 179 0 179 203 10 193
Hca Inc HCA 0 0 0 0 0 0
Health Management Assoc HMA 0 0 0 0 0 0
Healthsouth Corp HRC 0 0 0 0 0 0
Heinz (H J) Co HNZ 1,511 373 1,138 1,632 118 1,513
Hercules Inc HPC 1,284 272 1,012 1,472 53 1,419
Hershey Foods Corp HSY 687 102 586 838 202 636
Hewlett-Packard Co HPQ 2,409 181 2,228 3,255 388 2,867
Hilton Hotels Corp HLT 249 0 249 248 0 248
Home Depot Inc HD 0 0 0 0 0 0
Honeywell International Inc HON 11,051 1,448 9,603 10,952 0 10,952
Household International Inc HI 860 443 417 678 0 678
Humana Inc HUM 0 0 0 0 0 0
Huntington Bancshares HBAN 227 40 187 213 0 213
Illinois Tool Works ITW 1,157 74 1,083 1,157 0 1,157
IMS Health Inc RX 152 39 114 167 36 131
Ingersoll-Rand Co Ltd IR 2,510 271 2,239 2,496 80 2,416
Intel Corp INTC 0 0 0 0 0 0
Interpublic Group Of Cos IPG 262 10 251 356 43 313
Intl Business Machines Corp IBM 61,096 8,404 52,692 60,410 462 59,948
Intl Flavors & Fragrances IFF 551 11 540 608 55 554
Intl Game Technology IGT 0 0 0 0 0 0
Intl Paper Co IP 6,502 1,581 4,921 6,419 182 6,237
Intuit Inc INTU 0 0 0 0 0 0
ITT Industries Inc ITT 3,234 98 3,136 3,617 36 3,581
J P Morgan Chase & Co JPM 4,048 417 3,631 4,007 0 4,007
Jabil Circuit Inc JBL 0 0 0 0 0 0
JDS Uniphase Corp JDSU 0 0 0 0 0 0
Jefferson-Pilot Corp JP 361 12 349 267 0 267
Johnson & Johnson JNJ 4,355 206 4,149 5,026 782 4,244
Johnson Controls Inc JCI 1,371 75 1,296 1,674 317 1,357
Jones Apparel Group Inc JNY 31 0 31 24 0 24
KB Home KBH 0 0 0 0 0 0
Kellogg Co K 1,845 293 1,552 2,039 140 1,898
Kerr-Mcgee Corp KMG 1,384 191 1,193 1,075 31 1,044
Keycorp KEY 875 243 632 787 0 787
Keyspan Corp KSE 1,899 78 1,822 1,915 0 1,915
Kimberly-Clark Corp KMB 3,722 322 3,399 4,015 186 3,828
Kinder Morgan Inc KMI 149 6 143 141 0 141
King Pharmaceuticals Inc KG 0 0 0 0 0 0
Kla-Tencor Corp KLAC 0 0 0 0 0 0
Knight-Ridder Inc KRI 1,080 71 1,009 1,125 89 1,036
Kohls Corp KSS 0 0 0 0 0 0
Kroger Co KR 1,275 4 1,271 1,357 37 1,3201 Includes prepaid pension asset and intangible asset.2 Includes accrued liability and minimum pension liability.

The Magic of Pension Accounting 27 September 2002
136
2001 Off-Balance-Sheet Amounts
Company NameTickerSymbol
Pension PlanAssets
On-Balance-Sheet
Asset 1Off-BalanceSheet Asset PBO
On-Balance Sheet
Liability 2Off-Balance-Sheet
LiabilityLeggett & Platt Inc LEG 158 38 121 118 0 118
Lehman Brothers Holdings Inc LEH 803 331 472 776 0 776
Lexmark Intl Inc-Cl A LXK 456 23 433 575 123 452
Lilly (Eli) & Co LLY 3,182 1,103 2,079 3,599 372 3,227
Limited Brands Inc LTD 0 0 0 0 0 0
Lincoln National Corp LNC 390 0 390 475 66 409
Linear Technology Corp LLTC 0 0 0 0 0 0
Liz Claiborne Inc LIZ 0 0 0 0 0 0
Lockheed Martin Corp LMT 20,300 2,101 18,199 19,713 0 19,713
Loews Corp LTR 2,724 279 2,445 2,886 104 2,782
Louisiana-Pacific Corp LPX 147 15 132 224 60 164
Lowes Cos LOW 0 0 0 0 0 0
LSI Logic Corp LSI 0 0 0 0 0 0
Lucent Technologies Inc LU 35,539 5,085 30,454 29,850 75 29,775
Manor Care Inc HCR 56 26 30 31 0 31
Marathon Oil Corp MRO 942 123 819 1,157 21 1,136
Marriott Intl Inc MAR 0 0 0 0 0 0
Marsh & McLennan Cos MMC 5,046 519 4,527 5,304 233 5,071
Marshall & Ilsley Corp MI 0 0 0 0 0 0
Masco Corp MAS 146 5 141 204 0 204
Mattel Inc MAT 233 61 172 195 0 195
Maxim Integrated Products MXIM 0 0 0 0 0 0
May Department Stores Co MAY 549 53 496 808 168 640
Maytag Corp MYG 881 103 778 1,334 353 981
MBIA Inc MBI 0 0 0 0 0 0
MBNA Corp KRB 247 67 180 379 103 276
McDermott Intl Inc MDR 1,822 153 1,668 1,833 66 1,768
McDonalds Corp MCD 0 0 0 0 0 0
McGraw-Hill Companies MHP 954 212 742 614 0 614
McKesson Corp MCK 347 95 252 332 58 274
Meadwestvaco Corp MWV 2,542 779 1,763 1,362 33 1,329
Medimmune Inc MEDI 0 0 0 0 0 0
Medtronic Inc MDT 427 136 291 381 0 381
Mellon Financial Corp MEL 1,602 822 780 915 101 814
Merck & Co MRK 2,865 853 2,011 3,612 429 3,183
Mercury Interactive Corp MERQ 0 0 0 0 0 0
Meredith Corp MDP 64 8 56 73 14 59
Merrill Lynch & Co MER 2,500 282 2,218 2,014 50 1,964
Metlife Inc MET 4,161 821 3,340 4,426 323 4,103
MGIC Investment Corp/Wi MTG 90 10 80 92 0 92
Micron Technology Inc MU 0 0 0 0 0 0
Microsoft Corp MSFT 0 0 0 0 0 0
Millipore Corp MIL 9 4 6 10 0 10
Mirant Corp MIR 116 3 113 189 106 83
Molex Inc MOLX 38 0 38 64 23 41
Moodys Corp MCO 79 57 22 41 6 36
Morgan Stanley MWD 1,057 123 934 1,457 184 1,273
Motorola Inc MOT 3,131 13 3,118 3,578 221 3,357
Nabors Industries Ltd NBR 11 0 11 14 1 13
National City Corp NCC 1,586 238 1,347 1,069 0 1,069
National Semiconductor Corp NSM 76 47 29 123 97 26
Navistar International NAV 2,872 272 2,600 3,384 487 2,897
NCR Corp NCR 3,775 1,107 2,668 3,621 343 3,278
Network Appliance Inc NTAP 0 0 0 0 0 01 Includes prepaid pension asset and intangible asset.2 Includes accrued liability and minimum pension liability.

The Magic of Pension Accounting 27 September 2002
137
2001 Off-Balance-Sheet Amounts
Company NameTickerSymbol
Pension PlanAssets
On-Balance-Sheet
Asset 1Off-BalanceSheet Asset PBO
On-Balance Sheet
Liability 2Off-Balance-Sheet
LiabilityNew York Times Co-Cl A NYT 641 2 639 970 253 717
Newell Rubbermaid Inc NWL 757 146 611 847 99 748
Newmont Mining Corp NEM 151 5 146 216 39 178
Nextel Communications NXTL 0 0 0 0 0 0
Nicor Inc GAS 400 164 235 238 0 238
Nike Inc-Cl B NKE 0 0 0 0 0 0
Nisource Inc NI 1,844 232 1,612 1,735 0 1,735
Noble Corp NE 66 1 65 84 9 74
Nordstrom Inc JWN (5) (19) 14 34 9 26
Norfolk Southern Corp NSC 1,798 426 1,372 1,324 79 1,245
North Fork Bancorporation NFB 110 22 87 82 0 82
Northern Trust Corp NTRS 298 82 216 289 32 257
Northrop Grumman Corp NOC 13,889 3,035 10,854 12,404 581 11,823
Novell Inc NOVL 0 0 0 0 0 0
Novellus Systems Inc NVLS 0 0 0 0 0 0
Nucor Corp NUE 0 0 0 0 0 0
Nvidia Corp NVDA 0 0 0 0 0 0
Occidental Petroleum Corp OXY 255 39 216 338 83 255
Office Depot Inc ODP 0 0 0 0 0 0
Omnicom Group OMC 0 0 0 0 0 0
Oracle Corp ORCL 0 0 0 0 0 0
Paccar Inc PCAR 469 19 450 603 106 497
Pactiv Corp PTV 3,561 1,071 2,490 3,390 36 3,354
Pall Corp PLL 187 36 152 244 66 178
Palm Inc PALM 0 0 0 0 0 0
Parametric Technology Corp PMTC 63 0 63 90 29 62
Parker-Hannifin Corp PH 1,337 386 951 1,664 400 1,264
Paychex Inc PAYX 0 0 0 0 0 0
Penney (J C) Co JCP 3,074 667 2,407 3,064 0 3,064
Peoples Energy Corp PGL 634 155 479 454 11 443
Peoplesoft Inc PSFT 0 0 0 0 0 0
Pepsi Bottling Group Inc PBG 578 37 541 760 101 659
Pepsico Inc PEP 3,129 396 2,733 3,556 261 3,295
Perkinelmer Inc PKI 251 228 22 292 272 20
Pfizer Inc PFE 5,648 1,322 4,326 6,956 1,155 5,801
PG&E Corp PCG 7,175 981 6,194 6,087 0 6,087
Pharmacia Corp PHA 2,887 236 2,651 3,950 760 3,190
Phelps Dodge Corp PD 940 58 882 1,006 58 948
Philip Morris Cos Inc MO 11,720 2,700 9,020 12,222 1,400 10,822
Phillips Petroleum Co P 1,113 103 1,010 1,849 516 1,333
Pinnacle West Capital PNW 765 0 765 881 10 871
Pitney Bowes Inc PBI 1,255 86 1,169 1,357 44 1,314
Plum Creek Timber Co Inc PCL 65 0 65 70 7 63
PMC-Sierra Inc PMCS 0 0 0 0 0 0
PNC Financial Svcs Group Inc PNC 928 297 631 920 21 899
Power-One Inc PWER 0 0 0 0 0 0
PPG Industries Inc PPG 2,423 1,062 1,361 2,414 237 2,177
PPL Corp PPL 1,654 6 1,648 1,316 182 1,134
Praxair Inc PX 846 5 841 995 148 847
Price (T. Rowe) Group TROW 0 0 0 0 0 0
Principal Financial Grp Inc PFG 953 36 916 856 0 856
Procter & Gamble Co PG 1,432 91 1,341 2,567 1,006 1,561
Progress Energy Inc PGN 1,678 404 1,273 1,391 0 1,391
Progressive Corp-Ohio PGR 0 0 0 0 0 01 Includes prepaid pension asset and intangible asset.2 Includes accrued liability and minimum pension liability.

The Magic of Pension Accounting 27 September 2002
138
2001 Off-Balance-Sheet Amounts
Company NameTickerSymbol
Pension PlanAssets
On-Balance-Sheet
Asset 1Off-BalanceSheet Asset PBO
On-Balance Sheet
Liability 2Off-Balance-Sheet
LiabilityProvidian Financial Corp PVN 0 0 0 0 0 0
Prudential Financial Inc PRU 8,629 2,576 6,053 6,607 1,177 5,430
Public Service Entrp PEG 2,228 180 2,048 2,676 53 2,622
Pulte Homes Inc PHM 0 0 0 0 0 0
Qlogic Corp QLGC 0 0 0 0 0 0
Qualcomm Inc QCOM 0 0 0 0 0 0
Quintiles Transnational Corp QTRN 0 0 0 0 0 0
Qwest Communication Intl Inc Q 11,121 1,002 10,119 9,625 0 9,625
Radioshack Corp RSH 0 0 0 0 0 0
Rational Software Corp RATL 0 0 0 0 0 0
Raytheon Co RTN 10,164 2,366 7,798 11,171 514 10,657
Reebok International Ltd RBK 0 0 0 0 0 0
Regions Finl Corp RF 242 34 208 249 0 249
Reliant Energy Inc REI 1,377 263 1,114 1,491 0 1,491
Robert Half Intl Inc RHI 0 0 0 0 0 0
Rockwell Automation ROK 1,284 20 1,264 1,375 137 1,238
Rockwell Collins Inc COL 1,723 152 1,571 1,809 76 1,733
Rohm & Haas Co ROH 1,925 336 1,589 1,604 0 1,604
Rowan Cos Inc RDC 171 20 151 224 46 178
Ryder System Inc R 882 161 721 922 19 903
Sabre Hldgs Corp-Cl A TSG 186 0 186 243 27 216
Safeco Corp SAFC 125 0 125 147 12 135
Safeway Inc SWY 1,783 531 1,252 1,287 0 1,287
Sanmina-Sci Corp SANM 0 0 0 0 0 0
Sara Lee Corp SLE 2,701 (38) 2,739 2,957 0 2,957
SBC Communications Inc SBC 32,715 7,337 25,378 25,060 0 25,060
Schering-Plough SGP 1,140 169 971 1,167 0 1,167
Schlumberger Ltd SLB 1,942 10 1,932 2,243 152 2,091
Schwab (Charles) Corp SCH 281 49 232 248 0 248
Scientific-Atlanta Inc SFA 71 0 71 87 17 71
Sealed Air Corp SEE 145 61 83 154 25 128
Sears Roebuck & Co S 2,349 161 2,188 3,091 685 2,406
Sempra Energy SRE 2,449 149 2,300 2,010 100 1,910
Sherwin-Williams Co SHW 538 394 144 204 0 203
Siebel Systems Inc SEBL 0 0 0 0 0 0
Sigma-Aldrich SIAL 131 34 97 120 1 119
Simon Property Group Inc SPG 0 0 0 0 0 0
SLM Corp SLM 166 0 166 126 15 110
Snap-On Inc SNA 530 32 497 562 56 506
Solectron Corp SLR 0 0 0 0 0 0
Southern Co SO 5,109 547 4,562 3,760 0 3,760
Southtrust Corp SOTR 139 0 139 182 10 172
Southwest Airlines LUV 0 0 0 0 0 0
Sprint Fon Group FON 2,996 443 2,553 3,005 0 3,005
Sprint Pcs Group PCS 0 0 0 0 0 0
St Jude Medical Inc STJ 0 0 0 0 0 0
St Paul Cos SPC 1,020 283 737 979 0 979
Stanley Works SWK 517 104 413 380 25 355
Staples Inc SPLS 0 0 0 0 0 0
Starbucks Corp SBUX 0 0 0 0 0 0
Starwood Hotels & Resorts Wrld HOT 124 5 119 143 21 122
State Street Corp STT 290 34 256 430 0 430
Stilwell Finl Inc SV 0 0 0 0 0 0
Stryker Corp SYK 48 0 48 69 19 491 Includes prepaid pension asset and intangible asset.2 Includes accrued liability and minimum pension liability.

The Magic of Pension Accounting 27 September 2002
139
2001 Off-Balance-Sheet Amounts
Company NameTickerSymbol
Pension PlanAssets
On-Balance-Sheet
Asset 1Off-BalanceSheet Asset PBO
On-Balance Sheet
Liability 2Off-Balance-Sheet
LiabilitySun Microsystems Inc SUNW 0 0 0 0 0 0
Sungard Data Systems Inc SDS 0 0 0 0 0 0
Sunoco Inc SUN 1,110 3 1,107 1,265 32 1,233
Suntrust Banks Inc STI 1,097 409 688 914 0 914
Supervalu Inc SVU 396 42 354 467 0 467
Symbol Technologies SBL 0 0 0 12 12 0
Synovus Financial Cp SNV 0 0 0 0 0 0
Sysco Corp SYY 416 0 416 577 31 546
Target Corp TGT 1,033 287 746 1,067 0 1,067
Teco Energy Inc TE 428 0 428 382 11 372
Tektronix Inc TEK 464 0 464 548 82 466
Tellabs Inc TLAB 0 0 0 0 0 0
Temple-Inland Inc TIN 682 96 586 644 12 632
Tenet Healthcare Corp THC 0 0 0 0 0 0
Teradyne Inc TER 115 5 110 181 40 141
Texas Instruments Inc TXN 1,089 20 1,069 1,771 432 1,339
Textron Inc TXT 4,480 747 3,733 3,908 171 3,737
Thermo Electron Corp TMO 63 3 60 67 0 67
Thomas & Betts Corp TNB 210 13 197 288 53 235
Tiffany & Co TIF 73 0 73 106 25 82
TJX Companies Inc TJX 181 19 162 219 0 219
TMP Worldwide Inc TMPW 0 0 0 0 0 0
Torchmark Corp TMK 134 0 133 129 16 113
Toys R Us Inc TOY 0 0 0 0 0 0
Transocean Inc RIG 210 34 176 243 31 212
Tribune Co TRB 1,489 811 677 1,146 0 1,146
TRW Inc TRW 7,902 3,136 4,766 7,482 521 6,961
Tupperware Corp TUP 48 0 48 88 42 46
TXU Corp TXU 3,258 402 2,856 3,335 90 3,245
Tyco International Ltd TYC 2,690 111 2,580 3,589 794 2,795
U S Bancorp USB 1,611 532 1,079 1,656 172 1,485
Union Pacific Corp UNP 1,931 27 1,904 2,321 376 1,945
Union Planters Corp UPC 0 0 0 0 0 0
Unisys Corp UIS 5,215 1,221 3,994 4,816 10 4,806
United Parcel Service Inc UPS 6,496 1,845 4,651 5,347 0 5,347
United States Steel Corp X 8,583 2,719 5,864 7,358 32 7,326
United Technologies Corp UTX 10,025 778 9,247 12,354 1,534 10,820
Unitedhealth Group Inc UNH 0 0 0 0 0 0
Univision Communications Inc UVN 0 0 0 0 0 0
Unocal Corp UCL 1,026 501 525 1,065 82 983
Unumprovident Corp UNM 463 109 354 371 0 371
UST Inc UST 261 32 229 362 81 280
Veritas Software Co VRTS 0 0 0 0 0 0
Verizon Communications VZ 48,558 9,846 38,712 36,391 1,601 34,790
VF Corp VFC 592 57 535 689 47 642
Viacom Inc -Cl B VIA.B 4,566 271 4,296 5,100 549 4,551
Visteon Corp VC 1,017 107 910 1,344 266 1,078
Vitesse Semiconductor Corp VTSS 0 0 0 0 0 0
Vulcan Materials Co VMC 469 44 425 373 29 344
Wachovia Corp WB 3,221 834 2,387 3,583 275 3,308
Walgreen Co WAG 0 0 0 0 0 0
Wal-Mart Stores WMT 0 0 0 0 0 0
Washington Mutual Inc WM 754 148 606 798 0 798
Waste Management Inc WMI 12 0 12 18 4 141 Includes prepaid pension asset and intangible asset.2 Includes accrued liability and minimum pension liability.

The Magic of Pension Accounting 27 September 2002
140
2001 Off-Balance-Sheet Amounts
Company NameTickerSymbol
Pension PlanAssets
On-Balance-Sheet
Asset 1Off-BalanceSheet Asset PBO
On-Balance Sheet
Liability 2Off-Balance-Sheet
LiabilityWaters Corp WAT 24 5 19 34 12 23
Watson Pharmaceuticals Inc WPI 0 0 0 0 0 0
Wellpoint Hlth Netwrk-Cl A WLP 145 19 127 175 39 137
Wells Fargo & Co WFC 2,761 156 2,605 2,934 197 2,737
Wendy's International Inc WEN 65 11 54 67 0 67
Weyerhaeuser Co WY 3,699 671 3,028 2,869 140 2,729
Whirlpool Corp WHR 1,557 224 1,333 1,414 100 1,314
Williams Cos Inc WMB 886 137 749 1,023 34 989
Winn-Dixie Stores Inc WIN 0 0 0 0 0 0
Worthington Industries WOR 15 1 13 18 4 13
Wrigley (Wm) Jr Co WWY 347 14 333 389 6 383
Wyeth WYE 2,739 213 2,526 3,316 125 3,191
Xcel Energy Inc XEL 3,268 379 2,889 2,409 0 2,409
Xerox Corp XRX 7,040 604 6,436 7,606 785 6,821
Xilinx Inc XLNX 0 0 0 0 0 0
Xl Capital Ltd XL 0 0 0 0 0 0
Yahoo Inc YHOO 0 0 0 0 0 0
Yum Brands Inc YUM 291 8 283 420 84 336
Zimmer Hldgs Inc ZMH 2 0 2 26 25 0
Zions Bancorporation ZION 119 15 104 135 0 135
Totals 1,071,547 171,344 900,203 1,067,370 74,915 992,4551 Includes prepaid pension asset and intangible asset.2 Includes accrued liability and minimum pension liability.
Source: Company data, CSFB estimates.

The Magic of Pension Accounting 27 September 2002
141
Appendix J
Exhibit 106:Adjusted Net Income/(Loss) for the S&P 500US$ in millions
Ticker 2001 Adjusted Net Income (Loss) 2000 Adjusted Net Income (Loss)Company Name Symbol Net Income/
(Loss)Adjusted %Difference Net
Income/(Loss)Adjusted % Difference
3m Co MMM $1,430 $310 (78%) $1,857 $1,472 (21%)
Abbott Laboratories ABT 1,550 1,168 (25%) 2,786 2,426 (13%)
Ace Limited ACE (124) (124) NM 543 543 0%
ADC Telecommunications Inc ADCT (1,288) (1,288) NM 868 868 0%
Adobe Systems Inc. ADBE 206 206 0% 288 288 0%
Advanced Micro Devices AMD (61) (61) NM 1,006 1,006 0%
AES Corp. (The) AES 467 389 (17%) 648 667 3%
Aetna Inc AET (292) (927) NM (127) (68) NM
AFLAC Inc AFL 687 669 (3%) 687 684 (0%)
Agilent Technologies Inc A (406) (682) NM 757 788 4%
Air Products & Chemicals Inc APD 513 305 (41%) 124 179 44%
Alberto-Culver Co-Cl B ACV 110 110 0% 103 103 0%
Albertsons Inc ABS 501 402 (20%) 765 690 (10%)
Alcoa Inc AA 908 36 (96%) 1,489 1,650 11%
Allegheny Energy Inc AYE 454 320 (30%) 319 341 7%
Allegheny Technologies Inc ATI (25) (340) NM 133 (63) (148%)
Allergan Inc AGN 227 190 (16%) 215 215 (0%)
Allied Waste Inds Inc AW 75 31 (59%) 138 160 16%
Allstate Corp ALL 1,167 253 (78%) 2,211 1,927 (13%)
Alltel Corp AT 1,048 971 (7%) 1,965 1,902 (3%)
Altera Corp ALTR (40) (40) NM 497 497 0%
Ambac Financial Gp ABK 433 431 (0%) 366 365 (0%)
Amerada Hess Corp AHC 914 861 (6%) 1,023 964 (6%)
Ameren Corp AEE 488 366 (25%) 470 377 (20%)
American Electric Power AEP 1,013 487 (52%) 405 131 (68%)
American Express AXP 1,311 1,048 (20%) 2,810 2,859 2%
American Greetings-Cl A AM (122) (119) NM (93) (91) NM
American International Group AIG 5,499 5,114 (7%) 5,636 5,593 (1%)
American Pwr Cnvrsion APCC 113 113 0% 166 166 0%
American Standard Cos Inc ASD 295 192 (35%) 315 227 (28%)
Amerisourcebergen Corp ABC 124 121 (3%) 99 98 (1%)
Amgen Inc AMGN 1,120 1,120 0% 1,139 1,139 0%
AMR Corp/De AMR (1,762) (2,361) NM 779 631 (19%)
Amsouth Bancorporation ASO 536 450 (16%) 329 296 (10%)
Anadarko Petroleum Corp APC (176) (226) NM 824 821 (0%)
Analog Devices ADI 356 346 (3%) 607 606 (0%)
Andrew Corp ANDW 62 62 0% 80 80 0%
Anheuser-Busch Cos Inc BUD 1,705 1,298 (24%) 1,552 1,595 3%
Anthem Inc ATH 342 232 (32%) 226 218 (4%)
AOL Time Warner Inc AOL (4,921) (5,173) NM 1,232 1,202 (2%)
AON Corp AOC 203 (134) (166%) 481 359 (25%)
Apache Corp APA 723 723 0% 721 721 0%
Apollo Group Inc-Cl A APOL 108 108 0% 71 71 0%
Apple Computer Inc AAPL (37) (37) NM 786 786 0%
Applera Corp Applied Biosys ABI 212 141 (34%) 186 181 (3%)
Applied Materials Inc AMAT 775 775 0% 2,064 2,064 0%
Applied Micro Circuits Corp AMCC (3,606) (3,606) NM (436) (436) NM

The Magic of Pension Accounting 27 September 2002
142
Ticker 2001 Adjusted Net Income (Loss) 2000 Adjusted Net Income (Loss)Company Name Symbol Net Income/
(Loss)Adjusted %Difference Net
Income/(Loss)Adjusted % Difference
Archer-Daniels-Midland Co ADM 383 318 (17%) 301 319 6%
Ashland Inc ASH 406 300 (26%) 292 295 1%
AT&T Corp T (6,842) (9,285) NM 4,669 3,580 (23%)
AT&T Wireless Services Inc AWE 200 200 0% 658 658 0%
Autodesk Inc ADSK 90 90 0% 93 93 0%
Automatic Data Processing ADP 925 858 (7%) 841 872 4%
Autozone Inc AZO 176 164 (6%) 268 274 2%
Avaya Inc AV (352) (615) NM (375) 811 NM
Avery Dennison Corp AVY 243 185 (24%) 284 250 (12%)
Avon Products AVP 430 318 (26%) 485 446 (8%)
Baker-Hughes Inc BHI 439 384 (13%) 102 104 2%
Ball Corp BLL (99) (173) NM 68 66 (3%)
Bank Of America Corp BAC 6,792 6,448 (5%) 7,517 6,927 (8%)
Bank Of New York Co Inc BK 1,343 811 (40%) 1,429 1,729 21%
Bank One Corp ONE 2,682 2,351 (12%) (511) (704) NM
Bard (C.R.) Inc BCR 143 125 (13%) 107 113 6%
Bausch & Lomb Inc BOL 42 18 (57%) 82 69 (16%)
Baxter International Inc BAX 664 284 (57%) 738 655 (11%)
BB&T Corp BBT 974 917 (6%) 626 598 (5%)
Bear Stearns Companies Inc BSC 625 625 0% 773 773 0%
Becton Dickinson & Co BDX 438 343 (22%) 393 370 (6%)
Bed Bath & Beyond Inc BBBY 220 220 0% 172 172 0%
Bellsouth Corp BLS 2,570 162 (94%) 4,220 3,250 (23%)
Bemis Co BMS 140 71 (49%) 131 98 (25%)
Best Buy Co Inc BBY 570 570 0% 396 396 0%
Big Lots Inc BLI (29) (32) NM 98 97 (1%)
Biogen Inc BGEN 273 271 (1%) 334 332 (1%)
Biomet Inc BMET 240 240 0% 198 198 0%
BJ Services Co BJS 349 334 (4%) 118 122 3%
Black & Decker Corp BDK 108 (106) (199%) 282 311 10%
Block H & R Inc HRB 434 434 0% 277 277 0%
BMC Software Inc BMC (184) (184) NM 42 42 0%
Boeing Co BA 2,826 (5,891) (308%) 2,128 4,432 108%
Boise Cascade Corp BCC (43) (178) NM 179 98 (45%)
Boston Scientific Corp BSX (54) (54) NM 373 373 0%
Bristol Myers Squibb BMY 2,527 1,962 (22%) 4,096 3,884 (5%)
Broadcom Corp -Cl A BRCM (2,742) (2,742) NM (688) (688) NM
Brown-Forman -Cl B BF.B 228 143 (37%) 233 202 (13%)
Brunswick Corp BC 85 18 (78%) 202 117 (42%)
Burlington Northern Santa Fe BNI 737 550 (25%) 980 978 (0%)
Burlington Resources Inc BR 558 546 (2%) 675 667 (1%)
Calpine Corp CPN 641 641 0% 325 325 0%
Campbell Soup Co CPB 649 448 (31%) 714 769 8%
Capital One Finl Corp COF 642 642 0% 470 470 0%
Cardinal Health Inc CAH 857 849 (1%) 680 677 (0%)
Carnival Corp CCL 926 926 0% 965 965 0%
Caterpillar Inc CAT 805 (298) (137%) 1,053 531 (50%)
Cendant Corp CD 423 423 0% 660 660 0%
Centex Corp CTX 382 382 0% 282 282 0%
Centurytel Inc CTL 343 294 (14%) 231 199 (14%)
Charter One Finl Inc CF 501 501 0% 434 434 0%
Chevrontexaco Corp CVX 3,931 3,136 (20%) 5,185 4,820 (7%)
Chiron Corp CHIR 175 175 (0%) 16 16 (0%)

The Magic of Pension Accounting 27 September 2002
143
Ticker 2001 Adjusted Net Income (Loss) 2000 Adjusted Net Income (Loss)Company Name Symbol Net Income/
(Loss)Adjusted %Difference Net
Income/(Loss)Adjusted % Difference
Chubb Corp CB 112 73 (34%) 715 678 (5%)
Ciena Corp CIEN (1,794) (1,794) NM 81 81 0%
Cigna Corp CI 989 639 (35%) 987 566 (43%)
Cincinnati Financial Corp CINF 193 172 (11%) 118 117 (1%)
Cinergy Corp CIN 446 351 (21%) 404 459 14%
Cintas Corp CTAS 222 222 0% 193 193 0%
Circuit City Str Crct Cty Gp CC 191 174 (9%) 149 121 (19%)
Cisco Systems Inc CSCO (1,014) (1,014) NM 2,668 2,668 0%
Citigroup Inc C 14,284 13,498 (6%) 13,519 12,731 (6%)
Citizens Communications Co CZN (64) (113) NM (40) (63) NM
Citrix Systems Inc CTXS 105 105 0% 95 95 0%
Clear Channel Communications CCU (1,144) (1,144) NM 249 249 0%
Clorox Co/De CLX 325 274 (16%) 394 388 (2%)
CMS Energy Corp CMS (329) (532) NM 43 (48) (212%)
Coca-Cola Co KO 3,979 3,802 (4%) 2,177 2,042 (6%)
Coca-Cola Enterprises CCE (19) (257) NM 236 233 (1%)
Colgate-Palmolive Co CL 1,147 991 (14%) 1,064 946 (11%)
Comcast Corp-Cl A Spl CMCSK 226 226 0% 2,045 2,045 0%
Comerica Inc. CMA 710 604 (15%) 749 695 (7%)
Computer Associates Intl Inc CA (1,102) (1,102) NM (591) (591) NM
Computer Sciences Corp CSC 344 235 (32%) 233 144 (38%)
Compuware Corp CPWR (245) (245) NM 119 119 0%
Comverse Technology Inc CMVT 55 55 0% 249 249 0%
Conagra Foods Inc CAG 683 641 (6%) 382 538 41%
Concord Efs Inc CEFT 216 216 0% 187 187 0%
Conoco Inc COC 1,596 1,428 (11%) 1,902 1,836 (3%)
Consolidated Edison Inc ED 696 (128) (118%) 596 (11) (102%)
Constellation Energy Grp Inc CEG 96 (12) (113%) 359 310 (14%)
Convergys Corp CVG 139 100 (28%) 195 175 (10%)
Cooper Industries Ltd CBE 261 213 (18%) 357 331 (7%)
Cooper Tire & Rubber CTB 18 (37) (306%) 97 83 (14%)
Coors (Adolph)-Cl B RKY 123 66 (46%) 110 41 (63%)
Corning Inc GLW (5,498) (5,714) NM 410 414 1%
Costco Wholesale Corp COST 602 602 0% 631 631 0%
Countrywide Credit Ind Inc CCR 486 480 (1%) 374 369 (1%)
Crane Co CR 89 54 (39%) 124 113 (9%)
CSX Corp CSX 293 153 (48%) 186 159 (15%)
Cummins Inc CUM (102) (411) NM 8 (28) (447%)
CVS Corp CVS 413 383 (7%) 746 726 (3%)
Dana Corp DCN (298) (658) NM 334 210 (37%)
Danaher Corp DHR 298 240 (19%) 324 320 (1%)
Darden Restaurants Inc DRI 197 188 (4%) 177 185 5%
Deere & Co DE (64) (1,393) NM 486 1,136 134%
Dell Computer Corp DELL 1,246 1,246 0% 2,236 2,236 0%
Delphi Corp DPH (370) (1,417) NM 1,062 695 (35%)
Delta Air Lines Inc DAL (1,216) (3,253) NM 928 1,972 112%
Deluxe Corp DLX 186 186 0% 169 169 0%
Devon Energy Corp DVN 54 30 (45%) 730 726 (1%)
Dillards Inc-Cl A DDS 66 66 0% 97 97 0%
Disney (Walt) Co DIS 120 (291) (343%) 920 1,272 38%
Dollar General Corp DG 208 208 0% 71 71 0%
Dominion Resources Inc D 544 212 (61%) 415 233 (44%)
Donnelley (R R) & Sons Co DNY 25 (148) (693%) 267 267 (0%)

The Magic of Pension Accounting 27 September 2002
144
Ticker 2001 Adjusted Net Income (Loss) 2000 Adjusted Net Income (Loss)Company Name Symbol Net Income/
(Loss)Adjusted %Difference Net
Income/(Loss)Adjusted % Difference
Dover Corp DOV 167 106 (36%) 533 551 3%
Dow Chemical DOW (417) (1,879) NM 1,513 1,165 (23%)
Dow Jones & Co Inc DJ 98 98 0% (119) (119) NM
DTE Energy Co DTE 329 225 (32%) 468 311 (33%)
Du Pont (E I) De Nemours DD 4,328 1,734 (60%) 2,314 1,015 (56%)
Duke Energy Corp DUK 1,994 1,657 (17%) 1,776 1,633 (8%)
Dynegy Inc DYN 646 576 (11%) 501 509 2%
Eastman Chemical Co EMN (179) (380) NM 303 256 (16%)
Eastman Kodak Co EK 76 (926) (1319%) 1,407 1,435 2%
Eaton Corp ETN 169 (187) (211%) 363 199 (45%)
Ebay Inc EBAY 90 90 0% 48 48 0%
Ecolab Inc ECL 188 147 (22%) 209 175 (16%)
Edison International EIX 2,424 2,122 (12%) (1,922) (2,033) NM
El Paso Corp EP 67 (543) (911%) 607 829 37%
Electronic Arts Inc ERTS 102 102 0% (11) (11) NM
Electronic Data Systems Corp EDS 1,387 921 (34%) 1,143 1,287 13%
EMC Corp/Ma EMC (508) (538) NM 1,782 1,754 (2%)
Emerson Electric Co EMR 1,032 803 (22%) 1,422 1,456 2%
Engelhard Corp EC 226 136 (40%) 168 193 15%
Entergy Corp ETR 727 556 (23%) 711 608 (14%)
EOG Resources Inc EOG 399 399 0% 397 397 0%
Equifax Inc EFX 117 37 (69%) 228 237 4%
Equity Office Properties Tr EOP 630 630 0% 473 473 0%
Equity Residential EQR 456 456 0% 544 544 0%
Exelon Corp EXC 1,416 646 (54%) 566 292 (48%)
Exxon Mobil Corp XOM 15,105 12,890 (15%) 15,990 14,697 (8%)
Family Dollar Stores FDO 190 190 0% 172 172 0%
Fannie Mae FNM 6,067 6,076 0% 4,416 4,419 0%
Federal Home Loan Mortg Corp FRE 4,373 4,354 (0%) 2,539 2,540 0%
Federated Dept Stores FD 518 343 (34%) (184) (346) NM
Fedex Corp FDX 725 96 (87%) 584 (66) (111%)
Fifth Third Bancorp FITB 1,101 1,047 (5%) 863 841 (2%)
First Data Corp FDC 875 784 (10%) 930 960 3%
First Tennessee Natl Corp FTN 330 291 (12%) 233 249 7%
Firstenergy Corp FE 727 527 (27%) 662 537 (19%)
Fiserv Inc FISV 208 208 0% 177 177 0%
Fleetboston Financial Corp FBF 931 606 (35%) 3,420 3,232 (6%)
Fluor Corp FLR 128 56 (57%) 100 89 (11%)
Ford Motor Co F (5,453) (10,050) NM 5,410 3,010 (44%)
Forest Laboratories -Cl A FRX 338 338 0% 215 215 0%
Fortune Brands Inc FO 386 318 (18%) (138) (167) NM
FPL Group Inc FPL 796 528 (34%) 719 765 6%
Franklin Resources Inc BEN 485 486 0% 562 562 0%
Freeprt Mcmor Cop&Gld -Cl B FCX 113 112 (1%) 77 74 (3%)
Gannett Co GCI 831 324 (61%) 972 826 (15%)
Gap Inc GPS (8) (8) NM 877 877 0%
Gateway Inc GTW (1,014) (1,014) NM 253 253 0%
General Dynamics Corp GD 943 568 (40%) 901 1,090 21%
General Electric Co GE 14,128 8,402 (41%) 12,735 10,023 (21%)
General Mills Inc GIS 461 313 (32%) 665 554 (17%)
General Motors Corp GM 601 (7,064) (1275%) 4,452 (1,783) (140%)
Genuine Parts Co GPC 297 237 (20%) 385 392 2%
Genzyme Corp GENZ 40 40 0% 121 121 0%

The Magic of Pension Accounting 27 September 2002
145
Ticker 2001 Adjusted Net Income (Loss) 2000 Adjusted Net Income (Loss)Company Name Symbol Net Income/
(Loss)Adjusted %Difference Net
Income/(Loss)Adjusted % Difference
Georgia-Pacific Corp GP (476) (1,088) NM 343 407 19%
Gillette Co G 910 744 (18%) 821 692 (16%)
Golden West Financial Corp GDW 819 819 0% 546 546 0%
Goldman Sachs Group Inc GS 2,310 2,280 (1%) 3,067 3,054 (0%)
Goodrich Corp GR 177 22 (87%) 286 164 (43%)
Goodyear Tire & Rubber Co GT (204) (683) NM 40 (201) (600%)
Grainger (W W) Inc GWW 175 175 0% 193 193 0%
Great Lakes Chemical Corp GLK (290) (335) NM 127 138 9%
Guidant Corp GDT 484 475 (2%) 374 376 1%
Halliburton Co HAL 551 89 (84%) 188 263 40%
Hancock John Finl Svcs Inc JHF 612 357 (42%) 839 860 3%
Harley-Davidson Inc HDI 438 352 (20%) 348 396 14%
Harrahs Entertainment Inc HET 209 209 0% (11) (11) NM
Hartford Finl Svcs Grp Inc HIG 549 296 (46%) 974 837 (14%)
Hasbro Inc HAS 61 7 (88%) (145) (149) NM
Hca Inc HCA 903 903 0% 219 219 0%
Health Management Assoc HMA 195 195 0% 168 168 0%
Healthsouth Corp HRC 202 202 0% 278 278 0%
Heinz (H J) Co HNZ 834 720 (14%) 495 376 (24%)
Hercules Inc HPC (58) (265) NM 98 (36) (137%)
Hershey Foods Corp HSY 207 186 (10%) 335 291 (13%)
Hewlett-Packard Co HPQ 624 119 (81%) 3,561 3,601 1%
Hilton Hotels Corp HLT 166 166 0% 272 272 0%
Home Depot Inc HD 3,044 3,044 0% 2,581 2,581 0%
Honeywell International Inc HON (99) (1,659) NM 1,659 716 (57%)
Household International Inc HI 1,924 1,695 (12%) 1,701 1,760 3%
Humana Inc HUM 117 117 0% 90 90 0%
Huntington Bancshares HBAN 179 163 (9%) 328 326 (1%)
Illinois Tool Works ITW 802 521 (35%) 958 1,037 8%
IMS Health Inc RX 138 118 (15%) 116 105 (9%)
Ingersoll-Rand Co Ltd IR 246 50 (80%) 546 503 (8%)
Intel Corp INTC 1,291 1,291 0% 10,535 10,535 0%
Interpublic Group Of Cos IPG (505) (515) NM 359 343 (4%)
Intl Business Machines Corp IBM 7,723 19 (100%) 8,093 3,651 (55%)
Intl Flavors & Fragrances IFF 116 57 (51%) 123 124 1%
Intl Game Technology IGT 214 214 0% 157 157 0%
Intl Paper Co IP (1,142) (1,777) NM 368 (199) (154%)
Intuit Inc INTU (97) (97) NM 306 306 0%
ITT Industries Inc ITT 217 (173) (180%) 265 (118) (145%)
J P Morgan Chase & Co JPM 1,719 1,825 6% 5,727 5,806 1%
Jabil Circuit Inc JBL 119 119 0% 146 146 0%
JDS Uniphase Corp JDSU (56,122) (56,122) NM (905) (905) NM
Jefferson-Pilot Corp JP 512 477 (7%) 512 523 2%
Johnson & Johnson JNJ 5,668 5,047 (11%) 4,800 4,293 (11%)
Johnson Controls Inc JCI 478 389 (19%) 472 473 0%
Jones Apparel Group Inc JNY 236 236 (0%) 302 302 0%
KB Home KBH 214 214 0% 210 210 0%
Kellogg Co K 482 348 (28%) 588 425 (28%)
Kerr-Mcgee Corp KMG 506 333 (34%) 842 717 (15%)
Keycorp KEY 157 (20) (113%) 1,002 1,036 3%
Keyspan Corp KSE 244 12 (95%) 301 146 (51%)
Kimberly-Clark Corp KMB 1,610 1,241 (23%) 1,801 1,384 (23%)
Kinder Morgan Inc KMI 239 219 (8%) 184 188 2%

The Magic of Pension Accounting 27 September 2002
146
Ticker 2001 Adjusted Net Income (Loss) 2000 Adjusted Net Income (Loss)Company Name Symbol Net Income/
(Loss)Adjusted %Difference Net
Income/(Loss)Adjusted % Difference
King Pharmaceuticals Inc KG 233 233 0% 105 105 0%
Kla-Tencor Corp KLAC 373 373 0% 254 254 0%
Knight-Ridder Inc KRI 185 84 (55%) 314 250 (20%)
Kohls Corp KSS 496 496 0% 372 372 0%
Kroger Co KR 1,043 828 (21%) 880 881 0%
Leggett & Platt Inc LEG 188 163 (13%) 264 275 4%
Lehman Brothers Holdings Inc LEH 1,255 1,092 (13%) 1,775 1,741 (2%)
Lexmark Intl Inc-Cl A LXK 274 198 (28%) 285 227 (20%)
Lilly (Eli) & Co LLY 2,809 2,274 (19%) 3,058 2,847 (7%)
Limited Brands Inc LTD 519 519 0% 428 428 0%
Lincoln National Corp LNC 606 560 (8%) 621 591 (5%)
Linear Technology Corp LLTC 427 427 0% 288 288 0%
Liz Claiborne Inc LIZ 192 192 0% 185 185 0%
Lockheed Martin Corp LMT 79 (2,501) (3266%) (424) (2,372) NM
Loews Corp LTR (536) (615) NM 1,877 1,915 2%
Louisiana-Pacific Corp LPX (172) (198) NM (14) (15) NM
Lowes Cos LOW 1,023 1,023 0% 810 810 0%
LSI Logic Corp LSI (992) (992) NM 237 237 0%
Lucent Technologies Inc LU (14,170) (20,290) NM 1,681 5,618 234%
Manor Care Inc HCR 68 63 (8%) 39 38 (3%)
Marathon Oil Corp MRO 1,318 1,104 (16%) 432 290 (33%)
Marriott Intl Inc MAR 236 236 0% 479 479 0%
Marsh & McLennan Cos MMC 974 210 (78%) 1,181 842 (29%)
Marshall & Ilsley Corp MI 338 338 0% 317 317 0%
Masco Corp MAS 199 188 (5%) 592 591 (0%)
Mattel Inc MAT 311 295 (5%) 170 160 (6%)
Maxim Integrated Products MXIM 335 335 0% 281 281 0%
May Department Stores Co MAY 706 651 (8%) 858 790 (8%)
Maytag Corp MYG 168 (35) (121%) 201 208 4%
MBIA Inc MBI 583 583 0% 529 529 0%
MBNA Corp KRB 1,694 1,619 (4%) 1,313 1,316 0%
McDermott Intl Inc MDR (21) (173) NM (22) (116) NM
McDonalds Corp MCD 1,637 1,637 0% 1,977 1,977 0%
McGraw-Hill Companies MHP 377 233 (38%) 472 354 (25%)
McKesson Corp MCK 419 389 (7%) (43) (60) NM
Meadwestvaco Corp MWV 88 (221) (350%) 255 234 (8%)
Medimmune Inc MEDI 149 149 0% 145 145 0%
Medtronic Inc MDT 984 917 (7%) 1,046 1,034 (1%)
Mellon Financial Corp MEL 436 212 (51%) 1,007 894 (11%)
Merck & Co MRK 7,282 6,761 (7%) 6,822 6,385 (6%)
Mercury Interactive Corp MERQ 18 18 0% 65 65 0%
Meredith Corp MDP 71 59 (18%) 71 78 10%
Merrill Lynch & Co MER 573 517 (10%) 3,784 3,939 4%
Metlife Inc MET 473 (16) (103%) 953 586 (38%)
MGIC Investment Corp/Wi MTG 639 628 (2%) 542 539 (0%)
Micron Technology Inc MU (521) (521) NM 1,504 1,504 0%
Microsoft Corp MSFT 7,721 7,721 0% 9,421 9,421 0%
Millipore Corp MIL 63 63 (1%) 119 118 (1%)
Mirant Corp MIR 563 570 1% 332 331 (0%)
Molex Inc MOLX 204 202 (1%) 222 223 0%
Moodys Corp MCO 212 203 (5%) 159 156 (2%)
Morgan Stanley MWD 3,610 3,526 (2%) 5,456 5,607 3%
Motorola Inc MOT (3,937) (4,289) NM 1,318 944 (28%)

The Magic of Pension Accounting 27 September 2002
147
Ticker 2001 Adjusted Net Income (Loss) 2000 Adjusted Net Income (Loss)Company Name Symbol Net Income/
(Loss)Adjusted %Difference Net
Income/(Loss)Adjusted % Difference
Nabors Industries Ltd NBR 348 347 (0%) 135 135 (1%)
National City Corp NCC 1,388 1,315 (5%) 1,302 1,303 0%
National Semiconductor Corp NSM 246 232 (5%) 628 623 (1%)
Navistar International NAV (23) (278) NM 159 186 17%
NCR Corp NCR 221 (413) (287%) 178 (92) (152%)
Network Appliance Inc NTAP 3 3 0% 75 75 0%
New York Times Co-Cl A NYT 202 107 (47%) 398 408 3%
Newell Rubbermaid Inc NWL 265 102 (61%) 422 415 (1%)
Newmont Mining Corp NEM (23) (26) NM (11) (22) NM
Nextel Communications NXTL (3,094) (3,094) NM (711) (711) NM
Nicor Inc GAS 144 55 (62%) 47 57 23%
Nike Inc-Cl B NKE 668 668 0% 590 590 0%
Nisource Inc NI 220 (34) (116%) 155 138 (11%)
Noble Corp NE 264 259 (2%) 166 160 (3%)
Nordstrom Inc JWN 125 126 1% 102 102 0%
Norfolk Southern Corp NSC 362 144 (60%) 172 39 (77%)
North Fork Bancorporation NFB 331 320 (3%) 235 235 0%
Northern Trust Corp NTRS 488 418 (14%) 485 408 (16%)
Northrop Grumman Corp NOC 427 (1,233) (389%) 625 (287) (146%)
Novell Inc NOVL (262) (262) NM 49 49 0%
Novellus Systems Inc NVLS 144 144 0% 236 236 0%
Nucor Corp NUE 113 113 0% 311 311 0%
Nvidia Corp NVDA 177 177 0% 100 100 0%
Occidental Petroleum Corp OXY 1,186 1,164 (2%) 1,569 1,557 (1%)
Office Depot Inc ODP 201 201 0% 49 49 0%
Omnicom Group OMC 503 503 0% 499 499 0%
Oracle Corp ORCL 2,224 2,224 0% 2,561 2,561 0%
Paccar Inc PCAR 174 142 (18%) 442 400 (10%)
Pactiv Corp PTV 165 (539) (427%) 113 267 136%
Pall Corp PLL 118 88 (26%) 147 151 3%
Palm Inc PALM (82) (82) NM (356) (356) NM
Parametric Technology Corp PMTC (8) (19) NM (4) (4) NM
Parker-Hannifin Corp PH 130 (13) (110%) 344 143 (58%)
Paychex Inc PAYX 275 275 0% 255 255 0%
Penney (J C) Co JCP 114 (264) (331%) (568) (543) NM
Peoples Energy Corp PGL 97 52 (47%) 86 62 (29%)
Peoplesoft Inc PSFT 192 192 0% 146 146 0%
Pepsi Bottling Group Inc PBG 305 161 (47%) 229 271 18%
Pepsico Inc PEP 2,662 2,123 (20%) 2,183 2,270 4%
Perkinelmer Inc PKI (1) (22) NM 86 78 (9%)
Pfizer Inc PFE 7,752 6,752 (13%) 3,718 3,550 (5%)
PG&E Corp PCG 1,115 176 (84%) (3,299) (3,892) NM
Pharmacia Corp PHA 1,291 896 (31%) 984 693 (30%)
Phelps Dodge Corp PD (273) (378) NM 29 7 (77%)
Philip Morris Cos Inc MO 8,566 6,538 (24%) 8,510 7,580 (11%)
Phillips Petroleum Co P 1,643 1,408 (14%) 1,862 1,740 (7%)
Pinnacle West Capital PNW 327 250 (24%) 302 251 (17%)
Pitney Bowes Inc PBI 514 331 (36%) 563 376 (33%)
Plum Creek Timber Co Inc PCL 338 341 1% 132 127 (4%)
PMC-Sierra Inc PMCS (639) (639) NM 75 75 0%
PNC Financial Svcs Group Inc PNC 377 230 (39%) 1,214 1,131 (7%)
Power-One Inc PWER (186) (186) NM 44 44 0%
PPG Industries Inc PPG 387 99 (74%) 620 349 (44%)

The Magic of Pension Accounting 27 September 2002
148
Ticker 2001 Adjusted Net Income (Loss) 2000 Adjusted Net Income (Loss)Company Name Symbol Net Income/
(Loss)Adjusted %Difference Net
Income/(Loss)Adjusted % Difference
PPL Corp PPL 221 18 (92%) 513 391 (24%)
Praxair Inc PX 432 351 (19%) 363 309 (15%)
Price (T. Rowe) Group TROW 196 196 0% 269 269 0%
Principal Financial Grp Inc PFG 370 252 (32%) 620 600 (3%)
Procter & Gamble Co PG 2,922 2,729 (7%) 3,542 3,573 1%
Progress Energy Inc PGN 542 364 (33%) 478 407 (15%)
Progressive Corp-Ohio PGR 411 411 0% 46 46 0%
Providian Financial Corp PVN 141 141 0% 652 652 0%
Prudential Financial Inc PRU (170) (1,911) NM 321 565 76%
Public Service Entrp PEG 763 528 (31%) 773 641 (17%)
Pulte Homes Inc PHM 302 302 0% 218 218 0%
Qlogic Corp QLGC 71 71 0% 69 69 0%
Qualcomm Inc QCOM (531) (531) NM 670 670 0%
Quintiles Transnational Corp QTRN (176) (176) NM (34) (34) NM
Qwest Communication Intl Inc Q (3,958) (5,736) NM (81) (1,247) NM
Radioshack Corp RSH 167 167 0% 368 368 0%
Rational Software Corp RATL (76) (76) NM 72 72 0%
Raytheon Co RTN 5 (3,009) (60281%) 498 598 20%
Reebok International Ltd RBK 103 103 0% 81 81 0%
Regions Finl Corp RF 509 463 (9%) 528 530 0%
Reliant Energy Inc REI 919 775 (16%) 771 624 (19%)
Robert Half Intl Inc RHI 121 121 0% 186 186 0%
Rockwell Automation ROK 125 (23) (119%) 636 585 (8%)
Rockwell Collins Inc COL 139 (87) (163%) 269 353 31%
Rohm & Haas Co ROH (70) (285) NM 354 295 (17%)
Rowan Cos Inc RDC 77 45 (41%) 70 58 (18%)
Ryder System Inc R 19 (128) (786%) 89 (56) (163%)
Sabre Hldgs Corp-Cl A TSG (47) (67) NM 144 124 (14%)
Safeco Corp SAFC (1,045) (1,041) NM 115 116 1%
Safeway Inc SWY 1,254 1,079 (14%) 1,092 898 (18%)
Sanmina-Sci Corp SANM 40 40 0% 197 197 0%
Sara Lee Corp SLE 1,603 1,396 (13%) 1,158 1,237 7%
SBC Communications Inc SBC 7,260 1,958 (73%) 7,967 5,080 (36%)
Schering-Plough SGP 1,943 1,757 (10%) 2,423 2,344 (3%)
Schlumberger Ltd SLB 522 238 (54%) 735 599 (18%)
Schwab (Charles) Corp SCH 78 (8) (110%) 718 706 (2%)
Scientific-Atlanta Inc SFA 334 324 (3%) 156 160 3%
Sealed Air Corp SEE 157 151 (4%) 225 227 1%
Sears Roebuck & Co S 735 249 (66%) 1,343 1,472 10%
Sempra Energy SRE 529 233 (56%) 440 47 (89%)
Sherwin-Williams Co SHW 263 240 (9%) 16 8 (53%)
Siebel Systems Inc SEBL 255 255 0% 222 222 0%
Sigma-Aldrich SIAL 141 129 (8%) 139 129 (7%)
Simon Property Group Inc SPG 201 201 0% 236 236 0%
SLM Corp SLM 384 387 1% 465 475 2%
Snap-On Inc SNA 22 (39) (284%) 123 127 3%
Solectron Corp SLR (124) (124) NM 501 501 0%
Southern Co SO 1,137 241 (79%) 1,013 1,410 39%
Southtrust Corp SOTR 554 546 (2%) 482 475 (1%)
Southwest Airlines LUV 511 511 0% 625 625 0%
Sprint Fon Group FON (146) (643) NM 1,292 876 (32%)
Sprint Pcs Group PCS (1,249) (1,237) NM (1,868) (1,868) NM
St Jude Medical Inc STJ 173 173 0% 129 129 0%

The Magic of Pension Accounting 27 September 2002
149
Ticker 2001 Adjusted Net Income (Loss) 2000 Adjusted Net Income (Loss)Company Name Symbol Net Income/
(Loss)Adjusted %Difference Net
Income/(Loss)Adjusted % Difference
St Paul Cos SPC (1,009) (1,129) NM 1,013 850 (16%)
Stanley Works SWK 158 92 (42%) 194 191 (2%)
Staples Inc SPLS 265 265 0% 60 60 0%
Starbucks Corp SBUX 181 181 0% 95 95 0%
Starwood Hotels & Resorts Wrld HOT 151 132 (12%) 401 384 (4%)
State Street Corp STT 628 563 (10%) 595 564 (5%)
Stilwell Finl Inc SV 302 302 0% 664 664 0%
Stryker Corp SYK 272 268 (2%) 221 220 (1%)
Sun Microsystems Inc SUNW 981 981 0% 1,854 1,854 0%
Sungard Data Systems Inc SDS 246 246 0% 213 213 0%
Sunoco Inc SUN 398 258 (35%) 411 276 (33%)
Suntrust Banks Inc STI 1,369 1,266 (8%) 1,294 1,250 (3%)
Supervalu Inc SVU 206 154 (25%) 82 68 (17%)
Symbol Technologies SBL (55) (55) NM (69) (69) NM
Synovus Financial Cp SNV 312 312 0% 263 263 0%
Sysco Corp SYY 597 515 (14%) 454 467 3%
Target Corp TGT 1,374 1,189 (13%) 1,264 1,275 1%
Teco Energy Inc TE 304 250 (18%) 251 213 (15%)
Tektronix Inc TEK 30 (32) (204%) 140 83 (41%)
Tellabs Inc TLAB (182) (182) NM 760 760 0%
Temple-Inland Inc TIN 111 (22) (119%) 195 252 29%
Tenet Healthcare Corp THC 1,025 1,025 0% 678 678 0%
Teradyne Inc TER (202) (224) NM 518 509 (2%)
Texas Instruments Inc TXN (201) (331) NM 3,087 3,057 (1%)
Textron Inc TXT 166 (310) (287%) 277 (17) (106%)
Thermo Electron Corp TMO 50 45 (9%) 62 53 (15%)
Thomas & Betts Corp TNB (139) (161) NM (193) (224) NM
Tiffany & Co TIF 174 164 (6%) 191 181 (5%)
TJX Companies Inc TJX 540 512 (5%) 538 516 (4%)
TMP Worldwide Inc TMPW 69 69 0% 57 57 0%
Torchmark Corp TMK 391 379 (3%) 362 361 (0%)
Toys R Us Inc TOY 67 67 0% 404 404 0%
Transocean Inc RIG 272 256 (6%) 107 98 (9%)
Tribune Co TRB 111 (88) (179%) 310 188 (39%)
TRW Inc TRW 68 (993) (1561%) 438 (448) (202%)
Tupperware Corp TUP 62 55 (10%) 75 70 (6%)
TXU Corp TXU 845 404 (52%) 930 766 (18%)
Tyco International Ltd TYC 4,671 4,026 (14%) 4,520 4,677 3%
U S Bancorp USB 1,707 1,171 (31%) 1,284 1,502 17%
Union Pacific Corp UNP 966 641 (34%) 842 585 (30%)
Union Planters Corp UPC 444 444 0% 409 409 0%
Unisys Corp UIS (50) (861) NM 245 73 (70%)
United Parcel Service Inc UPS 2,425 997 (59%) 2,934 3,676 25%
United States Steel Corp X (218) (998) NM (21) (765) NM
United Technologies Corp UTX 1,938 (103) (105%) 1,808 2,132 18%
Unitedhealth Group Inc UNH 913 913 0% 736 736 0%
Univision Communications Inc UVN 55 55 0% 117 117 0%
Unocal Corp UCL 599 414 (31%) 723 644 (11%)
Unumprovident Corp UNM 582 491 (16%) 564 402 (29%)
UST Inc UST 492 466 (5%) 442 418 (5%)
Veritas Software Co VRTS (651) (651) NM (620) (620) NM
Verizon Communications VZ 590 (5,880) (1097%) 10,810 6,491 (40%)
VF Corp VFC 138 (18) (113%) 267 303 13%

The Magic of Pension Accounting 27 September 2002
150
Ticker 2001 Adjusted Net Income(Loss) 2000 Adjusted Net Income (Loss)Company Name Symbol Net Income/
(Loss)Adjusted %Difference Net
Income/(Loss)Adjusted % Difference
Viacom Inc -Cl B VIA.B (220) (513) NM (364) (455) NM
Visteon Corp VC (118) (266) NM 270 343 27%
Vitesse Semiconductor Corp VTSS (131) (131) NM 28 28 0%
Vulcan Materials Co VMC 223 149 (33%) 220 233 6%
Wachovia Corp WB 1,619 931 (43%) 138 296 114%
Walgreen Co WAG 6,671 6,671 0% 6,295 6,295 0%
Wal-Mart Stores WMT 886 886 0% 777 777 0%
Washington Mutual Inc WM 2,732 2,657 (3%) 1,899 1,846 (3%)
Waste Management Inc WMI 503 504 0% (97) (70) NM
Waters Corp WAT 115 111 (3%) 156 152 (2%)
Watson Pharmaceuticals Inc WPI 116 116 0% 171 171 0%
Wellpoint Hlth Netwrk-Cl A WLP 415 397 (4%) 342 336 (2%)
Wells Fargo & Co WFC 3,423 2,840 (17%) 4,026 4,179 4%
Wendy's International Inc WEN 194 188 (3%) 170 160 (5%)
Weyerhaeuser Co WY 354 (401) (213%) 840 796 (5%)
Whirlpool Corp WHR 34 (325) (1055%) 367 145 (61%)
Williams Cos Inc WMB 835 691 (17%) 873 723 (17%)
Winn-Dixie Stores Inc WIN 190 190 0% 45 45 0%
Worthington Industries WOR 36 34 (4%) 94 95 0%
Wrigley (Wm) Jr Co WWY 363 319 (12%) 329 304 (8%)
Wyeth WYE 2,285 1,928 (16%) (901) (1,091) NM
Xcel Energy Inc XEL 785 361 (54%) 546 415 (24%)
Xerox Corp XRX (109) (636) NM (257) (239) NM
Xilinx Inc XLNX (114) (114) NM 35 35 0%
Xl Capital Ltd XL (576) (576) NM 506 506 0%
Yahoo Inc YHOO (93) (93) NM 71 71 0%
Yum Brands Inc YUM 492 417 (15%) 413 412 (0%)
Zimmer Hldgs Inc ZMH 150 150 0% 176 176 0%
Zions Bancorporation ZION 290 273 (6%) 162 143 (11%)
TOTALS 219,082 68,660 (69%) 431,646 387,882 (10%)
Source: Company data, CSFB estimates.

The Magic of Pension Accounting 27 September 2002
151
Appendix K
Exhibit 107:Adjusted Operating Income/(Loss) for the S&P 500US$ in millions
Ticker 2001Adjusted Operating Income(Loss) 2000 Adjusted Operating Income(Loss)Company Name Symbol Op. Income/
(Loss)Adjusted %Difference Op.
Income/(Loss)Adjusted % Difference
3m Co MMM $ 2,777 $ 2,661 (4%) $ 3,081 $ 2,929 (5%)
Abbott Laboratories ABT 3,538 3,475 (2%) 3,262 3,197 (2%)
Ace Limited ACE (3) (3) NM 858 858 0%
ADC Telecommunications Inc ADCT (253) (253) NM 524 524 0%
Adobe Systems Inc. ADBE 391 391 0% 414 414 0%
Advanced Micro Devices AMD 38 38 0% 889 889 0%
AES Corp. (The) AES 2,182 2,212 1% 1,615 1,685 4%
Aetna Inc AET (64) (183) NM 662 568 (14%)
AFLAC Inc AFL 1,100 1,101 0% 1,031 1,032 0%
Agilent Technologies Inc A (550) (587) NM 1,074 1,026 (4%)
Air Products & Chemicals Inc APD 802 818 2% 834 840 1%
Alberto-Culver Co-Cl B ACV 189 189 0% 164 164 0%
Albertsons Inc ABS 1,787 1,767 (1%) 1,833 1,811 (1%)
Alcoa Inc AA 2,270 2,075 (9%) 3,085 2,940 (5%)
Allegheny Energy Inc AYE 960 938 (2%) 721 701 (3%)
Allegheny Technologies Inc ATI 67 (24) (136%) 258 111 (57%)
Allergan Inc AGN 359 359 (0%) 294 295 0%
Allied Waste Inds Inc AW 1,238 1,220 (1%) 1,336 1,318 (1%)
Allstate Corp ALL 1,725 1,629 (6%) 3,335 3,058 (8%)
Alltel Corp AT 1,757 1,740 (1%) 1,693 1,651 (2%)
Altera Corp ALTR 149 149 0% 527 527 0%
Ambac Financial Gp ABK 609 608 (0%) 521 520 (0%)
Amerada Hess Corp AHC 1,479 1,473 (0%) 1,550 1,543 (0%)
Ameren Corp AEE 965 937 (3%) 942 915 (3%)
American Electric Power AEP 2,395 2,249 (6%) 2,026 1,888 (7%)
American Express AXP 3,333 3,304 (1%) 3,908 3,877 (1%)
American Greetings-Cl A AM 211 211 (0%) 171 171 (0%)
American International Group AIG 14,834 14,792 (0%) 11,340 11,350 0%
American Pwr Cnvrsion APCC 153 153 0% 257 257 0%
American Standard Cos Inc ASD 654 654 0% 703 697 (1%)
Amerisourcebergen Corp ABC 281 281 0% 200 201 0%
Amgen Inc AMGN 1,777 1,777 0% 1,549 1,549 0%
AMR Corp/De AMR (1,860) (1,852) NM 1,381 1,384 0%
Amsouth Bancorporation ASO 1,002 974 (3%) 901 868 (4%)
Anadarko Petroleum Corp APC (318) (318) NM 1,419 1,421 0%
Analog Devices ADI 464 463 (0%) 767 766 (0%)
Andrew Corp ANDW 98 98 0% 128 128 0%
Anheuser-Busch Cos Inc BUD 2,705 2,658 (2%) 2,495 2,443 (2%)
Anthem Inc ATH 587 569 (3%) 385 369 (4%)
AOL Time Warner Inc AOL 703 691 (2%) 1,413 1,413 0%
AON Corp AOC 812 717 (12%) 1,076 973 (10%)
Apache Corp APA 1,339 1,339 0% 1,317 1,317 0%
Apollo Group Inc-Cl A APOL 161 161 0% 120 120 0%
Apple Computer Inc AAPL (333) (333) NM 620 620 0%
Applera Corp Applied Biosys ABI 280 277 (1%) 260 256 (2%)
Applied Materials Inc AMAT 1,151 1,151 0% 2,801 2,801 0%
Applied Micro Circuits Corp AMCC (590) (590) NM (291) (291) NM

The Magic of Pension Accounting 27 September 2002
152
Ticker 2001Adjusted Operating Income(Loss) 2000 Adjusted Operating Income(Loss)Company Name Symbol Op. Income/
(Loss)Adjusted %Difference Op.
Income/(Loss)Adjusted % Difference
Archer-Daniels-Midland Co ADM 701 698 (0%) 598 597 (0%)
Ashland Inc ASH 97 106 9% 277 290 5%
AT&T Corp T 6,284 5,781 (8%) 11,306 10,291 (9%)
AT&T Wireless Services Inc AWE 598 598 0% (38) (38) NM
Autodesk Inc ADSK 132 132 0% 139 139 0%
Automatic Data Processing ADP 1,617 1,601 (1%) 1,335 1,322 (1%)
Autozone Inc AZO 545 543 (0%) 512 511 (0%)
Avaya Inc AV 350 728 108% 314 314 0%
Avery Dennison Corp AVY 410 384 (6%) 481 457 (5%)
Avon Products AVP 845 858 2% 789 794 1%
Baker-Hughes Inc BHI 732 719 (2%) 465 454 (2%)
Ball Corp BLL 246 237 (4%) 286 282 (1%)
Bank Of America Corp BAC 16,411 16,211 (1%) 16,495 16,283 (1%)
Bank Of New York Co Inc BK 2,564 2,447 (5%) 2,847 2,760 (3%)
Bank One Corp ONE 7,439 7,329 (1%) 5,858 5,737 (2%)
Bard (C.R.) Inc BCR 213 211 (1%) 194 194 (0%)
Bausch & Lomb Inc BOL 115 113 (2%) 223 219 (2%)
Baxter International Inc BAX 1,493 1,429 (4%) 1,268 1,227 (3%)
BB&T Corp BBT 1,830 1,826 (0%) 1,569 1,563 (0%)
Bear Stearns Companies Inc BSC 4,863 4,863 0% 5,972 5,972 0%
Becton Dickinson & Co BDX 646 633 (2%) 590 571 (3%)
Bed Bath & Beyond Inc BBBY 346 346 0% 273 273 0%
Bellsouth Corp BLS 6,914 5,908 (15%) 7,490 6,609 (12%)
Bemis Co BMS 260 236 (9%) 245 224 (8%)
Best Buy Co Inc BBY 937 937 0% 619 619 0%
Big Lots Inc BLI 70 71 1% 185 186 0%
Biogen Inc BGEN 360 361 0% 328 329 0%
Biomet Inc BMET 371 371 0% 317 317 0%
BJ Services Co BJS 536 534 (0%) 195 192 (2%)
Black & Decker Corp BDK 348 311 (11%) 522 489 (6%)
Block H & R Inc HRB 832 832 0% 724 724 0%
BMC Software Inc BMC (157) (157) NM 27 27 0%
Boeing Co BA 4,717 3,206 (32%) 3,613 2,549 (29%)
Boise Cascade Corp BCC 219 195 (11%) 358 331 (8%)
Boston Scientific Corp BSX 517 517 0% 638 638 0%
Bristol Myers Squibb BMY 6,253 6,178 (1%) 5,986 5,892 (2%)
Broadcom Corp -Cl A BRCM (1,462) (1,462) NM 4 4 0%
Brown-Forman -Cl B BF.B 370 344 (7%) 374 351 (6%)
Brunswick Corp BC 191 184 (4%) 452 430 (5%)
Burlington Northern Santa Fe BNI 1,789 1,786 (0%) 2,130 2,104 (1%)
Burlington Resources Inc BR 1,095 1,092 (0%) 1,191 1,189 (0%)
Calpine Corp CPN 1,130 1,130 0% 578 578 0%
Campbell Soup Co CPB 1,266 1,219 (4%) 1,299 1,261 (3%)
Capital One Finl Corp COF 1,566 1,566 0% 1,234 1,234 0%
Cardinal Health Inc CAH 1,612 1,614 0% 1,260 1,261 0%
Carnival Corp CCL 1,076 1,076 0% 945 945 0%
Caterpillar Inc CAT 2,121 1,824 (14%) 2,425 2,114 (13%)
Cendant Corp CD 1,703 1,703 0% 1,373 1,373 0%
Centex Corp CTX 914 914 0% 656 656 0%
Centurytel Inc CTL 560 544 (3%) 525 501 (5%)
Charter One Finl Inc CF 974 974 0% 869 869 0%
Chevrontexaco Corp CVX 8,972 9,000 0% 8,193 7,975 (3%)
Chiron Corp CHIR 116 116 0% 116 117 0%

The Magic of Pension Accounting 27 September 2002
153
Ticker 2001Adjusted Operating Income(Loss) 2000 Adjusted Operating Income(Loss)Company Name Symbol Op. Income/
(Loss)Adjusted %Difference Op.
Income/(Loss)Adjusted % Difference
Chubb Corp CB (11) (26) NM 904 888 (2%)
Ciena Corp CIEN 41 41 0% 99 99 0%
Cigna Corp CI 1,550 1,528 (1%) 1,601 1,569 (2%)
Cincinnati Financial Corp CINF 260 252 (3%) 185 177 (4%)
Cinergy Corp CIN 942 938 (0%) 862 870 1%
Cintas Corp CTAS 367 367 0% 324 324 0%
Circuit City Str Crct Cty Gp CC 237 235 (1%) 323 320 (1%)
Cisco Systems Inc CSCO 21 21 0% 4,608 4,608 0%
Citigroup Inc C 55,018 54,772 (0%) 58,540 58,273 (0%)
Citizens Communications Co CZN 295 288 (3%) 162 161 (0%)
Citrix Systems Inc CTXS 136 136 0% 121 121 0%
Clear Channel Communications CCU (494) (494) NM 305 305 0%
Clorox Co/De CLX 709 694 (2%) 731 713 (2%)
CMS Energy Corp CMS 301 293 (3%) 727 716 (2%)
Coca-Cola Co KO 5,650 5,659 0% 5,134 5,119 (0%)
Coca-Cola Enterprises CCE 679 660 (3%) 1,118 1,096 (2%)
Colgate-Palmolive Co CL 1,861 1,858 (0%) 1,721 1,700 (1%)
Comcast Corp-Cl A Spl CMCSK (746) (746) NM (161) (161) NM
Comerica Inc. CMA 1,541 1,524 (1%) 1,386 1,365 (2%)
Computer Associates Intl Inc CA (1,099) (1,099) NM (475) (475) NM
Computer Sciences Corp CSC 639 626 (2%) 653 629 (4%)
Compuware Corp CPWR 162 162 0% 193 193 0%
Comverse Technology Inc CMVT 128 128 0% 251 251 0%
Conagra Foods Inc CAG 1,527 1,513 (1%) 1,543 1,540 (0%)
Concord Efs Inc CEFT 413 413 0% 268 268 0%
Conoco Inc COC 2,822 2,814 (0%) 3,282 3,275 (0%)
Consolidated Edison Inc ED 1,592 1,187 (25%) 1,334 1,022 (23%)
Constellation Energy Grp Inc CEG 358 353 (1%) 840 835 (1%)
Convergys Corp CVG 366 359 (2%) 328 322 (2%)
Cooper Industries Ltd CBE 475 471 (1%) 650 634 (3%)
Cooper Tire & Rubber CTB 187 185 (1%) 291 287 (1%)
Coors (Adolph)-Cl B RKY 175 169 (3%) 166 157 (5%)
Corning Inc GLW (275) (249) NM 1,198 1,193 (0%)
Costco Wholesale Corp COST 1,011 1,011 0% 1,037 1,037 0%
Countrywide Credit Ind Inc CCR 2,263 2,265 0% 1,934 1,934 (0%)
Crane Co CR 178 162 (9%) 184 167 (9%)
CSX Corp CSX 1,017 990 (3%) 805 774 (4%)
Cummins Inc CUM 73 46 (37%) 226 198 (12%)
CVS Corp CVS 1,120 1,120 0% 1,304 1,305 0%
Dana Corp DCN 133 74 (44%) 746 702 (6%)
Danaher Corp DHR 572 553 (3%) 552 537 (3%)
Darden Restaurants Inc DRI 332 326 (2%) 290 286 (2%)
Deere & Co DE 907 879 (3%) 1,296 1,203 (7%)
Dell Computer Corp DELL 2,271 2,271 0% 2,768 2,768 0%
Delphi Corp DPH 518 495 (4%) 1,744 1,647 (6%)
Delta Air Lines Inc DAL (1,117) (1,436) NM 1,745 1,491 (15%)
Deluxe Corp DLX 308 308 0% 285 285 0%
Devon Energy Corp DVN 290 292 1% 1,359 1,358 (0%)
Dillards Inc-Cl A DDS 306 306 0% 417 417 0%
Disney (Walt) Co DIS 2,832 2,718 (4%) 2,743 2,653 (3%)
Dollar General Corp DG 402 402 0% 341 341 0%
Dominion Resources Inc D 1,785 1,652 (7%) 1,529 1,458 (5%)
Donnelley (R R) & Sons Co DNY 343 283 (18%) 501 425 (15%)

The Magic of Pension Accounting 27 September 2002
154
Ticker 2001Adjusted Operating Income(Loss) 2000 Adjusted Operating Income(Loss)Company Name Symbol Op. Income/
(Loss)Adjusted %Difference Op.
Income/(Loss)Adjusted % Difference
Dover Corp DOV 299 291 (3%) 843 837 (1%)
Dow Chemical DOW 1,138 837 (26%) 2,147 1,944 (9%)
Dow Jones & Co Inc DJ 183 183 0% 498 498 0%
DTE Energy Co DTE 696 815 17% 830 804 (3%)
Du Pont (E I) De Nemours DD 2,301 1,592 (31%) 4,516 3,711 (18%)
Duke Energy Corp DUK 4,100 4,017 (2%) 3,406 3,339 (2%)
Dynegy Inc DYN 1,063 1,049 (1%) 741 720 (3%)
Eastman Chemical Co EMN 320 308 (4%) 583 578 (1%)
Eastman Kodak Co EK 1,233 934 (24%) 2,253 1,993 (12%)
Eaton Corp ETN 477 364 (24%) 701 598 (15%)
Ebay Inc EBAY 140 140 0% 37 37 0%
Ecolab Inc ECL 318 317 (1%) 322 320 (1%)
Edison International EIX 5,456 5,403 (1%) (1,729) (1,792) NM
El Paso Corp EP 833 744 (11%) 1,331 1,268 (5%)
Electronic Arts Inc ERTS 156 156 0% (28) (28) NM
Electronic Data Systems Corp EDS 2,225 2,094 (6%) 1,821 1,713 (6%)
EMC Corp/Ma EMC 21 19 (9%) 2,257 2,252 (0%)
Emerson Electric Co EMR 2,419 2,352 (3%) 2,541 2,473 (3%)
Engelhard Corp EC 327 321 (2%) 348 341 (2%)
Entergy Corp ETR 1,573 1,526 (3%) 1,546 1,503 (3%)
EOG Resources Inc EOG 693 693 0% 688 688 0%
Equifax Inc EFX 314 298 (5%) 455 440 (3%)
Equity Office Properties Tr EOP 1,511 1,511 0% 1,038 1,038 0%
Equity Residential EQR 793 793 0% 787 787 0%
Exelon Corp EXC 3,362 3,194 (5%) 1,527 1,379 (10%)
Exxon Mobil Corp XOM 21,658 21,677 0% 25,179 24,796 (2%)
Family Dollar Stores FDO 298 298 0% 271 271 0%
Fannie Mae FNM 49,708 49,722 0% 43,089 43,094 0%
Federal Home Loan Mortg Corp FRE 35,108 35,106 (0%) 28,694 28,691 (0%)
Federated Dept Stores FD 1,319 1,280 (3%) 1,512 1,471 (3%)
Fedex Corp FDX 1,202 1,003 (17%) 1,195 930 (22%)
Fifth Third Bancorp FITB 2,715 2,705 (0%) 1,745 1,716 (2%)
First Data Corp FDC 1,516 1,502 (1%) 1,336 1,323 (1%)
First Tennessee Natl Corp FTN 539 526 (2%) 538 527 (2%)
Firstenergy Corp FE 1,685 1,626 (3%) 1,505 1,435 (5%)
Fiserv Inc FISV 366 366 0% 314 314 0%
Fleetboston Financial Corp FBF 3,809 3,711 (3%) 6,641 6,555 (1%)
Fluor Corp FLR 186 175 (6%) 139 122 (13%)
Ford Motor Co F 3,354 2,312 (31%) 19,653 18,930 (4%)
Forest Laboratories -Cl A FRX 435 435 0% 282 282 0%
Fortune Brands Inc FO 704 684 (3%) 754 735 (3%)
FPL Group Inc FPL 1,397 1,239 (11%) 1,240 1,084 (13%)
Franklin Resources Inc BEN 607 609 0% 733 733 0%
Freeprt Mcmor Cop&Gld -Cl B FCX 545 546 0% 508 509 0%
Gannett Co GCI 1,590 1,505 (5%) 1,817 1,739 (4%)
Gap Inc GPS 426 426 0% 1,445 1,445 0%
Gateway Inc GTW (208) (208) NM 530 530 0%
General Dynamics Corp GD 1,485 1,322 (11%) 1,329 1,198 (10%)
General Electric Co GE 20,632 17,653 (14%) 18,697 16,173 (13%)
General Mills Inc GIS 1,273 1,154 (9%) 1,169 1,082 (7%)
General Motors Corp GM 8,201 7,674 (6%) 14,064 13,592 (3%)
Genuine Parts Co GPC 666 637 (4%) 713 682 (4%)
Genzyme Corp GENZ 215 215 0% 251 251 0%

The Magic of Pension Accounting 27 September 2002
155
Ticker 2001Adjusted Operating Income(Loss) 2000 Adjusted Operating Income(Loss)Company Name Symbol Op. Income/
(Loss)Adjusted %Difference Op.
Income/(Loss)Adjusted % Difference
Georgia-Pacific Corp GP 1,782 1,636 (8%) 1,352 1,352 0%
Gillette Co G 1,670 1,655 (1%) 2,084 2,043 (2%)
Golden West Financial Corp GDW 1,433 1,433 0% 956 956 0%
Goldman Sachs Group Inc GS 19,023 19,016 (0%) 21,720 21,715 (0%)
Goodrich Corp GR 586 565 (4%) 637 606 (5%)
Goodyear Tire & Rubber Co GT 309 337 9% 543 487 (10%)
Grainger (W W) Inc GWW 378 378 0% 335 335 0%
Great Lakes Chemical Corp GLK 44 39 (12%) 204 202 (1%)
Guidant Corp GDT 785 781 (0%) 799 799 0%
Halliburton Co HAL 977 962 (2%) 322 259 (20%)
Hancock John Finl Svcs Inc JHF 913 804 (12%) 1,124 1,021 (9%)
Harley-Davidson Inc HDI 687 695 1% 545 548 0%
Harrahs Entertainment Inc HET 606 606 0% 570 570 0%
Hartford Finl Svcs Grp Inc HIG 665 652 (2%) 1,668 1,654 (1%)
Hasbro Inc HAS 210 200 (5%) 86 74 (14%)
Hca Inc HCA 2,152 2,152 0% 2,018 2,018 0%
Health Management Assoc HMA 358 358 0% 301 301 0%
Healthsouth Corp HRC 844 844 0% 772 772 0%
Heinz (H J) Co HNZ 1,608 1,576 (2%) 1,683 1,672 (1%)
Hercules Inc HPC 270 242 (10%) 398 349 (12%)
Hershey Foods Corp HSY 672 772 15% 615 603 (2%)
Hewlett-Packard Co HPQ 2,030 1,965 (3%) 3,889 3,795 (2%)
Hilton Hotels Corp HLT 632 632 0% 822 822 0%
Home Depot Inc HD 4,932 4,932 0% 4,191 4,191 0%
Honeywell International Inc HON 2,748 2,244 (18%) 3,629 3,056 (16%)
Household International Inc HI 7,112 7,047 (1%) 6,539 6,484 (1%)
Humana Inc HUM 208 208 0% 143 143 0%
Huntington Bancshares HBAN 459 450 (2%) 659 655 (1%)
Illinois Tool Works ITW 1,306 1,234 (6%) 1,563 1,502 (4%)
IMS Health Inc RX 425 422 (1%) 367 372 1%
Ingersoll-Rand Co Ltd IR 740 697 (6%) 1,241 1,191 (4%)
Intel Corp INTC 2,578 2,578 0% 10,504 10,504 0%
Interpublic Group Of Cos IPG 776 778 0% 834 834 0%
Intl Business Machines Corp IBM 9,295 6,803 (27%) 11,643 9,369 (20%)
Intl Flavors & Fragrances IFF 286 277 (3%) 253 248 (2%)
Intl Game Technology IGT 252 252 0% 162 162 0%
Intl Paper Co IP 1,435 1,193 (17%) 2,508 2,309 (8%)
Intuit Inc INTU 40 40 0% (12) (12) NM
ITT Industries Inc ITT 495 427 (14%) 493 436 (12%)
J P Morgan Chase & Co JPM 9,682 9,845 2% 13,839 13,960 1%
Jabil Circuit Inc JBL 198 198 0% 218 218 0%
JDS Uniphase Corp JDSU (4,711) (4,711) NM (482) (482) NM
Jefferson-Pilot Corp JP 844 828 (2%) 881 867 (2%)
Johnson & Johnson JNJ 7,885 7,740 (2%) 6,477 6,328 (2%)
Johnson Controls Inc JCI 961 932 (3%) 965 939 (3%)
Jones Apparel Group Inc JNY 584 584 (0%) 608 608 0%
KB Home KBH 405 405 0% 332 332 0%
Kellogg Co K 1,201 1,143 (5%) 1,076 1,036 (4%)
Kerr-Mcgee Corp KMG 759 693 (9%) 1,493 1,440 (4%)
Keycorp KEY 1,438 1,396 (3%) 2,318 2,277 (2%)
Keyspan Corp KSE 801 709 (11%) 732 645 (12%)
Kimberly-Clark Corp KMB 2,518 2,433 (3%) 2,589 2,441 (6%)
Kinder Morgan Inc KMI 384 377 (2%) 395 388 (2%)

The Magic of Pension Accounting 27 September 2002
156
Ticker 2001Adjusted Operating Income(Loss) 2000 Adjusted Operating Income(Loss)Company Name Symbol Op. Income/
(Loss)Adjusted %Difference Op.
Income/(Loss)Adjusted % Difference
King Pharmaceuticals Inc KG 378 378 0% 284 284 0%
Kla-Tencor Corp KLAC 456 456 0% 307 307 0%
Knight-Ridder Inc KRI 540 506 (6%) 686 652 (5%)
Kohls Corp KSS 850 850 0% 651 651 0%
Kroger Co KR 2,643 2,607 (1%) 2,534 2,497 (1%)
Leggett & Platt Inc LEG 362 352 (3%) 487 479 (2%)
Lehman Brothers Holdings Inc LEH 17,531 17,484 (0%) 21,319 21,271 (0%)
Lexmark Intl Inc-Cl A LXK 399 383 (4%) 457 437 (4%)
Lilly (Eli) & Co LLY 3,730 3,619 (3%) 3,560 3,461 (3%)
Limited Brands Inc LTD 748 748 0% 876 876 0%
Lincoln National Corp LNC 905 905 0% 1,017 1,013 (0%)
Linear Technology Corp LLTC 546 546 0% 374 374 0%
Liz Claiborne Inc LIZ 347 347 0% 325 325 0%
Lockheed Martin Corp LMT 1,543 666 (57%) 1,614 795 (51%)
Loews Corp LTR (230) (214) NM 4,639 4,683 1%
Louisiana-Pacific Corp LPX (122) (121) NM 100 101 1%
Lowes Cos LOW 1,798 1,798 0% 1,402 1,402 0%
LSI Logic Corp LSI (479) (479) NM 370 370 0%
Lucent Technologies Inc LU (7,613) (6,839) NM 4,051 2,602 (36%)
Manor Care Inc HCR 203 199 (2%) 139 136 (2%)
Marathon Oil Corp MRO 2,907 2,877 (1%) 2,276 2,254 (1%)
Marriott Intl Inc MAR 591 591 0% 817 817 0%
Marsh & McLennan Cos MMC 2,159 1,954 (9%) 2,177 1,986 (9%)
Marshall & Ilsley Corp MI 846 846 0% 760 760 0%
Masco Corp MAS 1,040 1,043 0% 1,057 1,060 0%
Mattel Inc MAT 648 639 (1%) 538 527 (2%)
Maxim Integrated Products MXIM 673 673 0% 385 385 0%
May Department Stores Co MAY 1,493 1,516 2% 1,747 1,754 0%
Maytag Corp MYG 299 311 4% 467 479 2%
MBIA Inc MBI 851 851 0% 769 769 0%
MBNA Corp KRB 4,989 4,987 (0%) 3,917 3,920 0%
McDermott Intl Inc MDR 50 6 (88%) 15 (50) (437%)
McDonalds Corp MCD 2,954 2,954 0% 3,133 3,133 0%
McGraw-Hill Companies MHP 783 711 (9%) 766 707 (8%)
McKesson Corp MCK 769 757 (2%) 208 200 (4%)
Meadwestvaco Corp MWV 330 162 (51%) 555 418 (25%)
Medimmune Inc MEDI 206 206 0% 184 184 0%
Medtronic Inc MDT 2,149 2,137 (1%) 1,878 1,869 (1%)
Mellon Financial Corp MEL 1,160 1,005 (13%) 2,217 2,079 (6%)
Merck & Co MRK 9,728 9,686 (0%) 9,089 9,034 (1%)
Mercury Interactive Corp MERQ 26 26 0% 63 63 0%
Meredith Corp MDP 152 150 (1%) 184 183 (1%)
Merrill Lynch & Co MER 20,420 20,383 (0%) 23,802 23,765 (0%)
Metlife Inc MET 1,820 1,745 (4%) 1,840 1,689 (8%)
MGIC Investment Corp/Wi MTG 963 962 (0%) 841 839 (0%)
Micron Technology Inc MU (82) (82) NM 2,310 2,310 0%
Microsoft Corp MSFT 11,720 11,720 0% 11,029 11,029 0%
Millipore Corp MIL 119 119 0% 173 173 0%
Mirant Corp MIR 1,019 1,024 0% 664 666 0%
Molex Inc MOLX 323 323 (0%) 316 316 (0%)
Moodys Corp MCO 402 396 (1%) 289 287 (1%)
Morgan Stanley MWD 26,550 26,618 0% 26,667 26,741 0%
Motorola Inc MOT (613) (629) NM 2,960 2,929 (1%)

The Magic of Pension Accounting 27 September 2002
157
Ticker 2001Adjusted Operating Income(Loss) 2000 Adjusted Operating Income(Loss)Company Name Symbol Op. Income/
(Loss)Adjusted %Difference Op.
Income/(Loss)Adjusted % Difference
Nabors Industries Ltd NBR 499 499 0% 180 180 0%
National City Corp NCC 2,884 2,776 (4%) 2,604 2,509 (4%)
National Semiconductor Corp NSM 273 274 0% 287 288 0%
Navistar International NAV 108 126 17% 719 739 3%
NCR Corp NCR 234 33 (86%) 270 68 (75%)
Network Appliance Inc NTAP 11 11 0% 136 136 0%
New York Times Co-Cl A NYT 465 476 2% 664 660 (1%)
Newell Rubbermaid Inc NWL 657 621 (6%) 891 854 (4%)
Newmont Mining Corp NEM 105 127 20% 235 234 (0%)
Nextel Communications NXTL 54 54 0% (1) (1) NM
Nicor Inc GAS 244 215 (12%) 94 61 (35%)
Nike Inc-Cl B NKE 1,068 1,068 0% 999 999 0%
Nisource Inc NI 1,009 954 (5%) 568 544 (4%)
Noble Corp NE 386 386 (0%) 270 269 (0%)
Nordstrom Inc JWN 281 286 2% 286 286 0%
Norfolk Southern Corp NSC 1,007 876 (13%) 798 763 (4%)
North Fork Bancorporation NFB 566 561 (1%) 479 473 (1%)
Northern Trust Corp NTRS 941 936 (0%) 974 970 (0%)
Northrop Grumman Corp NOC 1,004 462 (54%) 1,098 463 (58%)
Novell Inc NOVL (32) (32) NM 16 16 0%
Novellus Systems Inc NVLS 228 228 0% 288 288 0%
Nucor Corp NUE 160 160 0% 477 477 0%
Nvidia Corp NVDA 255 255 0% 130 130 0%
Occidental Petroleum Corp OXY 2,558 2,563 0% 2,925 2,920 (0%)
Office Depot Inc ODP 394 394 0% 349 349 0%
Omnicom Group OMC 968 968 0% 878 878 0%
Oracle Corp ORCL 3,571 3,571 0% 3,777 3,777 0%
Paccar Inc PCAR 492 494 0% 925 923 (0%)
Pactiv Corp PTV 397 254 (36%) 385 247 (36%)
Pall Corp PLL 184 182 (1%) 214 213 (1%)
Palm Inc PALM (163) (163) NM (392) (392) NM
Parametric Technology Corp PMTC 40 41 5% 13 15 13%
Parker-Hannifin Corp PH 379 349 (8%) 590 530 (10%)
Paychex Inc PAYX 364 364 0% 337 337 0%
Penney (J C) Co JCP 635 635 0% 56 56 0%
Peoples Energy Corp PGL 162 130 (20%) 159 109 (31%)
Peoplesoft Inc PSFT 252 252 0% 104 104 0%
Pepsi Bottling Group Inc PBG 676 670 (1%) 590 588 (0%)
Pepsico Inc PEP 4,408 4,364 (1%) 3,225 3,222 (0%)
Perkinelmer Inc PKI 151 146 (3%) 184 183 (1%)
Pfizer Inc PFE 10,801 10,717 (1%) 8,670 8,609 (1%)
PG&E Corp PCG 2,736 2,483 (9%) (4,807) (5,234) NM
Pharmacia Corp PHA 2,701 2,661 (1%) 2,822 2,797 (1%)
Phelps Dodge Corp PD (77) (108) NM 294 271 (8%)
Philip Morris Cos Inc MO 16,295 15,868 (3%) 14,567 14,119 (3%)
Phillips Petroleum Co P 3,579 3,603 1% 3,857 3,840 (0%)
Pinnacle West Capital PNW 675 660 (2%) 676 654 (3%)
Pitney Bowes Inc PBI 997 962 (3%) 995 963 (3%)
Plum Creek Timber Co Inc PCL 256 258 1% 133 130 (2%)
PMC-Sierra Inc PMCS (170) (170) NM 176 176 0%
PNC Financial Svcs Group Inc PNC 1,793 1,763 (2%) 2,536 2,510 (1%)
Power-One Inc PWER (10) (10) NM 89 89 0%
PPG Industries Inc PPG 924 823 (11%) 1,202 1,073 (11%)

The Magic of Pension Accounting 27 September 2002
158
Ticker 2001Adjusted Operating Income(Loss) 2000 Adjusted Operating Income(Loss)Company Name Symbol Op. Income/
(Loss)Adjusted %Difference Op.
Income/(Loss)Adjusted % Difference
PPL Corp PPL 855 760 (11%) 1,202 1,154 (4%)
Praxair Inc PX 846 829 (2%) 817 794 (3%)
Price (T. Rowe) Group TROW 343 343 0% 468 468 0%
Principal Financial Grp Inc PFG 420 356 (15%) 821 775 (6%)
Procter & Gamble Co PG 6,459 6,485 0% 6,768 6,803 1%
Progress Energy Inc PGN 1,244 1,164 (6%) 720 682 (5%)
Progressive Corp-Ohio PGR 642 642 0% 114 114 0%
Providian Financial Corp PVN 1,621 1,621 0% 2,595 2,595 0%
Prudential Financial Inc PRU 420 (204) (149%) 1,203 701 (42%)
Public Service Entrp PEG 1,892 1,887 (0%) 1,889 1,864 (1%)
Pulte Homes Inc PHM 568 568 0% 415 415 0%
Qlogic Corp QLGC 87 87 0% 121 121 0%
Qualcomm Inc QCOM 611 611 0% 861 861 0%
Quintiles Transnational Corp QTRN 46 46 0% 8 8 0%
Qwest Communication Intl Inc Q 2,240 1,693 (24%) 3,575 3,074 (14%)
Radioshack Corp RSH 508 508 0% 630 630 0%
Rational Software Corp RATL (97) (97) NM 94 94 0%
Raytheon Co RTN 802 264 (67%) 1,625 1,119 (31%)
Reebok International Ltd RBK 184 184 0% 165 165 0%
Regions Finl Corp RF 1,118 1,109 (1%) 978 969 (1%)
Reliant Energy Inc REI 1,993 1,997 0% 1,879 1,809 (4%)
Robert Half Intl Inc RHI 188 188 0% 291 291 0%
Rockwell Automation ROK 298 264 (11%) 947 899 (5%)
Rockwell Collins Inc COL 395 358 (9%) 391 367 (6%)
Rohm & Haas Co ROH 456 352 (23%) 782 675 (14%)
Rowan Cos Inc RDC 125 123 (2%) 112 109 (2%)
Ryder System Inc R 253 223 (12%) 326 257 (21%)
Sabre Hldgs Corp-Cl A TSG (9) (6) NM 268 272 2%
Safeco Corp SAFC (89) (84) NM 332 332 0%
Safeway Inc SWY 2,632 2,546 (3%) 2,282 2,157 (5%)
Sanmina-Sci Corp SANM 275 275 0% 387 387 0%
Sara Lee Corp SLE 1,618 1,570 (3%) 1,743 1,706 (2%)
SBC Communications Inc SBC 10,923 8,923 (18%) 10,743 9,073 (16%)
Schering-Plough SGP 2,928 2,879 (2%) 3,095 3,048 (2%)
Schlumberger Ltd SLB 1,413 1,372 (3%) 898 848 (6%)
Schwab (Charles) Corp SCH 734 713 (3%) 1,419 1,400 (1%)
Scientific-Atlanta Inc SFA 417 415 (1%) 203 197 (3%)
Sealed Air Corp SEE 420 422 0% 467 467 0%
Sears Roebuck & Co S 3,657 3,657 0% 3,686 3,719 1%
Sempra Energy SRE 993 929 (6%) 905 815 (10%)
Sherwin-Williams Co SHW 490 460 (6%) 567 538 (5%)
Siebel Systems Inc SEBL 358 358 0% 359 359 0%
Sigma-Aldrich SIAL 219 217 (1%) 216 213 (2%)
Simon Property Group Inc SPG 965 965 0% 984 984 0%
SLM Corp SLM 3,194 3,185 (0%) 3,601 3,593 (0%)
Snap-On Inc SNA 207 185 (11%) 269 245 (9%)
Solectron Corp SLR 448 448 0% 742 742 0%
Southern Co SO 2,391 2,163 (10%) 2,404 2,180 (9%)
Southtrust Corp SOTR 1,060 1,061 0% 903 902 (0%)
Southwest Airlines LUV 631 631 0% 1,021 1,021 0%
Sprint Fon Group FON 1,813 1,655 (9%) 2,834 2,635 (7%)
Sprint Pcs Group PCS (637) (619) NM (1,904) (1,904) NM
St Jude Medical Inc STJ 279 279 0% 240 240 0%

The Magic of Pension Accounting 27 September 2002
159
Ticker 2001Adjusted Operating Income(Loss) 2000 Adjusted Operating Income(Loss)Company Name Symbol Op. Income/
(Loss)Adjusted %Difference Op.
Income/(Loss)Adjusted % Difference
St Paul Cos SPC (1,186) (1,227) NM 1,568 1,499 (4%)
Stanley Works SWK 350 300 (14%) 341 315 (8%)
Staples Inc SPLS 526 526 0% 488 488 0%
Starbucks Corp SBUX 252 252 0% 192 192 0%
Starwood Hotels & Resorts Wrld HOT 651 634 (3%) 1,028 1,018 (1%)
State Street Corp STT 1,955 1,959 0% 1,825 1,826 0%
Stilwell Finl Inc SV 613 613 0% 1,036 1,036 0%
Stryker Corp SYK 473 474 0% 432 432 0%
Sun Microsystems Inc SUNW 1,845 1,845 0% 2,405 2,405 0%
Sungard Data Systems Inc SDS 406 406 0% 348 348 0%
Sunoco Inc SUN 633 606 (4%) 650 636 (2%)
Suntrust Banks Inc STI 2,952 2,919 (1%) 2,708 2,667 (2%)
Supervalu Inc SVU 575 565 (2%) 585 575 (2%)
Symbol Technologies SBL 107 109 2% 206 207 1%
Synovus Financial Cp SNV 714 714 0% 548 548 0%
Sysco Corp SYY 1,039 1,033 (1%) 810 804 (1%)
Target Corp TGT 2,747 2,729 (1%) 2,478 2,469 (0%)
Teco Energy Inc TE 423 402 (5%) 414 395 (4%)
Tektronix Inc TEK 63 48 (24%) 175 155 (11%)
Tellabs Inc TLAB 169 169 0% 1,001 1,001 0%
Temple-Inland Inc TIN 456 422 (7%) 546 522 (4%)
Tenet Healthcare Corp THC 2,193 2,193 0% 1,690 1,690 0%
Teradyne Inc TER (107) (103) NM 711 712 0%
Texas Instruments Inc TXN (224) (221) NM 2,554 2,554 0%
Textron Inc TXT 947 742 (22%) 1,580 1,395 (12%)
Thermo Electron Corp TMO 167 166 (1%) 198 196 (1%)
Thomas & Betts Corp TNB (8) (8) NM (218) (227) NM
Tiffany & Co TIF 310 310 0% 331 331 0%
TJX Companies Inc TJX 900 902 0% 888 886 (0%)
TMP Worldwide Inc TMPW 186 186 0% 159 159 0%
Torchmark Corp TMK 646 643 (0%) 617 615 (0%)
Toys R Us Inc TOY 384 384 0% 395 395 0%
Transocean Inc RIG 523 521 (0%) 115 115 (1%)
Tribune Co TRB 802 781 (3%) 1,033 955 (8%)
TRW Inc TRW 922 586 (36%) 1,011 670 (34%)
Tupperware Corp TUP 134 135 1% 144 146 1%
TXU Corp TXU 2,285 2,210 (3%) 2,477 2,394 (3%)
Tyco International Ltd TYC 7,958 7,834 (2%) 5,750 5,701 (1%)
U S Bancorp USB 4,927 4,801 (3%) 2,597 2,540 (2%)
Union Pacific Corp UNP 2,072 2,002 (3%) 2,018 1,953 (3%)
Union Planters Corp UPC 936 936 0% 846 846 0%
Unisys Corp UIS 270 43 (84%) 553 358 (35%)
United Parcel Service Inc UPS 3,888 3,666 (6%) 4,522 4,412 (2%)
United States Steel Corp X (285) (494) NM 62 (287) (563%)
United Technologies Corp UTX 3,581 3,409 (5%) 3,140 2,942 (6%)
Unitedhealth Group Inc UNH 1,572 1,572 0% 1,200 1,200 0%
Univision Communications Inc UVN 228 228 0% 263 263 0%
Unocal Corp UCL 1,085 1,064 (2%) 1,057 1,014 (4%)
Unumprovident Corp UNM 1,000 971 (3%) 1,047 871 (17%)
UST Inc UST 833 836 0% 753 751 (0%)
Veritas Software Co VRTS (567) (567) NM (558) (558) NM
Verizon Communications VZ 15,408 12,895 (16%) 14,565 10,464 (28%)
VF Corp VFC 559 560 0% 610 604 (1%)

The Magic of Pension Accounting 27 September 2002
160
Ticker 2001Adjusted Operating Income(Loss) 2000 Adjusted Operating Income(Loss)Company Name Symbol Op. Income/
(Loss)Adjusted %Difference Op.
Income/(Loss)Adjusted % Difference
Viacom Inc -Cl B VIA.B 1,580 1,556 (1%) 2,019 1,982 (2%)
Visteon Corp VC 75 154 105% 661 703 6%
Vitesse Semiconductor Corp VTSS (97) (97) NM 154 154 0%
Vulcan Materials Co VMC 370 346 (6%) 340 321 (6%)
Wachovia Corp WB 3,243 3,141 (3%) 2,644 2,639 (0%)
Walgreen Co WAG 1,398 1,398 0% 1,224 1,224 0%
Wal-Mart Stores WMT 10,064 10,064 0% 9,524 9,524 0%
Washington Mutual Inc WM 4,610 4,605 (0%) 3,619 3,619 0%
Waste Management Inc WMI 1,663 1,664 0% 1,787 1,810 1%
Waters Corp WAT 225 224 (0%) 211 211 (0%)
Watson Pharmaceuticals Inc WPI 303 303 0% 178 178 0%
Wellpoint Hlth Netwrk-Cl A WLP 823 825 0% 634 634 (0%)
Wells Fargo & Co WFC 8,827 8,617 (2%) 9,201 9,096 (1%)
Wendy's International Inc WEN 330 328 (0%) 310 308 (1%)
Weyerhaeuser Co WY 906 602 (34%) 1,690 1,435 (15%)
Whirlpool Corp WHR 813 682 (16%) 807 661 (18%)
Williams Cos Inc WMB 2,591 2,566 (1%) 1,841 1,826 (1%)
Winn-Dixie Stores Inc WIN 366 366 0% 274 274 0%
Worthington Industries WOR 72 72 0% 169 170 0%
Wrigley (Wm) Jr Co WWY 513 511 (0%) 463 457 (1%)
Wyeth WYE 3,691 3,687 (0%) 3,273 3,243 (1%)
Xcel Energy Inc XEL 1,726 1,591 (8%) 1,388 1,269 (9%)
Xerox Corp XRX 1,181 1,106 (6%) 998 875 (12%)
Xilinx Inc XLNX (19) (19) NM 475 475 0%
Xl Capital Ltd XL (760) (760) NM 409 409 0%
Yahoo Inc YHOO (96) (96) NM 321 321 0%
Yum Brands Inc YUM 866 867 0% 863 863 0%
Zimmer Hldgs Inc ZMH 318 319 0% 285 285 0%
Zions Bancorporation ZION 609 607 (0%) 493 488 (1%)
TOTALS 895,099 862,931 (4%) 991,384 955,305 (4%)
Source: Company data, CSFB estimates.

The Magic of Pension Accounting 27 September 2002
161
GlossaryAccumulated benefit obligation—often referred to as ABO. Represents the currentobligation that an employer has to an employee for services rendered to date. Unlike theprojected benefit obligation, the ABO does not take future salary increases intoconsideration. In the absence of salary increases, the ABO and PBO would be identical.
Accrued benefit pension cost. The excess of the cumulative pension expenserecognized by an employer on its financial statements and the actual cumulativecontributions that the employer has made to a defined benefit pension plan. An accruedor prepaid pension benefit may arise in cases where a company’s cumulativecontributions exceed its cumulative pension expense.
Actual return on plan assets. Represents actual change in the fair value of pension planassets. This amount is not subject to any smoothing and is more volatile than expectedreturn, which could be significantly different. Unlike the expected return on plan assets,the actual return on plan assets is not recognized in income.
Actuarial gains and losses. Gains and losses associated with differences between anactuary’s assumptions and actual experience.
Actuarial present value. An amount that reflects (a) the time value of money and (b) theprobability of payment (probabilities reflect likelihood of death, disability, withdrawal, orretirement).
Benefit payments. Amounts paid to retirees for work performed or services rendered tothe plan sponsor.
Compensation inflation rate. See “Salary inflation rate.”
Contributions. Payments made usually by an employer or a pension plan participant to apension plan to increase the plan’s assets.
Corridor. The trigger that is used to determine whether a company’s unrecognized gainsand losses have grown to a point where they will begin to require amortization andtherefore included in pension cost. Unrecognized gains and losses must be amortizedwhen they exceed the corridor, which is set at 10% of the larger of (a) the PBO or (b)the market-related asset value as of the beginning of the period in question.
Curtailment. An event that significantly reduces or completely eliminates the planbenefits to which employees will be entitled in the future.
Defined benefit plan. A pension plan that clearly defines the benefits to whichemployees will be entitled for work performed for the plan sponsor. May be based on anumber of factors, including years of service or salary. The precise amount of anemployer’s liability under a defined benefit plan is unknown, given the uncertaintyinherent in arriving at the present value of the obligation.
Defined contribution plan. A pension plan that entitles employees to periodiccontribution payments made by an employer (and by the employee in many cases) toan employee’s retirement account. Unlike a defined benefit pension plan, this type ofplan limits an employer’s liability to amounts actually contributed to an employee’sretirement account. All risk surrounding future performance is borne by the employee.

The Magic of Pension Accounting 27 September 2002
162
Discount rate. The rate applied to future benefit payments to determin their presentvalue and ultimately used to arrive at the PBO.
ERISA. Acronym for the Employee Retirement Income Security Act of 1974. The Actcreated the PBGC (see below) and established guidelines for defined benefit pensionplan management.
Expected return on plan assets. Represents the long-term return that a plan sponsorexpects to earn on assets invested in the pension plan. Also an amount that reducespension expense, thereby effectively acting as an enhancement to net income.
Funded status. The difference between (a) the fair value of pension plan assets and (b)the projected benefit obligation. A pension plan with an excess of (a) over (b) is referredto as overfunded, while a plan with an excess of (b) over (a) is referred to asunderfunded.
Interest cost. The increase in the PBO due to the passage of time, calculated bymultiplying the discount rate from prior year by beginning of year PBO.
Market-related value. An amount representing either fair value or some other systematicvaluation method that recognizes changes in the fair value of plan assets over a periodno greater than five years.
Minimum pension liability. The excess of the accumulated benefit obligation over the fairvalue of plan assets. Represents the smallest liability amount that a plan sponsor canreport in its financial statements.
Participant. An individual who has rendered services to a pension plan sponsor and isentitled to plan benefits.
PBGC. Acronym for the Pension Benefit Guaranty Corporation, a U.S. governmentalentity created by the ERISA. PBGC collects revenues in the form of insurancepremiums from private defined benefit pension plan sponsors, protecting the retirementincome of American workers if their employers go into bankruptcy.
Plan assets. The assets that an employer has committed to a trust solely for thepurpose of satisfying its future obligation to an employee for services rendered to theemployer. Plan assets increase with employer contributions to the pension plan, and theactual earnings on those assets, and decrease with benefit payments made to retireesfrom the plan.
Prepaid pension cost/(benefit). Represents the excess of a sponsor’s cumulativecontributions to a plan over the cumulative amount of pension expense recognized inincome to date.
Prior service cost. The cost of benefits granted to employees in the current period forwork or services rendered in the past.
Projected benefit obligation—often referred to as PBO. Represents the currentobligation that an employer has to an employee for services rendered to date. Unlike theaccumulated benefit obligation, the PBO takes future salary increases intoconsideration. In the absence of salary increases, the PBO and ABO would be identical.
Salary inflation rate. The rate at which actuaries assume employee salaries will grow.

The Magic of Pension Accounting 27 September 2002
163
Service cost. Represents the liability to the company arising during the current period forwork performed or services rendered in the same period.
Settlement. An action that relieves the pension plan from further obligation to aparticipant (i.e., a lump-sum, cash payment to a retired employee).
Sponsor. The name of the party who establishes a plan.
Transition cost. The excess of a company’s PBO over the fair value of plan assets onthe date that the company transitioned to FAS No. 87 (some time between January 1,1985 and January 1, 1987). The excess is to be amortized to expense over theremaining service life of active employees. To the extent that a company’s PBO wasless than the fair value of its plan assets on the date that the company transitioned toFAS No. 87, the company had a transition benefit. This benefit is amortized into incomeover the remaining service life of active employees.
Unrecognized gains and losses. The cumulative difference between actual andexpected plan asset returns. We refer to these amounts as “unexpected” gains andlosses.
Vested benefit obligation—often referred to as the VBO. Represents the value ofbenefits to which a plan participant is entitled as of the measurement date. Unlike theABO and PBO, the VBO increases on the date when an employee becomes entitled tobenefits and not on the date in which the benefits are earned.


TA1261
AMSTERDAM............. 31 20 5754 890ATLANTA ................... 1 404 897 2800BALTIMORE............... 1 410 659 8800BANGKOK ...................... 62 614 6000BEIJING.................... 86 10 6410 6611BOSTON..................... 1 617 556 5500BUDAPEST .................. 36 1 202 2188BUENOS AIRES....... 54 11 4394 3100CHICAGO ................... 1 312 750 3000FRANKFURT................. 49 69 75 38 0HOUSTON .................. 1 713 890 6700HONG KONG .............. 852 2101 6000JOHANNESBURG 27 11 343 2200
KUALA LUMPUR........ 603 2143 0366LONDON .................. 44 20 7888 8888MADRID .................... 34 91 423 16 00MELBOURNE............. 61 3 9280 1888MEXICO CITY ............. 52 5 283 89 00MILAN ............................ 39 02 7702 1MOSCOW................... 7 501 967 8200MUMBAI ..................... 91 22 230 6333NEW YORK ................ 1 212 325 2000PALO ALTO ............... 1 650 614 5000PARIS....................... 33 1 53 75 85 00PHILADELPHIA ......... 1 215 851 1000
SAN FRANCISCO...... 1 415 836 7600SÃO PAULO ............ 55 11 3841 6000SEOUL ....................... 82 2 3707 3700SHANGHAI............... 86 21 6881 8418SINGAPORE ................. 65 6212 2000SYDNEY..................... 61 2 8205 4433TAIPEI ...................... 886 2 2715 6388TOKYO....................... 81 3 5404 9000TORONTO.................. 1 416 352 4500WARSAW................... 48 22 695 0050WASHINGTON........... 1 202 354 2600ZURICH ....................... 41 1 333 55 55
Copyright Credit Suisse First Boston, and its subsidiaries and affiliates, 2002. All rights reserved.
This report is not directed to, or intended for distribution to or use by, any person or entity who is a citizen or resident of or located in any locality, state, country or other jurisdiction where such distribution, publication,availability or use would be contrary to law or regulation or which would subject Credit Suisse First Boston or its subsidiaries or affiliates (collectively "CSFB") to any registration or licensing requirement within suchjurisdiction. All material presented in this report, unless specifically indicated otherwise, is under copyright to CSFB. None of the material, nor its content, nor any copy of it, may be altered in any way, transmitted to, copiedor distributed to any other party, without the prior express written permission of CSFB. All trademarks, service marks and logos used in this report are trademarks or service marks or registered trademarks or servicemarks of CSFB.The information, tools and material presented in this report are provided to you for information purposes only and are not to be used or considered as an offer or the solicitation of an offer to sell or to buy or subscribe forsecurities or other financial instruments. CSFB may not have taken any steps to ensure that the securities referred to in this report are suitable for any particular investor. CSFB will not treat recipients of this report as itscustomers by virtue of their receiving this report. The investments and services contained or referred to in this report may not be suitable for you and it is recommended that you consult an independent investment advisorif you are in doubt about such investments or investment services. Nothing in this report constitutes investment, legal, accounting or tax advice, or a representation that any investment or strategy is suitable or appropriateto your individual circumstances, or otherwise constitutes a personal recommendation to you. CSFB does not advise on the tax consequences of investments and you are advised to contact an independent tax adviser.Please note in particular that the bases and levels of taxation may change.Information and opinions presented in this report have been obtained or derived from sources believed by CSFB to be reliable, but CSFB makes no representation as to their accuracy or completeness. CSFB accepts noliability for loss arising from the use of the material presented in this report, except that this exclusion of liability does not apply to the extent that such liability arises under specific statutes or regulations applicable to CSFB.This report is not to be relied upon in substitution for the exercise of independent judgment. CSFB may have issued, and may in the future issue, other reports that are inconsistent with, and reach different conclusionsfrom, the information presented in this report. Those reports reflect the different assumptions, views and analytical methods of the analysts who prepared them and CSFB is under no obligation to ensure that such otherreports are brought to the attention of any recipient of this report.
CSFB may, to the extent permitted by law, participate or invest in financing transactions with the issuer(s) of the securities referred to in this report, perform services for or solicit business from such issuers, and/or have aposition or holding, or other material interest, or effect transactions, in such securities or options thereon, or other investments related thereto. In addition, it may make markets in the securities mentioned in the materialpresented in this report. CSFB may, to the extent permitted by law, act upon or use the information or opinions presented herein, or the research or analysis on which they are based, before the material is published.CSFB may have, within the last three years, served as manager or co-manager of a public offering of securities for, or currently may make a primary market in issues of, any or all of the entities mentioned in this report ormay be providing, or have provided within the previous 12 months, significant advice or investment services in relation to the investment concerned or a related investment. Additional information is, subject to duties ofconfidentiality, available on request. Some investments referred to in this report will be offered solely by a single entity and in the case of some investments solely by CSFB, or an associate of CSFB or CSFB may be theonly market maker in such investments.Past performance should not be taken as an indication or guarantee of future performance, and no representation or warranty, express or implied, is made regarding future performance. Information, opinions andestimates contained in this report reflect a judgement at its original date of publication by CSFB and are subject to change without notice. The price, value of and income from any of the securities or financial instrumentsmentioned in this report can fall as well as rise. The value of securities and financial instruments is subject to exchange rate fluctuation that may have a positive or adverse effect on the price or income of such securities orfinancial instruments. Investors in securities such as ADR’s, the values of which are influenced by currency volatility, effectively assume this risk.Structured securities are complex instruments, typically involve a high degree of risk and are intended for sale only to sophisticated investors who are capable of understanding and assuming the risks involved. Themarket value of any structured security may be affected by changes in economic, financial and political factors (including, but not limited to, spot and forward interest and exchange rates), time to maturity, marketconditions and volatility, and the credit quality of any issuer or reference issuer. Any investor interested in purchasing a structured product should conduct their own investigation and analysis of the product and consultwith their own professional advisers as to the risks involved in making such a purchase.
Some investments discussed in this report may have a high level of volatility. High volatility investments may experience sudden and large falls in their value causing losses when that investment is realised. Those lossesmay equal your original investment. Indeed, in the case of some investments the potential losses may exceed the amount of initial investment and, in such circumstances, you may be required to pay more money tosupport those losses. Income yields from investments may fluctuate and, in consequence, initial capital paid to make the investment may be used as part of that income yield. Some investments may not be readilyrealisable and it may be difficult to sell or realise those investments, similarly it may prove difficult for you to obtain reliable information about the value, or risks, to which such an investment is exposed.This report may provide the addresses of, or contain hyperlinks to, websites. Except to the extent to which the report refers to CSFB’s own website material, CSFB has not reviewed any such site and takes noresponsibility for the content contained therein. Such address or hyperlink (including addresses or hyperlinks to CSFB’s own website material) is provided solely for your convenience and information and the content of anysuch website does not in any way form part of this document. Accessing such website or following such link through this report or CSFB’s website shall be at your own risk.This report is issued and distributed in Europe (except Switzerland) by Credit Suisse First Boston (Europe) Limited, One Cabot Square, London E14 4QJ, England, which is regulated in the United Kingdom by TheFinancial Services Authority (“FSA”). This report is being distributed in the United States by Credit Suisse First Boston Corporation; in Switzerland by Credit Suisse First Boston; in Canada by Credit Suisse First BostonSecurities Canada, Inc.; in Brazil by Banco de Investimentos Credit Suisse First Boston S.A; in Japan by Credit Suisse First Boston Securities (Japan) Limited; elsewhere in Asia/ Pacific by whichever of the following is theappropriately authorised entity in the relevant jurisdiction: Credit Suisse First Boston (Hong Kong) Limited, Credit Suisse First Boston Australia Equities Limited, Credit Suisse First Boston (Thailand) Limited, CSFBResearch (Malaysia) Sdn Bhd, Credit Suisse First Boston Singapore Branch, and elsewhere in the world by the relevant authorised affiliate of the above. Research on Taiwanese securities produced by Credit Suisse FirstBoston, Taipei Branch has been prepared and/or reviewed by a registered Senior Business Person.In jurisdictions where CSFB is not already registered or licensed to trade in securities, transactions will only be effected in accordance with applicable securities legislation, which will vary from jurisdiction to jurisdiction andmay require that the trade be made in accordance with applicable exemptions from registration or licensing requirements. Non-U.S. customers wishing to effect a transaction should contact a CSFB entity in their localjurisdiction unless governing law permits otherwise. U.S. customers wishing to effect a transaction should do so only by contacting a representative at Credit Suisse First Boston Corporation in the U.S.Please note that this research was originally prepared and issued by CSFB for distribution to their market professional and institutional investor customers. Recipients who are not market professional or institutionalinvestor customers of CSFB should seek the advice of their independent financial advisor prior to taking any investment decision based on this report or for any necessary explanation of its contents. This research mayrelate to investments or services of a person outside of the UK or to other matters which are not regulated by the FSA or in respect of which the protections of the FSA for private customers and/or the UK compensationscheme may not be available, and further details as to where this may be the case are available upon request in respect of this report.

TA1261