A semi-empirical hydration model (SEHM) for describing aqueous electrolyte solutions
Upload
independentCategory
view
1download
0
The Influence of PMS-Additive on the Electrode/Electrolyte Interfacesin LiFePO4/Graphite Li-Ion BatteriesK. Ciosek Hogstrom,† S. Malmgren,† M. Hahlin,† H. Rensmo,‡ F. Thebault,§ P. Johansson,§,∥
and K. Edstrom*,†,∥
†Department of Chemistry−Ångstrom Laboratory, Uppsala University, Box 538, SE-751 21 Uppsala, Sweden‡Department of Physics and Materials Science, Uppsala University, Box 516, SE-751 20 Uppsala, Sweden§Department of Applied Physics, Chalmers University of Technology, SE-412 96 Goteborg, Sweden∥Alistore-ERI, 33 rue Saint-Leu, 80039 Amiens cedex, France
*S Supporting Information
ABSTRACT: The influence of a film-forming additive, propargyl methanesulfonate(PMS), on electrochemical performance and electrode/electrolyte interface compositionof LiFePO4/graphite Li-ion batteries has been studied. Combined use of in-house X-rayphotoelectron spectroscopy (XPS) and soft and hard X-ray photoelectron spectroscopy(PES) enabled nondestructive depth profiling at four different probing depths in the 2−50 nm range. Cells cycled with PMS and LiPF6 in ethylene carbonate/diethyl carbonate(EC/DEC) were compared to a reference sample cycled without PMS. In the first cycle,PMS cells showed a higher irreversible capacity, which is explained by formation of athicker solid electrolyte interphase (SEI). After three cycles, the SEI thicknesses weredetermined to be 19 and 25 nm for the reference and PMS samples, respectively. Afterthe initial cycling, irreversible losses shown by the PMS cells were lower than those of thereference cell. This could be attributed to a different SEI composition and lowerdifferences in the amount of lithium between lithiated and delithiated electrodes for thePMS sample. It was suggested that PMS forms a triple-bonded radical on reduction, which further reacts with the electrolyte. ThePMS additive was shown to influence the chemical composition at the positive electrode/electrolyte interface. Thicker interfacelayers with higher C−O and smaller LiF contributions were formed on LiFePO4 cycled with PMS.
■ INTRODUCTION
Li-ion batteries have revolutionized the consumer electronicsmarket. At present, they are the most commonly used batteriesin low-power applications such as cameras, mobile phones, andlaptops. Their usage has been growing rapidly; nowadays, Li-ion batteries are also entering the high-power applicationsmarket. They are also an attractive technology for electricvehicles (EV); however, there are some issues that limit theirsuccessful implementation. Li-ion batteries are considered tooexpensive, and their lifetime and safety must be improved. ForEVs, lifetimes of more than 10 years are a requirement. Forlarge-scale storage, the lifetime must be even longer.Most negative electrode materials used in Li-ion batteries
operate at voltages that are outside the electrochemical stabilitywindow of the most typically used electrolytes (e.g., organicsolvents containing a lithium salt). Before the first lithium ionsare inserted into negative electrode materials such as graphite,there will be an electrolyte decomposition accompanied byirreversible consumption of some of the lithium ions. This leadsto the formation of a solid electrolyte interphase (SEI) and anirreversible loss of capacity because lithium is consumed in theformation of the SEI.1,2 The SEI covers the surface of thenegative electrode particles and ideally protects it from furtherelectrolyte reduction. For graphite, which is used as a negative
electrode in commercial batteries, the SEI will also protectparticles from cointercalation of solvent molecules andexfoliation.3 In general, the electrolytes used today willpassivate all negative electrode materials that react with lithiumbelow the potential of 0.8 V versus Li+/Li through theformation of an SEI layer.2 SEI has been extensively studied, asit has been shown to influence not only the irreversible capacitybut also the cyclability, rate capability, and thermal stability ofthe whole Li-ion battery.4−6 Furthermore, processes at thenegative electrode/electrolyte interface are considered as one ofthe major sources for a too rapid aging of a Li-ion battery.7
Film-forming additives can be used as one way of influencingthe composition and properties of the SEI, leading to improvedLi-ion battery performances. With few exceptions, the additivesthat are intended to change the interface chemistry have higherreduction potentials than other electrolyte components.Therefore, they are reduced prior to other electrolytecomponents. In the early days of Li-ion battery research, itwas shown that gaseous species, such as CO2,
8−10 SO2,11,12 and
N2O,8 improve the electrochemical performance and promote
Received: May 7, 2013Revised: October 6, 2013
Article
pubs.acs.org/JPCC
© XXXX American Chemical Society A dx.doi.org/10.1021/jp4045385 | J. Phys. Chem. C XXXX, XXX, XXX−XXX

formation of inorganic films on the graphite anode. None ofthese additives have been used in commercial batteries;however, the results encouraged interest in functional electro-lyte research, and many film-forming additives have since beenstudied. Among them, a great deal of focus has been put onstudying polymerizable monomers with one or more carbon−carbon double bonds. Vinylene carbonate (VC),13−17 vinylethylene carbonate,18,19 and vinyl acetate20,21 are just a fewexamples of investigated compounds. Nowadays, VC is themost well-known SEI precursor. It improves the long-termcycling of the batteries, and it is therfore widely used incommercial Li-ion batteries.In the present work, we have focused our attention on the
film-forming additive propargyl methanesulfonate (PMS). Thestructural formula for PMS is shown in Figure 1. In an earlier
report, it was found that PMS leads to improved cyclability of aLiCoO2/graphite cell and that it prevents graphite exfoliation inpropylene carbonate (PC) based electrolytes.22 It was alsoshown that the SEI formed when the cell was cycled 50 timeswith a PMS-PC based electrolyte was thinner than that formedduring cycles in an ethylene carbonate (EC) based electrolytewithout additive. However, in that study different solventmixtures were used, and the thicknesses were determined usingargon ion etching, which is known to cause decomposition ofunstable surface products.23 There is also a lack of comparisonbetween the PMS-derived SEI with an SEI formed without anyadditive.In the present work, graphite/LiFePO4 cells have been cycled
and studied with and without the PMS additive usingelectrochemical and surface characterization techniques. Theaim was to determine how the additive would influence thechemical composition of the electrode/electrolyte interface onboth graphite and LiFePO4 during the first cycles.Photoelectron spectroscopy (PES) was used to perform
surface depth gradient studies. Soft X-ray PES measurementswere performed at the MAX IV Laboratory. Here theoutermost part of the SEI surface is studied. XPS studieswere performed with an in-house instrument that reachesdeeper into the SEI, and the results are comparable to mostother studies found in the literature. Hard X-ray PES(HAXPES), which was measured at the Helmholtz CentreBerlin, reach down into the bulk and could thus probe thechemical composition of both the SEI as well as the bulk ofgraphite or LiFePO4. Excitation energies in a range from 280 to6900 eV were used, and the probing depth was varied in the 2to 50 nm range. Hence, we could perform nondestructivedepth-profiling of the electrode/electrolyte interfaces. Adetailed comparison of the depth gradients in the electrode/electrolyte interfaces of anodes and cathodes from cells cycledwith and without PMS additive could thus be obtained.
■ EXPERIMENTAL METHODSBattery Preparation. The anode slurry was made from a
mixture of 85 wt % potato-shaped graphite (Toyo Tanso), 3 wt
% KS6 graphite (Timcal), 2 wt % conductive carbon black(Super P, Erachem Comilog N.V.), and 10 wt % Kynar binder(vinylidene fluoride trifluoroethylene copolymer, Arkema) inN-methyl-2-pyrrolidone (NMP) solvent. The cathode slurryconsisted of 75 wt % hydrothermally synthesized carbon-coatedLiFePO4, 10 wt % conductive carbon black (Super P, ErachemComilog N.V.), and 15 wt % Kynar binder in NMP solvent.Both slurries were ball-milled. The anode slurry was casted on acopper foil (13 μm thick) and the cathode slurry on analuminum foil (20 μm thick) using a Hosen pilot line, whichallowed the control of a reducible thickness of the coating. Theloading of the electrodes was controlled to allow for balancingbetween the anode and the cathode.Circular electrodes of a diameter of 2 cm were cut out,
moved to an argon-filled glovebox (≤1 ppm H2O, ≤1 ppm O),and dried for at least 5 h at 120 °C in a vacuum oven prior tocell assembly. The standard reference electrolyte was 1 M LiPF6in ethylene carbonate/diethyl carbonate (EC/DEC) in a 2:1volume ratio. In addition, 1 wt % of the film-forming additivepropargyl methanesulfonate (PMS) was added to some of theelectrolytes.PMS was synthesized following earlier published proce-
dures.24,25 All chemicals were purchased from Sigma-Aldrichand used without further purification. In detail, a 2 mL solutionof propargyl alcohol and a 3.6 mL solution of triethylaminewere added to 30 mL of dichloromethane cooled to 0 °C. A 4.1mL solution of methanesulfonyl chloride was then slowly addedover a period of 30 min. The solution was stirred at 0 °C forone hour. The mixture was then extracted with ice water, 10%hydrochloric acid at 0 °C, saturated sodium bicarbonatesolution, and brine. Dichloromethane solvent was evaporatedunder vacuum. The product was a colorless liquid at a 90%yield. Reported 1H NMR:25 2.66 ppm, t, 1H, J = 3 Hz (HCC−CH2−O−SO2−CH3); 3.10 ppm, s, 3H, (HCC−CH2−O-SO2−CH3); 4.86 ppm, d, 2H, J = 3 Hz (HCC−CH2−O−SO2−CH3). Experimental
1H NMR: 2.70 ppm, t, 1H; 3.11ppm, s, 3H; 4.84 ppm, d, 2H. A minor peak at 5.30 ppm in thespectrum indicates traces of dichloromethane remaining in theproduct; the 1H NMR characterization spectrum of the PMSadditive is available as Supporting Information.Full LiFePO4/graphite cells were assembled within the
glovebox in vacuum-sealed polymer-coated aluminum bags.The electrodes were balanced so that the graphite anode had20% extra capacity.
Electrochemical Measurements. All the electrochemicalmeasurements were carried out in LiFePO4/graphite full cells.Cyclic voltammetry was performed at a 0.01 mV s−1 sweep rateand galvanostatic cycling at C/10 between 2.7 and 4.2 V.Samples for interface analysis were collected after the thirdgalvanostatic cycle in charged or discharged state.
PES Measurements and Analysis. Special transfersystems were used to ensure transfer of samples from theglovebox to the PES instruments without contact with air.26
Caution was taken to avoid radiation damage; most of themeasurements were repeated on different batteries in order toobtain reproducible data. All the presented graphs representmeasurements performed on unwashed electrodes. However,the measurements have also been performed on electrodeswashed with DMC. This was done to keep the advantages ofboth treatments; unwashed samples guarantee that no SEIcomponents are washed off, whereas washed samples give auseful comparison and guarantee that not only the electrolytecomponents are being analyzed.
Figure 1. Chemical structure of the PMS additive.
The Journal of Physical Chemistry C Article
dx.doi.org/10.1021/jp4045385 | J. Phys. Chem. C XXXX, XXX, XXX−XXXB
Soft X-ray PES. The most surface sensitive measurementswere performed at the I411 beamline at MAX IV Laboratory,the Swedish synchrotron facility. The experiments were madein such a way that electrons emitted from all core levels hadsimilar kinetic energies (∼145 eV) and hence similar probingdepths. Therefore, C 1s spectra was measured with 430 eVexcitation energy (hυ), P 2p spectra with hυ = 280 eV, O 1sspectra with hυ = 680 eV, F 1s spectra with hυ = 835 eV, and S2p spectra with hυ = 325 eV. C 1s core levels were measuredfor all chosen excitation energies (besides hυ = 280 eV) toenergy calibrate the spectra. The slit through which the X-rayswere passing was reduced to less than 1 μm to reduceirradiation-related damage. The electron takeoff angle was 60°defined relative to the surface plane of the sample, and thetakeoff direction was collinear with the e-vector of the incidentphoton beam.In-House XPS. Measurements were performed on a PHI
5500 system with monochromatized 1486.6 eV Al Kα radiation.The electron takeoff angle was 45° defined relative to thesurface plane of the sample.Hard X-ray PES (HAXPES). More bulk sensitive measure-
ments were performed at the HIKE system, KMC-1 beamlineat the BESSY II synchrotron (Berlin, Germany). Two excitationenergies were chosen: 2300 eV, first-order radiation mono-chromatized by Si (111), and 6900 eV, first-order radiationmonochromatized by Si (422). For measurements performed at2300 eV, a 25 μm Be filter was used in order to reduceirradiation-related damage. The 6900 eV radiation was notfiltered because of its already lower intensity. The electrontakeoff angle was 80° defined relative to the surface plane of thesample, and the takeoff direction was collinear with the e-vectorof the incident photon beam.The combination of synchrotron PES and in-house XPS
measurements enabled the performance of a unique non-destructive depth profiling. The excitation energy was variedfrom 280 to 6900 eV, and samples were thus measured withfour different probing depths corresponding to ∼2, 11, 18, and47 nm. The probing depth is defined as 3 times the inelasticmean free path (λ), including 95% of the elastically emittedelectrons. Polyethylene inelastic mean free path values are usedto estimate the probing depth.27,28
Energy calibration was performed with respect to the C−HC 1s core level feature for graphite anode and with respect tothe C−C/C−H C 1s core level feature for LiFePO4 cathode,both set to 284.4 eV. PES spectra were fitted in CASA using a70% Gaussian and 30% Lorentzian mix for the Voigt peakshapes. The lithiated−delithiated carbon anode C 1s peak,termed the LixC, was an exception; in that case, an asymmetricpeak shape was used.29 In the presented graphs each spectrumwas normalized by the area of the respective core level signal.Quantifications were discussed using the cross section
corrected relative intensities Ij, given by the following equation:
=∑
σ
σ
Ij
A
iA
j
j
i
i (1)
where A is the detected core level peak area and σ is theScofield theoretical photoionization cross section.30 The SEIthickness d was calculated from the following equation:
λ θ= −d Iln( ) sin( )Li Cx (2)
where ILixC is the relative intensity of the C 1s LixC feature, λthe inelastic mean free path, and θ the electron takeoff angledefined relative to the surface plane of the sample. Thethickness calculations were based on a model assuming thatbelow a depth d, corresponding to the SEI thickness, theelectrode consists of LixC only. Thickness calculations are usedto give approximate values in order to be able to compare therelative thicknesses in the different cases. The thicknesscalculations were based on the 2300 eV lithiated graphitedata. More details about the experimental part of this study andthe performed analysis can be found in previous workperformed by some of us.28
■ RESULTS AND DISCUSSIONElectrochemical Studies. Cyclic voltammograms (CVs)
for a LiFePO4/graphite cell with PMS additive as well as for areference cell without additive are shown in Figure 2. As
expected, the typical intercalation processes for the graphiteand LiFePO4 are observed in the 3.1−3.5 V range in the CV,whereas peaks corresponding to reduction of electrolyte andSEI formation can be found below 3.0 V. The reference cell(without PMS) exhibited a reductive peak at 2.62 V (0.86 V vsLi+/Li), which corresponds to solvent reduction. The PMS cellexhibited a small reductive peak at 1.42 V (2.06 V vs Li+/Li),which may be attributed to reduction of trace oxygen in theelectrolyte.31 The peak at 2.10 V (1.38 V vs Li+/Li)corresponds to the reduction of the PMS additive, previouslyreported to take place at 1.24 V versus Li+/Li.22 The third peakin the CV of the PMS sample indicates that solventdecomposition (0.86 V vs Li+/Li) is not fully suppressed, asthis is the typical potential where the SEI is formed as indicatedby the CV of the reference sample.Figure 3a shows the three first galvanostatic cycles for
LiFePO4/graphite full cells with and without PMS. Bothbatteries exhibit similar performance. However, the PMS cellshows slightly higher irreversible capacity in the first cycle andslightly lower irreversible capacity in the following cycles. Theirreversible capacities for both the PMS cell and the referencecell are plotted in Figure 3b. The higher irreversible capacity inthe first cycle for the battery with the PMS additive couldindicate that a thicker SEI forms in the PMS cells. The lowerirreversible capacity in the following cycles could indicate thatthe SEI in the PMS cell gives a better long-term stability.On the basis of these results, we wanted to use a set of PES
measurements to better understand the surface chemistry of
Figure 2. Cyclic voltammogram of a LiFePO4/graphite cell cycled in astandard reference electrolyte and with a PMS additive, recorded witha sweep rate of 0.01 mV s−1.
The Journal of Physical Chemistry C Article
dx.doi.org/10.1021/jp4045385 | J. Phys. Chem. C XXXX, XXX, XXX−XXXC

both the graphite and the LiFePO4 and determine how thesurface chemistry would be influenced by electrolytes that differonly in terms of an additive.Interface Studies. SEI Thickness in Lithiated Graphite
Anode. The graphite selected for this study is of a standardtype with a ∼20 μm grain size. We are looking at the completeelectrodes, with binder, carbon black additive, and theelectroactive material. For the interface analysis the graphiteelectrodes were stopped after the third galvanostatic cycle ineither charged or discharged state.The PES depth profile (Figure 4) represents lithiated
graphite anode from cells cycled in the standard electrolyte,called reference, and in an electrolyte containing the PMSadditive. Similar depth profiles have previously been publishedfor cells cycled in the standard electrolyte,28 but in this study anew set of batteries was measured and an even more detaileddepth profiling was made by also including data measured withtraditional in-house XPS and by comparing results based onunwashed electrodes to samples that have been washed prior tomeasurements. In this way important trends could be followed.The C 1s spectra in the depth profile in Figure 4 show more
of the bulk components with probing depth (by increasing theenergy of the incoming X-ray). The lithiated carbon LixC peakat 282.0 eV in the C 1s spectra becomes clearly visible as theprobing depth increases. Cells cycled with PMS additive show asmaller LixC intensity, which indicates that the SEI formed isthicker than that of the reference samples. This is based on themeasurements showing strong LixC signals. The thickness ofthe SEI was estimated to be 19 and 25 nm for the reference andPMS samples, respectively. This result is in agreement with theelectrochemical studies, which indicated that a thicker SEI isformed with the PMS additive.SEI Composition in Lithiated Graphite Anode. Besides the
difference in thickness, similar trends with respect to the C 1sspectral features are observed in the graphite depth profiles forsamples cycled in a standard electrolyte and with the PMSadditive. We can see that the SEI is not homogeneous, e.g., theC−H contribution (284.4 eV in the C 1s spectra in Figure 4)decreases with probing depth, which indicates that hydro-carbon-containing compounds are more common in theoutermost part of the SEI further from the graphite surface.Turning to the P 2p spectra in Figure 4, we observe SEI
compounds containing P−F bonds (at a binding energy of
136.6 eV in the P 2p 3/2 spectra and 2151.9 eV in the P 1sspectra). Moreover, already in the most surface sensitivemeasurements we observe a small peak at lower bindingenergies, indicating compounds containing P−O/PO bonds(at the binding energy 133.7 eV in the P 2p 3/2 spectra and at2148.5 eV in P 1s). The relative intensity of both, P−F and P−O/PO features versus the other core levels is decreasing forprobing depths corresponding to 11 and 18 nm, indicating thatthese compounds are found in the outermost part of the SEI.This trend was observed in both unwashed and washedsamples; hence, this can not be attributed only to largeramounts of electrolyte residues in the outermost SEI.In the F 1s spectra shown in Figure 4, small amounts of
lithium fluoride, LiF (684.7 eV in F 1s) are detected closer tothe bulk material. These amounts are lower than earlierreported for similar graphite/LiPF6 electrolyte studies.5 Thereason for this is probably linked to the improved dataacquisition rate which allows better control over theexperimental conditions compared to measurements performed10 years ago. The relative intensity of the LiF feature was foundto increase during prolonged measurement time, indicating aslow reaction in the SEI forming the stable compound LiF dueto the X-ray exposure used in the experiment.Some compounds are not detectable when studying the
outermost SEI, but when probing deeper into the SEI theybecome visible. Lithium alkoxide, LiOR (∼530.2 eV in O 1s)and lithium oxide, Li2O (527.6 eV in O 1s), are two examplesof compounds that are detected only deeper in the electrode/electrolyte interface close to the bulk material. Li2O could beformed by reduction of Li2CO3 or during reaction of lithiatedcarbon with air.26,28 When comparing the contributions ofLiOR-species in the O 1s spectra in Figure 4, we note thatrelatively larger amounts of this compound are observed in thePES measurements of the SEI for the reference electrodecompared to an electrode cycled with PMS. However, we haveto keep in mind that the SEI is not homogeneous and that theLiOR contribution is observed to increase with probing depth.Because cells cycled with PMS have thicker SEI, we havedifferent sensitivity to the regions closest to the bulk material.We are less sensitive to compounds that are closer to the activematerial for the PMS sample compared to the reference sample.As a result, the signal from compounds which are preferentiallyfound close to the bulk of graphite, e.g. alkoxide, will be more
Figure 3. A graphite/LiFePO4 cell cycled with and without 1% PMS additive: comparison of the first three galvanostatic cycles (a) and the change inaverage irreversible capacity with standard deviation represented by error bars (b).
The Journal of Physical Chemistry C Article
dx.doi.org/10.1021/jp4045385 | J. Phys. Chem. C XXXX, XXX, XXX−XXXD

attenuated in the case of the thicker SEI in the PMS sample. Inview of this, it is difficult to compare the amounts of LiOR andLi2O for the different samples.In the O 1s spectra (Figure 4), the carbonate feature (∼531.8
eV in the O 1s spectra) slightly increases with probing depthfor both the reference and the PMS sample. In the referencesample, the contribution from ether-type compounds signifi-cantly decreases with probing depth, whereas in the PMSsample the O 1s core level intensity referred to oxygen in C−O
bonds (533.4 eV in O 1s) seems to be more constant. To betterunderstand these observations some different reductionmechanisms for EC will be discussed below.According to the literature, the most commonly suggested
EC reduction products are dilithium ethylene dicarbonate(LiOCO2CH2)2
32,33 and lithium carbonate (Li2CO3).32,34 It
was suggested that (LiOCO2CH2)2 is formed by reduction ofEC32,35
Figure 4. Depth profiling of lithiated graphite electrodes cycled in a standard reference electrolyte and with PMS additive. Probing depthcorresponds to ∼2, 11, 18, and 47 nm (from top to bottom in each figure).
The Journal of Physical Chemistry C Article
dx.doi.org/10.1021/jp4045385 | J. Phys. Chem. C XXXX, XXX, XXX−XXXE

+ + → +− +2(CH O) CO 2e 2Li (LiOCO CH ) C H2 2 2 2 2 2 4(3)
which has been proposed to further decompose to forminorganic salts by36
→ + + +(LiOCO CH ) Li CO C H CO 1/2O2 2 2 2 3 2 4 2 2(4)
or by electrochemical reduction5
+ + → ++ −(LiOCO CH ) 2Li 2e 2Li CO C H2 2 2 2 3 2 4 (5)
Our results of the reference sample show that the core levelsrepresenting C−O decrease with probing depth at the sametime as the carbonate feature is observed to grow. Taking intoconsideration that (LiOCO2CH2)2 contains both C−O andCO3 groups, whereas Li2CO3 has only carbonate bonds, theobserved depth gradients may be related to the fact that more(LiOCO2CH2)2 is found in the outermost part of SEI and moreLi2CO3 deeper in the SEI.In the PMS sample, the ratio between CO3 and C−O
features is more similar at all the measured probing depths.Together with the significantly higher hydrocarbon intensity inthe PMS sample spectra, this indicates that even though the SEIcomposition seems to be relatively similar in the two types ofsamples different SEI formation mechanisms and differentproducts are formed on the sample with this additive.Specific Variations in SEI Composition for Lithiated
and Delithiated Graphite Electrodes. To gain more insightinto the differences in SEI composition between the referenceand PMS samples, lithiated and delithiated graphite electrodesfrom PMS cells as well as from reference cells were studied andcompared.For both the reference and PMS samples, the LixC and
lithium intensity varies significantly between lithiated anddelithiated state, as shown in Figures 5 and 6. According toFigure 5, lithiation is accompanied by higher relative intensityof hydrocarbon and C−O-containing compounds, but slightlyhigher amounts of P−F and P−O/PO features also areobserved in the charged state. In the depth profiling study weshowed that all those compounds are mainly detected in theoutermost part of the SEI. This can be interpreted as theoutermost part of the SEI “growing” during lithiation of thegraphite electrode. It indicates that the SEI is quite dynamicallygrowing and shrinking during intercalation and deintercalation
of lithium in graphite after three cycles. Possibly, these changesmight also be linked to the irreversible capacity losses.To give a better description to the differences between the
PMS and reference samples, we will here give a detailed analysisof the Li 1s core level spectra of lithiated and delithiatedsamples, presented in Figure 6. The main peak at ∼55.6 eVcorresponds to the mixture of various SEI components. In thelithiated state, a peak at ∼53.5 eV also can be resolved. On thebasis of the difference between the binding energies for the C1s and Li 1s lithiated carbon features in previously publishedresults,37 the 53.5 eV feature matches the position of lithiatedcarbon, LixC. This is, to our knowledge, the first time that Li 1sspectra of an electrochemically lithiated graphite compositeelectrode has been detected with a probing depth sufficient toobtain a significant spectral contribution also from the lithiatedsubstrate. The corresponding peak in the C 1s spectra forlithiated carbon LixC is detected at 282.0 eV (Figure 6).The difference in the detected amounts of lithium
components, as represented in figure 5, between lithiated anddelithiated samples, is 3.0% for the PMS samples and 7.4% forthe reference samples. The lithiated carbon observed at lowbinding energy (∼53.5 eV in Li 1s) could not fully account forthese differences. A major part of the variation, 1.6% for PMSand 5.1% for the reference sample, corresponds to variations inthe main peak found at ∼55.6 eV in the Li 1s spectra, whichrefers to the lithium ions present in the SEI and not in the bulkmaterial. As the variation in the Li 1s intensity between lithiatedand delithiated electrodes is significantly smaller for the PMSsample, this may be interpreted as the SEI in the PMS sample ismore stable than the SEI in the reference sample. The lowerirreversible capacity loss seen beyond the first cycle in thesecells (Figure 3b) might be related to such increased SEIstability.It is important to note the small amounts (∼0.3%) of
detected sulfur in the SEI of graphite samples cycled in thePMS-containing electrolyte. Even smaller amounts of sulfurwere detected in a sample soaked with electrolyte (not cycled);in this case, the sulfur signal was barely detectable. In washed,cycled samples, the percentage of sulfur (0.4%) obtained waslarger than that in the SEI of the unwashed, cycled samples.This indicates that the sulfur, although in small quantities, ispart of the SEI and not only a rest product from the electrolyte.
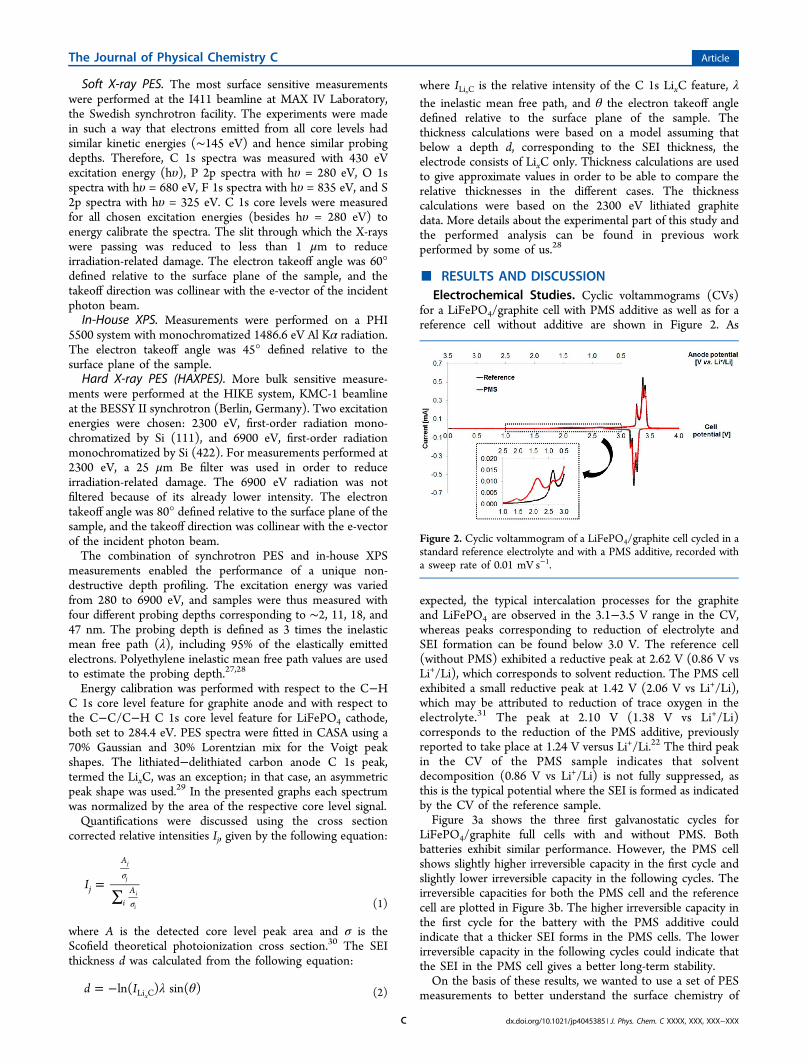
Decomposition of PMS. Figure 7 shows the depth profileof the S 2p/S 1s spectra of sulfur. The peak at the high binding
Figure 5. Relative intensities of detected core level peaks referred to different components for lithiated and delithiated graphite cycled with andwithout PMS additive. Probing depth in the measurements is ∼18 nm.
The Journal of Physical Chemistry C Article
dx.doi.org/10.1021/jp4045385 | J. Phys. Chem. C XXXX, XXX, XXX−XXXF

energy in the S 2p/S 1s spectra has a very similar bindingenergy to the PMS molecule (S 2p 3/2 168.5 eV, S 1s 2477.5eV).38 This indicates that a majority of the sulfur containingproduct has a similar sulfur environment as the PMS molecule.Such a product could be formed through the, e.g., exchange ofpropargyl with different hydrocarbon functional groups. Thefeature at lower binding energy (observed at 166.4 eV for the S2p 3/2 core level and at 2475.1 eV for S 1s) shows theformation of a new compound in which the sulfur is lesspositively charged. This compound could be lithium meth-anesulfonate.In Figure 8, a suggested reaction scheme for PMS reduction
is shown. It was previously suggested that PMS is reduced toform a methanesulfonate anion and a C−C triple-bonded
radical.22 Part of the methanesulfonate anions could react withlithium to form lithium methanesulfonate, which according tothe depth profile in Figure 8 is found in the deeper parts of theSEI. Methanesulfonate anions could also react with solventcomponents to form, for example, lithium methane sulfonateethyl carbonate. The C−C triple-bonded radical is proposed topolymerize; it could react with EC to form a SEI with highercontributions of hydrocarbon and C−O-containing compoundsthan found in the reference sample.
Thickness of the Surface Layer on LiFePO4 Cathode.The LiFePO4 sample is a standard compound with highcrystallinity and particle size in the 100 nm range. Also in thiscase the composite electrode including binder, carbon blackadditive, and the electroactive material was analyzed.
Figure 6. C 1s and Li 1s core level spectra for lithiated and delithiated graphite samples cycled with and without PMS additive. Probing depth ∼18nm.
The Journal of Physical Chemistry C Article
dx.doi.org/10.1021/jp4045385 | J. Phys. Chem. C XXXX, XXX, XXX−XXXG
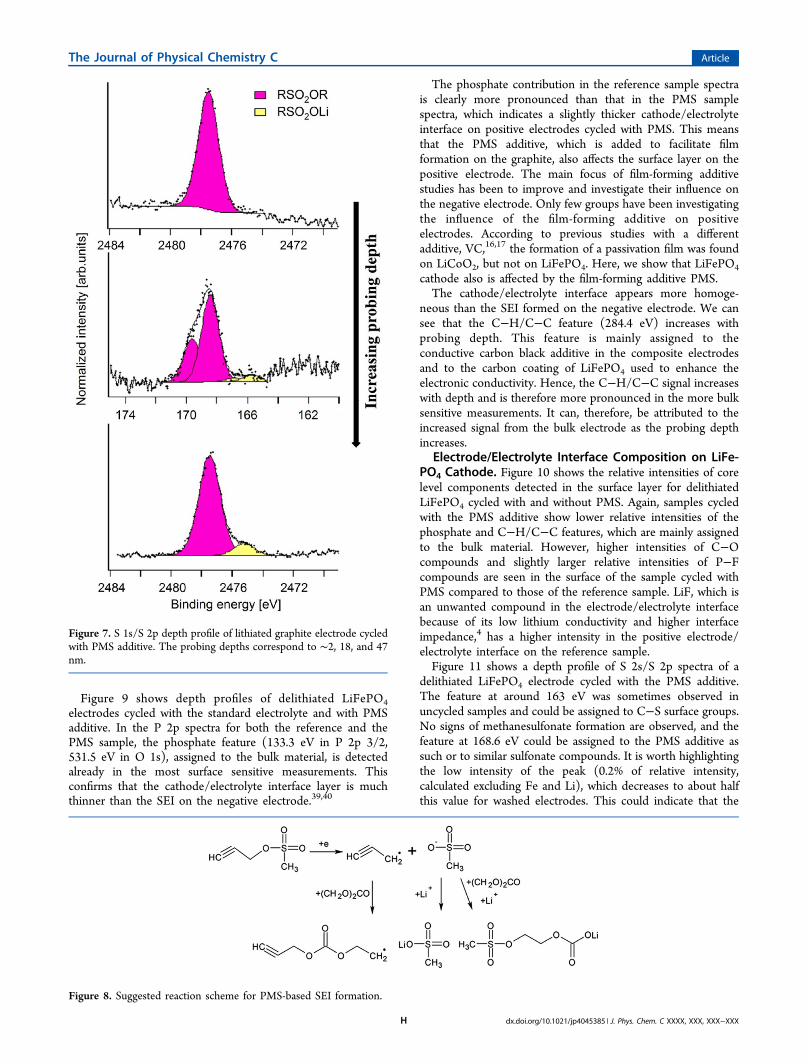
Figure 9 shows depth profiles of delithiated LiFePO4electrodes cycled with the standard electrolyte and with PMSadditive. In the P 2p spectra for both the reference and thePMS sample, the phosphate feature (133.3 eV in P 2p 3/2,531.5 eV in O 1s), assigned to the bulk material, is detectedalready in the most surface sensitive measurements. Thisconfirms that the cathode/electrolyte interface layer is muchthinner than the SEI on the negative electrode.39,40
The phosphate contribution in the reference sample spectrais clearly more pronounced than that in the PMS samplespectra, which indicates a slightly thicker cathode/electrolyteinterface on positive electrodes cycled with PMS. This meansthat the PMS additive, which is added to facilitate filmformation on the graphite, also affects the surface layer on thepositive electrode. The main focus of film-forming additivestudies has been to improve and investigate their influence onthe negative electrode. Only few groups have been investigatingthe influence of the film-forming additive on positiveelectrodes. According to previous studies with a differentadditive, VC,16,17 the formation of a passivation film was foundon LiCoO2, but not on LiFePO4. Here, we show that LiFePO4cathode also is affected by the film-forming additive PMS.The cathode/electrolyte interface appears more homoge-
neous than the SEI formed on the negative electrode. We cansee that the C−H/C−C feature (284.4 eV) increases withprobing depth. This feature is mainly assigned to theconductive carbon black additive in the composite electrodesand to the carbon coating of LiFePO4 used to enhance theelectronic conductivity. Hence, the C−H/C−C signal increaseswith depth and is therefore more pronounced in the more bulksensitive measurements. It can, therefore, be attributed to theincreased signal from the bulk electrode as the probing depthincreases.
Electrode/Electrolyte Interface Composition on LiFe-PO4 Cathode. Figure 10 shows the relative intensities of corelevel components detected in the surface layer for delithiatedLiFePO4 cycled with and without PMS. Again, samples cycledwith the PMS additive show lower relative intensities of thephosphate and C−H/C−C features, which are mainly assignedto the bulk material. However, higher intensities of C−Ocompounds and slightly larger relative intensities of P−Fcompounds are seen in the surface of the sample cycled withPMS compared to those of the reference sample. LiF, which isan unwanted compound in the electrode/electrolyte interfacebecause of its low lithium conductivity and higher interfaceimpedance,4 has a higher intensity in the positive electrode/electrolyte interface on the reference sample.Figure 11 shows a depth profile of S 2s/S 2p spectra of a
delithiated LiFePO4 electrode cycled with the PMS additive.The feature at around 163 eV was sometimes observed inuncycled samples and could be assigned to C−S surface groups.No signs of methanesulfonate formation are observed, and thefeature at 168.6 eV could be assigned to the PMS additive assuch or to similar sulfonate compounds. It is worth highlightingthe low intensity of the peak (0.2% of relative intensity,calculated excluding Fe and Li), which decreases to about halfthis value for washed electrodes. This could indicate that the
Figure 7. S 1s/S 2p depth profile of lithiated graphite electrode cycledwith PMS additive. The probing depths correspond to ∼2, 18, and 47nm.
Figure 8. Suggested reaction scheme for PMS-based SEI formation.
The Journal of Physical Chemistry C Article
dx.doi.org/10.1021/jp4045385 | J. Phys. Chem. C XXXX, XXX, XXX−XXXH

observed sulfur signal could largely be assigned to electrolyte
residuals. Further studies have to be performed to understand
the role of the sulfur in PMS on the positive electrode/
electrolyte interface.
■ CONCLUSIONS
This study demonstrates how a combination of nondestructive
depth profiling methods, using both soft and hard X-ray PES,
give information on the thickness and composition of the
surface layers when cycling a battery with the PMS additive.
Figure 9. Depth profile of delithiated LiFePO4 electrodes cycled in a standard reference electrolyte and with PMS additive. The probing depthscorrespond to ∼2, 11, and 18 nm.
Figure 10. Relative intensities of detected components for delithiated LiFePO4 cycled with and without PMS additive. The graph excludescontribution from lithium and iron. Probing depth ∼18 nm.
The Journal of Physical Chemistry C Article
dx.doi.org/10.1021/jp4045385 | J. Phys. Chem. C XXXX, XXX, XXX−XXXI

Our results show that the PMS additive decomposes prior tothe electrolyte; however, it does not completely inhibit solventdecomposition. PMS leads to formation of a thicker SEI; afterthree cycles it was estimated to be 19 and 25 nm thick forreference and PMS samples, respectively. It is suggested thatmethanesulfonate anions and C−C triple-bonded radicals areformed during PMS reduction. Some of the methanesulfonateanions could form lithium methanesulfonate. The C−C triple-bonded radical polymerizes, and it could react with solventcomponents to form an SEI with larger amounts ofhydrocarbon and a more constant CO3/C−O ratio for thePMS-cycled electrode compared to that for the referencesample.The SEI is not stable after three cycles, and during lithiation
further electrolyte decomposition takes place for both referenceand PMS samples, respectively. When cycling is performed withthe standard electrolyte, these processes involve changes inlithium intensity between lithiated and delithiated graphiteelectrodes that are larger than those in the case of the PMSsamples. This accumulation of lithium components couldexplain the higher irreversible capacity for the reference sample.The positive electrode/electrolyte interface also is influenced
by the PMS additive. A thicker electrode/electrolyte interfacewith higher contribution of C−O and smaller amount of LiF isfound on the LiFePO4 cathode cycled in the PMS-containingelectrolyte. There were no signs of PMS decomposition on thepositive electrode. Further studies have to be performed tounderstand the influence of the additive on interfacialproperties of the positive electrode.This study not only provides a better understanding of the
influence of PMS additive on Li-ion battery interfaces but alsodemonstrates a new, powerful technique for comparing sampleswith different SEI compositions. Compared to measurements
performed at only one probing depth or using more destructivemethods for depth-profiling such as Ar+ etching, nondestructivedepth profiling using both soft and hard X-ray PES gives anincreased and more reliable understanding of depth gradientspresent in the electrode/electrolyte interface.
■ ASSOCIATED CONTENT*S Supporting Information1H NMR characterization spectrum of the PMS additive. Thismaterial is available free of charge via the Internet at http://pubs.acs.org.
■ AUTHOR INFORMATIONCorresponding Author*Box 538, SE-751 21 Uppsala, Sweden. Tel: +46 18 471 3713.E-mail: [email protected] authors declare no competing financial interest.
■ ACKNOWLEDGMENTSThis work was funded by the Swedish Hybrid Vehicle Centre(SHC) and the Swedish Energy Agency (STEM), withadditional funding for F.T. from ÅngpanneforeningensForskningsstiftelse, which all are gratefully acknowledged. Weare thankful to Leif Nyholm, Torbjorn Gustafsson, StevenRenault, Bertrand Philippe at Uppsala University, MihaelaGorgoi at the Helmholtz Centre Berlin Bessy, and SusanneWilken at Chalmers for useful discussions and support.
■ REFERENCES(1) Peled, E. The Electrochemical Behavior of Alkali and AlkalineEarth Metals in Nonaqueous Battery SystemsThe Solid ElectrolyteInterphase Model. J. Electrochem. Soc. 1979, 126, 2047−2051.(2) Fong, R.; von Sacken, U.; Dahn, J. R. Studies of LithiumIntercalation into Carbons Using Nonaqueous Electrochemical Cells.J. Electrochem. Soc. 1990, 137, 2009−2013.(3) Nazri, G. A.; Pistoia, G. Lithium Batteries: Science andTechnology. In Lithium Batteries: Science and Technology; Springer:New York, 2003; Vol. 49.(4) Andersson, A. M.; Edstrom, K. Chemical Composition andMorphology of the Elevated Temperature SEI on Graphite. J.Electrochem. Soc. 2001, 148, A1100−A1109.(5) Andersson, A. M.; Herstedt, M.; Bishop, A. G.; Edstrom, K. TheInfluence of Lithium Salt on the Interfacial Reactions Controlling theThermal Stability of Graphite Anodes. Electrochim. Acta 2002, 47,1885−1898.(6) Verma, P.; Maire, P.; Novak, P. A Review of the Features andAnalyses of the Solid Electrolyte Interphase in Li-Ion Batteries.Electrochim. Acta 2010, 55, 6332−6341.(7) Vetter, J.; Novak, P.; Wagner, M. R.; Veit, C.; Moller, K.-C.;Besenhard, J. O.; Winter, M.; Wohlfahrt-Mehrens, M.; Vogler, C.;Hammouche, A. Ageing Mechanisms in Lithium-Ion Batteries. J. PowerSources 2005, 147, 269−281.(8) Besenhard, J. O.; Wagner, M. W.; Winter, M.; Jannakoudakis, A.D.; Jannakoudakis, P. D.; Theodoridou, E. Inorganic Film-FormingElectrolyte Additives Improving the Cycling Behaviour of MetallicLithium Electrodes and the Self-Discharge of Carbon-LithiumElectrodes. J. Power Sources 1993, 43−44, 413−420.(9) Chusid, O.; Ein Ely, Y.; Aurbach, D.; Babai, M.; Carmeli, Y.Electrochemical and Spectroscopic Studies of Carbon Electrodes inLithium Battery Electrolyte Systems. J. Power Sources 1993, 43−44,47−64.(10) Aurbach, D.; Ein-Eli, Y.; Chusid, O.; Carmeli, Y.; Babai, M.;Yamin, H. The Correlation Between the Surface Chemistry and thePerformance of Li-Carbon Intercalation Anodes for Rechargeable
Figure 11. S 1s/S 2p depth profile of a delithiated LiFePO4 electrodecycled with PMS additive. Probing depths correspond to ∼2 (top) and18 nm (bottom).
The Journal of Physical Chemistry C Article
dx.doi.org/10.1021/jp4045385 | J. Phys. Chem. C XXXX, XXX, XXX−XXXJ

“Rocking-Chair” Type Batteries. J. Electrochem. Soc. 1994, 141, 603−611.(11) Ein-Eli, Y.; Thomas, S. R.; Koch, V. R. New Electrolyte Systemfor Li-Ion Battery. J. Electrochem. Soc. 1996, 143, L195−L197.(12) Ein-Eli, Y.; Thomas, S. R.; Koch, V. R. The Role of SO2 as anAdditive. J. Electrochem. Soc. 1997, 144, 1159−1165.(13) Aurbach, D.; Gamolsky, K.; Markovsky, B.; Gofer, Y.; Schmidt,M.; Heider, U. On the Use of Vinylene Carbonate (VC) as an Additiveto Electrolyte Solutions for Li-Ion Batteries. Electrochim. Acta 2002,47, 1423−1439.(14) Herstedt, M.; Andersson, A. M.; Rensmo, H.; Siegbahn, H.;Edstrom, K. Characterisation of the SEI Formed on Natural Graphitein PC-Based Electrolytes. Electrochim. Acta 2004, 49, 4939−4947.(15) Herstedt, M.; Rensmo, H.; Siegbahn, H.; Edstrom, K.Electrolyte Additives for Enhanced Thermal Stability of the GraphiteAnode Interface in a Li-Ion Battery. Electrochim. Acta 2004, 49, 2351−2359.(16) El Ouatani, L.; Dedryvere, R.; Siret, C.; Biensan, P.; Reynaud, S.;Iratcabal, P.; Gonbeau, D. The Effect of Vinylene Carbonate Additiveon Surface Film Formation on Both Electrodes in Li-Ion Batteries. J.Electrochem. Soc. 2009, 156, A103.(17) El Ouatani, L.; Dedryvere, R.; Siret, C.; Biensan, P.; Gonbeau,D. Effect of Vinylene Carbonate Additive in Li-Ion Batteries:Comparison of LiCoO2/C, LiFePO4/C, and LiCoO2/Li4Ti5O12
Systems. J. Electrochem. Soc. 2009, 156, A468.(18) Hu, Y.; Kong, W.; Wang, Z.; Li, H.; Huang, X.; Chen, L. Effectof Morphology and Current Density on the Electrochemical Behaviorof Graphite Electrodes in PC-Based Electrolyte Containing VECAdditive. Electrochem. Solid-State Lett. 2004, 7, A442.(19) Chen, G.; Zhuang, G. V.; Richardson, T. J.; Liu, G.; Ross, P. N.Anodic Polymerization of Vinyl Ethylene Carbonate in Li-Ion BatteryElectrolyte. Electrochem. Solid-State Lett. 2005, 8, A344.(20) Yoshitake, H.; Abe, K.; Kitakura, T.; Gong, J. B.; Lee, Y. S.;Nakamura, H.; Yoshio, M. The Effect of Nano-Sized SEI Film Formedby Vinyl Acetate Additive for Li-Ion Batteries. Chem. Lett. 2003, 32,1−2.(21) Abe, K.; Yoshitake, H.; Kitakura, T.; Hattori, T.; Wang, H.;Yoshio, M. Additives-Containing Functional Electrolytes for Suppress-ing Electrolyte Decomposition in Lithium-Ion Batteries. Electrochim.Acta 2004, 49, 4613−4622.(22) Abe, K.; Hattori, T.; Kawabe, K.; Ushigoe, Y.; Yoshitake, H.Functional Electrolytes. J. Electrochem. Soc. 2007, 154, A810.(23) Andersson, A. M.; Henningson, A.; Siegbahn, H.; Jansson, U.;Edstrom, K. Electrochemically Lithiated Graphite Characterised byPhotoelectron Spectroscopy. J. Power Sources 2003, 119−121, 522−527.(24) Crossland, R. K.; Servis, K. L. A Facile Synthesis ofMethanesulfonate Esters. J. Org. Chem. 1970, 35, 3195−3196.(25) Jackson, W.; Perlmutter, P.; Smallridge, A. The Stereochemistryof Organometallic Compounds. XXXII. Hydrocyanation of Derivativesof Amino Alkynes. Aust. J. Chem. 1985, 41, 1201−1208.(26) Malmgren, S.; Ciosek, K.; Lindblad, R.; Plogmaker, S.; Kuhn, J.;Rensmo, H.; Edstrom, K.; Hahlin, M. Consequences of Air Exposureon the Lithiated Graphite SEI. Electrochim. Acta 2013, 105, 83−91.(27) Painter, L. R.; Arakawa, E. T.; Williams, M. W.; Ashley, J. C.Optical Properties of Polyethylene: Measurement and Applications.Radiat. Res. 1980, 83, 1−18.(28) Malmgren, S.; Ciosek, K.; Hahlin, M.; Gustafsson, T.; Gorgoi,M.; Rensmo, H.; Edstrom, K. Comparing Anode and CathodeElectrode/Electrolyte Interface Composition and Morphology UsingSoft and Hard X-Ray Photoelectron Spectroscopy. Electrochim. Acta2013, 97, 23−32.(29) Biesinger, M. C. X-ray Photoelectron Spectroscopy (XPS)Reference Pages. http://xpsfitting.blogspot.com/2008/12/graphite.html (accessed Apr 26, 2013).(30) Scofield, J. H. Theoretical Photoionization Cross Sections from 1 to1500 keV; Lawrence Livermore Laboratory, University of California:Livermore, CA, 1973; Vol. 257.
(31) Balbuena, P. B.; Wang, Y. Lithium-Ion Batteries Solid-Electrolyte Interphase. In Lithium-Ion Batteries Solid-ElectrolyteInterphase; Imperial College Press: London, 2004.(32) Wang, Y.; Nakamura, S.; Ue, M.; Balbuena, P. B. TheoreticalStudies to Understand Surface Chemistry on Carbon Anodes forLithium-Ion Batteries: Reduction Mechanisms of Ethylene Carbonate.J. Am. Chem. Soc. 2001, 123, 11708−18.(33) Yang, C. R.; Wang, Y. Y.; Wan, C. C. Composition Analysis ofthe Passive Film on the Carbon Electrode of a Lithium-Ion Batterywith an EC-Based Electrolyte. J. Power Sources 1998, 72, 66−70.(34) Kim, S.-P.; van Duin, A. C. T.; Shenoy, V. B. Effect ofElectrolytes on the Structure and Evolution of the Solid ElectrolyteInterphase (SEI) in Li-Ion Batteries: A Molecular Dynamics Study. J.Power Sources 2011, 196, 8590−8597.(35) Aurbach, D.; Levi, M. D.; Levi, E.; Schechter, A. Failure andStabilization Mechanisms of Graphite Electrodes. J. Phys. Chem. B1997, 101, 2195−2206.(36) Tasaki, K.; Goldberg, A.; Lian, J.-J.; Walker, M.; Timmons, A.;Harris, S. J. Solubility of Lithium Salts Formed on the Lithium-IonBattery Negative Electrode Surface in Organic Solvents. J. Electrochem.Soc. 2009, 156, A1019−A1027.(37) Wertheim, G. K.; Van Attekum, P. M. T. M.; Basu, S. ElectronicStructure of Lithium Graphite. Solid State Commun. 1980, 33, 1127−1130.(38) Lindberg, B. J.; Hamrin, K.; Johansson, G.; Gelius, U.; Fahlman,A.; Nordling, C.; Siegbahn, K. Molecular Spectroscopy by Means ofESCA II. Phys. Scr. 1970, 1, 286−298.(39) Herstedt, M.; Stjerndahl, M.; Nyten, A.; Gustafsson, T.;Rensmo, H.; Siegbahn, H.; Ravet, N.; Armand, M.; Thomas, J. O.;Edstrom, K. Surface Chemistry of Carbon-Treated LiFePO4 Particlesfor Li-Ion Battery Cathodes Studied by PES. Electrochem. Solid-StateLett. 2003, 6, A202−A206.(40) Dedryvere, R.; Maccario, M.; Croguennec, L.; Le Cras, F.;Delmas, C.; Gonbeau, D. X-Ray Photoelectron SpectroscopyInvestigations of Carbon-Coated LixFePO4 Materials. Chem. Mater.2008, 20, 7164−7170.
The Journal of Physical Chemistry C Article
dx.doi.org/10.1021/jp4045385 | J. Phys. Chem. C XXXX, XXX, XXX−XXXK
Copyright © 2022 FDOKUMEN