Characteristic Behavior of Polymer Electrolyte Fuel Cell Resistance during Cold Start
10
Characteristic Behavior of Polymer Electrolyte Fuel Cell Resistance during Cold Start Charles Chacko, a Ramaraja Ramasamy, a, * Soowhan Kim, a,b, * Manish Khandelwal, a, * and Matthew Mench a, ** ,z a Department of Mechanical and Nuclear Engineering, Fuel Cell Dynamics and Diagnostics Laboratory, The Pennsylvania State University, University Park, Pennsylvania 16802, USA b Hyundai Motor Corporation, Yongin, Korea In this study, experimental constant-current cold starts were performed on a polymer electrolyte fuel cell from -10°C to charac- terize high-frequency resistance behavior, water motion, and ice accumulation before, during, and after cold start. A diagnostic method for rapid and repeatable cold starts was developed and verified. Cold-start performance is found to be optimized when cell resistance is increasing prior to startup, which is indicative of polymer electrolyte membrane PEM dehydration. During cold start, cell resistance initially decreases due to PEM hydration by the product water. Interestingly, after a certain water-uptake capacity of the PEM is reached, resistance increases due to ice formation in and around the cathode catalyst layer CL, with some evidence of supercooled water flow at low currents. Utilizing lower startup currents apparently does not increase the PEM water-storage capability but does increase the total volume of ice formation in and around the CL. Lower startup currents were found to produce more total heat but at a reduced rate compared to high currents. Therefore, an acceptable current range exists for a given stack design which balances the total heat generation and time required to achieve a successful cold start. © 2008 The Electrochemical Society. DOI: 10.1149/1.2975189 All rights reserved. Manuscript submitted April 28, 2008; revised manuscript received July 30, 2008. Published September 10, 2008. Polymer electrolyte fuel cells PEFCs for automobile applica- tions still have many obstacles to overcome before mass production, including a rapid and damage-free start from frozen conditions. Be- cause water is a product of the fuel cell reaction, operating the PEFC below freezing temperatures is challenging; water produced by the electrochemical reaction can quickly solidify into ice, blocking the reaction sites of the catalyst layer CL, which can result in a failed start also known as freeze-out or accelerate local catalyst and ma- terial degradation. Of course, the cell can be heated by external means, but this requires additional energy, ultimately leading to a sacrifice in system efficiency. In an ideal scenario, the heat gener- ated by the electrochemical reaction would raise the cell temperature above 0°C before freeze-out occurs anywhere in the stack, allowing a damage-free self-start. During cold start, cell performance further suffers due to slug- gish kinetics as well as low polymer electrolyte membrane PEM conductivity associated with low temperatures. 1-6 Cappadonia et al. 5 showed that conductivity vs temperature vs T plots of water- saturated Nafion membranes revealed a significant decrease in at 0°C, indicating a phase change of water. For fully saturated Gore membranes, Tajiri et al. 4 attributed this decrease in conductivity to residual water diffusing out of the membrane during cool down, freezing, and increasing contact resistance between fuel cell compo- nents, which is also consistent with the view of He and Mench. 7-9 One metric of cold-start performance for a single fuel cell in an isothermal environment is the amount of water produced, m pro , be- fore a freeze-out occurs m pro = A M H 2 O 2F t=0 t=freeze-out idt 1 where A is the active area of the fuel cell, M H 2 O is the molecular weight of water, F is Faraday’s constant, t is the time from the beginning of startup until freeze-out, and i is the startup current density. Alternatively, cold-start performance can be described as a success, where the heat generated by the electrochemical reaction raises cell temperature above 0°C self-start, or as a failure, where the ice formation causes the reaction to cease before the cell rises above 0°C freeze-out. Many key parameters that affect cold-start performance have been identified in the literature, including mem- brane water content, startup current density, reactant gas-flow rates, and the phase of product water. It has been found that a dry membrane state prior to cold start is beneficial, because it increases the membrane water storage capacity. 4,10-14 During cold start, the membrane absorbs some of the product water, prolonging the time until freeze-out occurs. Directly related to membrane water content, the shutdown purge procedure has been shown to play a significant role, as a drier membrane results in increased cold-start performance 12,15 as well as an in- creased chance of self-start. 16,17 Furthermore, a shutdown purge that removes residual water in the CL has been shown to eliminate freeze/thaw cycle damage. 7-9,18,19 Utilizing a lower startup current density has also been shown to improve cold-start performance in various publications. 4,12,14,20 Specifically, Mao et al. 13 mentioned that lower current densities enable more water to be absorbed into a dry membrane. Tajiri et al. 4 explained that higher current densities may form a ice layer between the CL and diffusion media DM and cover reaction sites; hence, the CL pore space is not fully utilized for water storage. During startup, water removal by the reactant gas flow can impact performance as well. Oszcipok et al. 10,11 determined by statistical analysis that cathode air-flow rate significantly affects cold-start performance. It was also demonstrated by Yan et al. 17 that doubling the air-flow rate alone can result in self-start as opposed to freeze-out, indicating that water removal in the vapor phase can play a significant role during cold start. Several in situ imaging studies were performed to determine the phase of product water during cold start. Ishikawa et al. 21,22 showed that liquid water can exist on the cathode CL in a supercooled state at -10°C; however, Ge et al. 15,23 stated that liquid water cannot exist on the cathode CL below -1.5°C. The behavior of various fuel cell resistances has been studied in literature as well. Oszcipok et al. 10 measured the electrochemical impedance spectra during cold start and determined that high- frequency resistance HFR decreases during startup due to mem- brane hydration by product water. They also showed that charge- transfer resistance increases by an order of magnitude during startup as the electrochemical surface area is reduced by ice coverage. Tajiri et al. 4 also demonstrated that HFR decreases during cold start due to membrane hydration. In a later study, Oszcipok et al. 24 observed that HFR initially decreased, but exhibited a noticeable step increase during startup. This ohmic resistance was divided into membrane resistance and contact resistance; membrane resistance decreased due to membrane hydration, while contact resistance increased due to the freezing of product water. These key cold-start findings from existing literature are summarized in Table I. * Electrochemical Society Student Member. ** Electrochemical Society Active Member. z E-mail: [email protected] Journal of The Electrochemical Society, 155 11 B1145-B1154 2008 0013-4651/2008/15511/B1145/10/$23.00 © The Electrochemical Society B1145 Downloaded 11 Sep 2008 to 216.227.31.91. Redistribution subject to ECS license or copyright; see http://www.ecsdl.org/terms_use.jsp
-
Upload
independent -
Category
Documents
-
view
1 -
download
0
Transcript of Characteristic Behavior of Polymer Electrolyte Fuel Cell Resistance during Cold Start
Journal of The Electrochemical Society, 155 �11� B1145-B1154 �2008� B1145
Characteristic Behavior of Polymer Electrolyte Fuel CellResistance during Cold StartCharles Chacko,a Ramaraja Ramasamy,a,* Soowhan Kim,a,b,*Manish Khandelwal,a,* and Matthew Mencha,**,z
aDepartment of Mechanical and Nuclear Engineering, Fuel Cell Dynamics and Diagnostics Laboratory,The Pennsylvania State University, University Park, Pennsylvania 16802, USAbHyundai Motor Corporation, Yongin, Korea
In this study, experimental constant-current cold starts were performed on a polymer electrolyte fuel cell from −10°C to charac-terize high-frequency resistance behavior, water motion, and ice accumulation before, during, and after cold start. A diagnosticmethod for rapid and repeatable cold starts was developed and verified. Cold-start performance is found to be optimized when cellresistance is increasing prior to startup, which is indicative of polymer electrolyte membrane �PEM� dehydration. During coldstart, cell resistance initially decreases due to PEM hydration by the product water. Interestingly, after a certain water-uptakecapacity of the PEM is reached, resistance increases due to ice formation in and around the cathode catalyst layer �CL�, with someevidence of supercooled water flow at low currents. Utilizing lower startup currents apparently does not increase the PEMwater-storage capability but does increase the total volume of ice formation in and around the CL. Lower startup currents werefound to produce more total heat but at a reduced rate compared to high currents. Therefore, an acceptable current range exists fora given stack design which balances the total heat generation and time required to achieve a successful cold start.© 2008 The Electrochemical Society. �DOI: 10.1149/1.2975189� All rights reserved.
Manuscript submitted April 28, 2008; revised manuscript received July 30, 2008. Published September 10, 2008.
0013-4651/2008/155�11�/B1145/10/$23.00 © The Electrochemical Society
Polymer electrolyte fuel cells �PEFCs� for automobile applica-tions still have many obstacles to overcome before mass production,including a rapid and damage-free start from frozen conditions. Be-cause water is a product of the fuel cell reaction, operating the PEFCbelow freezing temperatures is challenging; water produced by theelectrochemical reaction can quickly solidify into ice, blocking thereaction sites of the catalyst layer �CL�, which can result in a failedstart �also known as freeze-out� or accelerate local catalyst and ma-terial degradation. Of course, the cell can be heated by externalmeans, but this requires additional energy, ultimately leading to asacrifice in system efficiency. In an ideal scenario, the heat gener-ated by the electrochemical reaction would raise the cell temperatureabove 0°C before freeze-out occurs anywhere in the stack, allowinga damage-free self-start.
During cold start, cell performance further suffers due to slug-gish kinetics as well as low polymer electrolyte membrane �PEM�conductivity associated with low temperatures.1-6 Cappadonia et al.5
showed that conductivity vs temperature �� vs T� plots of water-saturated Nafion membranes revealed a significant decrease in � at0°C, indicating a phase change of water. For fully saturated Goremembranes, Tajiri et al.4 attributed this decrease in conductivity toresidual water diffusing out of the membrane during cool down,freezing, and increasing contact resistance between fuel cell compo-nents, which is also consistent with the view of He and Mench.7-9
One metric of cold-start performance for a single fuel cell in anisothermal environment is the amount of water produced, mpro, be-fore a freeze-out occurs
mpro = AMH2O
2F �t=0
t=freeze-out
idt �1�
where A is the active area of the fuel cell, MH2O is the molecularweight of water, F is Faraday’s constant, t is the time from thebeginning of startup until freeze-out, and i is the startup currentdensity. Alternatively, cold-start performance can be described as asuccess, where the heat generated by the electrochemical reactionraises cell temperature above 0°C �self-start�, or as a failure, wherethe ice formation causes the reaction to cease before the cell risesabove 0°C �freeze-out�. Many key parameters that affect cold-startperformance have been identified in the literature, including mem-
* Electrochemical Society Student Member.** Electrochemical Society Active Member.
z E-mail: [email protected]
Downloaded 11 Sep 2008 to 216.227.31.91. Redistribution subject to E
brane water content, startup current density, reactant gas-flow rates,and the phase of product water.
It has been found that a dry membrane state prior to cold start isbeneficial, because it increases the membrane water storagecapacity.4,10-14 During cold start, the membrane absorbs some of theproduct water, prolonging the time until freeze-out occurs. Directlyrelated to membrane water content, the shutdown purge procedurehas been shown to play a significant role, as a drier membraneresults in increased cold-start performance12,15 as well as an in-creased chance of self-start.16,17 Furthermore, a shutdown purge thatremoves residual water in the CL has been shown to eliminatefreeze/thaw cycle damage.7-9,18,19 Utilizing a lower startup currentdensity has also been shown to improve cold-start performance invarious publications.4,12,14,20 Specifically, Mao et al.13 mentionedthat lower current densities enable more water to be absorbed into adry membrane. Tajiri et al.4 explained that higher current densitiesmay form a ice layer between the CL and diffusion media �DM� andcover reaction sites; hence, the CL pore space is not fully utilized forwater storage. During startup, water removal by the reactant gasflow can impact performance as well. Oszcipok et al.10,11 determinedby statistical analysis that cathode air-flow rate significantly affectscold-start performance. It was also demonstrated by Yan et al.17 thatdoubling the air-flow rate alone can result in self-start as opposed tofreeze-out, indicating that water removal in the vapor phase can playa significant role during cold start. Several in situ imaging studieswere performed to determine the phase of product water during coldstart. Ishikawa et al.21,22 showed that liquid water can exist on thecathode CL in a supercooled state at −10°C; however, Ge et al.15,23
stated that liquid water cannot exist on the cathode CL below−1.5°C.
The behavior of various fuel cell resistances has been studied inliterature as well. Oszcipok et al.10 measured the electrochemicalimpedance spectra during cold start and determined that high-frequency resistance �HFR� decreases during startup due to mem-brane hydration by product water. They also showed that charge-transfer resistance increases by an order of magnitude during startupas the electrochemical surface area is reduced by ice coverage. Tajiriet al.4 also demonstrated that HFR decreases during cold start due tomembrane hydration. In a later study, Oszcipok et al.24 observed thatHFR initially decreased, but exhibited a noticeable step increaseduring startup. This ohmic resistance was divided into membraneresistance and contact resistance; membrane resistance decreaseddue to membrane hydration, while contact resistance increased dueto the freezing of product water. These key cold-start findings fromexisting literature are summarized in Table I.
CS license or copyright; see http://www.ecsdl.org/terms_use.jsp
t
B1146 Journal of The Electrochemical Society, 155 �11� B1145-B1154 �2008�B1146
This summary reveals that a gap in fuel cell literature existsregarding the behavior of cell resistance during cold start. This gapgives a motivation to perform experimental cold starts from −10°Cto elucidate the behavior of cell resistance before, during, and aftercold start. The objective of this study is to develop cell resistance asa diagnostic tool for cold-start performance as well as an indicatorfor the level of water present in the membrane and CL. Furthermore,the effect of startup current density on cold-start performance, cellresistance, and CL ice formation is investigated. Additionally, it isdesired to develop experimental techniques to allow for rapid andrepeatable cold starts, because existing approaches require lengthyreconditioning and purge procedures after freeze-out occurs.
Experimental
Experimental setup.— A single 5 cm2 parallel-channel cell wasused in this study. The flow fields consist of 13 straight, parallelchannels, each measuring 23 mm long by 1 mm wide and 0.4 mmand 0.6 mm deep on the anode and cathode, respectively. The landsmeasure 0.75 mm wide, giving a land-to-channel ratio of 0.75. Theflow-field plates are 1.3 cm thick gold-plated stainless steel whichalso serve as current collectors. Outside of the flow-field plates arehollow aluminum end plates to allow coolant fluid to pass throughfor high-temperature isothermal management. The membrane elec-trode assemblies �MEAs� used were reinforced Gore Primea 57 se-ries with 0.4 mg/cm2 Pt loading on each electrode and a dry mem-brane thickness of 18 �m. Sigracet SGL 10BB, carbon paper withmicroporous layer and 5% poly�tetrafluorethylene� additive, arealweight of 125 g/m2, measuring 420 �m � 70 �m thick, was usedas DM for both the anode and cathode. The heat capacity of the fuelcell itself is much greater than that of the MEA; therefore, the heatgenerated by the electrochemical reaction has a negligible impact onthe channel and land boundary temperature during operation. Thisresults in an experimental isothermal boundary condition, althoughthe local membrane and CL temperature can rise during currentdraw.
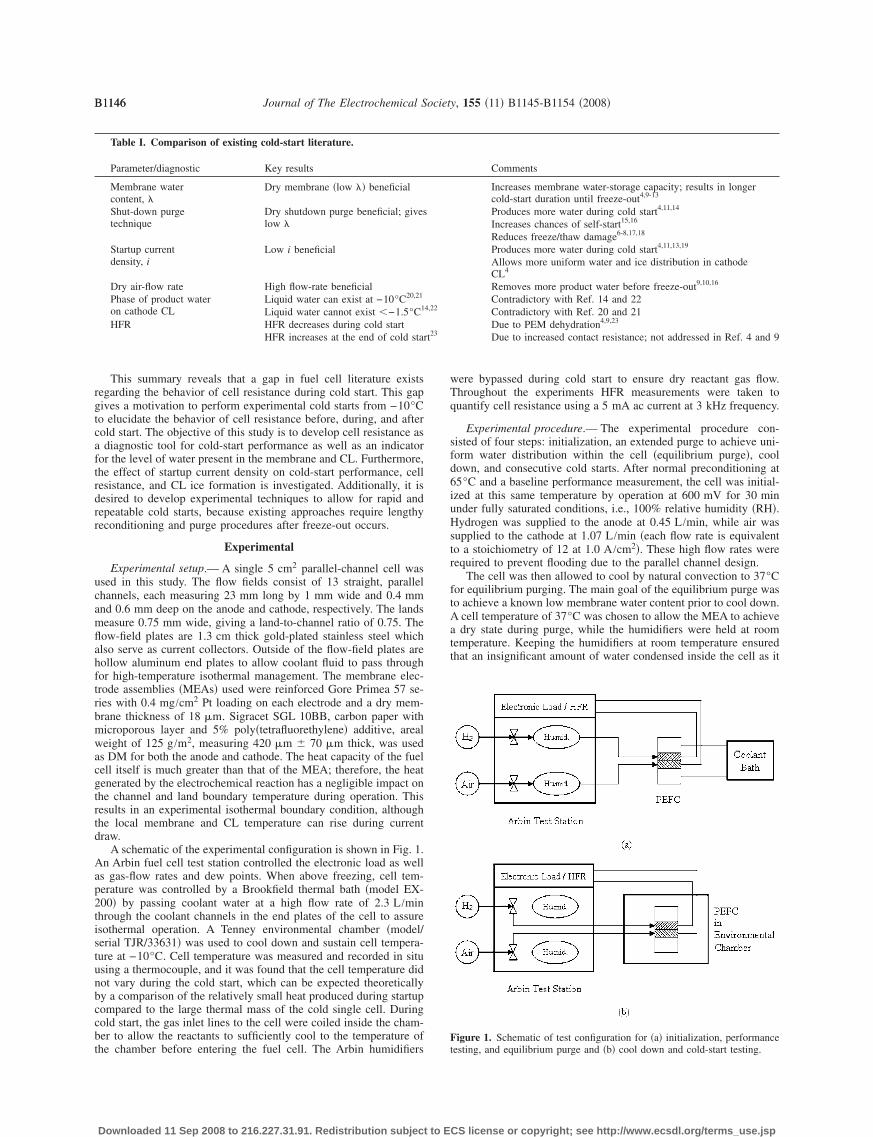
A schematic of the experimental configuration is shown in Fig. 1.An Arbin fuel cell test station controlled the electronic load as wellas gas-flow rates and dew points. When above freezing, cell tem-perature was controlled by a Brookfield thermal bath �model EX-200� by passing coolant water at a high flow rate of 2.3 L/minthrough the coolant channels in the end plates of the cell to assureisothermal operation. A Tenney environmental chamber �model/serial TJR/33631� was used to cool down and sustain cell tempera-ture at −10°C. Cell temperature was measured and recorded in situusing a thermocouple, and it was found that the cell temperature didnot vary during the cold start, which can be expected theoreticallyby a comparison of the relatively small heat produced during startupcompared to the large thermal mass of the cold single cell. Duringcold start, the gas inlet lines to the cell were coiled inside the cham-ber to allow the reactants to sufficiently cool to the temperature ofthe chamber before entering the fuel cell. The Arbin humidifiers
Table I. Comparison of existing cold-start literature.
Parameter/diagnostic Key results
Membrane watercontent, �
Dry membrane �low �� beneficial
Shut-down purgetechnique
Dry shutdown purge beneficial; giveslow �
Startup currentdensity, i
Low i beneficial
Dry air-flow rate High flow-rate beneficialPhase of product wateron cathode CL
Liquid water can exist at −10°C20,21
Liquid water cannot exist �−1.5°C1
HFR HFR decreases during cold startHFR increases at the end of cold star
Downloaded 11 Sep 2008 to 216.227.31.91. Redistribution subject to E
were bypassed during cold start to ensure dry reactant gas flow.Throughout the experiments HFR measurements were taken toquantify cell resistance using a 5 mA ac current at 3 kHz frequency.
Experimental procedure.— The experimental procedure con-sisted of four steps: initialization, an extended purge to achieve uni-form water distribution within the cell �equilibrium purge�, cooldown, and consecutive cold starts. After normal preconditioning at65°C and a baseline performance measurement, the cell was initial-ized at this same temperature by operation at 600 mV for 30 minunder fully saturated conditions, i.e., 100% relative humidity �RH�.Hydrogen was supplied to the anode at 0.45 L/min, while air wassupplied to the cathode at 1.07 L/min �each flow rate is equivalentto a stoichiometry of 12 at 1.0 A/cm2�. These high flow rates wererequired to prevent flooding due to the parallel channel design.
The cell was then allowed to cool by natural convection to 37°Cfor equilibrium purging. The main goal of the equilibrium purge wasto achieve a known low membrane water content prior to cool down.A cell temperature of 37°C was chosen to allow the MEA to achievea dry state during purge, while the humidifiers were held at roomtemperature. Keeping the humidifiers at room temperature ensuredthat an insignificant amount of water condensed inside the cell as it
Comments
Increases membrane water-storage capacity; results in longercold-start duration until freeze-out4,9-13
Produces more water during cold start4,11,14
Increases chances of self-start15,16
Reduces freeze/thaw damage6-8,17,18
Produces more water during cold start4,11,13,19
Allows more uniform water and ice distribution in cathodeCL4
Removes more product water before freeze-out9,10,16
Contradictory with Ref. 14 and 22Contradictory with Ref. 20 and 21Due to PEM dehydration4,9,23
Due to increased contact resistance; not addressed in Ref. 4 and 9
Figure 1. Schematic of test configuration for �a� initialization, performancetesting, and equilibrium purge and �b� cool down and cold-start testing.
4,22
23
CS license or copyright; see http://www.ecsdl.org/terms_use.jsp
B1147Journal of The Electrochemical Society, 155 �11� B1145-B1154 �2008� B1147
cooled to −10°C. During purging, 40% RH N2 at 1.07 L/min wasfed into the anode and cathode for an extended period of time,which gave a known water activity, a, upon completion. The mem-brane boundary water activity could then be related to membranewater content, �, by the Springer relationship1
� = 0.043 + 17.41a − 39.85a2 + 36.0a3 �2�
Equation 2 is valid at 30°C for Nafion 117 membranes, although ithas been used in many other recent publications over a wide varietyof temperatures and for various membrane types. We do have othermeasurements which show similar behavior for other membranes,although not the type in question. This fact alone does not make therelationship used in Eq. 2 more accurate but rather the only choicecurrently available in the open literature from which to make a rea-sonable estimation. Clearly, updated relationships for the particularmaterials used over a broader range of temperature conditions areneeded, although we believe the fundamental nature of the uptakeshould be similar, so the conclusions drawn based on the use of thisrelationship will not be significantly altered.
The purge was cycled on and off to determine when equilibriumin all cell components was obtained, because residual water in theDM or CL can rehydrate the membrane. During the off cycle of thepurge process, the inlets and outlets of the cell were closed, whichallowed the water distribution throughout the MEA and DM toequilibrate to remove any concentration differences that may occurthrough the MEA�DM structure during purging. The specific detailsof the purge cycle used to achieve a uniform water distribution of� = 3.1 for this cell are given in Table II.
After the equilibrium purge, the cell was placed in the environ-mental chamber and cooled to −10°C. The cell inlets and outletsremained closed in order for � to stay constant during cool down;the volume of the flow-field channels is 0.3 cm3, which can con-dense 4 �g of water during cool down from the dew point of21°C to −10°C. This amount of water, if fully absorbed by themembrane, gives an increase in � of only 0.01, which can be ne-glected. Therefore, � is assumed to remain constant at 3.1 during thecool-down procedure. The cool-down process took approximately2.5 h, which included a 1 h soak at −10°C to allow uniform tem-perature distribution throughout the cell. All cold starts performed inthis study occur from −10°C. Prior to cold start, the test station wasalso purged with dry gas directly from the gas cylinders to removeany residual water that may have accumulated in the pipelines dur-ing initialization or purging.
After the cell was sufficiently temperature soaked, dry reactantgases at −10°C were fed into the cell at 0.15 and 0.30 L/min�equivalent stoichiometries of 2.7 and 3.4 at 1.0 A/cm2� at the anodeand cathode, respectively, to allow for open-circuit voltage �OCV�stabilization. Cell resistance was recorded, and once reaching a spe-cific value �0.30 � cm2 unless otherwise specified�, the flow rateswere changed to 0.05 and 0.11 L/min �equivalent stoichiometries of12 and 12 at 0.1 A/cm2� at the anode and cathode, respectively. Acold start was then initiated by drawing a constant current from thecell while cell voltage and resistance were recorded. When cell volt-age dropped below a set value �50 mV� due to freeze-out, the elec-tronic load was automatically shut off. In this study, cold-start per-
Table II. Experimental procedure for equilibrium purge cycle (RH =
Step StageDuration
�min�
N2
Anode
I Purge 180 1.07II Relaxation 60 0III Purge 30 1.07IV Relaxation 30 0V Purge 30 1.07VI Relaxation 30 0
Downloaded 11 Sep 2008 to 216.227.31.91. Redistribution subject to E
formance was measured by the amount of water produced duringstartup, given by Eq. 1. The term “cold-start performance” is definedhere as the amount of water produced during the cold-start time untilfreeze-out occurs. This should not be confused with the generic termof fuel cell performance, which is related to polarization behavior.
It was found that if dry gas continued to flow through the cellafter freeze-out �termed cold purge�, OCV restabilized due to iceremoval by sublimation, and consecutive cold starts could be rapidlyperformed without the necessity of heating, initializing, and purgingthe cell again. Cold purging was performed by setting the flow ratesback to 0.15 and 0.30 L/min at the anode and cathode, respectively.Once the cell resistance again reached a specific value, the flow rateswere changed back to 0.05 and 0.1 L/min on the anode and cathode,respectively, and another cold start could be performed. This coldpurge/cold start/cold purge process could then be repeated. The per-formance of such successive cold starts was quite repeatable andrepresentative of the same behavior seen after a full equilibriumpurge. The process is described in more detail in the following sec-tions.
Results and Discussion
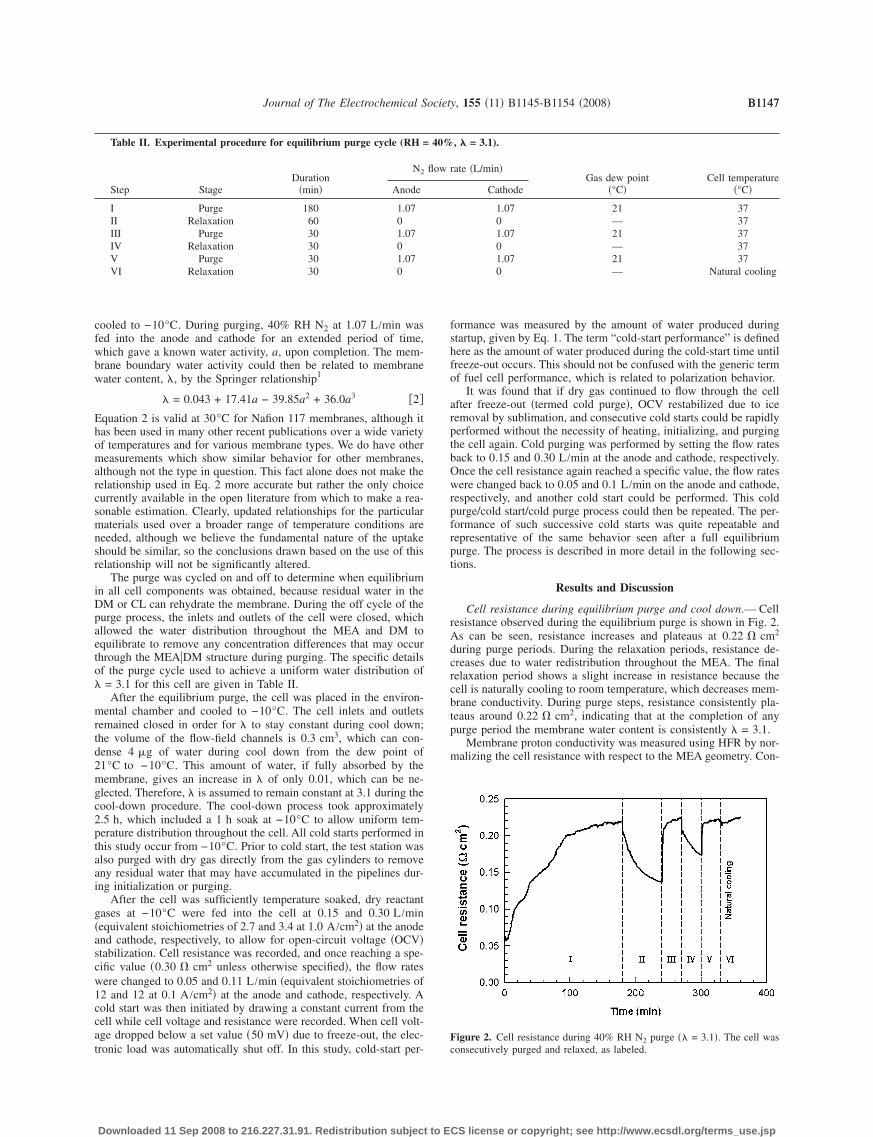
Cell resistance during equilibrium purge and cool down.— Cellresistance observed during the equilibrium purge is shown in Fig. 2.As can be seen, resistance increases and plateaus at 0.22 � cm2
during purge periods. During the relaxation periods, resistance de-creases due to water redistribution throughout the MEA. The finalrelaxation period shows a slight increase in resistance because thecell is naturally cooling to room temperature, which decreases mem-brane conductivity. During purge steps, resistance consistently pla-teaus around 0.22 � cm2, indicating that at the completion of anypurge period the membrane water content is consistently � = 3.1.
Membrane proton conductivity was measured using HFR by nor-malizing the cell resistance with respect to the MEA geometry. Con-
, � = 3.1).
rate �L/min�Gas dew point
�°C�Cell temperature
�°C�Cathode
1.07 21 370 — 371.07 21 370 — 371.07 21 370 — Natural cooling
Figure 2. Cell resistance during 40% RH N2 purge �� = 3.1�. The cell wasconsecutively purged and relaxed, as labeled.
40%
flow
CS license or copyright; see http://www.ecsdl.org/terms_use.jsp
B1148 Journal of The Electrochemical Society, 155 �11� B1145-B1154 �2008�B1148
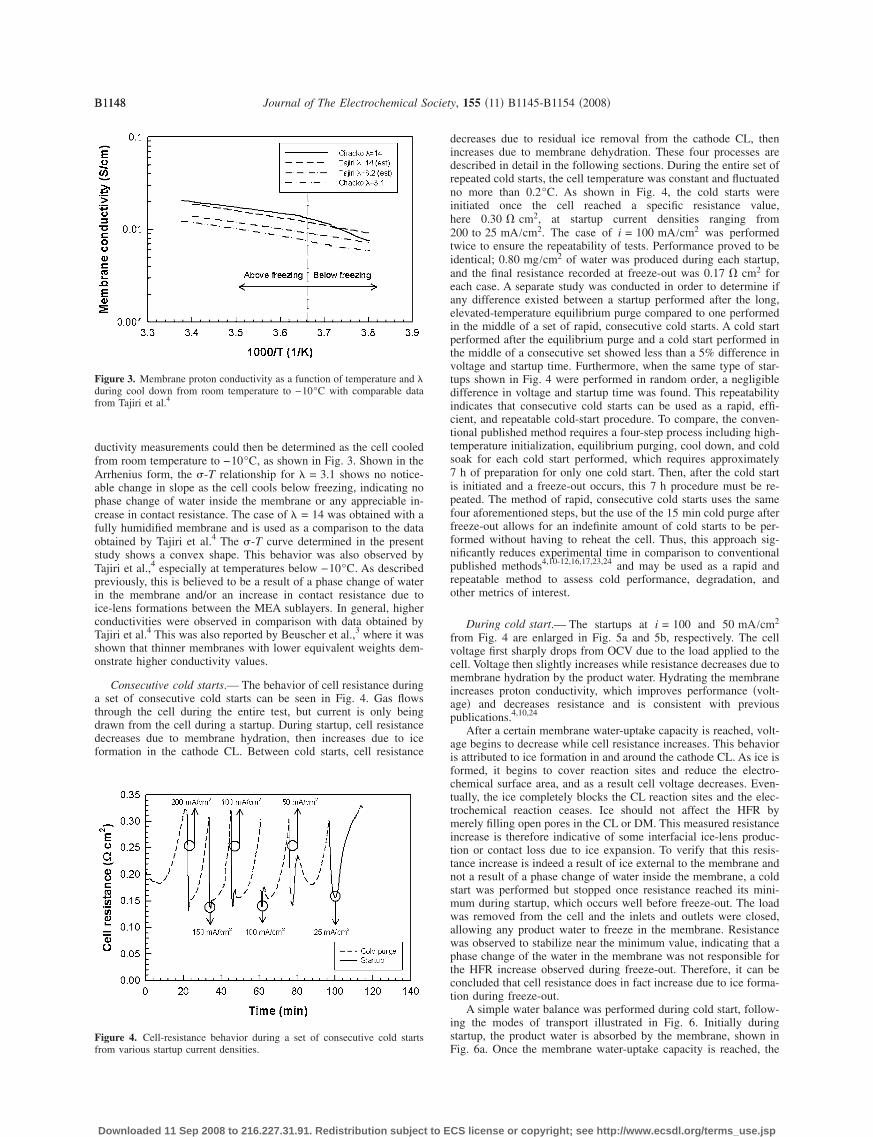
ductivity measurements could then be determined as the cell cooledfrom room temperature to −10°C, as shown in Fig. 3. Shown in theArrhenius form, the �-T relationship for � = 3.1 shows no notice-able change in slope as the cell cools below freezing, indicating nophase change of water inside the membrane or any appreciable in-crease in contact resistance. The case of � = 14 was obtained with afully humidified membrane and is used as a comparison to the dataobtained by Tajiri et al.4 The �-T curve determined in the presentstudy shows a convex shape. This behavior was also observed byTajiri et al.,4 especially at temperatures below −10°C. As describedpreviously, this is believed to be a result of a phase change of waterin the membrane and/or an increase in contact resistance due toice-lens formations between the MEA sublayers. In general, higherconductivities were observed in comparison with data obtained byTajiri et al.4 This was also reported by Beuscher et al.,3 where it wasshown that thinner membranes with lower equivalent weights dem-onstrate higher conductivity values.
Consecutive cold starts.— The behavior of cell resistance duringa set of consecutive cold starts can be seen in Fig. 4. Gas flowsthrough the cell during the entire test, but current is only beingdrawn from the cell during a startup. During startup, cell resistancedecreases due to membrane hydration, then increases due to iceformation in the cathode CL. Between cold starts, cell resistance
Figure 3. Membrane proton conductivity as a function of temperature and �during cool down from room temperature to −10°C with comparable datafrom Tajiri et al.4
Figure 4. Cell-resistance behavior during a set of consecutive cold startsfrom various startup current densities.
Downloaded 11 Sep 2008 to 216.227.31.91. Redistribution subject to E
decreases due to residual ice removal from the cathode CL, thenincreases due to membrane dehydration. These four processes aredescribed in detail in the following sections. During the entire set ofrepeated cold starts, the cell temperature was constant and fluctuatedno more than 0.2°C. As shown in Fig. 4, the cold starts wereinitiated once the cell reached a specific resistance value,here 0.30 � cm2, at startup current densities ranging from200 to 25 mA/cm2. The case of i = 100 mA/cm2 was performedtwice to ensure the repeatability of tests. Performance proved to beidentical; 0.80 mg/cm2 of water was produced during each startup,and the final resistance recorded at freeze-out was 0.17 � cm2 foreach case. A separate study was conducted in order to determine ifany difference existed between a startup performed after the long,elevated-temperature equilibrium purge compared to one performedin the middle of a set of rapid, consecutive cold starts. A cold startperformed after the equilibrium purge and a cold start performed inthe middle of a consecutive set showed less than a 5% difference involtage and startup time. Furthermore, when the same type of star-tups shown in Fig. 4 were performed in random order, a negligibledifference in voltage and startup time was found. This repeatabilityindicates that consecutive cold starts can be used as a rapid, effi-cient, and repeatable cold-start procedure. To compare, the conven-tional published method requires a four-step process including high-temperature initialization, equilibrium purging, cool down, and coldsoak for each cold start performed, which requires approximately7 h of preparation for only one cold start. Then, after the cold startis initiated and a freeze-out occurs, this 7 h procedure must be re-peated. The method of rapid, consecutive cold starts uses the samefour aforementioned steps, but the use of the 15 min cold purge afterfreeze-out allows for an indefinite amount of cold starts to be per-formed without having to reheat the cell. Thus, this approach sig-nificantly reduces experimental time in comparison to conventionalpublished methods4,10-12,16,17,23,24 and may be used as a rapid andrepeatable method to assess cold performance, degradation, andother metrics of interest.
During cold start.— The startups at i = 100 and 50 mA/cm2
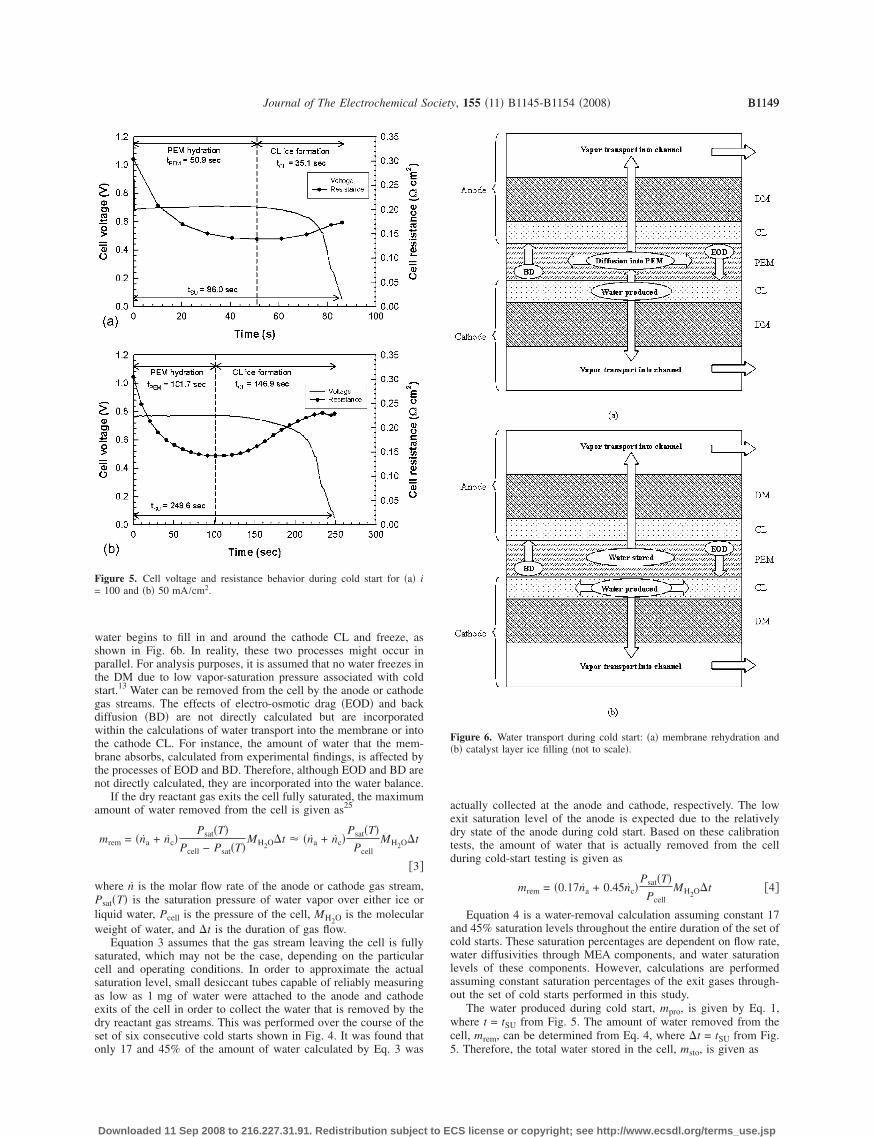
from Fig. 4 are enlarged in Fig. 5a and 5b, respectively. The cellvoltage first sharply drops from OCV due to the load applied to thecell. Voltage then slightly increases while resistance decreases due tomembrane hydration by the product water. Hydrating the membraneincreases proton conductivity, which improves performance �volt-age� and decreases resistance and is consistent with previouspublications.4,10,24
After a certain membrane water-uptake capacity is reached, volt-age begins to decrease while cell resistance increases. This behavioris attributed to ice formation in and around the cathode CL. As ice isformed, it begins to cover reaction sites and reduce the electro-chemical surface area, and as a result cell voltage decreases. Even-tually, the ice completely blocks the CL reaction sites and the elec-trochemical reaction ceases. Ice should not affect the HFR bymerely filling open pores in the CL or DM. This measured resistanceincrease is therefore indicative of some interfacial ice-lens produc-tion or contact loss due to ice expansion. To verify that this resis-tance increase is indeed a result of ice external to the membrane andnot a result of a phase change of water inside the membrane, a coldstart was performed but stopped once resistance reached its mini-mum during startup, which occurs well before freeze-out. The loadwas removed from the cell and the inlets and outlets were closed,allowing any product water to freeze in the membrane. Resistancewas observed to stabilize near the minimum value, indicating that aphase change of the water in the membrane was not responsible forthe HFR increase observed during freeze-out. Therefore, it can beconcluded that cell resistance does in fact increase due to ice forma-tion during freeze-out.
A simple water balance was performed during cold start, follow-ing the modes of transport illustrated in Fig. 6. Initially duringstartup, the product water is absorbed by the membrane, shown inFig. 6a. Once the membrane water-uptake capacity is reached, the
CS license or copyright; see http://www.ecsdl.org/terms_use.jsp
B1149Journal of The Electrochemical Society, 155 �11� B1145-B1154 �2008� B1149
water begins to fill in and around the cathode CL and freeze, asshown in Fig. 6b. In reality, these two processes might occur inparallel. For analysis purposes, it is assumed that no water freezes inthe DM due to low vapor-saturation pressure associated with coldstart.13 Water can be removed from the cell by the anode or cathodegas streams. The effects of electro-osmotic drag �EOD� and backdiffusion �BD� are not directly calculated but are incorporatedwithin the calculations of water transport into the membrane or intothe cathode CL. For instance, the amount of water that the mem-brane absorbs, calculated from experimental findings, is affected bythe processes of EOD and BD. Therefore, although EOD and BD arenot directly calculated, they are incorporated into the water balance.
If the dry reactant gas exits the cell fully saturated, the maximumamount of water removed from the cell is given as25
mrem = �na + nc�Psat�T�
Pcell − Psat�T�MH2O�t � �na + nc�
Psat�T�Pcell
MH2O�t
�3�
where n is the molar flow rate of the anode or cathode gas stream,Psat�T� is the saturation pressure of water vapor over either ice orliquid water, Pcell is the pressure of the cell, MH2O is the molecularweight of water, and �t is the duration of gas flow.
Equation 3 assumes that the gas stream leaving the cell is fullysaturated, which may not be the case, depending on the particularcell and operating conditions. In order to approximate the actualsaturation level, small desiccant tubes capable of reliably measuringas low as 1 mg of water were attached to the anode and cathodeexits of the cell in order to collect the water that is removed by thedry reactant gas streams. This was performed over the course of theset of six consecutive cold starts shown in Fig. 4. It was found thatonly 17 and 45% of the amount of water calculated by Eq. 3 was
Figure 5. Cell voltage and resistance behavior during cold start for �a� i= 100 and �b� 50 mA/cm2.
Downloaded 11 Sep 2008 to 216.227.31.91. Redistribution subject to E
actually collected at the anode and cathode, respectively. The lowexit saturation level of the anode is expected due to the relativelydry state of the anode during cold start. Based on these calibrationtests, the amount of water that is actually removed from the cellduring cold-start testing is given as
mrem = �0.17na + 0.45nc�Psat�T�
PcellMH2O�t �4�
Equation 4 is a water-removal calculation assuming constant 17and 45% saturation levels throughout the entire duration of the set ofcold starts. These saturation percentages are dependent on flow rate,water diffusivities through MEA components, and water saturationlevels of these components. However, calculations are performedassuming constant saturation percentages of the exit gases through-out the set of cold starts performed in this study.
The water produced during cold start, mpro, is given by Eq. 1,where t = tSU from Fig. 5. The amount of water removed from thecell, mrem, can be determined from Eq. 4, where �t = tSU from Fig.5. Therefore, the total water stored in the cell, m , is given as
Figure 6. Water transport during cold start: �a� membrane rehydration and�b� catalyst layer ice filling �not to scale�.
sto
CS license or copyright; see http://www.ecsdl.org/terms_use.jsp
B1150 Journal of The Electrochemical Society, 155 �11� B1145-B1154 �2008�B1150
msto = mpro − mrem �5�The water stored in the cell is utilized for either membrane hydra-tion or cathode CL ice formation. During cold start, the membranestores an amount of water, mPEM,act, given by
mPEM,act = mstotPEM
tSU�6�
where tPEM and tSU are determined from Fig. 5. The maximumamount of water that the membrane can store, mPEM,max, is given as
mPEM,max = MH2O�PEMdry��sat − �i�
EWA �7�
Typical membrane properties are assumed: �PEM = 18 �m, dry= 2000 kg/m3, EW = 0.95 kg/mol, and �sat = 14. Because themembrane is dried to some degree prior to startup, the exact value of�i, the initial membrane water content prior to startup, is difficult todetermine �see Between Cold Start section�, but it is assumed thatthe membrane is dried to �i � 3.1 prior to startup. For water-storagecalculation purposes only, we consider the membrane to be com-pletely dry at startup, i.e., �i = 0.043. This assumption accounts forthe absolute maximum amount of water the membrane can uptake�although it is not realistic to fully dry the membrane�.
The amount of water that is utilized for cathode CL ice forma-tion, mCL,act, is given as
mCL,act = mstotCL
tSU�8�
where tCL and tSU are determined from Fig. 5. The maximumamount of ice that the cathode CL can store, mCL,max, is given as
mCL,max = �CL�CLice + �satCL,edry
EWMH2OA �9�
The left term in parentheses in Eq. 9 represents the amount of waterthat can be stored in the pores of the cathode CL, while the rightterm represents the amount of water that can be stored in the elec-trolyte phase of the cathode CL. Typical CL properties are assumed:�CL = 10 �m, CL = 0.6, and CL,e = 0.2. To account for the maxi-mum cathode CL ice-storage capacity, it is assumed the CL is com-pletely free of ice prior to startup and becomes fully saturated atfreeze-out, i.e., �sat = 14.
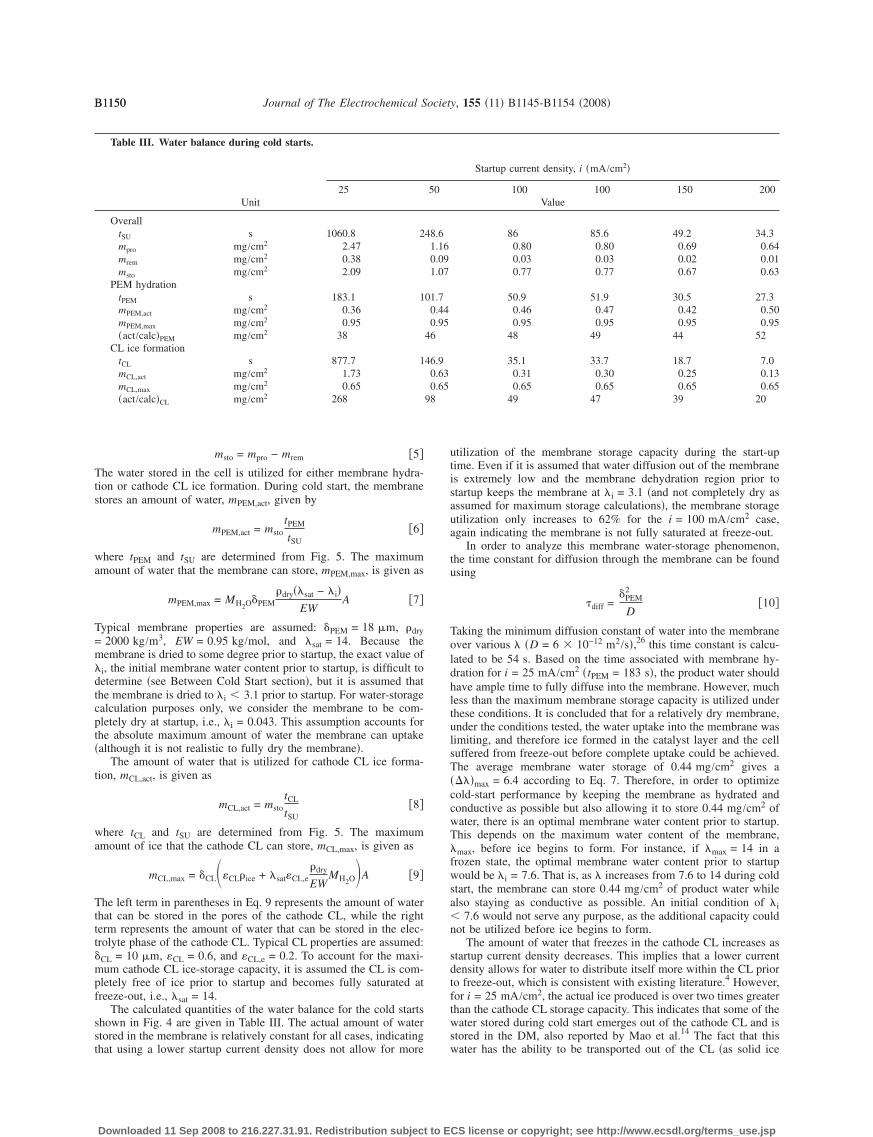
The calculated quantities of the water balance for the cold startsshown in Fig. 4 are given in Table III. The actual amount of waterstored in the membrane is relatively constant for all cases, indicatingthat using a lower startup current density does not allow for more
Table III. Water balance during cold starts.
Unit25
OveralltSU s 1060.8 2mpro mg/cm2 2.47mrem mg/cm2 0.38msto mg/cm2 2.09
PEM hydrationtPEM s 183.1 1mPEM,act mg/cm2 0.36mPEM,max mg/cm2 0.95�act/calc�PEM mg/cm2 38
CL ice formationtCL s 877.7 1mCL,act mg/cm2 1.73mCL,max mg/cm2 0.65�act/calc�CL mg/cm2 268
Downloaded 11 Sep 2008 to 216.227.31.91. Redistribution subject to E
utilization of the membrane storage capacity during the start-uptime. Even if it is assumed that water diffusion out of the membraneis extremely low and the membrane dehydration region prior tostartup keeps the membrane at �i = 3.1 �and not completely dry asassumed for maximum storage calculations�, the membrane storageutilization only increases to 62% for the i = 100 mA/cm2 case,again indicating the membrane is not fully saturated at freeze-out.
In order to analyze this membrane water-storage phenomenon,the time constant for diffusion through the membrane can be foundusing
�diff =�PEM
2
D�10�
Taking the minimum diffusion constant of water into the membraneover various � �D = 6 � 10−12 m2/s�,26 this time constant is calcu-lated to be 54 s. Based on the time associated with membrane hy-dration for i = 25 mA/cm2 �tPEM = 183 s�, the product water shouldhave ample time to fully diffuse into the membrane. However, muchless than the maximum membrane storage capacity is utilized underthese conditions. It is concluded that for a relatively dry membrane,under the conditions tested, the water uptake into the membrane waslimiting, and therefore ice formed in the catalyst layer and the cellsuffered from freeze-out before complete uptake could be achieved.The average membrane water storage of 0.44 mg/cm2 gives a����max = 6.4 according to Eq. 7. Therefore, in order to optimizecold-start performance by keeping the membrane as hydrated andconductive as possible but also allowing it to store 0.44 mg/cm2 ofwater, there is an optimal membrane water content prior to startup.This depends on the maximum water content of the membrane,�max, before ice begins to form. For instance, if �max = 14 in afrozen state, the optimal membrane water content prior to startupwould be �i = 7.6. That is, as � increases from 7.6 to 14 during coldstart, the membrane can store 0.44 mg/cm2 of product water whilealso staying as conductive as possible. An initial condition of �i� 7.6 would not serve any purpose, as the additional capacity couldnot be utilized before ice begins to form.
The amount of water that freezes in the cathode CL increases asstartup current density decreases. This implies that a lower currentdensity allows for water to distribute itself more within the CL priorto freeze-out, which is consistent with existing literature.4 However,for i = 25 mA/cm2, the actual ice produced is over two times greaterthan the cathode CL storage capacity. This indicates that some of thewater stored during cold start emerges out of the cathode CL and isstored in the DM, also reported by Mao et al.14 The fact that thiswater has the ability to be transported out of the CL �as solid ice
Startup current density, i �mA/cm2�
100 100 150 200Value
86 85.6 49.2 34.30.80 0.80 0.69 0.640.03 0.03 0.02 0.010.77 0.77 0.67 0.63
50.9 51.9 30.5 27.30.46 0.47 0.42 0.500.95 0.95 0.95 0.95
48 49 44 52
35.1 33.7 18.7 7.00.31 0.30 0.25 0.130.65 0.65 0.65 0.65
49 47 39 20
50
48.61.160.091.07
01.70.440.95
46
46.90.630.65
98
CS license or copyright; see http://www.ecsdl.org/terms_use.jsp
B1151Journal of The Electrochemical Society, 155 �11� B1145-B1154 �2008� B1151
would not have this transport ability� may be indicative of the pres-ence of supercooled liquid water, as observed by Ishikawa et al.21,22
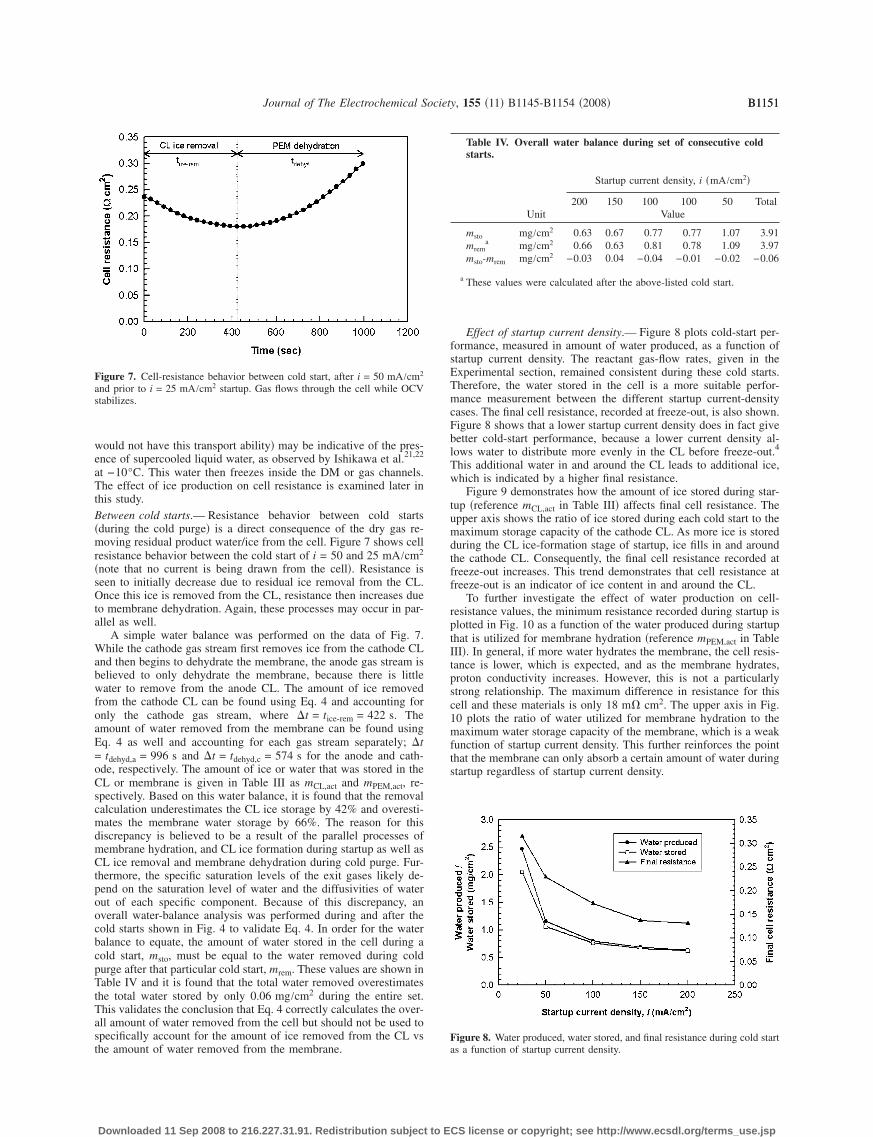
at −10°C. This water then freezes inside the DM or gas channels.The effect of ice production on cell resistance is examined later inthis study.Between cold starts.— Resistance behavior between cold starts�during the cold purge� is a direct consequence of the dry gas re-moving residual product water/ice from the cell. Figure 7 shows cellresistance behavior between the cold start of i = 50 and 25 mA/cm2
�note that no current is being drawn from the cell�. Resistance isseen to initially decrease due to residual ice removal from the CL.Once this ice is removed from the CL, resistance then increases dueto membrane dehydration. Again, these processes may occur in par-allel as well.
A simple water balance was performed on the data of Fig. 7.While the cathode gas stream first removes ice from the cathode CLand then begins to dehydrate the membrane, the anode gas stream isbelieved to only dehydrate the membrane, because there is littlewater to remove from the anode CL. The amount of ice removedfrom the cathode CL can be found using Eq. 4 and accounting foronly the cathode gas stream, where �t = tice-rem = 422 s. Theamount of water removed from the membrane can be found usingEq. 4 as well and accounting for each gas stream separately; �t= tdehyd,a = 996 s and �t = tdehyd,c = 574 s for the anode and cath-ode, respectively. The amount of ice or water that was stored in theCL or membrane is given in Table III as mCL,act and mPEM,act, re-spectively. Based on this water balance, it is found that the removalcalculation underestimates the CL ice storage by 42% and overesti-mates the membrane water storage by 66%. The reason for thisdiscrepancy is believed to be a result of the parallel processes ofmembrane hydration, and CL ice formation during startup as well asCL ice removal and membrane dehydration during cold purge. Fur-thermore, the specific saturation levels of the exit gases likely de-pend on the saturation level of water and the diffusivities of waterout of each specific component. Because of this discrepancy, anoverall water-balance analysis was performed during and after thecold starts shown in Fig. 4 to validate Eq. 4. In order for the waterbalance to equate, the amount of water stored in the cell during acold start, msto, must be equal to the water removed during coldpurge after that particular cold start, mrem. These values are shown inTable IV and it is found that the total water removed overestimatesthe total water stored by only 0.06 mg/cm2 during the entire set.This validates the conclusion that Eq. 4 correctly calculates the over-all amount of water removed from the cell but should not be used tospecifically account for the amount of ice removed from the CL vsthe amount of water removed from the membrane.
Figure 7. Cell-resistance behavior between cold start, after i = 50 mA/cm2
and prior to i = 25 mA/cm2 startup. Gas flows through the cell while OCVstabilizes.
Downloaded 11 Sep 2008 to 216.227.31.91. Redistribution subject to E
Effect of startup current density.— Figure 8 plots cold-start per-formance, measured in amount of water produced, as a function ofstartup current density. The reactant gas-flow rates, given in theExperimental section, remained consistent during these cold starts.Therefore, the water stored in the cell is a more suitable perfor-mance measurement between the different startup current-densitycases. The final cell resistance, recorded at freeze-out, is also shown.Figure 8 shows that a lower startup current density does in fact givebetter cold-start performance, because a lower current density al-lows water to distribute more evenly in the CL before freeze-out.4
This additional water in and around the CL leads to additional ice,which is indicated by a higher final resistance.
Figure 9 demonstrates how the amount of ice stored during star-tup �reference mCL,act in Table III� affects final cell resistance. Theupper axis shows the ratio of ice stored during each cold start to themaximum storage capacity of the cathode CL. As more ice is storedduring the CL ice-formation stage of startup, ice fills in and aroundthe cathode CL. Consequently, the final cell resistance recorded atfreeze-out increases. This trend demonstrates that cell resistance atfreeze-out is an indicator of ice content in and around the CL.
To further investigate the effect of water production on cell-resistance values, the minimum resistance recorded during startup isplotted in Fig. 10 as a function of the water produced during startupthat is utilized for membrane hydration �reference mPEM,act in TableIII�. In general, if more water hydrates the membrane, the cell resis-tance is lower, which is expected, and as the membrane hydrates,proton conductivity increases. However, this is not a particularlystrong relationship. The maximum difference in resistance for thiscell and these materials is only 18 m� cm2. The upper axis in Fig.10 plots the ratio of water utilized for membrane hydration to themaximum water storage capacity of the membrane, which is a weakfunction of startup current density. This further reinforces the pointthat the membrane can only absorb a certain amount of water duringstartup regardless of startup current density.
Table IV. Overall water balance during set of consecutive coldstarts.
Unit
Startup current density, i �mA/cm2�
200 150 100 100 50 TotalValue
msto mg/cm2 0.63 0.67 0.77 0.77 1.07 3.91mrem
a mg/cm2 0.66 0.63 0.81 0.78 1.09 3.97msto-mrem mg/cm2 −0.03 0.04 −0.04 −0.01 −0.02 −0.06
a These values were calculated after the above-listed cold start.
Figure 8. Water produced, water stored, and final resistance during cold startas a function of startup current density.
CS license or copyright; see http://www.ecsdl.org/terms_use.jsp

B1152 Journal of The Electrochemical Society, 155 �11� B1145-B1154 �2008�B1152
Other useful performance measurements that can be extractedfrom these startups include the total energy produced �E� and totalheat generated �Q� by the cell during cold start, given below
E = �t=0
tSU
VcelliAdt �11�
Q = �t=0
tSU
�Eth − Vcell�iAdt �12�
where Vcell is the actual cell voltage and Eth is the thermal potential�Eth = 1.48 V�. Furthermore, the average energy-generation rate
�Eavg� and average heat-generation rate �Qavg� during cold start canbe calculated by
Eavg = Vcell,avgiA �13�
Qavg = �Eth − Vcell,avg�iA �14�
Figure 9. Cell resistance recorded at freeze-out as a function of ice producedin the CL. Upper axis shows percentage of CL ice-storage capacity utilized.
Figure 10. Minimum resistance recorded during startup as a function of thewater used for membrane hydration. Upper axis shows percentage of maxi-mum membrane water-storage capacity utilized.
Downloaded 11 Sep 2008 to 216.227.31.91. Redistribution subject to E
These calculated quantities can be seen as a function of startupcurrent density in Fig. 11. Both total energy produced and total heatproduced follow a power-law relationship, indicating that a lowerstartup current density is able to produce more usable energy as wellas generate more heat to aid in self-start. This is attributed to lowerstartup current densities giving longer operation times before freeze-out; the total energy/heat produced is more dependent on startuptime than current density in the range of parameters tested. How-ever, when comparing the average production rates of energy andheat, it can be seen that these rates increase linearly as a function ofstartup current density. Therefore, a compromise must be made be-tween total energy/heat produced and their subsequent rates. Thiscompromise can be used to provide an operational guideline forrapid stack startup. For instance, a certain fuel cell stack may have aminimum total heat required to self-start �indicated by the “hypo-thetical stack minimum” line in Fig. 11�. In order to generate suffi-cient heat for self-start and do so as rapidly as possible, a startupcurrent density of approximately i = 90 mA/cm2 would be optimal.
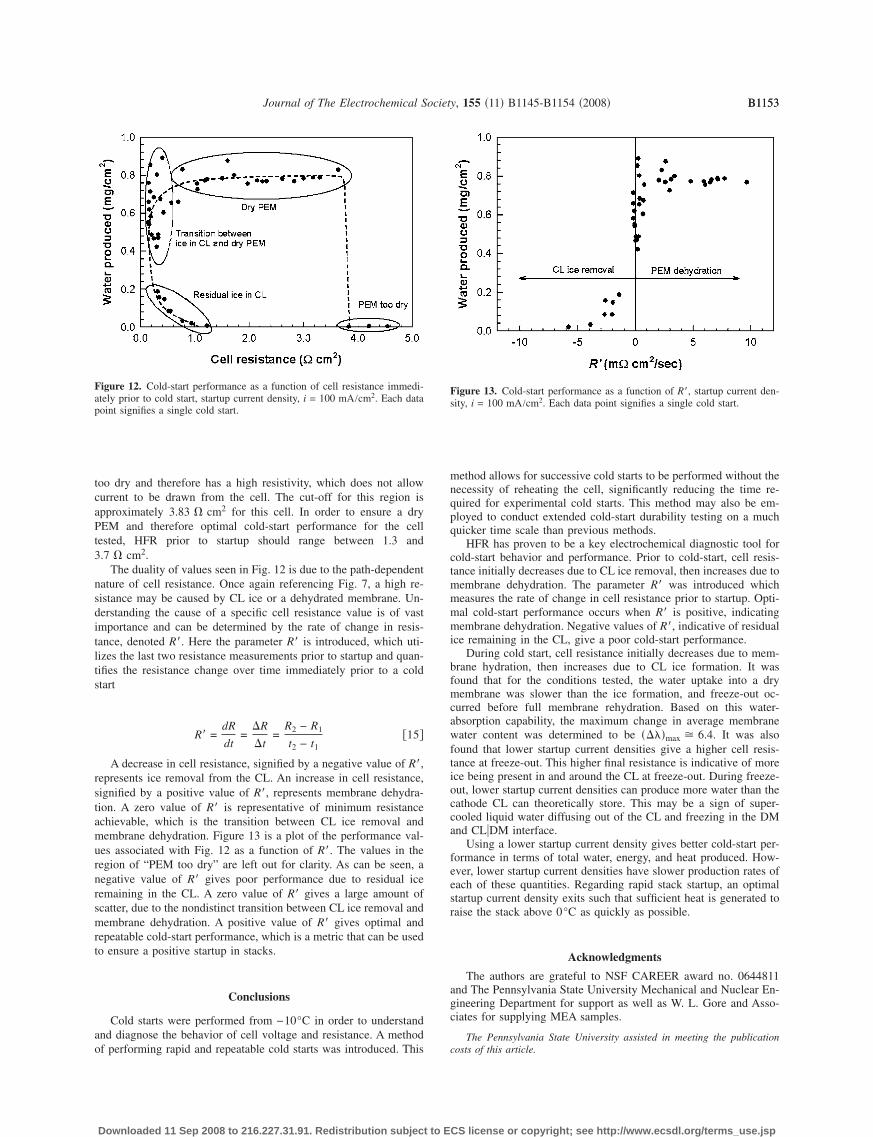
Predicting cold-start performance with initial resistance.— Theresults discussed so far conclude that the general hydration state ofthe MEA and the presence of residual ice can be described by mea-sured HFR. Because cold-start performance is highly dependent onMEA water content, the cell resistance recorded prior to startup maybe used to predict performance. HFR is well suited for this diagnos-tic due to its fast and nonintrusive nature. An additional set of ex-periments were performed to determine the range of resistance val-ues that lead to optimal cold-start performance. For theseexperiments, startup current density, flow rate, and cell temperaturewere identical for all cases; the only difference was initial cell re-sistance. Figure 12 shows cold-start performance as a function ofinitial resistance for 50 different cold starts. There are four different“zones” of resistance values, which can be related to Fig. 7, thatgive significantly different cold-start performance. The first zone,“Residual ice in CL,” corresponds to “CL ice removal” in Fig. 7,indicative of residual ice being present in the CL from the previousstartup. This gives quite a poor performance, because the reactionsites of the CL are still partially covered or filled with ice. Thesecond zone, “Transition between ice in CL and dry PEM,” corre-sponds to the minimum value of resistance shown in Fig. 7 and isrepresentative of the transition between CL ice removal and mem-brane dehydration. This zone gives a large amount of scatter inperformance, because this transition is nondistinct; the processes ofCL ice removal and membrane dehydration are in parallel. The “DryPEM” corresponds to the “PEM dehydration” region seen in Fig. 7and gives optimal and most predictable performance. This furtherreinforces the point that a dry membrane is beneficial for cold start.However, there is a region, “PEM too dry,” where the membrane is
Figure 11. Total energy produced, total heat produced, average energy pro-duction rate, and average heat production rate during cold start as a functionof startup current density.
CS license or copyright; see http://www.ecsdl.org/terms_use.jsp
B1153Journal of The Electrochemical Society, 155 �11� B1145-B1154 �2008� B1153
too dry and therefore has a high resistivity, which does not allowcurrent to be drawn from the cell. The cut-off for this region isapproximately 3.83 � cm2 for this cell. In order to ensure a dryPEM and therefore optimal cold-start performance for the celltested, HFR prior to startup should range between 1.3 and3.7 � cm2.
The duality of values seen in Fig. 12 is due to the path-dependentnature of cell resistance. Once again referencing Fig. 7, a high re-sistance may be caused by CL ice or a dehydrated membrane. Un-derstanding the cause of a specific cell resistance value is of vastimportance and can be determined by the rate of change in resis-tance, denoted R�. Here the parameter R� is introduced, which uti-lizes the last two resistance measurements prior to startup and quan-tifies the resistance change over time immediately prior to a coldstart
R� =dR
dt=
�R
�t=
R2 − R1
t2 − t1�15�
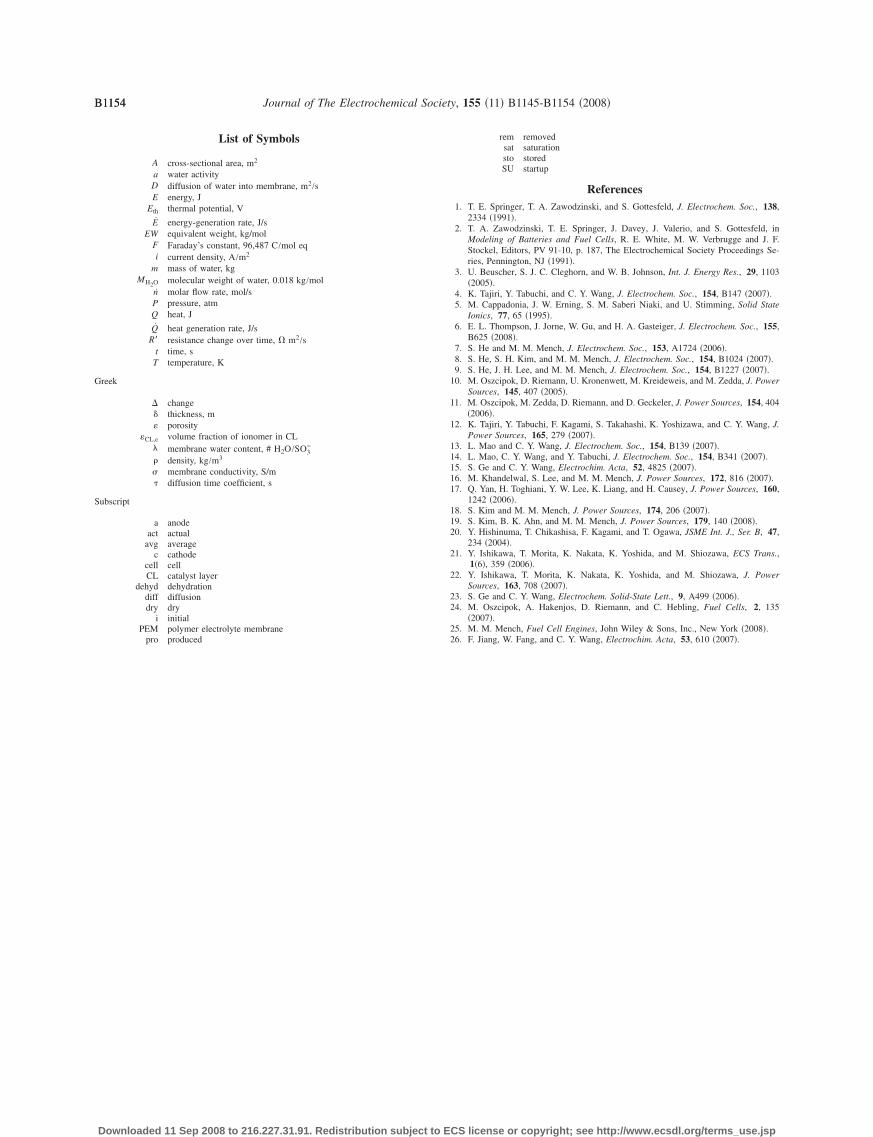
A decrease in cell resistance, signified by a negative value of R�,represents ice removal from the CL. An increase in cell resistance,signified by a positive value of R�, represents membrane dehydra-tion. A zero value of R� is representative of minimum resistanceachievable, which is the transition between CL ice removal andmembrane dehydration. Figure 13 is a plot of the performance val-ues associated with Fig. 12 as a function of R�. The values in theregion of “PEM too dry” are left out for clarity. As can be seen, anegative value of R� gives poor performance due to residual iceremaining in the CL. A zero value of R� gives a large amount ofscatter, due to the nondistinct transition between CL ice removal andmembrane dehydration. A positive value of R� gives optimal andrepeatable cold-start performance, which is a metric that can be usedto ensure a positive startup in stacks.
Conclusions
Cold starts were performed from −10°C in order to understandand diagnose the behavior of cell voltage and resistance. A methodof performing rapid and repeatable cold starts was introduced. This
Figure 12. Cold-start performance as a function of cell resistance immedi-ately prior to cold start, startup current density, i = 100 mA/cm2. Each datapoint signifies a single cold start.
Downloaded 11 Sep 2008 to 216.227.31.91. Redistribution subject to E
method allows for successive cold starts to be performed without thenecessity of reheating the cell, significantly reducing the time re-quired for experimental cold starts. This method may also be em-ployed to conduct extended cold-start durability testing on a muchquicker time scale than previous methods.
HFR has proven to be a key electrochemical diagnostic tool forcold-start behavior and performance. Prior to cold-start, cell resis-tance initially decreases due to CL ice removal, then increases due tomembrane dehydration. The parameter R� was introduced whichmeasures the rate of change in cell resistance prior to startup. Opti-mal cold-start performance occurs when R� is positive, indicatingmembrane dehydration. Negative values of R�, indicative of residualice remaining in the CL, give a poor cold-start performance.
During cold start, cell resistance initially decreases due to mem-brane hydration, then increases due to CL ice formation. It wasfound that for the conditions tested, the water uptake into a drymembrane was slower than the ice formation, and freeze-out oc-curred before full membrane rehydration. Based on this water-absorption capability, the maximum change in average membranewater content was determined to be ����max 6.4. It was alsofound that lower startup current densities give a higher cell resis-tance at freeze-out. This higher final resistance is indicative of moreice being present in and around the CL at freeze-out. During freeze-out, lower startup current densities can produce more water than thecathode CL can theoretically store. This may be a sign of super-cooled liquid water diffusing out of the CL and freezing in the DMand CL�DM interface.
Using a lower startup current density gives better cold-start per-formance in terms of total water, energy, and heat produced. How-ever, lower startup current densities have slower production rates ofeach of these quantities. Regarding rapid stack startup, an optimalstartup current density exits such that sufficient heat is generated toraise the stack above 0°C as quickly as possible.
Acknowledgments
The authors are grateful to NSF CAREER award no. 0644811and The Pennsylvania State University Mechanical and Nuclear En-gineering Department for support as well as W. L. Gore and Asso-ciates for supplying MEA samples.
The Pennsylvania State University assisted in meeting the publicationcosts of this article.
Figure 13. Cold-start performance as a function of R�, startup current den-sity, i = 100 mA/cm2. Each data point signifies a single cold start.
CS license or copyright; see http://www.ecsdl.org/terms_use.jsp
B1154 Journal of The Electrochemical Society, 155 �11� B1145-B1154 �2008�B1154
List of Symbols
A cross-sectional area, m2
a water activityD diffusion of water into membrane, m2/sE energy, J
Eth thermal potential, V
E energy-generation rate, J/sEW equivalent weight, kg/mol
F Faraday’s constant, 96,487 C/mol eqi current density, A/m2
m mass of water, kgMH2O molecular weight of water, 0.018 kg/mol
n molar flow rate, mol/sP pressure, atmQ heat, J
Q heat generation rate, J/sR� resistance change over time, � m2/s
t time, sT temperature, K
Greek
� change� thickness, m porosity
CL,e volume fraction of ionomer in CL� membrane water content, # H2O/SO3
−
density, kg/m3
� membrane conductivity, S/m� diffusion time coefficient, s
Subscript
a anodeact actual
avg averagec cathode
cell cellCL catalyst layer
dehyd dehydrationdiff diffusiondry dry
i initialPEM polymer electrolyte membrane
pro produced
Downloaded 11 Sep 2008 to 216.227.31.91. Redistribution subject to E
rem removedsat saturationsto storedSU startup
References1. T. E. Springer, T. A. Zawodzinski, and S. Gottesfeld, J. Electrochem. Soc., 138,
2334 �1991�.2. T. A. Zawodzinski, T. E. Springer, J. Davey, J. Valerio, and S. Gottesfeld, in
Modeling of Batteries and Fuel Cells, R. E. White, M. W. Verbrugge and J. F.Stockel, Editors, PV 91-10, p. 187, The Electrochemical Society Proceedings Se-ries, Pennington, NJ �1991�.
3. U. Beuscher, S. J. C. Cleghorn, and W. B. Johnson, Int. J. Energy Res., 29, 1103�2005�.
4. K. Tajiri, Y. Tabuchi, and C. Y. Wang, J. Electrochem. Soc., 154, B147 �2007�.5. M. Cappadonia, J. W. Erning, S. M. Saberi Niaki, and U. Stimming, Solid State
Ionics, 77, 65 �1995�.6. E. L. Thompson, J. Jorne, W. Gu, and H. A. Gasteiger, J. Electrochem. Soc., 155,
B625 �2008�.7. S. He and M. M. Mench, J. Electrochem. Soc., 153, A1724 �2006�.8. S. He, S. H. Kim, and M. M. Mench, J. Electrochem. Soc., 154, B1024 �2007�.9. S. He, J. H. Lee, and M. M. Mench, J. Electrochem. Soc., 154, B1227 �2007�.
10. M. Oszcipok, D. Riemann, U. Kronenwett, M. Kreideweis, and M. Zedda, J. PowerSources, 145, 407 �2005�.
11. M. Oszcipok, M. Zedda, D. Riemann, and D. Geckeler, J. Power Sources, 154, 404�2006�.
12. K. Tajiri, Y. Tabuchi, F. Kagami, S. Takahashi, K. Yoshizawa, and C. Y. Wang, J.Power Sources, 165, 279 �2007�.
13. L. Mao and C. Y. Wang, J. Electrochem. Soc., 154, B139 �2007�.14. L. Mao, C. Y. Wang, and Y. Tabuchi, J. Electrochem. Soc., 154, B341 �2007�.15. S. Ge and C. Y. Wang, Electrochim. Acta, 52, 4825 �2007�.16. M. Khandelwal, S. Lee, and M. M. Mench, J. Power Sources, 172, 816 �2007�.17. Q. Yan, H. Toghiani, Y. W. Lee, K. Liang, and H. Causey, J. Power Sources, 160,
1242 �2006�.18. S. Kim and M. M. Mench, J. Power Sources, 174, 206 �2007�.19. S. Kim, B. K. Ahn, and M. M. Mench, J. Power Sources, 179, 140 �2008�.20. Y. Hishinuma, T. Chikashisa, F. Kagami, and T. Ogawa, JSME Int. J., Ser. B, 47,
234 �2004�.21. Y. Ishikawa, T. Morita, K. Nakata, K. Yoshida, and M. Shiozawa, ECS Trans.,
1�6�, 359 �2006�.22. Y. Ishikawa, T. Morita, K. Nakata, K. Yoshida, and M. Shiozawa, J. Power
Sources, 163, 708 �2007�.23. S. Ge and C. Y. Wang, Electrochem. Solid-State Lett., 9, A499 �2006�.24. M. Oszcipok, A. Hakenjos, D. Riemann, and C. Hebling, Fuel Cells, 2, 135
�2007�.25. M. M. Mench, Fuel Cell Engines, John Wiley & Sons, Inc., New York �2008�.
26. F. Jiang, W. Fang, and C. Y. Wang, Electrochim. Acta, 53, 610 �2007�.CS license or copyright; see http://www.ecsdl.org/terms_use.jsp