
A Critical Review of Modeling Transport Phenomena in Polymer-Electrolyte Fuel Cells
46
F1254 Journal of The Electrochemical Society, 161 (12) F1254-F1299 (2014) A Critical Review of Modeling Transport Phenomena in Polymer-Electrolyte Fuel Cells Adam Z. Weber, a, ∗, z Rodney L. Borup, b, ∗ Robert M. Darling, c, ∗ Prodip K. Das, d, ∗ Thomas J. Dursch, a,e Wenbin Gu, f David Harvey, g,h Ahmet Kusoglu, a Shawn Litster, i, ∗ Matthew M. Mench, j, ∗ Rangachary Mukundan, b, ∗ Jon P. Owejan, k Jon G. Pharoah, h, ∗ Marc Secanell, l, ∗ and Iryna V. Zenyuk a a Lawrence Berkeley National Laboratory, Berkeley, California 94720, USA b Los Alamos National Laboratory, Los Alamos, New Mexico 87545, USA c United Technologies Research Center, East Hartford, Connecticut 06118, USA d School of Mechanical and Systems Engineering, Newcastle University, Newcastle upon Tyne NE1 7RU, United Kingdom e Chemical and Biomolecular Engineering Department, University of California, Berkeley, California 94720, USA f Fuel Cell Research and Development, General Motors, Pontiac, Michigan 48340, USA g Ballard Power Systems, Burnaby, British Columbia V5J 5J8, Canada h Fuel Cell Research Centre, Queens University, Kingston, Ontario K7L 3N6, Canada i Department of Mechanical Engineering, Carnegie Mellon University, Pittsburgh, Pennsylvania 15213, USA j Department of Mechanical Aerospace and Biomedical Engineering, University of Tennessee at Knoxville, Knoxville, Tennessee 37996, USA k Department of Mechanical Engineering Technology, SUNY Alfred State College, Alfred, New York 14802, USA l Department of Mechanical Engineering, University of Alberta, Edmonton, Alberta T6G 2G, Canada Polymer-electrolyte fuel cells are a promising energy-conversion technology. Over the last several decades significant progress has been made in increasing their performance and durability, of which continuum-level modeling of the transport processes has played an integral part. In this review, we examine the state-of-the-art modeling approaches, with a goal of elucidating the knowledge gaps and needs going forward in the field. In particular, the focus is on multiphase flow, especially in terms of understanding interactions at interfaces, and catalyst layers with a focus on the impacts of ionomer thin-films and multiscale phenomena. Overall, we highlight where there is consensus in terms of modeling approaches as well as opportunities for further improvement and clarification, including identification of several critical areas for future research. © The Author(s) 2014. Published by ECS. This is an open access article distributed under the terms of the Creative Commons Attribution 4.0 License (CC BY, http://creativecommons.org/licenses/by/4.0/), which permits unrestricted reuse of the work in any medium, provided the original work is properly cited. [DOI: 10.1149/2.0751412jes] All rights reserved. Manuscript submitted March 31, 2014; revised manuscript received August 25, 2014. Published September 13, 2014. This article was reviewed by Trung Van Nguyen ([email protected]) and Kunal Karan ([email protected]). Fuel cells may become the energy-delivery devices of the 21 st cen- tury. Although there are many types of fuel cells, polymer-electrolyte fuel cells (PEFCs) are receiving the most attention for automotive and small stationary applications. In a PEFC, fuel and oxygen are com- bined electrochemically. If hydrogen is used as the fuel, it oxidizes at the anode releasing proton and electrons according to H 2 → 2H + + 2e − [1] The generated protons are transported across the membrane and the electrons across the external circuit. At the cathode catalyst layer, protons and electrons recombine with oxygen to generate water 4H + + 4e − + O 2 → 2H 2 O [2] Although the above electrode reactions are written in single step, multiple elementary reaction pathways are possible at each electrode. During the operation of a PEFC, many interrelated and complex phe- nomena occur. These processes include mass and heat transfer, elec- trochemical reactions, and ionic and electronic transport. ∗ Electrochemical Society Active Member. z E-mail: [email protected] Over the last several decades significant progress has been made in increasing PEFC performance and durability. Such progress has been enabled by experiments and computation at multiple scales, with the bulk of the focus being on optimizing and discovering new materi- als for the membrane-electrode-assembly (MEA), composed of the proton-exchange membrane (PEM), catalyst layers, and diffusion- media (DM) backing layers. In particular, continuum modeling has been invaluable in providing understanding and insight into processes and phenomena that cannot be resolved or uncoupled through exper- iments. While modeling of the transport and related phenomena has progressed greatly, there are still some critical areas that need atten- tion. These areas include modeling the catalyst layer and multiphase phenomena in the PEFC porous media. While there have been various reviews over the years of PEFC modeling 1–7 and issues, 8–14 as well as numerous books and book chap- ters, there is a need to examine critically the field in terms of what has been done and what needs to be done. This review serves that purpose with a focus on transport modeling of PEFCs. This is not meant to be an exhaustive review of the very substantial literature on this topic, but to serve more as an examination and discussion of the state of the art and the needs going forward. In this fashion, the review focuses a bit more on the recent modeling issues and advances and not as much ) unless CC License in place (see abstract). ecsdl.org/site/terms_use address. Redistribution subject to ECS terms of use (see 128.240.225.120 Downloaded on 2014-09-14 to IP
Transcript of A Critical Review of Modeling Transport Phenomena in Polymer-Electrolyte Fuel Cells
F1254 Journal of The Electrochemical Society, 161 (12) F1254-F1299 (2014)
A Critical Review of Modeling Transport Phenomena inPolymer-Electrolyte Fuel CellsAdam Z. Weber,a,∗,z Rodney L. Borup,b,∗ Robert M. Darling,c,∗ Prodip K. Das,d,∗Thomas J. Dursch,a,e Wenbin Gu,f David Harvey,g,h Ahmet Kusoglu,a Shawn Litster,i,∗Matthew M. Mench,j,∗ Rangachary Mukundan,b,∗ Jon P. Owejan,k Jon G. Pharoah,h,∗Marc Secanell,l,∗ and Iryna V. Zenyuka
aLawrence Berkeley National Laboratory, Berkeley, California 94720, USAbLos Alamos National Laboratory, Los Alamos, New Mexico 87545, USAcUnited Technologies Research Center, East Hartford, Connecticut 06118, USAdSchool of Mechanical and Systems Engineering, Newcastle University, Newcastle upon Tyne NE1 7RU,United KingdomeChemical and Biomolecular Engineering Department, University of California, Berkeley, California 94720, USAfFuel Cell Research and Development, General Motors, Pontiac, Michigan 48340, USAgBallard Power Systems, Burnaby, British Columbia V5J 5J8, CanadahFuel Cell Research Centre, Queens University, Kingston, Ontario K7L 3N6, CanadaiDepartment of Mechanical Engineering, Carnegie Mellon University, Pittsburgh, Pennsylvania 15213, USAjDepartment of Mechanical Aerospace and Biomedical Engineering, University of Tennessee at Knoxville, Knoxville,Tennessee 37996, USAkDepartment of Mechanical Engineering Technology, SUNY Alfred State College, Alfred, New York 14802, USAlDepartment of Mechanical Engineering, University of Alberta, Edmonton, Alberta T6G 2G, Canada
Polymer-electrolyte fuel cells are a promising energy-conversion technology. Over the last several decades significant progress hasbeen made in increasing their performance and durability, of which continuum-level modeling of the transport processes has playedan integral part. In this review, we examine the state-of-the-art modeling approaches, with a goal of elucidating the knowledge gapsand needs going forward in the field. In particular, the focus is on multiphase flow, especially in terms of understanding interactionsat interfaces, and catalyst layers with a focus on the impacts of ionomer thin-films and multiscale phenomena. Overall, we highlightwhere there is consensus in terms of modeling approaches as well as opportunities for further improvement and clarification, includingidentification of several critical areas for future research.© The Author(s) 2014. Published by ECS. This is an open access article distributed under the terms of the Creative CommonsAttribution 4.0 License (CC BY, http://creativecommons.org/licenses/by/4.0/), which permits unrestricted reuse of the work in anymedium, provided the original work is properly cited. [DOI: 10.1149/2.0751412jes] All rights reserved.
Manuscript submitted March 31, 2014; revised manuscript received August 25, 2014. Published September 13, 2014. This articlewas reviewed by Trung Van Nguyen ([email protected]) and Kunal Karan ([email protected]).
Fuel cells may become the energy-delivery devices of the 21st cen-tury. Although there are many types of fuel cells, polymer-electrolytefuel cells (PEFCs) are receiving the most attention for automotive andsmall stationary applications. In a PEFC, fuel and oxygen are com-bined electrochemically. If hydrogen is used as the fuel, it oxidizes atthe anode releasing proton and electrons according to
H2 → 2H+ + 2e− [1]
The generated protons are transported across the membrane andthe electrons across the external circuit. At the cathode catalystlayer, protons and electrons recombine with oxygen to generatewater
4H+ + 4e− + O2 → 2H2O [2]
Although the above electrode reactions are written in single step,multiple elementary reaction pathways are possible at each electrode.During the operation of a PEFC, many interrelated and complex phe-nomena occur. These processes include mass and heat transfer, elec-trochemical reactions, and ionic and electronic transport.
∗Electrochemical Society Active Member.zE-mail: [email protected]
Over the last several decades significant progress has been made inincreasing PEFC performance and durability. Such progress has beenenabled by experiments and computation at multiple scales, with thebulk of the focus being on optimizing and discovering new materi-als for the membrane-electrode-assembly (MEA), composed of theproton-exchange membrane (PEM), catalyst layers, and diffusion-media (DM) backing layers. In particular, continuum modeling hasbeen invaluable in providing understanding and insight into processesand phenomena that cannot be resolved or uncoupled through exper-iments. While modeling of the transport and related phenomena hasprogressed greatly, there are still some critical areas that need atten-tion. These areas include modeling the catalyst layer and multiphasephenomena in the PEFC porous media.
While there have been various reviews over the years of PEFCmodeling1–7 and issues,8–14 as well as numerous books and book chap-ters, there is a need to examine critically the field in terms of what hasbeen done and what needs to be done. This review serves that purposewith a focus on transport modeling of PEFCs. This is not meant to bean exhaustive review of the very substantial literature on this topic,but to serve more as an examination and discussion of the state of theart and the needs going forward. In this fashion, the review focuses abit more on the recent modeling issues and advances and not as much
) unless CC License in place (see abstract). ecsdl.org/site/terms_use address. Redistribution subject to ECS terms of use (see 128.240.225.120Downloaded on 2014-09-14 to IP
Journal of The Electrochemical Society, 161 (12) F1254-F1299 (2014) F1255
on the various approaches that are historical or outside the scope ofcurrent issues.
This review is organized as follows. First, some background in-troduction into PEFC transport modeling is accomplished includingthe general governing equations, modeling dimensionality, and a dis-cussion on empirical modeling and the dominant mechanisms, with afocus on the generalized governing equations for the different mech-anisms and phenomena. Next, we critically examine multiphase-flowand catalyst-layer modeling. For the former, we will introduce severaltreatments and then focus on current issues including effective prop-erties, some microscale modeling, phase-change behavior, and theimpact and existence of interfaces. For catalyst-layer modeling, wediscuss incorporating structural details into the modeling framework,and focus on consideration of ionomer thin-films, as well as transportin ionomer-free zones, and finally touch on the intersection betweentransport modeling and durability. The next section focuses on fu-ture perspectives including interactions between modeling and exper-iments, modeling variability, open-source modeling, and an overallsummary of the article.
Background
In this section, some background information is provided in orderto orient the reader for the more detailed discussions below concern-ing multiphase-flow and catalyst-layer modeling and phenomena. Asnoted, the physics of most models is similar with the differences be-ing in the scale of the model and phenomena investigated, treatmentof the various transport properties, and boundary conditions. In thissection, first a discussion of model dimensionality is made, followedby a general description and review of macroscale, empirical model-ing. Finally, the general governing equations are presented. As notedabove, within this section the focus is on the state-of-the-art equationsfor the different mechanisms, layers, and phenomena, and not on thespecific models that have been used and which models have usedwhich equations. Thus, the equations presented are generalized andclassified and represent the key foundational precepts that are requiredfor a more in-depth investigation into the critical phenomena in thefollowing sections.
Although this is a review focused on transport modeling, one needsto be aware of the thermodynamics of the cell. From this perspective,a PEFC converts the intrinsic chemical energy of a fuel into electricaland heat energies. The associated Gibbs free energy can be convertedto a potential by
U θh = −�Gh
nh F[3]
where nh is the number of electrons transferred in reaction h and F isFaraday’s constant. Similarly, one can define the enthalpy potential as
UH h = −�Hh
nh F[4]
and thus the total heat released by the PEFC can be given by
Q = i (UH − V ) [5]
where V is the cell potential. Thus, if the cell potential equals theenthalpy potential, there is no net heat loss/gain. As reference, forhydrogen and oxygen going to liquid water at standard conditions, thereversible and enthalpy potentials are 1.229 and 1.48 V, respectively.To change to different conditions for this reaction, one can use ther-modynamic expressions for temperature as well as a Nernst equationfor composition,
U = U θ − RT
2Fln
(aH2
√aO2
aH2O
)[6]
where ai is the activity of species i, and R is the ideal-gas constant.From thermodynamics, the equilibrium and enthalpy potentials de-pend on the phase of water produced (i.e., liquid or vapor), and in thisreview it is assumed that water is produced in the condensed (liquid)
1.2
1.0
0.8
0.6
0.4
0.2
0
Cel
l po
ten
tial
(V
)
21.510.50
Current density (A/cm2)
LimitingCurrent
Kinetic losses
Ohmic losses
Thermodynamic potential
Mass-transport limitations
Open-circruit voltage
Figure 1. Sample polarization curve showing dominant losses.
phase next to the membrane (i.e., aH2O = 1 in equation 6). Since theassociated liquid and vapor cell potentials are related by the vaporpressure of water, there is no issue in assuming a vapor product aslong as the heat of vaporization/condensation is accounted for in theenergy balance.
Model Dimensionality
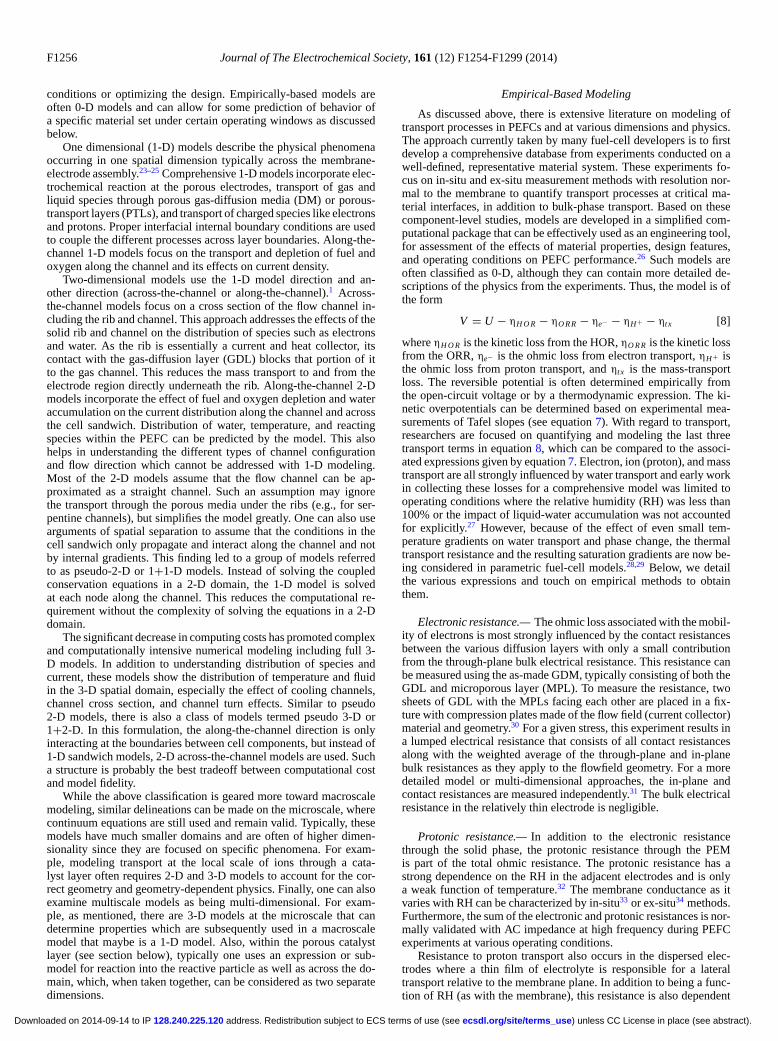
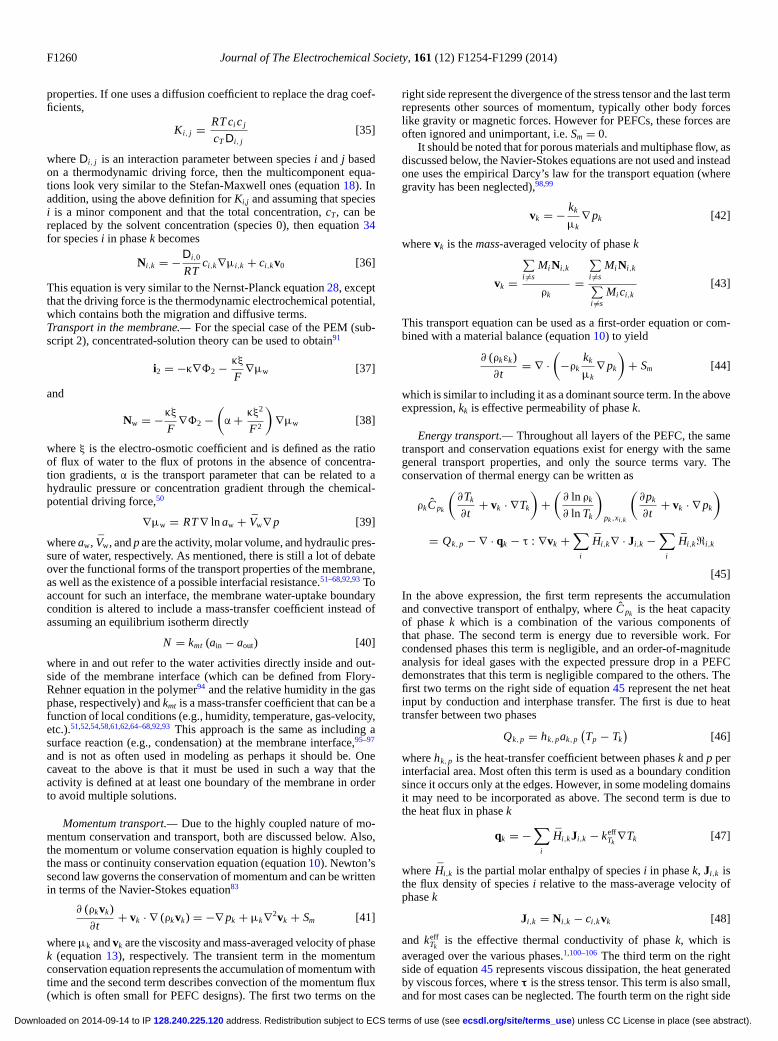
Just as with scale, there is an issue of model dimensionalityin that higher dimensional models better represent reality but at agreater computational expense. A lower-dimensionality model sacri-fices some spatial fidelity but often allows for more complex physicsto be incorporated. Due to increases in computational power, moremulti-dimensional models are being employed, with perhaps the idealtradeoff being the 1+2-D model framework. Figure 2 displays thevarious model dimensionalities and major cell components.
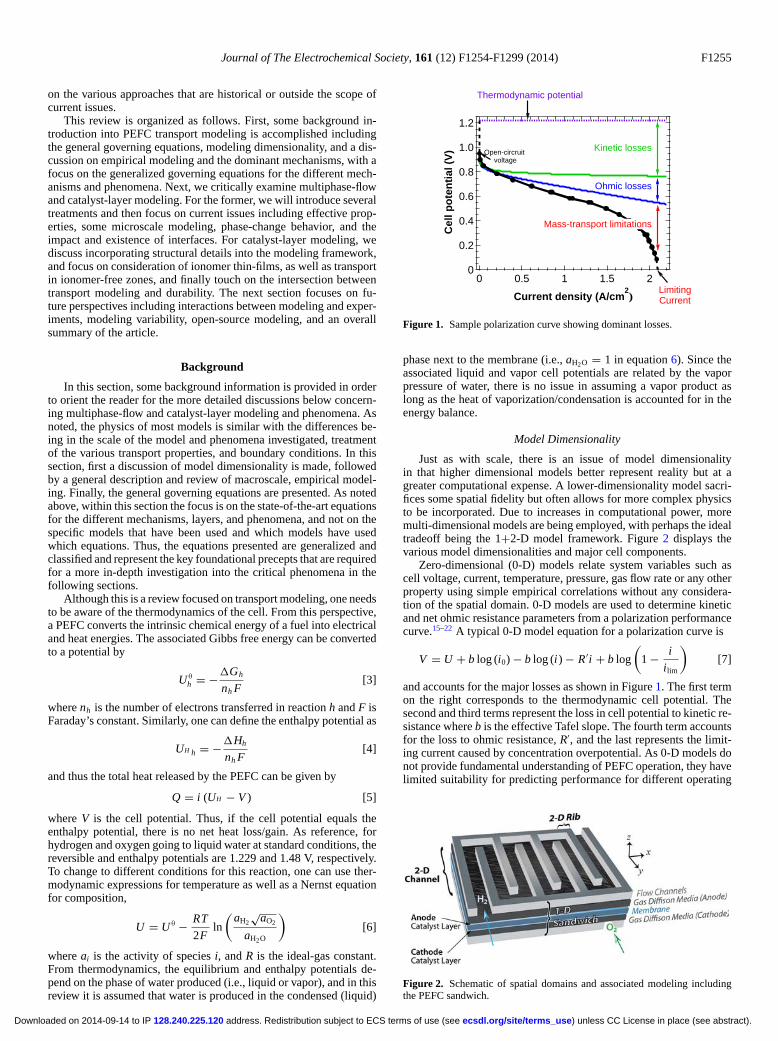
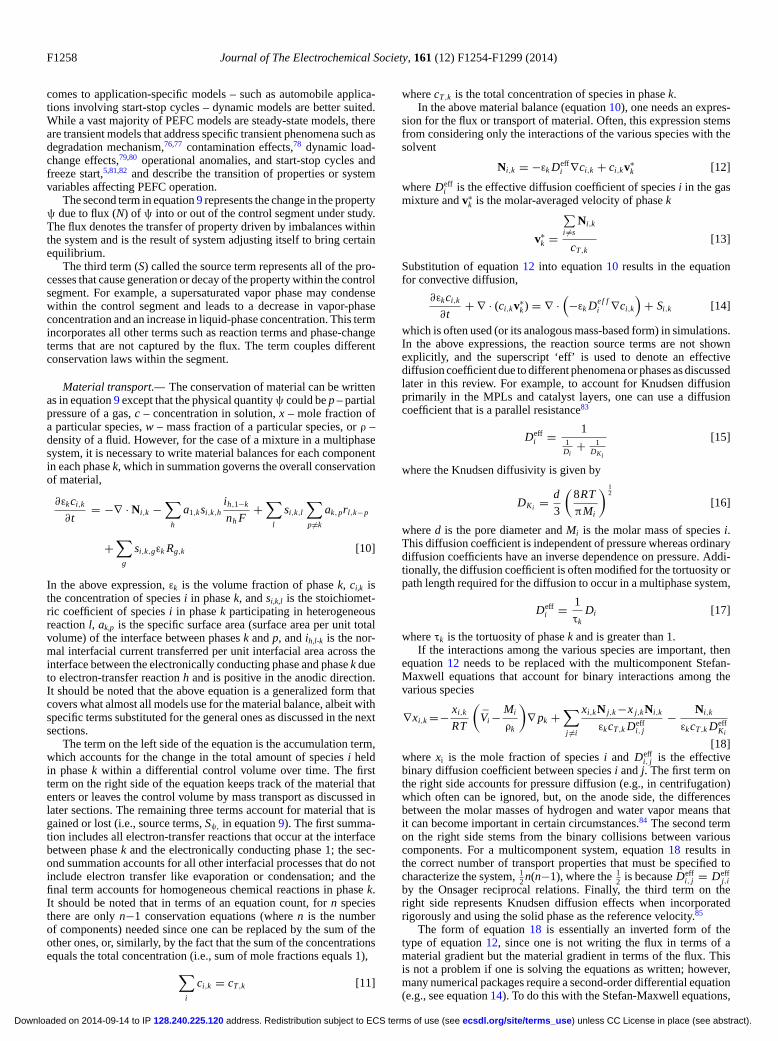
Zero-dimensional (0-D) models relate system variables such ascell voltage, current, temperature, pressure, gas flow rate or any otherproperty using simple empirical correlations without any considera-tion of the spatial domain. 0-D models are used to determine kineticand net ohmic resistance parameters from a polarization performancecurve.15–22 A typical 0-D model equation for a polarization curve is
V = U + b log (i0) − b log (i) − R′i + b log
(1 − i
ilim
)[7]
and accounts for the major losses as shown in Figure 1. The first termon the right corresponds to the thermodynamic cell potential. Thesecond and third terms represent the loss in cell potential to kinetic re-sistance where b is the effective Tafel slope. The fourth term accountsfor the loss to ohmic resistance, R′, and the last represents the limit-ing current caused by concentration overpotential. As 0-D models donot provide fundamental understanding of PEFC operation, they havelimited suitability for predicting performance for different operating
Figure 2. Schematic of spatial domains and associated modeling includingthe PEFC sandwich.
) unless CC License in place (see abstract). ecsdl.org/site/terms_use address. Redistribution subject to ECS terms of use (see 128.240.225.120Downloaded on 2014-09-14 to IP
F1256 Journal of The Electrochemical Society, 161 (12) F1254-F1299 (2014)
conditions or optimizing the design. Empirically-based models areoften 0-D models and can allow for some prediction of behavior ofa specific material set under certain operating windows as discussedbelow.
One dimensional (1-D) models describe the physical phenomenaoccurring in one spatial dimension typically across the membrane-electrode assembly.23–25 Comprehensive 1-D models incorporate elec-trochemical reaction at the porous electrodes, transport of gas andliquid species through porous gas-diffusion media (DM) or porous-transport layers (PTLs), and transport of charged species like electronsand protons. Proper interfacial internal boundary conditions are usedto couple the different processes across layer boundaries. Along-the-channel 1-D models focus on the transport and depletion of fuel andoxygen along the channel and its effects on current density.
Two-dimensional models use the 1-D model direction and an-other direction (across-the-channel or along-the-channel).1 Across-the-channel models focus on a cross section of the flow channel in-cluding the rib and channel. This approach addresses the effects of thesolid rib and channel on the distribution of species such as electronsand water. As the rib is essentially a current and heat collector, itscontact with the gas-diffusion layer (GDL) blocks that portion of itto the gas channel. This reduces the mass transport to and from theelectrode region directly underneath the rib. Along-the-channel 2-Dmodels incorporate the effect of fuel and oxygen depletion and wateraccumulation on the current distribution along the channel and acrossthe cell sandwich. Distribution of water, temperature, and reactingspecies within the PEFC can be predicted by the model. This alsohelps in understanding the different types of channel configurationand flow direction which cannot be addressed with 1-D modeling.Most of the 2-D models assume that the flow channel can be ap-proximated as a straight channel. Such an assumption may ignorethe transport through the porous media under the ribs (e.g., for ser-pentine channels), but simplifies the model greatly. One can also usearguments of spatial separation to assume that the conditions in thecell sandwich only propagate and interact along the channel and notby internal gradients. This finding led to a group of models referredto as pseudo-2-D or 1+1-D models. Instead of solving the coupledconservation equations in a 2-D domain, the 1-D model is solvedat each node along the channel. This reduces the computational re-quirement without the complexity of solving the equations in a 2-Ddomain.
The significant decrease in computing costs has promoted complexand computationally intensive numerical modeling including full 3-D models. In addition to understanding distribution of species andcurrent, these models show the distribution of temperature and fluidin the 3-D spatial domain, especially the effect of cooling channels,channel cross section, and channel turn effects. Similar to pseudo2-D models, there is also a class of models termed pseudo 3-D or1+2-D. In this formulation, the along-the-channel direction is onlyinteracting at the boundaries between cell components, but instead of1-D sandwich models, 2-D across-the-channel models are used. Sucha structure is probably the best tradeoff between computational costand model fidelity.
While the above classification is geared more toward macroscalemodeling, similar delineations can be made on the microscale, wherecontinuum equations are still used and remain valid. Typically, thesemodels have much smaller domains and are often of higher dimen-sionality since they are focused on specific phenomena. For exam-ple, modeling transport at the local scale of ions through a cata-lyst layer often requires 2-D and 3-D models to account for the cor-rect geometry and geometry-dependent physics. Finally, one can alsoexamine multiscale models as being multi-dimensional. For exam-ple, as mentioned, there are 3-D models at the microscale that candetermine properties which are subsequently used in a macroscalemodel that maybe is a 1-D model. Also, within the porous catalystlayer (see section below), typically one uses an expression or sub-model for reaction into the reactive particle as well as across the do-main, which, when taken together, can be considered as two separatedimensions.
Empirical-Based Modeling
As discussed above, there is extensive literature on modeling oftransport processes in PEFCs and at various dimensions and physics.The approach currently taken by many fuel-cell developers is to firstdevelop a comprehensive database from experiments conducted on awell-defined, representative material system. These experiments fo-cus on in-situ and ex-situ measurement methods with resolution nor-mal to the membrane to quantify transport processes at critical ma-terial interfaces, in addition to bulk-phase transport. Based on thesecomponent-level studies, models are developed in a simplified com-putational package that can be effectively used as an engineering tool,for assessment of the effects of material properties, design features,and operating conditions on PEFC performance.26 Such models areoften classified as 0-D, although they can contain more detailed de-scriptions of the physics from the experiments. Thus, the model is ofthe form
V = U − ηH O R − ηO R R − ηe− − ηH+ − ηt x [8]
where ηH O R is the kinetic loss from the HOR, ηO R R is the kinetic lossfrom the ORR, ηe− is the ohmic loss from electron transport, ηH+ isthe ohmic loss from proton transport, and ηt x is the mass-transportloss. The reversible potential is often determined empirically fromthe open-circuit voltage or by a thermodynamic expression. The ki-netic overpotentials can be determined based on experimental mea-surements of Tafel slopes (see equation 7). With regard to transport,researchers are focused on quantifying and modeling the last threetransport terms in equation 8, which can be compared to the associ-ated expressions given by equation 7. Electron, ion (proton), and masstransport are all strongly influenced by water transport and early workin collecting these losses for a comprehensive model was limited tooperating conditions where the relative humidity (RH) was less than100% or the impact of liquid-water accumulation was not accountedfor explicitly.27 However, because of the effect of even small tem-perature gradients on water transport and phase change, the thermaltransport resistance and the resulting saturation gradients are now be-ing considered in parametric fuel-cell models.28,29 Below, we detailthe various expressions and touch on empirical methods to obtainthem.
Electronic resistance.— The ohmic loss associated with the mobil-ity of electrons is most strongly influenced by the contact resistancesbetween the various diffusion layers with only a small contributionfrom the through-plane bulk electrical resistance. This resistance canbe measured using the as-made GDM, typically consisting of both theGDL and microporous layer (MPL). To measure the resistance, twosheets of GDL with the MPLs facing each other are placed in a fix-ture with compression plates made of the flow field (current collector)material and geometry.30 For a given stress, this experiment results ina lumped electrical resistance that consists of all contact resistancesalong with the weighted average of the through-plane and in-planebulk resistances as they apply to the flowfield geometry. For a moredetailed model or multi-dimensional approaches, the in-plane andcontact resistances are measured independently.31 The bulk electricalresistance in the relatively thin electrode is negligible.
Protonic resistance.— In addition to the electronic resistancethrough the solid phase, the protonic resistance through the PEMis part of the total ohmic resistance. The protonic resistance has astrong dependence on the RH in the adjacent electrodes and is onlya weak function of temperature.32 The membrane conductance as itvaries with RH can be characterized by in-situ33 or ex-situ34 methods.Furthermore, the sum of the electronic and protonic resistances is nor-mally validated with AC impedance at high frequency during PEFCexperiments at various operating conditions.
Resistance to proton transport also occurs in the dispersed elec-trodes where a thin film of electrolyte is responsible for a lateraltransport relative to the membrane plane. In addition to being a func-tion of RH (as with the membrane), this resistance is also dependent
) unless CC License in place (see abstract). ecsdl.org/site/terms_use address. Redistribution subject to ECS terms of use (see 128.240.225.120Downloaded on 2014-09-14 to IP
Journal of The Electrochemical Society, 161 (12) F1254-F1299 (2014) F1257
on current density due to the variation in electrode utilization depth ascurrent draw increases.35 The electrode effectiveness can be modeledtheoretically with Tafel kinetics, and this is used to correct an area-based proton resistance in the anode and cathode electrodes which iscommonly measured with H2/N2 AC impedance32 and an associatedtransmission-line model.36 This method of characterizing the protonresistance in the electrode requires an assumption of uniform ionomerfilm thickness and connectivity. The ionomer film is difficult to char-acterize, and if this film was discontinuous with significant variationsin thickness, the idealized proton resistance would under-predict theloss associated with proton mobility in the electrode. The ionomerfilm and its associated effects are discussed in more detail in a latersection.
Thermal resistance.— All of the voltage loss terms in equation 8have some functionality with temperature. To predict accurately thereaction kinetics and the gas composition at the catalyst surface, thetemperature profile through the PEFC sandwich must be established.There are several methods for characterizing the bulk and contact re-sistances of PEFC components as reviewed by Zamel and Li37 andWang et al.6 The total thermal resistance is used to solve the heatequation in one of two dimensions based on the heat flux from thecathode catalyst layer. At high RH conditions, where proton resistanceis minimized along with the product water flux from the cathode cata-lyst layer, such an analysis elucidates regions of phase change withinthe open volume of the diffusion layers and gas-delivery channels.
Diffusion resistance.— There are several length scales for whichdiffusion resistance must be characterized. For a given total pressurein the flow channel, the first resistance to mass transport is encoun-tered at the GDL interface. The convective mass-transfer coefficient,computed from the Sherwood number for a given flow rate and chan-nel geometry is used for single-phase conditions in the channel.38 Theimpact of liquid water in the gas channel is accomplish with a mod-ified Sherwood number39 and by reducing the gas contact area usinga surface-coverage ratio.40 In the GDM, the characterization of diffu-sion and governing parameters has been accomplished using variousexperiments combined with simple limiting-current or Fickian-typediffusion equations to get the values for use in equation 7 or 8.41–44
A more direct in-situ measurement of oxygen diffusion resistance hasbeen presented in previous work by Baker et al.38 and Caulk et al.45
that established a method and analysis using limiting-current mea-surements under dry and oversaturated conditions for use in equation7 or 8. Although these measurements result in a diffusion resistancewhile a two-phase condition exists in the PEFC assembly, the de-gree of saturation and its distribution is unknown; as a result, a directcorrelation between saturation and the resulting change in the diffu-sion resistance is required to validate a simplified saturation model.The limiting-current analysis developed by Baker et al. can also beused to isolate the pressure-independent component of diffusion re-sistance (i.e., Knudsen diffusion and interfacial resistance throughwater/ionomer (combined with Henry’s law)).38 Studies have shownthat this interfacial resistance is a significant component of voltage lossas it scales with reduced platinum loading and that it is much higherthan expected based on oxygen permeability through bulk ionomeras discussed in more detail in another section below.46–49 Currentlyin a parametric model, this resistance is accounted for by using anunrealistically thick ionomer or electrolyte layer with bulk ionomer(membrane) transport properties.
Membrane transport.— Accurate prediction of the reactant par-tial pressure at the catalyst surface requires the solution of speciesthroughout the PEFC assembly which is beyond the scope of empiri-cal models. Although the thermal, electronic, protonic, and gas-phasetransport resistances can be characterized, the water balance betweenthe anode and cathode due to water permeation through the electrolytemust be accounted for. This water balance also complicates the pre-diction of phase change and most of the components of transport
resistance are a function of the local liquid-water content. The keyis to determine the net flux of water through the ionomer, which is afunction of different driving forces including chemical potential andelectro-osmosis driven by proton movement.50 For chemical-potentialdriven flow, there is still debate over the values of the transport coeffi-cients and the possible existence of a humidity-dependent interfacialresistance in the membrane, where there is experimental support onboth sides of the issue.51–68 The value of the electro-osmotic coeffi-cient also varies significantly in literature,69–71 and since it scales withcurrent density it plays a critical role in predicting the water balance.Given the above difficulties, many parametric models use an empiricaleffective electro-osmotic coefficient.
Along-the-channel solution.— The various resistances describedabove are assembled in a through-plane model with boundary condi-tions at the flow distributors that include total pressure, species con-centration, temperature, and a reference potential of 0 V at the anodecurrent collector. The cathode current collector potential is calculatedbased on equation 8, where electronic and protonic resistances areused to predict the ohmic losses and the diffusion and thermal resis-tances are used to predict the species partial pressures and temperaturein the catalyst layers for calculation of the half-cell potentials, reactionkinetics, and membrane transport. This is typically solved in 1-D withaverage values over the geometric features.
Practical PEFC stacks have significant variation in the channelboundary conditions from the inlet to the outlet. To account for this,the parametric model is applied along-the-channel, assuming equipo-tential current collectors or by using a correlation for lateral potentialdifference through the current collector. This solution requires an ac-curate prediction of flow resistance in the channel. Although straight-forward for single-phase conditions, a two-phase pressure differentialcorrelation is required once the flow distributor condition exceeds100% RH.72–75 Additionally, PEFC systems typically operate withhydrogen stoichiometric ratios greater than 1.0, thereby requiring amethodology for recirculating exhaust anode flow. In this case the ni-trogen and water content in the anode flow distributor due to crossoverthrough the membrane must be accounted for as the diluted hydrogenfeed stream will impact performance.
Basic Governing Equations
The above sections describe the methodologies and dimensionali-ties for modeling PEFCs based on a good amount of empiricism. Tomodel PEFC behavior with more detailed physics at the continuumscale requires the use of overall conservation equations for mass, mo-mentum, energy, and charge transport within the various subdomainsor components. In addition, there is a need for expressions for overallkinetics and thermodynamics. The general physics equations are moreor less known and used in their general forms, with the complicationsarising from the need to determine the correct boundary conditions,effective properties, and related transfer expressions. In this section,the general governing equations are presented including the conserva-tion laws along with the general, well-known transport equations. Asmentioned, the equations presented below have not necessarily beenused as is since they represent generalized forms of specific model-ing approaches in order to be concise and show the generality of thephenomena being modeled. Also, no model has really used all of thegoverning equations below as most focus on certain aspects; however,we believe that these equations should be used and are the foundationfor the more detailed discussions in subsequent sections.
For a control segment, the general conservation equation for prop-erty ψ, representing any of the aforementioned transport processes,can be written as
∂ψ
∂t+ ∇ · Nψ = Sψ [9]
The first term represents the time-dependent property and is neglectedfor description of steady-state operation, which is the favored ap-proach to understand the mechanisms involved. However when it
) unless CC License in place (see abstract). ecsdl.org/site/terms_use address. Redistribution subject to ECS terms of use (see 128.240.225.120Downloaded on 2014-09-14 to IP
F1258 Journal of The Electrochemical Society, 161 (12) F1254-F1299 (2014)
comes to application-specific models – such as automobile applica-tions involving start-stop cycles – dynamic models are better suited.While a vast majority of PEFC models are steady-state models, thereare transient models that address specific transient phenomena such asdegradation mechanism,76,77 contamination effects,78 dynamic load-change effects,79,80 operational anomalies, and start-stop cycles andfreeze start,5,81,82 and describe the transition of properties or systemvariables affecting PEFC operation.
The second term in equation 9 represents the change in the propertyψ due to flux (N) of ψ into or out of the control segment under study.The flux denotes the transfer of property driven by imbalances withinthe system and is the result of system adjusting itself to bring certainequilibrium.
The third term (S) called the source term represents all of the pro-cesses that cause generation or decay of the property within the controlsegment. For example, a supersaturated vapor phase may condensewithin the control segment and leads to a decrease in vapor-phaseconcentration and an increase in liquid-phase concentration. This termincorporates all other terms such as reaction terms and phase-changeterms that are not captured by the flux. The term couples differentconservation laws within the segment.
Material transport.— The conservation of material can be writtenas in equation 9 except that the physical quantity ψ could be p – partialpressure of a gas, c – concentration in solution, x – mole fraction ofa particular species, w – mass fraction of a particular species, or ρ –density of a fluid. However, for the case of a mixture in a multiphasesystem, it is necessary to write material balances for each componentin each phase k, which in summation governs the overall conservationof material,
∂εkci,k
∂t= −∇ · Ni,k −
∑h
a1,ksi,k,hih,1−k
nh F+∑
l
si,k,l
∑p �=k
ak,prl,k−p
+∑
g
si,k,gεk Rg,k [10]
In the above expression, εk is the volume fraction of phase k, ci,k isthe concentration of species i in phase k, and si,k,l is the stoichiomet-ric coefficient of species i in phase k participating in heterogeneousreaction l, ak,p is the specific surface area (surface area per unit totalvolume) of the interface between phases k and p, and ih,l-k is the nor-mal interfacial current transferred per unit interfacial area across theinterface between the electronically conducting phase and phase k dueto electron-transfer reaction h and is positive in the anodic direction.It should be noted that the above equation is a generalized form thatcovers what almost all models use for the material balance, albeit withspecific terms substituted for the general ones as discussed in the nextsections.
The term on the left side of the equation is the accumulation term,which accounts for the change in the total amount of species i heldin phase k within a differential control volume over time. The firstterm on the right side of the equation keeps track of the material thatenters or leaves the control volume by mass transport as discussed inlater sections. The remaining three terms account for material that isgained or lost (i.e., source terms, Sψ, in equation 9). The first summa-tion includes all electron-transfer reactions that occur at the interfacebetween phase k and the electronically conducting phase 1; the sec-ond summation accounts for all other interfacial processes that do notinclude electron transfer like evaporation or condensation; and thefinal term accounts for homogeneous chemical reactions in phase k.It should be noted that in terms of an equation count, for n speciesthere are only n−1 conservation equations (where n is the numberof components) needed since one can be replaced by the sum of theother ones, or, similarly, by the fact that the sum of the concentrationsequals the total concentration (i.e., sum of mole fractions equals 1),∑
i
ci,k = cT,k [11]
where cT,k is the total concentration of species in phase k.In the above material balance (equation 10), one needs an expres-
sion for the flux or transport of material. Often, this expression stemsfrom considering only the interactions of the various species with thesolvent
Ni,k = −εk Deffi ∇ci,k + ci,kv∗
k [12]
where Deffi is the effective diffusion coefficient of species i in the gas
mixture and v∗k is the molar-averaged velocity of phase k
v∗k =
∑i �=s
Ni,k
cT,k[13]
Substitution of equation 12 into equation 10 results in the equationfor convective diffusion,
∂εkci,k
∂t+ ∇ · (ci,kv∗
k ) = ∇ ·(−εk Def f
i ∇ci,k
)+ Si,k [14]
which is often used (or its analogous mass-based form) in simulations.In the above expressions, the reaction source terms are not shownexplicitly, and the superscript ‘eff’ is used to denote an effectivediffusion coefficient due to different phenomena or phases as discussedlater in this review. For example, to account for Knudsen diffusionprimarily in the MPLs and catalyst layers, one can use a diffusioncoefficient that is a parallel resistance83
Deffi = 1
1Di
+ 1DKi
[15]
where the Knudsen diffusivity is given by
DKi = d
3
(8RT
πMi
) 12
[16]
where d is the pore diameter and Mi is the molar mass of species i.This diffusion coefficient is independent of pressure whereas ordinarydiffusion coefficients have an inverse dependence on pressure. Addi-tionally, the diffusion coefficient is often modified for the tortuosity orpath length required for the diffusion to occur in a multiphase system,
Deffi = 1
τkDi [17]
where τk is the tortuosity of phase k and is greater than 1.If the interactions among the various species are important, then
equation 12 needs to be replaced with the multicomponent Stefan-Maxwell equations that account for binary interactions among thevarious species
∇xi,k =− xi,k
RT
(Vi − Mi
ρk
)∇ pk +
∑j �=i
xi,kN j,k −x j,kNi,k
εkcT,k Deffi, j
− Ni,k
εkcT,k DeffKi
[18]where xi is the mole fraction of species i and Deff
i, j is the effectivebinary diffusion coefficient between species i and j. The first term onthe right side accounts for pressure diffusion (e.g., in centrifugation)which often can be ignored, but, on the anode side, the differencesbetween the molar masses of hydrogen and water vapor means thatit can become important in certain circumstances.84 The second termon the right side stems from the binary collisions between variouscomponents. For a multicomponent system, equation 18 results inthe correct number of transport properties that must be specified tocharacterize the system, 1
2 n(n−1), where the 12 is because Deff
i, j = Deffj,i
by the Onsager reciprocal relations. Finally, the third term on theright side represents Knudsen diffusion effects when incorporatedrigorously and using the solid phase as the reference velocity.85
The form of equation 18 is essentially an inverted form of thetype of equation 12, since one is not writing the flux in terms of amaterial gradient but the material gradient in terms of the flux. Thisis not a problem if one is solving the equations as written; however,many numerical packages require a second-order differential equation(e.g., see equation 14). To do this with the Stefan-Maxwell equations,
) unless CC License in place (see abstract). ecsdl.org/site/terms_use address. Redistribution subject to ECS terms of use (see 128.240.225.120Downloaded on 2014-09-14 to IP

Journal of The Electrochemical Society, 161 (12) F1254-F1299 (2014) F1259
inversion of them is required. For a two-component system wherethe pressure-diffusion is negligible, one arrives at equation 12. Forhigher numbers of components, the inversion becomes cumbersomeand analytic expressions are harder to obtain, resulting oftentimesin numerical inversion. In addition, the inversion results in diffusioncoefficients which are more composition dependent. For example,Bird et al. show the form for a three-component system.86
Finally, in addition to the above equation set, other models havebeen proposed including the binary friction model that uses a singleequation by combining Darcy’s law directly into the Stefan-Maxwellframework.87 Using this model, a governing equation for each speciescan be used instead of a mixture equation and n−1 species trans-port equations, thereby enabling the use of individual species vis-cosity instead of a mixture average viscosity. The combined Fick’sand Darcy model, Stefan-Maxwell, and binary-friction models wererecently compared.88
Charge transport.— The conservation equation for chargedspecies is an extension of the conservation of mass. Taking equa-tion 10 and multiplying by ziF and summing over all species andphases while noting that all reactions are charge balanced yields
∂
∂tF∑
k
εk
∑i
zi ci,k = −∇ · F∑
k
∑i
zi Ni,k [19]
where the volumetric charge density and areal current density can bedefined by
ρe = F∑
k
εk
∑i
zi ci,k [20]
and
ik = F∑
i
zi Ni,k [21]
respectively. Because a large electrical force is required to separatecharge over an appreciable distance, a volume element in the electrodewill, to a good approximation, be electrically neutral; thus one canassume electroneutrality for each phase∑
i
zi ci,k = 0 [22]
The assumption of electroneutrality implies that the diffuse doublelayer, where there is significant charge separation, is small comparedto the volume of the domain, which is normally (but not necessar-ily always as discussed later) the case. The general charge balance(equation 19), assuming electroneutrality and the current definition(equation 21) becomes ∑
k
∇ · ik = 0 [23]
While this relationship applies for almost all of the modeling, there arecases where electroneutrality does not strictly hold, including for sometransients and impedance measurements, where there is charging anddischarging of the double layer, as well as simulations at length scaleswithin the double layer (typically on the order of nanometers) such asreaction models near the electrode surface. For these cases, the correctgoverning charge conservation results in Poisson’s equation,
∇2� = ρe
ε0[24]
where ε0 is the permittivity of the medium. For the diffuse part of thedouble layer, often a Boltzmann distribution is used for the concen-tration of species i
ci = ci,∞ exp
(− zi F�
RT
)[25]
where � is the potential as referenced to the bulk solution (i.e., havingconcentration ci,∞). To charge this double layer, one can derive var-ious expressions for the double-layer capacitance depending on the
adsorption type, ionic charges, etc.,89 where the differential double-layer capacitance is defined as
Cd =(
∂q
∂�
)μi ,T
[26]
where q is the charge in the double layer and the differential is atconstant composition and temperature. To charge the double layer,one can write an equation of the form
i = Cd∂�
∂t[27]
where the charging current will decay with time as the double layerbecomes charged.
For the associated transport of charge, models can use eithera dilute-solution or concentrated-solution approach. In general, theconcentrated-solution approach is more rigorous but requires moreknowledge of all of the various interactions (similar to the material-transport-equation discussion above). For the dilute-solution ap-proach, one can use the Nernst-Planck equation,
Ni,k = −zi ui εk Fci,k∇�k − εk Di∇ci,k + ci,kv∗k [28]
where ui is the mobility of species i in phase k. In the equation,the terms on the right side correspond to migration, diffusion, andconvection, respectively. Multiplying equation 28 by ziF and summingover the species i in phase k,
F∑
i
zi Ni,k = −F2∑
i
z2i ui εkci,k∇�k
−F∑
i
zi εk Di∇ci,k + F∑
i
zi ci,kv∗k [29]
and noting that the last term is zero due to electroneutrality (convectionof a neutral solution cannot move charge) and using the definition ofcurrent density (equation 21), one gets
ik = −κk∇�k − F∑
i
zi εk Di∇ci,k [30]
where κk is the conductivity of the solution of phase k
κk = F2∑
i
z2i ci,kui [31]
When there are no concentration variations in the solution, equation30 reduces to Ohm’s law,
ik = −κk∇�k [32]
This dilute-solution approach does not account for interaction betweenthe solute molecules. Also, this approach will either use too many ortoo few transport coefficients depending on if the Nernst-Einsteinrelationship is used to relate mobility and diffusivity,
Di = RT ui [33]
which only rigorously applies at infinite dilution. Thus, concentrated-solution theory is preferred unless there are too many unknown pa-rameters and transport properties.
The concentrated-solution approach for charge utilizes the sameunderpinnings as that of the Stefan-Maxwell equation, which startswith the original equation of multicomponent transport90
di = ci∇μi =∑j �=i
Ki, j
(v j − vi
)[34]
where di is the driving force per unit volume acting on species i andcan be replaced by a electrochemical-potential gradient of species i,and Ki, j are the frictional interaction parameters between species i andj. The above equation can be analyzed in terms of finding expressionsfor the Ki,j’s, introducing the concentration scale including referencevelocities and potential definition, or by inverting the equations andcorrelating the inverse friction factors to experimentally determined
) unless CC License in place (see abstract). ecsdl.org/site/terms_use address. Redistribution subject to ECS terms of use (see 128.240.225.120Downloaded on 2014-09-14 to IP
F1260 Journal of The Electrochemical Society, 161 (12) F1254-F1299 (2014)
properties. If one uses a diffusion coefficient to replace the drag coef-ficients,
Ki, j = RT ci c j
cT Di, j[35]
where Di, j is an interaction parameter between species i and j basedon a thermodynamic driving force, then the multicomponent equa-tions look very similar to the Stefan-Maxwell ones (equation 18). Inaddition, using the above definition for Ki,j and assuming that speciesi is a minor component and that the total concentration, cT, can bereplaced by the solvent concentration (species 0), then equation 34for species i in phase k becomes
Ni,k = −Di,0
RTci,k∇μi,k + ci,kv0 [36]
This equation is very similar to the Nernst-Planck equation 28, exceptthat the driving force is the thermodynamic electrochemical potential,which contains both the migration and diffusive terms.Transport in the membrane.— For the special case of the PEM (sub-script 2), concentrated-solution theory can be used to obtain91
i2 = −κ∇�2 − κξ
F∇μw [37]
and
Nw = −κξ
F∇�2 −
(α + κξ2
F2
)∇μw [38]
where ξ is the electro-osmotic coefficient and is defined as the ratioof flux of water to the flux of protons in the absence of concentra-tion gradients, α is the transport parameter that can be related to ahydraulic pressure or concentration gradient through the chemical-potential driving force,50
∇μw = RT ∇ ln aw + Vw∇ p [39]
where aw, Vw, and p are the activity, molar volume, and hydraulic pres-sure of water, respectively. As mentioned, there is still a lot of debateover the functional forms of the transport properties of the membrane,as well as the existence of a possible interfacial resistance.51–68,92,93 Toaccount for such an interface, the membrane water-uptake boundarycondition is altered to include a mass-transfer coefficient instead ofassuming an equilibrium isotherm directly
N = kmt (ain − aout) [40]
where in and out refer to the water activities directly inside and out-side of the membrane interface (which can be defined from Flory-Rehner equation in the polymer94 and the relative humidity in the gasphase, respectively) and kmt is a mass-transfer coefficient that can be afunction of local conditions (e.g., humidity, temperature, gas-velocity,etc.).51,52,54,58,61,62,64–68,92,93 This approach is the same as including asurface reaction (e.g., condensation) at the membrane interface,95–97
and is not as often used in modeling as perhaps it should be. Onecaveat to the above is that it must be used in such a way that theactivity is defined at at least one boundary of the membrane in orderto avoid multiple solutions.
Momentum transport.— Due to the highly coupled nature of mo-mentum conservation and transport, both are discussed below. Also,the momentum or volume conservation equation is highly coupled tothe mass or continuity conservation equation (equation 10). Newton’ssecond law governs the conservation of momentum and can be writtenin terms of the Navier-Stokes equation83
∂ (ρkvk)
∂t+ vk · ∇ (ρkvk) = −∇ pk + μk∇2vk + Sm [41]
where μk and vk are the viscosity and mass-averaged velocity of phasek (equation 13), respectively. The transient term in the momentumconservation equation represents the accumulation of momentum withtime and the second term describes convection of the momentum flux(which is often small for PEFC designs). The first two terms on the
right side represent the divergence of the stress tensor and the last termrepresents other sources of momentum, typically other body forceslike gravity or magnetic forces. However for PEFCs, these forces areoften ignored and unimportant, i.e. Sm = 0.
It should be noted that for porous materials and multiphase flow, asdiscussed below, the Navier-Stokes equations are not used and insteadone uses the empirical Darcy’s law for the transport equation (wheregravity has been neglected),98,99
vk = − kk
μk∇ pk [42]
where vk is the mass-averaged velocity of phase k
vk =
∑i �=s
Mi Ni,k
ρk=
∑i �=s
Mi Ni,k∑i �=s
Mi ci,k[43]
This transport equation can be used as a first-order equation or com-bined with a material balance (equation 10) to yield
∂ (ρkεk)
∂t= ∇ ·
(−ρk
kk
μk∇ pk
)+ Sm [44]
which is similar to including it as a dominant source term. In the aboveexpression, kk is effective permeability of phase k.
Energy transport.— Throughout all layers of the PEFC, the sametransport and conservation equations exist for energy with the samegeneral transport properties, and only the source terms vary. Theconservation of thermal energy can be written as
ρkC pk
(∂Tk
∂t+ vk · ∇Tk
)+(
∂ ln ρk
∂ ln Tk
)pk ,xi,k
(∂pk
∂t+ vk · ∇ pk
)
= Qk,p − ∇ · qk − τ : ∇vk +∑
i
Hi,k∇ · Ji,k −∑
i
Hi,ki,k
[45]
In the above expression, the first term represents the accumulationand convective transport of enthalpy, where C pk is the heat capacityof phase k which is a combination of the various components ofthat phase. The second term is energy due to reversible work. Forcondensed phases this term is negligible, and an order-of-magnitudeanalysis for ideal gases with the expected pressure drop in a PEFCdemonstrates that this term is negligible compared to the others. Thefirst two terms on the right side of equation 45 represent the net heatinput by conduction and interphase transfer. The first is due to heattransfer between two phases
Qk,p = hk,pak,p
(Tp − Tk
)[46]
where hk,p is the heat-transfer coefficient between phases k and p perinterfacial area. Most often this term is used as a boundary conditionsince it occurs only at the edges. However, in some modeling domainsit may need to be incorporated as above. The second term is due tothe heat flux in phase k
qk = −∑
i
Hi,kJi,k − keffTk
∇Tk [47]
where Hi,k is the partial molar enthalpy of species i in phase k, Ji,k isthe flux density of species i relative to the mass-average velocity ofphase k
Ji,k = Ni,k − ci,kvk [48]
and keffTk
is the effective thermal conductivity of phase k, which isaveraged over the various phases.1,100–106 The third term on the rightside of equation 45 represents viscous dissipation, the heat generatedby viscous forces, where τ is the stress tensor. This term is also small,and for most cases can be neglected. The fourth term on the right side
) unless CC License in place (see abstract). ecsdl.org/site/terms_use address. Redistribution subject to ECS terms of use (see 128.240.225.120Downloaded on 2014-09-14 to IP
Journal of The Electrochemical Society, 161 (12) F1254-F1299 (2014) F1261
comes from enthalpy changes due to diffusion. Finally, the last termrepresents the change in enthalpy due to reaction∑
i
Hi,ki,k = −∑
h
a1,k ih,1−k
(ηsh,1−k + �h
)
−∑p �=k
�Hlak,prl,k−p −∑
g
�Hg Rg,k [49]
where the expressions can be compared to those in the material con-servation equation 10. The above reaction terms include homoge-neous reactions, interfacial reactions (e.g., evaporation), and inter-facial electron-transfer reactions. The irreversible heat generation isrepresented by the activation overpotential and the reversible heatgeneration is represented by the Peltier coefficient, �h . The Peltiercoefficient for charge-transfer reaction h is given by
�h ≈ T
nh F
∑i
si,k,h Si,k = T�Sh
nh F[50]
where �Sh is the entropy of reaction h. The above equation neglectstransported entropy (hence the approximate sign), and the summationincludes all species that participate in the reaction (e.g., electrons,protons, oxygen, hydrogen, water). While the entropy of the half-reactions that occur at the catalyst layers is not truly obtainable since itinvolves knowledge of the activity of an uncoupled proton, the Peltiercoefficients have been measured experimentally for these reactions,with most of the reversible heat in a PEFC is due to the 4-electronoxygen reduction reaction.107,108
It is often the case that because of the intimate contact between thegas, liquid, and solid phases within the small pores of the various PEFClayers, that equilibrium can be assumed such that all of the phases havethe same temperature for a given point in the PEFC (this assumptionis discussed more in a later section). Assuming local equilibriumeliminates the phase dependences in the above equations and allowsfor a single thermal energy equation to be written. Neglecting thosephenomena that are minor as mentioned above and summing over thephases, results in∑
k
ρkC pk
∂T
∂t= −
∑k
ρkC pk vk · ∇T +∇ · (keffT ∇T
)+∑
k
ik · ik
κeffk
+∑
h
ih (ηh + �h) −∑
h
�Hhrh [51]
where the expression for Joule or ohmic heating has been substitutedin for the fourth-term in the right side of equation 45 assuming aneffective conductivity
−∑
i
Ji,k · ∇ Hi,k = −ik · ∇�k = ik · ik
κeffk
[52]
In equation 51, the first term on the right side is energy transportdue to convection, the second is energy transport due to conduction,the third is the ohmic heating, the fourth is the reaction heats, andthe last represents reactions in the bulk which include such thingsas vaporization/condensation and freezing/melting. Heat lost to thesurroundings is only accounted for at the boundaries of the cell. Interms of magnitude, the major heat generation sources are the oxygenreduction reaction and the water phase changes, and the main modeof heat transport is by conduction.
Kinetics.— Electrochemical kinetic expressions provide the trans-fer current in the general material balance (i.e., ih,1−k in equation 10).A typical electrochemical reaction can be expressed as∑
k
∑i
si,k,h Mzii → nhe− [53]
where si,k,h is the stoichiometric coefficient of species i residing inphase k and participating in electron-transfer reaction h and Mzi
i rep-resents the chemical formula of i having valence zi . According to
Faraday’s law, the flux of species i in phase k and rate of reaction h isrelated to the current as
Ni,k =∑
h
rh,i,k =∑
h
si,k,hih
nh F[54]
For modeling purposes, especially with the multi-electron transport ofspecies, it is often easiest to use a semi-empirical equation to describethe reaction rate, namely, the Butler-Volmer equation,89,109
ih = i0h
[exp
(αa F
RT
(�k − �p − U ref
h
)) a�i
(ai
arefi
)si,k,h
− exp
(−αc F
RT
(�k − �p − U ref
h
)) c�i
(ai
arefi
)−si,k,h]
[55]
where ih is the transfer current between phases k and p due to electron-transfer reaction h, the products are over the anodic and cathodic re-action species, respectively, αa and αc are the anodic and cathodictransfer coefficients, respectively, and i0h and U ref
h are the exchangecurrent density per unit catalyst area and the potential of reaction hevaluated at the reference conditions and the operating temperature,respectively. It should be noted that the choice of reference potentialand exchange current density are linked meaning that one can result invalue and functional changes of the other.86,103 This is especially truein terms of a Tafel expression since the exchange current density andthe reference potential are not able to be separately distinguished.89,109
Also, as shown in the generalized material-balance equation 10, thevalue of the exchange current density is multiplied by the specificinterfacial area, and normally, these are not necessarily known in-dependently so models often will just use an ai0 parameter in theirkinetic expression.
In the above expression, the composition-dependent part of theexchange current density is explicitly written, with the multiplicationover those species participating in the anodic or cathodic direction.The reference potential is determined by thermodynamics as describedabove (e.g., equation 6), where the same (imaginary) reference elec-trode should be used for calculation of the electronic and ionic poten-tials. The term in parentheses in equation 27 can be written in termsof an electrode overpotential
ηh = �k − �p − U refh [56]
If the reference electrode is exposed to the conditions at the reactionsite, then a surface or kinetic overpotential can be defined
ηsh = �k − �p − Uh [57]
The surface overpotential is the overpotential that directly influencesthe reaction rate across the interface.
For the HOR occurring at the anode, equation 55 can be written as
iHOR = i0HOR
[pH2
prefH2
exp
(αa F
RT(ηHOR)
)
−(
aHM
arefHM
)2
exp
(−αc F
RT(ηHOR)
)][58]
where the reaction is almost always taken to be first order in hy-drogen. Typically, the dependence on the activity of the proton(H)-membrane(M) complex is not shown since the electrolyte is a poly-mer of defined acid concentration (i.e., cHM = cref
HM). However, ifone deals with contaminant ions, then equation 58 should be usedas written,110–112 and one might also expect that due to temperature,hydration, or other local conditions the activity coefficient for HMmay change and thus aHM does not necessary equal aref
HM. It has alsobeen shown that the HOR may proceed with a different mechanism atlow hydrogen concentrations or under certain conditions113,114; in suchcases, the kinetic equation is altered depending on the mechanism89
(e.g., by the use of a surface adsorption term). However, moremechanistic-based equations are typically only used for specific stud-ies and models and are beyond the scope of this review. Due to the
) unless CC License in place (see abstract). ecsdl.org/site/terms_use address. Redistribution subject to ECS terms of use (see 128.240.225.120Downloaded on 2014-09-14 to IP
F1262 Journal of The Electrochemical Society, 161 (12) F1254-F1299 (2014)
choice of reference electrode, the reference potential and reversiblepotential are both equal to zero.
Unlike the facile HOR, the ORR is slow. Due to its sluggishness,the anodic part of the ORR is considered negligible and is dropped,resulting in the so-called Tafel approximation
iORR = −i0ORR
(pO2
prefO2
)m0 (aHM
arefHM
)2
exp
(−αc F
RT(ηORR)
)[59]
with an observed kinetic dependence on oxygen partial pressure, m0,of between 0.8 and 1115–118 and an Arrhenius temperature dependencefor the exchange current density. For both the HOR and ORR, α istypically taken to be equal to 1,115,116,119–121 however newer mod-els use a value between 0.5 and 1 (with significant cell-performanceprediction changes) for the ORR due to Pt-oxide formation as ex-amined in more detail below.122–125 In addition, as mentioned, thechoice of the reference potential for the overpotential will directlyimpact the exchange-current density (since they cannot be separated)and even reaction order.115 Due to the importance of the ORR, moredetailed kinetic expressions have been developed as described brieflybelow. In addition, other reactions such as those involving durability(e.g., carbon corrosion) are discussed in subsequent sections of thisreview.Pt-oxide and the double trap model.— The underlying assumption ofusing a Butler-Volmer (or Tafel) equation is that the reaction proceedsthrough a single rate-determining-step (RDS). However, in electro-catalysis reactions over a wide potential range, the RDS can change,as intermediates form on the surface of the catalyst. These inter-mediates are due to oxide formation, which forms at the potentialrange of the ORR (0.6 to 1.0 V) by water or gas-phase oxygen.These oxides can inhibit the ORR by blocking active Pt sites withchemisorbed surface oxygen. Typically, a constant Tafel slope forthe ORR kinetics around 60 to 70 mV/decade is assumed over thecathode potential range relevant to PEFC operation. However, it hasbeen suggested by experiments that this approach has to be modi-fied to account for the potential-dependent oxide coverage,122,126–128
especially for low catalyst loadings where poisoning has greater im-pact due to the low catalyst-site number. To implement this coverage,either a term is added to the ORR kinetic equation 59129 or a moremechanistic model is used.124,130,131 For the first approach, equation 59becomes
iORR = −i0ORR (1 − �PtO)
(pO2
prefO2
)m0 (aHM
arefHM
)4
× exp
(−αc F
RT(ηORR)
)exp
(−ω�PtO
RT
)[60]
where �PtO is the coverage of Pt oxide; it should be noted that severaloxides can exist and here PtO is taken as an example, and ω is theenergy parameter for oxide adsorption. There are various methods tocalculate PtO using kinetic equations, such as132,133
�PtO =exp
[α′
a FRT ηPtO
]exp
[α′
a FRT ηPtO
]+ exp
[−α′
c FRT ηPtO
] [61]
where
ηPtO = �1 − �2 − UPtO [62]
and ηPtO and UPtO are the Pt-oxide overpotential and equilibriumpotential, respectively. Another approach is to estimate it with exper-imental correlations.134
While the above approach predicts the doubling of the Tafelslope,135,136 it assumes that the adsorbates are site-blockers and thatthe first electron transfer step is the RDS. To relax these assumptions,a double-trap kinetic model was developed by Wang et al.130,131 Inthis model, the kinetics are explained with four elementary reaction
steps,
1
2O2 ⇔ Oad, dissociative adsorption (DA) [63]
1
2O2 + H+ + e− ⇔ OHad, reductive adsorption (RA) [64]
Oad + H+ + e− ⇔ OHad, reductive transition (RT) [65]
OHad + H+ + e− ⇔ H2O, reductive desorption (RD) [66]
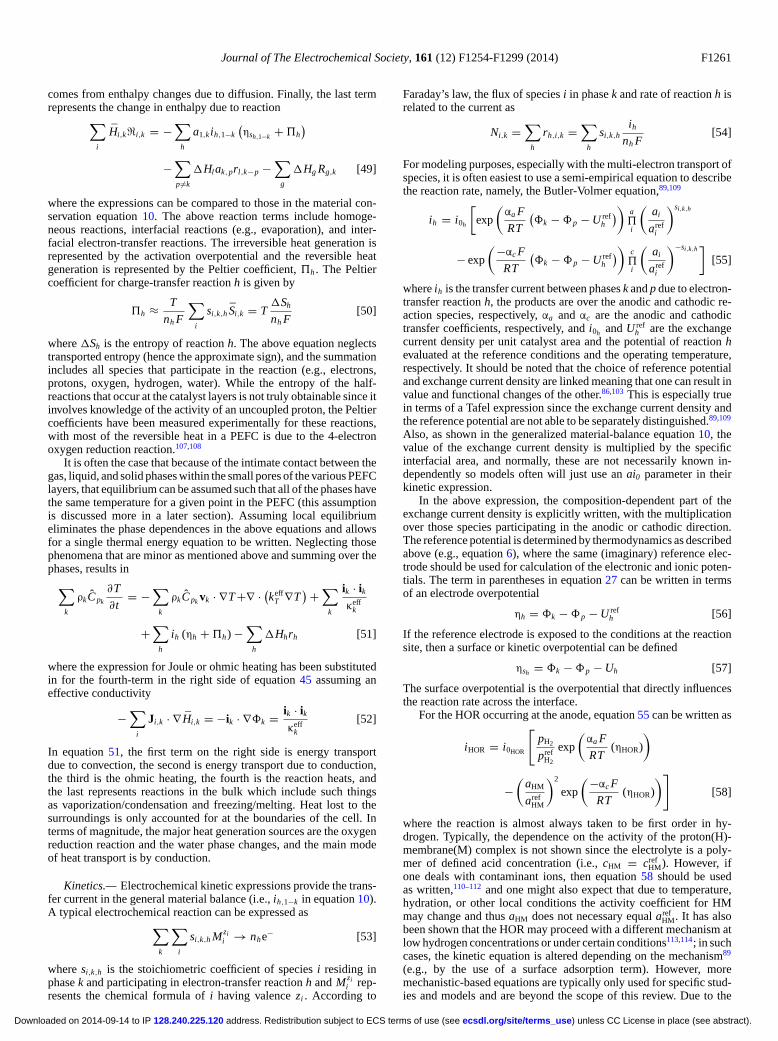
any of which can become the RDS depending on the potential.Schematically, these elementary reactions represent two adsorptionpathways that proceed through: 1) dissociative adsorption (DA) and2) reductive adsorption (RA):
[67]Using a steady-state approximation (intermediate coverage does
not change with time: dθO/dt = dθOH/dt = 0), the total kineticcurrent can be expressed as a combination of elementary currents
jk = jRD = jRA + jRT = jDA + jRA [68]
The individual currents can be expressed as a difference between theforward and backward reaction currents and in terms of a referenceprefactor, j∗, activation free energy, and adsorbed species; a detailedderivation is provided elsewhere.131 As an example, the kinetic currentfor the RD step, which represents the desorption of OH, is
jRD = j∗ exp(−�G∗RD/kT )θOH − j∗ exp(−�G∗
−RD/kT )
× (1 − θO − θOH) [69]
where the activation energies are potential dependent.131
In this framework, the adjustable kinetic parameters are fouractivation and two adsorption free energies, which are fit to ki-netic polarization data and cyclic-voltammetry data for surface oxidecoverage,137–139 or they can be estimated computationally by ab-initiomodeling.124,139,140 A double-trap modeling framework offers a versa-tile way to model the PEFC’s reaction kinetics (provided good datafor the fitting parameters is available), and it predicts the observeddoubling of the Tafel slope due to reaction-pathway changes and cap-tures the trends of the experimental oxide coverage. It can also has acapability to bridge the more traditional kinetic models with the the-oretical results from ab-initio studies. Finally, it can also be extendedto capture Pt dissolution and high-oxide-coverage regime (>1 V).
Critical Issues in the Field
As mentioned above, the two critical issues in the field for trans-port modeling to address are multiphase flow and modeling of catalystlayers, particularly the cathode. Specifically, there is still a need to re-solve, understand, and model liquid-water transport and interactions,especially at the GDL / gas-channel interface. In terms of catalyst lay-ers, they are the most complex layer within the PEFC, being composedof all other components and requiring knowledge of a wide varietyof physics that interacts on multiple scales. In addition, there is still alack of experimental data on issues related specifically to the catalystlayer, which makes modeling them challenging. Below, we examineeach of these critical areas in sequence. We will discuss the governingequations for these issues, while highlighting those areas that require
) unless CC License in place (see abstract). ecsdl.org/site/terms_use address. Redistribution subject to ECS terms of use (see 128.240.225.120Downloaded on 2014-09-14 to IP
Journal of The Electrochemical Society, 161 (12) F1254-F1299 (2014) F1263
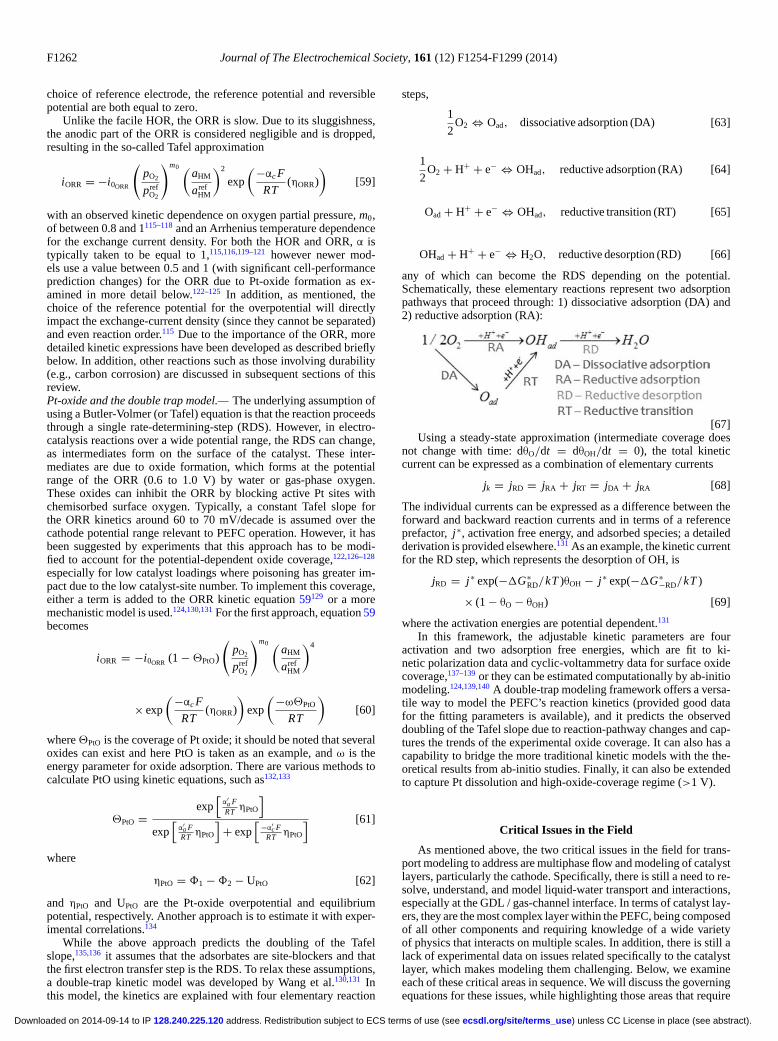
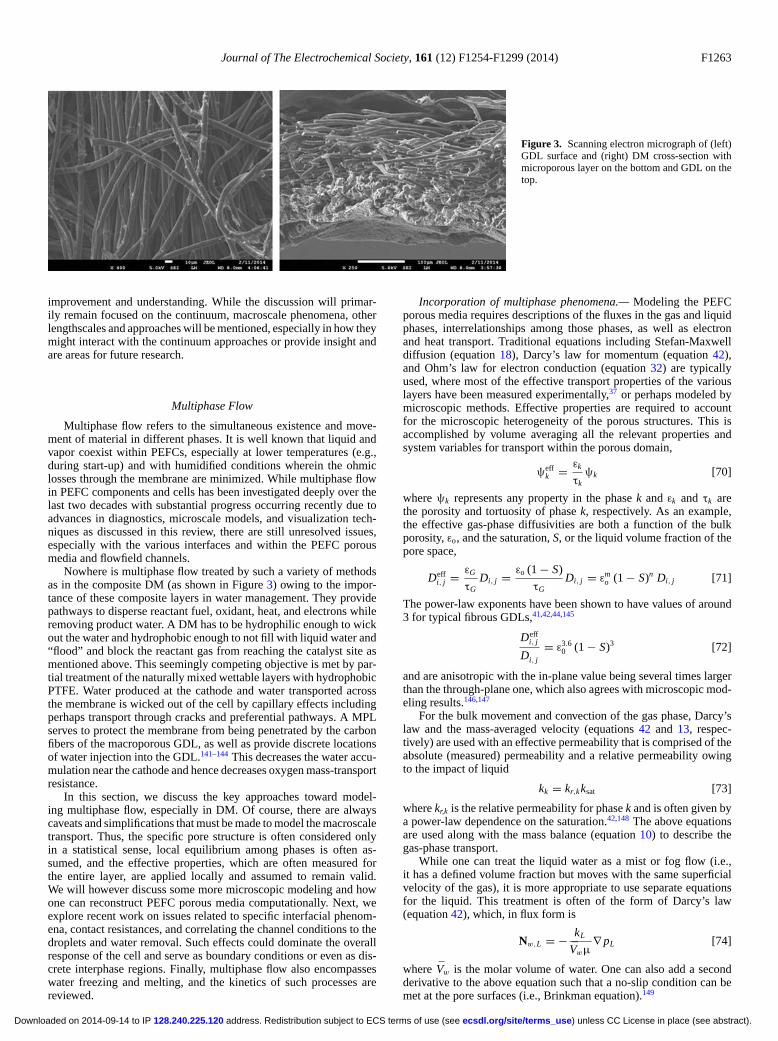
Figure 3. Scanning electron micrograph of (left)GDL surface and (right) DM cross-section withmicroporous layer on the bottom and GDL on thetop.
improvement and understanding. While the discussion will primar-ily remain focused on the continuum, macroscale phenomena, otherlengthscales and approaches will be mentioned, especially in how theymight interact with the continuum approaches or provide insight andare areas for future research.
Multiphase Flow
Multiphase flow refers to the simultaneous existence and move-ment of material in different phases. It is well known that liquid andvapor coexist within PEFCs, especially at lower temperatures (e.g.,during start-up) and with humidified conditions wherein the ohmiclosses through the membrane are minimized. While multiphase flowin PEFC components and cells has been investigated deeply over thelast two decades with substantial progress occurring recently due toadvances in diagnostics, microscale models, and visualization tech-niques as discussed in this review, there are still unresolved issues,especially with the various interfaces and within the PEFC porousmedia and flowfield channels.
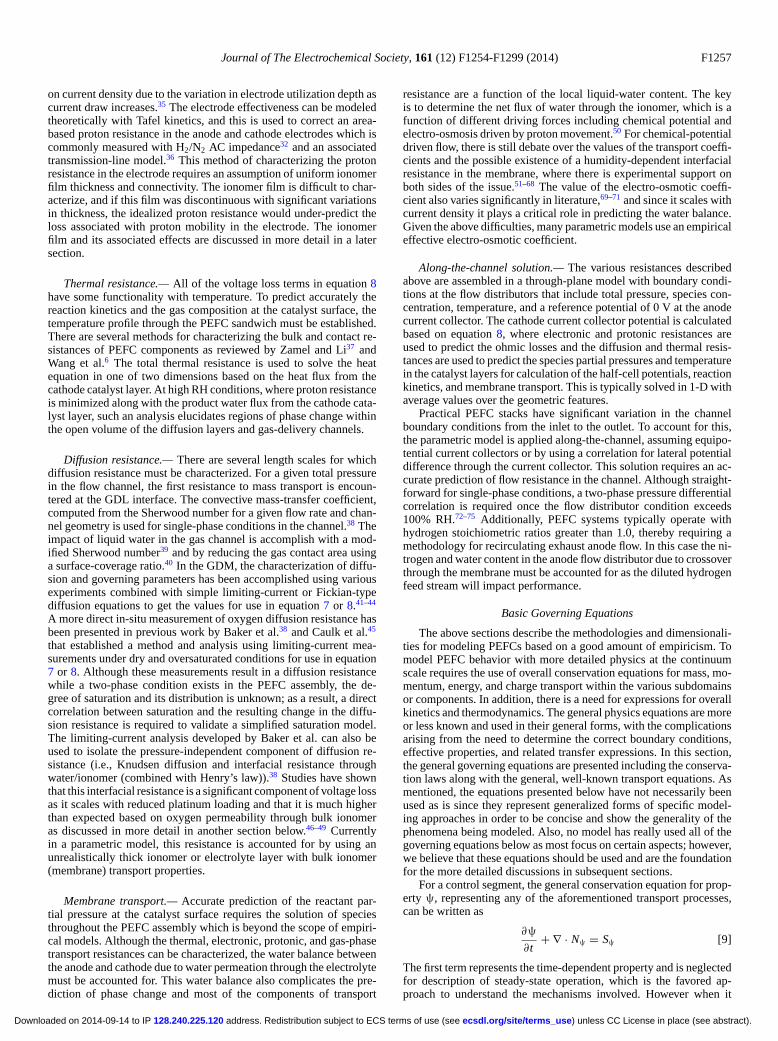
Nowhere is multiphase flow treated by such a variety of methodsas in the composite DM (as shown in Figure 3) owing to the impor-tance of these composite layers in water management. They providepathways to disperse reactant fuel, oxidant, heat, and electrons whileremoving product water. A DM has to be hydrophilic enough to wickout the water and hydrophobic enough to not fill with liquid water and“flood” and block the reactant gas from reaching the catalyst site asmentioned above. This seemingly competing objective is met by par-tial treatment of the naturally mixed wettable layers with hydrophobicPTFE. Water produced at the cathode and water transported acrossthe membrane is wicked out of the cell by capillary effects includingperhaps transport through cracks and preferential pathways. A MPLserves to protect the membrane from being penetrated by the carbonfibers of the macroporous GDL, as well as provide discrete locationsof water injection into the GDL.141–144 This decreases the water accu-mulation near the cathode and hence decreases oxygen mass-transportresistance.
In this section, we discuss the key approaches toward model-ing multiphase flow, especially in DM. Of course, there are alwayscaveats and simplifications that must be made to model the macroscaletransport. Thus, the specific pore structure is often considered onlyin a statistical sense, local equilibrium among phases is often as-sumed, and the effective properties, which are often measured forthe entire layer, are applied locally and assumed to remain valid.We will however discuss some more microscopic modeling and howone can reconstruct PEFC porous media computationally. Next, weexplore recent work on issues related to specific interfacial phenom-ena, contact resistances, and correlating the channel conditions to thedroplets and water removal. Such effects could dominate the overallresponse of the cell and serve as boundary conditions or even as dis-crete interphase regions. Finally, multiphase flow also encompasseswater freezing and melting, and the kinetics of such processes arereviewed.
Incorporation of multiphase phenomena.— Modeling the PEFCporous media requires descriptions of the fluxes in the gas and liquidphases, interrelationships among those phases, as well as electronand heat transport. Traditional equations including Stefan-Maxwelldiffusion (equation 18), Darcy’s law for momentum (equation 42),and Ohm’s law for electron conduction (equation 32) are typicallyused, where most of the effective transport properties of the variouslayers have been measured experimentally,37 or perhaps modeled bymicroscopic methods. Effective properties are required to accountfor the microscopic heterogeneity of the porous structures. This isaccomplished by volume averaging all the relevant properties andsystem variables for transport within the porous domain,
ψeffk = εk
τkψk [70]
where ψk represents any property in the phase k and εk and τk arethe porosity and tortuosity of phase k, respectively. As an example,the effective gas-phase diffusivities are both a function of the bulkporosity, εo, and the saturation, S, or the liquid volume fraction of thepore space,
Deffi, j = εG
τGDi, j = εo (1 − S)
τGDi, j = εm
o (1 − S)n Di, j [71]
The power-law exponents have been shown to have values of around3 for typical fibrous GDLs,41,42,44,145
Deffi, j
Di, j
= ε3.60 (1 − S)3 [72]
and are anisotropic with the in-plane value being several times largerthan the through-plane one, which also agrees with microscopic mod-eling results.146,147
For the bulk movement and convection of the gas phase, Darcy’slaw and the mass-averaged velocity (equations 42 and 13, respec-tively) are used with an effective permeability that is comprised of theabsolute (measured) permeability and a relative permeability owingto the impact of liquid
kk = kr,kksat [73]
where kr,k is the relative permeability for phase k and is often given bya power-law dependence on the saturation.42,148 The above equationsare used along with the mass balance (equation 10) to describe thegas-phase transport.
While one can treat the liquid water as a mist or fog flow (i.e.,it has a defined volume fraction but moves with the same superficialvelocity of the gas), it is more appropriate to use separate equationsfor the liquid. This treatment is often of the form of Darcy’s law(equation 42), which, in flux form is
Nw,L = − kL
Vwμ∇ pL [74]
where Vw is the molar volume of water. One can also add a secondderivative to the above equation such that a no-slip condition can bemet at the pore surfaces (i.e., Brinkman equation).149
) unless CC License in place (see abstract). ecsdl.org/site/terms_use address. Redistribution subject to ECS terms of use (see 128.240.225.120Downloaded on 2014-09-14 to IP
F1264 Journal of The Electrochemical Society, 161 (12) F1254-F1299 (2014)
In terms of heat transport, for DM, the thermal balance turnsmainly into heat conduction due to the high thermal conductivitycompared to convective fluxes. Although no electrochemical reac-tions are occurring within the DM, there are still phase-change re-actions that can consume/generate a considerable amount of heat,e.g.,
revap = kevapaG,L
(pw − pvap
w
)[75]
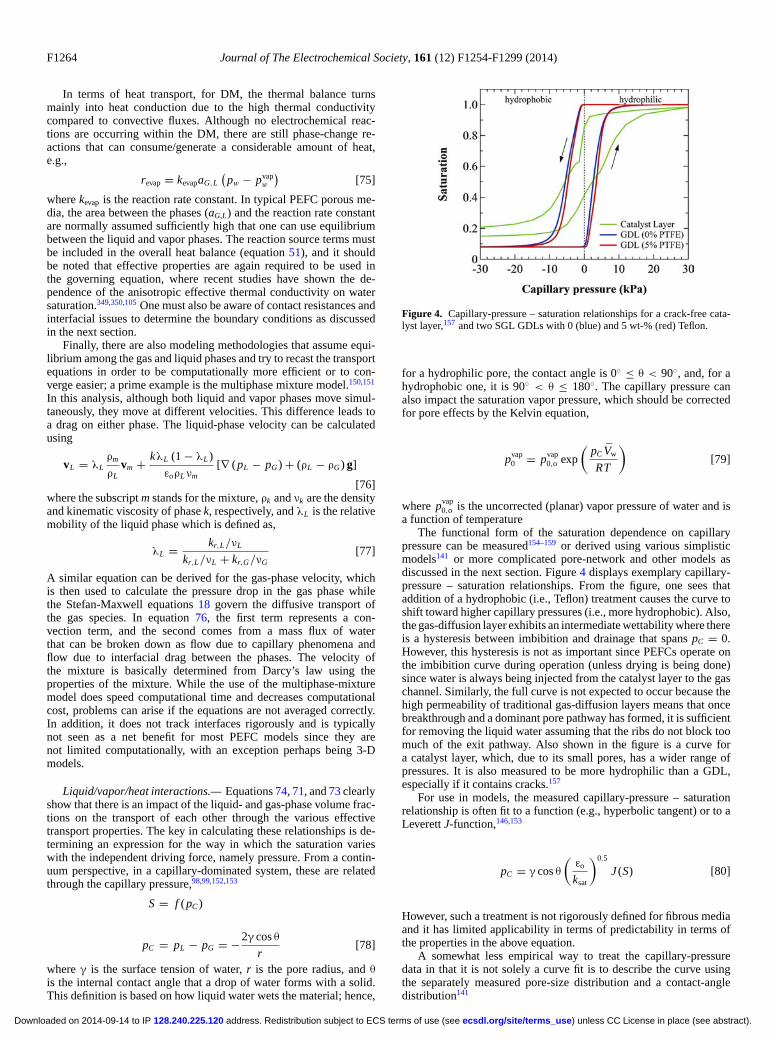
where kevap is the reaction rate constant. In typical PEFC porous me-dia, the area between the phases (aG,L) and the reaction rate constantare normally assumed sufficiently high that one can use equilibriumbetween the liquid and vapor phases. The reaction source terms mustbe included in the overall heat balance (equation 51), and it shouldbe noted that effective properties are again required to be used inthe governing equation, where recent studies have shown the de-pendence of the anisotropic effective thermal conductivity on watersaturation.349,350,105 One must also be aware of contact resistances andinterfacial issues to determine the boundary conditions as discussedin the next section.
Finally, there are also modeling methodologies that assume equi-librium among the gas and liquid phases and try to recast the transportequations in order to be computationally more efficient or to con-verge easier; a prime example is the multiphase mixture model.150,151
In this analysis, although both liquid and vapor phases move simul-taneously, they move at different velocities. This difference leads toa drag on either phase. The liquid-phase velocity can be calculatedusing
vL = λLρm
ρLvm + kλL (1 − λL )
εoρLνm[∇ (pL − pG) + (ρL − ρG) g]
[76]where the subscript m stands for the mixture, ρk and νk are the densityand kinematic viscosity of phase k, respectively, and λL is the relativemobility of the liquid phase which is defined as,
λL = kr,L/νL
kr,L/νL + kr,G/νG[77]
A similar equation can be derived for the gas-phase velocity, whichis then used to calculate the pressure drop in the gas phase whilethe Stefan-Maxwell equations 18 govern the diffusive transport ofthe gas species. In equation 76, the first term represents a con-vection term, and the second comes from a mass flux of waterthat can be broken down as flow due to capillary phenomena andflow due to interfacial drag between the phases. The velocity ofthe mixture is basically determined from Darcy’s law using theproperties of the mixture. While the use of the multiphase-mixturemodel does speed computational time and decreases computationalcost, problems can arise if the equations are not averaged correctly.In addition, it does not track interfaces rigorously and is typicallynot seen as a net benefit for most PEFC models since they arenot limited computationally, with an exception perhaps being 3-Dmodels.
Liquid/vapor/heat interactions.— Equations 74, 71, and 73 clearlyshow that there is an impact of the liquid- and gas-phase volume frac-tions on the transport of each other through the various effectivetransport properties. The key in calculating these relationships is de-termining an expression for the way in which the saturation varieswith the independent driving force, namely pressure. From a contin-uum perspective, in a capillary-dominated system, these are relatedthrough the capillary pressure,98,99,152,153
S = f (pC )
pC = pL − pG = −2γ cos θ
r[78]
where γ is the surface tension of water, r is the pore radius, and θis the internal contact angle that a drop of water forms with a solid.This definition is based on how liquid water wets the material; hence,
Figure 4. Capillary-pressure – saturation relationships for a crack-free cata-lyst layer,157 and two SGL GDLs with 0 (blue) and 5 wt-% (red) Teflon.
for a hydrophilic pore, the contact angle is 0◦ ≤ θ < 90◦, and, for ahydrophobic one, it is 90◦ < θ ≤ 180◦. The capillary pressure canalso impact the saturation vapor pressure, which should be correctedfor pore effects by the Kelvin equation,
pvap0 = pvap
0,o exp
(pC Vw
RT
)[79]
where pvap0,o is the uncorrected (planar) vapor pressure of water and is
a function of temperatureThe functional form of the saturation dependence on capillary
pressure can be measured154–159 or derived using various simplisticmodels141 or more complicated pore-network and other models asdiscussed in the next section. Figure 4 displays exemplary capillary-pressure – saturation relationships. From the figure, one sees thataddition of a hydrophobic (i.e., Teflon) treatment causes the curve toshift toward higher capillary pressures (i.e., more hydrophobic). Also,the gas-diffusion layer exhibits an intermediate wettability where thereis a hysteresis between imbibition and drainage that spans pC = 0.However, this hysteresis is not as important since PEFCs operate onthe imbibition curve during operation (unless drying is being done)since water is always being injected from the catalyst layer to the gaschannel. Similarly, the full curve is not expected to occur because thehigh permeability of traditional gas-diffusion layers means that oncebreakthrough and a dominant pore pathway has formed, it is sufficientfor removing the liquid water assuming that the ribs do not block toomuch of the exit pathway. Also shown in the figure is a curve fora catalyst layer, which, due to its small pores, has a wider range ofpressures. It is also measured to be more hydrophilic than a GDL,especially if it contains cracks.157
For use in models, the measured capillary-pressure – saturationrelationship is often fit to a function (e.g., hyperbolic tangent) or to aLeverett J-function,146,153
pC = γ cos θ
(εo
ksat
)0.5
J (S) [80]
However, such a treatment is not rigorously defined for fibrous mediaand it has limited applicability in terms of predictability in terms ofthe properties in the above equation.
A somewhat less empirical way to treat the capillary-pressuredata in that it is not solely a curve fit is to describe the curve usingthe separately measured pore-size distribution and a contact-angledistribution141
) unless CC License in place (see abstract). ecsdl.org/site/terms_use address. Redistribution subject to ECS terms of use (see 128.240.225.120Downloaded on 2014-09-14 to IP
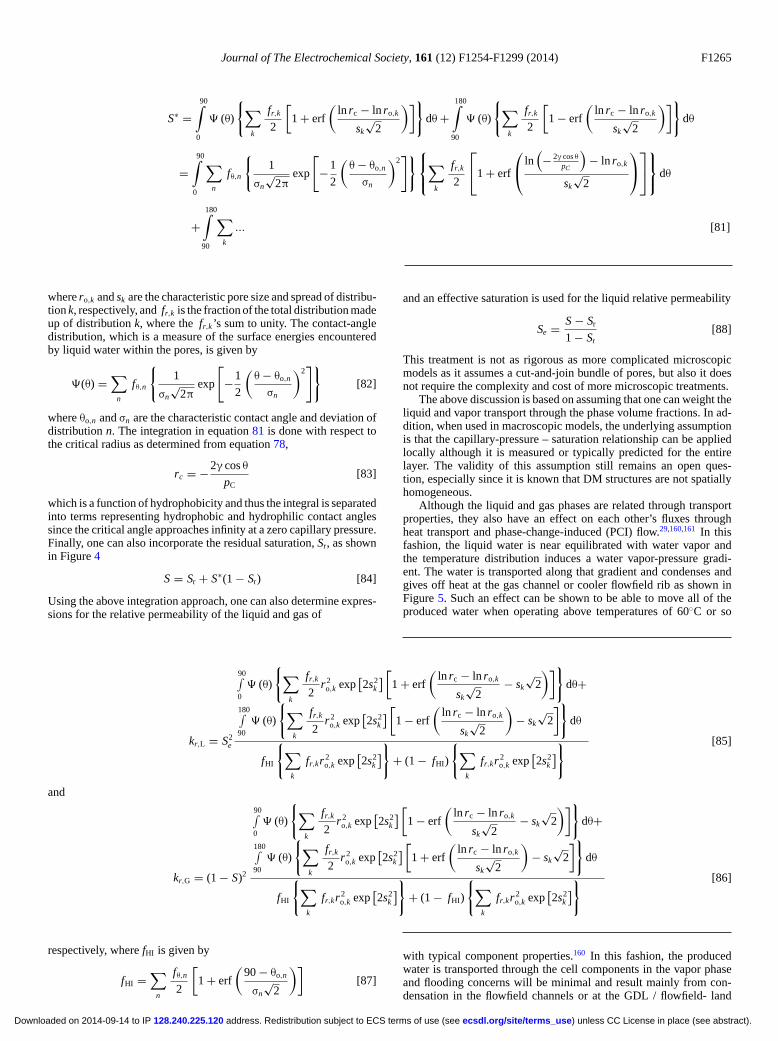
Journal of The Electrochemical Society, 161 (12) F1254-F1299 (2014) F1265
S∗ =90∫
0
� (θ)
{∑k
fr,k
2
[1 + erf
(ln rc − ln ro,k
sk
√2
)]}dθ +
180∫90
� (θ)
{∑k
fr,k
2
[1 − erf
(ln rc − ln ro,k
sk
√2
)]}dθ
=90∫
0
∑n
fθ,n
{1
σn
√2π
exp
[−1
2
(θ − θo,n
σn
)2]}⎧⎨⎩∑
k
fr,k
2
⎡⎣1 + erf
⎛⎝ ln
(− 2γ cos θ
pC
)− ln ro,k
sk
√2
⎞⎠⎤⎦⎫⎬⎭ dθ
+180∫
90
∑k
... [81]
where ro,k and sk are the characteristic pore size and spread of distribu-tion k, respectively, and fr,k is the fraction of the total distribution madeup of distribution k, where the fr,k’s sum to unity. The contact-angledistribution, which is a measure of the surface energies encounteredby liquid water within the pores, is given by
�(θ) =∑
n
fθ,n
{1
σn
√2π
exp
[−1
2
(θ − θo,n
σn
)2]}
[82]
where θo,n and σn are the characteristic contact angle and deviation ofdistribution n. The integration in equation 81 is done with respect tothe critical radius as determined from equation 78,
rc = −2γ cos θ
pC[83]
which is a function of hydrophobicity and thus the integral is separatedinto terms representing hydrophobic and hydrophilic contact anglessince the critical angle approaches infinity at a zero capillary pressure.Finally, one can also incorporate the residual saturation, Sr, as shownin Figure 4
S = Sr + S∗(1 − Sr) [84]
Using the above integration approach, one can also determine expres-sions for the relative permeability of the liquid and gas of
kr,L = S2e
90∫0
� (θ)
{∑k
fr,k
2r 2
o,k exp[2s2
k
] [1 + erf
(ln rc − ln ro,k
sk
√2
− sk
√2
)]}dθ+
180∫90
� (θ)
{∑k
fr,k
2r 2
o,k exp[2s2
k
] [1 − erf
(ln rc − ln ro,k
sk
√2
)− sk
√2
]}dθ
fHI
{∑k
fr,kr 2o,k exp
[2s2
k
]}+ (1 − fHI)
{∑k
fr,kr 2o,k exp
[2s2
k
]} [85]
and
kr,G = (1 − S)2
90∫0
� (θ)
{∑k
fr,k
2r 2
o,k exp[2s2
k
] [1 − erf
(ln rc − ln ro,k
sk
√2
− sk
√2
)]}dθ+
180∫90
� (θ)
{∑k
fr,k
2r 2
o,k exp[2s2
k
] [1 + erf
(ln rc − ln ro,k
sk
√2
)− sk
√2
]}dθ
fHI
{∑k
fr,kr 2o,k exp
[2s2
k
]}+ (1 − fHI)
{∑k
fr,kr 2o,k exp
[2s2
k
]} [86]
respectively, where fHI is given by
fHI =∑
n
fθ,n2
[1 + erf
(90 − θo,n
σn
√2
)][87]
and an effective saturation is used for the liquid relative permeability
Se = S − Sr
1 − Sr[88]
This treatment is not as rigorous as more complicated microscopicmodels as it assumes a cut-and-join bundle of pores, but also it doesnot require the complexity and cost of more microscopic treatments.
The above discussion is based on assuming that one can weight theliquid and vapor transport through the phase volume fractions. In ad-dition, when used in macroscopic models, the underlying assumptionis that the capillary-pressure – saturation relationship can be appliedlocally although it is measured or typically predicted for the entirelayer. The validity of this assumption still remains an open ques-tion, especially since it is known that DM structures are not spatiallyhomogeneous.
Although the liquid and gas phases are related through transportproperties, they also have an effect on each other’s fluxes throughheat transport and phase-change-induced (PCI) flow.29,160,161 In thisfashion, the liquid water is near equilibrated with water vapor andthe temperature distribution induces a water vapor-pressure gradi-ent. The water is transported along that gradient and condenses andgives off heat at the gas channel or cooler flowfield rib as shown inFigure 5. Such an effect can be shown to be able to move all of theproduced water when operating above temperatures of 60◦C or so
with typical component properties.160 In this fashion, the producedwater is transported through the cell components in the vapor phaseand flooding concerns will be minimal and result mainly from con-densation in the flowfield channels or at the GDL / flowfield- land
) unless CC License in place (see abstract). ecsdl.org/site/terms_use address. Redistribution subject to ECS terms of use (see 128.240.225.120Downloaded on 2014-09-14 to IP
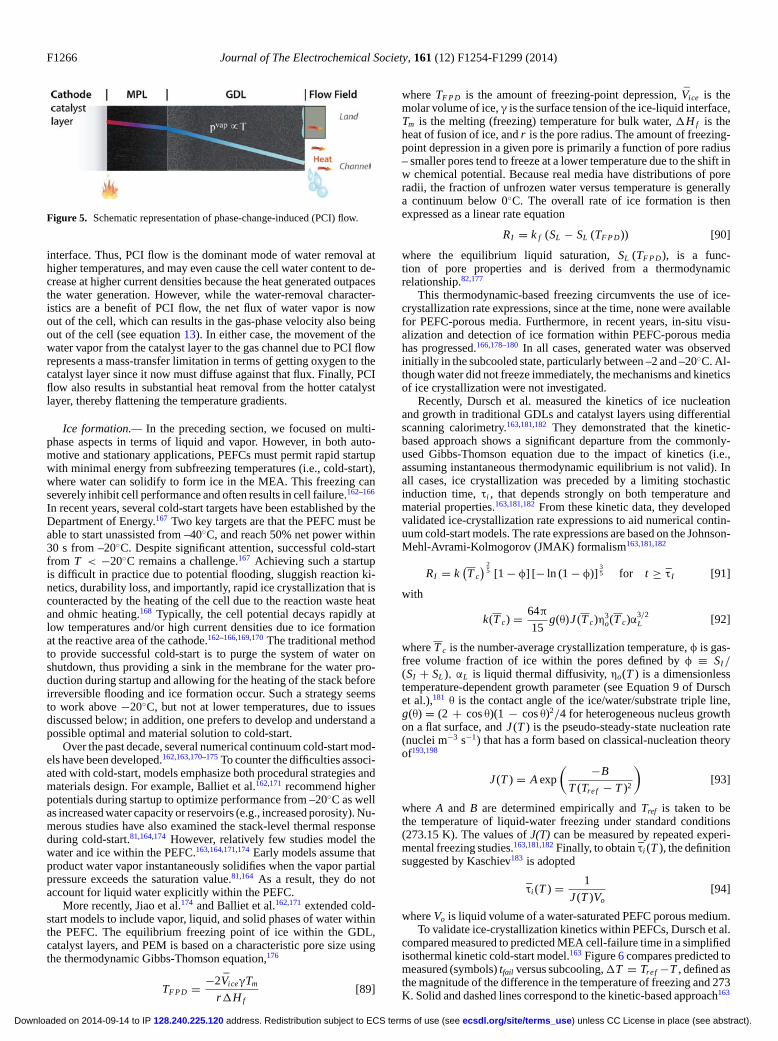
F1266 Journal of The Electrochemical Society, 161 (12) F1254-F1299 (2014)
Figure 5. Schematic representation of phase-change-induced (PCI) flow.
interface. Thus, PCI flow is the dominant mode of water removal athigher temperatures, and may even cause the cell water content to de-crease at higher current densities because the heat generated outpacesthe water generation. However, while the water-removal character-istics are a benefit of PCI flow, the net flux of water vapor is nowout of the cell, which can results in the gas-phase velocity also beingout of the cell (see equation 13). In either case, the movement of thewater vapor from the catalyst layer to the gas channel due to PCI flowrepresents a mass-transfer limitation in terms of getting oxygen to thecatalyst layer since it now must diffuse against that flux. Finally, PCIflow also results in substantial heat removal from the hotter catalystlayer, thereby flattening the temperature gradients.
Ice formation.— In the preceding section, we focused on multi-phase aspects in terms of liquid and vapor. However, in both auto-motive and stationary applications, PEFCs must permit rapid startupwith minimal energy from subfreezing temperatures (i.e., cold-start),where water can solidify to form ice in the MEA. This freezing canseverely inhibit cell performance and often results in cell failure.162–166
In recent years, several cold-start targets have been established by theDepartment of Energy.167 Two key targets are that the PEFC must beable to start unassisted from –40◦C, and reach 50% net power within30 s from –20◦C. Despite significant attention, successful cold-startfrom T < −20◦C remains a challenge.167 Achieving such a startupis difficult in practice due to potential flooding, sluggish reaction ki-netics, durability loss, and importantly, rapid ice crystallization that iscounteracted by the heating of the cell due to the reaction waste heatand ohmic heating.168 Typically, the cell potential decays rapidly atlow temperatures and/or high current densities due to ice formationat the reactive area of the cathode.162–166,169,170 The traditional methodto provide successful cold-start is to purge the system of water onshutdown, thus providing a sink in the membrane for the water pro-duction during startup and allowing for the heating of the stack beforeirreversible flooding and ice formation occur. Such a strategy seemsto work above −20◦C, but not at lower temperatures, due to issuesdiscussed below; in addition, one prefers to develop and understand apossible optimal and material solution to cold-start.
Over the past decade, several numerical continuum cold-start mod-els have been developed.162,163,170–175 To counter the difficulties associ-ated with cold-start, models emphasize both procedural strategies andmaterials design. For example, Balliet et al.162,171 recommend higherpotentials during startup to optimize performance from –20◦C as wellas increased water capacity or reservoirs (e.g., increased porosity). Nu-merous studies have also examined the stack-level thermal responseduring cold-start.81,164,174 However, relatively few studies model thewater and ice within the PEFC.163,164,171,174 Early models assume thatproduct water vapor instantaneously solidifies when the vapor partialpressure exceeds the saturation value.81,164 As a result, they do notaccount for liquid water explicitly within the PEFC.
More recently, Jiao et al.174 and Balliet et al.162,171 extended cold-start models to include vapor, liquid, and solid phases of water withinthe PEFC. The equilibrium freezing point of ice within the GDL,catalyst layers, and PEM is based on a characteristic pore size usingthe thermodynamic Gibbs-Thomson equation,176
TF P D = −2ViceγTm
r�H f[89]
where TF P D is the amount of freezing-point depression, Vice is themolar volume of ice, γ is the surface tension of the ice-liquid interface,Tm is the melting (freezing) temperature for bulk water, �H f is theheat of fusion of ice, and r is the pore radius. The amount of freezing-point depression in a given pore is primarily a function of pore radius– smaller pores tend to freeze at a lower temperature due to the shift inw chemical potential. Because real media have distributions of poreradii, the fraction of unfrozen water versus temperature is generallya continuum below 0◦C. The overall rate of ice formation is thenexpressed as a linear rate equation
RI = k f (SL − SL (TF P D)) [90]
where the equilibrium liquid saturation, SL (TF P D), is a func-tion of pore properties and is derived from a thermodynamicrelationship.82,177
This thermodynamic-based freezing circumvents the use of ice-crystallization rate expressions, since at the time, none were availablefor PEFC-porous media. Furthermore, in recent years, in-situ visu-alization and detection of ice formation within PEFC-porous mediahas progressed.166,178–180 In all cases, generated water was observedinitially in the subcooled state, particularly between –2 and –20◦C. Al-though water did not freeze immediately, the mechanisms and kineticsof ice crystallization were not investigated.
Recently, Dursch et al. measured the kinetics of ice nucleationand growth in traditional GDLs and catalyst layers using differentialscanning calorimetry.163,181,182 They demonstrated that the kinetic-based approach shows a significant departure from the commonly-used Gibbs-Thomson equation due to the impact of kinetics (i.e.,assuming instantaneous thermodynamic equilibrium is not valid). Inall cases, ice crystallization was preceded by a limiting stochasticinduction time, τi , that depends strongly on both temperature andmaterial properties.163,181,182 From these kinetic data, they developedvalidated ice-crystallization rate expressions to aid numerical contin-uum cold-start models. The rate expressions are based on the Johnson-Mehl-Avrami-Kolmogorov (JMAK) formalism163,181,182
RI = k(T c
) 25 [1 − φ] [− ln (1 − φ)]
35 for t ≥ τI [91]
with
k(T c) = 64π
15g(θ)J (T c)η
3o(T c)α
3/2L [92]
where T c is the number-average crystallization temperature, φ is gas-free volume fraction of ice within the pores defined by φ ≡ SI /(SI + SL ), αL is liquid thermal diffusivity, ηo(T ) is a dimensionlesstemperature-dependent growth parameter (see Equation 9 of Durschet al.),181 θ is the contact angle of the ice/water/substrate triple line,g(θ) = (2 + cos θ)(1 − cos θ)2/4 for heterogeneous nucleus growthon a flat surface, and J (T ) is the pseudo-steady-state nucleation rate(nuclei m−3 s−1) that has a form based on classical-nucleation theoryof193,198
J (T ) = A exp
( −B
T (Tref − T )2
)[93]
where A and B are determined empirically and Tref is taken to bethe temperature of liquid-water freezing under standard conditions(273.15 K). The values of J(T) can be measured by repeated experi-mental freezing studies.163,181,182 Finally, to obtain τi (T ), the definitionsuggested by Kaschiev183 is adopted
τi (T ) = 1
J (T )Vo[94]
where Vo is liquid volume of a water-saturated PEFC porous medium.To validate ice-crystallization kinetics within PEFCs, Dursch et al.
compared measured to predicted MEA cell-failure time in a simplifiedisothermal kinetic cold-start model.163 Figure 6 compares predicted tomeasured (symbols) tfail versus subcooling, �T = Tref −T , defined asthe magnitude of the difference in the temperature of freezing and 273K. Solid and dashed lines correspond to the kinetic-based approach163
) unless CC License in place (see abstract). ecsdl.org/site/terms_use address. Redistribution subject to ECS terms of use (see 128.240.225.120Downloaded on 2014-09-14 to IP

Journal of The Electrochemical Society, 161 (12) F1254-F1299 (2014) F1267
Figure 6. MEA-cell-failure time, tfail, for isothermal galvanostatic start-up asa function of subcooling at a current density of 20 mA/cm2 (figure reprintedfrom Reference 163 with the kind permission of the publisher).
and thermodynamic-based approach (equation 90),171 respectively. Assubcooling extends beyond �T = 11 K, ice-crystallization kinetics iswell approximated by the thermodynamic-based approach, since icecrystallization occurs rapidly. However, in the kinetic approach, theparticular �T that establishes the “nucleation-limited” regime reliesheavily on all heat-transfer and kinetic parameters. Accordingly, thesecontrolling parameters can be adjusted to significantly delay or evenprevent ice formation. The impact of the nucleation-limited regimeis also shown to agree better with experimental isothermal cold-startdata, and the other experimental findings mentioned above.
In addition to freeze kinetics, Dursch et al.184 also examined non-isothermal melting in the GDL. It was shown that ice-melting timesdecrease nonlinearly with increasing heating rate, although the melt-ing temperatures remain at the thermodynamic-based values (consis-tent with Gibbs-Thomson, equation 89) but are rate limited by heattransfer. Using a moving-boundary Stefan problem, they derived anexpression for the melting time,
tmelt =(
εoρL SL�H f
β
)1/2 (L2
kef fT
+ 2L
U
)1/2
[95]
where L denotes bulk-ice or GDL thickness, ρL is liquid mass density,�H f is latent heat of fusion per unit mass of ice (taken as positive),U is the overall heat-transfer coefficient, β is the heating rate (K/min),and the other variables are as already defined. This melting time shouldbe incorporated into cold-start simulations.
Microscale modeling and reconstruction.— Within the area of nu-merical simulation for the performance and durability of PEFCs, therehas always been a great interest and need to understand the linkagebetween the properties of the component materials in the MEA andthe performance of the unit cell and stack. As research progressed andan increasing level of detail was paid to the fabrication, engineering,and effect of the individual component properties on the overall PEFCperformance and durability, there began to emerge attempts to resolvethe morphology of the components with ever increasing levels of res-olution and detail. These morphology-based simulations are typicallyascribed with the label of being microstructural simulations and arerelated significantly to transport and multiphase aspects.
For each component within a PEFC, a relevant length scale can beconsidered dependent on the physical process being considered andthe morphology of the component itself. In regards to this, one typ-ically finds that the analysis of the PEFC porous media (i.e., GDLs,MPLs, catalyst layers) are accomplished using similar methodologies,while analysis of the polymeric membrane, for example, has tradition-
ally lent itself more toward the application of molecular dynamics-based approaches. While the latter is outside the scope of this review,some remarks should be made on the former. Morphological-basedmodels offer the potential to investigate explicitly the relationshipbetween the porous media and the specific transport property gen-erally with consideration given for the constituent material proper-ties, spatial distributions, and statistical variations that may originatewithin manufacturing processes. In order to make these linkages, how-ever, a virtual method of representation of the component structure isrequired.
Porous media within PEFCs are generally accepted to fall into thecategory of random, heterogeneous porous media. It was from theaerospace, metallurgy, and energy industries that some of the earliestattempts at morphological analysis and numerical reconstructions arefound.185,186 Typically, there are two main methodologies employed ingenerating a virtual morphology with the first being a stochastic-basedreconstruction method in which a statistical distributions, randomness,and a series of rule-sets are used as a basis to create a “representative”morphology. The second method, image-based reconstruction, em-ploys experimental diagnostic imaging, such as SEM, TEM, or X-raycomputed tomography (XCT), combined with a numerical processingstep that converts the images to a virtual structure thus translating theoriginal experimental images into a morphology that can be used fornumerical analysis.187–190
For the latter approach, this can be accomplished, for example, byextracting images from the center lines of single fiber from the resul-tant images of GDLs. These center lines are then used in conjunctionwith a stochastic algorithm to reconnect parts of the center lines in anattempt to preserve the curvature of the fibers.190 The limitation of therendered pore space and features within the domain remain the limitof the spatial resolution of the imaging technique itself as well as theability to determine the distinct phases (e.g., Teflon and carbon andsometimes water are not easy to distinguish with X-rays).191
For stochastic reconstruction, the virtual generation of the mi-crostructures relies on the use of a random number generator, statis-tical distribution of geometric information relating to the constituentmaterials that comprise the media, and a series of rule-sets.192–195 Typ-ically these rule-sets are an attempt to impose physical constraints onthe placement algorithms in order to make the creation of the domainmore tractable, such as constraining fiber size, overlap, interactions,etc.193 The constraints placed on the invariance of domain proper-ties in the non-through-thickness directions are directly related to theoverall numerical intensity of the final simulations as constraining themorphological model to as small a sample as possible dramaticallyincreases the speed of the simulations. However, the main criteria indeciding this aspect should relate primarily to the size of the morpho-logical domain relative to the transport coefficient of interest, whereinthe transport coefficient does not vary if the domain size changes (i.e.,it is a representative volume element). An example of a reconstructionof a GDL is shown in Figure 7, where one clearly observes the fibrousstructure.196
For all of these simulations, it should be noted that predicting avolume-averaged coefficient for use in macroscopic models necessi-tates conducting simulations enough times to get representative struc-tures and values. Thus, the use of a quality random number generatoris paramount in generating an appropriate numerical representation,where it has been suggested that the use of 25 samples is sufficientto represent an appropriate sample set given the stochastic nature ofthe experimental geometry data.197 The need for the larger sampleset is especially the case since validation of the microstructures byimaging and other methods (e.g., porosimetry) are typically throughgeneral, statistical information,198 of which various microstructuresmay still agree with the data. Ultimately, it is best to compare aspectsthat relate directly to the distribution of material through the samplebut on a statistical or probabilistic basis, thus the use of both imagingand measurable characteristics are ideal.
Due to the increasing amount of structural characterization and thevirtual microstructures, it is now possible to model transport throughthe DM using direct simulations.188,194,199,200 These models can
) unless CC License in place (see abstract). ecsdl.org/site/terms_use address. Redistribution subject to ECS terms of use (see 128.240.225.120Downloaded on 2014-09-14 to IP
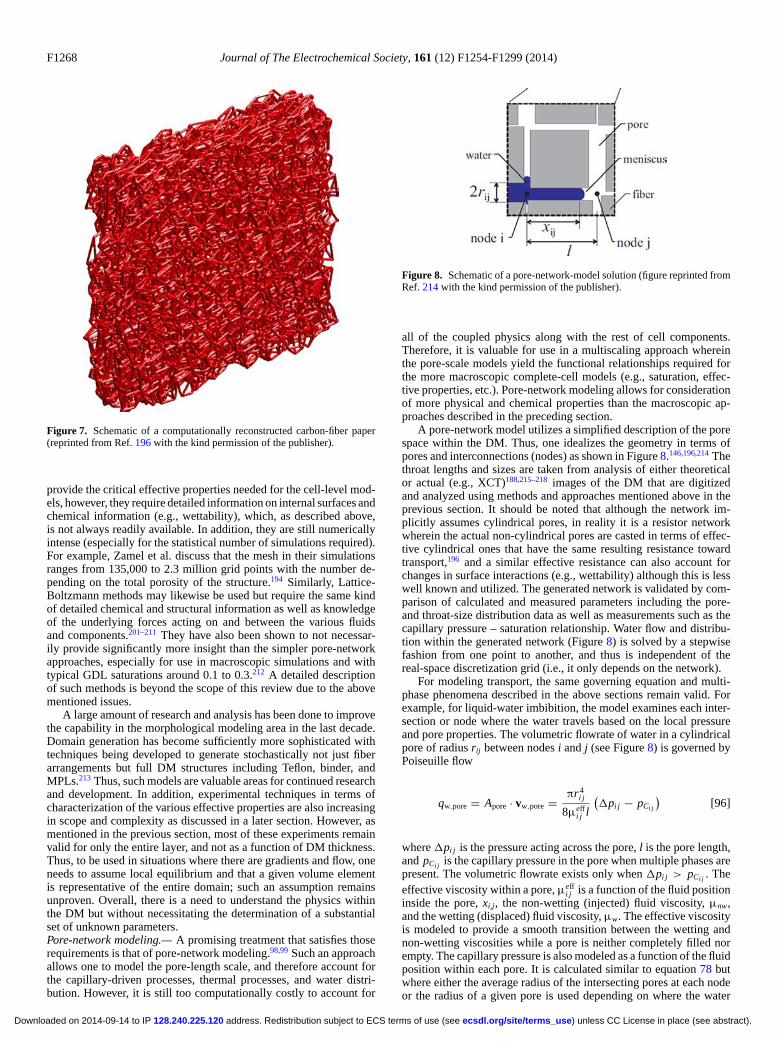
F1268 Journal of The Electrochemical Society, 161 (12) F1254-F1299 (2014)
Figure 7. Schematic of a computationally reconstructed carbon-fiber paper(reprinted from Ref. 196 with the kind permission of the publisher).
provide the critical effective properties needed for the cell-level mod-els, however, they require detailed information on internal surfaces andchemical information (e.g., wettability), which, as described above,is not always readily available. In addition, they are still numericallyintense (especially for the statistical number of simulations required).For example, Zamel et al. discuss that the mesh in their simulationsranges from 135,000 to 2.3 million grid points with the number de-pending on the total porosity of the structure.194 Similarly, Lattice-Boltzmann methods may likewise be used but require the same kindof detailed chemical and structural information as well as knowledgeof the underlying forces acting on and between the various fluidsand components.201–211 They have also been shown to not necessar-ily provide significantly more insight than the simpler pore-networkapproaches, especially for use in macroscopic simulations and withtypical GDL saturations around 0.1 to 0.3.212 A detailed descriptionof such methods is beyond the scope of this review due to the abovementioned issues.
A large amount of research and analysis has been done to improvethe capability in the morphological modeling area in the last decade.Domain generation has become sufficiently more sophisticated withtechniques being developed to generate stochastically not just fiberarrangements but full DM structures including Teflon, binder, andMPLs.213 Thus, such models are valuable areas for continued researchand development. In addition, experimental techniques in terms ofcharacterization of the various effective properties are also increasingin scope and complexity as discussed in a later section. However, asmentioned in the previous section, most of these experiments remainvalid for only the entire layer, and not as a function of DM thickness.Thus, to be used in situations where there are gradients and flow, oneneeds to assume local equilibrium and that a given volume elementis representative of the entire domain; such an assumption remainsunproven. Overall, there is a need to understand the physics withinthe DM but without necessitating the determination of a substantialset of unknown parameters.Pore-network modeling.— A promising treatment that satisfies thoserequirements is that of pore-network modeling.98,99 Such an approachallows one to model the pore-length scale, and therefore account forthe capillary-driven processes, thermal processes, and water distri-bution. However, it is still too computationally costly to account for
Figure 8. Schematic of a pore-network-model solution (figure reprinted fromRef. 214 with the kind permission of the publisher).
all of the coupled physics along with the rest of cell components.Therefore, it is valuable for use in a multiscaling approach whereinthe pore-scale models yield the functional relationships required forthe more macroscopic complete-cell models (e.g., saturation, effec-tive properties, etc.). Pore-network modeling allows for considerationof more physical and chemical properties than the macroscopic ap-proaches described in the preceding section.
A pore-network model utilizes a simplified description of the porespace within the DM. Thus, one idealizes the geometry in terms ofpores and interconnections (nodes) as shown in Figure 8.146,196,214 Thethroat lengths and sizes are taken from analysis of either theoreticalor actual (e.g., XCT)188,215–218 images of the DM that are digitizedand analyzed using methods and approaches mentioned above in theprevious section. It should be noted that although the network im-plicitly assumes cylindrical pores, in reality it is a resistor networkwherein the actual non-cylindrical pores are casted in terms of effec-tive cylindrical ones that have the same resulting resistance towardtransport,196 and a similar effective resistance can also account forchanges in surface interactions (e.g., wettability) although this is lesswell known and utilized. The generated network is validated by com-parison of calculated and measured parameters including the pore-and throat-size distribution data as well as measurements such as thecapillary pressure – saturation relationship. Water flow and distribu-tion within the generated network (Figure 8) is solved by a stepwisefashion from one point to another, and thus is independent of thereal-space discretization grid (i.e., it only depends on the network).
For modeling transport, the same governing equation and multi-phase phenomena described in the above sections remain valid. Forexample, for liquid-water imbibition, the model examines each inter-section or node where the water travels based on the local pressureand pore properties. The volumetric flowrate of water in a cylindricalpore of radius rij between nodes i and j (see Figure 8) is governed byPoiseuille flow
qw,pore = Apore · vw,pore = πr 4i j
8μeffi j l
(�pi j − pCi j
)[96]
where �pi j is the pressure acting across the pore, l is the pore length,and pCi j is the capillary pressure in the pore when multiple phases arepresent. The volumetric flowrate exists only when �pi j > pCi j . Theeffective viscosity within a pore, μeff
i j is a function of the fluid positioninside the pore, xi,j, the non-wetting (injected) fluid viscosity, μnw,and the wetting (displaced) fluid viscosity, μw. The effective viscosityis modeled to provide a smooth transition between the wetting andnon-wetting viscosities while a pore is neither completely filled norempty. The capillary pressure is also modeled as a function of the fluidposition within each pore. It is calculated similar to equation 78 butwhere either the average radius of the intersecting pores at each nodeor the radius of a given pore is used depending on where the water
) unless CC License in place (see abstract). ecsdl.org/site/terms_use address. Redistribution subject to ECS terms of use (see 128.240.225.120Downloaded on 2014-09-14 to IP
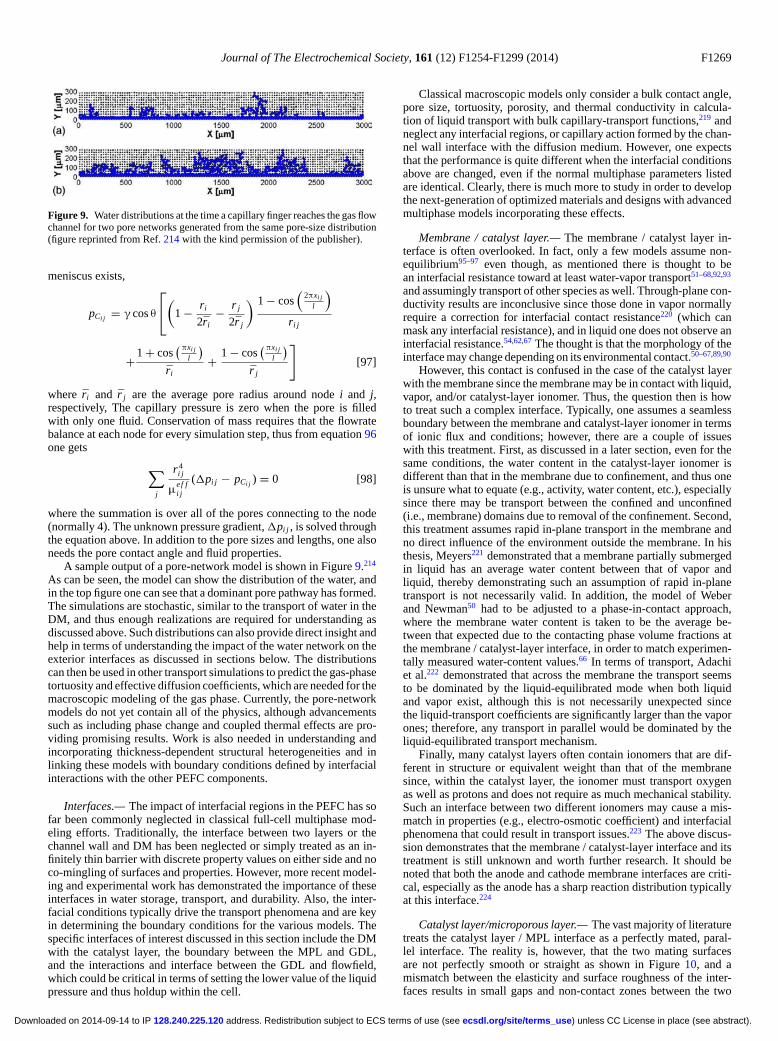
Journal of The Electrochemical Society, 161 (12) F1254-F1299 (2014) F1269
Figure 9. Water distributions at the time a capillary finger reaches the gas flowchannel for two pore networks generated from the same pore-size distribution(figure reprinted from Ref. 214 with the kind permission of the publisher).
meniscus exists,
pCi j = γ cos θ
⎡⎣(1 − ri
2ri− r j
2r j
) 1 − cos(
2πxi j
l
)ri j
+1 + cos(πxi j
l
)ri
+ 1 − cos(πxi j
l
)r j
][97]
where ri and r j are the average pore radius around node i and j,respectively, The capillary pressure is zero when the pore is filledwith only one fluid. Conservation of mass requires that the flowratebalance at each node for every simulation step, thus from equation 96one gets
∑j
r 4i j
μe f fi j
(�pi j − pCi j ) = 0 [98]
where the summation is over all of the pores connecting to the node(normally 4). The unknown pressure gradient, �pi j , is solved throughthe equation above. In addition to the pore sizes and lengths, one alsoneeds the pore contact angle and fluid properties.
A sample output of a pore-network model is shown in Figure 9.214
As can be seen, the model can show the distribution of the water, andin the top figure one can see that a dominant pore pathway has formed.The simulations are stochastic, similar to the transport of water in theDM, and thus enough realizations are required for understanding asdiscussed above. Such distributions can also provide direct insight andhelp in terms of understanding the impact of the water network on theexterior interfaces as discussed in sections below. The distributionscan then be used in other transport simulations to predict the gas-phasetortuosity and effective diffusion coefficients, which are needed for themacroscopic modeling of the gas phase. Currently, the pore-networkmodels do not yet contain all of the physics, although advancementssuch as including phase change and coupled thermal effects are pro-viding promising results. Work is also needed in understanding andincorporating thickness-dependent structural heterogeneities and inlinking these models with boundary conditions defined by interfacialinteractions with the other PEFC components.
Interfaces.— The impact of interfacial regions in the PEFC has sofar been commonly neglected in classical full-cell multiphase mod-eling efforts. Traditionally, the interface between two layers or thechannel wall and DM has been neglected or simply treated as an in-finitely thin barrier with discrete property values on either side and noco-mingling of surfaces and properties. However, more recent model-ing and experimental work has demonstrated the importance of theseinterfaces in water storage, transport, and durability. Also, the inter-facial conditions typically drive the transport phenomena and are keyin determining the boundary conditions for the various models. Thespecific interfaces of interest discussed in this section include the DMwith the catalyst layer, the boundary between the MPL and GDL,and the interactions and interface between the GDL and flowfield,which could be critical in terms of setting the lower value of the liquidpressure and thus holdup within the cell.
Classical macroscopic models only consider a bulk contact angle,pore size, tortuosity, porosity, and thermal conductivity in calcula-tion of liquid transport with bulk capillary-transport functions,219 andneglect any interfacial regions, or capillary action formed by the chan-nel wall interface with the diffusion medium. However, one expectsthat the performance is quite different when the interfacial conditionsabove are changed, even if the normal multiphase parameters listedare identical. Clearly, there is much more to study in order to developthe next-generation of optimized materials and designs with advancedmultiphase models incorporating these effects.
Membrane / catalyst layer.— The membrane / catalyst layer in-terface is often overlooked. In fact, only a few models assume non-equilibrium95–97 even though, as mentioned there is thought to bean interfacial resistance toward at least water-vapor transport51–68,92,93
and assumingly transport of other species as well. Through-plane con-ductivity results are inconclusive since those done in vapor normallyrequire a correction for interfacial contact resistance220 (which canmask any interfacial resistance), and in liquid one does not observe aninterfacial resistance.54,62,67 The thought is that the morphology of theinterface may change depending on its environmental contact.50–67,89,90
However, this contact is confused in the case of the catalyst layerwith the membrane since the membrane may be in contact with liquid,vapor, and/or catalyst-layer ionomer. Thus, the question then is howto treat such a complex interface. Typically, one assumes a seamlessboundary between the membrane and catalyst-layer ionomer in termsof ionic flux and conditions; however, there are a couple of issueswith this treatment. First, as discussed in a later section, even for thesame conditions, the water content in the catalyst-layer ionomer isdifferent than that in the membrane due to confinement, and thus oneis unsure what to equate (e.g., activity, water content, etc.), especiallysince there may be transport between the confined and unconfined(i.e., membrane) domains due to removal of the confinement. Second,this treatment assumes rapid in-plane transport in the membrane andno direct influence of the environment outside the membrane. In histhesis, Meyers221 demonstrated that a membrane partially submergedin liquid has an average water content between that of vapor andliquid, thereby demonstrating such an assumption of rapid in-planetransport is not necessarily valid. In addition, the model of Weberand Newman50 had to be adjusted to a phase-in-contact approach,where the membrane water content is taken to be the average be-tween that expected due to the contacting phase volume fractions atthe membrane / catalyst-layer interface, in order to match experimen-tally measured water-content values.66 In terms of transport, Adachiet al.222 demonstrated that across the membrane the transport seemsto be dominated by the liquid-equilibrated mode when both liquidand vapor exist, although this is not necessarily unexpected sincethe liquid-transport coefficients are significantly larger than the vaporones; therefore, any transport in parallel would be dominated by theliquid-equilibrated transport mechanism.
Finally, many catalyst layers often contain ionomers that are dif-ferent in structure or equivalent weight than that of the membranesince, within the catalyst layer, the ionomer must transport oxygenas well as protons and does not require as much mechanical stability.Such an interface between two different ionomers may cause a mis-match in properties (e.g., electro-osmotic coefficient) and interfacialphenomena that could result in transport issues.223 The above discus-sion demonstrates that the membrane / catalyst-layer interface and itstreatment is still unknown and worth further research. It should benoted that both the anode and cathode membrane interfaces are criti-cal, especially as the anode has a sharp reaction distribution typicallyat this interface.224
Catalyst layer/microporous layer.— The vast majority of literaturetreats the catalyst layer / MPL interface as a perfectly mated, paral-lel interface. The reality is, however, that the two mating surfacesare not perfectly smooth or straight as shown in Figure 10, and amismatch between the elasticity and surface roughness of the inter-faces results in small gaps and non-contact zones between the two
) unless CC License in place (see abstract). ecsdl.org/site/terms_use address. Redistribution subject to ECS terms of use (see 128.240.225.120Downloaded on 2014-09-14 to IP
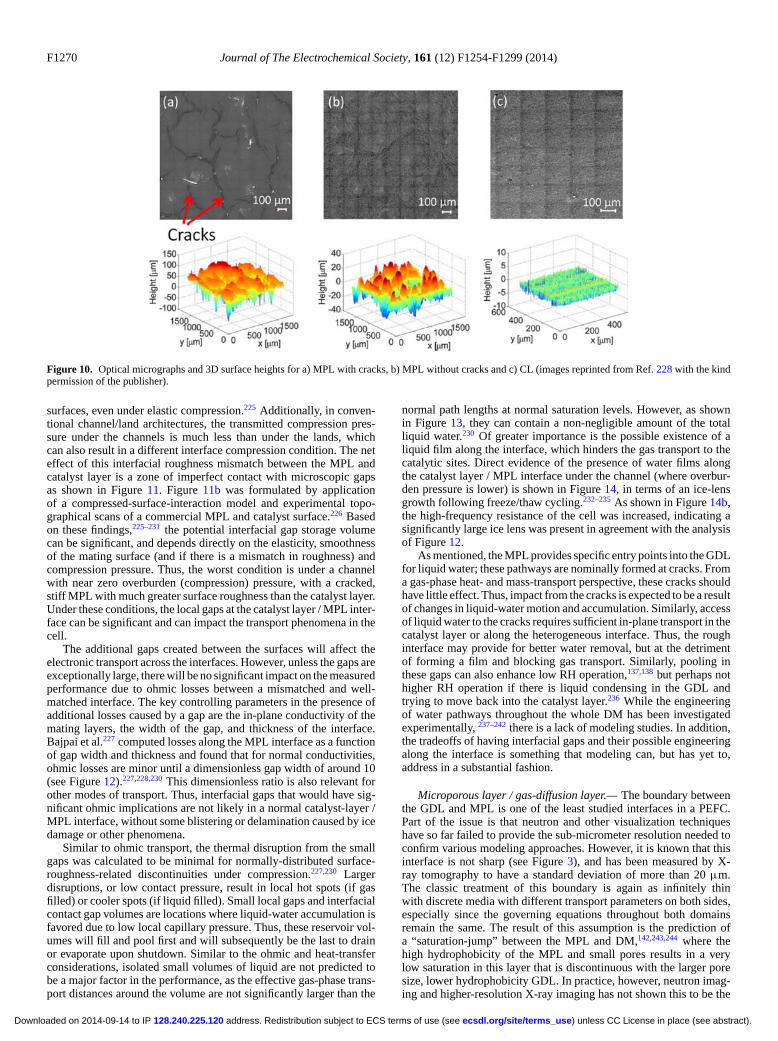
F1270 Journal of The Electrochemical Society, 161 (12) F1254-F1299 (2014)
Figure 10. Optical micrographs and 3D surface heights for a) MPL with cracks, b) MPL without cracks and c) CL (images reprinted from Ref. 228 with the kindpermission of the publisher).
surfaces, even under elastic compression.225 Additionally, in conven-tional channel/land architectures, the transmitted compression pres-sure under the channels is much less than under the lands, whichcan also result in a different interface compression condition. The neteffect of this interfacial roughness mismatch between the MPL andcatalyst layer is a zone of imperfect contact with microscopic gapsas shown in Figure 11. Figure 11b was formulated by applicationof a compressed-surface-interaction model and experimental topo-graphical scans of a commercial MPL and catalyst surface.226 Basedon these findings,225–231 the potential interfacial gap storage volumecan be significant, and depends directly on the elasticity, smoothnessof the mating surface (and if there is a mismatch in roughness) andcompression pressure. Thus, the worst condition is under a channelwith near zero overburden (compression) pressure, with a cracked,stiff MPL with much greater surface roughness than the catalyst layer.Under these conditions, the local gaps at the catalyst layer / MPL inter-face can be significant and can impact the transport phenomena in thecell.
The additional gaps created between the surfaces will affect theelectronic transport across the interfaces. However, unless the gaps areexceptionally large, there will be no significant impact on the measuredperformance due to ohmic losses between a mismatched and well-matched interface. The key controlling parameters in the presence ofadditional losses caused by a gap are the in-plane conductivity of themating layers, the width of the gap, and thickness of the interface.Bajpai et al.227 computed losses along the MPL interface as a functionof gap width and thickness and found that for normal conductivities,ohmic losses are minor until a dimensionless gap width of around 10(see Figure 12).227,228,230 This dimensionless ratio is also relevant forother modes of transport. Thus, interfacial gaps that would have sig-nificant ohmic implications are not likely in a normal catalyst-layer /MPL interface, without some blistering or delamination caused by icedamage or other phenomena.
Similar to ohmic transport, the thermal disruption from the smallgaps was calculated to be minimal for normally-distributed surface-roughness-related discontinuities under compression.227,230 Largerdisruptions, or low contact pressure, result in local hot spots (if gasfilled) or cooler spots (if liquid filled). Small local gaps and interfacialcontact gap volumes are locations where liquid-water accumulation isfavored due to low local capillary pressure. Thus, these reservoir vol-umes will fill and pool first and will subsequently be the last to drainor evaporate upon shutdown. Similar to the ohmic and heat-transferconsiderations, isolated small volumes of liquid are not predicted tobe a major factor in the performance, as the effective gas-phase trans-port distances around the volume are not significantly larger than the
normal path lengths at normal saturation levels. However, as shownin Figure 13, they can contain a non-negligible amount of the totalliquid water.230 Of greater importance is the possible existence of aliquid film along the interface, which hinders the gas transport to thecatalytic sites. Direct evidence of the presence of water films alongthe catalyst layer / MPL interface under the channel (where overbur-den pressure is lower) is shown in Figure 14, in terms of an ice-lensgrowth following freeze/thaw cycling.232–235 As shown in Figure 14b,the high-frequency resistance of the cell was increased, indicating asignificantly large ice lens was present in agreement with the analysisof Figure 12.
As mentioned, the MPL provides specific entry points into the GDLfor liquid water; these pathways are nominally formed at cracks. Froma gas-phase heat- and mass-transport perspective, these cracks shouldhave little effect. Thus, impact from the cracks is expected to be a resultof changes in liquid-water motion and accumulation. Similarly, accessof liquid water to the cracks requires sufficient in-plane transport in thecatalyst layer or along the heterogeneous interface. Thus, the roughinterface may provide for better water removal, but at the detrimentof forming a film and blocking gas transport. Similarly, pooling inthese gaps can also enhance low RH operation,137,138 but perhaps nothigher RH operation if there is liquid condensing in the GDL andtrying to move back into the catalyst layer.236 While the engineeringof water pathways throughout the whole DM has been investigatedexperimentally, 237–242 there is a lack of modeling studies. In addition,the tradeoffs of having interfacial gaps and their possible engineeringalong the interface is something that modeling can, but has yet to,address in a substantial fashion.
Microporous layer / gas-diffusion layer.— The boundary betweenthe GDL and MPL is one of the least studied interfaces in a PEFC.Part of the issue is that neutron and other visualization techniqueshave so far failed to provide the sub-micrometer resolution needed toconfirm various modeling approaches. However, it is known that thisinterface is not sharp (see Figure 3), and has been measured by X-ray tomography to have a standard deviation of more than 20 μm.The classic treatment of this boundary is again as infinitely thinwith discrete media with different transport parameters on both sides,especially since the governing equations throughout both domainsremain the same. The result of this assumption is the prediction ofa “saturation-jump” between the MPL and DM,142,243,244 where thehigh hydrophobicity of the MPL and small pores results in a verylow saturation in this layer that is discontinuous with the larger poresize, lower hydrophobicity GDL. In practice, however, neutron imag-ing and higher-resolution X-ray imaging has not shown this to be the
) unless CC License in place (see abstract). ecsdl.org/site/terms_use address. Redistribution subject to ECS terms of use (see 128.240.225.120Downloaded on 2014-09-14 to IP
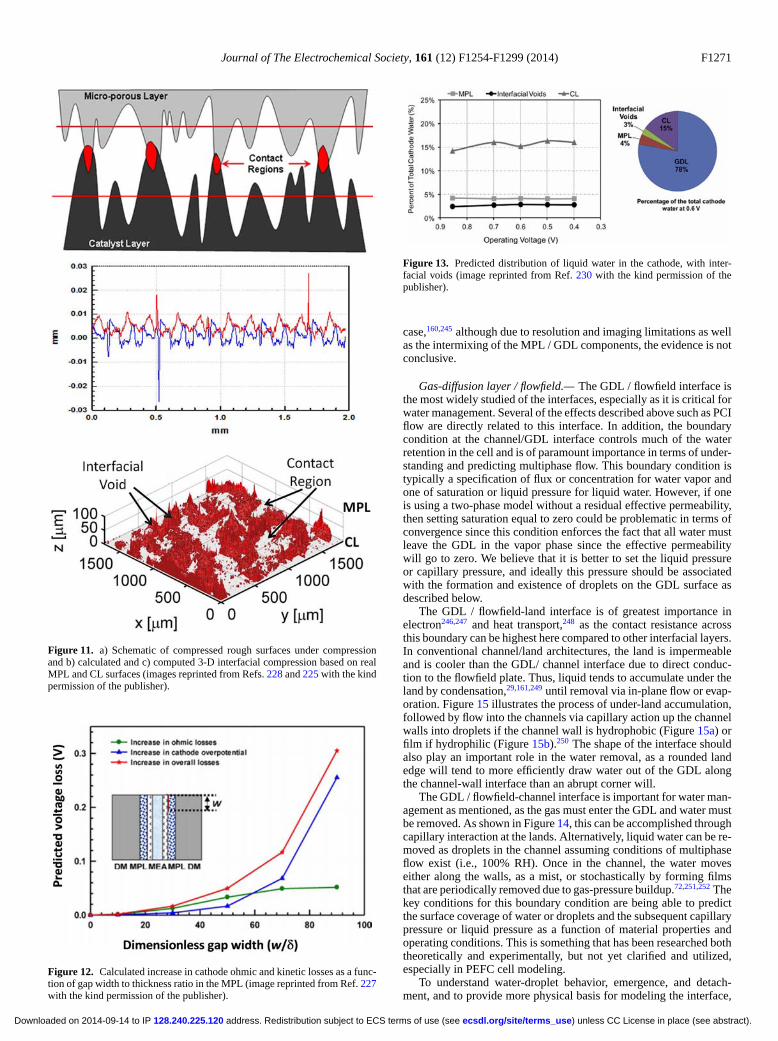
Journal of The Electrochemical Society, 161 (12) F1254-F1299 (2014) F1271
Figure 11. a) Schematic of compressed rough surfaces under compressionand b) calculated and c) computed 3-D interfacial compression based on realMPL and CL surfaces (images reprinted from Refs. 228 and 225 with the kindpermission of the publisher).
Figure 12. Calculated increase in cathode ohmic and kinetic losses as a func-tion of gap width to thickness ratio in the MPL (image reprinted from Ref. 227with the kind permission of the publisher).
Figure 13. Predicted distribution of liquid water in the cathode, with inter-facial voids (image reprinted from Ref. 230 with the kind permission of thepublisher).
case,160,245 although due to resolution and imaging limitations as wellas the intermixing of the MPL / GDL components, the evidence is notconclusive.
Gas-diffusion layer / flowfield.— The GDL / flowfield interface isthe most widely studied of the interfaces, especially as it is critical forwater management. Several of the effects described above such as PCIflow are directly related to this interface. In addition, the boundarycondition at the channel/GDL interface controls much of the waterretention in the cell and is of paramount importance in terms of under-standing and predicting multiphase flow. This boundary condition istypically a specification of flux or concentration for water vapor andone of saturation or liquid pressure for liquid water. However, if oneis using a two-phase model without a residual effective permeability,then setting saturation equal to zero could be problematic in terms ofconvergence since this condition enforces the fact that all water mustleave the GDL in the vapor phase since the effective permeabilitywill go to zero. We believe that it is better to set the liquid pressureor capillary pressure, and ideally this pressure should be associatedwith the formation and existence of droplets on the GDL surface asdescribed below.
The GDL / flowfield-land interface is of greatest importance inelectron246,247 and heat transport,248 as the contact resistance acrossthis boundary can be highest here compared to other interfacial layers.In conventional channel/land architectures, the land is impermeableand is cooler than the GDL/ channel interface due to direct conduc-tion to the flowfield plate. Thus, liquid tends to accumulate under theland by condensation,29,161,249 until removal via in-plane flow or evap-oration. Figure 15 illustrates the process of under-land accumulation,followed by flow into the channels via capillary action up the channelwalls into droplets if the channel wall is hydrophobic (Figure 15a) orfilm if hydrophilic (Figure 15b).250 The shape of the interface shouldalso play an important role in the water removal, as a rounded landedge will tend to more efficiently draw water out of the GDL alongthe channel-wall interface than an abrupt corner will.
The GDL / flowfield-channel interface is important for water man-agement as mentioned, as the gas must enter the GDL and water mustbe removed. As shown in Figure 14, this can be accomplished throughcapillary interaction at the lands. Alternatively, liquid water can be re-moved as droplets in the channel assuming conditions of multiphaseflow exist (i.e., 100% RH). Once in the channel, the water moveseither along the walls, as a mist, or stochastically by forming filmsthat are periodically removed due to gas-pressure buildup.72,251,252 Thekey conditions for this boundary condition are being able to predictthe surface coverage of water or droplets and the subsequent capillarypressure or liquid pressure as a function of material properties andoperating conditions. This is something that has been researched boththeoretically and experimentally, but not yet clarified and utilized,especially in PEFC cell modeling.
To understand water-droplet behavior, emergence, and detach-ment, and to provide more physical basis for modeling the interface,
) unless CC License in place (see abstract). ecsdl.org/site/terms_use address. Redistribution subject to ECS terms of use (see 128.240.225.120Downloaded on 2014-09-14 to IP
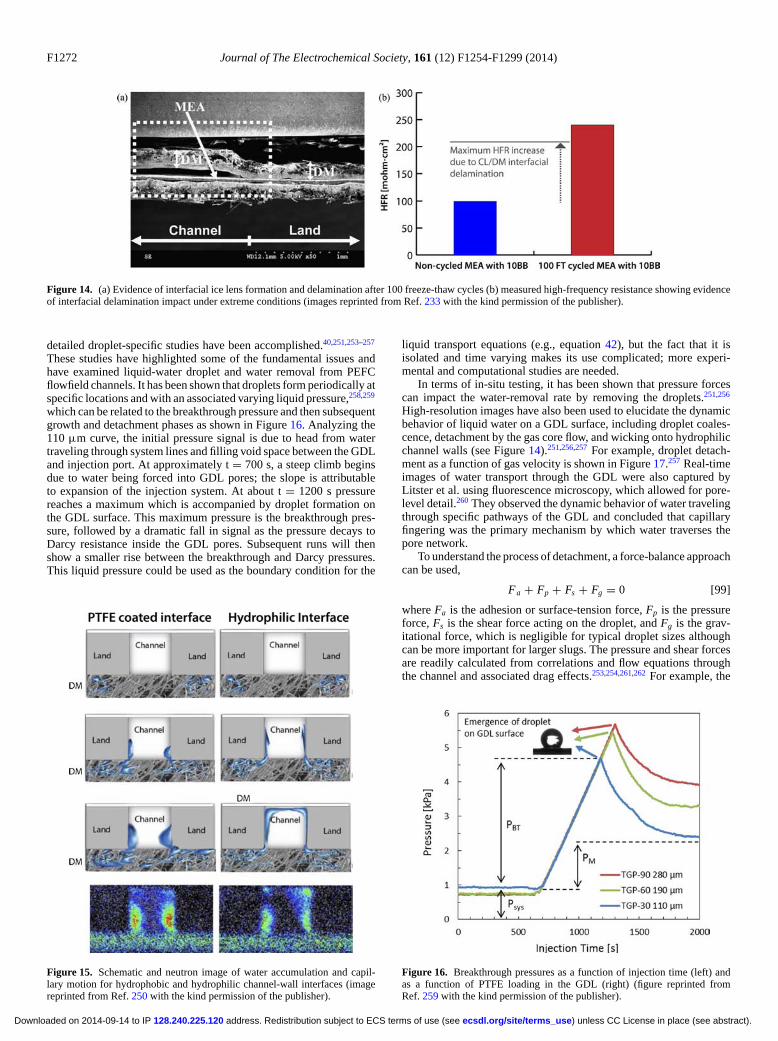
F1272 Journal of The Electrochemical Society, 161 (12) F1254-F1299 (2014)
Figure 14. (a) Evidence of interfacial ice lens formation and delamination after 100 freeze-thaw cycles (b) measured high-frequency resistance showing evidenceof interfacial delamination impact under extreme conditions (images reprinted from Ref. 233 with the kind permission of the publisher).
detailed droplet-specific studies have been accomplished.40,251,253–257
These studies have highlighted some of the fundamental issues andhave examined liquid-water droplet and water removal from PEFCflowfield channels. It has been shown that droplets form periodically atspecific locations and with an associated varying liquid pressure,258,259
which can be related to the breakthrough pressure and then subsequentgrowth and detachment phases as shown in Figure 16. Analyzing the110 μm curve, the initial pressure signal is due to head from watertraveling through system lines and filling void space between the GDLand injection port. At approximately t = 700 s, a steep climb beginsdue to water being forced into GDL pores; the slope is attributableto expansion of the injection system. At about t = 1200 s pressurereaches a maximum which is accompanied by droplet formation onthe GDL surface. This maximum pressure is the breakthrough pres-sure, followed by a dramatic fall in signal as the pressure decays toDarcy resistance inside the GDL pores. Subsequent runs will thenshow a smaller rise between the breakthrough and Darcy pressures.This liquid pressure could be used as the boundary condition for the
Figure 15. Schematic and neutron image of water accumulation and capil-lary motion for hydrophobic and hydrophilic channel-wall interfaces (imagereprinted from Ref. 250 with the kind permission of the publisher).
liquid transport equations (e.g., equation 42), but the fact that it isisolated and time varying makes its use complicated; more experi-mental and computational studies are needed.
In terms of in-situ testing, it has been shown that pressure forcescan impact the water-removal rate by removing the droplets.251,256
High-resolution images have also been used to elucidate the dynamicbehavior of liquid water on a GDL surface, including droplet coales-cence, detachment by the gas core flow, and wicking onto hydrophilicchannel walls (see Figure 14).251,256,257 For example, droplet detach-ment as a function of gas velocity is shown in Figure 17.257 Real-timeimages of water transport through the GDL were also captured byLitster et al. using fluorescence microscopy, which allowed for pore-level detail.260 They observed the dynamic behavior of water travelingthrough specific pathways of the GDL and concluded that capillaryfingering was the primary mechanism by which water traverses thepore network.
To understand the process of detachment, a force-balance approachcan be used,
Fa + Fp + Fs + Fg = 0 [99]
where Fa is the adhesion or surface-tension force, Fp is the pressureforce, Fs is the shear force acting on the droplet, and Fg is the grav-itational force, which is negligible for typical droplet sizes althoughcan be more important for larger slugs. The pressure and shear forcesare readily calculated from correlations and flow equations throughthe channel and associated drag effects.253,254,261,262 For example, the
Figure 16. Breakthrough pressures as a function of injection time (left) andas a function of PTFE loading in the GDL (right) (figure reprinted fromRef. 259 with the kind permission of the publisher).
) unless CC License in place (see abstract). ecsdl.org/site/terms_use address. Redistribution subject to ECS terms of use (see 128.240.225.120Downloaded on 2014-09-14 to IP
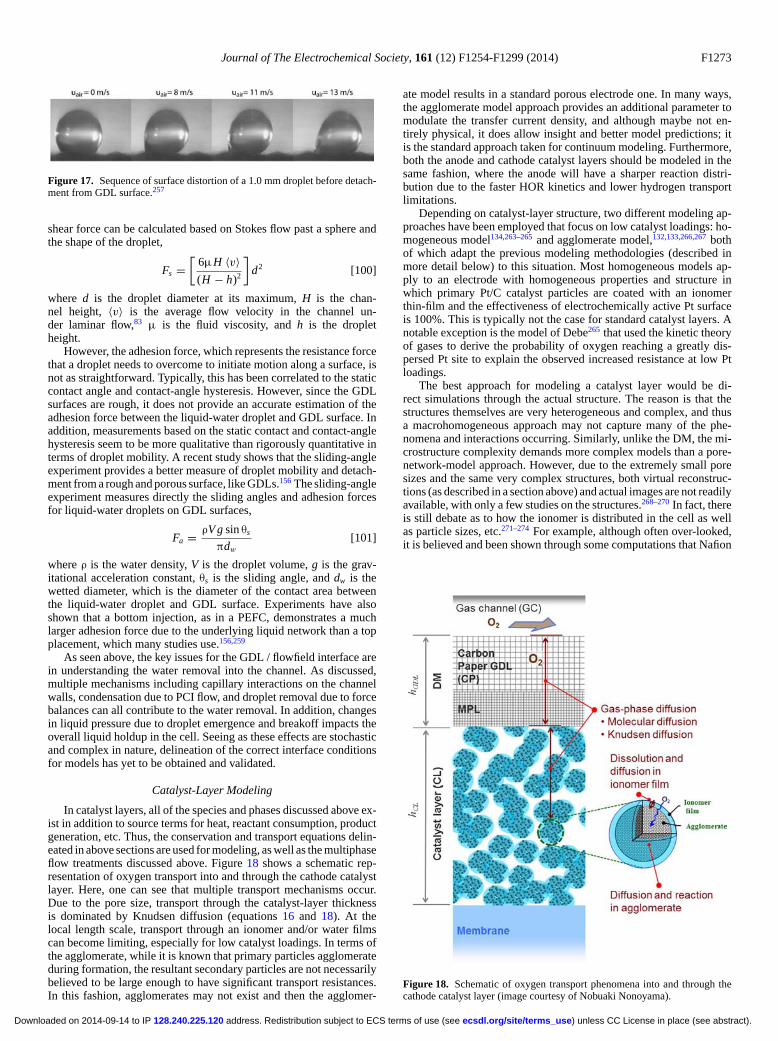
Journal of The Electrochemical Society, 161 (12) F1254-F1299 (2014) F1273
Figure 17. Sequence of surface distortion of a 1.0 mm droplet before detach-ment from GDL surface.257
shear force can be calculated based on Stokes flow past a sphere andthe shape of the droplet,
Fs =[
6μH 〈v〉(H − h)2
]d2 [100]
where d is the droplet diameter at its maximum, H is the chan-nel height, 〈v〉 is the average flow velocity in the channel un-der laminar flow,83 μ is the fluid viscosity, and h is the dropletheight.
However, the adhesion force, which represents the resistance forcethat a droplet needs to overcome to initiate motion along a surface, isnot as straightforward. Typically, this has been correlated to the staticcontact angle and contact-angle hysteresis. However, since the GDLsurfaces are rough, it does not provide an accurate estimation of theadhesion force between the liquid-water droplet and GDL surface. Inaddition, measurements based on the static contact and contact-anglehysteresis seem to be more qualitative than rigorously quantitative interms of droplet mobility. A recent study shows that the sliding-angleexperiment provides a better measure of droplet mobility and detach-ment from a rough and porous surface, like GDLs.156 The sliding-angleexperiment measures directly the sliding angles and adhesion forcesfor liquid-water droplets on GDL surfaces,
Fa = ρV g sin θs
πdw
[101]
where ρ is the water density, V is the droplet volume, g is the grav-itational acceleration constant, θs is the sliding angle, and dw is thewetted diameter, which is the diameter of the contact area betweenthe liquid-water droplet and GDL surface. Experiments have alsoshown that a bottom injection, as in a PEFC, demonstrates a muchlarger adhesion force due to the underlying liquid network than a topplacement, which many studies use.156,259
As seen above, the key issues for the GDL / flowfield interface arein understanding the water removal into the channel. As discussed,multiple mechanisms including capillary interactions on the channelwalls, condensation due to PCI flow, and droplet removal due to forcebalances can all contribute to the water removal. In addition, changesin liquid pressure due to droplet emergence and breakoff impacts theoverall liquid holdup in the cell. Seeing as these effects are stochasticand complex in nature, delineation of the correct interface conditionsfor models has yet to be obtained and validated.
Catalyst-Layer Modeling
In catalyst layers, all of the species and phases discussed above ex-ist in addition to source terms for heat, reactant consumption, productgeneration, etc. Thus, the conservation and transport equations delin-eated in above sections are used for modeling, as well as the multiphaseflow treatments discussed above. Figure 18 shows a schematic rep-resentation of oxygen transport into and through the cathode catalystlayer. Here, one can see that multiple transport mechanisms occur.Due to the pore size, transport through the catalyst-layer thicknessis dominated by Knudsen diffusion (equations 16 and 18). At thelocal length scale, transport through an ionomer and/or water filmscan become limiting, especially for low catalyst loadings. In terms ofthe agglomerate, while it is known that primary particles agglomerateduring formation, the resultant secondary particles are not necessarilybelieved to be large enough to have significant transport resistances.In this fashion, agglomerates may not exist and then the agglomer-
ate model results in a standard porous electrode one. In many ways,the agglomerate model approach provides an additional parameter tomodulate the transfer current density, and although maybe not en-tirely physical, it does allow insight and better model predictions; itis the standard approach taken for continuum modeling. Furthermore,both the anode and cathode catalyst layers should be modeled in thesame fashion, where the anode will have a sharper reaction distri-bution due to the faster HOR kinetics and lower hydrogen transportlimitations.
Depending on catalyst-layer structure, two different modeling ap-proaches have been employed that focus on low catalyst loadings: ho-mogeneous model134,263–265 and agglomerate model,132,133,266,267 bothof which adapt the previous modeling methodologies (described inmore detail below) to this situation. Most homogeneous models ap-ply to an electrode with homogeneous properties and structure inwhich primary Pt/C catalyst particles are coated with an ionomerthin-film and the effectiveness of electrochemically active Pt surfaceis 100%. This is typically not the case for standard catalyst layers. Anotable exception is the model of Debe265 that used the kinetic theoryof gases to derive the probability of oxygen reaching a greatly dis-persed Pt site to explain the observed increased resistance at low Ptloadings.
The best approach for modeling a catalyst layer would be di-rect simulations through the actual structure. The reason is that thestructures themselves are very heterogeneous and complex, and thusa macrohomogeneous approach may not capture many of the phe-nomena and interactions occurring. Similarly, unlike the DM, the mi-crostructure complexity demands more complex models than a pore-network-model approach. However, due to the extremely small poresizes and the same very complex structures, both virtual reconstruc-tions (as described in a section above) and actual images are not readilyavailable, with only a few studies on the structures.268–270 In fact, thereis still debate as to how the ionomer is distributed in the cell as wellas particle sizes, etc.271–274 For example, although often over-looked,it is believed and been shown through some computations that Nafion
Figure 18. Schematic of oxygen transport phenomena into and through thecathode catalyst layer (image courtesy of Nobuaki Nonoyama).
) unless CC License in place (see abstract). ecsdl.org/site/terms_use address. Redistribution subject to ECS terms of use (see 128.240.225.120Downloaded on 2014-09-14 to IP
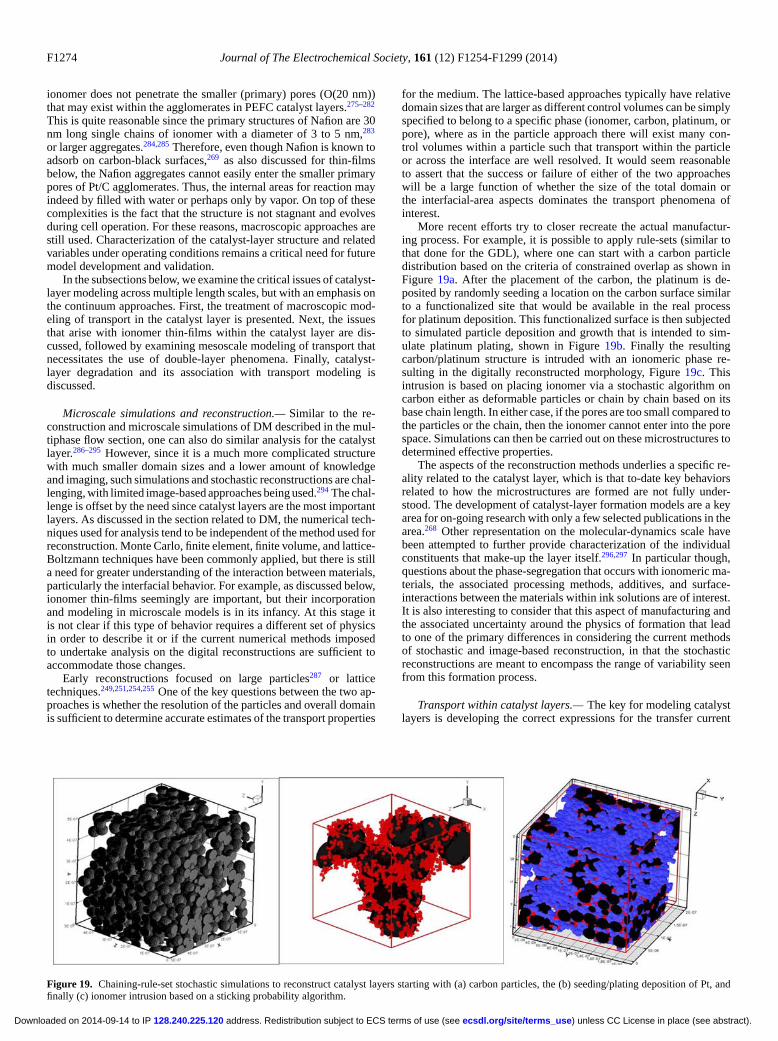
F1274 Journal of The Electrochemical Society, 161 (12) F1254-F1299 (2014)
ionomer does not penetrate the smaller (primary) pores (O(20 nm))that may exist within the agglomerates in PEFC catalyst layers.275–282
This is quite reasonable since the primary structures of Nafion are 30nm long single chains of ionomer with a diameter of 3 to 5 nm,283
or larger aggregates.284,285 Therefore, even though Nafion is known toadsorb on carbon-black surfaces,269 as also discussed for thin-filmsbelow, the Nafion aggregates cannot easily enter the smaller primarypores of Pt/C agglomerates. Thus, the internal areas for reaction mayindeed by filled with water or perhaps only by vapor. On top of thesecomplexities is the fact that the structure is not stagnant and evolvesduring cell operation. For these reasons, macroscopic approaches arestill used. Characterization of the catalyst-layer structure and relatedvariables under operating conditions remains a critical need for futuremodel development and validation.
In the subsections below, we examine the critical issues of catalyst-layer modeling across multiple length scales, but with an emphasis onthe continuum approaches. First, the treatment of macroscopic mod-eling of transport in the catalyst layer is presented. Next, the issuesthat arise with ionomer thin-films within the catalyst layer are dis-cussed, followed by examining mesoscale modeling of transport thatnecessitates the use of double-layer phenomena. Finally, catalyst-layer degradation and its association with transport modeling isdiscussed.
Microscale simulations and reconstruction.— Similar to the re-construction and microscale simulations of DM described in the mul-tiphase flow section, one can also do similar analysis for the catalystlayer.286–295 However, since it is a much more complicated structurewith much smaller domain sizes and a lower amount of knowledgeand imaging, such simulations and stochastic reconstructions are chal-lenging, with limited image-based approaches being used.294 The chal-lenge is offset by the need since catalyst layers are the most importantlayers. As discussed in the section related to DM, the numerical tech-niques used for analysis tend to be independent of the method used forreconstruction. Monte Carlo, finite element, finite volume, and lattice-Boltzmann techniques have been commonly applied, but there is stilla need for greater understanding of the interaction between materials,particularly the interfacial behavior. For example, as discussed below,ionomer thin-films seemingly are important, but their incorporationand modeling in microscale models is in its infancy. At this stage itis not clear if this type of behavior requires a different set of physicsin order to describe it or if the current numerical methods imposedto undertake analysis on the digital reconstructions are sufficient toaccommodate those changes.
Early reconstructions focused on large particles287 or latticetechniques.249,251,254,255 One of the key questions between the two ap-proaches is whether the resolution of the particles and overall domainis sufficient to determine accurate estimates of the transport properties
for the medium. The lattice-based approaches typically have relativedomain sizes that are larger as different control volumes can be simplyspecified to belong to a specific phase (ionomer, carbon, platinum, orpore), where as in the particle approach there will exist many con-trol volumes within a particle such that transport within the particleor across the interface are well resolved. It would seem reasonableto assert that the success or failure of either of the two approacheswill be a large function of whether the size of the total domain orthe interfacial-area aspects dominates the transport phenomena ofinterest.
More recent efforts try to closer recreate the actual manufactur-ing process. For example, it is possible to apply rule-sets (similar tothat done for the GDL), where one can start with a carbon particledistribution based on the criteria of constrained overlap as shown inFigure 19a. After the placement of the carbon, the platinum is de-posited by randomly seeding a location on the carbon surface similarto a functionalized site that would be available in the real processfor platinum deposition. This functionalized surface is then subjectedto simulated particle deposition and growth that is intended to sim-ulate platinum plating, shown in Figure 19b. Finally the resultingcarbon/platinum structure is intruded with an ionomeric phase re-sulting in the digitally reconstructed morphology, Figure 19c. Thisintrusion is based on placing ionomer via a stochastic algorithm oncarbon either as deformable particles or chain by chain based on itsbase chain length. In either case, if the pores are too small compared tothe particles or the chain, then the ionomer cannot enter into the porespace. Simulations can then be carried out on these microstructures todetermined effective properties.
The aspects of the reconstruction methods underlies a specific re-ality related to the catalyst layer, which is that to-date key behaviorsrelated to how the microstructures are formed are not fully under-stood. The development of catalyst-layer formation models are a keyarea for on-going research with only a few selected publications in thearea.268 Other representation on the molecular-dynamics scale havebeen attempted to further provide characterization of the individualconstituents that make-up the layer itself.296,297 In particular though,questions about the phase-segregation that occurs with ionomeric ma-terials, the associated processing methods, additives, and surface-interactions between the materials within ink solutions are of interest.It is also interesting to consider that this aspect of manufacturing andthe associated uncertainty around the physics of formation that leadto one of the primary differences in considering the current methodsof stochastic and image-based reconstruction, in that the stochasticreconstructions are meant to encompass the range of variability seenfrom this formation process.
Transport within catalyst layers.— The key for modeling catalystlayers is developing the correct expressions for the transfer current
Figure 19. Chaining-rule-set stochastic simulations to reconstruct catalyst layers starting with (a) carbon particles, the (b) seeding/plating deposition of Pt, andfinally (c) ionomer intrusion based on a sticking probability algorithm.
) unless CC License in place (see abstract). ecsdl.org/site/terms_use address. Redistribution subject to ECS terms of use (see 128.240.225.120Downloaded on 2014-09-14 to IP
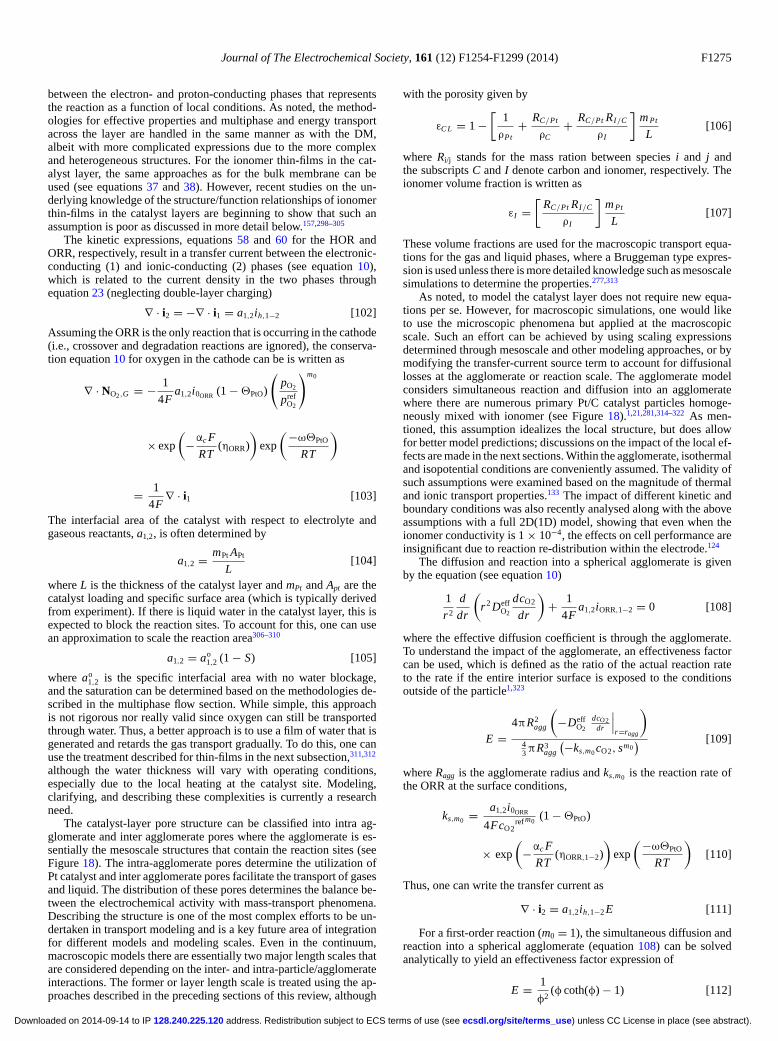
Journal of The Electrochemical Society, 161 (12) F1254-F1299 (2014) F1275
between the electron- and proton-conducting phases that representsthe reaction as a function of local conditions. As noted, the method-ologies for effective properties and multiphase and energy transportacross the layer are handled in the same manner as with the DM,albeit with more complicated expressions due to the more complexand heterogeneous structures. For the ionomer thin-films in the cat-alyst layer, the same approaches as for the bulk membrane can beused (see equations 37 and 38). However, recent studies on the un-derlying knowledge of the structure/function relationships of ionomerthin-films in the catalyst layers are beginning to show that such anassumption is poor as discussed in more detail below.157,298–305
The kinetic expressions, equations 58 and 60 for the HOR andORR, respectively, result in a transfer current between the electronic-conducting (1) and ionic-conducting (2) phases (see equation 10),which is related to the current density in the two phases throughequation 23 (neglecting double-layer charging)
∇ · i2 = −∇ · i1 = a1,2ih,1−2 [102]
Assuming the ORR is the only reaction that is occurring in the cathode(i.e., crossover and degradation reactions are ignored), the conserva-tion equation 10 for oxygen in the cathode can be is written as
∇ · NO2,G = − 1
4Fa1,2i0ORR (1 − �PtO)
(pO2
prefO2
)m0
× exp
(−αc F
RT(ηORR)
)exp
(−ω�PtO
RT
)
= 1
4F∇ · i1 [103]
The interfacial area of the catalyst with respect to electrolyte andgaseous reactants, a1,2, is often determined by
a1,2 = mPt APt
L[104]
where L is the thickness of the catalyst layer and mPt and Apt are thecatalyst loading and specific surface area (which is typically derivedfrom experiment). If there is liquid water in the catalyst layer, this isexpected to block the reaction sites. To account for this, one can usean approximation to scale the reaction area306–310
a1,2 = ao1,2 (1 − S) [105]
where ao1,2 is the specific interfacial area with no water blockage,
and the saturation can be determined based on the methodologies de-scribed in the multiphase flow section. While simple, this approachis not rigorous nor really valid since oxygen can still be transportedthrough water. Thus, a better approach is to use a film of water that isgenerated and retards the gas transport gradually. To do this, one canuse the treatment described for thin-films in the next subsection,311,312
although the water thickness will vary with operating conditions,especially due to the local heating at the catalyst site. Modeling,clarifying, and describing these complexities is currently a researchneed.
The catalyst-layer pore structure can be classified into intra ag-glomerate and inter agglomerate pores where the agglomerate is es-sentially the mesoscale structures that contain the reaction sites (seeFigure 18). The intra-agglomerate pores determine the utilization ofPt catalyst and inter agglomerate pores facilitate the transport of gasesand liquid. The distribution of these pores determines the balance be-tween the electrochemical activity with mass-transport phenomena.Describing the structure is one of the most complex efforts to be un-dertaken in transport modeling and is a key future area of integrationfor different models and modeling scales. Even in the continuum,macroscopic models there are essentially two major length scales thatare considered depending on the inter- and intra-particle/agglomerateinteractions. The former or layer length scale is treated using the ap-proaches described in the preceding sections of this review, although
with the porosity given by
εC L = 1 −[
1
ρPt+ RC/Pt
ρC+ RC/Pt RI/C
ρI
]m Pt
L[106]
where Ri/j stands for the mass ration between species i and j andthe subscripts C and I denote carbon and ionomer, respectively. Theionomer volume fraction is written as
εI =[
RC/Pt RI/C
ρI
]m Pt
L[107]
These volume fractions are used for the macroscopic transport equa-tions for the gas and liquid phases, where a Bruggeman type expres-sion is used unless there is more detailed knowledge such as mesoscalesimulations to determine the properties.277,313
As noted, to model the catalyst layer does not require new equa-tions per se. However, for macroscopic simulations, one would liketo use the microscopic phenomena but applied at the macroscopicscale. Such an effort can be achieved by using scaling expressionsdetermined through mesoscale and other modeling approaches, or bymodifying the transfer-current source term to account for diffusionallosses at the agglomerate or reaction scale. The agglomerate modelconsiders simultaneous reaction and diffusion into an agglomeratewhere there are numerous primary Pt/C catalyst particles homoge-neously mixed with ionomer (see Figure 18).1,21,281,314–322 As men-tioned, this assumption idealizes the local structure, but does allowfor better model predictions; discussions on the impact of the local ef-fects are made in the next sections. Within the agglomerate, isothermaland isopotential conditions are conveniently assumed. The validity ofsuch assumptions were examined based on the magnitude of thermaland ionic transport properties.133 The impact of different kinetic andboundary conditions was also recently analysed along with the aboveassumptions with a full 2D(1D) model, showing that even when theionomer conductivity is 1 × 10⁻⁴, the effects on cell performance areinsignificant due to reaction re-distribution within the electrode.124
The diffusion and reaction into a spherical agglomerate is givenby the equation (see equation 10)
1
r 2
d
dr
(r 2 Deff
O2
dcO2
dr
)+ 1
4Fa1,2iORR,1−2 = 0 [108]
where the effective diffusion coefficient is through the agglomerate.To understand the impact of the agglomerate, an effectiveness factorcan be used, which is defined as the ratio of the actual reaction rateto the rate if the entire interior surface is exposed to the conditionsoutside of the particle1,323
E =4πR2
agg
(−Deff
O2
dcO2dr
∣∣∣r=ragg
)43 πR3
agg
(−ks,m0 cO2, sm0) [109]
where Ragg is the agglomerate radius and ks,m0 is the reaction rate ofthe ORR at the surface conditions,
ks,m0 = a1,2i0ORR
4FcO2ref m0
(1 − �PtO)
× exp
(−αc F
RT(ηORR,1−2)
)exp
(−ω�PtO
RT
)[110]
Thus, one can write the transfer current as
∇ · i2 = a1,2ih,1−2 E [111]
For a first-order reaction (m0 = 1), the simultaneous diffusion andreaction into a spherical agglomerate (equation 108) can be solvedanalytically to yield an effectiveness factor expression of
E = 1
φ2(φ coth(φ) − 1) [112]
) unless CC License in place (see abstract). ecsdl.org/site/terms_use address. Redistribution subject to ECS terms of use (see 128.240.225.120Downloaded on 2014-09-14 to IP
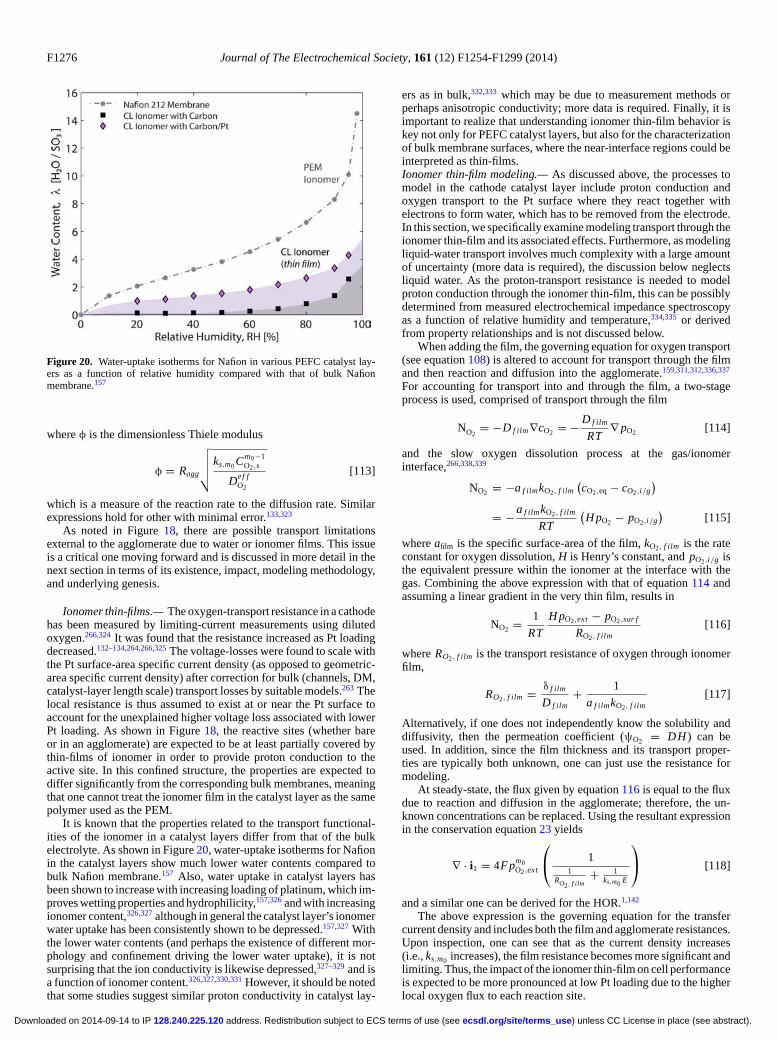
F1276 Journal of The Electrochemical Society, 161 (12) F1254-F1299 (2014)
Figure 20. Water-uptake isotherms for Nafion in various PEFC catalyst lay-ers as a function of relative humidity compared with that of bulk Nafionmembrane.157
where φ is the dimensionless Thiele modulus
φ = Ragg
√√√√ ks,m0 Cm0−1O2,s
Def fO2
[113]
which is a measure of the reaction rate to the diffusion rate. Similarexpressions hold for other with minimal error.133,323
As noted in Figure 18, there are possible transport limitationsexternal to the agglomerate due to water or ionomer films. This issueis a critical one moving forward and is discussed in more detail in thenext section in terms of its existence, impact, modeling methodology,and underlying genesis.
Ionomer thin-films.— The oxygen-transport resistance in a cathodehas been measured by limiting-current measurements using dilutedoxygen.266,324 It was found that the resistance increased as Pt loadingdecreased.132–134,264,266,325 The voltage-losses were found to scale withthe Pt surface-area specific current density (as opposed to geometric-area specific current density) after correction for bulk (channels, DM,catalyst-layer length scale) transport losses by suitable models.263 Thelocal resistance is thus assumed to exist at or near the Pt surface toaccount for the unexplained higher voltage loss associated with lowerPt loading. As shown in Figure 18, the reactive sites (whether bareor in an agglomerate) are expected to be at least partially covered bythin-films of ionomer in order to provide proton conduction to theactive site. In this confined structure, the properties are expected todiffer significantly from the corresponding bulk membranes, meaningthat one cannot treat the ionomer film in the catalyst layer as the samepolymer used as the PEM.
It is known that the properties related to the transport functional-ities of the ionomer in a catalyst layers differ from that of the bulkelectrolyte. As shown in Figure 20, water-uptake isotherms for Nafionin the catalyst layers show much lower water contents compared tobulk Nafion membrane.157 Also, water uptake in catalyst layers hasbeen shown to increase with increasing loading of platinum, which im-proves wetting properties and hydrophilicity,157,326 and with increasingionomer content,326,327 although in general the catalyst layer’s ionomerwater uptake has been consistently shown to be depressed.157,327 Withthe lower water contents (and perhaps the existence of different mor-phology and confinement driving the lower water uptake), it is notsurprising that the ion conductivity is likewise depressed,327–329 and isa function of ionomer content.326,327,330,331 However, it should be notedthat some studies suggest similar proton conductivity in catalyst lay-
ers as in bulk,332,333 which may be due to measurement methods orperhaps anisotropic conductivity; more data is required. Finally, it isimportant to realize that understanding ionomer thin-film behavior iskey not only for PEFC catalyst layers, but also for the characterizationof bulk membrane surfaces, where the near-interface regions could beinterpreted as thin-films.Ionomer thin-film modeling.— As discussed above, the processes tomodel in the cathode catalyst layer include proton conduction andoxygen transport to the Pt surface where they react together withelectrons to form water, which has to be removed from the electrode.In this section, we specifically examine modeling transport through theionomer thin-film and its associated effects. Furthermore, as modelingliquid-water transport involves much complexity with a large amountof uncertainty (more data is required), the discussion below neglectsliquid water. As the proton-transport resistance is needed to modelproton conduction through the ionomer thin-film, this can be possiblydetermined from measured electrochemical impedance spectroscopyas a function of relative humidity and temperature,334,335 or derivedfrom property relationships and is not discussed below.
When adding the film, the governing equation for oxygen transport(see equation 108) is altered to account for transport through the filmand then reaction and diffusion into the agglomerate.159,311,312,336,337
For accounting for transport into and through the film, a two-stageprocess is used, comprised of transport through the film
NO2= −D f ilm∇cO2 = − D f ilm
RT∇ pO2 [114]
and the slow oxygen dissolution process at the gas/ionomerinterface,266,338,339
NO2 = −a f ilmkO2, f ilm
(cO2,eq − cO2,i/g
)= −a f ilmkO2, f ilm
RT
(H pO2 − pO2,i/g
)[115]
where afilm is the specific surface-area of the film, kO2, f ilm is the rateconstant for oxygen dissolution, H is Henry’s constant, and pO2,i/g isthe equivalent pressure within the ionomer at the interface with thegas. Combining the above expression with that of equation 114 andassuming a linear gradient in the very thin film, results in
NO2 = 1
RT
H pO2,ext − pO2,sur f
RO2, f ilm[116]
where RO2, f ilm is the transport resistance of oxygen through ionomerfilm,
RO2, f ilm = δ f ilm
D f ilm+ 1
a f ilmkO2, f ilm[117]
Alternatively, if one does not independently know the solubility anddiffusivity, then the permeation coefficient (ψO2 = DH ) can beused. In addition, since the film thickness and its transport proper-ties are typically both unknown, one can just use the resistance formodeling.
At steady-state, the flux given by equation 116 is equal to the fluxdue to reaction and diffusion in the agglomerate; therefore, the un-known concentrations can be replaced. Using the resultant expressionin the conservation equation 23 yields
∇ · i1 = 4Fpm0O2,ext
⎛⎝ 1
1RO2, f ilm
+ 1ks,m0 E
⎞⎠ [118]
and a similar one can be derived for the HOR.1,142
The above expression is the governing equation for the transfercurrent density and includes both the film and agglomerate resistances.Upon inspection, one can see that as the current density increases(i.e., ks,m0 increases), the film resistance becomes more significant andlimiting. Thus, the impact of the ionomer thin-film on cell performanceis expected to be more pronounced at low Pt loading due to the higherlocal oxygen flux to each reaction site.
) unless CC License in place (see abstract). ecsdl.org/site/terms_use address. Redistribution subject to ECS terms of use (see 128.240.225.120Downloaded on 2014-09-14 to IP
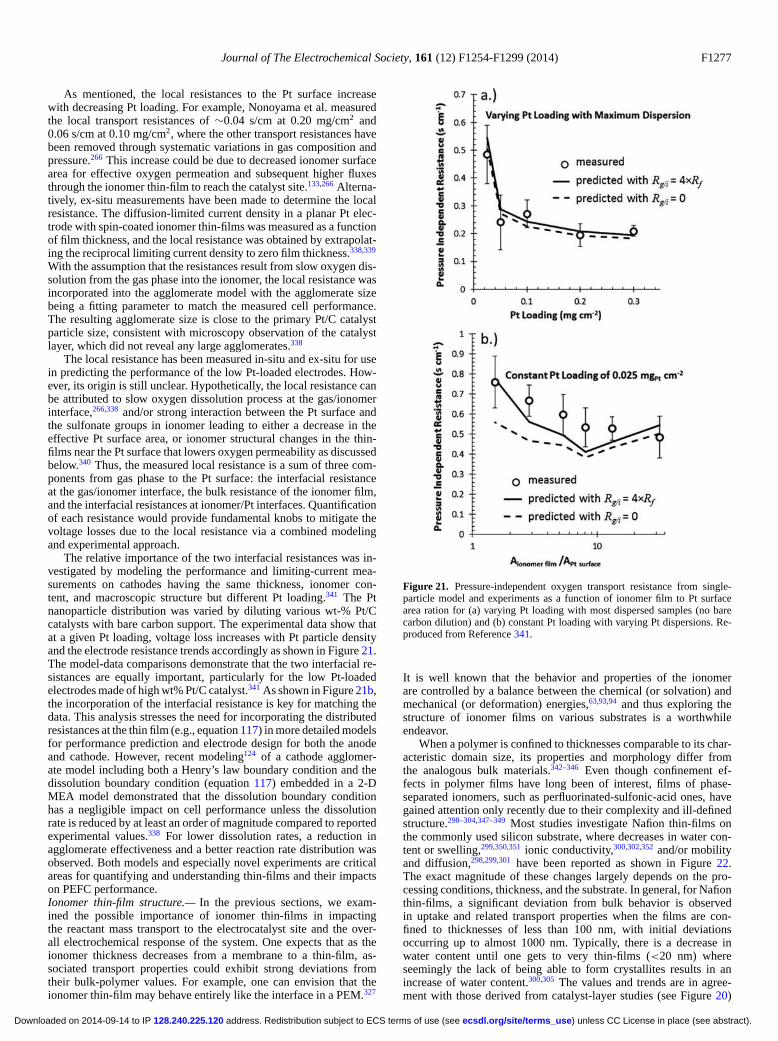
Journal of The Electrochemical Society, 161 (12) F1254-F1299 (2014) F1277
As mentioned, the local resistances to the Pt surface increasewith decreasing Pt loading. For example, Nonoyama et al. measuredthe local transport resistances of ∼0.04 s/cm at 0.20 mg/cm2 and0.06 s/cm at 0.10 mg/cm2, where the other transport resistances havebeen removed through systematic variations in gas composition andpressure.266 This increase could be due to decreased ionomer surfacearea for effective oxygen permeation and subsequent higher fluxesthrough the ionomer thin-film to reach the catalyst site.133,266 Alterna-tively, ex-situ measurements have been made to determine the localresistance. The diffusion-limited current density in a planar Pt elec-trode with spin-coated ionomer thin-films was measured as a functionof film thickness, and the local resistance was obtained by extrapolat-ing the reciprocal limiting current density to zero film thickness.338,339
With the assumption that the resistances result from slow oxygen dis-solution from the gas phase into the ionomer, the local resistance wasincorporated into the agglomerate model with the agglomerate sizebeing a fitting parameter to match the measured cell performance.The resulting agglomerate size is close to the primary Pt/C catalystparticle size, consistent with microscopy observation of the catalystlayer, which did not reveal any large agglomerates.338
The local resistance has been measured in-situ and ex-situ for usein predicting the performance of the low Pt-loaded electrodes. How-ever, its origin is still unclear. Hypothetically, the local resistance canbe attributed to slow oxygen dissolution process at the gas/ionomerinterface,266,338 and/or strong interaction between the Pt surface andthe sulfonate groups in ionomer leading to either a decrease in theeffective Pt surface area, or ionomer structural changes in the thin-films near the Pt surface that lowers oxygen permeability as discussedbelow.340 Thus, the measured local resistance is a sum of three com-ponents from gas phase to the Pt surface: the interfacial resistanceat the gas/ionomer interface, the bulk resistance of the ionomer film,and the interfacial resistances at ionomer/Pt interfaces. Quantificationof each resistance would provide fundamental knobs to mitigate thevoltage losses due to the local resistance via a combined modelingand experimental approach.
The relative importance of the two interfacial resistances was in-vestigated by modeling the performance and limiting-current mea-surements on cathodes having the same thickness, ionomer con-tent, and macroscopic structure but different Pt loading.341 The Ptnanoparticle distribution was varied by diluting various wt-% Pt/Ccatalysts with bare carbon support. The experimental data show thatat a given Pt loading, voltage loss increases with Pt particle densityand the electrode resistance trends accordingly as shown in Figure 21.The model-data comparisons demonstrate that the two interfacial re-sistances are equally important, particularly for the low Pt-loadedelectrodes made of high wt% Pt/C catalyst.341 As shown in Figure 21b,the incorporation of the interfacial resistance is key for matching thedata. This analysis stresses the need for incorporating the distributedresistances at the thin film (e.g., equation 117) in more detailed modelsfor performance prediction and electrode design for both the anodeand cathode. However, recent modeling124 of a cathode agglomer-ate model including both a Henry’s law boundary condition and thedissolution boundary condition (equation 117) embedded in a 2-DMEA model demonstrated that the dissolution boundary conditionhas a negligible impact on cell performance unless the dissolutionrate is reduced by at least an order of magnitude compared to reportedexperimental values.338 For lower dissolution rates, a reduction inagglomerate effectiveness and a better reaction rate distribution wasobserved. Both models and especially novel experiments are criticalareas for quantifying and understanding thin-films and their impactson PEFC performance.Ionomer thin-film structure.— In the previous sections, we exam-ined the possible importance of ionomer thin-films in impactingthe reactant mass transport to the electrocatalyst site and the over-all electrochemical response of the system. One expects that as theionomer thickness decreases from a membrane to a thin-film, as-sociated transport properties could exhibit strong deviations fromtheir bulk-polymer values. For example, one can envision that theionomer thin-film may behave entirely like the interface in a PEM.327
Figure 21. Pressure-independent oxygen transport resistance from single-particle model and experiments as a function of ionomer film to Pt surfacearea ration for (a) varying Pt loading with most dispersed samples (no barecarbon dilution) and (b) constant Pt loading with varying Pt dispersions. Re-produced from Reference 341.
It is well known that the behavior and properties of the ionomerare controlled by a balance between the chemical (or solvation) andmechanical (or deformation) energies,63,93,94 and thus exploring thestructure of ionomer films on various substrates is a worthwhileendeavor.
When a polymer is confined to thicknesses comparable to its char-acteristic domain size, its properties and morphology differ fromthe analogous bulk materials.342–346 Even though confinement ef-fects in polymer films have long been of interest, films of phase-separated ionomers, such as perfluorinated-sulfonic-acid ones, havegained attention only recently due to their complexity and ill-definedstructure.298–304,347–349 Most studies investigate Nafion thin-films onthe commonly used silicon substrate, where decreases in water con-tent or swelling,299,350,351 ionic conductivity,300,302,352 and/or mobilityand diffusion,298,299,301 have been reported as shown in Figure 22.The exact magnitude of these changes largely depends on the pro-cessing conditions, thickness, and the substrate. In general, for Nafionthin-films, a significant deviation from bulk behavior is observedin uptake and related transport properties when the films are con-fined to thicknesses of less than 100 nm, with initial deviationsoccurring up to almost 1000 nm. Typically, there is a decrease inwater content until one gets to very thin-films (<20 nm) whereseemingly the lack of being able to form crystallites results in anincrease of water content.300,305 The values and trends are in agree-ment with those derived from catalyst-layer studies (see Figure 20)
) unless CC License in place (see abstract). ecsdl.org/site/terms_use address. Redistribution subject to ECS terms of use (see 128.240.225.120Downloaded on 2014-09-14 to IP
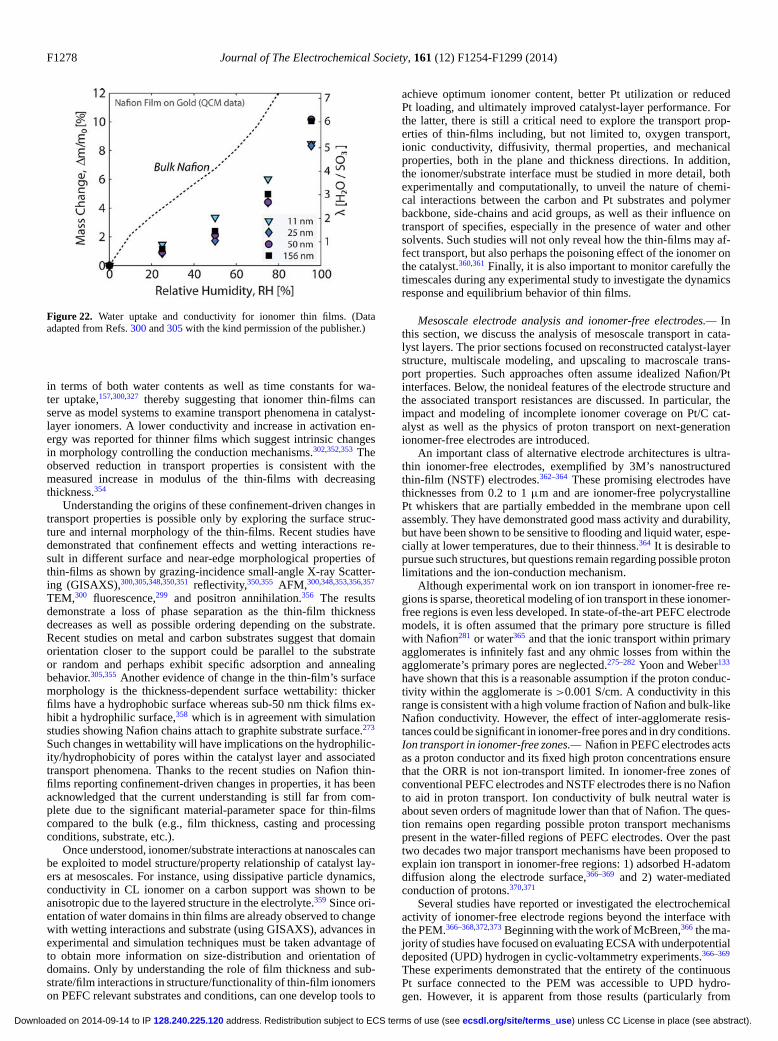
F1278 Journal of The Electrochemical Society, 161 (12) F1254-F1299 (2014)
Figure 22. Water uptake and conductivity for ionomer thin films. (Dataadapted from Refs. 300 and 305 with the kind permission of the publisher.)
in terms of both water contents as well as time constants for wa-ter uptake,157,300,327 thereby suggesting that ionomer thin-films canserve as model systems to examine transport phenomena in catalyst-layer ionomers. A lower conductivity and increase in activation en-ergy was reported for thinner films which suggest intrinsic changesin morphology controlling the conduction mechanisms.302,352,353 Theobserved reduction in transport properties is consistent with themeasured increase in modulus of the thin-films with decreasingthickness.354
Understanding the origins of these confinement-driven changes intransport properties is possible only by exploring the surface struc-ture and internal morphology of the thin-films. Recent studies havedemonstrated that confinement effects and wetting interactions re-sult in different surface and near-edge morphological properties ofthin-films as shown by grazing-incidence small-angle X-ray Scatter-ing (GISAXS),300,305,348,350,351 reflectivity,350,355 AFM,300,348,353,356,357
TEM,300 fluorescence,299 and positron annihilation.356 The resultsdemonstrate a loss of phase separation as the thin-film thicknessdecreases as well as possible ordering depending on the substrate.Recent studies on metal and carbon substrates suggest that domainorientation closer to the support could be parallel to the substrateor random and perhaps exhibit specific adsorption and annealingbehavior.305,355 Another evidence of change in the thin-film’s surfacemorphology is the thickness-dependent surface wettability: thickerfilms have a hydrophobic surface whereas sub-50 nm thick films ex-hibit a hydrophilic surface,358 which is in agreement with simulationstudies showing Nafion chains attach to graphite substrate surface.273
Such changes in wettability will have implications on the hydrophilic-ity/hydrophobicity of pores within the catalyst layer and associatedtransport phenomena. Thanks to the recent studies on Nafion thin-films reporting confinement-driven changes in properties, it has beenacknowledged that the current understanding is still far from com-plete due to the significant material-parameter space for thin-filmscompared to the bulk (e.g., film thickness, casting and processingconditions, substrate, etc.).
Once understood, ionomer/substrate interactions at nanoscales canbe exploited to model structure/property relationship of catalyst lay-ers at mesoscales. For instance, using dissipative particle dynamics,conductivity in CL ionomer on a carbon support was shown to beanisotropic due to the layered structure in the electrolyte.359 Since ori-entation of water domains in thin films are already observed to changewith wetting interactions and substrate (using GISAXS), advances inexperimental and simulation techniques must be taken advantage ofto obtain more information on size-distribution and orientation ofdomains. Only by understanding the role of film thickness and sub-strate/film interactions in structure/functionality of thin-film ionomerson PEFC relevant substrates and conditions, can one develop tools to
achieve optimum ionomer content, better Pt utilization or reducedPt loading, and ultimately improved catalyst-layer performance. Forthe latter, there is still a critical need to explore the transport prop-erties of thin-films including, but not limited to, oxygen transport,ionic conductivity, diffusivity, thermal properties, and mechanicalproperties, both in the plane and thickness directions. In addition,the ionomer/substrate interface must be studied in more detail, bothexperimentally and computationally, to unveil the nature of chemi-cal interactions between the carbon and Pt substrates and polymerbackbone, side-chains and acid groups, as well as their influence ontransport of specifies, especially in the presence of water and othersolvents. Such studies will not only reveal how the thin-films may af-fect transport, but also perhaps the poisoning effect of the ionomer onthe catalyst.360,361 Finally, it is also important to monitor carefully thetimescales during any experimental study to investigate the dynamicsresponse and equilibrium behavior of thin films.
Mesoscale electrode analysis and ionomer-free electrodes.— Inthis section, we discuss the analysis of mesoscale transport in cata-lyst layers. The prior sections focused on reconstructed catalyst-layerstructure, multiscale modeling, and upscaling to macroscale trans-port properties. Such approaches often assume idealized Nafion/Ptinterfaces. Below, the nonideal features of the electrode structure andthe associated transport resistances are discussed. In particular, theimpact and modeling of incomplete ionomer coverage on Pt/C cat-alyst as well as the physics of proton transport on next-generationionomer-free electrodes are introduced.
An important class of alternative electrode architectures is ultra-thin ionomer-free electrodes, exemplified by 3M’s nanostructuredthin-film (NSTF) electrodes.362–364 These promising electrodes havethicknesses from 0.2 to 1 μm and are ionomer-free polycrystallinePt whiskers that are partially embedded in the membrane upon cellassembly. They have demonstrated good mass activity and durability,but have been shown to be sensitive to flooding and liquid water, espe-cially at lower temperatures, due to their thinness.364 It is desirable topursue such structures, but questions remain regarding possible protonlimitations and the ion-conduction mechanism.
Although experimental work on ion transport in ionomer-free re-gions is sparse, theoretical modeling of ion transport in these ionomer-free regions is even less developed. In state-of-the-art PEFC electrodemodels, it is often assumed that the primary pore structure is filledwith Nafion281 or water365 and that the ionic transport within primaryagglomerates is infinitely fast and any ohmic losses from within theagglomerate’s primary pores are neglected.275–282 Yoon and Weber133
have shown that this is a reasonable assumption if the proton conduc-tivity within the agglomerate is >0.001 S/cm. A conductivity in thisrange is consistent with a high volume fraction of Nafion and bulk-likeNafion conductivity. However, the effect of inter-agglomerate resis-tances could be significant in ionomer-free pores and in dry conditions.Ion transport in ionomer-free zones.— Nafion in PEFC electrodes actsas a proton conductor and its fixed high proton concentrations ensurethat the ORR is not ion-transport limited. In ionomer-free zones ofconventional PEFC electrodes and NSTF electrodes there is no Nafionto aid in proton transport. Ion conductivity of bulk neutral water isabout seven orders of magnitude lower than that of Nafion. The ques-tion remains open regarding possible proton transport mechanismspresent in the water-filled regions of PEFC electrodes. Over the pasttwo decades two major transport mechanisms have been proposed toexplain ion transport in ionomer-free regions: 1) adsorbed H-adatomdiffusion along the electrode surface,366–369 and 2) water-mediatedconduction of protons.370,371
Several studies have reported or investigated the electrochemicalactivity of ionomer-free electrode regions beyond the interface withthe PEM.366–368,372,373 Beginning with the work of McBreen,366 the ma-jority of studies have focused on evaluating ECSA with underpotentialdeposited (UPD) hydrogen in cyclic-voltammetry experiments.366–369
These experiments demonstrated that the entirety of the continuousPt surface connected to the PEM was accessible to UPD hydro-gen. However, it is apparent from those results (particularly from
) unless CC License in place (see abstract). ecsdl.org/site/terms_use address. Redistribution subject to ECS terms of use (see 128.240.225.120Downloaded on 2014-09-14 to IP
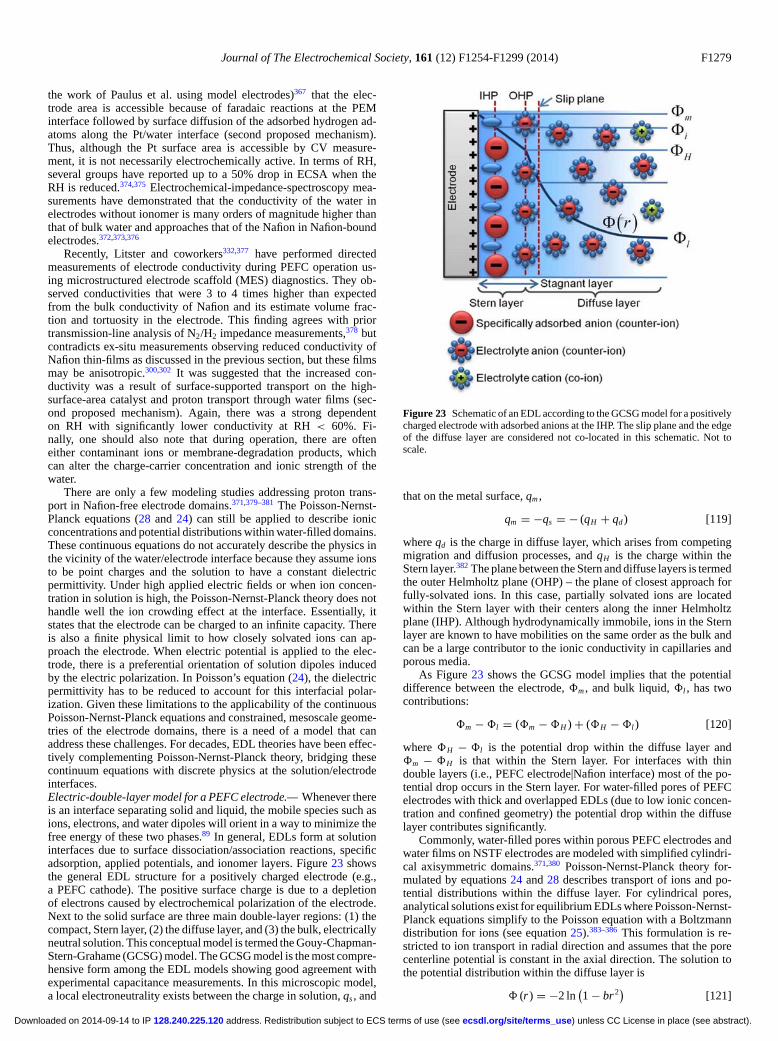
Journal of The Electrochemical Society, 161 (12) F1254-F1299 (2014) F1279
the work of Paulus et al. using model electrodes)367 that the elec-trode area is accessible because of faradaic reactions at the PEMinterface followed by surface diffusion of the adsorbed hydrogen ad-atoms along the Pt/water interface (second proposed mechanism).Thus, although the Pt surface area is accessible by CV measure-ment, it is not necessarily electrochemically active. In terms of RH,several groups have reported up to a 50% drop in ECSA when theRH is reduced.374,375 Electrochemical-impedance-spectroscopy mea-surements have demonstrated that the conductivity of the water inelectrodes without ionomer is many orders of magnitude higher thanthat of bulk water and approaches that of the Nafion in Nafion-boundelectrodes.372,373,376
Recently, Litster and coworkers332,377 have performed directedmeasurements of electrode conductivity during PEFC operation us-ing microstructured electrode scaffold (MES) diagnostics. They ob-served conductivities that were 3 to 4 times higher than expectedfrom the bulk conductivity of Nafion and its estimate volume frac-tion and tortuosity in the electrode. This finding agrees with priortransmission-line analysis of N2/H2 impedance measurements,378 butcontradicts ex-situ measurements observing reduced conductivity ofNafion thin-films as discussed in the previous section, but these filmsmay be anisotropic.300,302 It was suggested that the increased con-ductivity was a result of surface-supported transport on the high-surface-area catalyst and proton transport through water films (sec-ond proposed mechanism). Again, there was a strong dependenton RH with significantly lower conductivity at RH < 60%. Fi-nally, one should also note that during operation, there are ofteneither contaminant ions or membrane-degradation products, whichcan alter the charge-carrier concentration and ionic strength of thewater.
There are only a few modeling studies addressing proton trans-port in Nafion-free electrode domains.371,379–381 The Poisson-Nernst-Planck equations (28 and 24) can still be applied to describe ionicconcentrations and potential distributions within water-filled domains.These continuous equations do not accurately describe the physics inthe vicinity of the water/electrode interface because they assume ionsto be point charges and the solution to have a constant dielectricpermittivity. Under high applied electric fields or when ion concen-tration in solution is high, the Poisson-Nernst-Planck theory does nothandle well the ion crowding effect at the interface. Essentially, itstates that the electrode can be charged to an infinite capacity. Thereis also a finite physical limit to how closely solvated ions can ap-proach the electrode. When electric potential is applied to the elec-trode, there is a preferential orientation of solution dipoles inducedby the electric polarization. In Poisson’s equation (24), the dielectricpermittivity has to be reduced to account for this interfacial polar-ization. Given these limitations to the applicability of the continuousPoisson-Nernst-Planck equations and constrained, mesoscale geome-tries of the electrode domains, there is a need of a model that canaddress these challenges. For decades, EDL theories have been effec-tively complementing Poisson-Nernst-Planck theory, bridging thesecontinuum equations with discrete physics at the solution/electrodeinterfaces.Electric-double-layer model for a PEFC electrode.— Whenever thereis an interface separating solid and liquid, the mobile species such asions, electrons, and water dipoles will orient in a way to minimize thefree energy of these two phases.89 In general, EDLs form at solutioninterfaces due to surface dissociation/association reactions, specificadsorption, applied potentials, and ionomer layers. Figure 23 showsthe general EDL structure for a positively charged electrode (e.g.,a PEFC cathode). The positive surface charge is due to a depletionof electrons caused by electrochemical polarization of the electrode.Next to the solid surface are three main double-layer regions: (1) thecompact, Stern layer, (2) the diffuse layer, and (3) the bulk, electricallyneutral solution. This conceptual model is termed the Gouy-Chapman-Stern-Grahame (GCSG) model. The GCSG model is the most compre-hensive form among the EDL models showing good agreement withexperimental capacitance measurements. In this microscopic model,a local electroneutrality exists between the charge in solution, qs , and
Figure 23 Schematic of an EDL according to the GCSG model for a positivelycharged electrode with adsorbed anions at the IHP. The slip plane and the edgeof the diffuse layer are considered not co-located in this schematic. Not toscale.
that on the metal surface, qm ,
qm = −qs = − (qH + qd ) [119]
where qd is the charge in diffuse layer, which arises from competingmigration and diffusion processes, and qH is the charge within theStern layer.382 The plane between the Stern and diffuse layers is termedthe outer Helmholtz plane (OHP) – the plane of closest approach forfully-solvated ions. In this case, partially solvated ions are locatedwithin the Stern layer with their centers along the inner Helmholtzplane (IHP). Although hydrodynamically immobile, ions in the Sternlayer are known to have mobilities on the same order as the bulk andcan be a large contributor to the ionic conductivity in capillaries andporous media.
As Figure 23 shows the GCSG model implies that the potentialdifference between the electrode, �m , and bulk liquid, �l , has twocontributions:
�m − �l = (�m − �H ) + (�H − �l ) [120]
where �H − �l is the potential drop within the diffuse layer and�m − �H is that within the Stern layer. For interfaces with thindouble layers (i.e., PEFC electrode|Nafion interface) most of the po-tential drop occurs in the Stern layer. For water-filled pores of PEFCelectrodes with thick and overlapped EDLs (due to low ionic concen-tration and confined geometry) the potential drop within the diffuselayer contributes significantly.
Commonly, water-filled pores within porous PEFC electrodes andwater films on NSTF electrodes are modeled with simplified cylindri-cal axisymmetric domains.371,380 Poisson-Nernst-Planck theory for-mulated by equations 24 and 28 describes transport of ions and po-tential distributions within the diffuse layer. For cylindrical pores,analytical solutions exist for equilibrium EDLs where Poisson-Nernst-Planck equations simplify to the Poisson equation with a Boltzmanndistribution for ions (see equation 25).383–386 This formulation is re-stricted to ion transport in radial direction and assumes that the porecenterline potential is constant in the axial direction. The solution tothe potential distribution within the diffuse layer is
� (r ) = −2 ln(1 − br2
)[121]
) unless CC License in place (see abstract). ecsdl.org/site/terms_use address. Redistribution subject to ECS terms of use (see 128.240.225.120Downloaded on 2014-09-14 to IP
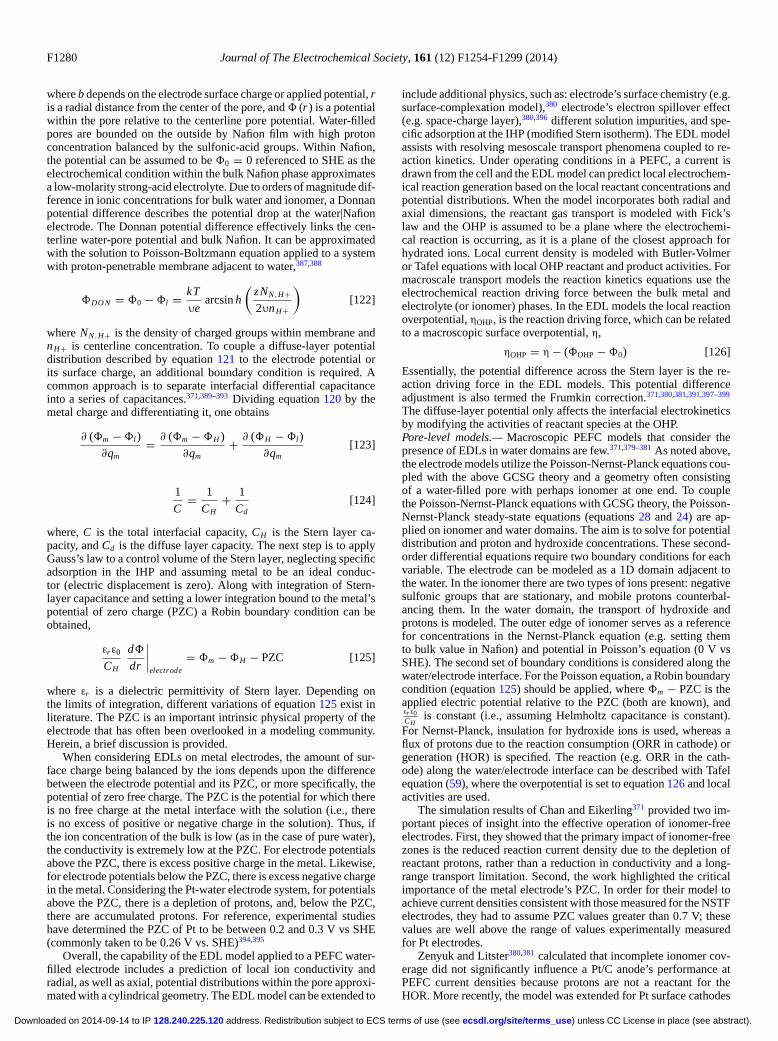
F1280 Journal of The Electrochemical Society, 161 (12) F1254-F1299 (2014)
where b depends on the electrode surface charge or applied potential, ris a radial distance from the center of the pore, and � (r ) is a potentialwithin the pore relative to the centerline pore potential. Water-filledpores are bounded on the outside by Nafion film with high protonconcentration balanced by the sulfonic-acid groups. Within Nafion,the potential can be assumed to be �0 = 0 referenced to SHE as theelectrochemical condition within the bulk Nafion phase approximatesa low-molarity strong-acid electrolyte. Due to orders of magnitude dif-ference in ionic concentrations for bulk water and ionomer, a Donnanpotential difference describes the potential drop at the water|Nafionelectrode. The Donnan potential difference effectively links the cen-terline water-pore potential and bulk Nafion. It can be approximatedwith the solution to Poisson-Boltzmann equation applied to a systemwith proton-penetrable membrane adjacent to water,387,388
�DO N = �0 − �l = kT
υearcsin h
(zNN ,H+2υnH+
)[122]
where NN ,H+ is the density of charged groups within membrane andnH+ is centerline concentration. To couple a diffuse-layer potentialdistribution described by equation 121 to the electrode potential orits surface charge, an additional boundary condition is required. Acommon approach is to separate interfacial differential capacitanceinto a series of capacitances.371,389–393 Dividing equation 120 by themetal charge and differentiating it, one obtains
∂ (�m − �l )
∂qm= ∂ (�m − �H )
∂qm+ ∂ (�H − �l )
∂qm[123]
1
C= 1
CH+ 1
Cd[124]
where, C is the total interfacial capacity, CH is the Stern layer ca-pacity, and Cd is the diffuse layer capacity. The next step is to applyGauss’s law to a control volume of the Stern layer, neglecting specificadsorption in the IHP and assuming metal to be an ideal conduc-tor (electric displacement is zero). Along with integration of Stern-layer capacitance and setting a lower integration bound to the metal’spotential of zero charge (PZC) a Robin boundary condition can beobtained,
εr ε0
CH
d�
dr
∣∣∣∣electrode
= �m − �H − PZC [125]
where εr is a dielectric permittivity of Stern layer. Depending onthe limits of integration, different variations of equation 125 exist inliterature. The PZC is an important intrinsic physical property of theelectrode that has often been overlooked in a modeling community.Herein, a brief discussion is provided.
When considering EDLs on metal electrodes, the amount of sur-face charge being balanced by the ions depends upon the differencebetween the electrode potential and its PZC, or more specifically, thepotential of zero free charge. The PZC is the potential for which thereis no free charge at the metal interface with the solution (i.e., thereis no excess of positive or negative charge in the solution). Thus, ifthe ion concentration of the bulk is low (as in the case of pure water),the conductivity is extremely low at the PZC. For electrode potentialsabove the PZC, there is excess positive charge in the metal. Likewise,for electrode potentials below the PZC, there is excess negative chargein the metal. Considering the Pt-water electrode system, for potentialsabove the PZC, there is a depletion of protons, and, below the PZC,there are accumulated protons. For reference, experimental studieshave determined the PZC of Pt to be between 0.2 and 0.3 V vs SHE(commonly taken to be 0.26 V vs. SHE)394,395
Overall, the capability of the EDL model applied to a PEFC water-filled electrode includes a prediction of local ion conductivity andradial, as well as axial, potential distributions within the pore approxi-mated with a cylindrical geometry. The EDL model can be extended to
include additional physics, such as: electrode’s surface chemistry (e.g.surface-complexation model),380 electrode’s electron spillover effect(e.g. space-charge layer),380,396 different solution impurities, and spe-cific adsorption at the IHP (modified Stern isotherm). The EDL modelassists with resolving mesoscale transport phenomena coupled to re-action kinetics. Under operating conditions in a PEFC, a current isdrawn from the cell and the EDL model can predict local electrochem-ical reaction generation based on the local reactant concentrations andpotential distributions. When the model incorporates both radial andaxial dimensions, the reactant gas transport is modeled with Fick’slaw and the OHP is assumed to be a plane where the electrochemi-cal reaction is occurring, as it is a plane of the closest approach forhydrated ions. Local current density is modeled with Butler-Volmeror Tafel equations with local OHP reactant and product activities. Formacroscale transport models the reaction kinetics equations use theelectrochemical reaction driving force between the bulk metal andelectrolyte (or ionomer) phases. In the EDL models the local reactionoverpotential, ηOHP, is the reaction driving force, which can be relatedto a macroscopic surface overpotential, η,
ηOHP = η − (�OHP − �0) [126]
Essentially, the potential difference across the Stern layer is the re-action driving force in the EDL models. This potential differenceadjustment is also termed the Frumkin correction.371,380,381,391,397–399
The diffuse-layer potential only affects the interfacial electrokineticsby modifying the activities of reactant species at the OHP.Pore-level models.— Macroscopic PEFC models that consider thepresence of EDLs in water domains are few.371,379–381 As noted above,the electrode models utilize the Poisson-Nernst-Planck equations cou-pled with the above GCSG theory and a geometry often consistingof a water-filled pore with perhaps ionomer at one end. To couplethe Poisson-Nernst-Planck equations with GCSG theory, the Poisson-Nernst-Planck steady-state equations (equations 28 and 24) are ap-plied on ionomer and water domains. The aim is to solve for potentialdistribution and proton and hydroxide concentrations. These second-order differential equations require two boundary conditions for eachvariable. The electrode can be modeled as a 1D domain adjacent tothe water. In the ionomer there are two types of ions present: negativesulfonic groups that are stationary, and mobile protons counterbal-ancing them. In the water domain, the transport of hydroxide andprotons is modeled. The outer edge of ionomer serves as a referencefor concentrations in the Nernst-Planck equation (e.g. setting themto bulk value in Nafion) and potential in Poisson’s equation (0 V vsSHE). The second set of boundary conditions is considered along thewater/electrode interface. For the Poisson equation, a Robin boundarycondition (equation 125) should be applied, where �m − PZC is theapplied electric potential relative to the PZC (both are known), andεr ε0CH
is constant (i.e., assuming Helmholtz capacitance is constant).For Nernst-Planck, insulation for hydroxide ions is used, whereas aflux of protons due to the reaction consumption (ORR in cathode) orgeneration (HOR) is specified. The reaction (e.g. ORR in the cath-ode) along the water/electrode interface can be described with Tafelequation (59), where the overpotential is set to equation 126 and localactivities are used.
The simulation results of Chan and Eikerling371 provided two im-portant pieces of insight into the effective operation of ionomer-freeelectrodes. First, they showed that the primary impact of ionomer-freezones is the reduced reaction current density due to the depletion ofreactant protons, rather than a reduction in conductivity and a long-range transport limitation. Second, the work highlighted the criticalimportance of the metal electrode’s PZC. In order for their model toachieve current densities consistent with those measured for the NSTFelectrodes, they had to assume PZC values greater than 0.7 V; thesevalues are well above the range of values experimentally measuredfor Pt electrodes.
Zenyuk and Litster380,381 calculated that incomplete ionomer cov-erage did not significantly influence a Pt/C anode’s performance atPEFC current densities because protons are not a reactant for theHOR. More recently, the model was extended for Pt surface cathodes
) unless CC License in place (see abstract). ecsdl.org/site/terms_use address. Redistribution subject to ECS terms of use (see 128.240.225.120Downloaded on 2014-09-14 to IP
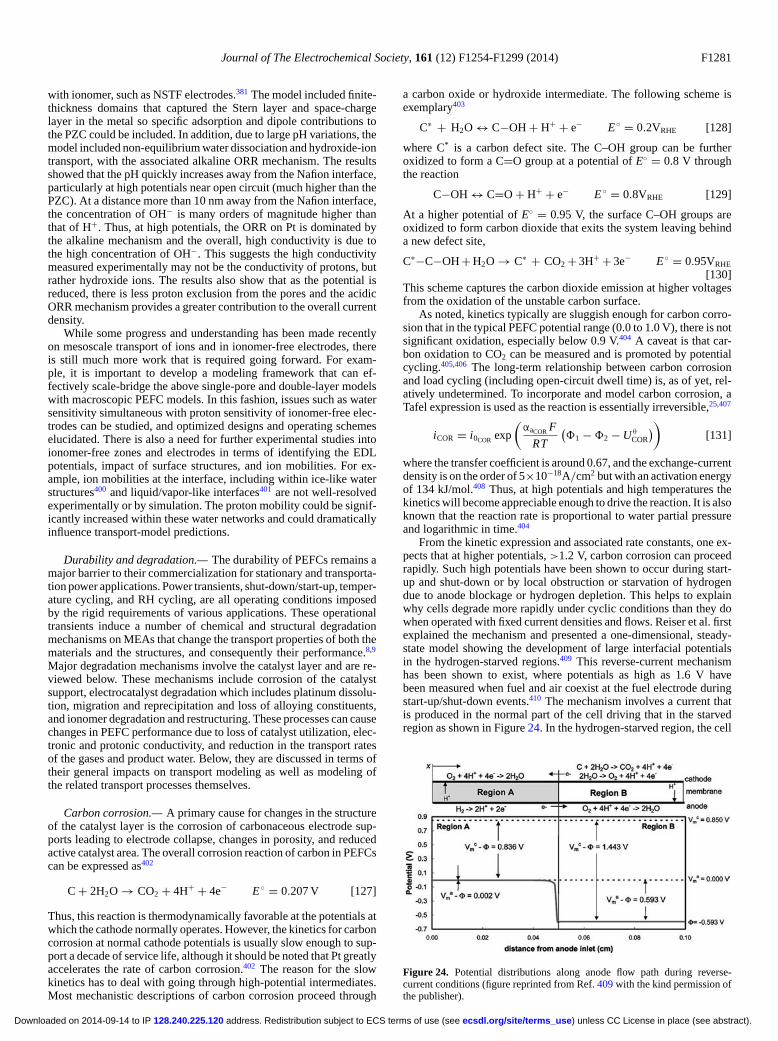
Journal of The Electrochemical Society, 161 (12) F1254-F1299 (2014) F1281
with ionomer, such as NSTF electrodes.381 The model included finite-thickness domains that captured the Stern layer and space-chargelayer in the metal so specific adsorption and dipole contributions tothe PZC could be included. In addition, due to large pH variations, themodel included non-equilibrium water dissociation and hydroxide-iontransport, with the associated alkaline ORR mechanism. The resultsshowed that the pH quickly increases away from the Nafion interface,particularly at high potentials near open circuit (much higher than thePZC). At a distance more than 10 nm away from the Nafion interface,the concentration of OH− is many orders of magnitude higher thanthat of H+. Thus, at high potentials, the ORR on Pt is dominated bythe alkaline mechanism and the overall, high conductivity is due tothe high concentration of OH−. This suggests the high conductivitymeasured experimentally may not be the conductivity of protons, butrather hydroxide ions. The results also show that as the potential isreduced, there is less proton exclusion from the pores and the acidicORR mechanism provides a greater contribution to the overall currentdensity.
While some progress and understanding has been made recentlyon mesoscale transport of ions and in ionomer-free electrodes, thereis still much more work that is required going forward. For exam-ple, it is important to develop a modeling framework that can ef-fectively scale-bridge the above single-pore and double-layer modelswith macroscopic PEFC models. In this fashion, issues such as watersensitivity simultaneous with proton sensitivity of ionomer-free elec-trodes can be studied, and optimized designs and operating schemeselucidated. There is also a need for further experimental studies intoionomer-free zones and electrodes in terms of identifying the EDLpotentials, impact of surface structures, and ion mobilities. For ex-ample, ion mobilities at the interface, including within ice-like waterstructures400 and liquid/vapor-like interfaces401 are not well-resolvedexperimentally or by simulation. The proton mobility could be signif-icantly increased within these water networks and could dramaticallyinfluence transport-model predictions.
Durability and degradation.— The durability of PEFCs remains amajor barrier to their commercialization for stationary and transporta-tion power applications. Power transients, shut-down/start-up, temper-ature cycling, and RH cycling, are all operating conditions imposedby the rigid requirements of various applications. These operationaltransients induce a number of chemical and structural degradationmechanisms on MEAs that change the transport properties of both thematerials and the structures, and consequently their performance.8,9
Major degradation mechanisms involve the catalyst layer and are re-viewed below. These mechanisms include corrosion of the catalystsupport, electrocatalyst degradation which includes platinum dissolu-tion, migration and reprecipitation and loss of alloying constituents,and ionomer degradation and restructuring. These processes can causechanges in PEFC performance due to loss of catalyst utilization, elec-tronic and protonic conductivity, and reduction in the transport ratesof the gases and product water. Below, they are discussed in terms oftheir general impacts on transport modeling as well as modeling ofthe related transport processes themselves.
Carbon corrosion.— A primary cause for changes in the structureof the catalyst layer is the corrosion of carbonaceous electrode sup-ports leading to electrode collapse, changes in porosity, and reducedactive catalyst area. The overall corrosion reaction of carbon in PEFCscan be expressed as402
C + 2H2O → CO2 + 4H+ + 4e− E◦ = 0.207 V [127]
Thus, this reaction is thermodynamically favorable at the potentials atwhich the cathode normally operates. However, the kinetics for carboncorrosion at normal cathode potentials is usually slow enough to sup-port a decade of service life, although it should be noted that Pt greatlyaccelerates the rate of carbon corrosion.402 The reason for the slowkinetics has to deal with going through high-potential intermediates.Most mechanistic descriptions of carbon corrosion proceed through
a carbon oxide or hydroxide intermediate. The following scheme isexemplary403
C∗ + H2O ↔ C−OH + H+ + e− E◦ = 0.2VRHE [128]
where C* is a carbon defect site. The C–OH group can be furtheroxidized to form a C=O group at a potential of E◦ = 0.8 V throughthe reaction
C−OH ↔ C=O + H+ + e− E◦ = 0.8VRHE [129]
At a higher potential of E◦ = 0.95 V, the surface C–OH groups areoxidized to form carbon dioxide that exits the system leaving behinda new defect site,
C∗−C−OH + H2O → C∗ + CO2 + 3H+ + 3e− E◦ = 0.95VRHE
[130]This scheme captures the carbon dioxide emission at higher voltagesfrom the oxidation of the unstable carbon surface.
As noted, kinetics typically are sluggish enough for carbon corro-sion that in the typical PEFC potential range (0.0 to 1.0 V), there is notsignificant oxidation, especially below 0.9 V.404 A caveat is that car-bon oxidation to CO2 can be measured and is promoted by potentialcycling.405,406 The long-term relationship between carbon corrosionand load cycling (including open-circuit dwell time) is, as of yet, rel-atively undetermined. To incorporate and model carbon corrosion, aTafel expression is used as the reaction is essentially irreversible,25,407
iCOR = i0COR exp
(αaCOR F
RT
(�1 − �2 − U θ
COR
))[131]
where the transfer coefficient is around 0.67, and the exchange-currentdensity is on the order of 5×10⁻¹⁸A/cm2 but with an activation energyof 134 kJ/mol.408 Thus, at high potentials and high temperatures thekinetics will become appreciable enough to drive the reaction. It is alsoknown that the reaction rate is proportional to water partial pressureand logarithmic in time.404
From the kinetic expression and associated rate constants, one ex-pects that at higher potentials, >1.2 V, carbon corrosion can proceedrapidly. Such high potentials have been shown to occur during start-up and shut-down or by local obstruction or starvation of hydrogendue to anode blockage or hydrogen depletion. This helps to explainwhy cells degrade more rapidly under cyclic conditions than they dowhen operated with fixed current densities and flows. Reiser et al. firstexplained the mechanism and presented a one-dimensional, steady-state model showing the development of large interfacial potentialsin the hydrogen-starved regions.409 This reverse-current mechanismhas been shown to exist, where potentials as high as 1.6 V havebeen measured when fuel and air coexist at the fuel electrode duringstart-up/shut-down events.410 The mechanism involves a current thatis produced in the normal part of the cell driving that in the starvedregion as shown in Figure 24. In the hydrogen-starved region, the cell
Figure 24. Potential distributions along anode flow path during reverse-current conditions (figure reprinted from Ref. 409 with the kind permission ofthe publisher).
) unless CC License in place (see abstract). ecsdl.org/site/terms_use address. Redistribution subject to ECS terms of use (see 128.240.225.120Downloaded on 2014-09-14 to IP
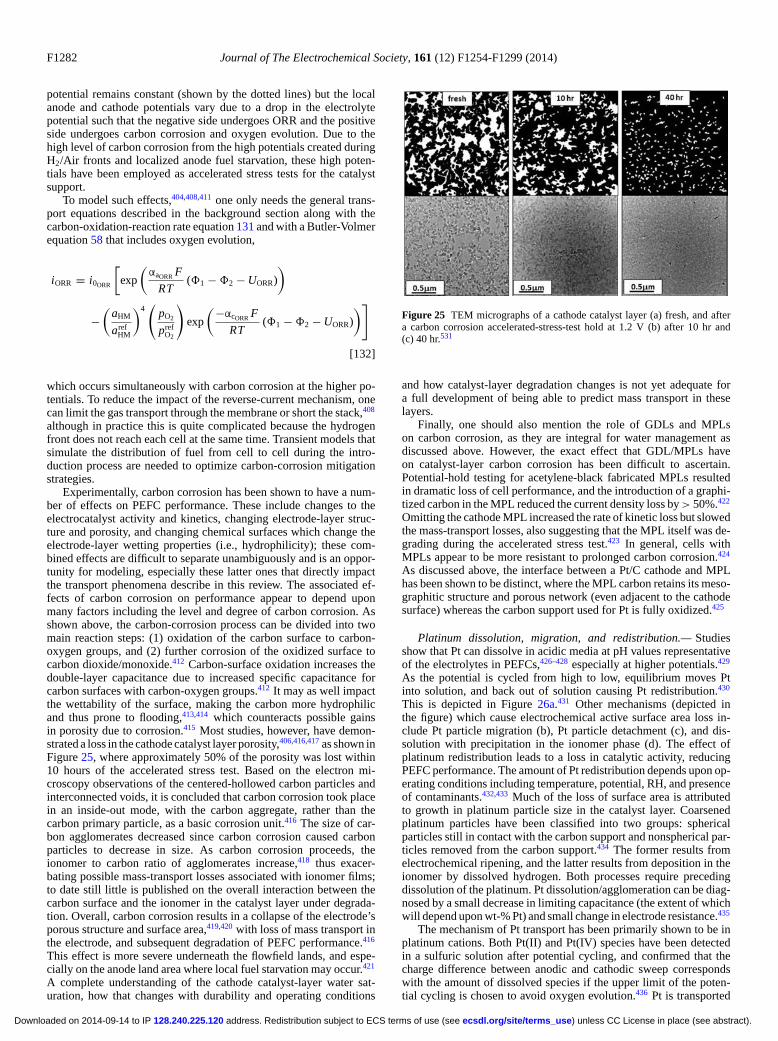
F1282 Journal of The Electrochemical Society, 161 (12) F1254-F1299 (2014)
potential remains constant (shown by the dotted lines) but the localanode and cathode potentials vary due to a drop in the electrolytepotential such that the negative side undergoes ORR and the positiveside undergoes carbon corrosion and oxygen evolution. Due to thehigh level of carbon corrosion from the high potentials created duringH2/Air fronts and localized anode fuel starvation, these high poten-tials have been employed as accelerated stress tests for the catalystsupport.
To model such effects,404,408,411 one only needs the general trans-port equations described in the background section along with thecarbon-oxidation-reaction rate equation 131 and with a Butler-Volmerequation 58 that includes oxygen evolution,
iORR = i0ORR
[exp
(αaORR F
RT(�1 − �2 − UORR)
)
−(
aHM
arefHM
)4(
pO2
prefO2
)exp
(−αcORR F
RT(�1 − �2 − UORR)
)]
[132]
which occurs simultaneously with carbon corrosion at the higher po-tentials. To reduce the impact of the reverse-current mechanism, onecan limit the gas transport through the membrane or short the stack,408
although in practice this is quite complicated because the hydrogenfront does not reach each cell at the same time. Transient models thatsimulate the distribution of fuel from cell to cell during the intro-duction process are needed to optimize carbon-corrosion mitigationstrategies.
Experimentally, carbon corrosion has been shown to have a num-ber of effects on PEFC performance. These include changes to theelectrocatalyst activity and kinetics, changing electrode-layer struc-ture and porosity, and changing chemical surfaces which change theelectrode-layer wetting properties (i.e., hydrophilicity); these com-bined effects are difficult to separate unambiguously and is an oppor-tunity for modeling, especially these latter ones that directly impactthe transport phenomena describe in this review. The associated ef-fects of carbon corrosion on performance appear to depend uponmany factors including the level and degree of carbon corrosion. Asshown above, the carbon-corrosion process can be divided into twomain reaction steps: (1) oxidation of the carbon surface to carbon-oxygen groups, and (2) further corrosion of the oxidized surface tocarbon dioxide/monoxide.412 Carbon-surface oxidation increases thedouble-layer capacitance due to increased specific capacitance forcarbon surfaces with carbon-oxygen groups.412 It may as well impactthe wettability of the surface, making the carbon more hydrophilicand thus prone to flooding,413,414 which counteracts possible gainsin porosity due to corrosion.415 Most studies, however, have demon-strated a loss in the cathode catalyst layer porosity,406,416,417 as shown inFigure 25, where approximately 50% of the porosity was lost within10 hours of the accelerated stress test. Based on the electron mi-croscopy observations of the centered-hollowed carbon particles andinterconnected voids, it is concluded that carbon corrosion took placein an inside-out mode, with the carbon aggregate, rather than thecarbon primary particle, as a basic corrosion unit.416 The size of car-bon agglomerates decreased since carbon corrosion caused carbonparticles to decrease in size. As carbon corrosion proceeds, theionomer to carbon ratio of agglomerates increase,418 thus exacer-bating possible mass-transport losses associated with ionomer films;to date still little is published on the overall interaction between thecarbon surface and the ionomer in the catalyst layer under degrada-tion. Overall, carbon corrosion results in a collapse of the electrode’sporous structure and surface area,419,420 with loss of mass transport inthe electrode, and subsequent degradation of PEFC performance.416
This effect is more severe underneath the flowfield lands, and espe-cially on the anode land area where local fuel starvation may occur.421
A complete understanding of the cathode catalyst-layer water sat-uration, how that changes with durability and operating conditions
Figure 25 TEM micrographs of a cathode catalyst layer (a) fresh, and aftera carbon corrosion accelerated-stress-test hold at 1.2 V (b) after 10 hr and(c) 40 hr.531
and how catalyst-layer degradation changes is not yet adequate fora full development of being able to predict mass transport in theselayers.
Finally, one should also mention the role of GDLs and MPLson carbon corrosion, as they are integral for water management asdiscussed above. However, the exact effect that GDL/MPLs haveon catalyst-layer carbon corrosion has been difficult to ascertain.Potential-hold testing for acetylene-black fabricated MPLs resultedin dramatic loss of cell performance, and the introduction of a graphi-tized carbon in the MPL reduced the current density loss by > 50%.422
Omitting the cathode MPL increased the rate of kinetic loss but slowedthe mass-transport losses, also suggesting that the MPL itself was de-grading during the accelerated stress test.423 In general, cells withMPLs appear to be more resistant to prolonged carbon corrosion.424
As discussed above, the interface between a Pt/C cathode and MPLhas been shown to be distinct, where the MPL carbon retains its meso-graphitic structure and porous network (even adjacent to the cathodesurface) whereas the carbon support used for Pt is fully oxidized.425
Platinum dissolution, migration, and redistribution.— Studiesshow that Pt can dissolve in acidic media at pH values representativeof the electrolytes in PEFCs,426–428 especially at higher potentials.429
As the potential is cycled from high to low, equilibrium moves Ptinto solution, and back out of solution causing Pt redistribution.430
This is depicted in Figure 26a.431 Other mechanisms (depicted inthe figure) which cause electrochemical active surface area loss in-clude Pt particle migration (b), Pt particle detachment (c), and dis-solution with precipitation in the ionomer phase (d). The effect ofplatinum redistribution leads to a loss in catalytic activity, reducingPEFC performance. The amount of Pt redistribution depends upon op-erating conditions including temperature, potential, RH, and presenceof contaminants.432,433 Much of the loss of surface area is attributedto growth in platinum particle size in the catalyst layer. Coarsenedplatinum particles have been classified into two groups: sphericalparticles still in contact with the carbon support and nonspherical par-ticles removed from the carbon support.434 The former results fromelectrochemical ripening, and the latter results from deposition in theionomer by dissolved hydrogen. Both processes require precedingdissolution of the platinum. Pt dissolution/agglomeration can be diag-nosed by a small decrease in limiting capacitance (the extent of whichwill depend upon wt-% Pt) and small change in electrode resistance.435
The mechanism of Pt transport has been primarily shown to be inplatinum cations. Both Pt(II) and Pt(IV) species have been detectedin a sulfuric solution after potential cycling, and confirmed that thecharge difference between anodic and cathodic sweep correspondswith the amount of dissolved species if the upper limit of the poten-tial cycling is chosen to avoid oxygen evolution.436 Pt is transported
) unless CC License in place (see abstract). ecsdl.org/site/terms_use address. Redistribution subject to ECS terms of use (see 128.240.225.120Downloaded on 2014-09-14 to IP

Journal of The Electrochemical Society, 161 (12) F1254-F1299 (2014) F1283
Figure 26. Schematic representation of platinum dissolution and redeposition(image reprinted from Ref. 431 with the kind permission of the publisher).
from the cathode catalyst, and where reprecipitation occurs seemsdependent upon operating and transport conditions. Much of the Ptreprecipitates in the cathode catalyst layer creating larger platinumparticles as noted in Figure 26 and seen experimentally.437,438 Someof the Pt also reprecipitates in the Nafion membrane, primarily wherehydrogen and oxygen diffusion fronts meet and hydrogen reduces theplatinum cations creating a ‘band’ of platinum.439–443 Platinum hasalso been shown to plate out on the anode catalyst layer/membraneinterface.306,320
To describe accurately platinum oxidation and dissolution requiresinclusion of anodic and cathodic terms describing both the oxidationand the reduction of platinum oxide to platinum. For example, onecan include equilibrium Pt-oxide coverage term in the kinetics (seeequations 60 and 61).133,444,445 This coverage is potential dependentand ranges from zero to full coverage, where a full coverage protectsthe underlying Pt from dissolving even at higher potentials. Thus,one can see the reason why cycling is so detrimental is that one istransitioning to where Pt wants to dissolve thermodynamically andis not yet protected from doing so by the Pt-oxide layer. A morecomplicated expression can be used for Pt oxide formation, assum-ing that Pt forms a non-ideal solid solution with the Pt oxides thatappear at potentials higher than 0.85 V.426 Thus, the activity of Ptin Pt-PtOx solid solution was derived from experimental dissolutiondata as
E = E0 (Pt) − RT
nFln (aPt ) + RT
nFln (cPt2+ ) [133]
where cPt2+ is the concentration of Pt2+ in the perchloric-acid solution.This model was expanded for use on catalyst-coated membranes andrelated to accelerated stress tests.446 The rate at which Pt dissolves by
the reaction Pt = Pt2+ + 2e− is given by
iPt2+ = k exp
(��Pt O
RT
)f (ϕ)
[aPt
(dp, �Pt O , T
)
× exp
(αanF
RT
(E − E0 (Pt)
))
−cPt2+ xp
(−αcnF
RT
(E − E0 (Pt)
))][134]
This model expansion includes the dynamics of particle-size evolu-tion (dp) considering particle growth by Ostwald ripening and coa-lescence/sintering. Results from this model indicate that the observedgrowth in particle size and loss in surface area are primarily dueto coalescence/sintering and are sensitive to the potential limits andthe initial particle-size distribution. An enthalpy of dissolution of49.3 kJ.mol−1 and an effective heat of fusion of 28.2 kJ.mol−1 for par-ticle coalescence/sintering have been empirically determined from themeasured temperature dependence of particle growth.446 A systematicstudy is still needed to investigate the effect of O2 on the thermody-namics and kinetics of Pt dissolution in aqueous media. Additionally,the model suggests that a reduction in ionomer hydration limits thediffusion of Pt ions in the ionomer; data is needed to estimate theplatinum dissolution rate dependence on ionomer hydration.
As mentioned, Pt ions can move into and across the ionomer, whichis a solid acid. This results in deposited particles in the membraneas well as the Pt band mentioned above.434,439–443,447 A substantialamount of Pt can be observed migrating into the membrane inducedfrom potential cycling; measurements have shown up to ∼ 13% 443
to 20%448 of the cathode catalyst-layer Pt deposited into the Nafionmembrane. A model based on dilute-solution theory (see equation 28)has been used to describe the movement of soluble platinum throughthe Nafion membrane.440
There are few publications describing the platinum transport andplatinum-dissolution effects on mass-transport limitations in PEFCs,although they seem to indicate larger mass-transfer overpotentials.449
Other restructuring effects.— Cathode catalyst-layer thinning isregularly observed and most reports indicate increased losses asso-ciated with mass transport.450 This catalyst-layer thinning is coupledwith loss of porosity in the catalyst layer, and in some cases cor-relate with carbon corrosion. It is unclear as to the causes of thiscatalyst-layer thinning, although restructuring and compaction withan associated loss of porosity of the catalyst layer is suspected. Itis also unclear if this effect is widely observed for different MEAmanufacturing techniques.
Results have indicated that structural changes in the PEM and cat-alyst layers are the main reasons for the decline in performance duringopen-circuit operation as well. The results also show that degradationdue to Pt oxidation or catalyst contamination can be partially recov-ered by a subsequent potential-cycling process, whereas the same cy-cling process cannot recover the membrane degradation.451 Ionomerdegradation in the catalyst layer and membrane have been assumedto be the cause of performance decline during open-circuit-potentialholds.418,450
Degradation during freeze/thaw testing have also been attributedto catalyst-layer structural changes and associated with the increasedcharge transfer and mass-transfer resistances, especially the internaldiffusion resistance.178,413,425,452 Related are issues of catalyst-layerdelamination, which will impact PEFC performance and transportmodeling. To understand these effects, nascent efforts have focusedon plasticity and mechanics models of the catalyst layer and its com-ponents. The cohesive zone model and the frictional contact modelare used to describe the evolution of interfaces between the protonicand the electronic conducting phases.453
Other catalyst-layer effects include dissolution of alloying mate-rials to make platinum alloy. These alloying materials include othernoble metals (e.g. Pd, Au, Ir), and metals including Ni, Co, Cr, Feetc. The leaching effect of these alloying metals on catalyst-layer
) unless CC License in place (see abstract). ecsdl.org/site/terms_use address. Redistribution subject to ECS terms of use (see 128.240.225.120Downloaded on 2014-09-14 to IP
F1284 Journal of The Electrochemical Society, 161 (12) F1254-F1299 (2014)
structure and transport (e.g., in the ionomer thin-film) remains widelyunknown to date; most studies have concentrated only on the impacton electrocatalyst kinetics.
Future Perspectives
The above sections outline the critical areas of research and thecurrent progress for continuum-scale modeling of transport in PEFCs.Throughout, not only background and current state of the art is dis-cussed, but critical needs to move the field forward are mentioned.In this section, several of those needs are highlighted and discussedfurther. In addition, discussion is made on some underlying critical is-sues for the modeling community including the intersection betweenthe models and experiments, accounted for variations in propertiesand structures, and the use of open-source modeling.
Intersection with Experiments
As noted throughout this review, the modeling efforts depend heav-ily on understanding and elucidating the correct physics driving theobserved phenomena. In addition, models rely on input parametersof the correct properties, and should be validated by both local andglobal cell performance and distributions of variables. We believe thatto advance the art and understanding of transport modeling requiressynergistic efforts in determining effective properties and providingmodel validation through systematic and orthogonal data sets. In otherwords, a model should use independently validated submodels or ex-or in-situ measured properties as input parameters, and then be vali-dated in terms of multiple in-operando observations (e.g., water con-tent, response to operation changes, impedance spectra, polarizationbehavior, etc.), such as that provided at pemfcdata.org. If any fittingparameters are utilized, these should be fit simultaneously to the set ofrelevant experimental data. In this section, some of the key advancesoccurring or needed to occur will be highlighted including measure-ment of effective properties, cell-level studies, and electrochemicalimpedance spectroscopy.
Effective properties.— Recently, there has been a substantial effortto measure directly many of the key transport properties as a func-tion of the various operating conditions such as temperature, pressure,compression, relative humidity, and liquid saturation. Typically, theseare measured ex situ, and care must be taken in translating resultsfor complete layers into the discretized modeling domain as men-tioned in the multiphase section above. In addition, more sophisti-cated techniques are being used to validate in situ measurements thatwere previously accomplished ex situ. For example, recent neutronimaging experiments have confirmed that the measured membranewater content in an operating PEFC is similar to the ex-situ measure-ments reported over two decades ago.34,61,66 Also, in terms of transportproperties, methods have been developed to separate the GDL masstransport from the catalyst-layer transport as well as diffusion mech-anisms by varying inlet gas compositions and temperature and totalpressure.38,325,454–456
Many of the recent studies have focused on multiphase flow anddeveloping diagnostics to measure effective properties as a functionof saturation. For example, one is now using capillary pressure – sat-uration curves that are measured to calibrate pore-network modelsthat then can simulate different structures and be used for parametricstudies, as discussed above. Similarly, there are studies on the perhapsmore important variables of breakthrough pressure457–459 and dropletwettability and adhesion, both internally and externally.156,257,460–464
Also, researchers have begun to characterize how the resulting satura-tion impacts the thermal resistivity. Ex-situ investigations of ther-mal resistance as a function of saturation have shown that thisrelationship can be accurately approximated by an effective ther-mal conductivity.106,465 In terms of oxygen diffusivity, which is akey quantity impacting performance, in-situ characterization hasbeen investigated with AC impedance spectroscopy,466 conductiv-ity cells,41 mercury-intrusion porosimetry,155,467 X-ray computed to-
mography (XCT),42 Loschmidt diffusion cells,43 and electrochemicaltechniques.44 As discussed in the empirical-modeling section, Bakeret al.38 and Caulk et al.45 established a method and analysis usinglimiting-current measurements under dry and oversaturated condi-tions. These limiting current methods and the corresponding analysishave shown that the effective diffusion coefficient follows a charac-teristic behavior. With increasing current density, a dry then a wetplateau is observed for several types of carbon fiber GDLs.
As discussed in the catalyst-layer section, the catalyst layer is theleast characterized of the PEFC components due to the difficulty inmeasuring its properties. Recent work has concentrated on measuringthe properties of the catalyst layers on various polymer, metallic, andnon-metallic substrates. The permeability and porosity of a catalystlayer supported on ethylene tetrafluoroethylene has been determinedand the catalyst porosity measured using traditional mercury-intrusionporosimetry is lower that what would be expected from typical catalystlayers.468 The water uptake in catalyst layers supported on PTFEmembranes has been reported to be lower than that expected frombulk ionomer measurements,157 which directly agree with studies ofionomer thin films as discussed above. The ionic conductivity ofPEFC catalyst layers can be directly measured and modeled using ACimpedance techniques333 and has been found to be ≈ 100 m�cm2 instate of the art Pt/C electrodes,333 which is in conflict with some of thethin-film measurements;300,353,358,469 there is no current agreement.The ionic conductivity is a strong function of the Nafion contentand needs to be optimized for optimal ionic conductivity and gastransport.470,471
Visualization and validation.— The modeling results have tra-ditionally been validated using PEFC performance data, mainly inthe form of polarization curves.23,24 However the insensitivity ofPEFC polarization curves to varying component materials proper-ties and operating conditions makes model validation a challenge.472
To this end, there is a need for validation through comparison of localvariables.
Segmented-cell data has better fidelity than single polarizationcurves. Segmented cells have been utilized extensively as a diagnos-tic tool for PEFC as recently reviewed.14,473 The most widely usedsegmented-cell techniques (commercially available systems) involvesegmenting the current collector and measuring the resultant currentusing printed circuit boards.474–476 There are also several groups thatutilize segmented GDLs and even segmented catalyst layers withcurrent being measured either by resistor networks or Hall-effectsensors.477 In addition to measuring current, some systems allow si-multaneous measurement of cyclic voltammograms and EIS spectrain each of the segments.
Direct visualization of liquid water in PEFCs is an excellent toolfor model validation and significant progress has been made in thepast decade in improving visualization techniques.478,479 These tech-niques include direct optical imaging of specially designed trans-parent PEFCs,480 X-ray radiography234,240 and tomography,481 neu-tron scattering,482 radiography,483,484 and tomography,169 and NMRimaging.485 For catalyst layers, while recent work has demonstratedthat nano X-ray computed tomography can be utilized to measuretheir pore distribution,486 it is challenging to obtain the ionomer.487
Scanning transmission x–ray microscopy (STXM),488 scanning elec-tron microscopy331 and other microscopy techniques are being devel-oped to visualize catalyst-layer structures.487 It should also be notedthat these techniques normally involve image-based reconstructionsof small areas. Thus, there is a need to address the lack of statistic-based variability and the cost/time expense of imaging a sufficientnumber of samples to attain reproducible results, especially for sim-ulations or validation that depend on them. With the current analysistechniques, the simulation cost from a time perspective is still inher-ently prohibitive if sample domains approach the scales seen in realPEFC systems. From a validation standpoint, phase resolution in thediagnostic imaging and the use of phase-differentiated distributiondata would yield a boon in increasing the confidence in the designcapability of these methods.
) unless CC License in place (see abstract). ecsdl.org/site/terms_use address. Redistribution subject to ECS terms of use (see 128.240.225.120Downloaded on 2014-09-14 to IP
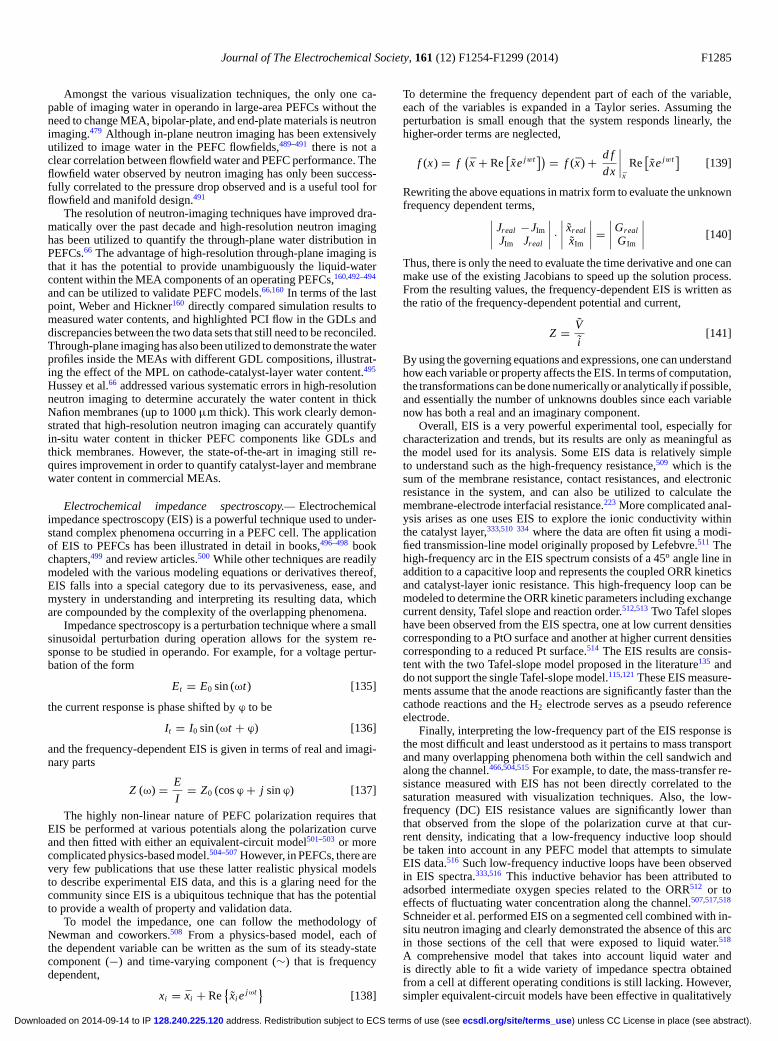
Journal of The Electrochemical Society, 161 (12) F1254-F1299 (2014) F1285
Amongst the various visualization techniques, the only one ca-pable of imaging water in operando in large-area PEFCs without theneed to change MEA, bipolar-plate, and end-plate materials is neutronimaging.479 Although in-plane neutron imaging has been extensivelyutilized to image water in the PEFC flowfields,489–491 there is not aclear correlation between flowfield water and PEFC performance. Theflowfield water observed by neutron imaging has only been success-fully correlated to the pressure drop observed and is a useful tool forflowfield and manifold design.491
The resolution of neutron-imaging techniques have improved dra-matically over the past decade and high-resolution neutron imaginghas been utilized to quantify the through-plane water distribution inPEFCs.66 The advantage of high-resolution through-plane imaging isthat it has the potential to provide unambiguously the liquid-watercontent within the MEA components of an operating PEFCs,160,492–494
and can be utilized to validate PEFC models.66,160 In terms of the lastpoint, Weber and Hickner160 directly compared simulation results tomeasured water contents, and highlighted PCI flow in the GDLs anddiscrepancies between the two data sets that still need to be reconciled.Through-plane imaging has also been utilized to demonstrate the waterprofiles inside the MEAs with different GDL compositions, illustrat-ing the effect of the MPL on cathode-catalyst-layer water content.495
Hussey et al.66 addressed various systematic errors in high-resolutionneutron imaging to determine accurately the water content in thickNafion membranes (up to 1000 μm thick). This work clearly demon-strated that high-resolution neutron imaging can accurately quantifyin-situ water content in thicker PEFC components like GDLs andthick membranes. However, the state-of-the-art in imaging still re-quires improvement in order to quantify catalyst-layer and membranewater content in commercial MEAs.
Electrochemical impedance spectroscopy.— Electrochemicalimpedance spectroscopy (EIS) is a powerful technique used to under-stand complex phenomena occurring in a PEFC cell. The applicationof EIS to PEFCs has been illustrated in detail in books,496–498 bookchapters,499 and review articles.500 While other techniques are readilymodeled with the various modeling equations or derivatives thereof,EIS falls into a special category due to its pervasiveness, ease, andmystery in understanding and interpreting its resulting data, whichare compounded by the complexity of the overlapping phenomena.
Impedance spectroscopy is a perturbation technique where a smallsinusoidal perturbation during operation allows for the system re-sponse to be studied in operando. For example, for a voltage pertur-bation of the form
Et = E0 sin (ωt) [135]
the current response is phase shifted by ϕ to be
It = I0 sin (ωt + ϕ) [136]
and the frequency-dependent EIS is given in terms of real and imagi-nary parts
Z (ω) = E
I= Z0 (cos ϕ + j sin ϕ) [137]
The highly non-linear nature of PEFC polarization requires thatEIS be performed at various potentials along the polarization curveand then fitted with either an equivalent-circuit model501–503 or morecomplicated physics-based model.504–507 However, in PEFCs, there arevery few publications that use these latter realistic physical modelsto describe experimental EIS data, and this is a glaring need for thecommunity since EIS is a ubiquitous technique that has the potentialto provide a wealth of property and validation data.
To model the impedance, one can follow the methodology ofNewman and coworkers.508 From a physics-based model, each ofthe dependent variable can be written as the sum of its steady-statecomponent (−) and time-varying component (∼) that is frequencydependent,
xi = xi + Re{
xi ejωt}
[138]
To determine the frequency dependent part of each of the variable,each of the variables is expanded in a Taylor series. Assuming theperturbation is small enough that the system responds linearly, thehigher-order terms are neglected,
f (x) = f(x + Re
[xe jwt
]) = f (x) + d f
dx
∣∣∣∣x
Re[xe jwt
][139]
Rewriting the above equations in matrix form to evaluate the unknownfrequency dependent terms,∣∣∣∣ Jreal −JIm
JIm Jreal
∣∣∣∣ ·∣∣∣∣ xreal
xIm
∣∣∣∣ =∣∣∣∣Greal
GIm
∣∣∣∣ [140]
Thus, there is only the need to evaluate the time derivative and one canmake use of the existing Jacobians to speed up the solution process.From the resulting values, the frequency-dependent EIS is written asthe ratio of the frequency-dependent potential and current,
Z = V
i[141]
By using the governing equations and expressions, one can understandhow each variable or property affects the EIS. In terms of computation,the transformations can be done numerically or analytically if possible,and essentially the number of unknowns doubles since each variablenow has both a real and an imaginary component.
Overall, EIS is a very powerful experimental tool, especially forcharacterization and trends, but its results are only as meaningful asthe model used for its analysis. Some EIS data is relatively simpleto understand such as the high-frequency resistance,509 which is thesum of the membrane resistance, contact resistances, and electronicresistance in the system, and can also be utilized to calculate themembrane-electrode interfacial resistance.223 More complicated anal-ysis arises as one uses EIS to explore the ionic conductivity withinthe catalyst layer,333,510 334 where the data are often fit using a modi-fied transmission-line model originally proposed by Lefebvre.511 Thehigh-frequency arc in the EIS spectrum consists of a 45o angle line inaddition to a capacitive loop and represents the coupled ORR kineticsand catalyst-layer ionic resistance. This high-frequency loop can bemodeled to determine the ORR kinetic parameters including exchangecurrent density, Tafel slope and reaction order.512,513 Two Tafel slopeshave been observed from the EIS spectra, one at low current densitiescorresponding to a PtO surface and another at higher current densitiescorresponding to a reduced Pt surface.514 The EIS results are consis-tent with the two Tafel-slope model proposed in the literature135 anddo not support the single Tafel-slope model.115,121 These EIS measure-ments assume that the anode reactions are significantly faster than thecathode reactions and the H2 electrode serves as a pseudo referenceelectrode.
Finally, interpreting the low-frequency part of the EIS response isthe most difficult and least understood as it pertains to mass transportand many overlapping phenomena both within the cell sandwich andalong the channel.466,504,515 For example, to date, the mass-transfer re-sistance measured with EIS has not been directly correlated to thesaturation measured with visualization techniques. Also, the low-frequency (DC) EIS resistance values are significantly lower thanthat observed from the slope of the polarization curve at that cur-rent density, indicating that a low-frequency inductive loop shouldbe taken into account in any PEFC model that attempts to simulateEIS data.516 Such low-frequency inductive loops have been observedin EIS spectra.333,516 This inductive behavior has been attributed toadsorbed intermediate oxygen species related to the ORR512 or toeffects of fluctuating water concentration along the channel.507,517,518
Schneider et al. performed EIS on a segmented cell combined with in-situ neutron imaging and clearly demonstrated the absence of this arcin those sections of the cell that were exposed to liquid water.518
A comprehensive model that takes into account liquid water andis directly able to fit a wide variety of impedance spectra obtainedfrom a cell at different operating conditions is still lacking. However,simpler equivalent-circuit models have been effective in qualitatively
) unless CC License in place (see abstract). ecsdl.org/site/terms_use address. Redistribution subject to ECS terms of use (see 128.240.225.120Downloaded on 2014-09-14 to IP
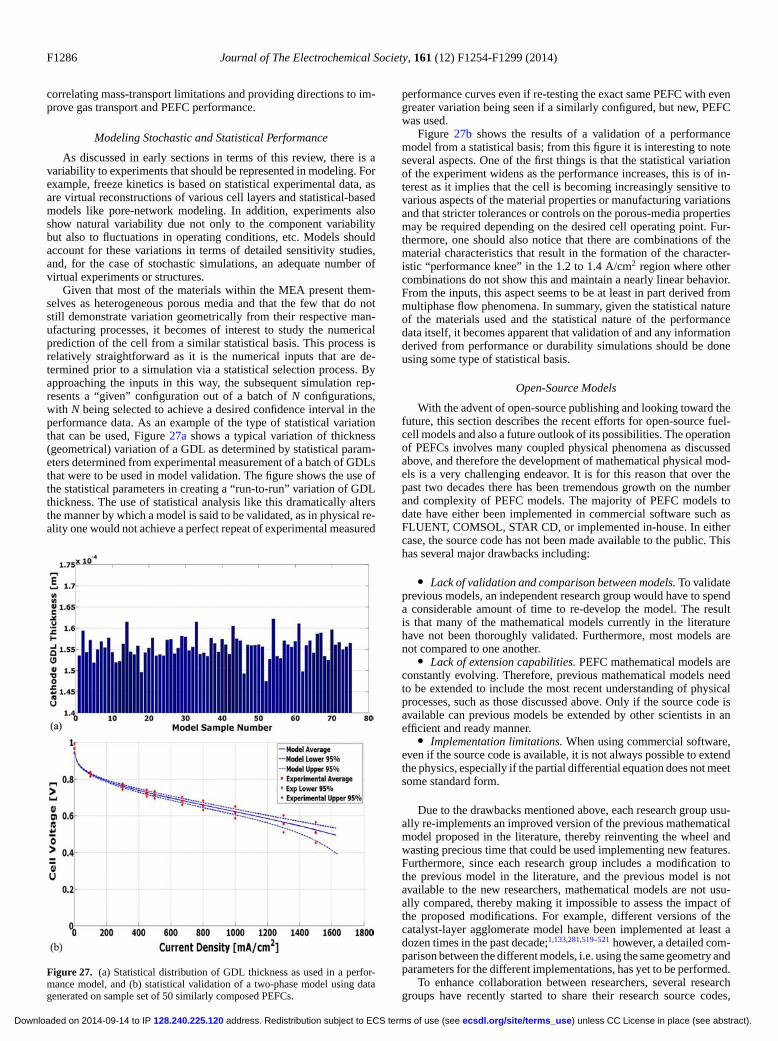
F1286 Journal of The Electrochemical Society, 161 (12) F1254-F1299 (2014)
correlating mass-transport limitations and providing directions to im-prove gas transport and PEFC performance.
Modeling Stochastic and Statistical Performance
As discussed in early sections in terms of this review, there is avariability to experiments that should be represented in modeling. Forexample, freeze kinetics is based on statistical experimental data, asare virtual reconstructions of various cell layers and statistical-basedmodels like pore-network modeling. In addition, experiments alsoshow natural variability due not only to the component variabilitybut also to fluctuations in operating conditions, etc. Models shouldaccount for these variations in terms of detailed sensitivity studies,and, for the case of stochastic simulations, an adequate number ofvirtual experiments or structures.
Given that most of the materials within the MEA present them-selves as heterogeneous porous media and that the few that do notstill demonstrate variation geometrically from their respective man-ufacturing processes, it becomes of interest to study the numericalprediction of the cell from a similar statistical basis. This process isrelatively straightforward as it is the numerical inputs that are de-termined prior to a simulation via a statistical selection process. Byapproaching the inputs in this way, the subsequent simulation rep-resents a “given” configuration out of a batch of N configurations,with N being selected to achieve a desired confidence interval in theperformance data. As an example of the type of statistical variationthat can be used, Figure 27a shows a typical variation of thickness(geometrical) variation of a GDL as determined by statistical param-eters determined from experimental measurement of a batch of GDLsthat were to be used in model validation. The figure shows the use ofthe statistical parameters in creating a “run-to-run” variation of GDLthickness. The use of statistical analysis like this dramatically altersthe manner by which a model is said to be validated, as in physical re-ality one would not achieve a perfect repeat of experimental measured
Figure 27. (a) Statistical distribution of GDL thickness as used in a perfor-mance model, and (b) statistical validation of a two-phase model using datagenerated on sample set of 50 similarly composed PEFCs.
performance curves even if re-testing the exact same PEFC with evengreater variation being seen if a similarly configured, but new, PEFCwas used.
Figure 27b shows the results of a validation of a performancemodel from a statistical basis; from this figure it is interesting to noteseveral aspects. One of the first things is that the statistical variationof the experiment widens as the performance increases, this is of in-terest as it implies that the cell is becoming increasingly sensitive tovarious aspects of the material properties or manufacturing variationsand that stricter tolerances or controls on the porous-media propertiesmay be required depending on the desired cell operating point. Fur-thermore, one should also notice that there are combinations of thematerial characteristics that result in the formation of the character-istic “performance knee” in the 1.2 to 1.4 A/cm2 region where othercombinations do not show this and maintain a nearly linear behavior.From the inputs, this aspect seems to be at least in part derived frommultiphase flow phenomena. In summary, given the statistical natureof the materials used and the statistical nature of the performancedata itself, it becomes apparent that validation of and any informationderived from performance or durability simulations should be doneusing some type of statistical basis.
Open-Source Models
With the advent of open-source publishing and looking toward thefuture, this section describes the recent efforts for open-source fuel-cell models and also a future outlook of its possibilities. The operationof PEFCs involves many coupled physical phenomena as discussedabove, and therefore the development of mathematical physical mod-els is a very challenging endeavor. It is for this reason that over thepast two decades there has been tremendous growth on the numberand complexity of PEFC models. The majority of PEFC models todate have either been implemented in commercial software such asFLUENT, COMSOL, STAR CD, or implemented in-house. In eithercase, the source code has not been made available to the public. Thishas several major drawbacks including:
� Lack of validation and comparison between models. To validateprevious models, an independent research group would have to spenda considerable amount of time to re-develop the model. The resultis that many of the mathematical models currently in the literaturehave not been thoroughly validated. Furthermore, most models arenot compared to one another.
� Lack of extension capabilities. PEFC mathematical models areconstantly evolving. Therefore, previous mathematical models needto be extended to include the most recent understanding of physicalprocesses, such as those discussed above. Only if the source code isavailable can previous models be extended by other scientists in anefficient and ready manner.
� Implementation limitations. When using commercial software,even if the source code is available, it is not always possible to extendthe physics, especially if the partial differential equation does not meetsome standard form.
Due to the drawbacks mentioned above, each research group usu-ally re-implements an improved version of the previous mathematicalmodel proposed in the literature, thereby reinventing the wheel andwasting precious time that could be used implementing new features.Furthermore, since each research group includes a modification tothe previous model in the literature, and the previous model is notavailable to the new researchers, mathematical models are not usu-ally compared, thereby making it impossible to assess the impact ofthe proposed modifications. For example, different versions of thecatalyst-layer agglomerate model have been implemented at least adozen times in the past decade;1,133,281,519–521 however, a detailed com-parison between the different models, i.e. using the same geometry andparameters for the different implementations, has yet to be performed.
To enhance collaboration between researchers, several researchgroups have recently started to share their research source codes,
) unless CC License in place (see abstract). ecsdl.org/site/terms_use address. Redistribution subject to ECS terms of use (see 128.240.225.120Downloaded on 2014-09-14 to IP

Journal of The Electrochemical Society, 161 (12) F1254-F1299 (2014) F1287
which is believed to be a key future issue/opportunity. To date, there arethree known main open-source packages in the literature, i.e. the codedeveloped by Novaresio et al.,522 openFuelCell,523 and openFCST.524
The first two codes focus on solid-oxide fuel cells (SOFCs). The latterfocuses on PEFCs and currently contains cathode,279 anode,224 andMEA models and is capable of solving mass and charge transportusing Fick’s law, Ohm’s law, and water transport in the membrane.The code can be used for PEFC analysis, parameter estimation,525 andoptimization.526,527 Furthermore, the former two codes are based onthe openFOAM finite volume libraries338 while the latter is based onthe deal.II finite element libraries .528
The main advantages of developing, sharing and using open-sourcecodes can be summarized as:
� Transparency. Researchers can provide the source code and datafiles with their articles so that other scientists can verify their results
� Ease to develop new routines by using already existingclasses/functions
� Ease to share new developments with the fuel-cell community� Ease of integration. It is easy to integrate new mathematical
models with already existing models in order to develop complex,multi-dimensional fuel cell simulations within a short timeframe
� Easy to validate and compare to previous models� New models can easily be compared to previously imple-
mented models under the same architecture.� If a large user base is established, there will be a large number
of testers. This would make bugs in the code easy to find.� It is easy to track and fix bugs. For example, both openFCST
and openFuelCell have a ticketing system so that users can submitbugs that were found in the code.� Ease of integration with other programs. For example, all the
open source codes discussed above are integrated with other open-source packages and algorithms such as openFOAM, Trilinos, deal.II,and Dakota.341
The three open-source packages mentioned above were releasedin 2012 and 2013; therefore, at this point, none of the packages have alarge user base. Part of the reason for the slow uptake of open-sourcecodes is that they require a steeper learning curve than commercialsoftware. In the case of in-house codes, the learning curve is worsethan open-source packages since most open-source packages provideextensive documentation, e.g., openFCST contains a user guide, adeveloper guide and a class list reference guide in HTML.524 Thekey disadvantages of most open-source codes are no graphical userinterface and a necessary knowledge of Linux OS and a program-ming language (preferably an object-oriented language, e.g. C++ orpython). To reduce the steep learning curve, most open-source codeshave extensive documentation, a mailing list that is used to help newusers get started, and many examples.
Due to the advantages of sharing and working together on codes, itis believed that the fuel-cell scientific community could benefit froman open-source framework. The new routines developed by users canbe integrated with the current open-source packages thereby leadingto the required level of sophistication needed in order to increase ourunderstanding of the physical processes taking place in PEFCs. Toovercome the key disadvantages of most open-source packages is tohold trainings and get a buy-in from the community in order to gen-erate a large enough user base. One possible mechanism might be theformation of a clearinghouse where codes can be developed, validated,and enhanced. In this fashion, the main contributing institutions couldhost a welcome page, the main repository, testing site, and mailing listthat all developers submit questions and bugs to in order to ensure alarge user base and subsequent quick response times and discussions.In addition, comparison of the simulation results to standard data setssuch as the provided at pemfcdata.org using consistent and standardinput parameters can provide insights and useful measures of oper-ating ranges and need for better models in terms of properties andphenomena.
As discussed throughout this review, although there are some con-tentious issues, most of the PEFC physics is becoming standardized.In addition, most PEFC codes are implemented with either a finite-volume or a finite-element analysis library already as a backbone, andthus transitioning to open source may not be too problematic. Whilefull open source is perhaps a good end goal, an intermediate goal ofuse of a common commercial software package and sharing of themodel files could also be a means to bring together the communityto build around a single model set. This would not be as easy tomodify as open-source code, but it would allow for greater accessi-bility of the simulations to the larger fuel-cell community, which in-clude the casual modeler. This also alleviates the steep learning curvefor open-source codes, especially if the community also provides in-put into the methods to make the commercial package converge andsolve.
Summary and Outlook
Modeling of polymer-electrolyte fuel cells (PEFCs) has advancedsignificantly over the last couple of decades, where the simultaneousadvent of increased computational power and diagnostic techniqueshave allowed much greater predictability, complexity, and usefulnessof the models. Today, design and optimization strategies can be com-putationally explored with high fidelity and confidence. This criticalreview has focused on examining these advancements as they relateto modeling of transport phenomena in PEFCs. Throughout, we havediscussed the governing phenomena and equations while highlight-ing the needs and gaps. Of particular focus are issues surroundingmultiphase flow and catalyst layers. For the former, there are stillunknowns in terms of the correct treatment of interfaces, and, in par-ticular, that with the GDL/gas channel. These interfaces are seen assignificantly influencing the overall transport and cell behavior. Theland-to-GDL interface is characterized by relatively high ohmic andthermal resistance in conventional channel|land designs, and a loca-tion for accumulation of condensing vapor drawn by PCI flow. Thechannel wall-to-diffusion medium interface has been demonstrated tobe a key factor in the retention of water in the DM and cell. The shapeand surface condition is important to draw water out of the DM andprevent flooding in the DM. The GDL/MPL interface is a region thathas so far been studied the least, with properties that are influencedby the manufacturing method and degree of co-mingling of the layermaterial. Particularly at the micrometer-scale, more work needs tobe done to improve our overall understanding of the interfaces, sothat all relevant effects can be included in state-of-the-art multiphasemodels.
For catalyst layers, there is a need to correlate better the phenom-ena at the local scale where ionomer thin-films or lack thereof impactperformance with the phenomena at the macroscale and thus be pre-dictive. For example, due to the heterogeneous porous structure of thecatalyst layer, it is important to establish accurate correlations betweenthe catalyst-layer ionomer and thin-films of ionomer on substrates. Itis particularly critical to understand how catalyst-layer properties in-cluding, but not limited to, ionomer content, I/C loading, Pt loading,porosity could be studied in thin-film model systems using parame-ters such as film thickness, substrate/film interactions, film casting andprocessing. Similarly, one needs to understand how processing con-ditions, such as hot pressing, can impact overall transport propertiesand behavior of the ionomer and catalyst layer.
As discussed throughout, there is still a need to link the macro-scopic observables and equations with those at smaller length scales inorder to provide a truly representative simulation. While such linkagesare typically accomplished by transfer of properties, adaptive mech-anisms and bidirectional coupling and multiscaling provide still newopportunities and challenges for modeling transport in PEFCs. Virtualor image reconstructions may allow for such a route, but there is stilla need for better resolution and more knowledge of the interrelatedconditions and formation rules, especially for catalyst layers.
Other transport modeling challenges remain. For example, oneneeds to understand the sensitivity of the various input parameters
) unless CC License in place (see abstract). ecsdl.org/site/terms_use address. Redistribution subject to ECS terms of use (see 128.240.225.120Downloaded on 2014-09-14 to IP
F1288 Journal of The Electrochemical Society, 161 (12) F1254-F1299 (2014)
(e.g., transport properties) whether they come from experiment orlower-scale models. By knowing the sensitivity, we can see how thatmatches with experimental results and also provide direction to futureactivities and research areas. Similarly, this can help to link the mod-eling results with real-world results in which the systems are muchmore dynamic with nonuniform properties and stressors. Similarly,one needs to analyze and understand the impact of defects and signifi-cant spatial variation in properties that can impact overall performanceand durability. This is something that has only minimally been studiedin the modeling literature.529,530
In the same fashion, in order to accelerate the components devel-opment it is necessary to correlate the measurable properties to theperformance effect on a PEFC over its lifetime. This is a place wheremodeling has a possible significant role to play, since experimentsrequire substantial times to enact. Also, the use of accelerated stresstests and their applicability to real-world and in-operando conditionscan be correlated through validated cell models. The issue of lifetimepredictions dovetails into that of durability modeling, where there issubstantial room for improvement and understanding. While there aresome degradation specific models for phenomena as discussed such ascatalyst dissolution, a majority of models just alter their transport orrelated (e.g., water-uptake isotherm or capillary pressure – saturationrelationship) properties as a function of time. This method is similar tothe use of a fitting parameter with time, and more in-depth modelingand knowledge of degradation phenomena are required to increase theusefulness of macroscopic modeling for durability as it is already forperformance.
Overall, significant progress has been made and consensus is be-ing reached for the general treatments and governing equations formodeling transport phenomena in PEFCs. However, as highlighted inthis critical review, there are still some significant issues that requiremore research and understanding. As modeling becomes more com-mon, there is a need to ensure that the proper physics is elucidatedand considered, and new modeling methodologies, treatments, andemphasis guided to the key issues.
Acknowledgments
This review has stemmed out of various discussions within andamong the members and meetings of the Transport Modeling Work-ing Group of the U.S. Department of Energy, Energy Efficiency andRenewable Energy, Fuel Cell Technologies Office. We thank the pro-gram manager Dimitrios Papageorgopoulos for his support, and thefinancial support of that office to LBNL under contract No. DE-AC02–05CH11231. In addition, we thank those that helped to form thismanuscript including Jeff Allen, Sirivatch Shimpalee, and John VanZee. Finally, we thank the reviewers for their helpful guidance andinput, Thomas Fuller, John Weidner, and JES for their support, en-couragement, and guidance in writing this critical review.
List of Symbols
aiα activity of species i in phase α
ak,p interfacial surface area between phases k and p per unitvolume, 1/cm
ao1,2 interfacial area between the electronically conducting and
membrane phases with no flooding, 1/cmafilm specific surface-area of the film, 1/cmAagg specific external surface area of the agglomerate, 1/cmApore cross-sectional area of pore, cm2
APt reactive surface area of platinum, cm2/gb Tafel slope, Vci,k interstitial concentration of species i in phase k, mol/cm3
cPt2+ the concentration of Pt2+ in perchloric-acid solution,mol/cm3
cT total solution concentration or molar density, mol/cm3
C pk heat capacity of phase k, J/g-KCd differential double-layer capacitance, and diffuse layer ca-
pacitance, F/cm2
CH Stern layer capacity, F/cm2
D the droplet diameter at its maximum, cmdi driving force per unit volume acting on species i in phase
k, J/cm4
dp particle-size, cmdw wetted diameter, cmDi Fickian diffusion coefficient of species i in a mixture in
phase k, cm2/sDS capillary diffusivity, cm2/sDi,j diffusion coefficient of i in j, cm2/sDKi Knudsen diffusion coefficient of species i, cm2/sE effectiveness factorEt voltage signal in EIS, Vfr,k the fraction of total distribution made up of distribution kF Faraday’s constant, 96487 C/equivFa adhesion or surface-tension force, NFp pressure force, NFs shear force acting on the froplet, NFg gravitational force, Ng acceleration due to gravity, cm/s2
�G Gibbs free energy of reaction l, J/molh droplet height, cmhk,p heat-transfer coefficient between phases k and p, J/cm2s-KH channel height, cm, and Henry’s constantHf
i heat of formation of species i, J/molHi,k partial molar enthalpy of species i in phase k, J/molHi,j Henry’s constant for species i in component j, mol/cm3kPa�Hl heat or enthalpy of reaction l, J/mol�H f heat of fusion of ice, J/moli current density, A/cm2
ik current density in phase k, A/cm2
i0h exchange current density for reaction h, A/cm2
ih,k-p transfer current density of reaction h per interfacial areabetween phases k and p, A/cm2
ilim limiting current density, A/cm2
I steady-state current component in EIS, AIt time-varying current component in EIS, AIt current signal in EIS, AJi,k flux density of species i in phase k relative the mass-average
velocity of phase k, mol/cm2sJ(s) Leverett J-functionJ (T ) pseudo-steady-state nucleation rate, 1/m3sk effective hydraulic permeability, cm2
k′ ORR rate constant, 1/sk* ORR rate constant, cm/skevap evaporation rate constant, mol/cm2skf rate constant for ice formation, mol/cm2skO2, f ilm rate constant for oxygen dissolution, mol/cm2skTk thermal conductivity of phase k, J/cm2Kkr relative hydraulic permeabilitykmt mass-transfer coefficient, mol/cm2sksat saturated hydraulic permeability, cm2
k� electrokinetic permeability, cm2
Ki,j frictional interaction parameter between species i and j,Ns/cm4
l length of the pore between nodes i and j, cmL catalyst layer thickness, cmm parameter in polarization equationmPt loading of platinum, g/cm2
Mi molecular weight of species i, g/molMzi
i symbol for the chemical formula of species i in phase khaving charge Zi
n parameter in 0-D model equation for polarization curvenh number of electrons transferred in electrode reaction hnH+ the centerline number density of ions, 1/m3
Ni,k superficial flux density of species i in phase k, mol/cm2sNN ,H+ the density of charge droups within membrane, 1/m3
pvap0 saturation vapor pressure, kPa
pvap0,o uncorrected vapor pressure of water, which is function of
temperature, kPa
) unless CC License in place (see abstract). ecsdl.org/site/terms_use address. Redistribution subject to ECS terms of use (see 128.240.225.120Downloaded on 2014-09-14 to IP
Journal of The Electrochemical Society, 161 (12) F1254-F1299 (2014) F1289
pi partial pressure of species i, kPa�pi j pressure acting across the pore between nodes i and j, kPapc capillary pressure, kPapCi j capillary pressure in the pore when multiple phases are
present, kPapk total pressure of phase k, kPapO2,i/g the equivalent pressure within the ionomer at the interface
with gas, kPapvap
w vapor pressure of water, kPaPZC potential of zero charge, Vqk superficial heat flux through phase k, J/cm2sq charge in the double layer, C/cm2
qw,pore volumetric flowrate of water cm3/sQ total amount of heat generated, J/cm2sQk-p heat flux transferred between phases k and p, J/cm3sr pore radius, cmragg radius of agglomerate, cmrc critical pore radius, cmrij radius of cylindrical pore between nodes i and j, cmri average pore radius around the node i, cmrevap rate of evaporation, mol/cm3sro,k characteristic pore size, cmRl,k-p rate of reaction l per unit of interfacial area between phases
k and p, mol/cm2sR ideal-gas constant, 8.3143 J/mol-KRagg agglomerate radius, cmRg,k rate of homogenous reaction g in phase k, mol/cm3sRi,j resistance of resistor i,j, � cm2
Ri/j mass ratio between species i and jRI ice-crystallization rate, mol/cm2sRi rate of ice formation, mol/cm2sR′ total ohmic resistance, � cm2
RO2, f ilm transport resistance of oxygen through ionomer film,s/cm
Re { } the real portion of time-dependent current in EISi,k total rate of reaction of species i in phase k, mol/cm3ssi,k,l stoichiometric coefficient of species i in phase k partici-
pating in reaction lsk spread of distribution kS liquid saturationS* pore-size distributionSe effective saturationSi,k molar entropy of species i in phase k, J/mol-KSL equilibrium liquid saturationSm other sources of momentum in Navier-Stockes equations,
N/cm3
�Sh entropy of reaction h, J/mol-KSr residual saturationt time, sT absolute temperature, KT c number-average crystallization temperature, KTF P D the amount of freezing-point depression, KTk absolute temperature of phase k, KTm melting (freezing) temperature for bulk water, Kui mobility of species i in phase k, cm2mol/J-sUh reversible cell potential of reaction h, VU′ potential intercept for a polarization equation, VU θ
h standard potential of reaction h, for oxygen reduction,1.229 V at 25◦C
UHh enthalpy potential,vk superficial mass-averaged velocity of phase k, cm/sv∗
k superficial molar-averaged velocity of phase k, cm/svw,pore water velocity in cylindrical pore, cm/s〈v〉 average flow velocity in the channel, cm/sV cell potential, V and droplet volume, cm3
Vi (partial) molar volume of species i, cm3/molW diff
O2molar flow rate of oxygen to the agglomerate, mol/cm3s
x distance across the flow field, cmxi,k mole fraction of species i in phase k
y distance along the flow-field channel, cmz distance across the cell sandwich, cmzi valence or charge number of species iZ (ω) frequency-dependent, resistance in EIS, �
Greek
αa anodic transfer coefficientαc cathodic transfer coefficientαL liquid thermal diffusivity, m2/sαw water transport coefficient, mol2/J-cm-sβ net water flux per proton flux through the membrane, and
is the heating rate, K/minγ surface tension, N/cmδfilm ionomer film thickness, cmδn diffusion length or thickness of region n, cmζ characteristic length, cmθo,n characteristic contact angle of distribution n�PtO coverage of Pt oxideθs the sliding angleεk volume fraction of phase kεo bulk porosityνk kinematic viscosity of phase k, cm2/sξ electroosmotic coefficient�h Peltier coefficient for charge-transfer reaction h, Vρk density of phase k, g/cm3
σn deviation of distribution nσo standard conductivity in the electronically conducting
phase, S/cmηh,k-p electrode overpotential of reaction h between phases k and
p, Vη* dimensionless overpotentialηo(T ) dimensionless temperature-dependent growth parameterηO H P local reaction overpotential, Vθ contact angle, degreesκ conductivity of the ionically conducting phase, S/cmλ moles of water per mole of sulfonic acid sitesλL relative mobility of the liquid phaseμ viscosity, Pa-sμeff
i j effective viscosity within a pore between nodes i and j,kPa-s
μi (electro)chemical potential of species i, J/molμnw non-wetting fluid viscosity, kPa-sμw wetting fluid viscosity, kPa-sμα
i electrochemical potential of species i in phase α, J/molτ stress tensor, kPaτi a limiting stochastic induction time, sτk tortuosity of phase kφ Thiele modulus, and gas-free volume fraction of ice within
the pores,ϕ phase shift of response in impedance�k electrostatic potential of phase k, Vψ Dimensionless propertyψi Permeation coefficient of species i, mol/bar · cm · s�(θ) the contact angle distributionω energy parameter for oxide adsorption, J/mol, and fre-
quency of sinusoidal signal, 1/s
Subscripts/Superscripts
1 electronically conducting phase2 ionically conducting phaseagg agglomerateCL catalyst layerCOR carbon oxidation reactionDON Donnaneff effective value, corrected for tortuosity and porosityext external to the control volumef fixed ionic site in the membrane
) unless CC License in place (see abstract). ecsdl.org/site/terms_use address. Redistribution subject to ECS terms of use (see 128.240.225.120Downloaded on 2014-09-14 to IP
F1290 Journal of The Electrochemical Society, 161 (12) F1254-F1299 (2014)
film film covering the agglomerateg homogeneous reaction numberG gas phaseh electron-transfer reaction numberH Stern or Helmholtz planeHOR hydrogen-oxidation reactioni generic speciesice ice portion in the poresj generic speciesk generic phasel heterogeneous reaction numberL liquid phasem mixtureOHP outer Helmholtz planeORR oxygen-reduction reactionp generic phasepore cylindrical porePtO Pt oxideref parameter evaluated at the reference conditionss solid phasesw water∞ bulk
References
1. A. Z. Weber and J. Newman, “Modeling transport in polymer-electrolyte fuel cells,”Chem Rev, 104, 4679 (2004).
2. C. Y. Wang, “Fundamental models for fuel cell engineering,” Chem Rev, 104, 4727(2004).
3. W. Q. Tao, C. H. Min, X. L. Liu, Y. L. He, B. H. Yin, and W. Jiang, “Parametersensitivity examination and discussion of PEM fuel cell simulation model validationPart I. Current status of modeling research and model development,” Journal ofPower Sources, 160, 359 (2006).
4. N. Djilali, “Computational modelling of polymer electrolyte membrane (PEM) fuelcells: Challenges and opportunities,” Energy, 32, 269 (2007).
5. H. Meng and B. Ruan, “Numerical studies of cold-start phenomena in PEM fuelcells: A review,” International Journal of Energy Research, 35, 2 (2011).
6. Y. Wang, K. S. Chen, J. Mishler, S. C. Cho, and X. C. Adroher, “A review ofpolymer electrolyte membrane fuel cells: Technology, applications, and needs onfundamental research,” Applied Energy, 88, 981 (2011).
7. M. Secanell, J. Wishart, and P. Dobson, “Computational design and optimization offuel cells and fuel cell systems: A review,” Journal of Power Sources, 196, 3690(2011).
8. M. P. Rodgers, L. J. Bonville, H. R. Kunz, D. K. Slattery, and J. M. Fenton, “FuelCell Perfluorinated Sulfonic Acid Membrane Degradation Correlating AcceleratedStress Testing and Lifetime,” Chem Rev, 112, 6075 (2012).
9. R. Borup, J. Meyers, B. Pivovar, Y. S. Kim, R. Mukundan, N. Garland, D. Myers,M. Wilson, F. Garzon, D. Wood, P. Zelenay, K. More, K. Stroh, T. Zawodzinski,J. Boncella, J. E. McGrath, M. Inaba, K. Miyatake, M. Hori, K. Ota, Z. Ogumi,S. Miyata, A. Nishikata, Z. Siroma, Y. Uchimoto, K. Yasuda, K. I. Kimijima, andN. Iwashita, “Scientific aspects of polymer electrolyte fuel cell durability and degra-dation,” Chem Rev, 107, 3904 (2007).
10. X. Cheng, Z. Shi, N. Glass, L. Zhang, J. J. Zhang, D. T. Song, Z. S. Liu, H. J. Wang,and J. Shen, “A review of PEM hydrogen fuel cell contamination: Impacts, mecha-nisms, and mitigation,” Journal of Power Sources, 165, 739 (2007).
11. M. Eikerling, A. A. Kornyshev, and A. R. Kucernak, “Water in polymer electrolytefuel cells: Friend or foe?,” Physics Today, 59, 38 (2006).
12. H. A. Gasteiger and M. F. Mathias, in Proton Conducting Membrane Fuel Cells III,J. W. Van Zee, T. F. Fuller, S. Gottesfeld, and M. Murthy Editors, The Electrochem-ical Society Proceeding Series, Pennington, NJ (2002).
13. K. A. Mauritz and R. B. Moore, “State of understanding of Nafion,” Chem Rev, 104,4535 (2004).
14. L. C. Perez, L. Brandao, J. M. Sousa, and A. Mendes, “Segmented polymer elec-trolyte membrane fuel cells—A review,” Renewable and Sustainable Energy Re-views, 15, 169 (2011).
15. J. C. Amphlett, R. M. Baumert, R. F. Mann, B. A. Peppley, P. R. Roberge, andT. J. Harris, “Performance Modeling of the Ballard-Mark-Iv Sold Polymer Elec-trolyte Fuel-Cell .2. Empirical-Model Development,” Journal of the Electrochemi-cal Society, 142, 9 (1995).
16. D. R. Sena, E. A. Ticianelli, V. A. Paganin, and E. R. Gonzalez, “Effect of watertransport in a PEFC at low temperatures operating with dry hydrogen,” Journal ofElectroanalytical Chemistry, 477, 164 (1999).
17. A. Parthasarathy, S. Srinivasan, A. J. Appleby, and C. R. Martin, “TemperatureDependence of the Electrode Kinetics of Oxygen Reduction at the Platinum/NafionInterface–A Microelectrode Investigation,” Journal of the Electrochemical Society,139, 2530 (1992).
18. A. Parthasarathy, S. Srinivasan, A. J. Appleby, and C. R. Martin, “Pressure-Dependence of the Oxygen Reduction Reaction at the Platinum Microelectrode
Nafion Interface - Electrode-Kinetics and Mass-Transport,” Journal of the Electro-chemical Society, 139, 2856 (1992).
19. R. Mosdale and S. Srinivasan, “Analysis of Performance and of Water and ThermalManagement in Proton Exchange Fuel Cells,” Electrochimica Acta, 40, 413 (1995).
20. P. D. Beattie, V. I. Basura, and S. Holdcroft, “Temperature and pressure dependenceof O2 reduction at Pt | Nafion 117 and Pt | BAM 407 interfaces,” Journal ofElectroanalytical Chemistry, 468, 180 (1999).
21. S. J. Lee, S. Mukerjee, J. McBreen, Y. W. Rho, Y. T. Kho, and T. H. Lee, “Effects ofNafion impregnation on performances of PEMFC electrodes,” Electrochimica Acta,43, 3693 (1998).
22. H. A. Liebhafsky, E. J. Cairns, W. T. Grubb, and L. W. Niedrach, in Fuel CellSystems, G. J. Young and H. R. Linden Editors, p. 116, (American Chemical Society,Washington, DC, 1965).
23. D. M. Bernardi and M. W. Verbrugge, “A Mathematical Model of the Solid-Polymer-Electrolyte Fuel Cell,” Journal of The Electrochemical Society, 139, 2477(1992).
24. T. E. Springer, T. A. Zawodzinski, and S. Gottesfeld, “Polymer Electrolyte FuelCell Model,” Journal of the Electrochemical Society, 138, 2334 (1991).
25. A. Z. Weber, “Gas-Crossover and Membrane-Pinhole Effects in Polymer-Electrolyte Fuel Cells,” Journal of the Electrochemical Society, 155, B521(2008).
26. H. A. Gasteiger, W. Gu, R. Makharia, M. F. Mathias, and B. Sompalli, Handbookof Fuel Cells: Fundamentals, Technology and Applications (John Wiley & Sons,2003).
27. D. R. B. W. Gu, Y. Liu, and H. A. Gastieger, Handbook of Fuel Cells: Fundamentals,Technology, Applications (John Wiley & Sons, 2009).
28. M. M. Mench, Fuel Cell Engines (Wiley, New York, 2008).29. A. Z. Weber and J. Newman, “Coupled Thermal and Water Management in Poly-
mer Electrolyte Fuel Cells,” Journal of the Electrochemical Society, 153, A2205(2006).
30. J. R. M. Mathias, J. Fleming, and W. Lehnert, Handbook of Fuel Cells: Fundamen-tals, Technology, Applications (John Wiley & Sons, 2003).
31. A. El-Kharouf, T. J. Mason, D. J. L. Brett, and B. G. Pollet, “Ex-situ characterisationof gas diffusion layers for proton exchange membrane fuel cells,” Journal of PowerSources, 218, 393 (2012).
32. Y. Liu, M. W. Murphy, D. R. Baker, W. Gu, C. Ji, J. Jorne, and H. A. Gasteiger,in 7th Symposium Devoted to Proton Exchange Membrane Fuel Cells - 212th ECSMeeting, p. 473, Washington, DC (2007).
33. R. Jiang, C. K. Mittelsteadt, and C. S. Gittleman, “Through-plane proton transportresistance of membrane and ohmic resistance distribution in fuel cells,” Journal ofthe Electrochemical Society, 156, B1440 (2009).
34. T. A. Zawodzinski, C. Derouin, S. Radzinski, R. J. Sherman, V. T. Smith,T. E. Springer, and S. Gottesfeld, “Water-Uptake by and Transport throughNafion(R) 117 Membranes,” Journal of the Electrochemical Society, 140, 1041(1993).
35. K. C. Neyerlin, W. Gu, J. Jorne, A. Clark Jr., and H. A. Gasteiger, “Cathode catalystutilization for the ORR in a PEMFC: Analytical model and experimental validation,”Journal of the Electrochemical Society, 154, B279 (2007).
36. M. Eikerling and A. A. Kornyshev, “Electrochemical impedance of the cathode cat-alyst layer in polymer electrolyte fuel cells,” Journal of Electroanalytical Chemistry,475, 107 (1999).
37. N. Zamel and X. G. Li, “Effective transport properties for polymer electrolytemembrane fuel cells - With a focus on the gas diffusion layer,” Progress in Energyand Combustion Science, 39, 111 (2013).
38. D. R. Baker, D. A. Caulk, K. C. Neyerlin, and M. W. Murphy, “Measurement ofoxygen transport resistance in PEM fuel cells by limiting current methods,” Journalof the Electrochemical Society, 156, B991 (2009).
39. M. Koz and S. G. Kandlikar, “Numerical investigation of interfacial transport resis-tance due to water droplets in proton exchange membrane fuel cell air channels,”Journal of Power Sources, 243, 946 (2013).
40. J. M. Sergi and S. G. Kandlikar, “Quantification and characterization of water cover-age in PEMFC gas channels using simultaneous anode and cathode visualization andimage processing,” International Journal of Hydrogen Energy, 36, 12381 (2011).
41. M. J. Martinez, S. Shimpalee, and J. W. Van Zee, “Measurement of MacMullinNumbers for PEMFC Gas-Diffusion Media,” J. Electrochem. Soc., 156, B80 (2009).
42. T. Rosen, J. Eller, J. Kang, N. I. Prasianakis, J. Mantzaras, and F. N. Buchi, “Satura-tion dependent effective transport properties of PEFC gas diffusion layers,” Journalof the Electrochemical Society, 159, F536 (2012).
43. G. Unsworth, L. Dong, and X. Li, “Improved experimental method for measuringgas diffusivity through thin porous media,” AIChE Journal, 59, 1409 (2013).
44. G. S. Hwang and A. Z. Weber, “Effective-Diffusivity Measurement of Partially-Saturated Fuel-Cell Gas-Diffusion Layers,” Journal of the Electrochemical Society,159, F683 (2012).
45. D. A. Caulk and D. R. Baker, “Heat and water transport in hydrophobic diffusionmedia of PEM fuel cells,” Journal of the Electrochemical Society, 157, B1237(2010).
46. T. A. Greszler, D. Caulk, and P. Sinha, “The impact of platinum loading on oxygentransport resistance,” Journal of the Electrochemical Society, 159, F831 (2012).
47. H. Iden, A. Ohma, K. Yamaguchi, and K. Shinohara, in 9th Proton ExchangeMembrane Fuel Cell Symposium (PEMFC 9) - 216th Meeting of the ElectrochemicalSociety, p. 907, Vienna (2009).
48. K. Kudo, T. Suzuki, and Y. Morimoto, in 10th Polymer Electrolyte Fuel Cell Sym-posium, PEFC 10 - 218th ECS Meeting, p. 1495, Las Vegas, NV (2010).
49. T. Mashio, A. Ohma, S. Yamamoto, and K. Shinohara, in 7th Symposium Devoted toProton Exchange Membrane Fuel Cells - 212th ECS Meeting, p. 529, Washington,DC (2007).
) unless CC License in place (see abstract). ecsdl.org/site/terms_use address. Redistribution subject to ECS terms of use (see 128.240.225.120Downloaded on 2014-09-14 to IP

Journal of The Electrochemical Society, 161 (12) F1254-F1299 (2014) F1291
50. A. Z. Weber and J. Newman, “Transport in polymer-electrolyte membranes - II.Mathematical model,” Journal of the Electrochemical Society, 151, A311 (2004).
51. S. Ge, X. Li, B. Yi, and I. M. Hsing, “Absorption, desorption, and transport of waterin polymer electrolyte membranes for fuel cells,” Journal of the ElectrochemicalSociety, 152, A1149 (2005).
52. D. T. Hallinan, M. G. De Angelis, M. Giacinti Baschetti, G. C. Sarti, andY. A. Elabd, “Non-fickian diffusion of water in nafion,” Macromolecules, 43, 4667(2010).
53. D. T. Hallinan Jr. and Y. A. Elabd, “Diffusion of water in nafion using time-resolvedfourier transform infrared-attenuated total reflectance spectroscopy,” Journal ofPhysical Chemistry B, 113, 4257 (2009).
54. P. W. Majsztrik, M. B. Satterfield, A. B. Bocarsly, and J. B. Benziger, “Water sorp-tion, desorption and transport in Nafion membranes,” Journal of Membrane Science,301, 93 (2007).
55. D. R. Morris and X. Sun, “Water-sorption and transport properties of Nafion 117H,” Journal of Applied Polymer Science, 50, 1445 (1993).
56. D. Rivin, C. E. Kendrick, P. W. Gibson, and N. S. Schneider, “Solubility and trans-port behavior of water and alcohols in NafionTM,” Polymer, 42, 623 (2001).
57. T. E. Springer, T. Rockward, T. A. Zawodzinski, and S. Gottesfeld, “Model forpolymer electrolyte fuel cell operation on reformate feed effects of CO, H2 dilu-tion, and high fuel utilization,” Journal of the Electrochemical Society, 148, A11(2001).
58. X. Ye and M. D. LeVan, “Water transport properties of Nafion membranes: Part II.Multi-tube membrane module for air drying,” Journal of Membrane Science, 221,163 (2003).
59. T. A. Zawodzinski Jr, M. Neeman, L. O. Sillerud, and S. Gottesfeld, “Determinationof water diffusion coefficients in perfluorosulfonate ionomeric membranes,” Journalof Physical Chemistry, 95, 6040 (1991).
60. Q. Zhao, P. Majsztrik, and J. Benziger, “Diffusion and interfacial transport of waterin Nafion,” Journal of Physical Chemistry B, 115, 2717 (2011).
61. A. Kusoglu and A. Z. Weber, in Polymers for Energy Storage and Delivery: Poly-electrolytes for Batteries and Fuel Cells, p. 175, (American Chemical Society,2012).
62. A. Kusoglu, M. Modestino, A. Hexemer, R. A. Segalman, and A. Z. Weber, “Sub-second Morphological Changes in Nafion during Water Uptake Detected by Small-Angle X-Ray Scattering,” Acs Macro Lett, 1, 33 (2012).
63. A. Kusoglu, S. Savagatrup, K. T. Clark, and A. Z. Weber, “Role of MechanicalFactors in Controlling the Structure−Function Relationship of PFSA Ionomers,”Macromolecules, 45, 7467 (2012).
64. D. A. Caulk, A. M. Brenner, and S. M. Clapham, “A steady permeation methodfor measuring water transport properties of fuel cell membranes,” Journal of theElectrochemical Society, 159, F518 (2012).
65. G. S. Hwang, D. Y. Parkinson, A. Kusoglu, A. A. MacDowell, and Adam Z. Weber,“Understanding Water Uptake and Transport in Nafion using X-Ray Microtomog-raphy,” Acs Macro Lett, 2, 288 (2013).
66. D. S. Hussey, D. Spernjak, A. Z. Weber, R. Mukundan, J. Fairweather, E. L. Brosha,J. Davey, J. S. Spendelow, D. L. Jacobson, and R. L. Borup, “Accurate measurementof the through-plane water content of proton-exchange membranes using neutronradiography,” J Appl Phys, 112 (2012).
67. B. Kienitz, H. Yamada, N. Nonoyama, and A. Z. Weber, “Interfacial Water Trans-port Effects in Proton-Exchange Membranes,” Journal of Fuel Cell Science andTechnology, 8, 011013 (2011).
68. Q. He, A. Kusoglu, I. T. Lucas, K. Clark, A. Z. Weber, and R. Kostecki, “Correlatinghumidity-dependent ionically conductive surface area with transport phenomena inproton-exchange membranes,” The Journal of Physical Chemistry. B, 115, 11650(2011).
69. W. Braff and C. Mittelsteadt, in Proton Exchange Membrane Fuel Cells 8, PEMFC- 214th ECS Meeting, p. 309, Honolulu, HI (2008).
70. B. S. Pivovar, “An overview of electro-osmosis in fuel cell polymer electrolytes,”Polymer, 47, 4194 (2006).
71. X. Ye and C. Y. Wang, “Measurement of water transport properties throughmembrane-electrode assemblies: I. Membranes,” Journal of the ElectrochemicalSociety, 154, B676 (2007).
72. R. Anderson, L. Zhang, Y. Ding, M. Blanco, X. Bi, and D. P. Wilkinson, “A criticalreview of two-phase flow in gas flow channels of proton exchange membrane fuelcells,” Journal of Power Sources, 195, 4531 (2010).
73. R. Banerjee and S. G. Kandlikar, “Liquid water quantification in the cathode sidegas channels of a proton exchange membrane fuel cell through two-phase flowvisualization,” Journal of Power Sources, 247, 9 (2014).
74. C. E. Colosqui, M. J. Cheah, I. G. Kevrekidis, and J. B. Benziger, “Droplet and slugformation in polymer electrolyte membrane fuel cell flow channels: The role ofinterfacial forces,” Journal of Power Sources, 196, 10057 (2011).
75. M. Hossain, S. Z. Islam, A. Colley-Davies, and E. Adom, “Water dynamics inside acathode channel of a polymer electrolyte membrane fuel cell,” Renewable Energy,50, 763 (2013).
76. A. A. Franco, M. Guinard, B. Barthe, and O. Lemaire, “Impact of carbon monox-ide on PEFC catalyst carbon support degradation under current-cycled operatingconditions,” Electrochimica Acta, 54, 5267 (2009).
77. A. A. Franco and M. Tembely, “Transient multiscale modeling of aging mechanismsin a PEFC cathode,” Journal of the Electrochemical Society, 154, B712 (2007).
78. J. St-Pierre, “PEMFC contamination model: Foreign cation exchange with ionomerprotons,” Journal of Power Sources, 196, 6274 (2011).
79. P. O. Olapade, J. P. Meyers, R. Mukundan, J. R. Davey, and R. L. Borup, “Modelingthe Dynamic Behavior of Proton-Exchange Membrane Fuel Cells,” Journal of theElectrochemical Society, 158, B536 (2011).
80. A. A. Franco, P. Schott, C. Jallut, and B. Maschke, “A multi-scale dynamic mecha-nistic model for the transient analysis of PEFCs,” Fuel Cells, 7, 99 (2007).
81. L. Mao, C.-Y. Wang, and Y. Tabuchi, “A Multiphase Model for Cold Start ofPolymer Electrolyte Fuel Cells,” Journal of the Electrochemical Society, 154, B341(2007).
82. R. J. Balliet, in Chemical Engineering, p. 170 (University of California, Berkeley,Berkeley, 2010).
83. R. B. Bird, W. E. Stewart, and E. N. Lightfoot, Transport Phenomena (John Wiley& Sons, Inc., New York, 2002).
84. A. Z. Weber and J. Newman, “Modeling Gas-Phase Transport in Polymer-Electrolyte Fuel Cells,” ECS Transactions, 1(16), 61 (2005).
85. A. Z. Weber and J. Newman, “Modeling Gas-Phase Flow in Porous Media,” Inter-national Communications in Heat and Mass Transfer, 32, 855 (2005).
86. R. B. Bird, W. E. Stewart, and E. N. Lightfoot, Transport Phenomena (John Wiley& Sons, New York, 1960).
87. P. J. A. M. Kerkhof, “A modified Maxwell-Stefan model for transport through inertmembranes: The binary friction model,” Chem Eng J, 64, 319 (1996).
88. L. M. Pant, S. K. Mitra, and M. Secanell, “A generalized mathematical model tostudy gas transport in PEMFC porous media,” International Journal of Heat andMass Transfer, 58, 70 (2013).
89. J. Newman and K. E. Thomas-Alyea, Electrochemical Systems, John Wiley & Sons,New York (2004).
90. P. N. Pintauro and D. N. Bennion, “Mass-Transport of Electrolytes in Membranes. 1.Development of Mathematical Transport Model,” Industrial & Engineering Chem-istry Fundamentals, 23, 230 (1984).
91. T. F. Fuller, Solid-polymer-electrolyte Fuel Cells. Ph.D. Dissertation (University ofCalifornia, Berkeley, CA, 1992).
92. M. H. Eikerling and P. Berg, “Poroelectroelastic theory of water sorption andswelling in polymer electrolyte membranes,” Soft Matter, 7, 5976 (2011).
93. K. D. Kreuer, “The role of internal pressure for the hydration and transport propertiesof ionomers and polyelectrolytes,” Solid State Ionics, 252, 93 (2013).
94. A. Kusoglu, B. L. Kienitz, and A. Z. Weber, “Understanding the Effects of Com-pression and Constraints on Water Uptake of Fuel-Cell Membranes,” Journal of theElectrochemical Society, 158, B1504 (2011).
95. P. Berg, A. Novruzi, and K. Promislow, “Analysis of a cathode catalyst layermodel for a polymer electrolyte fuel cell,” Chemical Engineering Science, 61, 4316(2006).
96. P. Futerko and I. M. Hsing, “Two-dimensional finite-element method study of theresistance of membranes in polymer electrolyte fuel cells,” Electrochimica Acta,45, 1741 (2000).
97. A. Vorobev, O. Zikanov, and T. Shamim, “A computational model of a PEMfuel cell with finite vapor absorption rate,” Journal of Power Sources, 166, 92(2007).
98. J. Bear, Dynamics of Fluids in Porous Media (Dover Publications, Inc., New York,1988).
99. F. A. L. Dullien, Porous Media: Fluid Transport and Pore Structure, (AcademicPress, Inc., New York, 1992).
100. T. Berning, D. M. Lu, and N. Djilali, “Three-dimensional computational analysisof transport phenomena in a PEM fuel cell,” Journal of Power Sources, 106, 284(2002).
101. T. Berning and N. Djilali, “A 3D, Multiphase, Multicomponent Model of theCathode and Anode of a PEM Fuel Cell,” Journal of the Electrochemical Soci-ety, 150, A1598 (2003).
102. V. Gurau, H. Liu, and S. Kakac, “Two-Dimensional Model for Proton ExchangeMembrane Fuel Cells,” AIChE Journal, 44, 2414 (1998).
103. S. Mazumder and J. V. Cole, “Rigorous 3-D Mathematical Modeling of PEM FuelCells I. Model Predictions without Liquid Water Transport,” Journal of the Electro-chemical Society, 150, A1503 (2003).
104. S. Mazumder and J. V. Cole, “Rigorous 3-D Mathematical Modeling of PEM FuelCells II. Model Predictions with Liquid Water Transport,” Journal of the Electro-chemical Society, 150, A1510 (2003).
105. O. Burheim, P. J. S. Vie, J. G. Pharoah, and S. Kjelstrup, “Ex situ measurements ofthrough-plane thermal conductivities in a polymer electrolyte fuel cell,” Journal ofPower Sources, 195, 249 (2010).
106. O. S. Burheim, J. G. Pharoah, H. Lampert, P. J. S. Vie, and S. Kjelstrup, “Through-Plane Thermal Conductivity of PEMFC Porous Transport Layers,” Journal of FuelCell Science and Technology, 8 (2011).
107. M. J. Lampinen and M. Fomino, “Analysis of Free-Energy and Entropy Changesfor Half-Cell Reactions,” Journal of the Electrochemical Society, 140, 3537(1993).
108. S. Shibata and M. P. Sumino, “The Electrochemical Peltier Heat for the Adsorptionand Desorption of Hydrogen on a Platinized Platinum-Electrode in Sulfuric-AcidSolution,” Journal of Electroanalytical Chemistry, 193, 135 (1985).
109. K. J. Vetter, Electrochemical Kinetics, (Academic Press, Inc., New York, 1967).110. A. Z. Weber and C. Delacourt, “Mathematical Modelling of Cation Contamination
in a Proton-exchange Membrane,” Fuel Cells, 8, 459 (2008).111. T. Okada, “Theory for water management in membranes for polymer electrolyte
fuel cells - Part 2. The effect of impurity ions at the cathode side on the membraneperformances,” Journal of Electroanalytical Chemistry, 465, 18 (1999).
112. T. Okada, “Theory for water management in membranes for polymer electrolytefuel cells - Part 1. The effect of impurity ions at the anode side on the membraneperformances,” Journal of Electroanalytical Chemistry, 465, 1 (1999).
113. J. X. Wang, T. E. Springer, and R. R. Adzic, “Dual-pathway kinetic equation forthe hydrogen oxidation reaction on Pt electrodes,” Journal of the ElectrochemicalSociety, 153, A1732 (2006).
) unless CC License in place (see abstract). ecsdl.org/site/terms_use address. Redistribution subject to ECS terms of use (see 128.240.225.120Downloaded on 2014-09-14 to IP

F1292 Journal of The Electrochemical Society, 161 (12) F1254-F1299 (2014)
114. W. Vogel, J. Lundquist, P. Ross, and P. Stonehart, “Reaction Pathways and Poisons.2. Rate Controlling Step for Electrochemical Oxidation of Hydrogen on Pt in Acidand Poisoning of Reaction by Co,” Electrochimica Acta, 20, 79 (1975).
115. K. C. Neyerlin, W. B. Gu, J. Jorne, and H. A. Gasteiger, “Determination of catalystunique parameters for the oxygen reduction reaction in a PEMFC,” Journal of theElectrochemical Society, 153, A1955 (2006).
116. A. J. Appleby, “Oxygen reduction on oxide-free platinum in 85% orthophospho-ric acid: Temperature and impurity dependence,” Journal of the ElectrochemicalSociety, 117, 328 (1970).
117. K. Kinoshita, Electrochemical Oxygen Technology (John Wiley & Sons, Inc., NewYork (1992).
118. A. Parthasarathy, B. Dave, S. Srinivasan, A. J. Appleby, and C. R. Martin, “ThePlatinum Microelectrode Nafion Interface - an Electrochemical Impedance Spectro-scopic Analysis of Oxygen Reduction Kinetics and Nafion Characteristics,” Journalof the Electrochemical Society, 139, 1634 (1992).
119. A. Parthasarathy, S. Srinivasan, A. J. Appleby, and C. R. Martin, “Electrode-Kinetics of Oxygen Reduction at Carbon-Supported and Unsupported PlatinumMicrocrystallite Nafion(R) Interfaces,” Journal of Electroanalytical Chemistry, 339,101 (1992).
120. F. A. Uribe, T. E. Springer, and S. Gottesfeld, “A Microelectrode Study of OxygenReduction at the Platinum/Recast-Nafion Film Interface,” Journal of the Electro-chemical Society, 139, 765 (1992).
121. K. C. Neyerlin, W. B. Gu, J. Jorne, and H. A. Gasteiger, “Study of the exchangecurrent density for the hydrogen oxidation and evolution reactions,” Journal of theElectrochemical Society, 154, B631 (2007).
122. J. X. Wang, J. Zhang, and R. R. Adzic, “Double-Trap Kinetic Equation for theOxygen Reduction Reaction on Pt(111) in Acidic Media,” J. Phys. Chem. A, 111,12702 (2007).
123. N. P. Subramanian, T. A. Greszler, J. Zhang, W. Gu, and R. Makharia, “Pt-OxideCoverage-Dependent Oxygen Reduction Reaction (ORR) Kinetics,” J. Electrochem.Soc., 159, B531 (2012).
124. M. Moore, A. Putz, and M. Secanell, “Investigation of the ORR Using the Double-Trap Intrinsic Kinetic Model,” Journal of the Electrochemical Society, 160, F670(2013).
125. M. Moore, A. Putz, and M. Secanell, “Understanding the Effect of Kinetic and MassTransport Processes in Cathode Agglomerates,” Journal of the ElectrochemicalSociety, 161, E1 (2014).
126. Y. Liu, M. Mathias, and J. Zhang, “Measurement of Platinum Oxide Coverage in aProton Exchange Membrane Fuel Cell,” Electrochem. and Solid-State Letters, 12,B1 (2010).
127. T. P. Caremans, B. Loppinet, L. R. A. Follens, T. S. van Erp, J. Vermant, B. Goderis,C. E. A. Kirschhock, J. A. Martens, and A. Aerts, “Investigation of NanoparticlesOccurring in the Colloidal Silicalite-1 Zeolite Crystallization Process Using Disso-lution Experiments,” Chemistry of Materials, 22, 3619 (2010).
128. S. Gottesfeld, “Some observations on the oxygen reduction reaction (ORR) atplatinum catalysts based on post year 2000 reports,” ECS Transactions, 6, 51(2008).
129. V. R. Stamenkovic, B. S. Mun, M. Arenz, K. J. J. Mayrhofer, C. A. Lucas, G. Wang,P. N. Ross, and N. M. Markovic, “Trends in electrocatalysis on extended andnanoscale Pt-bimetallic alloy surfaces,” Nature Materials, 6, 241 (2007).
130. J. X. Wang, F. A. Uribe, T. E. Springer, J. Zhang, and R. R. Adzic, “Intrinsic kineticequation for oxygen reduction reaction in acidic media: the double Tafel slope andfuel cell applications,” Faraday discussions, 140, 347 (2009).
131. J. X. Wang, J. Zhang, and R. R. Adzic, “Double-Trap Kinetic Equation for theOxygen Reduction Reaction on Pt(111) in Acidic Media†,” The Journal of PhysicalChemistry A, 111, 12702 (2007).
132. S. Jomori, N. Nonoyama, and T. Yoshida, “Analysis and modeling ofPEMFC degradation: effect on oxygen transport,” J. Power Sources, 215, 18(2012).
133. W. Yoon and A. Z. Weber, “Modeling Low-Platinum-Loading Effects in Fuel-Cell Catalyst Layers,” Journal of The Electrochemical Society, 158, B1007(2011).
134. Y. Ono, T. Mashio, S. Takaichi, A. Ohma, H. Kanesaka, and K. Shinohara, “Theanalysis of performance loss with low platinum loaded cathode catalyst layer,” ECSTrans., 28(27), 69 (2010).
135. N. P. Subramanian, T. A. Greszler, J. Zhang, W. Gu, and R. Makharia, “Pt-OxideCoverage-Dependent Oxygen Reduction Reaction (ORR) Kinetics,” Journal of TheElectrochemical Society, 159, B531 (2012).
136. N. M. Markovic, H. A. Gasteiger, B. N. Grgur, and P. N. Ross, “Oxygen reductionreaction on Pt(111): effects of bromide,” Journal of Electroanalytical Chemistry,467, 157 (1999).
137. M. Wakisaka, H. Suzuki, S. Mitsui, H. Uchida, and M. Watanabe, “Identificationand Quantification of Oxygen Species Adsorbed on Pt(111) Single-Crystal andPolycrystalline Pt Electrodes by Photoelectron Spectroscopy,” Langmuir, 25, 1897(2009).
138. A. Parthasarathy, S. Srinivasan, A. J. Appleby, and C. R. Martin, “Pressure-dependence of the oxygen reduction reaction at the platinum microelectrode nafioninterface - Electrode-kinetics and mass-transport,” Journal of the ElectrochemicalSociety, 139, 2856 (1992).
139. R. Jinnouchi, K. Kodama, T. Hatanaka, and Y. Morimoto, “First principles basedmean field model for oxygen reduction reaction,” Phys Chem Chem Phys, 13, 21070(2011).
140. V. Rai, M. Aryanpour, and H. Pitsch, “First-principles analysis of oxygen-containingadsorbates formed from the electrochemical discharge of water on pt(111),” Journalof Physical Chemistry C, 112, 9760 (2008).
141. A. Z. Weber, “Improved Modeling and Understanding of Diffusion-Media Wetta-bility on Polymer-Electrolyte-Fuel-Cell Performance,” journal of Power Sources,195, 5292 (2010).
142. A. Z. Weber and J. Newman, “Effects of microporous layers in polymer electrolytefuel cells,” Journal of the Electrochemical Society, 152, A677 (2005).
143. J. T. Gostick, M. A. Ioannidis, M. W. Fowler, and M. D. Pritzker, “On the role ofthe microporous layer in PEMFC operation,” Electrochemistry Communications,11, 576 (2009).
144. J. H. Nam, K. J. Lee, G. S. Hwang, C. J. Kim, and M. Kaviany, “Microporous layerfor water morphology control in PEMFC,” International Journal of Heat and MassTransfer, 52, 2779 (2009).
145. J. P. Owejan, T. A. Trabold, and M. M. Mench, “Oxygen transport resis-tance correlated to liquid water saturation in the gas diffusion layer ofPEM fuel cells,” International Journal of Heat and Mass Transfer, 71, 585(2014).
146. J. H. Nam and M. Kaviany, “Effective diffusivity and water-saturation distributionin single- and two-layer PEMFC diffusion medium,” International Journal of Heatand Mass Transfer, 46, 4595 (2003).
147. M. M. Tomadakis and S. V. Sotirchos, AIChE Journal, 39, 397 (1993).148. B. Ramos-Alvarado, J. D. Sole, A. Hernandez-Guerrero, and M. W. Ellis, “Experi-
mental characterization of the water transport properties of PEM fuel cells diffusionmedia,” Journal of Power Sources, 218, 221 (2012).
149. J. J. Hwang, “Thermal-electrochemical modeling of a proton exchange membranefuel cell,” Journal of the Electrochemical Society, 153, A216 (2006).
150. C. Y. Wang and P. Cheng, “Multiphase Flow and Heat Transfer in Porous Media,”Advances in Heat Transfer, 30, 93 (1997).
151. C. Y. Wang and P. Cheng, “A multiphase mixture model for multiphase, multicom-ponent transport in capillary porous media-I. Model development,” InternationalJournal of Heat and Mass Transfer, 39, 3607 (1996).
152. W. O. Smith, “The Final Distribution of Retained Liquid in an Ideal Uniform Soil,”Physics, 4, 425 (1933).
153. M. C. Leverett, “Capillary Behavior in Porous Solids,” Petroleum Division Trans-actions of the American Institute of Mining and Metallurgical Engineers, 142, 152(1941).
154. J. T. Gostick, M. A. Ioannidis, M. W. Fowler, and M. D. Pritzker, “Wettability andcapillary behavior of fibrous gas diffusion media for polymer electrolyte membranefuel cells,” Journal of Power Sources, 194, 433 (2009).
155. J. T. Gostick, M. W. Fowler, M. A. Ioannidis, M. D. Pritzker, Y. M. Volfkovich,and A. Sakars, “Capillary pressure and hydrophilic porosity in gas diffusionlayers for polymer electrolyte fuel cells,” Journal of Power Sources, 156, 375(2006).
156. P. K. Das, A. Grippin, A. Kwong, and A. Z. Weber, “Liquid-Water-DropletAdhesion-Force Measurements on Fresh and Aged Fuel-Cell Gas-Diffusion Lay-ers,” Journal of the Electrochemical Society, 159, B489 (2012).
157. A. Kusoglu, A. Kwong, K. T. Clark, H. P. Gunterman, and A. Z. Weber, “WaterUptake of Fuel-Cell Catalyst Layers,” Journal of the Electrochemical Society, 159,F530 (2012).
158. T. V. Nguyen, G. Lin, H. Ohn, and X. Wang, “Measurement of capil-lary pressure property of gas diffusion media used in proton exchangemembrane fuel cells,” Electrochemical and Solid State Letters, 11, B127(2008).
159. X. H. Wang and T. Van Nguyen, “Modeling the effects of capillary property ofporous media on the performance of the cathode of a PEMFC,” Journal of theElectrochemical Society, 155, B1085 (2008).
160. A. Z. Weber and M. A. Hickner, “Modeling and high-resolution-imaging studiesof water-content profiles in a polymer-electrolyte-fuel-cell membrane-electrode as-sembly,” Electrochimica Acta, 53, 7668 (2008).
161. S. Kim and M. M. Mench, “Investigation of Temperature-Driven Water Transportin Polymer Electrolyte Fuel Cell: Phase-Change-Induced Flow,” Journal of theElectrochemical Society, 156, B353 (2009).
162. R. J. Balliet and J. Newman, “Cold Start of a Polymer-Electrolyte Fuel Cell III.Optimization of Operational and Configurational Parameters,” Journal of the Elec-trochemical Society, 158, B948 (2011).
163. T. J. Dursch, G. J. Trigub, R. Lujan, J. F. Liu, R. Mukundan, C. J. Radke, andA. Z. Weber, “Ice-Crystallization Kinetics in the Catalyst Layer of a Proton-Exchange-Membrane Fuel Cell,” Journal of the Electrochemical Society, 161, F199(2014).
164. L. Mao and C.-Y. Wang, “Analysis of Cold Start in Polymer Electrolyte Fuel Cells,”Journal of the Electrochemical Society, 154, B139 (2007).
165. K. Tajiri, Y. Tabuchi, F. Kagami, S. Takahashi, K. Yoshizawa, and C. Y. Wang,journal of Power Sources, 165, 279 (2007).
166. P. Oberholzer, P. Boillat, R. Siegrist, R. Perego, A. Kastner, E. Lehmann,G. G. Scherer, and A. Wokaun, “Cold-Start of a PEFC Visualized with High Reso-lution Dynamic In-Plane Neutron Imaging,” Journal of the Electrochemical Society,159, B235 (2012).
167. Hydrogen, fuel cells & infrastructure technologies program; multi-year re-search, development and demonstration plan, p. 14, U.S. Department of Energy(2013).
168. E. L. Thompson, T. W. Capehart, T. J. Fuller, and J. Jorne, “Investigation of Low-Temperature Proton Transport in Nafion Using Direct Current COnductivity andDifferential Scanning Calorimetry,” Journal of the Electrochemical Society, 153,A2351 (2006).
169. R. Satija, D. L. Jacobson, M. Arif, and S. A. Werner, “In situ neutron imagingtechnique for evaluation of water management systems in operating PEM fuelcells,” Journal of Power Sources, 129, 238 (2004).
) unless CC License in place (see abstract). ecsdl.org/site/terms_use address. Redistribution subject to ECS terms of use (see 128.240.225.120Downloaded on 2014-09-14 to IP

Journal of The Electrochemical Society, 161 (12) F1254-F1299 (2014) F1293
170. Y. Hishinuma, T. Chikahisa, F. Kagami, and T. Ogawa, “The design and performanceof a PEFC at a temperature below freezing,” Jsme International Journal SeriesB-Fluids and Thermal Engineering, 47, 235 (2004).
171. R. Balliet, K. E. Thomas-Alyea, and J. Newman, ECS Transactions, 16, 285 (2008).172. M. Khandelwal, S. H. Lee, and M. M. Mench, “One-dimensional thermal model of
cold-start in a polymer electrolyte fuel cell stack,” Journal of Power Sources, 172,816 (2007).
173. H. Meng, “Numerical analyses of non-isothermal self-start behaviors of PEM fuelcells from subfreezing startup temperatures,” International Journal of HydrogenEnergy, 33, 5738 (2008).
174. K. Jiao and X. G. Li, “Three-dimensional multiphase modeling of cold start pro-cesses in polymer electrolyte membrane fuel cells,” Electrochimica Acta, 54, 6876(2009).
175. L. Mao and C. Y. Wang, “A Multiphase Model for Cold Start of Polymer ElectrolyteFuel Cells,” Journal of the Electrochemical Society, 154, B341 (2007).
176. M. Modell and R. C. Reid, Thermodynamics and its Applications, (Prentice-Hall,1974).
177. D. H. Everett, “Thermodynamics of Frost Damage To Porous Solids,” Transactionsof the Faraday Society, 57, 1541 (1961).
178. G. S. Hwang, H. Kim, R. Lujan, R. Mukundan, D. Spernjak, R. L. Borup,M. Kaviany, M. H. Kim, and A. Z. Weber, “Phase-change-related degradation ofcatalyst layers in proton-exchange-membrane fuel cells,” Electrochimica Acta, 95,29 (2013).
179. Y. Ishikawa, H. Harnada, M. Uehara, and M. Shiozawa, “Super-cooled water behav-ior inside polymer electrolyte fuel cell cross-section below freezing temperature,”Journal of Power Sources, 179, 547 (2008).
180. Y. Ishikawa, T. Morita, K. Nakata, K. Yoshida, and M. Shiozawa, “Behavior ofwater below the freezing point in PEFCs,” Journal of Power Sources, 163, 708(2007).
181. T. J. Dursch, M. A. Ciontea, C. J. Radke, and A. Z. Weber, “Isothermal Ice Crystal-lization Kinetics in the Gas-Diffusion Layer of a Proton-Exchange-Membrane FuelCell,” Langmuir, 28, 1222 (2012).
182. T. J. Dursch, M. A. Ciontea, G. J. Trigub, C. J. Radke, and A. Z. Weber, “Pseudo-isothermal Ice-Crystallization Kinetics in the Gas-Diffusion Layer of a Fuel Cellfrom Differential Scanning Calorimetry,” International Journal of Heat and MassTransfer, 60, 450 (2013).
183. D. Kaschiev, D. Verdoes, and G. M. van Rosmalen, Journal of Crystal Growth, 110,373 (1991).
184. T. J. Dursch, G. J. Trigub, J. F. Liu, C. J. Radke, and A. Z. Weber, “Non-isothermalMelting of Ice in the Gas-Diffusion Layer of a Proton-Exchange-Membrane FuelCell,” International Journal of Heat and Mass Transfer, 67, 896 (2013).
185. M. M. Tomadakis and S. V. Sotirchos, “Knudsen Diffusivities and Properties ofStructures of Unidirectiional Fibers,” AIChE Journal, 37, 1175 (1991).
186. M. M. Tomadakis and S. V. Sotirchos, “Effective Knudsen Diffusivities in Structuresof Randomly Overlapping Fibers,” AIChE, 37, 74 (1991).
187. G. Gaiselmann, C. Totzke, I. Manke, W. Lehnert, and V. Schmidt, “3D mictrostruc-ture modeling of compressed fiber-based materials,” Journal of Power Sources, InPress (2014).
188. J. P. James, H.-W. Choi, and J. G. Pharoah, “X-ray computed tomography recon-struction and analysis of polymer electrolyte membrane fuel cell porous transportlayers,” International Journal of Hydrogen Energy, 37, 18216 (2012).
189. G. Gaiselmann, R. Thiedmann, I. Manke, W. Lehnert, and V. Schmidt, “Stochastic3D modeling of fiber-based materials,” Compuational Materials Science, 59, 75(2012).
190. G. Gaiselmann, D. Froning, C. Totzke, C. Quick, I. Manke, W. Lehnert, andV. Schmidt, “Stochastic 3D modeling of non-woven materials with wet-proofingagent,” International Journal of Hydrogen Energy, 38, 8448 (2013).
191. M. M. Daino and S. G. Kandlika, “3D phase-differentiated GDL microstructuregeneration with binder and PTFE distributions,” International Journal of HydrogenEnergy, 37, 5180 (2012).
192. K. Schladitz, S. Peters, D. Reinel-Bitzer, A. Wiegmann, and J. Ohser, “Design ofacoustic trim based on geometric modeling and flow simulation for non-woven,”Computational Materials Science, 38, 56 (2006).
193. V. P. Schulz, J. Becker, A. Wiegmann, P. P. Mukherjee, and C.-Y. Wang, “Modelingof Two-Phase Behaviour in the Gas Diffusion Medium of PEFCs via Full Morphol-ogy Approach,” Journal of The Electrochemical Society, 154, B419 (2007).
194. N. Zamel, X. Li, J. Shen, J. Becker, and A. Wiegmann, “Estimating effective thermalconductivity in carbon paper diffusion media,” Chemical Engineering Science, 65,3994 (2010).
195. N. Zamel, X. Li, J. Becker, and A. Wiegmann, “Effect of liquid water on transportproperties of the gas diffusion layer of polymer electrolyte membrane fuel cells,”International Journal of Hydrogen Energy, 36, 5466 (2011).
196. J. T. Gostick, “Random pore network modeling of GDLs using Voronoi and Delau-nay Tessellations,” ECS Transactions, 41, 125 (2011).
197. D. Froning, J. Brinkmann, U. Reimer, V. Schmidt, W. Lehnert, and D. Stolten, “3Danalysis, modeling, and simulation of transport processes in compressed fibrousmicrostructures, using the Lattice Boltzmann method,” Electrochimica Acta, 110,325 (2013).
198. G. Inoue, T. Yoshimoto, Y. Matsukuma, and M. Minemoto, “Development of sim-ulated gas diffusion layer of polymer electrolyte fuel cells and evaluation of itsstructure,” Journal of Power Sources, 175, 145 (2008).
199. P. P. Mukherjee and C. Y. Wang, “Direct numerical simulation modeling of bilayercathode catalyst layers in polymer electrolyte fuel cells,” Journal of the Electro-chemical Society, 154, B1121 (2007).
200. Y. Wang, S. C. Cho, R. Thiedmann, V. Schmidt, W. Lehnert, and X. H. Feng,“Stochastic modeling and direct simulation of the diffusion media for polymer
electrolyte fuel cells,” International Journal of Heat and Mass Transfer, 53, 1128(2010).
201. U. R. Salomov, E. Chiavazzo, and P. Asinari, “Pore-scale modeling of fluid flowthrough gas diffusion and catalyst layers for high temperature proton exchange(HT-PEM) fuel cells,” Computers and Mathematics with Applications, 67, 393(2014).
202. P. K. Sinha, P. P. Mukherjee, and C.-Y. Wang, “Impact of GDL structure and wetta-bility on water management in polymer electrolyte fuel cells,” Journal of MaterialsChemistry, 17, 3089 (2007).
203. L. Chen, Y.-L. Feng, C.-X. Song, L. Chen, Y.-L. He, and W.-Q. Tao, “Multi-scalemodelling of proton exchange membrane fuell cell by coupling finite volume andlattice Boltzmann method,” International Jounral of Heat and Mass Transfer, 63,268 (2013).
204. L. Chen, H. B. Luan, Y. L. He, and W. Q. Tao, “Numerical investigation of liquidwater transport and distribution in porous gas diffusion layer of a proton exchangemembrane fuel cell using lattice Boltzmann method,” Russian Journal of Electro-chemistry, 48, 712 (2012).
205. M. A. Van Doorrnaal and J. G. Pharoah, “Determination of permeability in fi-brous porous media using the lattice Boltzmann method with application toPEM fuel cells,” International Journal for Numerical Methods in Fluids, 59, 75(2009).
206. L. Hao and P. Cheng, “Lattice Boltzmann simulations of anisotropic permeabil-ities in carbon paper gas diffusion layers,” Journal of Power Sources, 186, 104(2009).
207. P. P. Mukherjee, Q. J. Kang, and C. Y. Wang, “Pore-scale modeling of two-phasetransport in polymer electrolyte fuel cells-progress and perspective,” Energy &Environmental Science, 4, 346 (2011).
208. Y. Gao, X. X. Zhang, P. Rama, Y. Liu, R. Chen, H. Ostadi, and K. Jiang, “ModelingFluid Flow in the Gas Diffusion Layers in PEMFC Using the Multiple Relaxation-time Lattice Boltzmann Method,” Fuel Cells, 12, 365 (2012).
209. S. H. Kim and H. Pitsch, “Reconstruction and Effective Transport Properties of theCatalyst Layer in PEM Fuel Cells,” Journal of the Electrochemical Society, 156,B673 (2009).
210. L. P. Wang and B. Afsharpoya, “Modeling fluid flow in fuel cells using thelattice-Boltzmann approach,” Mathematics and Computers in Simulation, 72, 242(2006).
211. J. Mantzaras, S. A. Freunberger, F. N. Buchi, M. Roos, W. Brandstatter,M. Prestat, L. J. Gauckler, B. Andreaus, F. Hajbolouri, S. M. Senn, D. Poulikakos,A. K. Chaniotis, D. Larrain, N. Autissier, and F. Marechal, “Fuel cell modeling andsimulations,” Chimia, 58, 857 (2004).
212. H. J. Vogel, J. Tolke, V. P. Schulz, M. Krafczyk, and K. Roth, “Comparison of aLattice-Boltzmann model, a full-morphology model, and a pore network model fordetermining capillary pressure-saturation relationships,” Vadose Zone Journal, 4,380 (2005).
213. N. Zamel, J. Becker, and A. Wiegmann, “Estimating the thermal conductivity anddiffusion coefficient of the microporous layer of polymer electrolyte fuel cells,”Journal of Power Sources, 207, 70 (2012).
214. E. F. Medici and J. S. Allen, “Modeling and Diagnostics of Fuel Cell Porous Mediafor ImprovingWater Transport,” ECS Transactions, 41, 165 (2011).
215. M. M. Daino and S. G. Kandlikar, “3D phase-differentiated GDL microstructuregeneration with binder and PTFE distributions,” International Journal of HydrogenEnergy, 37, 5180 (2012).
216. A. Pfrang, D. Veyret, F. Sieker, and G. Tsotridis, “X-ray computed tomographyof gas diffusion layers of PEM fuel cells: Calculation of thermal conductivity,”International Journal of Hydrogen Energy, 35, 3751 (2010).
217. Z. Fishman, J. Hinebaugh, and A. Bazylak, “Microscale Tomography Investiga-tions of Heterogeneous Porosity Distributions of PEMFC GDLs,” Journal of theElectrochemical Society, 157, B1643 (2010).
218. J. Lee, J. Hinebaugh, and A. Bazylak, “Synchrotron X-ray radiographic investi-gations of liquid water transport behavior in a PEMFC with MPL-coated GDLs,”Journal of Power Sources, 227, 123 (2013).
219. E. C. Kumbur, K. V. Sharp, and M. M. Mench, “On the effectiveness of Leverettapproach for describing the water transport in fuel cell diffusion media,” Journal ofPower Sources, 168, 356 (2007).
220. K. Cooper, “Progress Toward Accurate Through-Plane Membrane Resistance andConductivity Measurement,” ECS Transactions, 25, 995 (2009).
221. J. P. Meyers, in Department of Chemical Engineering, University of California,Berkeley (1998).
222. M. Adachi, T. Navessin, Z. Xie, B. Frisken, and S. Holdcroft, “Correlation of In Situand Ex Situ Measurements of Water Permeation Through Nafion NRE211 ProtonExchange Membranes,” Journal of the Electrochemical Society, 156, B782 (2009).
223. B. S. Pivovar and Y. S. Kim, “The Membrane–Electrode Interface in PEFCs: I. AMethod for Quantifying Membrane–Electrode Interfacial Resistance,” Journal ofThe Electrochemical Society, 154, B739 (2007).
224. M. Secanell, K. Karan, A. Suleman, and N. Djilali, “Optimal design of ultralow-platinum PEMFC anode electrodes,” Journal of the Electrochemical Society, 155,B125 (2008).
225. T. Swamy, E. C. Kumbur, and M. M. Mench, “Characterization of Interfacial Struc-ture in PEFCs: Water Storage and Contact Resistance Model,” Journal of the Elec-trochemical Society, 157, B77 (2010).
226. F. E. Hizir, S. O. Ural, E. C. Kumbur, and M. M. Mench, “Characterization ofinterfacial morphology in polymer electrolyte fuel cells: Micro-porous layer andcatalyst layer surfaces,” Journal of Power Sources, 195, 3463 (2010).
227. H. Bajpai, M. Khandelwal, E. C. Kumbur, and M. M. Mench, “A computationalmodel for assessing impact of interfacial morphology on polymer electrolyte fuelcell performance,” Journal of Power Sources, 195, 4196 (2010).
) unless CC License in place (see abstract). ecsdl.org/site/terms_use address. Redistribution subject to ECS terms of use (see 128.240.225.120Downloaded on 2014-09-14 to IP
F1294 Journal of The Electrochemical Society, 161 (12) F1254-F1299 (2014)
228. I. V. Zenyuk, E. C. Kumbur, and S. Litster, “Deterministic contact mechanics modelapplied to electrode interfaces in polymer electrolyte fuel cells and interfacial wateraccumulation,” Journal of Power Sources, 241, 379 (2013).
229. S. Litster, W. K. Epting, E. A. Wargo, S. R. Kalidindi, and E. C. Kumbur, “Mor-phological Analyses of Polymer Electrolyte Fuel Cell Electrodes with Nano-ScaleComputed Tomography Imaging,” Fuel Cells, 13, 935 (2013).
230. A. R. Kalidindi, R. Taspinar, S. Litster, and E. C. Kumbur, “A two-phase modelfor studying the role of microporous layer and catalyst layer interface on polymerelectrolyte fuel cell performance,” International Journal of Hydrogen Energy, 38,9297 (2013).
231. E. A. Wargo, V. P. Schulz, A. Cecen, S. R. Kalidindi, and E. C. Kumbur, “Resolvingmacro- and micro-porous layer interaction in polymer electrolyte fuel cells usingfocused ion beam and X-ray computed tomography,” Electrochimica Acta, 87, 201(2013).
232. S. Kim, M. Khandelwal, C. Chacko, and M. M. Mench, “Investigation of the Impactof Interfacial Delamination on Polymer Electrolyte Fuel Cell Performance,” Journalof the Electrochemical Society, 156, B99 (2009).
233. S. Kim, B. K. Ahn, and M. M. Mench, “Physical degradation of membrane electrodeassemblies undergoing freeze/thaw cycling: Diffusion media effects,” Journal ofPower Sources, 179, 140 (2008).
234. I. Manke, C. Hartnig, M. Grunerbel, W. Lehnert, N. Kardjilov, A. Haibel, A. Hilger,J. Banhart, and H. Riesemeier, “Investigation of water evolution and transport infuel cells with high resolution synchrotron x-ray radiography,” Appl Phys Lett, 90(2007).
235. C. Chacko, R. Ramasamy, S. Kim, M. Khandelwal, and M. Mench, “Characteristicbehavior of polymer electrolyte fuel cell resistance during cold start,” Journal ofthe Electrochemical Society, 155, B1145 (2008).
236. X. H. Wang and T. Van Nguyen, “Modeling the Effects of the Microporous Layer onthe Net Water Transport Rate Across the Membrane in a PEM Fuel Cell,” Journalof the Electrochemical Society, 157, B496 (2010).
237. R. Alink, J. Haussmann, H. Markotter, M. Schwager, I. Manke, and D. Gerteisen,“The influence of porous transport layer modifications on the water managementin polymer electrolyte membrane fuel cells,” Journal of Power Sources, 233, 358(2013).
238. D. Gerteisen, T. Heilmann, and C. Ziegler, “Enhancing liquid water transport bylaser perforation of a GDL in a PEM fuel cell,” Journal of Power Sources, 177, 348(2008).
239. D. Gerteisen and C. Sadeler, “Stability and performance improvement of a polymerelectrolyte membrane fuel cell stack by laser perforation of gas diffusion layers,”Journal of Power Sources, 195, 5252 (2010).
240. H. Markotter, R. Alink, J. Haussmann, K. Dittmann, T. Arlt, F. Wieder, C. Totzke,M. Klages, C. Reiter, H. Riesemeier, J. Scholta, D. Gerteisen, J. Banhart, andI. Manke, “Visualization of the water distribution in perforated gas diffusion layersby means of synchrotron X-ray radiography,” International Journal of HydrogenEnergy, 37, 7757 (2012).
241. T. Kitahara, H. Nakajima, and K. Mori, “Hydrophilic and hydrophobic doublemicroporous layer coated gas diffusion layer for enhancing performance of polymerelectrolyte fuel cells under no-humidification at the cathode,” Journal of PowerSources, 199, 29 (2012).
242. E. Kimball, T. Whitaker, Y. G. Kevrekidis, and J. B. Benziger, “Drops, slugs, andflooding in polymer electrolyte membrane fuel cells,” Aiche Journal, 54, 1313(2008).
243. U. Pasaogullari and C. Y. Wang, “Two-phase modeling and flooding prediction ofpolymer electrolyte fuel cells,” Journal of the Electrochemical Society, 152, A380(2005).
244. X. H. Wang and T. V. Nguyen, “An experimental study of the liquid water saturationlevel in the cathode gas diffusion layer of a PEM fuel cell,” Journal of Power Sources,197, 50 (2012).
245. M. P. Manahan, M. C. Hatzell, E. C. Kumbur, and M. M. Mench, “Laser perforatedfuel cell diffusion media. Part I: Related changes in performance and water content,”Journal of Power Sources, 196, 5573 (2011).
246. T. Swamy, E. C. Kumbur, and M. M. Mench, “Investigation of bipolar plate anddiffusion media interfacial structure in PEFCs: A fractal geometry approach,” Elec-trochimica Acta, 56, 3060 (2011).
247. H. A. Gasteiger, W. Gu, R. Makharia, M. F. Mathias, and B. Sompalli, Beginning-of-life MEA performance- Efficiency loss contributions, John Wiley & Sons, Ltd.(2003).
248. M. Khandelwal and M. M. Mench, “Direct measurement of through-plane thermalconductivity and contact resistance in fuel cell materials,” Journal of Power Sources,161, 1106 (2006).
249. M. C. Hatzell, A. Turhan, S. Kim, D. S. Hussey, D. L. Jacobson, and M. M. Mench,“Quantification of Temperature Driven Flow in a Polymer Electrolyte Fuel Cell Us-ing High-Resolution Neutron Radiography,” Journal of the Electrochemical Society,158, B717 (2011).
250. A. Turhan, S. Kim, M. Hatzell, and M. M. Mench, “Impact of channel wall hy-drophobicity on through-plane water distribution and flooding behavior in a polymerelectrolyte fuel cell,” Electrochimica Acta, 55, 2734 (2010).
251. F. Y. Zhang, X. G. Yang, and C. Y. Wang, “Liquid water removal from a poly-mer electrolyte fuel cell,” Journal of the Electrochemical Society, 153, A225(2006).
252. D. P. Wilkenson and O. Venderleeden, Handbook of Fuel Cells, John Wiley & Sons,Ltd (2003).
253. E. C. Kumbur, K. V. Sharp, and M. M. Mench, “Liquid droplet behavior and insta-bility in a polymer electrolyte fuel cell flow channel,” Journal of Power Sources,161, 333 (2006).
254. K. S. Chen, M. A. Hickner, and D. R. Noble, “Simplified models for predicting theonset of liquid water droplet instability at the gas diffusion layer/gas flow channelinterface,” International Journal of Energy Research, 29, 1113 (2005).
255. G. L. He, P. W. Ming, Z. C. Zhao, A. Abudula, and Y. Xiao, “A two-fluid model fortwo-phase flow in PEMFCs,” Journal of Power Sources, 163, 864 (2007).
256. X. G. Yang, F. Y. Zhang, A. L. Lubawy, and C. Y. Wang, “Visualization of liq-uid water transport in a PEFC,” Electrochemical and Solid State Letters, 7, A408(2004).
257. A. Theodorakakos, T. Ous, A. Gavaises, J. M. Nouri, N. Nikolopoulos, andH. Yanagihara, “Dynamics of water droplets detached from porous surfaces ofrelevance to PEM fuel cells,” J. Colloid. Interf. Sci., 300, 673 (2006).
258. J. T. Gostick, M. A. Ioannidis, M. D. Pritzker, and M. W. Fowler, “Impact of LiquidWater on Reactant Mass Transfer in PEM Fuel Cell Electrodes,” Journal of theElectrochemical Society, 157, B563 (2010).
259. A. D. Santamaria, P. K. Das, J. C. MacDonald, and A. Z. Weber, ‘Liquid-WaterInteractions with Gas-Diffusion-Layer Surfaces,’ J. Electrochem. Soc., 161(12),F1184 (2014).
260. S. Litster, D. Sinton, and N. Djilali, “Ex situ visualization of liquid water transportin PEM fuel cell gas diffusion layers,” Journal of Power Sources, 154, 95 (2006).
261. R. H. Perry and D. W. Green, Perry’s Chemical Engineers’ Handbook, McGraw-Hill, New York (1997).
262. M. J. Fuerstman, A. Lai, M. E. Thrlow, S. S. Shevkoplyas, H. A. Stone, andG. M. Whitesides, Lab on a Chip, 7, 1479 (2007).
263. T. A. Greszler, D. Caulk, and P. Sinha, “The impact of platinum loading on oxygentransport resistance,” J. Electrochem. Soc., 159, F831 (2012).
264. A. Ohma, T. Mashio, K. Sato, H. Iden, Y. Ono, K. Sakai, K. Akizuki, S. Takaichi, andK. Shinohara, “Analysis of proton exchange membrane fuel cell catalyst layers forreduction of platinum loading at Nissan,” Electrochimica Acta, 56, 10832 (2011).
265. M. K. Debe, “Effect of Electrode Surface Area Distribution on High Current DensityPerformance of PEM Fuel Cells,” Journal of the Electrochemical Society, 159, B54(2012).
266. N. Nonoyama, S. Okazaki, A. Z. Weber, Y. Ikogi, and T. Yoshida, “Analysis ofoxygen-transport diffusion resistance in proton-exchange-membrane fuel cells,” J.Electrochem. Soc., 158, B416 (2011).
267. M. Kobayashi, Y. Tabe, and T. Chikahisa, “Analysis and experiments of majorparameters in catalyst layer structure affecting on PEFC performance,” ECS Trans.,50(2), 415 (2012).
268. K. Malek, M. Eikerling, Q. P. Wang, T. C. Navessin, and Z. S. Liu, “Self-organization in catalyst layers of polymer electrolyte fuel cells,” Journal of PhysicalChemistry C, 111, 13627 (2007).
269. H. Mizukawa and M. Kawaguchi, “Effects of Perfluorosulfonic Acid Adsorption onthe Stability of Carbon Black Suspensions,” Langmuir, 25, 11984 (2009).
270. T. Soboleva, X. S. Zhao, K. Mallek, Z. Xie, T. Navessin, and S. Holdcroft, “On theMicro-, Meso- and Macroporous Structures of Polymer Electrolyte Membrane FuelCell Catalyst Layers,” Acs Applied Materials & Interfaces, 2, 375 (2010).
271. J. Xie, D. L. Wood, K. L. More, P. Atanassov, and R. L. Borup, “Microstructuralchanges of membrane electrode assemblies during PEFC durability testing at highhumidity conditions,” Journal of the Electrochemical Society, 152, A1011 (2005).
272. M. F. Mathias, R. Makharia, H. A. Gasteiger, J. J. Conley, T. J. Fuller,C. J. Gittleman, S. S. Kocha, D. P. Miller, C. K. Mittelsteadt, T. Xie, S. G. Van,and P. T. Yu, “Two fuel cell cars in every garage?,” Electrochemical Society Inter-face, 14, 24 (2005).
273. T. Mashio, K. Malek, M. Eikerling, A. Ohma, H. Kanesaka, and K. Shinohara,“Molecular Dynamics Study of Ionomer and Water Adsorption at Carbon SupportMaterials,” Journal of Physical Chemistry C, 114, 13739 (2010).
274. Z. Xie, T. Navessin, K. Shi, R. Chow, Q. P. Wang, D. T. Song, B. Andreaus,M. Eikerling, Z. S. Liu, and S. Holdcroft, “Functionally graded cathode cata-lyst layers for polymer electrolyte fuel cells - II. Experimental study of the ef-fect of Nafion distribution,” Journal of the Electrochemical Society, 152, A1171(2005).
275. D. Gerteisen, T. Heilmann, and C. Ziegler, “Modeling the phenomena of dehydrationand flooding of a polymer electrolyte membrane fuel cell,” Journal of Power Sources,187, 165 (2009).
276. F. Gloaguen, P. Convert, S. Gamburzev, O. A. Velev, and S. Srinivasan, “An eval-uation of the macro-homogeneous and agglomerate model for oxygen reduction inPEMFCs,” Electrochimica Acta, 43, 3767 (1998).
277. D. Harvey, J. G. Pharoah, and K. Karan, “A comparison of different approaches tomodelling the PEMFC catalyst layer,” Journal of Power Sources, 179, 209 (2008).
278. D. H. Schwarz and N. Djilali, “Three-dimensional modelling of catalyst layers inPEM fuel cells: Effects of non-uniform catalyst loading,” International Journal ofEnergy Research, 33, 631 (2009).
279. M. Secanell, K. Karan, A. Suleman, and N. Djilali, “Multi-variable optimizationof PEMFC cathodes using an agglomerate model,” Electrochimica Acta, 52, 6318(2007).
280. A. A. Shah, G. S. Kim, P. C. Sui, and D. Harvey, “Transient non-isothermal modelof a polymer electrolyte fuel cell,” Journal of Power Sources, 163, 793 (2007).
281. W. Sun, B. A. Peppley, and K. Karan, “An improved two-dimensional agglomer-ate cathode model to study the influence of catalyst layer structural parameters,”Electrochimica Acta, 50, 3359 (2005).
282. Z. T. Xia, Q. P. Wang, M. Eikerling, and Z. S. Liu, “Effectiveness factor of Ptutilization in cathode catalyst layer of polymer electrolyte fuel cells,” CanadianJournal of Chemistry-Revue Canadienne De Chimie, 86, 657 (2008).
283. L. Rubatat, G. Gebel, and O. Diat, “Fibrillar structure of Nafion: Matching Fourierand real space studies of corresponding films and solutions,” Macromolecules, 37,7772 (2004).
) unless CC License in place (see abstract). ecsdl.org/site/terms_use address. Redistribution subject to ECS terms of use (see 128.240.225.120Downloaded on 2014-09-14 to IP
Journal of The Electrochemical Society, 161 (12) F1254-F1299 (2014) F1295
284. S. J. Lee, T. L. Yu, H. L. Lin, W. H. Liu, and C. L. Lai, “Solution properties ofnafion in methanol/water mixture solvent,” Polymer, 45, 2853 (2004).
285. H. N. Zhang, J. J. Pan, X. C. He, and M. Pan, “Zeta potential of Nafion moleculesin isopropanol-water mixture solvent,” Journal of Applied Polymer Science, 107,3306 (2008).
286. K. Barbosa, J. Andaverde, B. Escobar, and U. Cano, “Stochastic reconstruction anda scaling method to determine effective transport coefficients of a proton exchangemembrane catalyst layer,” Journal of Power Sources, 196, 1248 (2011).
287. G. Wang, P. P. Mukherjee, and C.-Y. Wang, “Optimization of polymer electrolytefuel cell cathode catalyst layers via direct numerical simulation modeling,” Elec-trochimica Acta, 52, 6367 (2007).
288. G. Wang, P. P. Mukherjee, and C.-Y. Wang, “Direct numerical simulation (DNS)modeling of PEFC electrodes: Part II Random microstructure,” Electrochimica Acta,51, 3151 (2006).
289. K. J. Lange, P.-C. Sui, and N. Djilali, “Determination of effective transport propertiesin a PEMFC catalyst layer using different reconstruction algorithms,” Journal ofPower Sources, 208, 354 (2012).
290. K. J. Lange, C. Misra, P.-C. Sui, and N. Djilali, “A numerical study on precondi-tioning and partitioning schemes for reactive transport in a PEMFC catalyst layer,”Comput. Methods Appl. Engrg., 200, 905 (2011).
291. N. A. Siddique and F. Liu, “Process based reconstruction and simulation of a three-dimensional fuel cell catalyst layer,” Electrochimica Acta, 55, 5357 (2010).
292. J. Zhang, W. Yang, L. Xu, and Y. Wang, “Simulation of the catalyst layer inPEMFC based on a novel two-phase lattice model,” Electrochimica Acta, 56, 6912(2011).
293. S. Thiele, R. Zengerle, and C. Ziegler, “Nano-morphology of a Polymer ElectrolyteFuel Cell Catalyst Layer – Imaging, Reconstruction, and Analysis,” Nano Res., 4,849 (2011).
294. S. Thiele, T. Furstenhaupt, D. Banham, D. Hutzenlaub, V. Birss, C. Ziegler, andR. Zengerle, “Multiscale tomography of nanoporous carbon-supported noble metalcatalyst layers,” Journal of Power Sources, 228, 185 (2013).
295. K. J. Lange, H. Carlsson, I. Stewart, P.-C. Sui, R. Herring, and N. Djilali, “PEMfuel cell CL characterization using a standalone FIB and SEM: Experiments andSimulation,” Electrochimica Acta, 85, 322 (2012).
296. C. H. Cheng, K. Malek, P. C. Sui, and N. Djilali, “Effect of Pt nano-particle size onthe microstructure of PEM fuel cell catalyst layer: Insights from molecular dynamicsimulations,” Electrochimica Acta, 55, 1588 (2010).
297. S. Ban, M. Koroush, C. Huang, and Z. Liu, “A molecular model for carbon blackprimary particules with internal nanoporosity,” Carbon, 49, 3362 (2011).
298. S. A. Eastman, S. Kim, K. A. Page, B. W. Rowe, S. H. Kang, S. C. DeCaluwe,J. A. Dura, C. L. Soles, and K. G. Yager, “Effect of Confinement on Structure,Water Solubility, and Water Transport in Nafion Thin Films,” Macromolecules, 45,7920 (2012).
299. S. K. Dishari and M. A. Hickner, “Antiplasticization and Water Uptake of NafionThin Films,” Acs Macro Lett, 1, 291 (2012).
300. M. A. Modestino, D. K. Paul, S. Dishari, S. A. Petrina, F. I. Allen, M. A. Hickner,K. Karan, R. A. Segalman, and A. Z. Weber, “Self-Assembly and Transport Limi-tations in Confined Nafion Films,” Macromolecules, 46, 867 (2013).
301. P. Bertoncello, I. Ciani, F. Li, and P. R. Unwin, “Measurement of apparent diffu-sion coefficients within ultrathin Nafion Langmuir-Schaefer films: Comparison ofa novel scanning electrochemical microscopy approach with cyclic voltammetry,”Langmuir, 22, 10380 (2006).
302. Z. Siroma, R. Kakitsubo, N. Fujiwara, T. Ioroi, S. I. Yamazaki, and K. Yasuda,“Depression of proton conductivity in recast Nafion (R) film measured on flatsubstrate,” Journal of Power Sources, 189, 994 (2009).
303. A. Kongkanand, “Interfacial Water Transport Measurements in Nafion Thin FilmsUsing a Quartz-Crystal Microbalance,” The Journal of Physical Chemistry C, 115,11318 (2011).
304. S. K. Dishari and M. A. Hickner, “Confinement and Proton Transfer in NAFIONThin Films,” Macromolecules, 46, 413 (2013).
305. A. Kusoglu, D. Kushner, D. K. Paul, K. Karan, M. A. Hickner, and A. Z. Weber,“Impact of Substrate and Processing on Confinement of Nafion Thin Films,” Ad-vanced Functional Materials, 24(30), 4763 (2014).
306. D. Natarajan and T. V. Nguyen, “A Two-Dimensional, Two-Phase, Multicomponent,Transient Model for the Cathode of a Proton Exchange Membrane Fuel Cell UsingConventional Gas Distributors,” Journal of the Electrochemical Society, 148, A1324(2001).
307. D. Natarajan and T. V. Nguyen, “Three-dimensional effects of liquid water floodingin the cathode of a PEM fuel cell,” Journal of Power Sources, 115, 66 (2003).
308. W. He, J. S. Yi, and T. V. Nguyen, “Two-Phase Flow Model of the Cathode ofPEM Fuel Cells Using Interdigitated Flow Fields,” AIChE Journal, 46, 2053(2000).
309. S.-H. Ge and B.-L. Yi, “A mathematical model for PEMFC in different flow modes,”Journal of Power Sources, 124, 1 (2003).
310. Z. H. Wang, C. Y. Wang, and K. S. Chen, “Two-phase flow and transport in the aircathode of proton exchange membrane fuel cells,” Journal of Power Sources, 94,40 (2001).
311. J. J. Baschuk and X. Li, “Modelling of polymer electrolyte membrane fuel cellswith variable degrees of water flooding,” Journal of Power Sources, 86, 181(2000).
312. C. Marr and X. G. Li, “Composition and performance modelling of catalyst layerin a proton exchange membrane fuel cell,” Journal of Power Sources, 77, 17(1999).
313. A. Patel, K. Artyushkova, P. Atanassov, V. Colbow, M. Dutta, D. Harvey, andS. Wessel, “Investigating the effects of proton exchange membrane fuel cell condi-
tions on carbon supported platinum electrocatalyst composition and performance,”J Vac Sci Technol A, 30 (2012).
314. F. C. Cetinbas, S. G. Advani, and A. K. Prasad, “A modified agglomerate modelwith discrete catalyst particles for the PEM fuel cell catalyst layer,” J. Electrochem.Soc., 160, F750 (2013).
315. R. P. Iczkowski and M. B. Cutlip, “Voltage Losses in Fuel-Cell Cathodes,” Journalof the Electrochemical Society, 127, 1433 (1980).
316. S. J. Ridge, R. E. White, Y. Tsou, R. N. Beaver, and G. A. Eisman, “Oxygen Re-duction in a Proton-Exchange Membrane Test Cell,” Journal of the ElectrochemicalSociety, 136, 1902 (1989).
317. H. van Bussel, F. G. H. Koene and R. Mallant, “Dynamic model of solid polymerfuel cell water management,” Journal of Power Sources, 71, 218 (1998).
318. N. P. Siegel, M. W. Ellis, D. J. Nelson, and M. R. von Spakovsky, “Single domainPEMFC model based on agglomerate catalyst geometry,” Journal of Power Sources,115, 81 (2003).
319. P. Stonehart and P. N. Ross, “Use of Porous-Electrodes to Obtain Kinetic Rate Con-stants for Rapid Reactions and Adsorption-Isotherms of Poisons,” ElectrochimicaActa, 21, 441 (1976).
320. V. Gurau, F. Barbir, and H. Liu, “An Analytical Solution of a Half-CellModel for PEM Fuel Cells,” Journal of the Electrochemical Society, 147, 2468(2000).
321. M. Maja, P. Tosco, and M. Vanni, “A One-Dimensional Model of Gas-DiffusionElectrodes for O2 Reduction,” Journal of the Electrochemical Society, 148, A1368(2003).
322. W. Sun, B. A. Peppley, and K. Karan, “An improved two-dimensional agglomer-ate cathode model to study the influence of catalyst layer structure parameters,”Electrochimica Acta, 50, 3359 (2005).
323. H. S. Fogler, Elements of Chemical Reaction Engineering, Prentice-Hall, UpperSaddle River, NJ (1992).
324. D. R. Baker, D. A. Caulk, K. C. Neyerlin, and M. W. Murphy, “Measurement ofOxygen Transport Resistance in PEM Fuel Cells by Limiting Current Methods,”J. Electrochem. Soc., 156, B991 (2009).
325. N. Nonoyama, S. Okazaki, A. Z. Weber, Y. Ikogi, and T. Yoshida, “Analysisof Oxygen-Transport Diffusion Resistance in Proton-Exchange-Membrane FuelCells,” J. Electrochem. Soc., 158, B416 (2011).
326. T. Soboleva, K. Malek, Z. Xie, T. Navessin, and S. Holdcroft, “PEMFC CatalystLayers: The Role of Micropores and Mesopores on Water Sorption and Fuel CellActivity,” Acs Applied Materials & Interfaces, 3, 1827 (2011).
327. H. Iden, K. Sato, A. Ohma, and K. Shinohara, “Relationship among Microstructure,Ionomer Property and Proton Transport in Pseudo Catalyst Layers,” Journal of theElectrochemical Society, 158, B987 (2011).
328. J. Peron, D. Edwards, M. Haldane, X. Y. Luo, Y. M. Zhang, S. Holdcroft, andZ. Q. Shi, “Fuel cell catalyst layers containing short-side-chain perfluorosulfonicacid ionomers,” Journal of Power Sources, 196, 179 (2011).
329. T. Soboleva, K. Malek, Z. Xie, T. Navessin, and S. Holdcroft, “PEMFC catalystlayers: the role of micropores and mesopores on water sorption and fuel cell activity,”ACS Appl Mater Interfaces, 3, 1827 (2011).
330. A. Suzuki, U. Sen, T. Hattori, R. Miura, R. Nagumo, H. Tsuboi, N. Hatakeyama,A. Endou, H. Takaba, M. C. Williams, and A. Miyamoto, “Ionomer content inthe catalyst layer of polymer electrolyte membrane fuel cell (PEMFC): Effects ondiffusion and performance,” International Journal of Hydrogen Energy, 36, 2221(2011).
331. A. Ohma, T. Mashio, K. Sato, H. Iden, Y. Ono, K. Sakai, K. Akizuki, S. Takaichi, andK. Shinohara, “Analysis of proton exchange membrane fuel cell catalyst layers forreduction of platinum loading at Nissan,” Electrochimica Acta, 56, 10832 (2011).
332. K. C. Hess, W. K. Epting, and S. Litster, “Spatially Resolved, In Situ PotentialMeasurements through Porous Electrodes As Applied to Fuel Cells,” AnalyticalChemistry, 83, 9492 (2011).
333. R. Makharia, M. F. Mathias, and D. R. Baker, “Measurement of Catalyst LayerElectrolyte Resistance in PEFCs Using Electrochemical Impedance Spectroscopy,”Journal of The Electrochemical Society, 152, A970 (2005).
334. Y. Liu, M. Murphy, D. Baker, W. Gu, C. Ji, J. Jorne, and H. A. Gasteiger, “Determi-nation of Electrode Sheet Resistance in Cathode Catalyst Layer by AC Impedance,”ECS Transactions, 11, 473 (2007).
335. K. Karan, ECS Trans., 50, 395 (2013).336. G. Y. Lin and T. Van Nguyen, “A two-dimensional two-phase model of a PEM fuel
cell,” Journal of the Electrochemical Society, 153, A372 (2006).337. G. Y. Lin, W. S. He, and T. Van Nguyen, “Modeling liquid water effects in the gas
diffusion and catalyst layers of the cathode of a PEM fuel cell,” Journal of theElectrochemical Society, 151, A1999 (2004).
338. T. Suzuki, K. Kudo, and Y. Morimoto, “Model for investigation of oxygen transportlimitation in a polymer electrolyte fuel cell,” J. Power Sources, 222, 379 (2013).
339. K. Kudo and Y. Morimoto, “Analysis of Oxygen Transport Resistance of Nafionthin film on Pt electrode,” ECS Trans., 50(2), 1487 (2012).
340. S. Jomori, K. Komatsubara, N. Nonoyama, M. Kato, and T. Yoshida, “An Ex-perimental Study of the Effects of Operational History on Activity Changes in aPEMFC,” J. Electrochem. Soc., 160, F1067 (2013).
341. J. P. Owejan, J. E. Owejan, and W. Gu, “Impact of platinum loading and catalystlayer structure on PEMFC performance,” J. Electrochem. Soc., 160, F824 (2013).
342. J. N. L. Albert and T. H. Epps Iii, “Self-assembly of block copolymer thin films,”Mater Today, 13, 24 (2010).
343. R. A. Segalman, “Patterning with block copolymer thin films,” Mat Sci Eng R, 48,191 (2005).
344. M. J. Fasolka and A. M. Mayes, “BLOCKCOPOLYMERTHINFILMS: Physics andApplications1,” Annual Review of Materials Research, 31, 323 (2001).
) unless CC License in place (see abstract). ecsdl.org/site/terms_use address. Redistribution subject to ECS terms of use (see 128.240.225.120Downloaded on 2014-09-14 to IP
F1296 Journal of The Electrochemical Society, 161 (12) F1254-F1299 (2014)
345. T. P. Russell, P. Lambooy, G. J. Kellogg, and A. M. Mayes, “Diblock Copolymersunder Confinement,” Physica B, 213, 22 (1995).
346. E. Huang, T. P. Russell, C. Harrison, P. M. Chaikin, R. A. Register, C. J. Hawker, andJ. Mays, “Using surface active random copolymers to control the domain orientationin diblock copolymer thin films,” Macromolecules, 31, 7641 (1998).
347. M. Bass, A. Berman, A. Singh, O. Konovalov, and V. Freger, “Surface Structure ofNafion in Vapor and Liquid,” Journal of Physical Chemistry B, 114, 3784 (2010).
348. M. Bass, A. Berman, A. Singh, O. Konovalov, and V. Freger, “Surface-InducedMicelle Orientation in Nafion Films,” Macromolecules, 44, 2893 (2011).
349. R. Koestner, Y. Roiter, I. Kozhinova, and S. Minko, “AFM Imaging of AdsorbedNafion Polymer on Mica and Graphite at Molecular Level,” Langmuir, 27, 10157(2011).
350. S. A. Eastman, S. Kim, K. A. Page, B. W. Rowe, S. Kang, C. L. Soles, andK. G. Yager, “Effect of Confinement on Structure, Water Solubility, and WaterTransport in Nafion Thin Films,” Macromolecules, 45, 7920 (2012).
351. M. A. Modestino, A. Kusoglu, A. Hexemer, A. Z. Weber, and R. A. Segalman,“Controlling Nafion Structure and Properties via Wetting Interactions,” Macro-molecules, 45, 4681 (2012).
352. D. K. Paul, A. Fraser, and K. Karan, “Towards the understanding of proton conduc-tion mechanism in PEMFC catalyst layer: Conductivity of adsorbed Nafion films,”Electrochem Commun, 13, 774 (2011).
353. D. K. Paul, A. Fraser, and K. Karan, “Understanding the Ionomer Structure andthe Proton Conduction Mechanism in PEFC Catalyst Layer: Adsorbed Nafion onModel Substrate,” ECS Transactions, 41, 1393 (2011).
354. K. A. Page, A. Kusoglu, C. M. Stafford, S. Kim, R. J. Kline, and A. Z. Weber,“Confinement-Driven Increase in Ionomer Thin-Film Modulus,” Nano Lett, 14,2299 (2014).
355. J. A. Dura, V. S. Murthi, M. Hartman, S. K. Satija, and C. F. Majkrzak,“Multilamellar Interface Structures in Nafion,” Macromolecules, 42, 4769(2009).
356. H. F. M. Mohamed, S. Kuroda, Y. Kobayashi, N. Oshima, R. Suzuki, and A. Ohira,“Possible presence of hydrophilic SO3H nanoclusters on the surface of dry ultrathinNafion (R) films: a positron annihilation study,” Phys Chem Chem Phys, 15, 1518(2013).
357. K. Umemura, T. Wang, M. Hara, R. Kuroda, O. Uchida, and M. Nagai, “Nanochar-acterization and nanofabrication of a Nafion thin film in liquids by atomic forcemicroscopy,” Langmuir, 22, 3306 (2006).
358. D. K. Paul, K. Karan, A. Docoslis, J. B. Giorgi, and J. Pearce, “Character-istics of Self-Assembled Ultrathin Nafion Films,” Macromolecules, 46, 3461(2013).
359. G. Dorenbos, V. A. Pomogaev, M. Takigawa, and K. Morohoshi, “Prediction ofanisotropic transport in Nafion containing catalyst layers,” Electrochemistry Com-munications, 12, 125 (2010).
360. R. Subbaraman, D. Strmcnik, A. P. Paulikas, V. R. Stamenkovic, andN. M. Markovic, “Oxygen Reduction Reaction at Three-Phase Interfaces,”Chemphyschem, 11, 2825 (2010).
361. R. Subbaraman, D. Strmcnik, V. Stamenkovic, and N. M. Markovic, “Three PhaseInterfaces at Electrified Metal-Solid Electrolyte Systems 1. Study of the Pt(hkl)-Nafion Interface,” Journal of Physical Chemistry C, 114, 8414 (2010).
362. M. K. Debe, A. K. Schmoeckel, G. D. Vernstrorn, and R. Atanasoski, “High voltagestability of nanostructured thin film catalysts for PEM fuel cells,” Journal of PowerSources, 161, 1002 (2006).
363. M. K. Debe, in DOE Hydrogen Program Annual Merit Review, Arlington, VA(2009).
364. M. K. Debe, in DOE Hydrogen Program Annual Merit Review, Washinton, DC(2010).
365. M. Eikerling, “Water management in cathode catalyst layers of PEM fuel cells -A structure-based model,” Journal of the Electrochemical Society, 153, E58(2006).
366. J. McBreen, “Voltammetric Studies of Electrodes in Contact with Ionomeric Mem-branes,” Journal of The Electrochemical Society, 132, 1112 (1985).
367. U. A. Paulus, Z. Veziridis, B. Schnyder, M. Kuhnke, G. G. Scherer, and A. Wokaun,“Fundamental investigation of catalyst utilization at the electrode/solid polymerelectrolyte interface - Part I. Development of a model system,” J. ElectroanalyticalChem., 541, 77 (2003).
368. Q. Wang, C. S. Cha, J. T. Lu, and L. Zhuang, “The electrochemistry of “solid/water”interfaces involved in PEM-H2O reactors Part I. The “Pt/water” interfaces,” PhysChem Chem Phys, 11, 679 (2009).
369. W. Y. Tu, W. J. Liu, C. S. Cha, and B. L. Wu, “Study of the powder/membraneinterface by using the powder microelectrode technique I. The Pt-black/Nafion (R)interfaces,” Electrochimica Acta, 43, 3731 (1998).
370. M. K. Debe, “Tutorial on the Fundamental Characteristics and Practical Propertiesof Nanostructured Thin Film (NSTF) Catalysts,” Journal of the ElectrochemicalSociety, 160, F522 (2013).
371. K. Chan and M. Eikerling, “A Pore-Scale Model of Oxygen Reduction in Ionomer-Free Catalyst Layers of PEFCs,” Journal of the Electrochemical Society, 158, B18(2011).
372. S. Tominaka, C. W. Wu, K. Kuroda, and T. Osaka, “Electrochemical analysis ofperpendicular mesoporous Pt electrode filled with pure water for clarifying theactive region in fuel cell catalyst layers,” Journal of Power Sources, 195, 2236(2010).
373. S. Tominaka, K. Goto, T. Momma, and T. Osaka, “Ionic conductivity improve-ment in primary pores of fuel cell catalyst layers: Electropolymerization of m-aminobenzenesulfonic acid and its effect on the performance,” Journal of PowerSources, 192, 316 (2009).
374. K. Shinozaki, H. Yamada, and Y. Morimoto, “Pt Utilization Analysis at Low RHCondition,” ECS Transactions, 33, 1217 (2010).
375. N. Ikeda, N. Nonoyama, and Y. Ikogi, “Analysis of the Ionomer Coverage of PtSurface in PEMFC,” ECS Transactions, 33 1189 (2010).
376. E. L. Thompson and D. Baker, “Proton Conduction on Ionomer-Free Pt Surfaces,”ECS Transactions, 41, 709 (2011).
377. S. J. An and S. Litster, “In Situ, Ionic Conductivity Measurement of Ionomer/Binder-Free Pt Catalyst under Fuel Cell Operating Condition,” ECS Transactions, 58, 831(2013).
378. Y. X. Liu, C. X. Ji, W. B. Gu, J. Jorne, and H. A. Gasteiger, “Effects of CatalystCarbon Support on Proton Conduction and Cathode Performance in PEM FuelCells,” Journal of The Electrochemical Society, 158, B614 (2011).
379. Q. P. Wang, M. Eikerling, D. T. Song, and Z. S. Liu, “Modeling of ultrathin two-phase catalyst layers in PEFCs,” Journal of The Electrochemical Society, 154, F95(2007).
380. I. V. Zenyuk and S. Litster, “Spatially Resolved Modeling of Electric DoubleLayers and Surface Chemistry for the Hydrogen Oxidation Reaction in Water-Filled Platinum-Carbon Electrodes,” Journal of Physical Chemistry C, 116, 9862(2012).
381. I. V. Zenyuk and S. Litster, “Spatially-Resolved Modeling of Electric Double Layersfor the Oxygen Reduction Reaction in Water-Filled Platinum Electrodes,” ECSTransactions, 58, 27 (2013).
382. R. F. Probstein, Physicochemical Hydrodynamics, John Wiley & Sons, Hoboken,NJ (2003).
383. H.-K. Tsao, “Counterion Distribution Enclosed in a Cylinder and a Sphere,” TheJournal of Physical Chemistry B, 102, 10243 (1998).
384. H.-K. Tsao, “Effects of Salt Addition on the Ion Distribution Enclosed in a Cylinderand a Sphere,” Langmuir, 15, 4981 (1999).
385. P. Berg and K. Ladipo, “Exact solution of an electro-osmotic flow problem ina cylindrical channel of polymer electrolyte membranes,” Proceedings of theRoyal Society A: Mathematical, Physical and Engineering Science, 465, 2663(2009).
386. M. Eikerling, A. A. Kornyshev, A. M. Kuznetsov, J. Ulstrup, and S. Walbran,“Mechanisms of proton conductance in polymer electrolyte membranes,” Journalof Physical Chemistry B, 105, 3646 (2001).
387. H. Ohshima and T. Kondo, “Membrane-Potential and Donnan Potential,” BiophysChem, 29, 277 (1988).
388. H. Ohshima and S. Ohki, “Donnan Potential and Surface-Potential of a ChargedMembrane,” Biophys J, 47, 673 (1985).
389. E. M. Itskovich, A. A. Kornyshev, and M. A. Vorotyntsev, “Electric current acrossthe metal–solid electrolyte interface I. Direct current, current–voltage characteris-tic,” physica status solidi (a), 39, 229 (1977).
390. P. M. Biesheuvel, Y. Q. Fu, and M. Z. Bazant, “Diffuse charge and Faradaic reactionsin porous electrodes,” Physical Review E, 83 (2011).
391. P. M. Biesheuvel, M. van Soestbergen, and M. Z. Bazant, “Imposed currents ingalvanic cells,” Electrochimica Acta, 54, 4857 (2009).
392. M. van Soestbergen, P. M. Biesheuvel, and M. Z. Bazant, “Diffuse-charge effectson the transient response of electrochemical cells,” Physical Review E, 81 (2010).
393. A. A. Franco, P. Schott, C. Jallut, and B. Maschke, “A Dynamic MechanisticModel of an Electrochemical Interface,” Journal of the Electrochemical Society,153, A1053 (2006).
394. S. Trasatti and E. Lust, in Modern Aspects of Electrochemistry, R. White, Editor(1999).
395. Q.-S. Chen, J. Solla-Gullon, S.-G. Sun, and J. M. Feliu, “The potential of zero totalcharge of Pt nanoparticles and polycrystalline electrodes with different surface struc-ture The role of anion adsorption in fundamental electrocatalysis,” ElectrochimicaActa, 55, 7982 (2010).
396. J. O. Bockris, A. K. N. Reddy, and M. Gamboa-Aldeco, Modern Electrochemistry2A: Fundamental of Electrodics, Springer, New York (2000).
397. P. M. Biesheuvel, A. A. Franco, and M. Z. Bazant, “Diffuse Charge Effects in FuelCell Membranes,” Journal of the Electrochemical Society, 156, B225 (2009).
398. A. Bonnefont, F. Argoul, and M. Z. Bazant, “Analysis of diffuse-layer effects ontime-dependent interfacial kinetics,” Journal of Electroanalytical Chemistry, 500,52 (2001).
399. M. Z. Bazant, K. T. Chu, and B. J. Bayly, “Current-voltage relations for electro-chemical thin films,” Siam J Appl Math, 65, 1463 (2005).
400. F. Tian, R. Jinnouchi, and A. B. Anderson, “How Potentials of Zero Charge and Po-tentials for Water Oxidation to OH(ads) on Pt(111) Electrodes Vary With Coverage,”Journal of Physical Chemistry C, 113, 17484 (2009).
401. D. T. Limmer, A. P. Willard, P. Madden, and D. Chandler, “Hydration of metalsurfaces can be dynamically heterogeneous and hydrophobic,” Proceedings of theNational Academy of Sciences of the United States of America, 110, 4200 (2013).
402. K. Kinoshita, Carbon. Electrochemical and Physiochemical Properties, John Wiley& Sons, New York (1988).
403. A. Pandy, Z. W. Yang, M. Gummalla, V. V. Atrazhev, N. Y. Kuzminyh,V. I. Sultanov, and S. Burlatsky, “A Carbon Corrosion Model to Evaluate the Effectof Steady State and Transient Operation of a Polymer Electrolyte Membrane FuelCell,” Journal of the Electrochemical Society, 160, F972 (2013).
404. K. G. Gallagher, R. M. Darling, and T. F. Fuller, in Handbook of Fuel Cells: Fun-damentals, Technology, and Applications, Vol. 5, W. Vielstich, A. Lamm, andH. A. Gasteiger Editors, John Wiley & Sons, Inc., New York (2010).
405. S. Maass, F. Finsterwalder, G. Frank, R. Hartmann, and C. Merten, “Carbon supportoxidation in PEM fuel cell cathodes,” Journal of Power Sources, 176, 444 (2008).
406. J. D. Fairweather, D. Spernjak, A. Z. Weber, D. Harvey, S. Wessel, D. S. Hussey,D. L. Jacobson, K. Artyushkova, R. Mukundan, and R. L. Borup, “Effects of Cath-
) unless CC License in place (see abstract). ecsdl.org/site/terms_use address. Redistribution subject to ECS terms of use (see 128.240.225.120Downloaded on 2014-09-14 to IP
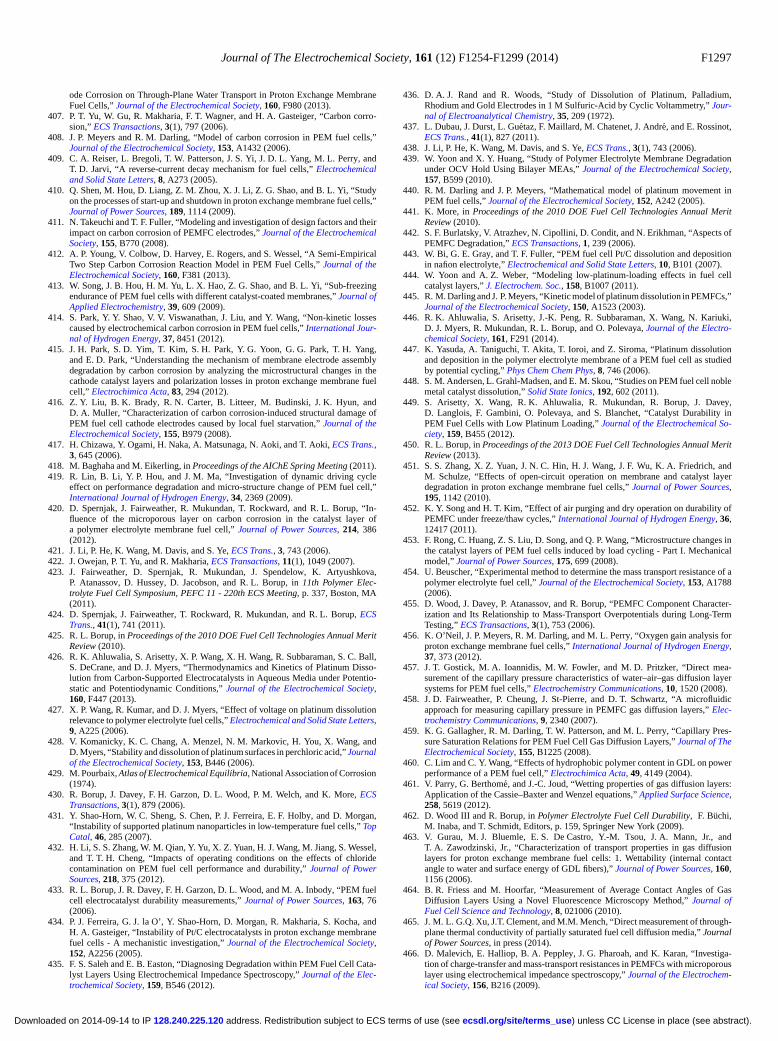
Journal of The Electrochemical Society, 161 (12) F1254-F1299 (2014) F1297
ode Corrosion on Through-Plane Water Transport in Proton Exchange MembraneFuel Cells,” Journal of the Electrochemical Society, 160, F980 (2013).
407. P. T. Yu, W. Gu, R. Makharia, F. T. Wagner, and H. A. Gasteiger, “Carbon corro-sion,” ECS Transactions, 3(1), 797 (2006).
408. J. P. Meyers and R. M. Darling, “Model of carbon corrosion in PEM fuel cells,”Journal of the Electrochemical Society, 153, A1432 (2006).
409. C. A. Reiser, L. Bregoli, T. W. Patterson, J. S. Yi, J. D. L. Yang, M. L. Perry, andT. D. Jarvi, “A reverse-current decay mechanism for fuel cells,” Electrochemicaland Solid State Letters, 8, A273 (2005).
410. Q. Shen, M. Hou, D. Liang, Z. M. Zhou, X. J. Li, Z. G. Shao, and B. L. Yi, “Studyon the processes of start-up and shutdown in proton exchange membrane fuel cells,”Journal of Power Sources, 189, 1114 (2009).
411. N. Takeuchi and T. F. Fuller, “Modeling and investigation of design factors and theirimpact on carbon corrosion of PEMFC electrodes,” Journal of the ElectrochemicalSociety, 155, B770 (2008).
412. A. P. Young, V. Colbow, D. Harvey, E. Rogers, and S. Wessel, “A Semi-EmpiricalTwo Step Carbon Corrosion Reaction Model in PEM Fuel Cells,” Journal of theElectrochemical Society, 160, F381 (2013).
413. W. Song, J. B. Hou, H. M. Yu, L. X. Hao, Z. G. Shao, and B. L. Yi, “Sub-freezingendurance of PEM fuel cells with different catalyst-coated membranes,” Journal ofApplied Electrochemistry, 39, 609 (2009).
414. S. Park, Y. Y. Shao, V. V. Viswanathan, J. Liu, and Y. Wang, “Non-kinetic lossescaused by electrochemical carbon corrosion in PEM fuel cells,” International Jour-nal of Hydrogen Energy, 37, 8451 (2012).
415. J. H. Park, S. D. Yim, T. Kim, S. H. Park, Y. G. Yoon, G. G. Park, T. H. Yang,and E. D. Park, “Understanding the mechanism of membrane electrode assemblydegradation by carbon corrosion by analyzing the microstructural changes in thecathode catalyst layers and polarization losses in proton exchange membrane fuelcell,” Electrochimica Acta, 83, 294 (2012).
416. Z. Y. Liu, B. K. Brady, R. N. Carter, B. Litteer, M. Budinski, J. K. Hyun, andD. A. Muller, “Characterization of carbon corrosion-induced structural damage ofPEM fuel cell cathode electrodes caused by local fuel starvation,” Journal of theElectrochemical Society, 155, B979 (2008).
417. H. Chizawa, Y. Ogami, H. Naka, A. Matsunaga, N. Aoki, and T. Aoki, ECS Trans.,3, 645 (2006).
418. M. Baghaha and M. Eikerling, in Proceedings of the AIChE Spring Meeting (2011).419. R. Lin, B. Li, Y. P. Hou, and J. M. Ma, “Investigation of dynamic driving cycle
effect on performance degradation and micro-structure change of PEM fuel cell,”International Journal of Hydrogen Energy, 34, 2369 (2009).
420. D. Spernjak, J. Fairweather, R. Mukundan, T. Rockward, and R. L. Borup, “In-fluence of the microporous layer on carbon corrosion in the catalyst layer ofa polymer electrolyte membrane fuel cell,” Journal of Power Sources, 214, 386(2012).
421. J. Li, P. He, K. Wang, M. Davis, and S. Ye, ECS Trans., 3, 743 (2006).422. J. Owejan, P. T. Yu, and R. Makharia, ECS Transactions, 11(1), 1049 (2007).423. J. Fairweather, D. Spernjak, R. Mukundan, J. Spendelow, K. Artyushkova,
P. Atanassov, D. Hussey, D. Jacobson, and R. L. Borup, in 11th Polymer Elec-trolyte Fuel Cell Symposium, PEFC 11 - 220th ECS Meeting, p. 337, Boston, MA(2011).
424. D. Spernjak, J. Fairweather, T. Rockward, R. Mukundan, and R. L. Borup, ECSTrans., 41(1), 741 (2011).
425. R. L. Borup, in Proceedings of the 2010 DOE Fuel Cell Technologies Annual MeritReview (2010).
426. R. K. Ahluwalia, S. Arisetty, X. P. Wang, X. H. Wang, R. Subbaraman, S. C. Ball,S. DeCrane, and D. J. Myers, “Thermodynamics and Kinetics of Platinum Disso-lution from Carbon-Supported Electrocatalysts in Aqueous Media under Potentio-static and Potentiodynamic Conditions,” Journal of the Electrochemical Society,160, F447 (2013).
427. X. P. Wang, R. Kumar, and D. J. Myers, “Effect of voltage on platinum dissolutionrelevance to polymer electrolyte fuel cells,” Electrochemical and Solid State Letters,9, A225 (2006).
428. V. Komanicky, K. C. Chang, A. Menzel, N. M. Markovic, H. You, X. Wang, andD. Myers, “Stability and dissolution of platinum surfaces in perchloric acid,” Journalof the Electrochemical Society, 153, B446 (2006).
429. M. Pourbaix, Atlas of Electrochemical Equilibria, National Association of Corrosion(1974).
430. R. Borup, J. Davey, F. H. Garzon, D. L. Wood, P. M. Welch, and K. More, ECSTransactions, 3(1), 879 (2006).
431. Y. Shao-Horn, W. C. Sheng, S. Chen, P. J. Ferreira, E. F. Holby, and D. Morgan,“Instability of supported platinum nanoparticles in low-temperature fuel cells,” TopCatal, 46, 285 (2007).
432. H. Li, S. S. Zhang, W. M. Qian, Y. Yu, X. Z. Yuan, H. J. Wang, M. Jiang, S. Wessel,and T. T. H. Cheng, “Impacts of operating conditions on the effects of chloridecontamination on PEM fuel cell performance and durability,” Journal of PowerSources, 218, 375 (2012).
433. R. L. Borup, J. R. Davey, F. H. Garzon, D. L. Wood, and M. A. Inbody, “PEM fuelcell electrocatalyst durability measurements,” Journal of Power Sources, 163, 76(2006).
434. P. J. Ferreira, G. J. la O’, Y. Shao-Horn, D. Morgan, R. Makharia, S. Kocha, andH. A. Gasteiger, “Instability of Pt/C electrocatalysts in proton exchange membranefuel cells - A mechanistic investigation,” Journal of the Electrochemical Society,152, A2256 (2005).
435. F. S. Saleh and E. B. Easton, “Diagnosing Degradation within PEM Fuel Cell Cata-lyst Layers Using Electrochemical Impedance Spectroscopy,” Journal of the Elec-trochemical Society, 159, B546 (2012).
436. D. A. J. Rand and R. Woods, “Study of Dissolution of Platinum, Palladium,Rhodium and Gold Electrodes in 1 M Sulfuric-Acid by Cyclic Voltammetry,” Jour-nal of Electroanalytical Chemistry, 35, 209 (1972).
437. L. Dubau, J. Durst, L. Guetaz, F. Maillard, M. Chatenet, J. Andre, and E. Rossinot,ECS Trans., 41(1), 827 (2011).
438. J. Li, P. He, K. Wang, M. Davis, and S. Ye, ECS Trans., 3(1), 743 (2006).439. W. Yoon and X. Y. Huang, “Study of Polymer Electrolyte Membrane Degradation
under OCV Hold Using Bilayer MEAs,” Journal of the Electrochemical Society,157, B599 (2010).
440. R. M. Darling and J. P. Meyers, “Mathematical model of platinum movement inPEM fuel cells,” Journal of the Electrochemical Society, 152, A242 (2005).
441. K. More, in Proceedings of the 2010 DOE Fuel Cell Technologies Annual MeritReview (2010).
442. S. F. Burlatsky, V. Atrazhev, N. Cipollini, D. Condit, and N. Erikhman, “Aspects ofPEMFC Degradation,” ECS Transactions, 1, 239 (2006).
443. W. Bi, G. E. Gray, and T. F. Fuller, “PEM fuel cell Pt/C dissolution and depositionin nafion electrolyte,” Electrochemical and Solid State Letters, 10, B101 (2007).
444. W. Yoon and A. Z. Weber, “Modeling low-platinum-loading effects in fuel cellcatalyst layers,” J. Electrochem. Soc., 158, B1007 (2011).
445. R. M. Darling and J. P. Meyers, “Kinetic model of platinum dissolution in PEMFCs,”Journal of the Electrochemical Society, 150, A1523 (2003).
446. R. K. Ahluwalia, S. Arisetty, J.-K. Peng, R. Subbaraman, X. Wang, N. Kariuki,D. J. Myers, R. Mukundan, R. L. Borup, and O. Polevaya, Journal of the Electro-chemical Society, 161, F291 (2014).
447. K. Yasuda, A. Taniguchi, T. Akita, T. Ioroi, and Z. Siroma, “Platinum dissolutionand deposition in the polymer electrolyte membrane of a PEM fuel cell as studiedby potential cycling,” Phys Chem Chem Phys, 8, 746 (2006).
448. S. M. Andersen, L. Grahl-Madsen, and E. M. Skou, “Studies on PEM fuel cell noblemetal catalyst dissolution,” Solid State Ionics, 192, 602 (2011).
449. S. Arisetty, X. Wang, R. K. Ahluwalia, R. Mukundan, R. Borup, J. Davey,D. Langlois, F. Gambini, O. Polevaya, and S. Blanchet, “Catalyst Durability inPEM Fuel Cells with Low Platinum Loading,” Journal of the Electrochemical So-ciety, 159, B455 (2012).
450. R. L. Borup, in Proceedings of the 2013 DOE Fuel Cell Technologies Annual MeritReview (2013).
451. S. S. Zhang, X. Z. Yuan, J. N. C. Hin, H. J. Wang, J. F. Wu, K. A. Friedrich, andM. Schulze, “Effects of open-circuit operation on membrane and catalyst layerdegradation in proton exchange membrane fuel cells,” Journal of Power Sources,195, 1142 (2010).
452. K. Y. Song and H. T. Kim, “Effect of air purging and dry operation on durability ofPEMFC under freeze/thaw cycles,” International Journal of Hydrogen Energy, 36,12417 (2011).
453. F. Rong, C. Huang, Z. S. Liu, D. Song, and Q. P. Wang, “Microstructure changes inthe catalyst layers of PEM fuel cells induced by load cycling - Part I. Mechanicalmodel,” Journal of Power Sources, 175, 699 (2008).
454. U. Beuscher, “Experimental method to determine the mass transport resistance of apolymer electrolyte fuel cell,” Journal of the Electrochemical Society, 153, A1788(2006).
455. D. Wood, J. Davey, P. Atanassov, and R. Borup, “PEMFC Component Character-ization and Its Relationship to Mass-Transport Overpotentials during Long-TermTesting,” ECS Transactions, 3(1), 753 (2006).
456. K. O’Neil, J. P. Meyers, R. M. Darling, and M. L. Perry, “Oxygen gain analysis forproton exchange membrane fuel cells,” International Journal of Hydrogen Energy,37, 373 (2012).
457. J. T. Gostick, M. A. Ioannidis, M. W. Fowler, and M. D. Pritzker, “Direct mea-surement of the capillary pressure characteristics of water–air–gas diffusion layersystems for PEM fuel cells,” Electrochemistry Communications, 10, 1520 (2008).
458. J. D. Fairweather, P. Cheung, J. St-Pierre, and D. T. Schwartz, “A microfluidicapproach for measuring capillary pressure in PEMFC gas diffusion layers,” Elec-trochemistry Communications, 9, 2340 (2007).
459. K. G. Gallagher, R. M. Darling, T. W. Patterson, and M. L. Perry, “Capillary Pres-sure Saturation Relations for PEM Fuel Cell Gas Diffusion Layers,” Journal of TheElectrochemical Society, 155, B1225 (2008).
460. C. Lim and C. Y. Wang, “Effects of hydrophobic polymer content in GDL on powerperformance of a PEM fuel cell,” Electrochimica Acta, 49, 4149 (2004).
461. V. Parry, G. Berthome, and J.-C. Joud, “Wetting properties of gas diffusion layers:Application of the Cassie–Baxter and Wenzel equations,” Applied Surface Science,258, 5619 (2012).
462. D. Wood III and R. Borup, in Polymer Electrolyte Fuel Cell Durability, F. Buchi,M. Inaba, and T. Schmidt, Editors, p. 159, Springer New York (2009).
463. V. Gurau, M. J. Bluemle, E. S. De Castro, Y.-M. Tsou, J. A. Mann, Jr., andT. A. Zawodzinski, Jr., “Characterization of transport properties in gas diffusionlayers for proton exchange membrane fuel cells: 1. Wettability (internal contactangle to water and surface energy of GDL fibers),” Journal of Power Sources, 160,1156 (2006).
464. B. R. Friess and M. Hoorfar, “Measurement of Average Contact Angles of GasDiffusion Layers Using a Novel Fluorescence Microscopy Method,” Journal ofFuel Cell Science and Technology, 8, 021006 (2010).
465. J. M. L. G.Q. Xu, J.T. Clement, and M.M. Mench, “Direct measurement of through-plane thermal conductivity of partially saturated fuel cell diffusion media,” Journalof Power Sources, in press (2014).
466. D. Malevich, E. Halliop, B. A. Peppley, J. G. Pharoah, and K. Karan, “Investiga-tion of charge-transfer and mass-transport resistances in PEMFCs with microporouslayer using electrochemical impedance spectroscopy,” Journal of the Electrochem-ical Society, 156, B216 (2009).
) unless CC License in place (see abstract). ecsdl.org/site/terms_use address. Redistribution subject to ECS terms of use (see 128.240.225.120Downloaded on 2014-09-14 to IP

F1298 Journal of The Electrochemical Society, 161 (12) F1254-F1299 (2014)
467. S. Park and B. N. Popov, “Effect of a GDL based on carbon paper or carbon clothon PEM fuel cell performance,” Fuel, 90, 436 (2011).
468. Z. Yu and R. Carter, “Measurements of Effective Oxygen Diffusivity, Pore SizeDistribution, and Porosity in PEM Fuel Cell Electrodes,” ECS Transactions, 19, 1(2009).
469. D. Malevich, B. R. Jayasankar, E. Halliop, J. G. Pharoah, B. A. Peppley, andK. Karan, “On the Determination of PEM Fuel Cell Catalyst Layer Resistancefrom Impedance Measurement in H-2/N-2 Cells,” Journal of the ElectrochemicalSociety, 159, F888 (2012).
470. G. Li and P. G. Pickup, “Ionic Conductivity of PEMFC Electrodes: Effect of NafionLoading,” Journal of The Electrochemical Society, 150, C745 (2003).
471. M. Uchida, Y. Aoyama, N. Eda, and A. Ohta, “Investigation of the Microstructurein the Catalyst Layer and Effects of Both Perfluorosulfonate Ionomer and PTFE-Loaded Carbon on the Catalyst Layer of Polymer Electrolyte Fuel Cells,” Journalof The Electrochemical Society, 142, 4143 (1995).
472. B. Carnes, D. Spernjak, G. Luo, L. Hao, K. S. Chen, C.-Y. Wang, R. Mukundan,and R. L. Borup, “Validation of a two-phase multidimensional polymer electrolytemembrane fuel cell computational model using current distribution measurements,”Journal of Power Sources, 236, 126 (2013).
473. C. Kalyvas, A. Kucernak, D. Brett, G. Hinds, S. Atkins, and N. Brandon, “Spatiallyresolved diagnostic methods for polymer electrolyte fuel cells: a review,” WileyInterdisciplinary Reviews: Energy and Environment, n/a (2013).
474. S. J. C. Cleghorn, C. R. Derouin, M. S. Wilson, and S. Gottesfeld, “A printed circuitboard approach to measuring current distribution in a fuel cell,” Journal of AppliedElectrochemistry, 28, 663 (1998).
475. D. Natarajan and T. Van Nguyen, “Current distribution in PEM fuel cells. Part 1:Oxygen and fuel flow rate effects,” AIChE Journal, 51, 2587 (2005).
476. D. Natarajan and T. Van Nguyen, “Current distribution in PEM fuel cells. Part 2:Air operation and temperature effect,” AIChE Journal, 51, 2599 (2005).
477. J. Stumper, S. A. Campbell, D. P. Wilkinson, M. C. Johnson, and M. Davis, “In-situ methods for the determination of current distributions in PEM fuel cells,”Electrochimica Acta, 43, 3773 (1998).
478. A. Bazylak, “Liquid water visualization in PEM fuel cells: A review,” InternationalJournal of Hydrogen Energy, 34, 3845 (2009).
479. R. Mukundan and R. L. Borup, “Visualising Liquid Water in PEM Fuel Cells UsingNeutron Imaging,” Fuel Cells, 9, 499 (2009).
480. K. Tuber, D. Pocza, and C. Hebling, “Visualization of water buildup in the cathodeof a transparent PEM fuel cell,” Journal of Power Sources, 124, 403 (2003).
481. P. K. Sinha, P. Halleck, and C.-Y. Wang, “Quantification of Liquid Water Saturationin a PEM Fuel Cell Diffusion Medium Using X-ray Microtomography,” Electro-chemical and Solid-State Letters, 9, A344 (2006).
482. R. Mosdale, G. Gebel, and M. Pineri, “Water profile determination in a runningproton exchange membrane fuel cell using small-angle neutron scattering,” Journalof Membrane Science, 118, 269 (1996).
483. D. Kramer, E. Lehmann, G. Frei, P. Vontobel, A. Wokaun, and G. G. Scherer, “Anon-line study of fuel cell behavior by thermal neutrons,” Nuclear Instruments andMethods in Physics Research Section A: Accelerators, Spectrometers, Detectors andAssociated Equipment, 542, 52 (2005).
484. R. J. Bellows, M. Y. Lin, M. Arif, A. K. Thompson, and D. Jacobson, “NeutronImaging Technique for In Situ Measurement of Water Transport Gradients withinNafion in Polymer Electrolyte Fuel Cells,” Journal of The Electrochemical Society,146, 1099 (1999).
485. S. Tsushima, K. Teranishi, and S. Hirai “Magnetic Resonance Imaging of the WaterDistribution within a Polymer Electrolyte Membrane in Fuel Cells,” Electrochemicaland Solid-State Letters, 7, A269 (2004).
486. S. Litster, K. Hess, W. Epting, and J. Gelb, “Catalyst Layer Analysis: NanoscaleX-ray CT, Spatially-Resolved In Situ Microscale Diagnostics, and Modeling,” ECSTransactions, 41, 409 (2011).
487. S. Ma, C.-H. Solterbeck, M. Odgaard, and E. Skou, “Microscopy studies on prontonexchange membrane fuel cell electrodes with different ionomer contents,” Appl.Phys. A, 96, 581 (2009).
488. D. Susac, V. Berejnov, A. P. Hitchcock, and J. Stumper, “STXM Study of theIonomer Distribution in the PEM Fuel Cell Catalyst Layers,” ECS Transactions, 41,629 (2011).
489. D. Kramer, J. Zhang, R. Shimoi, E. Lehmann, A. Wokaun, K. Shinohara, andG. G. Scherer, “In situ diagnostic of two-phase flow phenomena in polymer elec-trolyte fuel cells by neutron imaging: Part A. Experimental, data treatment, andquantification,” Electrochimica Acta, 50, 2603 (2005).
490. T. A. Trabold, J. P. Owejan, D. L. Jacobson, M. Arif, and P. R. Huffman, “In situinvestigation of water transport in an operating PEM fuel cell using neutron radiog-raphy: Part 1 – Experimental method and serpentine flow field results,” InternationalJournal of Heat and Mass Transfer, 49, 4712 (2006).
491. J. P. Owejan, T. A. Trabold, D. L. Jacobson, D. R. Baker, D. S. Hussey, and M. Arif,“In situ investigation of water transport in an operating PEM fuel cell using neutronradiography: Part 2 – Transient water accumulation in an interdigitated cathode flowfield,” International Journal of Heat and Mass Transfer, 49, 4721 (2006).
492. R. Mukundan, J. R. Davey, T. Rockward, J. S. Spendelow, B. Pivovar, D. S. Hussey,D. L. Jacobson, M. Arif, and R. Borup, “Imaging of Water Profiles in PEM FuelCells Using Neutron Radiography: Effect of Operating Conditions and GDL Com-position,” ECS Transactions, 11, 411 (2007).
493. P. Boillat, D. Kramer, B. C. Seyfang, G. Frei, E. Lehmann, G. G. Scherer,A. Wokaun, Y. Ichikawa, Y. Tasaki, and K. Shinohara, “In situ observation ofthe water distribution across a PEFC using high resolution neutron radiography,”Electrochemistry Communications, 10, 546 (2008).
494. M. A. Hickner, N. P. Siegel, K. S. Chen, D. S. Hussey, D. L. Jacobson, and M. Arif,“In Situ High-Resolution Neutron Radiography of Cross-Sectional Liquid Water
Profiles in Proton Exchange Membrane Fuel Cells,” Journal of The ElectrochemicalSociety, 155, B427 (2008).
495. R. Mukundan, J. Davey, J. D. Fairweather, D. Spernjak, J. S. Spendelow,D. S. Hussey, D. Jacobson, P. Wilde, R. Schweiss, and R. L. Borup, “Effect ofHydrophilic Treatment of Microporous Layer on Fuel Cell Performance,” ECSTransactions, 33, 1109 (2010).
496. X.-Z. Yuan, C. Song, H. Wang, and J. Zhang, Electrochemical Impedance Spec-troscopy in PEM Fuel Cells, p. 420, Springer (2010).
497. E. Barsoukov and J. R. Macdonald, Impedance Spectroscopy: Theory, Experiment,and Applications, John Wiley & Sons, Inc., Hoboken, NJ (2005).
498. M. E. Orazem and B. Tribollet, Electrochemical Impedance Spectroscopy, JohnWiley & Sons, Inc., Hoboken, NJ (2008).
499. W. Norbert, in PEM Fuel Cell Diagnostic Tools, p. 37, CRC Press (2011).500. X. Yuan, H. Wang, J. Colin Sun, and J. Zhang, “AC impedance technique in PEM
fuel cell diagnosis—A review,” International Journal of Hydrogen Energy, 32, 4365(2007).
501. J. S. Yi and T.-w. Song, “Performance Characterization of PEM Fuel Cells UsingAC Impedance Spectroscopy: I. Model-Based Analysis,” Journal of The Electro-chemical Society, 160, F141 (2013).
502. M. Ciureanu and R. Roberge, “Electrochemical Impedance Study of PEM FuelCells. Experimental Diagnostics and Modeling of Air Cathodes,” The Journal ofPhysical Chemistry B, 105, 3531 (2001).
503. N. Fouquet, C. Doulet, C. Nouillant, G. Dauphin-Tanguy, and B. Ould-Bouamama,“Model based PEM fuel cell state-of-health monitoring via ac impedance measure-ments,” Journal of Power Sources, 159, 905 (2006).
504. T. E. Springer, T. A. Zawodzinski, M. S. Wilson, and S. Gottesfeld, “Characteriza-tion of Polymer Electrolyte Fuel Cells Using AC Impedance Spectroscopy,” Journalof the Electrochemical Society, 143, 587 (1996).
505. K. Wiezell, P. Gode, and G. Lindbergh, “Steady-state and EIS investigations ofhydrogen electrodes and membranes in polymer electrolyte fuel cells I. Modeling,”Journal of the Electrochemical Society, 153, A749 (2006).
506. A. A. Kulikovsky, “A physical model for catalyst layer impedance,” Journal ofElectroanalytical Chemistry, 669, 28 (2012).
507. K. Wiezell, N. Holmstrom, and G. Lindbergh, “Studying Low-Humidity Effects inPEFCs Using EIS II. Modeling,” Journal of the Electrochemical Society, 159, F379(2012).
508. J. P. Meyers, M. Doyle, R. M. Darling, and J. Newman, “The impedance responseof a porous electrode composed of intercalation particles,” Journal of the Electro-chemical Society, 147, 2930 (2000).
509. J. P. Owejan, J. J. Gagliardo, J. M. Sergi, S. G. Kandlikar, and T. A. Trabold,“Water management studies in PEM fuel cells, Part I: Fuel cell design and insitu water distributions,” International Journal of Hydrogen Energy, 34, 3436(2009).
510. J. W. Lim, Y.-H. Cho, M. Ahn, D. Y. Chung, Y.-H. Cho, N. Jung, Y. S. Kang,O.-H. Kim, M. J. Lee, M. Kim, and Y.-E. Sung, “Ionic Resistance of a Cathode Cat-alyst Layer with Various Thicknesses by Electrochemical Impedance Spectroscopyfor PEMFC,” Journal of The Electrochemical Society, 159, B378 (2012).
511. M. C. Lefebvre, R. B. Martin, and P. G. Pickup, “Characterization of Ionic Conduc-tivity Profiles within Proton Exchange Membrane Fuel Cell Gas Diffusion Elec-trodes by Impedance Spectroscopy,” Electrochemical and Solid-State Letters, 2,259 (1999).
512. O. Antoine, Y. Bultel, and R. Durand, “Oxygen reduction reaction kinetics andmechanism on platinum nanoparticles inside Nafion,” Journal of ElectroanalyticalChemistry, 499, 85 (2001).
513. S. Arisetty, X. Wang, R. K. Ahluwalia, R. Mukundan, R. Borup, J. Davey,D. Langlois, F. Gambini, O. Polevaya, and S. Blanchet, “Catalyst Durability inPEM Fuel Cells with Low Platinum Loading,” Journal of The ElectrochemicalSociety, 159, B455 (2012).
514. C. Song, Y. Tang, J. L. Zhang, J. Zhang, H. Wang, J. Shen, S. McDermid, J. Li, andP. Kozak, “PEM fuel cell reaction kinetics in the temperature range of 23–120 ◦C,”Electrochimica Acta, 52, 2552 (2007).
515. S. Cruz-Manzo and R. Chen, “Electrochemical impedance study on estimating themass transport resistance in the polymer electrolyte fuel cell cathode catalyst layer,”Journal of Electroanalytical Chemistry, 702, 45 (2013).
516. M. Mathias, D. Baker, J. Zhang, Y. Liu, and W. Gu, “Frontiers in Application ofImpedance Diagnostics to H2-Fed Polymer Electrolyte Fuel Cells,” ECS Transac-tions, 13, 129 (2008).
517. I. A. Schneider, M. H. Bayer, A. Wokaun, and G. G. Scherer, “Negative ResistanceValues in Locally Resolved Impedance Spectra of Polymer Electrolyte Fuel Cells,”ECS Transactions, 25, 937 (2009).
518. I. A. Schneider, M. H. Bayer, P. Boillat, A. Wokaun, and G. G. Scherer, “Forma-tion of Low Frequency Inductive Loops In Polymer Electrolyte Fuel Cell (PEFC)Impedance Spectra Under Sub-Saturated Conditions,” ECS Transactions, 11, 461(2007).
519. K. Broka and P. Ekdunge, “Modelling the PEM fuel cell cathode,” Journal of AppliedElectrochemistry, 27, 281 (1997).
520. M. Secanell, K. Karan, A. Suleman, and N. Djilali, “Multi-variable optimizationof PEMFC cathodes using an agglomerate model,” Electrochim. Acta, 52, 6318(2007).
521. M. Moein-Jahromi and M. J. Kermani, “Performance prediction of PEM fuel cellcathode catalyst layer using agglomerate model,” International Journal of HydrogenEnergy, 37, 17954 (2012).
522. V. Novaresio, M. Garcia-Camprubi, S. Izquierdo, P. Asinari, and N. Fueyo, “Anopen-source library for the numerical modeling of mass-transfer in solid oxide fuelcells,” Computer Physics Communications, 183, 125 (2012).
523. http://openfuelcell.sourceforge.net/, accessed January 12, 2014.
) unless CC License in place (see abstract). ecsdl.org/site/terms_use address. Redistribution subject to ECS terms of use (see 128.240.225.120Downloaded on 2014-09-14 to IP

Journal of The Electrochemical Society, 161 (12) F1254-F1299 (2014) F1299
524. M. Secanell, in, http://www.openfcst.mece.ualberta.ca/documentation.html,accessed January 12, 2014.
525. P. Dobson, C. Lei, T. Navessin, and M. Secanell, “Characterization of the PEMFuel Cell Catalyst Layer Microstructure by Nonlinear Least-Squares ParameterEstimation,” Journal of the Electrochemical Society, 159, B514 (2012).
526. M. Secanell, R. Songprakorp, N. Djilali, and A. Suleman, “Optimization of a protonexchange membrane fuel cell membrane electrode assembly,” Struct Multidiscip O,40, 563 (2010).
527. M. Secanell, R. Songprakorp, A. Suleman, and N. Djilali, “Multi-objective opti-mization of a polymer electrolyte fuel cell membrane electrode assembly,” Energy& Environmental Science, 1, 378 (2008).
528. http://www.dealii.org/, accessed January 12, 2014.529. A. Z. Weber and J. Newman, “Effects of membrane- and catalyst-layer-thickness
nonuniformities in polymer-electrolyte fuel cells,” Journal of the ElectrochemicalSociety, 154, B405 (2007).
530. N. V. Aieta, P. K. Das, A. Perdue, G. Bender, A. M. Herring, A. Z. Weber,and M. J. Ulsh, “Applying infrared thermography as a quality-controltool for the rapid detection of polymer-electrolyte-membrane-fuel-cellcatalyst-layer-thickness variations,” Journal of Power Sources, 211, 4(2012).
531. K. Morre, in Proceedings of the 2013 DOE Fuel Cell Technologies Annual MeritReview (2013).
) unless CC License in place (see abstract). ecsdl.org/site/terms_use address. Redistribution subject to ECS terms of use (see 128.240.225.120Downloaded on 2014-09-14 to IP