Evaluation of coated metallic bipolar plates for polymer electrolyte membrane fuel cells
9
Available online at www.sciencedirect.com Journal of Power Sources 179 (2008) 265–273 Evaluation of coated metallic bipolar plates for polymer electrolyte membrane fuel cells Wonseok Yoon a , Xinyu Huang a,∗ , Paul Fazzino a , Kenneth L. Reifsnider a , Michael A. Akkaoui b a University of Connecticut, Connecticut Global Fuel Cell Center, 44 Weaver Road, Unit 5233 Storrs, CT 06269-5233, USA b Tanury Industries, 6 New England Way, Lincoln, RI 02865, USA Received 24 November 2007; received in revised form 5 December 2007; accepted 5 December 2007 Available online 23 December 2007 Abstract Metallic bipolar plates for polymer electrolyte membrane (PEM) fuel cells typically require coatings for corrosion protection. Other requirements for the corrosion protective coatings include low electrical contact resistance, good mechanical robustness, low material and fabrication cost. The authors have evaluated a number of protective coatings deposited on stainless steel substrates by electroplating and physical vapor deposition (PVD) methods. The coatings are screened with an electrochemical polarization test for corrosion resistance; then the contact resistance test was performed on selected coatings. The coating investigated include Gold with various thicknesses (2 nm, 10 nm, and 1 m), Titanium, Zirconium, Zirconium Nitride (ZrN), Zirconium Niobium (ZrNb), and Zirconium Nitride with a Gold top layer (ZrNAu). The substrates include three types of stainless steel: 304, 310, and 316. The results show that Zr-coated samples satisfy the DOE target for corrosion resistance at both anode and cathode sides in typical PEM fuel cell environments in the short-term, but they do not meet the DOE contact resistance goal. Very thin gold coating (2 nm) can significantly decrease the electrical contact resistance, however a relatively thick gold coating (>10 nm) with our deposition method is necessary for adequate corrosion resistance, particularly for the cathode side of the bipolar plate. © 2008 Published by Elsevier B.V. Keywords: Fuel cells; Metallic bipolar plates; Coating; Corrosion; PVD 1. Introduction The bipolar plates for the polymer electrolyte membrane fuel cell (PEMFC) perform multiple functions, such as conducting electrons between adjacent cells, separating and distributing fuel and oxidant, and carrying away reaction products and heat from each cell. In order to perform these functions well, bipolar plates need to have low contact resistance and high electrical conduc- tivity, high thermal conductivity, low gas permeability, good mechanical strength, satisfactory corrosion resistance, or suit- able surface properties for liquid water removal. Traditionally, graphite and graphite composite plates with machined flow fields have been widely used in PEMFC because of their high corrosion ∗ Corresponding author. Present address: Florida Solar Energy Center, Uni- versity of Central Florida, 1679 Clearlake Road, Cocoa, FL 32922-5703, USA. Tel.: +1 321 638 1706; fax: +1 321 638 1010. E-mail address: [email protected] (X. Huang). resistance, and low interfacial contact resistance (ICR). How- ever, their poor manufacturability results in high fabrication cost, and their brittleness requires the use of fairly thick plates for ade- quate mechanical strength. Recently, metallic bipolar plates have received much attention as an alternative bipolar plate material because of their superior mechanical strength, low gas imper- meability, very high bulk electrical and thermal conductivity, relatively low material and manufacturing cost [1]. Typically, bipolar plates are exposed to a warm (65–90 ◦ C), acidic (pH 2–3) and humid environment. Under such conditions, the ther- modynamically stable state of most of the metallic elements is frequently the cations, rather than the metal itself. For example, in the case of stainless steel bipolar plates, metal cations, such as Fe 2+ , Ni 2+ and Cr 3+ can be released during the corrosion pro- cess [2]. Additionally, poorly conductive metal oxides can form on the corroded surfaces, increasing the ICR of the contacting surfaces and thus reducing fuel cell performance. The corrosion process is an electrochemical process which involves both oxidation and reduction reactions. In case of metal 0378-7753/$ – see front matter © 2008 Published by Elsevier B.V. doi:10.1016/j.jpowsour.2007.12.034
Transcript of Evaluation of coated metallic bipolar plates for polymer electrolyte membrane fuel cells

A
fa(pZoc(n©
K
1
ceaentmagh
vT
0d
Available online at www.sciencedirect.com
Journal of Power Sources 179 (2008) 265–273
Evaluation of coated metallic bipolar plates for polymer electrolytemembrane fuel cells
Wonseok Yoon a, Xinyu Huang a,∗, Paul Fazzino a, Kenneth L. Reifsnider a,Michael A. Akkaoui b
a University of Connecticut, Connecticut Global Fuel Cell Center, 44 Weaver Road, Unit 5233 Storrs, CT 06269-5233, USAb Tanury Industries, 6 New England Way, Lincoln, RI 02865, USA
Received 24 November 2007; received in revised form 5 December 2007; accepted 5 December 2007Available online 23 December 2007
bstract
Metallic bipolar plates for polymer electrolyte membrane (PEM) fuel cells typically require coatings for corrosion protection. Other requirementsor the corrosion protective coatings include low electrical contact resistance, good mechanical robustness, low material and fabrication cost. Theuthors have evaluated a number of protective coatings deposited on stainless steel substrates by electroplating and physical vapor depositionPVD) methods. The coatings are screened with an electrochemical polarization test for corrosion resistance; then the contact resistance test waserformed on selected coatings. The coating investigated include Gold with various thicknesses (2 nm, 10 nm, and 1 �m), Titanium, Zirconium,irconium Nitride (ZrN), Zirconium Niobium (ZrNb), and Zirconium Nitride with a Gold top layer (ZrNAu). The substrates include three typesf stainless steel: 304, 310, and 316. The results show that Zr-coated samples satisfy the DOE target for corrosion resistance at both anode and
athode sides in typical PEM fuel cell environments in the short-term, but they do not meet the DOE contact resistance goal. Very thin gold coating2 nm) can significantly decrease the electrical contact resistance, however a relatively thick gold coating (>10 nm) with our deposition method isecessary for adequate corrosion resistance, particularly for the cathode side of the bipolar plate.2008 Published by Elsevier B.V.
reaqrbmrb2
eywords: Fuel cells; Metallic bipolar plates; Coating; Corrosion; PVD
. Introduction
The bipolar plates for the polymer electrolyte membrane fuelell (PEMFC) perform multiple functions, such as conductinglectrons between adjacent cells, separating and distributing fuelnd oxidant, and carrying away reaction products and heat fromach cell. In order to perform these functions well, bipolar plateseed to have low contact resistance and high electrical conduc-ivity, high thermal conductivity, low gas permeability, good
echanical strength, satisfactory corrosion resistance, or suit-
ble surface properties for liquid water removal. Traditionally,raphite and graphite composite plates with machined flow fieldsave been widely used in PEMFC because of their high corrosion∗ Corresponding author. Present address: Florida Solar Energy Center, Uni-ersity of Central Florida, 1679 Clearlake Road, Cocoa, FL 32922-5703, USA.el.: +1 321 638 1706; fax: +1 321 638 1010.
E-mail address: [email protected] (X. Huang).
mfiacos
i
378-7753/$ – see front matter © 2008 Published by Elsevier B.V.oi:10.1016/j.jpowsour.2007.12.034
esistance, and low interfacial contact resistance (ICR). How-ver, their poor manufacturability results in high fabrication cost,nd their brittleness requires the use of fairly thick plates for ade-uate mechanical strength. Recently, metallic bipolar plates haveeceived much attention as an alternative bipolar plate materialecause of their superior mechanical strength, low gas imper-eability, very high bulk electrical and thermal conductivity,
elatively low material and manufacturing cost [1]. Typically,ipolar plates are exposed to a warm (65–90 ◦C), acidic (pH–3) and humid environment. Under such conditions, the ther-odynamically stable state of most of the metallic elements is
requently the cations, rather than the metal itself. For example,n the case of stainless steel bipolar plates, metal cations, suchs Fe2+, Ni2+ and Cr3+ can be released during the corrosion pro-ess [2]. Additionally, poorly conductive metal oxides can form
n the corroded surfaces, increasing the ICR of the contactingurfaces and thus reducing fuel cell performance.The corrosion process is an electrochemical process whichnvolves both oxidation and reduction reactions. In case of metal

2 wer Sources 179 (2008) 265–273
cas
M
2
IsHers
iasoeceaiFmc
bFfiiitttFba
F2
Table 1DOE targets for 2010; ICR, corrosion resistance, and cost
Performance metrics DOE goal by 2010
ICR at 140 N cm−2 (m� cm2) 10Corrosion current at −0.1 V (H2) (�A cm−2) <1CC
cp
mlrsiMlahfsitr
sm[awsp
66 W. Yoon et al. / Journal of Po
orrosion in acid solution, metal oxidation takes place at thenode sites, and reduction of hydrogen ions occurs at cathodeites [3–5]. The processes can be represented as follows:
→ Mn+ + ne− (1)
H+ + 2e− → H2 (2)
n Eq. (1), M represents surface metal element, Mn+ is the corre-ponding metal ion in the solution, e− is free electron; in Eq. (2),+ and H2 represent proton adsorbed on metal surface and the
volved hydrogen gas. Besides these, oxidation and reductioneactions involving other ions (ferrous and hydroxide ions) andpecies (oxygen) can also occur depending on the solution used.
The corrosion reactions involve the transfer of electrons andons between the metal and the solution. Without an externalpplied potential or external source of electrons, surface corro-ion reactions normally occur at a potential for which the ratef oxidation and reduction are electrochemically balanced. Thequilibrium potential (corrosion potential, ECorr) and the asso-iated current (corrosion current, ICorr) can be measured by anlectrochemical polarization test. ECorr and ICorr are widely useds the indicators of the corrosion resistance of a material. A typ-cal polarization curve for bare stainless steel (316) is shown inig. 1. The corrosion current and corrosion potential are deter-ined by extrapolating the tangential line of the anodic and
athodic polarization curve.Comprehensive research has been conducted on metallic
ipolar plates and protective coatings over the past few years. Ane-based alloy (FeB) and Ni-based alloy (NiB) were investigatedor the suitability of cost-effective bipolar plates [6]. The polar-zation characteristics of the fuel cells with FeB plates testedndicated that most of the FeBs exhibited a characteristic behav-or comparable to that of the Ni-based alloy (NiB) and was foundo be susceptible to pitting corrosion. Moreover, contact resis-ance was about 100 m� cm2 at 140 N cm−2, which was higher
han that of NiB and does not meet the DOE targets (Table 1 [7]).leury et al. [8] evaluated an Fe-based amorphous alloy for theipolar plates; the contact resistance of the Fe-based amorphouslloys were found to be similar to that of stainless steel and theirig. 1. Polarization curve of bare SS 316 around the corrosion potential in pHH2SO4 solution at 80 ◦C (Potential vs. SCE).
ttbricq4o
iadmclis[
mN
orrosion current at 0.6 V (air) (�A cm−2) <1ost ($ kW−1) 6
orrosion resistance was poor in comparison with the graphitelates.
Stainless steel (SS) is the most widely used candidate foretallic bipolar plates and numerous reports have been pub-
ished on this material by several institutes and universities overecent years. Stainless steel’s relatively high resistance to corro-ion, relatively low cost, and superior manufacturability maket an ideal base material for a host of commercial applications.
akkus et al. [9] conducted fuel cell testing with different stain-ess steel bipolar plates. The results show a current decay ofpproximately 30–50% in the first 300 h of operation, and aigh metal ion concentration in the MEA. Similar work was per-ormed by Davies et al. [10] with 310, 316 and 904L stainlessteel bipolar plates. Li et al. [11] examined the corrosion behav-or of 316 SS in a simulated anode environment. They statedhat a coating needs to be developed to enhance the corrosionesistance of the stainless steel.
Some researchers investigated gold-coated bipolar plates,ince gold, itself, is the one of the best corrosion resistanceaterials and an excellent electrical conductor. Hentall et al.
12] and Woodman et al. [13] fabricated current collectors fromluminum, then coated them with gold by a solution process. Itas found that the fuel cell data with gold-coated bipolar plates
howed a comparable performance to that of cells with graphitelates.
Wang et al. [14] conducted short-term fuel cell performanceesting with gold-plated titanium bipolar plates. Since a long-erm corrosion test was not implemented, feasibility of theipolar plate was not completely validated. Surface contactesistance below 1 m� was measured at a compaction torquen the range from 20 kgf cm to 60 kgf cm. Cell polarizationurves indicated that the cell performance with coated plate wasuite similar to that of graphite plates. Their cell was tested at0 ◦C with 5 psi back pressure; the humidification temperaturef anode and cathode, 90 ◦C and 80 ◦C, respectively.
Most coatings for metallic bipolar plates have been provennadequate due to pin-hole defects, which cause local corrosionnd metallic ion contamination of the membrane. Recently, nitri-ation has been identified as an alternative coating method foretallic bipolar plates due to the combination of high electri-
al conductivity and good corrosion resistance [15]. The nitrideayer is formed by nitrogen atom penetration and diffusionnto the substrate, for which there is less interfacial adhe-ion problem, and is characterized by high corrosion resistance
16].Brady et al. [15] have recently developed a preferential ther-al nitridation process to generate a pinhole-free coating on ai–Cr alloy base plate, which shows excellent corrosion resis-

wer Sources 179 (2008) 265–273 267
taa00
iwsrpAriira
p[iTcTfeaitg
catmssfrpatocpor
2
2
wcsa
Table 2Substrates and coating materials
Substrate Coating materials
SS 304 2 nm gold, 10 nmgold, 1 �m golda
Zr, ZrN, ZrNb,ZrNAub (0.5 �m)
Ti (0.5 �m)SS 310SS 316
Cs
peutTscntppmgvtaidnmthdabcmoontcota
2
p
W. Yoon et al. / Journal of Po
ance and negligible contact resistance. Nitrided surface showedsignificantly lower contact resistance than that of 316L SS. Inddition, a single cell test (operated at a constant voltage of.7 V) data indicated trace levels of Ni and Cr in the range of.01–0.3 �g cm−2 over a 1000-h test period.
Feasibility of thermally nitrided stainless steel was also stud-ed by Wang et al. [16]. A 2-h and a 24-h nitridation treatmentere developed for the AISI446 SS. Cell polarization data
howed that the 2-h nitrided AISI446 exhibited better corrosionesistance and smaller ICR than the 24-h nitrided AISI446. Theyointed out that the nitrided layer developed on 24-h nitridedISI446 was not continuous, which resulted in poor corrosion
esistance. The 2-h nitridation treatment created a nitrogen mod-fication of the native passive oxide layer on the alloy, whichmproved corrosion resistance in the simulated PEMFC envi-onments. However, the ICR value, 40 m� cm2 at 150 N cm−2
fter polarization test, did not meet the DOE targets.Rujin Tian et al. [17] examined the corrosion behavior of
lasma-nitrided austenitic 316L SS bipolar plates and Li et al.18] investigated the corrosion behavior of TiN-coated 316 SSn a simulated PEMFC environment. The authors concluded thatiN-coated 316 SS has higher corrosion resistance and surfaceonductivity than uncoated 316 SS with no significant effect oniN coatings under the typical load conditions for 4 h. However,urther study is needed to improve the coating quality and tovaluate the long-term stability of TiN coating. Cho et al. [19]lso developed TiN-coated bipolar plate, which significantlymproved the initial performance and lifetime when comparedo 316 SS; however, the performance is still lower than that ofraphite.
To date, feasibility of various protective coating materials andoating methods for metallic bipolar plates has been investigatednd some of them showed promising results in mostly short-termests. However, for commercial automotive application of the
etallic bipolar plates, an operation time over 5000 h withoutignificant performance degradation has to be guaranteed. Asuch, long-term corrosion and fuel cell testing are necessaryor evaluating coating materials for metallic bipolar plates. Ouresearch on coated metallic bipolar plates is structured into threehases: Phase I includes mostly short-term screening tests suchs polarization and contact resistance tests; in Phase II, long-erm corrosion test using a corrosion test cell will be carriedut; in Phase III mid-term and long-term fuel cell testing will beonducted to further evaluate selected coatings on metal bipolarlates. This paper reports the results of our Phase I work for a setf coating materials. Mid-term and long-term test results will beeported in subsequent papers.
. Experimental
.1. Sample preparation
For this research, austenitic stainless steel 304, 310, and 316
ere used for substrate material since they were known to beorrosion resistant materials in many other applications. The firstubset of coating materials are listed in Table 2. The substratesnd coated samples were obtained from Tanury Industries Inc.
raie
a Coated on SS 316 only.b 10 nm gold thickness.
oating was deposited on as-fabricated substrates without anyurface grinding or polishing.
For the deposition of coatings, both high speed acid goldlating and two methods of physical vapor deposition weremployed. For gold only coatings, the electroplating process wassed. Tanury used a high speed gold plating chemistry wherehe cathode film was rapidly changed or recharged with gold.his process allowed for very uniform thin deposits in relativelyhort periods of time, hence reduced material and fabricationost. For all other samples that used titanium, zirconium, oriobium, the samples were coated using either magnetron sput-ering or cathodic arc coating systems. In both of these PVDrocesses, the samples are placed into a vacuum chamber andumped down to 10−5 Torr or 10−6 Torr to create an environ-ent that is contaminant free and will allow a free flow of plasma
ases. At a preset vacuum, argon gas is fed into the chamberia mass flow controllers. The pressure of the system is moni-ored and controlled as the argon is fed in to the chamber. Thergon gas is energized creating a glow discharge etch processnside the chamber resulting in a cleaner and active surface foreposition of the initial layer. Once this stage is complete, highegative potential is applied to the substrate while the targetaterial is energized at low power. Coating material is attracted
o the negatively charged substrate and forms a bond. Due to theigh negative potential applied to the substrate, particles thato not adhere are intentionally ejected from the substrate andre replaced by those that have bonded resulting in a firm bondetween the substrate and the new coating. Once this phase isomplete, the system is programmed to grow a film of the targetaterial by combining these ions with reactive gases. The type
f reactive gas used results in the type of compound that is grownn the substrate surface. For instance, when making a zirconiumitride, we introduce a controlled amount of nitrogen gas withhe proper proportion of argon during the zirconium PVD pro-ess. Similarly, to produce carbides coating, we utilize methaner acetylene as the reactive gas. Once the thin film layer is builto the target thickness, the chamber is vented and the samplesre removed.
.2. Short-term corrosion test
The corrosion property of a material was characterized by theolarization test. A commercially available electrochemical cor-
osion test cell was employed to conduct the polarization test,s illustrated in Fig. 2. The components of the corrosion cellnclude the metal sample as the working electrode (WE), a ref-rence electrode (RE, SCE), a counter electrode (CE, Graphite
268 W. Yoon et al. / Journal of Power S
rrra
crs8asscts
2
dces
lptamtm(msomomvrtt
capimiscierort
Fig. 2. Experimental setup for polarization test.
od). A potentiostat (Solartron 1287) was used to control theelative potential of the metal sample (WE) with respect to theeference electrode (RE). A plot of potential vs. current is calledpolarization curve as presented in Fig. 1.
In the polarization test, the potential of the metal coupon washanged from negative 1 V to positive 1 V at a 1 mV s−1 scanate. The corrosion bath used was an aqueous H2SO4 (pH 2)olution and the temperature of the solution was maintained at0 ◦C using an external heater around the cell; these conditionsre representative of an operating PEMFC. Before the test, allamples were degreased and rinsed with DI water. Corrosionurface area is 3 cm2 and a polarization test for each sample wasonducted after a 1 h dwell in the solution for the redox reactiono be stabilized [11]. Fresh corrosion bath was used for each newample.
.3. Contact resistance test
In PEMFC, bipolar plates are typically in contact with gas
iffusion layers such as carbon paper or carbon cloth. Interfa-ial contact resistance should be minimized for better fuel cellfficiency. Interfacial contact resistance tests were conducted forelected coated samples to pick the best candidate for Phase IIwwtr
Fig. 3. A picture (left) and a schematic of the inter
ources 179 (2008) 265–273
ong-term corrosion test and actual fuel cell testing. For com-arison purposes, a bare SS 316 and a graphite plate were alsoested. Measurement techniques for interfacial contact resistancere well documented in the literature [10,20,21]. The measure-ent scheme is described as follows. As illustrated in Fig. 3,
he sample (bare or coated on both sides) for contact resistanceeasurement is positioned between two pieces of carbon papers
Toray TGPH-120, 30 wt% wet proof), a typical gas diffusionedium in PEMFC. The carbon papers are pressed against the
ample by a pair of gold-plated metal current collector plates. Inrder to apply a controlled uniform contact pressure between theetal sample and the carbon paper, a thick metal platen is pressed
n to the sample assembly by a pneumatic cylinder. The topetal plate is connected to the actuator of the pneumatic cylinder
ia a universal joint to minimize bending moment. A precisionegulator is used to control and maintain a constant pressure inhe cylinder, hence the total compressive (or compact) force onhe assembly.
To measure the resistance, some researchers apply a 1 A DCurrent through the metal plates and measure the voltage dropcross them to calculate the contact resistance as a function ofressure. However, excessive current through the contacts dur-ng testing may cause a physical change in the contact area at the
icroscopic level. For example, high current may cause local-zed heating, which can soften or melt the contact points and theurrounding area [22,23]. To avoid such potential issues, a totalurrent of less than 20 mA was applied to an area of approx-mately 13 cm2, the so-called dry circuit method [23]. In ourxperiment, an Agilent 4338B milliohm-meter (10 micro Ohmesolution) was employed for direct measurement of the totalhmic resistance. The meter supplied an AC a current (1 kHz)anging from 1 �A to 10 mA according to the magnitude ofhe target resistance. Before measurement, all of the samples
ere degreased and rinsed with DI water and all measurementsere made at a room temperature. The measured total resis-ance (R1) consisted of material’s bulk resistance (Rb), leadesistance (Rcircuit), and interfacial resistances from four con-
facial contact resistance measurement setup.

wer Sources 179 (2008) 265–273 269
tgpsttwmmismotbc
R
R
R
wtrcm
3
3
fihi
stsa0
cntp
wtptp
Fig. 4. Polarization curve of bare SS 304, 310, and 316 samples.
Fig. 5. Polarization curve of SS 304, 310, and 316 with 2 nm gold coating.
W. Yoon et al. / Journal of Po
act pairs, which included two contact pairs of carbon paper andold-plated current collector and two contact pairs of carbonaper and the bare or coated (on both sides) metal bipolar plateample under investigation. It is believed that the bulk resis-ances of the metallic components were negligible compared tohe interfacial contact resistance. What we wanted to measureas the contact resistance between the carbon paper and theetal sample. Therefore, a calibration test was performed byeasuring the resistance (R2) of only one carbon paper placed
n between the gold plated current collectors without the metalample, and subtracting that value from the total resistance (R1)easured with the metal sample in place. The contact resistance
f the metal sample can be calculated by the following equa-ion. The area specific contact resistance 1(� cm2) is obtainedy multiply the measured contact resistance Rct (�) with theontact area (cm2) of the specimen.
1 = 2Rct + 2RC-G + Rcircuit + Rb1 + Rb2 (3)
2 = 2RC-G + Rcircuit + Rb2 (4)
ct =(
R1 − R2
2
)(5)
here R1 is the total resistance with metal sample (�), R2 theotal resistance without metal sample (�), RC-G the Contactesistance between the carbon paper and gold-coated currentollector (�), Rcircuit is the Ohmic resistance of the leads in theeasurement circuit (�).
. Results and discussion
.1. Polarization test results
Corrosion potential and corrosion current can be estimatedrom the polarization test result of each sample. They are approx-mate indicators for the corrosion resistance of the materials. Aigher corrosion potential and lower corrosion current usuallyndicate a higher corrosion resistance.
Fig. 4 shows the polarization curves of three types of bare SSamples. It can be seen that they behave very similarly in thisest. The corrosion potential (−0.347 V vs. SCE) of SS 316 islightly higher than other two samples. All three samples showedpassivation behavior in the potential range from −0.2 V to
.6 V (vs. SCE).Fig. 5 shows the polarization curve of the three types of SS
oated with 2 nm gold. It shows that the 2 nm gold coating doesot produce a discernable effect on the corrosion characteris-ics of the metal substrates except for increasing the corrosionotential slightly by about 50 mV.
Fig. 6 shows the polarization test results of the three SS coatedith 10 nm gold. The 10 nm gold coating was found to improve
he corrosion resistance remarkably by increasing the corrosion
otential and decreasing the corrosion current regardless of whatype of substrates were used. The corrosion potential of all sam-les was increased up to approximately 0 V with respect to SCE1 Neglect Rb1 and Rb2, bulk resistance of metal samples and carbon papers. Fig. 6. Polarization curve of bare SS 304, 310, and 316 with 10 nm gold coating.

270 W. Yoon et al. / Journal of Power Sources 179 (2008) 265–273
a3ca
ittcrr
bd3ocotafa
F
F
cc
(swieaa
3ibaianode electrode is approximately −0.1 V vs. SCE, and that of
Fig. 7. Gold thickness effect on the corrosion resistance of SS 316.
nd the corrosion current density (e.g. 5.6568 �A cm−2 for SS16) was less than 1 �A cm−2, which is the DOE target for aorrosion test. The passivation behavior can still be observed athigher potential range.
To observe the effects of gold coating thickness on the polar-zation behavior, we further tested SS 316 samples with 1 �mhick gold coatings. The results are shown in Fig. 7. Compared tohe 10 nm gold coating, one micron gold coating further reducesorrosion current. The thicker the gold coating is, the better cor-osion resistance can be achieved particularly at higher potentialanges.
During the experiment, it was noticed that the corrosionehavior of different substrates with the same coating materialsid not show much difference from each other, or that the SS16 samples showed slightly better corrosion resistance than thethers. It can be observed in the polarization curve of the gold-oated samples and Ti-coated samples in Fig. 8 as well. Becausef that, only coated SS 316 samples were studied in subsequent
esting. As shown in Fig. 9, the polarization curves of Zr, ZrNs well as ZrNb-coated SS 316 samples were obtained. It wasound that the corrosion current of the Zr sample is the leastmong the this group and that ZrN and ZrNb exhibited betterig. 8. Polarization curve of the bare SS 304, 310, and 316 with Ti coating.
tid
F3
ig. 9. Polarization test of Zr, ZrN and ZrNb coating on the SS 316 sample.
orrosion resistance than bare SS 316 in terms of the corrosionurrent.
As noticed in Fig. 10, the 10 nm gold on the ZrN sampleZrNAu) further enhanced the corrosion resistance of the ZrNample in terms of the corrosion potential as well. In otherords, it appears that the 10 nm gold coating is adequate for
ncreasing the corrosion potential of the target substrates; how-ver, the 10 nm gold on ZrN does not reduce the corrosionpparent current. Instead, 10 nm gold on ZrN raises the currentt the low potential range.
The corrosion potential and current of all the samples with SS16 substrate with different coating materials are summarizedn Fig. 11. In a PEM fuel cell, the bipolar plate is positionedetween an anode electrode where the hydrogen fuel is oxidizednd a cathode electrode where the oxygen is reduced. The typ-cal potential of the bipolar plate surface in contact with the
he bipolar plate surface in contact with the cathode electrodes 0.6 V vs. SCE [20]. As can be seen in Table 1, the currentensity less than 1 �A cm−2 in the potential range of approxi-
ig. 10. Comparison of the corrosion resistance for ZrN and ZrNAu-coated SS16 samples.
W. Yoon et al. / Journal of Power S
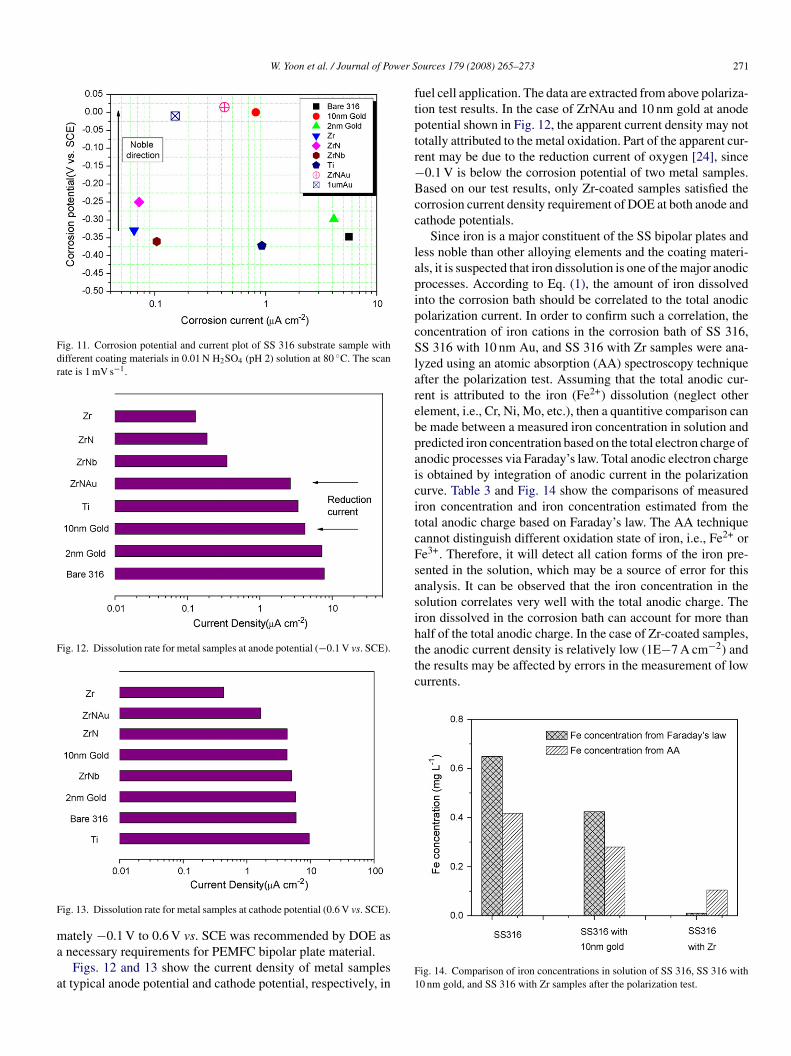
Fig. 11. Corrosion potential and current plot of SS 316 substrate sample withdifferent coating materials in 0.01 N H2SO4 (pH 2) solution at 80 ◦C. The scanrate is 1 mV s−1.
Fig. 12. Dissolution rate for metal samples at anode potential (−0.1 V vs. SCE).
F
ma
a
ftptr−Bcc
lapipcSlarebpaicitcFsasihalf of the total anodic charge. In the case of Zr-coated samples,the anodic current density is relatively low (1E−7 A cm−2) andthe results may be affected by errors in the measurement of lowcurrents.
ig. 13. Dissolution rate for metal samples at cathode potential (0.6 V vs. SCE).
ately −0.1 V to 0.6 V vs. SCE was recommended by DOE asnecessary requirements for PEMFC bipolar plate material.
Figs. 12 and 13 show the current density of metal samplest typical anode potential and cathode potential, respectively, in
F1
ources 179 (2008) 265–273 271
uel cell application. The data are extracted from above polariza-ion test results. In the case of ZrNAu and 10 nm gold at anodeotential shown in Fig. 12, the apparent current density may nototally attributed to the metal oxidation. Part of the apparent cur-ent may be due to the reduction current of oxygen [24], since0.1 V is below the corrosion potential of two metal samples.ased on our test results, only Zr-coated samples satisfied theorrosion current density requirement of DOE at both anode andathode potentials.
Since iron is a major constituent of the SS bipolar plates andess noble than other alloying elements and the coating materi-ls, it is suspected that iron dissolution is one of the major anodicrocesses. According to Eq. (1), the amount of iron dissolvednto the corrosion bath should be correlated to the total anodicolarization current. In order to confirm such a correlation, theoncentration of iron cations in the corrosion bath of SS 316,S 316 with 10 nm Au, and SS 316 with Zr samples were ana-
yzed using an atomic absorption (AA) spectroscopy techniquefter the polarization test. Assuming that the total anodic cur-ent is attributed to the iron (Fe2+) dissolution (neglect otherlement, i.e., Cr, Ni, Mo, etc.), then a quantitive comparison cane made between a measured iron concentration in solution andredicted iron concentration based on the total electron charge ofnodic processes via Faraday’s law. Total anodic electron charges obtained by integration of anodic current in the polarizationurve. Table 3 and Fig. 14 show the comparisons of measuredron concentration and iron concentration estimated from theotal anodic charge based on Faraday’s law. The AA techniqueannot distinguish different oxidation state of iron, i.e., Fe2+ ore3+. Therefore, it will detect all cation forms of the iron pre-ented in the solution, which may be a source of error for thisnalysis. It can be observed that the iron concentration in theolution correlates very well with the total anodic charge. Theron dissolved in the corrosion bath can account for more than
ig. 14. Comparison of iron concentrations in solution of SS 316, SS 316 with0 nm gold, and SS 316 with Zr samples after the polarization test.

272 W. Yoon et al. / Journal of Power Sources 179 (2008) 265–273
Table 3Estimation of iron dissolution from anodic current density
Samples Charge density(C cm−2)
Massconsumption (g)
Conversion (fromg to mg L−1)
Fen+ concentration byAA (mg L−1)
Remarks
316 0.0299 1.7306E−5 0.6489316 with 10 nm Au 0.01953 1.1303E−5 0.4238316 with Zr 4.34E−4 2.5142E−7 0.009428
Fg
3
pealbo1t
Fs
Atbiitsatgp
4
psptrtmcpD
ig. 15. Contact resistance results of 10 nm, 1 �m, ZrNAu-coated samples andraphite plate.
.2. Contact resistance measurements
For comparison, the contact resistance of a typical graphitelate was measured. It can be seen that 10 nm gold samplesxhibited the lowest contact resistance among the candidatess summarized in Fig. 15. The ZrNAu samples show similarow contact resistance to that of the 10 nm gold; this is simply
ecause the gold layer of 10 nm thickness in ZrNAu is coatedn top of the ZrN coating. Comparing with 2 nm, 10 nm, andmicron gold samples, the 2 nm gold coating (Fig. 16) reduceshe contact resistance of a bare 316 material to about one third.
ig. 16. Contact resistance results of bare SS 316, Zr, ZrN, and 2 nm gold-coatedamples.
stcetitrtsmts
A
A
R
0.416 Solution volume: 40 mL Fe molecularweight: 55.845 g mol−10.28
0.105
lso, there is no perceptible difference in the contact resis-ance between 10 nm and 1 �m gold coating; small differenceetween the two results in Fig. 15 could be due to noises/errorn the measurement, sample condition or other factors. This factmplies that there exists a thinnest thickness of gold to meethe requirement. In Fig. 16, the contact resistance of the ZrNample is significantly lower than the pure Zr-coated samplend even lower than bare SS 316. The Zr-coated sample showshe best corrosion resistance among the coated samples withoutold coating, but it cannot be considered as a viable coating forotential bipolar plate due to the high contact resistance.
. Summary and conclusions
Short-term polarization and contact resistance tests have beenerformed for a set of coating materials and substrates. Corro-ion potential and corrosion current are extrapolated from theolarization test results for each sample and they are used to rankhe corrosion resistance of the coated metallic bipolar plate mate-ials. The more positive the corrosion potential and the smallerhe corrosion current, the more corrosion resistant are the coated
etallic samples. The Zr, ZrN, ZrNb, ZrNAu and 10 nm gold-oated samples satisfied the DOE target at the typical anodeotential of PEMFC, but only the Zr-coated sample satisfied theOE goal at the typical cathode potential. Gold-coated samples
uch as ZrNAu and 10 nm gold met the DOE target for con-act resistance. Also, the nitrided surface showed better surfaceonductivity than the original metal. In terms of gold thicknessffect, the thicker the gold coating, the better the interfacial elec-rical conductivity and the corrosion resistance. However, theres a minimum thickness of gold for satisfying the contact resis-ance goal. The 10 nm gold coating renders adequate corrosionesistance for the anode side of the bipolar plate, but it is nothick enough to protect the metal from corrosion at the cathodeide. For future work, polarization tests will be performed forore coating candidates; long-term corrosion and actual fuel cell
esting will be carried out to further investigate the endurance ofelected coated metallic bipolar plates.
cknowledgement
The authors would like to thank Dr. Kirk Weisbrod with Loslamos National Laboratory for helpful discussions.
eferences
[1] H. Tawfik, Y. Hung, D. Mahajan, J. Power Sources 163 (2007) 755.[2] S.-J. Lee, C.-H. Huang, J.-J. Lai, Y.-P. Chen, J. Power Sources 131 (2004)
162.

wer S
[
[
[
[
[
[
[
[[
[
[
[
W. Yoon et al. / Journal of Po
[3] P.R. Roberge, Handbook of Corrosion Engineering, McGraw-Hill, pp.2000, in press.
[4] <http://www.corrosion-doctors.org/InternetResources/NPL.htm#Electrochemistry>.
[5] <http://www.gamry.com/App Notes/DC Corrosion/GettingStartedWithEchemCorrMe asurements.htm>.
[6] R. Hornung, G. Kappelt, J. Power Sources 72 (1998) 20.[7] J.A. Turner, H. Wang, in: DOE Annual Progress Report, 2005.[8] E. Fleury, J. Jayaraj, C.H. Kim, H.K. Seok, K.Y. Kim, J.B. Kim, J. Power
Sources 159 (2006) 34.[9] R.C. Makkus, A.H.H. Janssen, F.A. Bruijn, R. Mallant, J. Power Sources
86 (2000) 274.10] D.P. Davies, P.L. Adcock, M. Turpin, S.J. Rowen, J. Power Sources 86
(2000) 237.11] M.C. Li, C.L. Zeng, S.Z. Luo, J.N. Shen, H.C. Lin, C.N. Cao, Electrochim.
Acta 48 (2003) 1735.12] P.L. Hentall, J.B. Lakeman, G.O. Mepsted, P.L. Adcock, J.M. Moore, J.
Power Sources 80 (1999) 235.13] A.S. Woodman, E.B. Anderson, K.D. Jayne, M.C. Kimble, Am. Electro-
platers Surf. Finish. Soc. (1999) 1735.
[
[
[
ources 179 (2008) 265–273 273
14] S.-H. Wang, J. Peng, W.-B. Lui, J.-S. Zhang, J. Power Sources 162 (2006)486.
15] M.P. Brady, K. Weisbrod, I. Paulauskas, R.A. Buchanan, K.L. More,H. Wang, M. Wilson, F. Garzon, L.R. Walker, Scripta Mater. 50 (2004)1017.
16] H. Wang, M.P. Brady, K.L. More, H.M. Meyer, J.A. Turner, J. PowerSources 138 (2004) 79.
17] R. Tian, J. Sun, L. Wang, Int. J. Hydrogen Energy 31 (2006) 1874.18] M. Li, S. Luo, C. Zeng, J. Shen, H. Lin, C.N. Cao, Corros. Sci. 46 (2004)
1369.19] E.A. Cho, U.S. Jeon, S.A. Hong, I.H. Oh, S.G. Kang, J. Power Sources 142
(2005) 177.20] H. Wang, M.A. Sweikart, J.A. Turner, J. Power Sources 115 (2003)
243.21] H. Wang, G. Teeter, J.A. Turner, J. Electrochem. Soc. 152 (2005) B99.
22] K. Banerjee, A. Amerasekera, G. Dixit, C. Hu, Proceedings of the ElectronDevices Meeting, IEEE, Washington, DC, 1997, p. 115.23] Keithley, Low Level Measurements; Precision DC Current, Voltage, and
Resistance Measurements, User Manual (2004) 4–26.24] Y. Wang, D.O. Northwood, Electrochim. Acta 52 (2007) 6793.