
the impact of trade credit management on firm's performance
76
i THE IMPACT OF TRADE CREDIT MANAGEMENT ON FIRM’S PERFORMANCE (CASE STUDY- GUINNESS GHANA BREWERY LIMITED) ABOAGYE KWARTENG AMANING ADJEI BOAHEN GEORGE AMPONFI OSEI KOFI BISMARK ABENA GYANKOMA ALHASSAN ABDULAI JEDUAH A PROJECT WORK PRESENTED TO THE DEPARTMENT OF BUSINESS ADMINISTRATION IN PARTIAL FULFILLMENT OF THE REQUIREMENTS FOR THE AWARD OF A BACHELOR OF BUSINESS ADMINISTRATION (BACHELOR OF BUSINESS ACCOUNTING OPTION) JUNE, 2013
-
Upload
khangminh22 -
Category
Documents
-
view
1 -
download
0
Transcript of the impact of trade credit management on firm's performance

i
THE IMPACT OF TRADE CREDIT MANAGEMENT ON FIRM’S PERFORMANCE
(CASE STUDY- GUINNESS GHANA BREWERY LIMITED)
ABOAGYE KWARTENG AMANING
ADJEI BOAHEN GEORGE
AMPONFI OSEI KOFI BISMARK
ABENA GYANKOMA
ALHASSAN ABDULAI JEDUAH
A PROJECT WORK PRESENTED TO THE DEPARTMENT OF BUSINESS
ADMINISTRATION IN PARTIAL FULFILLMENT OF THE REQUIREMENTS
FOR THE AWARD OF A BACHELOR OF BUSINESS ADMINISTRATION
(BACHELOR OF BUSINESS ACCOUNTING OPTION)
JUNE, 2013

ii
STATEMENT OF AUTHENTICITY
We have read the university regulations relating to plagiarism and certify that this report is all
our own work and does not contain any unacknowledged work from any other source. We
also declare that we have been under supervision for this report herein submitted.
Name Index Number Signature Date
Aboagye Kwarteng Amaning 10140645 ………………… …………………
Adjei Boahen George 10140980 ………………. …………………
Alhassan Abdulai Jeduah 10140934 ………………. ….………………
Abena Gyankoma 10140643 ……………….. ….……………….
Amponfi Osei Kofi Bismark 10135037 ……………….. …..……………..
Supervisor’s Declaration
I hereby declare that the preparation and presentation of the dissertation were supervised in
accordance with the guidelines on supervision laid down by Christian service University
College.
Supervisor’s Name
Mr. Samuel Yawlui ……………………… ….…………………..
Head of Department’s Name
Kwaku Ahenkorah (Dr.) ………………………. ….…………………..

iii
ABSTRACT
An efficient credit management system reduces the amount of capital tired up with debtors
and minimizes bad debts. Good credit management system is vital to business cash flow and
success and ensures effective business operation.
The study investigated the impact of financial management of trade credit on firm’s
performance; using Guinness Ghana brewery limited (GGBL) as case study. The choice of
the topic was influenced by the impact of short term financial management of trade credit on
profitability of companies.
Secondary data was used for the study. It noted that, average collection period of 39.6 days
was maintained by GGBL over the period. Average payment period was also 96.2 days,
which was encouraging. This means that, supplies made to GGBL on credit were utilized to
turn over sales cycle three times before payments were eventually made to suppliers. The
performance in terms of profitability evidenced by ROE (Return On Equity), was 36% and
OPM (Operating Profit Margin) was 12.4%. This goes to highlight the importance the impact
of efficient credit management have on profitability of firms.
The study further observed that ACP and APP were positively related to profit margin
(OPM), but negatively related to return on equity. The study was observed to be consistent
with other studies conducted by Poutziouris, Michaelas and Soufani (2005)
The recommendations made include;
Policy makers should have the interest in promoting efficient management of working
capital to facilitate performance management.
Top management of every firm should manage their trade credits prudently in order to
remain profitable and competitive.

iv
ACKNOWLEDGEMENTS
Our profound gratitude goes to the almighty God for his Grace and wisdom which guided us
through this laborious study.
We are also very grateful to our supervisors Eric Atta Appiagyei and Sammuel Yawlui for
their immense contributions to making this project come to fruitful. We are thankful to the
Ghana stock exchange that made their data accessible to researchers.
We are also grateful to earlier researchers into this area whose work continues to be an
exemplary record or guide to those of us very naïve in the field of finance.

v
TABLE OF CONTENT
Statement of Authenticity…………………………………………………………………. ii
Abstract……………………………………………………………………………………. iii
Acknowledgements…………………………………………………………………………iv
Table of content…………………………………………………………………………… v
CHAPTER ONE
INTRODUCTION
1.1 Background of the Study……………………………………………………………… 1
1.2. Problem Statement…………………………………………………………………… 3
1.3 Research Objective…………………………………………………………………… 5
1.4 Research Questions…………………………………………………………………… 5
1.5 Research Hypothesis………………………………………………………………….. 5
1.6 Scope of The Study…………………………………………………………………… 6
1.7 Significance of the Study…………………………………………………………….. 6
1.8 Limitations of the Study……………………………………………………………… 7
1.9 Organization of the Study……………………………………………………………. 7
CHAPTER TWO
LITERATURE REVIEW
2.0 Introduction…………………………………………………………………………… 8
2.1 Theoretical Basis of the Study………………………………………………………… 8
2.2 Significance of Working Capital Management………………………………………………. 9
2.3 Policies of Working Capital Management……………………………………………………. 9
2.5 Stages of Working Capital Management……………………………………………………… 10
2.5.1 Working Capital Management Overview………………………………………………… 12

vi
2.6 Constituents of Working Capital Management………………………………. ………………. 13
2.7 Inventories Management……………………………………………………….………………. 14
2.8 Just -In-Time Inventory Management…………………………………………………………. 17
2.9 Working Capital and Cash Conversion Cycle………………………………………………… 17
2.10 Working Capital Trade-Off…………………………………………………………………. . 18
2.11 Managing Cash Flows………………………………………………………………………… 20
2.12 Managements of Trade Credit (Debtors)……………………………………………………. 20
2.12.1 Account Receivable and Current Liability Management…………………………………… 21
2.12.2 Methods of Collection…………………………………………………………………….. 26
2.12.3 Cost of Accounts Receivables……………………………………………………………...27
2.12.4 Evaluation of Credit Worthiness…………………………………………………………. 27
2.12.5 Currents Liabilities………………………………………………………………………… 28
2.13 Financing Current Assets…………………………………………………………………… 28
2.14 Sources of Short-Term Financing…………………………………………………………… 28
2.13 Empirical Studies on Working Capital Management and its
effects on Performance………………………………………………………………. 33
CHAPTER THREE
RESEARCH DESIGN AND METHODOLOGY
3.1 Introduction………………............................................................................................. 38
3.2. Research Design ........................................................................................................... 39
3.3 Data Consideration and Sources………………………………………………………. 40
3.4 Description and Explanation of Variables…………………………………………….. 41
3.4.1 Dependent Variable………………………………………………………………….. 42
3.5 Data Coding…………………………………………………………………………… 42
3.6 Data Analysis …………………………………………………………………………. 42
3.6.1 Data Analysis Technique……………………………………………………………. 42

vii
3.7 Profile of the Study Area ……………………………………………………… …. 43
CHAPTER FOUR
DATA ANALYSIS AND DISCUSSION OF FINDINGS
4.1 Introduction……………………………………………………………………….. 45
4.2 Descriptive Statistics……………………………………………………………… 45-52
CHAPTER FIVE
FINDINGS, CONCLUSIONS AND RECOMMENDATIONS
5.1 Introduction………………………………………………………………………… 53
5.2 Descriptive Statistics………………………………………………………………... 53
5.3 Raw Data Analysis ………………………………………………………………… 55
5.4 Conclusions…………………………………………………………………………. 55
5.5 Recommendation…………………………………………………………………….56
References……………………………………………………………………………….. 57
Appendix…………………………………………………………………………………59-69

1 | P a g e
CHAPTER ONE
INTRODUCTION
1.1 BACKGROUND OF THE STUDY
An efficient credit management system reduces the amount of capital tied up with debtors
and minimizes bad debts Finlay (2009). Peter D. (2005) conceived that there is a positive cor-
relation between credit management and profitability. According to Dina A. (2007), good
credit management is vital to business cash flow and ensures business operations. Good credit
management involves optimizing cash flow to ensure stability and provide maximum poten-
tial for growth. Credit arises when a firm sells its products or services on credit and does not
receive cash immediately. It is an essential marketing tool, acting as a bridge for the move-
ment of goods through production and distribution stages to customers. A firm grants trade
credit to protect its sales from the competitors and to attract the potential customers to buy its
products at favorable terms. Trade credit creates receivable or book debts which the firm is
expected to collect in the near future. The book debts or receivable arising out of credit has
three characteristics:' first, it involves an element of risk which should be carefully analysed.
Cash sales are totally riskless, but not the credit sales as the cash payment are yet to be re-
ceived. Second it is based on economic value. To the buyer, the economic value in goods or
services passes immediately at the time of sale, while the seller expects an equivalent value to
be received later on. Third, it implies futurity. The cash payment for goods or services re-
ceived by the buyer will be made by him in a future period. The customers from whom re-
ceivable or book debts have to be collected in the future are called trade debtors or simply as
debtors and represent the firm's claim or asset.(Ramamoorth,1976,p.183)

2 | P a g e
Receivable constitutes a substantial portion of current assets of several firms. For example in
India, trade debtors, after inventories, are the major components of current assets. They form
about one-third of current assets in India. Granting credit and creating debtors amount to the
blocking of the firms funds,(Ramamoorthy,1976.)
It is perceived that the following factors might have contributed to high failure of business
having bad debt sitting in their account statements;
Either no documentation or poorly constructed documentation specifying the terms
and conditions of trade in the organization’s credit policy.
Inability to seek legal advice before finalizing the documentation to ensure it has in-
ternal consistency and covers all the key issues.
Inability to clearly specifying what will be supplied, when the work will be done, and
when and how payment is to be made.
Failure to obtain a written acceptance of the agreement along with written approval of
any variations to the original agreement
Poor timing of invoicing and insufficient details to resolve invoice queries or disputes
quickly.
Poor maintenance of debtors’ records to identify any due or over due debts and how
much is owed and who owes (Ramamurthy, 1976.)
Philip K. (2010) cited four basic things businesses must strive for effective credit manage-
ment:
Know who your customers are before you start trading with them.
Agree payment terms before supplying,
Invoice promptly after you have sent the goods; and
Do not be afraid to ask for payment when it is due.

3 | P a g e
The importance of practicing good credit management cannot be over emphasized. Accord-
ing to Michael (1997), good credit management is an essential component and a fundamental
part of the modern commercial strategy. Michael (1997) consented that extending credit to
customers is an aid to selling and all staff should be involved. Michael blended sensible con-
trol of credit management and customer satisfaction with profitability. According to Steve
(1997) of Association of Credit Professionals (ACP) good credit management is all about
customer satisfaction and profit. Steve, (1997) agreed with Michael’s assertion. Michael con-
tended that satisfied customers are more likely to pay promptly than buyers who feel they are
not getting a good deal.
Indeed if revenue is the energy that powers company, credit management is the engine that
keeps it flowing. The credit management engine acts as a powerhouse, driving revenue and
motivation to every part of the company. As credit management engine becomes more re-
fined and efficient, so the company becomes more productive and profitable. Good credit
management should be a proactive task, starting even before the sales begin. Effective credit
management will protect and prosper the business with regards to profitability however; the
opposite is true if ineffective credit management is practiced. Credit indeed impacts all areas
of life and efficient credit management minimizes delinquency and bad debt losses.
It is against this background that the researchers want to ascertain the impact of credit man-
agement on profitability using GGBL as a case study.
1.2. PROBLEM STATEMENT
A lot of studies have been conducted to establish the impact of short term debt management
policies on profitability. Dina, A. (2007) argued that, it appears that customers who pay

4 | P a g e
promptly are not the problem but those who cannot pay or would not pay. Invariable unpaid
debts will affect profitability. If repayments are not made regularly as a result of poor control-
ling, monitoring and collection of debts, then the ability to make profit is severely affected. It
is believed that inefficient credit management generates irregular incomes which hinder the
organization’s effectiveness and efficiency.
Further study conducted by Michael,(1997) concluded that, about 38% of businesses that ex-
tend credit to clients are unlikely to sustain in the market. Michael asserted that it is possible
to be profitable on paper but lack the cash to continue operating the business. The European
Commission in 2008 reported that, 33% of EU businesses regard late payment as a survival-
threatening issue. The report stated that late payments hinder the functioning of the single
market and cross-border trade.
However, extending credit has become an aspect of everyday business activity to be able to
increase sale. Since it contributes significant revenue to businesses especially as the world
recovers from the financial shocks of recent years and exposures of company balance sheet
The above have demonstrated the contributions made so far by theses researchers in contri-
buting to the existing literature in this context. Irrespective of this doubt still remains as to
whether the findings can be applied in the Ghanaian situations, where the business environ-
ment is very fragile. In addition, there is inadequate research on trade credit management in
Ghana.
Furtherance to this, the significance of the relationship between the two variables still re-
mains to be empirically concluded. Hence this study was initiated to contribute to the existing

5 | P a g e
literature using data from the Ghanaian business environment. It is hoped that the findings of
this study will have enormous policy implications to the private sector given the fact that the
private sector has been earmarked to be the engine of growth.
1.3 RESEARCH OBJECTIVE
The objective of this study is to identify any relationship between short term financial man-
agement of trade credit on profitability of GGBL. .Specifically; we are going to look at the
Average Collection Period (ACP), Average Payment Period (APP) and their relationship with
Return On Equity (ROE) and Operating Profit Margin (OPM)
1.4 RESEARCH QUESTIONS
Do short term debt or trade credit management policies or decisions matter in firms’ perfor-
mance in Ghana? Is there any relationship between trade credit management and perfor-
mance? To what extent does effective trade credit financial management affect profitability?
1.5 RESEARCH HYPOTHESIS
To answer the above questions the following hypothesis are designed based on the test of the
null hypothesis:
HoA: There is no significant relationship between short term debt or credit and profitability
as measured by Return on Equity (ROE) and operating profit margin (OPM).
H1B: There is a significant relationship between short term debt or credit and profitability
as measured by Return on Equity (ROE) and operating profit margin (OPM).
HOi: There is no significant change in firm’s profitability as a result of increase or decrease
in short term debt and credit.

6 | P a g e
HOii: There is a significant change in firm’s profitability as a result of increase or decrease
in short term debt and credit.
1.6 SCOPE OF THE STUDY
The study covered a period of 2004 - 2012 works of GGBL.
1.7 SIGNIFICANCE OF THE STUDY
For the academic world, this study has shed some light on the short term debt policies. The
significance of this study has further enhanced considering the fact that research into the rela-
tionship between short term debt and profitability in Ghana is only at its infantile stage. For
practitioners, this study is relevant and of much interest to financial controllers, managers,
directors particularly those working in the brewery sector to get to know about the trend of
debt management policies of their competitors. The study is also relevant to the government
of Ghana. Policy makers in Ghana recently developed Medium-Term National Private Sector
Development Strategy, and articulated government’s commitment to facilitating private sec-
tor-led growth. It is expected that the findings of this study will have important policy impli-
cations.
1.8 LIMITATIONS OF THE STUDY
The limitations of the study are;
Financial constrains
Time constrain.
7 | P a g e
1.9 ORGANIZATION OF THE STUDY
The study is organized as follows:
Chapter One covers the background, statement of the problem, purpose of the study, research
question, significance of the study, limitations, and organization of the study.
Chapter two; Review of related literature on; Theoretical basis of the study, Working capital
management, Management of trade credit, Financing current assets, Empirical studies on
working capital management and its effects on performance.
Chapter three covers research methodology used for this study. The chapter includes the
sources of the data, description of the variables; research questions with respective hypothes-
es .The analysis of the data and the tools that were used to perform the statistical analysis.
Chapter four; includes data analysis, presentation of results and discussion of the findings of
the study.
The last chapter that is chapter five; consists of the summary of findings, recommendations
and conclusion.
8 | P a g e
CHAPTER TWO
LITERATURE REVIEW
2.0 INTRODUCTION
This chapter reviews the conceptual framework of the study. The chapter considered some
leading empirical studies that has helped popularized the concept of financial management of
trade credit. It goes further to analyze some theoretical issues pertaining to trade credit man-
agement on working capital.
2.1 THEORETICAL BASIS OF THE STUDY
The significant of effective working capital management lies in the fact that working capital
is the engine of growth for every business organization .working capital can be managed ef-
fectively when proper attention has been paid to current asset ( cash/bank, trade credit, inven-
tories) and current liabilities( trade payables, owning, short term loans). There may be excel-
lent and competent sales personnel, brilliant designers to design exactly what the customer's
want, smooth and efficient production methods but if trade credit is not well managed, the
business will come to a standstill. Working capital management (WCM) is the management
of short-term financing requirements of a firm. This includes maintaining optimum balance
of working capital components; receivables, inventory and payables and using the cash effi-
ciently for day-to-day operations. Optimization of working capital balance means minimizing
the working capital requirements and realizing maximum possible revenues. Efficient WCM
increases firms’ free cash flow, which in turn increases the firms’ growth opportunities and
return to shareholders. Even though firms traditionally are focused on long term capital bud-
geting and capital structure, the recent trend is that many companies across different indus-
tries focus on WCM efficiency. Inadequate working capital leads the company to bankruptcy.

9 | P a g e
On the other hand, too much working capital results in wasting cash and ultimately the de-
crease in profitability (Chakraborty, 2008).
2.3 SIGNIFICANCE OF WORKING CAPITAL MANAGEMENT
To be effective, working capital management requires a clear specification of the objectives
to be achieved. The purposes of working capital management are: To increase the profitabili-
ty of a company, and to ensure that the firm has sufficient liquidity to meet short-term obliga-
tions as they fall due and so continue in business. Profitability is connected to the goal of
shareholders wealth maximization, so investment in current assets should be made only if an
acceptable return would be obtained. On the other hand, liquidity is needed for a company to
continue in business. A company may consider holding more cash than is needed for day –to
– day operations or transaction needs. The twin goals of profitability and liquidity will often
conflict since liquid assets give the lowest returns. For example, cash kept in a safe will not
generate a return while a six-month bank deposit will earn interest in exchange for loss of as-
sets for the period.
2.4 POLICIES OF WORKING CAPITAL MANAGEMENT
Working capital management is important that, a company needs to come out with clear pol-
icies relating to the various components of working capital. These key policies areas relate
to;
The level of investment in working capital for a given level of operations and the extent to
which working capital is financed from short-term funds such as bank overdrafts. A company
should have working capital policies on the management of debtors, cash, inventories, and

10 | P a g e
short-term investments in order to minimize the possibility of mangers coming out with deci-
sions which are not in the best interest of the firm or company.
Working capital policies will also need to reflect the credit policies of a company's close
competitors since it would be unfair to lose business because of an unfavorable comparison
of terms of trade.
2.5 STAGES OF WORKING CAPITAL MANAGEMENT
An aggressive policy with regard to the stages of investment in working capital means that a
company chooses to operate with lower levels of cash, debtors and inventory for a given level
of sales or activity. An aggressive policy will increase profitability since less cash will be tied
up in current assets, but it will also increase risk since the possibility of cash shortages or
running out of inventories is increased.
A conservative and more flexible working capital policy for a given level of turnover would
be associated with maintaining a larger cash balance, perhaps even investing in short-term
securities, offering more generous credit terms to customers and holding higher levels of in-
ventory, such a policy will give rise to a lower risk of financial problems or inventory prob-
lems, but at the expense of reducing profitability.
Finally, a moderate policy would tread a middle path between the aggressive and conserva-
tive approaches. It should be noted that the working capital policies of a company can be cha-
racterized as aggressive, moderate or conservative by comparing them with the working capi-
tal policies of similar companies. There are no absolute benchmarks of what may be regarded

11 | P a g e
as aggressive for analyzing the ways in which individual companies approach the operational
problem of working capital management.
2.5.1 WORKING CAPITAL MANAGEMENT OVERVIEW
Working capital represents operating liquidity available to a business along with fixed assets
such as plant and equipment. Working capital is considered a part of operating capital and it
is calculated as current asset minus current liabilities. If current assets are less than current
liabilities, an entity has a working capital deficit or deficiency. An increase in working capital
indicated that the business has either increased current assets (that is received cash, or other
current assets) or has decrease current liabilities.
Decisions relating to working capital and short-term financing are referred to as working cap-
ital management. These involve managing the relationship between firm's short-term assets
and its short-term liabilities. The goal of every business is to able to continue its operations
and that it has sufficient cash flow to satisfy both upcoming operational expenses and matur-
ing short-term debt.
A measure of cash flow is provided by the cash conversion cycle. This is the net number of
days from the outlay of cash for raw material to receiving payment from the customer. As a
management tool, this metric makes explicitly the inter-relatedness of decisions relating to
inventories, cash, accounts receivable and payables. This number of days effectively corres-
ponds to the time that the firm’s cash is tied up in operations and unavailable for other activi-
ties.
12 | P a g e
Brealey, et al (2006) explained that, company can be gifted with assets but short of short term
financing if its assets cannot be readily converted into cash. They argued further that, positive
working capital is required to ensure that a company is able to continue its operations and that
it has sufficient funds to satisfy both maturing short-term debt and operational expenses.
Therefore the management of working capital involves aging inventories, cash, and account
receivable and payable.
Dike Ross, Westerfield and Jordan, Brealey, Myers and Marcus, Kofi Osei in "A workshop
working capital management" (2000) defined working capital as current assets and current
'abilities. He went further to divide working capital into two types. Permanent and Temporal
working capital, permanent working capital is the working capital that persists over time de-
spite fluctuations in sales. He further stated that temporal working capital is the additional
assets needed to meet, variations in sales above the permanent working capital level.
These parts considered the ideas of some writers relevant to the study and in my opinion two
views were discussed with respect to the split between current and fixed assets as well as
fixed long-term liabilities and the need to ensure effective working capital management. Both
views apparently agreed that effective working capital management can free significant in-
stant liquidity, a valuable tool at a time when liquidity is a scarce commodity. It must howev-
er be stressed that, this study shall convert the general working capital management and its
impact on organizations and it is not limited to any particular type of business organization.

13 | P a g e
2.6 CONSTITUENTS OF WORKING CAPITAL MANAGEMENT
Working capital consists of short term or current assets and current liabilities.
Current Assets
One significant component of current assets is Accounts Receivable. Accounts receivable
arise because companies do not usually expect customers to pay for their goods and services
immediately. These unpaid bills are a valuable asset that companies expect to be able to turn
into cash in the near future. The bulk of accounts receivable consists of unpaid bills from
sales to other companies and are known as trade credit. The remainder arises from the sale of
goods to the final consumer.
Another important current asset is inventory. Inventories may consist of raw materials, work
in progress, or finished goods awaiting shipment. Banks also lend on the security of invento-
ry, but they are careful about the inventory they will accept. They want to make sure that they
can identify and sell it if you default. Automobiles and other standardized non-perishable
commodities are good security for a loan. Banks need to monitor companies to be sure they
don't sell their assets and run off with the money.
To protect themselves against this sort of risk, lenders often insist on field warehousing. An
independent warehouse company hired by the bank supervises the inventory pledged as colla-
teral for the loan. As the firm sells its product and uses the revenue to pay back the loan, the
bank directs the warehouse company to release the inventory back to the firm. If the firms
default on the loan, the bank keeps the inventory and sells it to recover the debt.

14 | P a g e
The remaining current assets are cash and marketable securities. The cash consists partly of
cedi bills, but most of the cash is in the forms of bank deposits. These may be demand depo-
sits (money in current accounts that the firm can pay out immediately) and fixed deposits
(money in savings account that can be paid out only with a delay). The principal marketable
security is commercial paper (Short-term unsecured debt sold by other firms). Other securi-
ties include Treasury Bills and others which are Short-Term debts sold by the Government of
Ghana and state and local security agencies.
In managing their cash, companies always enjoy the advantages to holding large amounts of
ready cash; - They reduce the risk of running out of cash and having to borrow more on short
notice. On the other hand, there is a cost to holding idle cash balances rather than putting the
money to work earning interest.
Current Liabilities
It has been established that a company's principal current liabilities consists of unpaid bills.
One firm's credit must be another's debit. Therefore, it is not surprising that a company's prin-
cipal current liability consists of accounts payable; that is, outstanding payments due to other
companies. The other major current liabilities consist of short-term a borrowing which has
been fully explained under sources of short-term financing.
2.7 INVENTORIES MANAGEMENT
According to William Baumol, an economist was the first to come out that, inventory models
can tell us something about the management of cash balances. If that seems more easily said
than done, it may interest you to know that, production managers make a similar trade-off as

15 | P a g e
why firms carry inventories of raw materials, work in progress and finished goods. They are
not obliged to carry these inventories; for example, they could simply buy materials day to
day; as needed. But then they would pay higher prices for ordering in small lots, and they
would risk production delays if the materials were not delivered on time. That is why they
order more than the firm's immediate needs. Similarly, the firm holds inventories of finished
goods to avoid the risk of running out of product and losing a sale because it cannot fill an
order.
But there are costs of holding inventories; money tied up in inventories does not earn interest;
storage and insurance must be paid for; and often there is spoilage and deterioration. Produc-
tion managers must try to strike a sensible balance between the costs of holding too little in-
ventory and that of holding too much.
There are cost to keeping an excessive inventory of cash (the lost interest) and cost to keeping
two small an inventory (the cost of repeated sales of securities).There are two costs asso-
ciated with holding inventory. These are order cost and carrying cost. Order cost is the cost of
placing order with a supplier involves a fixed handling expense and delivery charge. The
second type of cost is the carrying cost. This includes the cost of space, insurance and losses
due to spoilage or theft. The opportunity cost of the capital tied up in the inventory is also
part of the carrying cost.
As the firm increases its order size, the number of orders falls and therefore the order costs
decline. However, an increase in order size also increases the average amount in inventory.So

16 | P a g e
that the carrying cost of inventory raises. The trick is to strike a balance between these two
costs. This is the kernel of the inventory problem.
Note that it is worth increasing order size as long as the decrease in total order costs outweigh
the increase in carrying costs and the optimal order size is the point at which these two effects
offset each other. This order size is called the economic order quantity. That is, order sizes
that minimize total inventory costs.
The economic order quantity is a simplified version of the inventory management process in
real firms, but it does capture the four essential features for inventory management; these are:
Optimal inventory levels involve a trade-off between carrying costs and order cost.
Carrying costs include the cost of storing goods as well as the cost of capital tied up in
inventory.
Inventory levels will be lower when storage or interest costs are high and will be
higher when restocking costs are high.
Inventory level does not rise in direct proportion to sales. As sales increase, the op-
timal inventory level rises, but less than proportionately.
Also, never forget that, the level of inventories should always depend on your forecast
of sale, which like all forecasts is subject to uncertainty.

17 | P a g e
2.8 JUST -IN-TIME INVENTORY MANAGEMENT
A number of firms have used a technique known as a just-in-time inventory management to
make dramatic reductions in inventory levels. Firms that use the just-in-time system receive a
nearly continuous flow of deliveries of parts and raw materials. For these firms, the extra cost
of restocking is completely outweighed by the savings in carrying cost. Just -in-time invento-
ry management can also reduce costs by allowing suppliers to produce and transport goods on
a steadier schedule. However, such systems rely heavily on predictability of the production
process. For instance, a firm in an industry with shaking labour relations would adopt a just-
in-time system at its peril, for with essentially no inventory on hand; it would be particularly
vulnerable to a strike.
2.9 WORKING CAPITAL AND CASH CONVERSION CYCLE
The difference between current assets and current liabilities is known as net working capital,
but financial managers often refer to the difference simply as working capital, usually current
assets exceed current liabilities; that is, firms have positive net working capital.
If a firm's balance sheet is prepared at the beginning, you will see cash (a current asset). If
you delay a little, you will find the cash replaced first by inventories of raw materials and
then an inventory of finished goods (also current asset). When goods are sold, the inventories
give to accounts receivable (another current asset) and finally, when the customers pay their
bills, the firm takes out its profit and replenishes the cash balance.
The components of working constantly change with the cycle of operations, but the amount
of working capital is fixed. This is one reason why net working capital is a useful summary
measure of current assets or liabilities.
18 | P a g e
The following four key dates in the production cycle that influence the firm’s investment in
working capital. The firm starts the cycle by purchasing raw material, but it does not pay for
them immediately. The firm processes the raw materials and then sells the finished goods.
The delay between the initial investment in inventories and the sale date is the inventory pe-
riod. Sometime after the firm has sold the goods, its customers pay their bills. The delay be-
tween the date of sale and the date at which the firm is paid is the accounts receivable period.
The total delay between initial purchase of raw materials and ultimate payments from cus-
tomers is the sum of the inventory and accounts receivable periods. However, the net time
that the company is out of cash is reduced by the time it takes to pay its own bills. The length
of time between the firm’s payment, firm’s raw materials and the collection of payment from
the customers is known as the firm's cash conversion cycle. That is the period between firm's
payment for materials and collection of its sales.
The longer the production process, the more cash the firm must keep tied up in inventories.
Similarly the longer it takes customers to pay their bills, the higher the value of accounts re-
ceivable. It may reduce the amount of cash it needs. In other words, accounts payable reduce
net working capital.
2.10 WORKING CAPITAL TRADE-OFF.
The cash conversion cycle is not cash in store but to a large extent, it is within credit man-
agement control. Working capital can be managed. For instance, accounts receivable are af-
fected by the terms of credit the firm offers to its customers. The amount of money tied up in
receivables can be cut down by getting tough with customer's who are slow in paying their

19 | P a g e
bills. Similarly, the firm can reduce it's investment in working capital that has both cost and
benefits.
The cost of the firm's investment in receivables is the interest that could have been earned if
customers had paid their bills earlier. The firm also forgoes interest income when it holds idle
cash balances rather than putting the money to work in marketable securities. The cost of
holding inventory includes not only the opportunity cost of capital but also storage and insur-
ance costs and the risk of spoilage or obsolescence. All these carrying costs encourage firms
to hold current assets to a minimum.
While carrying costs discourage large investments in current assets a low level of current as-
sets makes it more likely that the firm will face shortage costs. For instance if the firm runs
out of inventory of raw materials, it may have to shut down production.
Similarly, a producer holding a small finished goods inventory is more likely to be caught
short, unable to fill orders promptly. There are also disadvantages to holding small "invento-
ries" of cash. If the firm runs out of cash, it may have to sell its securities and incur unneces-
sary trading cost. The firm may also maintain too low a level of accounts receivable but if the
firm tries to minimize accounts receivable by restricting credit sales, it may lose customers.
Therefore, an important job of the financial manager is to strike a balance between the cost
and benefits of current assets that is to find the level of current assets that minimizes the sum
of carrying costs and storage costs.

20 | P a g e
2.11 MANAGING CASH FLOWS
The efficient way of managing cash flow means that debts should be collected in line with
agreed credit terms and cash should be quickly banked. Prompt banking will either reduce the
interest charged on an outstanding overdraft or increase the interest earned on cash deposits.
Credit offered by suppliers should be used to the full and payments made as late as possible,
provided the benefit of these actions is greater than the benefit of taking any early payment
discounts available. The float is the period of time between initiating payment and receiving
cash in a company's bank account. The floats can vary between four and nine days and con-
sist of:
Transmission on delay; time taken for a payment to pass from payer to payee. Lodgment de-
lay: delay in banking any payments received. Clearance delay: time taken by a bank to clear
presented instructions to pay:
The float can be reduced by minimizing lodgments delay and by simplifying and speeding up
cash handling. A good cash management will seek to keep the float to a minimum.
2.12 MANAGEMENTS OF TRADE CREDIT (DEBTORS)
A company's credit management policy should help it maximize expected profits. It will need
to take into accounts its current and desired cash position, as well as its ability to satisfy ex-
pected demand. For effective trade credit management policy, managers may need training or
qualified staff.
21 | P a g e
The key variables affecting the level of debtors will be the terms of sale prevailing in a com-
pany's area of business and the ability of the company to match and service comparable terms
of sale. There is also a relationship between the level of debtors and a company's pricing pol-
icy. The effectiveness of debtor follow-up procedures used will also influence the overall lev-
el of debtors and the likely hood of bad debts arising.
The debtor’s management policy decided upon by managers should also take into account the
administrative costs of debt collection, the way in which the policy could be implemented
effectively and the costs and effects of erasing credit. It should balance the benefits to be
gained from offering credit to customers against the costs of doing so.
Longer credit terms may increase turnover, but will also increase the risk of bad debts. The
cost of increased bad debts and the cost of any additional working capital required should be
less than the increased profits generated by the higher turnover. In order to prepare debtors
policy, a company need, to set up a credit analysis system, a credit control system and a deb-
tor collection system.
2.12.1 ACCOUNT RECEIVABLE AND CURRENT LIABILITY MANAGEMENT
Account receivable is defined as money owned at a company from the sale on credit of goods
and services in the normal course of business. The two credit types are trade credit and con-
sumer credit. Trade credit refers to sales made on credit to another business and consumer
credit refers to credit sales made to an individual.

22 | P a g e
Terms of sale
When goods are sold, you need to set the terms of sale. For example if you are supplying
goods to a wide variety of irregular customers, you may require cash on delivery. And if you
are producing goods to the customer's specification or incurring heavy delivery cost, then, it
may be sensible to ask for cash before delivery. Some contracts provide for progress pay-
ments as work is carried out. For instance, a large consulting contract might call for 30 per-
cent payments after competition of field research, 30 percent more on submission of a draft
report and the remaining 40 percent when the project is finally completed.
In many other cases, payment is not made until after delivery, so the buyer receives credit.
Each industry seems to have its own typical credit arrangements. When you buy on credit, the
supplier will state a final payment date. To encourage you to pay before the final date, it is
common to offer cash discount for prompt settlement. A manufacturer may require payment
within 30 days but offer a 5 percent discount to customers who pay with 10 days. These terms
would be referred to as 5/10 net 30.
When purchases are subject to seasonal fluctuations manufacturers often encourage custom-
ers to take early delivery by allowing them to delay payment until the usual order season.
This practice is known as season dating. A firm that buys on credit is in effect borrowing
from its supplier; it saves cash today but will have to pay later. This is an implicit loan from
the supplier.
Credit agreements
Credit agreements are agreements whereby sales are made with no formal debt contract. The
terms of sale define the amount of any credit but not the nature of the contract. Repetitive

23 | P a g e
sales are almost always made on open account and involve only an implicit contract. Some-
times you might want a clear commitment from the buyer before you deliver the good. In this
case the common procedure is to arrange a commercial draft. The seller prepares a draft or-
dering payment by the customer and sends this draft to the customer's bank. If immediate
payment is required, the draft is termed as a sight draft. Depending on whether it is a sight or
time draft, the customer either tells the bank to pay up or acknowledges the debt by adding
the word accepted and a signature.
Once accepted, a time draft is like a postdated cheque and is called a trade acceptance. This
is then forwarded to seller, who holds it until the payment becomes due. But when the cus-
tomer's credit is for any reason suspect, the seller may ask the customer to arrange for his or
her bank to accept the time draft; by so doing the bank guarantees the customer's debt. When
goods are sold to customers who unable to pay, you cannot get your goods back. You simply
become a general creditor of the company. This situation can be avoided by making a condi-
tional sale, so that ownership of the goods remains with the seller until full payment is made.
This is normally used for goods that are paid on installment basis, so that if the customer fails
to make the agreed number payments, then the goods can be immediately repossessed by the
seller.
Credit analysis
Credit analysis is a procedure to determine the likelihood a customer will pay its bills. There
are a number of ways to find out whether customers are likely to pay their debts. The most
obvious indication is whether they have paid promptly in the past. Prompt payments is usual-
ly a good owner, but beware of the customer who establishes a high credit limit on the basis
24 | P a g e
of small payments and then disappears, leaving you with a large unpaid bill. But if you are
dealing with a new customer, you will probably check with a credit agency.
Credit agencies usually report the experience that other firms have had with your customer
but you can also get this information by contacting those firms directly or through a credit
bureau. Again, your bank can also make a credit check, that is, it will contact the customer's
bank and ask for information on the customer's average bank balance, access to bank credit
and general reputation. In addition to checking with your customer's bank, it might make
sense to check what everybody else in the financial community thinks about your customer's
credit standing. Finally, you can look at how the customer's stock price has been behaving
recently. A sharp fall in price doesn't mean that the customer is in trouble, but it does suggest
that prospects are less bright than formerly. The following important variable need to be dis-
cussed in order to make the subject of accounts receivable more meaningful.
Credit policy
These are the management procedures concerning the extension of trade credit and accounts
receivable management. They determine the level of sales and profits. Credit terms, credit
standards and collection period policy are the variable under credit policy.
Credit terms
The credit terms are the maximum amount of credit to be given, the length of period for pay-
ment (ie the net period), the discount rate (s) and the discount period (s) if any. The idea of
discount is to attract customers, thereby increasing sales and to encourage the early payment
of access as to reduce the amount tied up in accounts receivable.
25 | P a g e
Credit standards
Credit standards determine the maximum risk that a firm is willing to take in extending cre-
dit. Credit to nearly all customers who request and to delay collection of other due accounts.
This is aimed at attracting more new customers and also encouraging existing customers to
go in for more credit. A strength policy on the other hand will keep the firms collection cost
at the lowest minimum but also lead to the loss of customers to competitors.
The firm must therefore determine the nature of credit risk on the basis of prior record of
payment, financial stability and the current net worth of the customer.
Collection policy and procedure
A collection policy refers to the procedures the firm follows to obtain payment of past due
accounts, the critical problem associated with this policy is the need to recognize when an
account warrants a special attention. Again, collection policies are procedures to collect and
monitor receivables. It would be nice if all customers paid their bills by the due date but that
is not the case. Slow payers impose two costs on the firm. First, they require the firm to spend
more resources in collecting payments. They also force the firm to investment in working
capital.
When your customers stretch payables, you end up with a longer collection period and great-
er investment in accounts receivables. The credit manager keeps a record of payment expe-
riences with each customer. In addition, the manger monitors overdue payments by drawing
up a schedule of the aging receivables. The aging schedule classifies accounts receivables by
the length of time they are outstanding. When a customer is in arrears, the usual procedure is
to send a statement of account and follow this at intervals with increasing insistent letters,
26 | P a g e
telephone calls or fax messages. If none of these has any effect, most companies turn the debt
over to a collection agency. There is always a potential conflict of interest between the collec-
tion department and the sales department. Sales representatives commonly complain that they
no longer win new customers. The collection department frightens their customers with
threatening letters.
The collection manger, on the other hand, become the fact that the sales force is concerned
only with winning order and does not care whether the goods are subsequently paid for. Good
collection policy balances conflicting goals. The company wants cordial relations with its
customers. It also wants them to pay their bills on time.
There are instance of cooperation between sales managers and the financial managers who
worry about collection. For instance, chemical division of a major pharmaceutical company
actually made a business loan to an important customer that had been suddenly cut off by its
bank. The pharmaceutical company knew the customer better than the customer's bank did
and the company was right. The customer arranged alternative bank financing, paid back the
company and become an even more loyal customer. This is a nice example of financial man-
agement supporting sales.
2.12.2 METHODS OF COLLECTION
Reminders:
Reminders of overdue accounts are usually sent after a grace period elapsed, customers are
reminded of their overdue accounts. Letters sent to customers reminding them of their over-
due accounts.
27 | P a g e
Collection letters:
These letters are generally stronger than reminders. They could take the form of a threat that
the accounts are being turned over to a collection agency for action and when things fail, a
legal action is taken against the customers.
2.12.3 COST OF ACCOUNTS RECEIVABLES
There are certain costs associated with holding accounts receivables. Opportunity cost of in-
vestment since accounts receivables tie up investible funds, there is an opportunity cost equal
to the returns the funds could have earned to cover payment of wages, bad debts and delin-
quent account.
Some customers may automatically delay payment of their accounts (delinquent account)
whilst others may not pay at all ('bad debt). With delinquent accounts, the longer the time the
firm receive payment the grater will be the opportunity cost.
2.12.4 EVALUATION OF CREDIT WORTHINESS.
In evaluating the customer's credit worthiness, the five (5) 'C's of credit must be considered:
Capacity: This refers to the customer's ability to pay his or her debt.
Capital: The general financial position of the firm a shown by the ratio analysis.
Character: It is the willingness of the customer to pay his or her debt.
Collateral: This is represented by the assets the customer may offer as the security for the
credit extended to him.
Conditions. This refers to the sensitivity of the customer's ability to pay with respect to un-
derlying economic and market forces.

28 | P a g e
2.12.5 CURRENTS LIABILITIES
Current Liabilities are the obligations due within one year or within the companies operating
cycle. Firms generally make purchase from other firms on credit, recording the debt as an ac-
count payable.
2.13FINANCING CURRENT ASSETS
The way in which the assets of a company are financed involved a trade - off between risk
and profitability. Short term financing can be categorized according to whether or not the
source is spontaneous. Spontaneous financing arise naturally from the firms day to day trans-
actions. Trade credits, accruals and other payables are classified as spontaneous. There are
also negotiated sources of short term financing consisting of money market credit and both
secured loans and unsecured short - term loans. Every source of finance has cost; the point is
to keep this cost to a minimum. The short-term financial problem is how to balance the op-
tions available.
2.14 SOURCES OF SHORT-TERM FINANCING
Firms normally depend on long-term financing for their capital investment. How a firm will
finance that investment depends on its financial policy. However, sometimes a firm may face
a short-term financing problem and may look for ways of getting funds to solve such a prob-
lem. Below are some short-term borrowing options available to firms.

29 | P a g e
Bank Overdraft
The most common way to finance a temporary cash deficit is to arrange a short-term bank
overdraft. This is a loan from a bank, which normally has a specified upper limit. This is
known as a non-committed loan, which allows firms to borrow up to a previously specified
limit without going through the normal paperwork (much like a credit card). The borrower
only borrows to the extent that funds are needed. A bank overdraft is thus a very flexible
form of financing in that interest is only paid on the money actually borrowed at any point in
time. As the company receives funds, they are paid into the bank account and the overdraft
automatically falls.
The interest rate charged depends on the perceived riskiness of the borrower and the extent to
which security is provided. Invariably the strongest public companies will be able to obtain
an overdraft at prime rates of interest, without the provision of any form of security. Smaller
companies will be charged rates which could be as higher than the prime rate.The most im-
portant factor to note about a bank overdraft is that it is a short-term source of finance. It is
generally renegotiated annually with the bank. It is meant to provide a fluctuating source of
working capital for companies.
Trade of Suppliers’ Credit
Most companies buy goods on credit. Suppliers usually have standard terms which apply to
their customers. These would include a specified period after which payment is due and
sometimes a maximum amount beyond which no further goods would be supplied until pay-
ment of the amount owing is made. Normally, however, this form of finance expends as the
purchasing firm grows, and provided payment is made within the specified period, suppliers
30 | P a g e
are generally happy to increase the amount of credit offered. There is no explicit cost asso-
ciated with accounts payable. Of course when a supplier does extend credit, presumably the
cost thereof is included in the price of the goods or services. Some suppliers will, however,
stipulate that interest will be charged on any overdue amount. Suppliers, in order to encour-
age prompt payment, sometimes offer a discount for payment within a shorter time than the
normal payment period.
Letters of Credit
A letter of credit is a common arrangement in international finance. With a letter of credit, the
bank issuing the letter promises to make a loan if certain conditions are met. Typically, the
letter guarantees payment on a shipment of goods provided that the good provided that the
good arrive as promised. A letter of credit can be revocable (Subject to cancellation) of irre-
vocable (not subject to cancellation if the specified conditions are met.)
Secured Loans
Banks and other finance companies often require security for a short- term loan just as they
do for a long-term loan. Securities for short-term loans usually consist of accounts receivable,
inventories, or both. Additionally directors for smaller companies would normally be re-
quired to secure the loan by means of personal guarantees.
Factoring
Factoring is a way of turning accounts receivables quickly into cash, thereby reducing the
level of investment in assets needed by the firm. The accounts receivables are sold to finan-
cial institutions (the factor) that specialize in this form of activity.

31 | P a g e
Although factoring is the process of purchasing an asset (the firm’s receivables), funds are
advanced against accounts receivables, which are only to be collected in the future. Therefore
interest is charged on any amount advanced. Typically interest charges in factoring would be
equal to or slightly above the firm’s prime overdraft rate.
The factor undertakes all the credit control work associated with the client’s receivables
book: collecting outstanding amount; sending out statements; and providing a computerized
management reporting system to the client. A service fee of a percentage of the gross value of
invoices sold during a calendar month is charged for these activities. This fee will depend on
the volume of invoices to be processed, the quality of the firm’s receivable and the amount of
work the factor estimates will need to be put into managing the account. It can range from
0.25% to 3% of sales revenues-although the average charge is of the order of 1%.
The benefits of factoring include the following:
Turning credit sales into cash providing additional working capital for growth;
Enabling clients to take advantage of trade discounts;
Increasing the client’s management time to concentrate on the business; Cutfm, a leading fac-
toring house in South Africa reports that often teh biggest benefit to businesses that switch to
factoring is the “economics of scale’ that an be attained through the assistance of this form of
financing.

32 | P a g e
Factoring can be done openly or confidentially. The letter is known invoice discounting. If
factoring is done confidentially (some firms prefer their customers not to known that they
have factored their receivables, and in some cases the sheet volume of invoices being pro-
duced make the normal full factoring impractical), thee is no annotation on invoices. Cus-
tomers continue to make payment to the firm directly.
The factor will now need to seed their staff into the firm to establish the actual levels of re-
ceivables and check on the existence of invoices and proofs of delivery. The firm will supply
lists of sales and collections, at least on a weekly, and sometimes a daily basis. A set amount
is normally charged for a confidential factoring service (apart from the interest charge). It
normally equates to only 0.25% to 0.5% of monthly sales revenue. Since, even under invoice
discounting, the receivables invoices are ceded to the factor, the factor must now appoint the
firm as its collection agent and an agency agreement is drawn up. This type of factoring is
really only applicable to large firms since an important qualifying criterion is a sophisticated
systems infrastructure and good management of the receivables book.
Acceptance Credits
Large companies requiring credit, usually to finance a trade transaction, often use banker’s
acceptances. These are bills of exchanges, usually with a maturity of 90 or 180 days. The
purchaser of goods that are the subject of the transaction writes a document (the bill) on
which is stated the amount and nature of the transaction being financed. The purchaser
presents the bill to its banks; which accepts the bill, thereby guaranteeing payment on due
date and the purchaser endorses the back of the bill, thereby indicating its liability to the ac-
cepting bank. The bill is forwarded to the supplier who than effects delivery of the goods.
33 | P a g e
On due date supplier of the goods presents the bill to the accepting bank, which effects pay-
ment and claims the amount of the loan from the purchaser. The supplier can obtain earlier
payment by discounting the bill. This is done by selling it, at an appropriate discount to its
face value, in the money market. The bank guarantees payment and the bank’s security de-
pends on the creditworthiness of the purchaser. Thus bankers’ acceptances are usually only
used by larger companies.
Other Sources
Another option available to a firm is to increase the accounts payable period; in other words,
it may take longer to pay its accounts. This amounts to borrowing from suppliers in the form
of trade credit. This is an extremely important form of financing for smaller businesses in-
particular. A firm using trade credit may end up paying much higher price for what it pur-
chases, so this can be a very expensive source of financing.
2.15 EMPIRICAL STUDIES ON WORKING CAPITAL MANAGEMENT AND ITS
EFFECTS ON PERFORMANCE.
The management of working capital has been reported to be inadequate by researchers across
the world. Although, empirical work on working capital practices of US SMEs has been ex-
tensive (McMahon & Holmes, 1991 and McMahon et al., 1993) empirical research on the
working capital practices of UK SMEs has been less acute (Bolton, 1971; Peel and Wilson,
1996; Wilson, 1996, Jarvis et al., 1996; and Chittenden et al., 1998; Singleton and Wilson,
1998, Soufani 2002 are notable exceptions). The Bolton Committee were critical of many
aspects of the financial management of small firms, reporting that information was often so

34 | P a g e
poor that management frequently learnt of an impending crisis only when the annual accounts
appeared, or following an urgent call from the bank manager.
In fact, a study conducted by the chartered Institute of Management Accountants in the UK
(CIMA, 1994) revealed that 20 per cent of businesses (most of which were smaller firms) that
failed did so as a result of bad debts or poor credit management. Wilson (1996), examined the
credit management practices in the UK, and found a strong connection between good credit
management practice and aspects of company performance.
Wilson (1996) reports a strong relationship between efficiencies in managing the cash cycle
and profitability. Wilson (1996), showed that those firms with late payment problems were
typically reliant on short-term finance and were generally poorer in terms of credit manage-
ment practice.
Similarly, Singleton and Wilson (1998), argue that although late payment is a concern for all
small firms, some of them manage it better than others. They find that firms with formal cre-
dit management procedures were better in managing late debt. These businesses tend to use
longer term finance compared to businesses that have bigger late payment problems and use
various forms of short term finance to fund working capital needs (Singleton and Wilson,
1998).
Peel and Wilson (1996), analyzed the postal questionnaire responses of 84 small firms and
conclude that a relatively high proportion of small firms in their sample use quantitative capi-
tal budgeting techniques, and review various aspects of the companies’ working capital.

35 | P a g e
On the other hand, Jarvis et al. (1996) interviewed 20 small firms and indicated that ‘best
practice’ models advocated by the finance literature are not necessarily appropriate to small
firms and alternative approaches may be viable, even though these alternative approaches
may be unorthodox in the eyes of academics. They conclude that financial management prac-
tices in small businesses are driven by the motivations of owner-managers which tend to be
ignored in the literature.
Other study by Lazardidis and Tryfonidis (2006) has investigated the relationship between
profitability and working capital management in the Stock Exchange Market of Athens
throughout 2001-2004. The objective of their research was to study the relationship between
profitability and the cycle of cash transformation and its components. Results indicate that a
significant relationship exists between gross operational profit and the cash transformation
cycle. Moreover managers can generate a good profit for the company using the right man-
agement techniques for the cash transformation cycle and its components.
Following closely was Nazir and Afza (2009), who have studied the relationship between
profitability and working capital management policies in 208 companies listed in Tehran
Stock Exchange throughout the years 1998-2005. Results have shown that managers using
conservative strategies have been able to increase the value of their stocks. Findings indicate
that in selecting a portfolio, investors choose companies that apply short term credit policies
and retain a low level of current liabilities.

36 | P a g e
Furthermore, Zubiri (2010) studied the impact of working capital management on company
profitability in a research performed on the automobile production industry in Pakistan from
2000 to 2008.
The researcher has used current ratio as an indicator for working capital management policies
and financial leverage as the indicator for capital structure. Variables in this research were
tested using the correlation coefficient and multi variable regression. Results of the research
indicate that companies must increase current assets and decrease current liabilities for max-
imizing profitability.
Findings reflect that the increase in cash flow would result in an increase in profitability.
Moreover a positive relationship exists between profitability and the financial leverage. In
addition, Nobani, Abdollatif and Alhajjar (2010), studied the relationship between the cash
transformation cycle and profitability, they used data gathered from Japanese companies be-
tween the years 1990-2004. Results indicated that a negative relationship existed between
profitability and the cash transformation cycle. The result was the same in all sample compa-
nies except service providers and commercial companies.
Moreover, Chatreji (2010) studied the impact of working capital management on profitability
in companies listed in London stock exchange throughout the years 2006-2008. The re-
searcher has used the Pearson correlation coefficient to evaluate the impact of cash transfor-
mation cycle, the period of collection of receivables, inventory retention period, liability set-
tlement period, the current to quick ratio, to net operational profit. Results indicated that a
negative relationship exists between working capital management and profitability. This
means that an increase in cash transformation cycle would result in a reduction in profitabili-
37 | P a g e
ty. Moreover results have also stated that a negative relationship exists between liquidity and
profitability as well.
Also, Hassanpoor (2007), has studied the impact of working capital strategies on stock return
throughout 2001 to 2005. He selected 62 companies from 459 companies active in 34 indus-
tries listed in Tehran Stock Exchange and subsequently classified them into 9 industries. In
this research, the significance of working capital was emphasized such that when considering
the situation of the business entity the best working capital strategies are employed to maxim-
ize the interests of the entity and its investors. Moreover the impact of the type of strategy on
the average stock return was evaluated and results indicated that a significant difference ex-
isted among these averages in various strategies and that bold strategies generate the highest
stock return among the industry as a whole.
From the above empirical evidence, the significance of the relationship is inconclusive. Given
the proportion of privately owned entities in our economy and their continual quest for more
efficient use of resources in order to remain competitive, there is a definite need for more in-
formation on the methods used by firms to accumulate and allocate their scarce working capi-
tal resources.
Doubt also remains as to whether, the findings from these studies can straight away be ap-
plied in Ghana given the fact that they were all conduct in more advanced countries where the
economic environment were stable as compared to Gha

38 | P a g e
CHAPTER THREE
RESEARCH METHODOLOGY
3.1 INTRODUCTION
This study aimed to provide a status on the extent to which a firm’s performance may differ
and how the value of firm changes as a result of efficient management of its credit or working
capital. The objective of this chapter is to develop a model that measures the impact of effi-
cient financial management of trade credit on company’s performance.
The Poutziouris, Michaelas and Soufani (2005) model in their study to investigate the impact
of financial management of trade credits in SME’s on profitability in the UK was adopted
and modified to serve as a framework for the model development. Research can be catego-
rized into exploratory, descriptive, or explanatory (causal).Exploratory research is undertaken
to gain better understanding of the dimension of a problem Saunders, Lewis and Thornhill
(2007) cited Robson (2002) and contend that exploratory study is a valuable means of finding
out what is happening; to seek new insights; to question and to assess phenomena in a new
light. It is particularly useful to clarify an understanding of a problem.
Descriptive research seeks to describe characteristics of a population or phenomenon. The
object of descriptive research is to portray an accurate profile of persons, events or situations,
Robson, (2002) as cited by Saunders, Lewis and Thornhill (2007).
Causal study is used to identify cause – and - effect relationships between variables. Studies
that establish causal relationships between variables may be termed explanatory studies. The
emphasis here is on studying a situation or a problem in order to explain the relationship be-
tween variables (Saunders, Lewis and Thornhill 2007).

39 | P a g e
Based on this explanation, this study could be classified as causal in nature as it sought to
explain the cause – and – effect relationship between credit management and performance
variables. Therefore almost all the data used in this study were quantitative.
3.2. RESEARCH DESIGN
Research design encompasses the methodology and procedures employed to conduct scien-
tific research. The design of the study defines type (the descriptive, co relational, semi – ex-
perimental, experimental, review, meta- analytic) and sub type (eg. descriptive- longitudinal
case study), research question, hypothesis, independent and dependent variables.
For empirical purposes, the following operationalization equations were used. Previous study
conducted by Poutziouris, Michaelas and Soufani (2005) estimated the model in linear form.
This study also estimated the model in linear form. The full model used for testing firm’s per-
formance in relations to its financial management of trade credit was as follows:
Y1,i,t = αi + 1X1,i,t + 2X2,i,t + ui
Where:
Y1,i,t is performance measure
αi is constant generated by the system.
1X1,i,t is coefficient of ACP
2X2,i,t is coefficient of APP
ui is error term(errors in calculating ratio and variables that are omitted in determine the
profit of the organization)
This was then modified as follows:
ROE1,,i,t = αi + 1ACP,i,t + 2APP,i,t + ui eq.1

40 | P a g e
Where,
ROE= return on equity
ACP = average collection period
APP = average payment period
ui = error term
1 measures the rate of change of the independent variables.
ACP and APP are the independent variables while ROE and OPM are the dependent va-
riables.
To investigate the extent by which changes in working capital affect firm’s ROE, equation 1
was developed: in equation 2 the same variables were maintained as in equation 1 except that,
the dependent variable was changed to OPM (Operating profit margin).
OPM,i,t = αi + 1ACP,i,t + 2APP,i,t ++ ui, eq. 2
3.3 DATA CONSIDERATION AND SOURCES
To study the impact of financial management of trade credits on the value of firm, this study
analyzed GGBL financial data for the period 2004 to 2012. This study used only secondary
data, which were obtained from GGBL’s statement of financial position (balance sheet) and
statement of comprehensive income (income statements) from 2004 to 2012. The study used
time series data. Time series analysis identifies the nature of phenomenon represented by the
sequence of observation and forecast the future and observes a trend (www.zaitunsoftware
.com).
This study carefully attempted to select a number of factors that are essential to enhance the
present status of the working capital management structure of the firm as well as to take a
further movement towards success.

41 | P a g e
The period of 2004–2012 was chosen for two reasons. First, the early 2000 was a period in
which most companies were rendered ineffective and suffered substantial losses due to the
nature of the economy which was characterized by acute inflation and high interest rate.
Second, many policy changes were made in early 2000’s to strengthen the manufacturing sec-
tor and the stock market through financial reforms.
3.4 DESCRIPTION AND EXPLANATION OF VARIABLES
3.4.1 DEPENDENT VARIABLE
A variable (often denoted by Y) whose value depends on that of another. Two dependent va-
riables were used in this study. The data for the dependent variables— Return On Equity
(ROE) and Net Profit Margin (NPM) — comes from the annual balance sheets and income
statements. The return on Equity (ROE) is defined as the ratio of pre-tax profit to total Equi-
ty capital. This is a common and widely accepted measure of Return in the accounting and
finance literature.
Net profit Margin is also defined as the ratio of pre-tax profit to total sales. These dependent
variables are measured in Ghana New Cedis.
Independent Variables for the study were; average collection period (ACP) which is the ratio
of total accounts receivables to turnover, and average payment period which is the ratio of
total accounts payables to total purchases (APP).

42 | P a g e
3.5 DATA CODING
As noted earlier, the data were collected from the balance sheet and the income statement of
GGBL, after which various ratios were computed, and coded into variable using definitions
given earlier in this chapter. The two variables were sorted based on the researcher calcula-
tions and was entered into Excel tables and later converted to an ‘R’ statistical data file for
statistical analysis.
3.6 DATA ANALYSIS
To summarize the data and describe the central tendency of the variables and variability with-
in the values, descriptive analysis was used. Pearson correlation was used to determine
whether there was a relationship between the variables. Correlation analysis is a statistical
tool that was used in this study to describe the degree to which one variable is linearly related
to another. Through conducting correlation analysis this study shall be able to identify the
degree of association among the variables.
Multiple regression analysis was used to analyze the linear relationship between the depen-
dent and independent variables. Maddala (1988) defines multiple regression as a model in
which the dependent variable depends on two or more variables. The main strength of using
multiple regression data is its ability to measure the joint effect of any number of independent
variables upon one dependent variable.
3.6.1 DATA ANALYSIS TECHNIQUE
Two major statistics analysis technique were used in this study. They were:
Descriptive statistics such as the mean, and the standard deviation to determine the
trend and behavior of variables.

43 | P a g e
Regression or ordinary least square technique to investigate the strength, direction,
significance of association or relationship variables.
All statistical analysis mentioned above was carried out using a computer software program
called SPSS on MS windows 7 ultimate plus MS excel and word.
The above statistical tools were used in a research methodology known as Panel Data Mul-
tiple Regression Analysis. The particular method was the most appropriate for the study, this
was supported by James H. Stock and Mark W. Watson (2007 pg350)
3.7 PROFILE OF THE STUDY AREA
Guinness Ghana Breweries Ltd was established in August 29th, 1960 and incorporated to
commence business in August 23rd. 1991. In November 1990, Guinness Ghana Breweries
Ltd was listed provisionally on the Ghana Stock Exchange and finally had their official list-
ing on August 23, 1991 with a Stated Capital of twenty six million two hundred and fifty
two thousand Ghana Cedis( GH(¢) 26,252,000). It has Ordinary Shares of no par value Issued
at 211,338,142 and Authorized Shares of 200 million.
The company has its registered office at Kaasi industrial area in Kumasi, with postal address
of post office box 1536. Kumasi, Telephone numbers (03220)263015/24878. The company
Board of Directors are as follows; David Harlock (Chairman), Peter Ndegwa (Managing) and
the rest are all members of the board : E. M. Boye, J. W. Acheampong (Dr.), Kwame Donkor
Fordwor, Mrs. Agnes Emefa Essah, Mr. Charles Kimeria Mwangi, P. V. Obeng, Mrs. Kathe-
rine Joanna Seljeflot, Mr. Didier Francis Martial Leleu, Mr. James Kweku Inkoom, Mr. P.
Ndegwa - Chairman. Peter Ndegwa - Managing. E. M. Boye, J. W. Acheampong (Dr.),
Kwame Donkor Fordwor, Mrs. Agnes Emefa Essah, Mr. Charles Kimeria Mwangi, P. V. Ob-

44 | P a g e
eng, Mrs. Katherine Joanna Seljeflot, Mr. Didier Francis Martial Leleu, Mr. James Kweku
Inkoom,
Guinness Ghana Breweries Ltd is into production of alcoholic liquor (Guinness Extra Stout,
Star Beer, Gulder. Etc) and non-alcoholic liquor (Malta Guinness and Amstel Malta).Their
financial Year Ends June 30 (source; www.ibroker.com).

45 | P a g e
CHAPTER FOUR
DATA ANALYSIS AND DISCUSSION OF FINDINGS
4.1 INTRODUCTION
This chapter discusses the analysis of the empirical results. It begins by looking at the de-
scriptive statistics, regression analysis and then raw data analysis.
4.2 DESCRIPTIVE STATISTICS
The descriptive statistics as shown in Tables 4.1 below has made some important observa-
tions relating to the two models that were run. It noted that, average collection period of 39.6
days was maintained by GGBL over the period. Average payment period was also 96.2 days,
which was encouraging. This means that, supplies made to GGBL on credit were utilized to
turn over sales cycle three times before payments are eventually made to suppliers. This re-
flected in a mean profitability measured by ROE of 36% as evidenced by the model 1 which
was ran.
The model 2 results were not different from the above except that profitability as measured
by profit margin reduced from 36% to 12.4%. This goes to highlight the importance the im-
pact of efficient credit management have on profitability of firms. This trend was observed
consistently over the period 2004 to 2012.
.

46 | P a g e
TABLE 4.1A MODEL 1
DESCRIPTIVE STATISTICS
Mean Std. Deviation N
ROE .3611 .10167 9
ACP 39.6144 35.14295 9
APP 96.2244 29.99101 9
Source: Field Data 2013
TABLE 4.1B MODEL 2
DESCRIPTIVE STATISTICS
Mean Std. Deviation N
OPM .1244 .03539 9
ACP 39.6144 35.14295 9
APP 96.2244 29.99101 9
Source: Field Data 2013
Tables 4.2, provides the Pearson correlation for the variables that were used in the regression
model. Pearson’s correlation analysis was used to find the relationship between financial
management of trade credit and ROE and OPM.
We found that, ROE is negatively correlated with average collection period and average
payment period.
The negative correlation between working capital and profitability variables indicates that if
collection period increases it will have a negative impact on profitability and vice versa.

47 | P a g e
We also found in model 2 that, OPM is positively correlated with average collection period
and average payment period.
The positive correlation between working capital and profitability variables indicates that if
collection period increases it will have a positive impact on profitability and the reverse is
true.
TABLE 4.2A MODEL 1
CORRELATIONS
ROE ACP APP
Pearson Correlation ROE 1.000 -.543 -.318
ACP -.543 1.000 .559
APP -.318 .559 1.000
Sig. (1-tailed) ROE . .065 .202
ACP .065 . .059
APP .202 .059 .
N ROE 9 9 9
ACP 9 9 9
APP 9 9 9

48 | P a g e
TABLE 4.2B MODEL 2
CORRELATIONS
OPM ACP APP
Pearson Correlation OPM 1.000 .155 .082
ACP .155 1.000 .559
APP .082 .559 1.000
Sig. (1-tailed) OPM . .345 .417
ACP .345 . .059
APP .417 .059 .
N OPM 9 9 9
ACP 9 9 9
APP 9 9 9
Source: Field Data 2013
Multiple Regression Results
A regression analysis was performed on the dependent and independent variables to check on
the existence of the multi-co linearity problem. In a multiple regression model, multicolli-
nearity exists when two independent variables are perfectly correlated with each other. The
result is shown in the Table 4.3 above.

49 | P a g e
As a rule of thumb a variable inflation factor (VIF) in excess of 5 is considered an indication
of harmful multi-co linearity, Zikmund et al (2010). All the VIF are less than 5 and the aver-
age VIF is 1.455 therefore it can be said that there is no multi-co linearity problem for the
models.
The results of the regression analysis can therefore be interpreted with a greater degree of
confidence.The Durbin -Watson statistic averaged between 1.729 and 2.476 was also used to
test for autocorrelation. The Durbin- Watson value of 1.729 and 2.476 indicates that the data
has no serial correlation or autocorrelation problem.
TABLE 4.3 MODELS 1
MULTIPLE REGRESSION ANALYSIS RESULTS
Model DEP V IND V Slope/
Coefficient
()
Sig R2 Durbin
Watson
VIF
1 ROE ACP -.532 .246 .295 2.476 1.455
APP -.020 .962 .295 2.476 1.455
2 OPM ACP .159 .755 .024 1.729 1.455
APP -0.007 .789 .024 1.729 1.455
Sources: Field Data 2013

50 | P a g e
The multiple regression models were highly significant. The coefficient of determination (R2)
of 0.295 or 29.5% observed by model one (1) indicates that 29.5% of the variation in depen-
dent variable (i.e. ROE) is partially explained by variation in the independent variables.
Furtherance to this the coefficient of determination (R2) of 0.024 or 2.4% observed in model
two (2) indicates that only 2.4% of the variation in dependent variable (i.e. OPM) is ex-
plained by variation in the independent variables.
The above results have shown how working capital management will impact positively on the
profitability of GGBL; hence effective management of that resource will have important im-
plication on them.
The above results and findings is consistent with earlier research or studies conducted by
Poutziouris, Michaelas and Soufani (2005), Lazardidis and Tryfonidis (2006), Nazir and Afza
(2009), Zubiri (2010), Nobani, Abdollatif and Alhajjar (2010), Chatreji (2010), Hassan poor
(2007).
Raw Data Analysis
Raw data analysis was performed to find out whether there was any relationship between
trade credit management and performance of GGBL operations.

51 | P a g e
TABLE 4.4A
IMPACT OF AVERAGE COLLECTION PERIOD ON PROFITABILITY.
Years Average Collec-tion Period
(ACP)
Return On Equity
(ROE)
OperatingProfit Margin
(OPM)
2005 84.08 22% 11%
2006 30.71 35% 17%
2007 54.13 31% 17%
2008 0.01 51% 13%
2009 39.59 27% 7%
2010 24.99 49% 11%
SOURCE: Field Data 2013.
From Table 4.a,
A reduction of 84.08 days Average Collection Period (ACP) to 30.71days resulted in
an increase of 22% of ROE to 35% of ROE.
An increase of 30.71 days ACP to 54.13days brought a reduction of 35% ROE to 31%
ROE.
A further reduction of 54.13days of ACP to 0.01days resulted in an increase of 31%
ROE to 51% ROE.
From the analysis conducted on the impact of Average Collection Period (ACP) on profitabil-
ity, we observed that, when average collection period reduces, it will have a positive impact
on profitability and the reserve is true.

52 | P a g e
TABLE 4. 4B
IMPACT OF AVERAGE PAYMENT PERIOD ON PROFITABILITY.
Years Average Pay-ment Period
(APP)
Return On Equity
(ROE)
OperatingProfit Margin
(OPM)
2005 125.15 22% 11%
2006 133.01 35% 17%
2007 50.51 31% 17%
2008 64.66 51% 13%
2009 90.11 27% 7%
2010 95.77 49% 11%
SOURCE: Field Data 2013.
From table 4.4b,
An increase of 125.15 days Average Payment Period (APP) to 133.01 days of APP re-
sulted in an increase of Return on Equity (ROE) of 22% to 35% ROE.
A reduction of 133.01 days of Average Payment Period (APP) to 50.51 days resulted
in a decrease of 35% of ROE to 31% ROE.
An increase of 50.51days of Average Payment Period (APP) to 64.66 days (APP) re-
sulted in an increase of 31% of ROE to 51% ROE.
From the analysis conducted, we observed that when Average Payment Period increases, it
will have a positive impact on profitability and vice versa

53 | P a g e
CHAPTER FIVE
FINDINGS, CONCLUSIONS AND RECOMMENDATIONS
5.1 INTRODUCTION
In this chapter, we consider the key findings of the study and their implications, followed by
conclusions and the researchers’ recommendations. In this study the impact that financial
management of trade credit have on profitability was investigated. Key findings of the study
are summarized below.
5.2 DESCRIPTIVE STATISTICS
The descriptive statistics noted that, average collection period and average payment period of
39.6 and 96.2 days were maintained by GGBL. The performance in terms of profitability evi-
denced by this style of working capital management was ROE, 36% and OPM 12.4%.This
was impressive; however, it goes to highlights the importance of how efficient financial man-
agement of trade credit can impact positively or otherwise on profitability. This trend was
observed consistently over the period 2004 to 2012.
The study made some interesting revelations resulting from the Pearson’s correlation analy-
sis. We found that, ROE was negatively correlated with ACP and APP. The negative correla-
tion between working capital and profitability variables indicates that if working capital in-
creases it will have a direct negative impact on profitability and vice versa. We also found
that, OPM positively correlated with ACP and APP. The positive correlation between work-
ing capital and profitability variables indicates that if working capital increases it will have a
direct positive impact on profitability and vice versa.

54 | P a g e
The multiple regression models were highly significant. The coefficient of determination
(R2) of 0.295 or 29.5% observed by model one (1) indicates that 29.5% of the variation in
dependent variable (i.e. ROE) is explained by variation in the independent variables. Further-
ance to this the coefficient of determination (R2) of 0.024 or 2.4% observed in model two (2)
indicates that 2.4% of the variation in dependent variable (i.e. OPM) is explained by variation
in the independent variables.
A regression analysis performed on the dependent and independent variables to check on the
existence of the multi-co linearity problem, showed non existence of that. In a multiple re-
gression model, multicollinearity exists when two independent variables are perfectly corre-
lated with each other.
As a rule of thumb a variable inflation factor (VIF) in excess of 5 is considered an indication
of harmful multi-co linearity, Zikmund et al (2010). All the VIF are less than 5 and the aver-
age VIF is 1.121 therefore it can be said that there is no multi-co linearity problem for the
models.
The results of the regression analysis could therefore be interpreted with a greater degree of
confidence. The Durbin -Watson statistic was also used to test for autocorrelation. The Dur-
bin- Watson value of 2.425 and 2.549 indicates that the data has no serial correlation or auto-
correlation problem. The above results have shown how working capital management will
impact positively on the profitability of GGBL; hence effective management of that resource
will have important implication on profitability.

55 | P a g e
The findings were consistent with earlier research or studies conducted by Poutziouris, Mi-
chaelas and Soufani (2005), Lazardidis and Tryfonidis (2006), Nazir and Afza (2009), Zubiri
(2010), Nobani, Abdollatif and Alhajjar (2010), Chatreji (2010), Hassanpoor (2007).
5.3 RAW DATA ANALYSIS
From the raw data analysis, it was noted that, both average collection period (ACP) and Av-
erage Payment Period (APP) have direct relationship with GGBL performance .The observa-
tion made include,
Any increase in average collection period result in a decrease in profitability and the
reserve is true.
Any decrease in average payment period result in a decrease in profitability and the
reserve is true.
5.4 CONCLUSIONS
The study investigated the association between financial management of trade credit and
profitability. Using secondary data with GGBL as evidence, it was noted that ACP and APP
were positively related with Operating Profit Margin (OPM), but negatively related to return
on equity.
The study was observed to be consistent with other studies conducted by Poutziouris, Mi-
chaelas and Soufani (2005), Lazardidis and Tryfonidis (2006), Nazir and Afza (2009), Zubiri
(2010), Nobani, Abdollatif and Alhajjar (2010), Chatreji (2010), Hassanpoor(2007).

56 | P a g e
5.5 RECOMMENDATIONS
Policy makers should have the interest in promoting efficient management of working
capital to facilitate performance management.
It should therefore be the priority of top management of every firm to manage their
trade credits prudently in order to remain profitable and competitive. Hence managers
should know how and what working capital structure will influence their perfor-
mance.

57 | P a g e
REFERENCES
Chakraborty, (2008); Efficient financial management of working capital.
CIMA (1994),CIMA to Investigate Trade credit management, CIMA Research Foundation
newsletter vol 4 (11), p.1
Finley (2009), Peter D (2005), Dina A (2007); Credit management and profitability.
Haithan Nobanee and Modar Abdullative and Al Hajjar (2010); Cash Conversion Cycle and
Firms Performance of Japanesse Firms.
James H.Stock and Mark W.Waston (2007,page 35), Support to Panel Data Multiple Regres-
sion Analysis.
Jarvis (1996); The financial Management of Small Firms; An Alternative Perspective, The
Chartered Association of Certified Accountants Research number – 49, Certified Ac-
countants Education Trust London.
Kofi Osei, Westerfield and Jordan, Meyres, Marcus Ross, Brealey, et al (2006); Work shop
on working capital management (2000).
Lazardidis and Tryfonidis (2006); Investigation of the relationship between profitability and
working capital in the Stock Exchange Market of Athens. .
Maddala (1988) defines multiple regression as a model in which the dependent variable de-
pends on two or more variables
Michael A.B and Steve S. F (1997), Association of credit professional (ACP); Importance of
practicing good credit management.
Multiple Regression Analysis; Source, SPSS on MS Windows 7 Ultimate plus MS excel and
word computer software programme.
(Mcmahon and Holmes, 1991); Emperical Research on the Working Capital Practices of UK.
SMES.
Nazir,Main Sajid and Afza(2009); Is Better to be Aggressive or Conversative in Managing
Working capital?
Phillip K. (2010) ; Four basic things business must strive for effective credit management.
Poutziouris, P. Michaelas, N. Soufani, K. (2005); Financial management on trade credit in
small – medium sized Enterprise, European financial management Association ( EF-
MA).

58 | P a g e
Poutzwuris, P.Chitten,F. And Michaelas N.(1998); The Financial Affairs of Private Compa-
nies; Tilney Fund Management; Liverpool.
Real and Wilson N. (1996); working capital and financial management practices in the small
firms sector; International small business journal,vol.14 (12); July –March, pp 52-68.
Robson, (2002) as cited by Saunders, Lewis and Thornhill (2007).
Romanvorthy,V.E working capital management, chtnnsa; institute for finanacial management
and research 1976, p. 183.844 working capital management; The impact of trade credit on
working capital management in india.
Singleton C. And Wilson N,(1998); Late payment and the small firm; An examination of
case; 21st ISBA National Small Firms Conference; celebrating the small Business,
Durham.
Soufani. K (2002); On the determinants of factoring as a financial choice from the Llk; Jour-
nal of Economics and Bussiness, Volume 54, Number 2, pp 239-252, March to April.
The European commission (2008); Problems of granting credit.
WWW.Ibroker.com; source of Guinness Ghana Brewery Limited (GGBL) profile.
www.zaitunsoftware .com ,source of Time series analysis
Zubiri (2010); Impact of Working Capital Management and Capital Structure on Profitability
of Automobile Firms in Paskistan.D. Hassanpour (2007); Impact of Working Capital Strate-
gies on Stock Return.

59 | P a g e
APPENDIX I
REGRESSION
MODEL 1
Descriptive Statistics
Mean Std. Deviation N
ROE .3611 .10167 9
ACP 39.6144 35.14295 9
APP 96.2244 29.99101 9
SOURCE: Field Data 2013.
Correlations
ROE ACP APP
Pearson Correlation ROE 1.000 -.543 -.318
ACP -.543 1.000 .559
APP -.318 .559 1.000
Sig. (1-tailed) ROE . .065 .202
ACP .065 . .059
APP .202 .059 .
N ROE 9 9 9
ACP 9 9 9
APP 9 9 9
SOURCE: Field Data 2013.
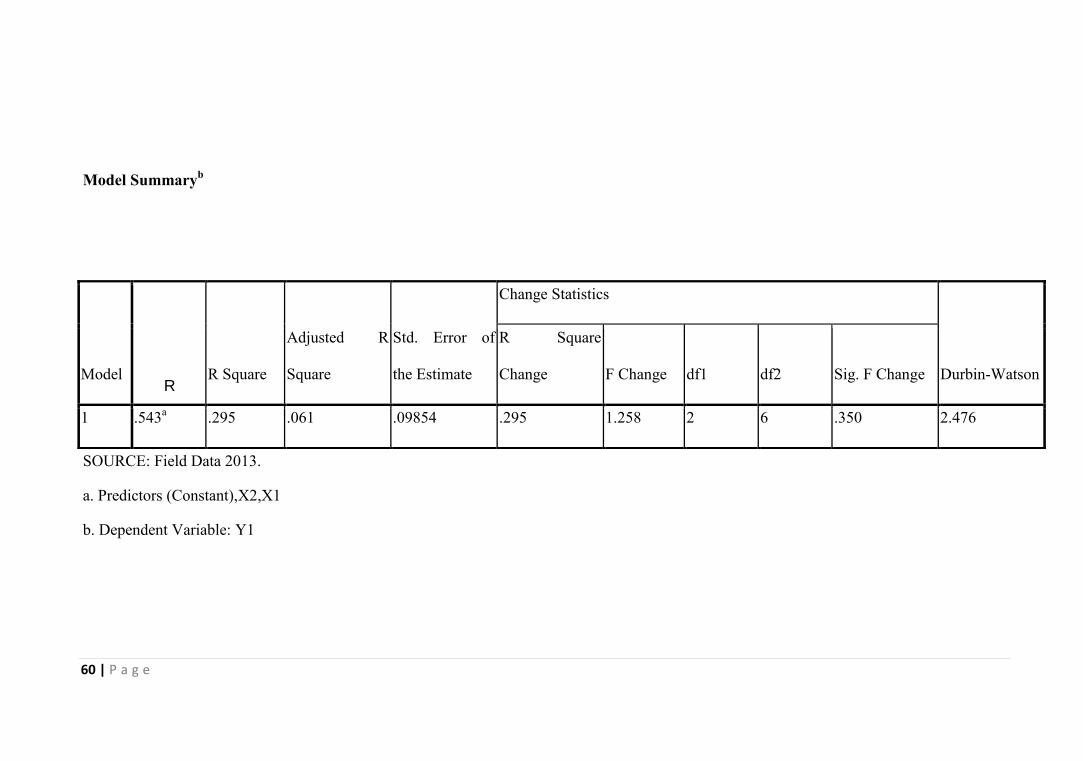
60 | P a g e
Model Summaryb
SOURCE: Field Data 2013.
a. Predictors (Constant),X2,X1
b. Dependent Variable: Y1
Model R R Square
Adjusted R
Square
Std. Error of
the Estimate
Change Statistics
Durbin-Watson
R Square
Change F Change df1 df2 Sig. F Change
1 .543a .295 .061 .09854 .295 1.258 2 6 .350 2.476

61 | P a g e
ANOVAa
Model Sum of Squares df Mean Square F Sig.
1 Regression .024 2 .012 1.258 .350a
Residual .058 6 .010
Total .083 8
SOURCE: Field Data 2013.
a. Predictors: (Constant), X2, X1
b. Dependent Variable: Y1

62 | P a g e
model
Unstandardized
coefficients
Standardized
coefficient
t Sig.
Collinearity Statistics
B
Std.
Error Beta Tolerance VIF
1(cont
ant)
SOURCE: Field Data 2013.
a. Dependent Variable: Y1
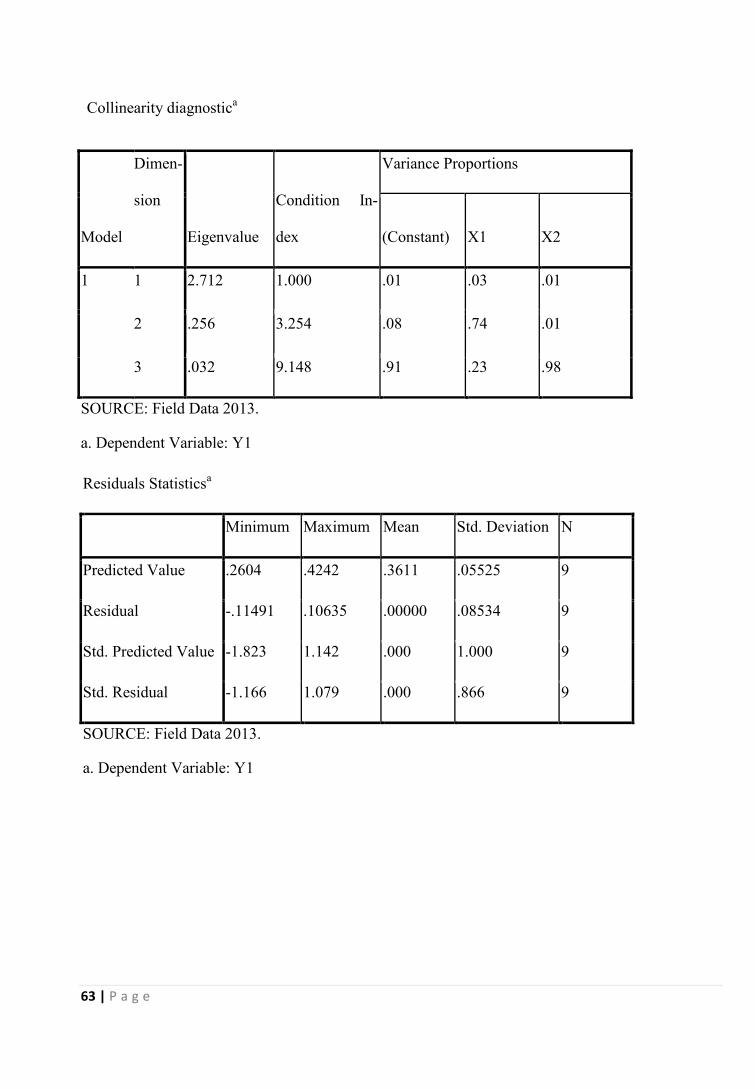
63 | P a g e
Collinearity diagnostica
Residuals Statisticsa
Minimum Maximum Mean Std. Deviation N
Predicted Value .2604 .4242 .3611 .05525 9
Residual -.11491 .10635 .00000 .08534 9
Std. Predicted Value -1.823 1.142 .000 1.000 9
Std. Residual -1.166 1.079 .000 .866 9
SOURCE: Field Data 2013.
a. Dependent Variable: Y1
Model
Dimen-
sion
Eigenvalue
Condition In-
dex
Variance Proportions
(Constant) X1 X2
1 1 2.712 1.000 .01 .03 .01
2 .256 3.254 .08 .74 .01
3 .032 9.148 .91 .23 .98
SOURCE: Field Data 2013.
a. Dependent Variable: Y1
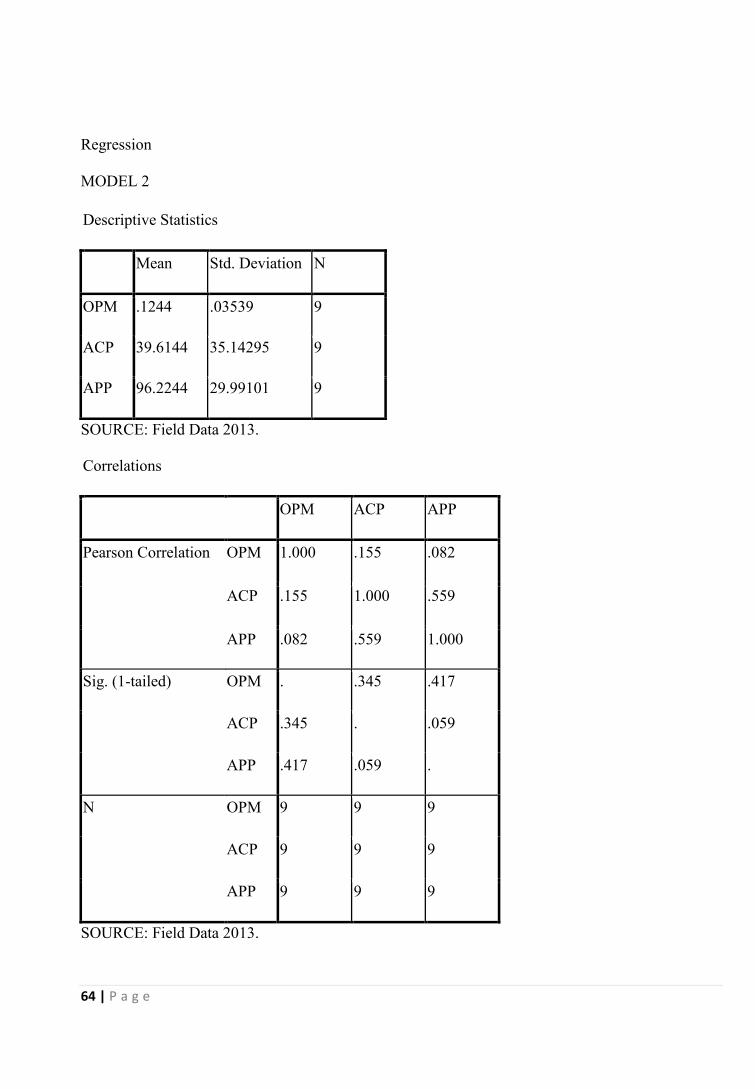
64 | P a g e
Regression
MODEL 2
Descriptive Statistics
Mean Std. Deviation N
OPM .1244 .03539 9
ACP 39.6144 35.14295 9
APP 96.2244 29.99101 9
SOURCE: Field Data 2013.
Correlations
OPM ACP APP
Pearson Correlation OPM 1.000 .155 .082
ACP .155 1.000 .559
APP .082 .559 1.000
Sig. (1-tailed) OPM . .345 .417
ACP .345 . .059
APP .417 .059 .
N OPM 9 9 9
ACP 9 9 9
APP 9 9 9
SOURCE: Field Data 2013.

65 | P a g e
Model Summaryb
Model R R Square
Adjusted R
Square
Std. Error of the
Estimate
Change Statistics
Durbin-Watson
R Square
Change F Change df1 df2 Sig. F Change
1 .155a .024 -.301 .04038 .024 .074 2 6 .930 1.729
SOURCE: Field Data 2013
a. Predictors: (Constant), APP, ACP
b. Dependent Variable: OPM

66 | P a g e
ANOVAb
Model Sum of Squares df Mean Square F Sig.
1 Regression .000 2 .000 .074 .930a
Residual .010 6 .002
Total .010 8
SOURCE: Field Data 2013.
a. Predictors: (Constant), X2, X1
b. Dependent Variable: Y2

67 | P a g e
Cofficientsa
a.DependentVariable:Y2
Model
Unstandardized Coefficients
Standardized
Coefficients
T Sig.
Collinearity Statistics
B Std. Error Beta Tolerance VIF
1 (Constant) .119 .049 2.422 .052
X1 .000 .000 .159 .327 .755 .688 1.455
X2 -8.437E-6 .001 -.007 -.015 .989 .688 1.455

68 | P a g e
Collinearity Diagnosticsa
Model
Dimen-
sion
Eigenvalue
Condition In-
dex
Variance Proportions
(Constant) X1 X2
1 1 2.712 1.000 .01 .03 .01
2 .256 3.254 .08 .74 .01
3 .032 9.148 .91 .23 .98
SOURCE: Field Data 2013.
a. Dependent Variable: Y2
Residuals Statisticsa
Minimum Maximum Mean Std. Deviation N
Predicted Value .1184 .1343 .1244 .00549 9
Residual -.05449 .04729 .00000 .03497 9
Std. Predicted Value -1.107 1.797 .000 1.000 9
Std. Residual -1.350 1.171 .000 .866 9
SOURCE: Field Data 2013.
a. Dependent Variable: Y2

69 | P a g e
YR DRS Equity Sales CRS O.profit PURCH OP/E OP/SALES ACP APPDR/SALES*365 CR/PURCH*365
Y1 Y2 X1 X22004 46540 62165 164441 112589 22277 303042 0.36 0.14 103.30 135.612005 28758 64394 124848 122514 14061 357308 0.22 0.11 84.08 125.152006 88141 519382 1047599 156907 182833 430591 0.35 0.17 30.71 133.012007 118567 438153 799452 80554 134008 582105 0.31 0.17 54.13 50.512008 15617 134743531 527211260 14761 68597247 83329 0.51 0.13 0.01 64.662009 21798 54065 200968 34914 14798 141429 0.27 0.07 39.59 90.112010 14136 45163 206499 37320 21986 142230 0.49 0.11 24.99 95.772011 5636 45696 244293 37043 20681 172577 0.45 0.08 8.42 78.352012 9051 138957 292318 49078 40974 192923 0.29 0.14 11.30 92.85
APPENDIX II GGBL DATA
2004 TO 2012 DEP VAR IND VAR