The Impact of Active Aerodynamic Load Control on Fatigue and Energy Capture at Low Wind Speed Sites
10
The Impact of Active Aerodynamic Load Control on Fatigue and Energy Capture at Low Wind Speed Sites * Dale E. Berg, David G. Wilson, Matthew F. Barone, Brian R. Resor, Jonathan C. Berg, Joshua A. Paquette and Jose R. Zayas Wind Energy Technology Department. Sandia National Laboratories † P.O. Box 5800, Albuquerque, NM 87184-1124 USA e-mail: [email protected] , phone: +1-505-844-1030 Sridhar Kota, Gregory Ervin and Dragan Maric FlexSys Inc., Ann Arbor, MI USA Abstract *† Active aerodynamic load control of wind turbine blades has been heavily researched for years by the wind energy research community and shows great promise for reducing turbine fatigue damage. One way to benefit from this technology is to choose to utilize a larger rotor on a turbine tower and drive train to realize increased turbine energy capture while keeping the fatigue damage of critical turbine components at the original levels. To assess this rotor-increase potential, Sandia National Laboratories and FlexSys Inc. performed aero/structural simulations of a 1.5MW wind turbine at mean wind speeds spanning the entire operating range. Moment loads at several critical system locations were post- processed and evaluated for fatigue damage accumulation at each mean wind speed. Combining these fatigue damage estimates with a Rayleigh wind-speed distribution yielded estimates of the total fatigue damage accumulation for the turbine. This simulation procedure was performed for both the turbine baseline system and the turbine system incorporating a rotor equipped with FlexSys active aerodynamic load control devices. The simulation results were post-processed to evaluate the decrease in the blade root flap fatigue damage accumulation provided by the active aero technology. The blade length was increased until the blade root flap fatigue damage accumulation values matched those * This paper is declared work of the U.S. Government and is not subject to copyright protection in the United States. † Sandia is a multiprogram laboratory operated by Sandia Corporation, a Lockheed Martin Company, for the United States Department of Energy’s National Nuclear Security Administration under contract DE-AC04-94AL85000. of the baseline rotor. With the new rotor size determined, the additional energy capture potential was calculated. These analyses resulted in an energy capture increase of 11% for a mean wind speed of 6.5m/s. 1. Introduction Researchers at Delft Technical University (TU Delft) [1] and Risø National Laboratory/Danish Technical University [2] have demonstrated that active aerodynamic blade load control (AALC) can potentially decrease the blade flap fatigue loads on a wind turbine rotor by significant amounts. A comprehensive list of devices that could be used for wind turbine blade load control has recently been compiled by Johnson, van Dam and Berg [3]. Among the promising technologies are flap-type devices, including conventional flaps and morphing trailing edges [4]. Lackner and van Kuik recently reported on a study of the load reduction capabilities of AALC using conventional flaps on a 5MW turbine [5]. FlexSys Inc, of Ann Arbor, Michigan utilizes distributed-compliance mechanisms that rely on elastic deformation of their elements to transmit motion and/or forces. This design expertise and capability has enabled FlexSys to develop morphing trailing edges for aircraft wings [6]. A morphing trailing edge is a structure that contours to precisely-determined aerodynamic shapes while creating a smooth and continuous surface, supporting aerodynamic loads, minimizing actuator forces, and withstanding lifetimes of operation. These structures can be smoothly and quickly deflected toward either the pressure or suction surface of the wing to form an effective flap, while avoiding the surface discontinuities and
-
Upload
independent -
Category
Documents
-
view
2 -
download
0
Transcript of The Impact of Active Aerodynamic Load Control on Fatigue and Energy Capture at Low Wind Speed Sites
The Impact of Active Aerodynamic Load Control on Fatigue and Energy Capture at Low Wind Speed Sites*
Dale E. Berg, David G. Wilson, Matthew F. Barone, Brian R. Resor, Jonathan C. Berg,
Joshua A. Paquette and Jose R. Zayas Wind Energy Technology Department. Sandia National Laboratories†
P.O. Box 5800, Albuquerque, NM 87184-1124 USA e-mail: [email protected], phone: +1-505-844-1030
Sridhar Kota, Gregory Ervin and Dragan Maric
FlexSys Inc., Ann Arbor, MI USA Abstract*† Active aerodynamic load control of wind turbine blades has been heavily researched for years by the wind energy research community and shows great promise for reducing turbine fatigue damage. One way to benefit from this technology is to choose to utilize a larger rotor on a turbine tower and drive train to realize increased turbine energy capture while keeping the fatigue damage of critical turbine components at the original levels. To assess this rotor-increase potential, Sandia National Laboratories and FlexSys Inc. performed aero/structural simulations of a 1.5MW wind turbine at mean wind speeds spanning the entire operating range. Moment loads at several critical system locations were post-processed and evaluated for fatigue damage accumulation at each mean wind speed. Combining these fatigue damage estimates with a Rayleigh wind-speed distribution yielded estimates of the total fatigue damage accumulation for the turbine. This simulation procedure was performed for both the turbine baseline system and the turbine system incorporating a rotor equipped with FlexSys active aerodynamic load control devices. The simulation results were post-processed to evaluate the decrease in the blade root flap fatigue damage accumulation provided by the active aero technology. The blade length was increased until the blade root flap fatigue damage accumulation values matched those * This paper is declared work of the U.S. Government and is not subject to copyright protection in the United States. † Sandia is a multiprogram laboratory operated by Sandia Corporation, a Lockheed Martin Company, for the United States Department of Energy’s National Nuclear Security Administration under contract DE-AC04-94AL85000.
of the baseline rotor. With the new rotor size determined, the additional energy capture potential was calculated. These analyses resulted in an energy capture increase of 11% for a mean wind speed of 6.5m/s. 1. Introduction Researchers at Delft Technical University (TU Delft) [1] and Risø National Laboratory/Danish Technical University [2] have demonstrated that active aerodynamic blade load control (AALC) can potentially decrease the blade flap fatigue loads on a wind turbine rotor by significant amounts. A comprehensive list of devices that could be used for wind turbine blade load control has recently been compiled by Johnson, van Dam and Berg [3]. Among the promising technologies are flap-type devices, including conventional flaps and morphing trailing edges [4]. Lackner and van Kuik recently reported on a study of the load reduction capabilities of AALC using conventional flaps on a 5MW turbine [5]. FlexSys Inc, of Ann Arbor, Michigan utilizes distributed-compliance mechanisms that rely on elastic deformation of their elements to transmit motion and/or forces. This design expertise and capability has enabled FlexSys to develop morphing trailing edges for aircraft wings [6]. A morphing trailing edge is a structure that contours to precisely-determined aerodynamic shapes while creating a smooth and continuous surface, supporting aerodynamic loads, minimizing actuator forces, and withstanding lifetimes of operation. These structures can be smoothly and quickly deflected toward either the pressure or suction surface of the wing to form an effective flap, while avoiding the surface discontinuities and
air gaps common to conventional flap systems. The compliant structure is designed and optimized to minimize actuator effort and maximize the airfoil surface stiffness to air loading. The morphed flap has a lift characteristic comparable to that of a conventional flap, but with a significant reduction in drag increment during extreme flap deflections. Figure 1 illustrates the National Renewable Energy Laboratories (NREL) S825 wind-turbine airfoil with a 20% chord conventional flap and morphed trailing edges deployed at +/- 20°. The smooth surfaces of the morphed trailing edges are far less likely to cause flow separation than are the surface discontinuities of the conventional flaps.
Figure 1. Conventional Flap and Morphed Trailing Edge Flap Shapes, 20% Chord, +/-20° Deflection. FlexSys is now interested in the application of this morphing trailing edge technology to wind turbine blades and has entered into a Cooperative Research and Development Agreement (CRADA) with the Wind Energy Technology Department of Sandia National Laboratories to study that application on the WindPACT 1.5 MW turbine [7]. Sandia has performed extensive simulations of several turbine configurations using two different control algorithms and has analyzed the results to estimate the increased energy capture and benefits of integrating the FlexSys technology into the tip region of the turbine blades. Concurrently, FlexSys has developed a composite version of their morphing trailing edge technology, investigated methods to integrate it into a wind turbine blade and estimated the costs associated with that integration and the long-term Operations and Maintenance (O&M) of the resultant turbine. 2. Simulation Method 2.1 Overview A full assessment of the impact of implementing active aerodynamic blade load
control on wind turbine cost of energy (COE) would first require the design of a new turbine from the ground up with active aerodynamic load control technology in mind. Once that design is complete, one would have to develop detailed cost estimates for every component of that turbine, estimate O&M costs, determine the energy capture at various wind speeds and compute the COE. This is a major effort and the resultant cost figures will be subject to considerable error, leading to large uncertainty in the turbine COE figures. For this effort we have developed an alternative procedure to quickly establish a reasonable (and conservative) estimate of the probable impact of a variety of AALC devices on turbine COE. Under this scenario, the fatigue damage accumulations at critical locations on an existing utility-size turbine (the “baseline” turbine) are determined for wind speeds spanning the wind turbine operating range. Active aerodynamic load control devices and an associated controller are added to the turbine rotor and these fatigue calculations are repeated. Comparison of the results for the AALC configuration with those for the baseline turbine reveals the impact of the particular AALC devices and controller on the turbine fatigue damage accumulations. The addition of AALC to the blades of a turbine can result in major decreases in flap bending moment fatigue damage accumulation at the blade root, the design-driver loading location for many utility-sized turbines operating in low-to-moderate wind speed conditions. The ability to accomplish this without significant impacts on the fatigue damage accumulations at other wind-turbine drive train and tower locations is heavily dependent upon both the response rate of the AALC device and the development of an appropriate AALC control logic. This decrease in fatigue damage accumulation for the blade-root flap location means that we can either 1) redesign the turbine drive train and tower and remove material to compensate for the decreased loads, thus decreasing the capital cost of the turbine, or, 2) increase the length of the turbine blades (incorporating AALC) until the blade-root flap fatigue damage
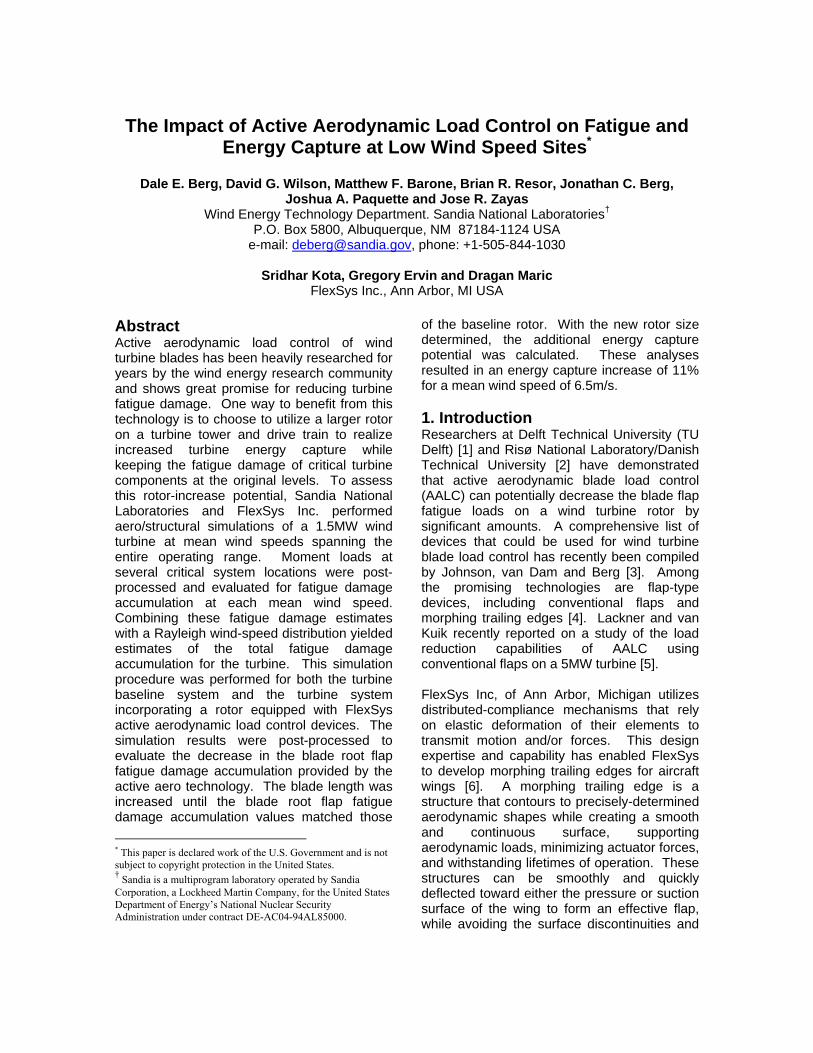
accumulation returns to what it was on the baseline rotor, increasing energy capture for the given drive train and tower. We have elected to pursue this latter course of action, which we refer to as the “Grow-the-Rotor” or GTR approach. Figure 2 illustrates typical and GTR (10% longer blades) power curves for a 1.5MW turbine, together with a typical low-wind-speed wind distribution. The usual control operating regions are also indicated on the figure. A modified turbine with a larger rotor on this drive train cannot capture any more power than the baseline turbine in Region III, since both are operating at maximum generator power. The turbine generates no power in Regions I and IV. Thus, the only region that will be affected by an increase in blade length is Region II, where the power curve for a larger rotor will be shifted to the left, as illustrated by the dashed line and arrow on Figure 2. The amount that the power curve is shifted to the left depends on the increase in blade length, as the power curve is defined as:
PCAVP 2
21
∞= ρ ,
Where: P is the turbine power ρ is the air density A is the rotor swept area (= πR2) R is the rotor radius V∞ is the free-stream wind speed, and CP is the coefficient of performance of the
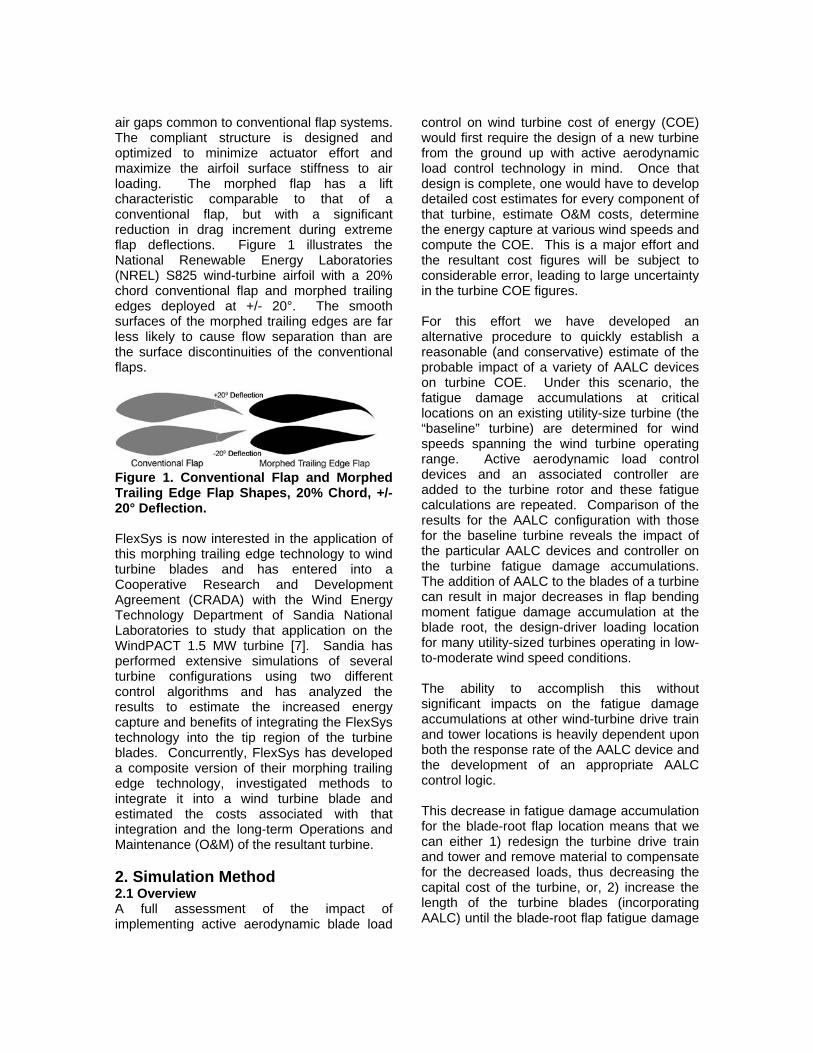
turbine For a given blade design, CP will not change as the rotor is increased in size. Thus, the only variable that changes with the GTR approach is A. As also indicated in Figure 2 by the wind speed probability curve, wind at a low wind site (<7.5 m/s, according to the International Electrotechnical Commission or IEC [8]) occurs in Region II for this turbine a large portion of the time. Therefore, shifting the power curve to the left, even a small amount, will result in a significant increase in energy capture. In summary, as illustrated in Figure 3, the addition of morphing trailing edges to the existing blades results in a major decrease in the blade-root flap fatigue damage
accumulation; growing the blades with morphing trailing edges until this accumulation approaches the original value results in increased rotor area. This increased rotor area shifts the turbine power curve in Region II to the left, as illustrated by the dashed line in Figure 2, resulting in additional energy capture for the turbine.
Figure 2. 1.5MW Wind Turbine Power Curve and 6.5m/s Rayleigh Wind Speed Distribution.
Figure 3. Grow the Rotor Concept. Addition of AALC Results in Lower Fatigue Damage; Increase in Blade Length Results in Increase in Energy Capture. 2.2 Simulation Details Turbine component fatigue accumulation calculations require time-series load histories at the turbine locations of interest at a number of mean wind speeds spanning the entire operating range of the turbine. These load
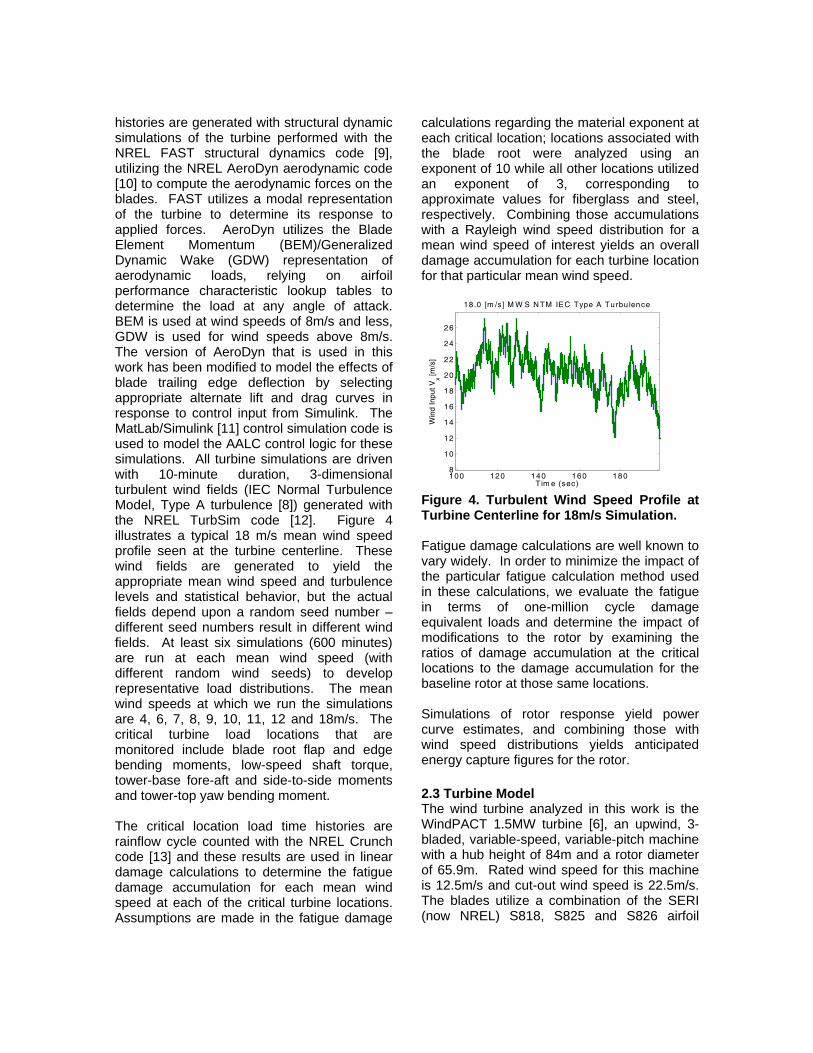
histories are generated with structural dynamic simulations of the turbine performed with the NREL FAST structural dynamics code [9], utilizing the NREL AeroDyn aerodynamic code [10] to compute the aerodynamic forces on the blades. FAST utilizes a modal representation of the turbine to determine its response to applied forces. AeroDyn utilizes the Blade Element Momentum (BEM)/Generalized Dynamic Wake (GDW) representation of aerodynamic loads, relying on airfoil performance characteristic lookup tables to determine the load at any angle of attack. BEM is used at wind speeds of 8m/s and less, GDW is used for wind speeds above 8m/s. The version of AeroDyn that is used in this work has been modified to model the effects of blade trailing edge deflection by selecting appropriate alternate lift and drag curves in response to control input from Simulink. The MatLab/Simulink [11] control simulation code is used to model the AALC control logic for these simulations. All turbine simulations are driven with 10-minute duration, 3-dimensional turbulent wind fields (IEC Normal Turbulence Model, Type A turbulence [8]) generated with the NREL TurbSim code [12]. Figure 4 illustrates a typical 18 m/s mean wind speed profile seen at the turbine centerline. These wind fields are generated to yield the appropriate mean wind speed and turbulence levels and statistical behavior, but the actual fields depend upon a random seed number – different seed numbers result in different wind fields. At least six simulations (600 minutes) are run at each mean wind speed (with different random wind seeds) to develop representative load distributions. The mean wind speeds at which we run the simulations are 4, 6, 7, 8, 9, 10, 11, 12 and 18m/s. The critical turbine load locations that are monitored include blade root flap and edge bending moments, low-speed shaft torque, tower-base fore-aft and side-to-side moments and tower-top yaw bending moment. The critical location load time histories are rainflow cycle counted with the NREL Crunch code [13] and these results are used in linear damage calculations to determine the fatigue damage accumulation for each mean wind speed at each of the critical turbine locations. Assumptions are made in the fatigue damage
calculations regarding the material exponent at each critical location; locations associated with the blade root were analyzed using an exponent of 10 while all other locations utilized an exponent of 3, corresponding to approximate values for fiberglass and steel, respectively. Combining those accumulations with a Rayleigh wind speed distribution for a mean wind speed of interest yields an overall damage accumulation for each turbine location for that particular mean wind speed.
100 120 140 160 1808
10
12
14
16
18
20
22
24
26
Tim e (sec)
Win
d In
put V
x [m/s
]
18 .0 [m /s] M W S N TM IEC Type A Turbu lence
Figure 4. Turbulent Wind Speed Profile at Turbine Centerline for 18m/s Simulation. Fatigue damage calculations are well known to vary widely. In order to minimize the impact of the particular fatigue calculation method used in these calculations, we evaluate the fatigue in terms of one-million cycle damage equivalent loads and determine the impact of modifications to the rotor by examining the ratios of damage accumulation at the critical locations to the damage accumulation for the baseline rotor at those same locations. Simulations of rotor response yield power curve estimates, and combining those with wind speed distributions yields anticipated energy capture figures for the rotor. 2.3 Turbine Model The wind turbine analyzed in this work is the WindPACT 1.5MW turbine [6], an upwind, 3-bladed, variable-speed, variable-pitch machine with a hub height of 84m and a rotor diameter of 65.9m. Rated wind speed for this machine is 12.5m/s and cut-out wind speed is 22.5m/s. The blades utilize a combination of the SERI (now NREL) S818, S825 and S826 airfoil
profiles. The standard turbine controllers are fixed pitch, variable speed in control Region II, combined with constant power, variable pitch and variable speed in control Region III. This is a conceptual – rather than an actual – machine; it was selected because the details of the model are available in the open
erature.
odynamics Device
ables to account for blade tation [18-19].
ortional to the square of e generator speed:
WhT is the generator torque
lit 2.4 Active AerPerformance Tables The tables of lift and drag coefficients for each airfoil section comprising the blade, as functions of angle of attack, are required inputs for the FAST/Aerodyn code. These tables for each airfoil geometry of interest, including those configurations with morphed trailing edges, are generated using the ARC2D [14] Computational Fluid Dynamics (CFD) code, a two-dimensional Navier-Stokes solver. The CFD calculations utilize the Spalart-Allmaras turbulence model, in conjunction with upper and lower surface boundary layer transition locations determined with the XFOIL viscous panel code [15]. The use of CFD allows for a consistent method for determining changes in airfoil performance with the non-trivial shape changes associated with the active aero devices. The time required to generate meshes for the CFD calculations of many different shapes is greatly reduced by using an automated mesh-generation tool [16] developed by the University of California at Davis and Sandia. CFD solutions are obtained over an angle of attack range of -14° to +20°; the airfoil tables are then pre-processed using the AirfoilPrep spreadsheet [17], which applies the Viterna method to expand the performance tables to the full 360° range of angles of attack required by the FAST/AeroDyn code. AirfoilPrep also applies a delayed stall model to the airfoils tro 2.5 Controls In control region II, the standard controller operates the turbine in fixed-pitch mode with generator torque forced to be prop
th2Ωk =T
ere:
3*max
32/1 λρ PCARk = is the maximum aCPmax erodynamic power
λ* is ma d ratio (
coefficient
the opti l tip-spee∞V
=Rω
) at
d
constant
ack from the FAST output with no
which CPmax occurs ω is the rotational speed of the rotor anΩ is the generator rotational speed.
In control region III, the standard collective-pitch controller utilizes blade pitch to control
tor speed while maintaining rogenerator torque. The AALC control system is a Proportional-Derivative (PD) feedback design that operates completely independently of the standard controller. It uses blade tip deflection or tip-deflection rate as the feedback and attempts to minimize deviation from the reference input signal. This reference signal, for the tip-deflection controller, is the nominal tip deflection, defined as the mean value of the tip deflection for the baseline turbine without AALC. In future work, that input will be generated by a running real-time average computation. The reference signal for the tip-deflection rate controller is zero. The simulation assumes both availability and ideal ensor feedbs
time delay. The active aerodynamic devices are considered to be fast-acting and capable of responding to high-frequency disturbances. Therefore, the integration of the AALC controller with the existing low-frequency blade collective pitch and generator torque control
as been seamless, with no obh served impact
actuator s
of either controller on the other. In the AALC controller design, the controller gains were selected to optimize maximum power output while minimizing blade root flap bending moment oscillations. This performance criterion was restricted to avoid
aturation; i.e.,
MAXactuatoractuator ββ ≤ (either +/-10° or +/-20° for the work reported here), where β is the flap deflection angle. Initial simulations did not include any actuator rate constraints, while
more recent simulations have restricted the
ment of ese control systems may be found in the
energy capture calculations ported here were performed according to this
ove to determine tigue load damage accumulations for each of
w-speed shaft torque, blade-root edge and mage.
e erodynamic Load Control on 1.5MW Blade
H tory
ne-million Cycle Damage Eq
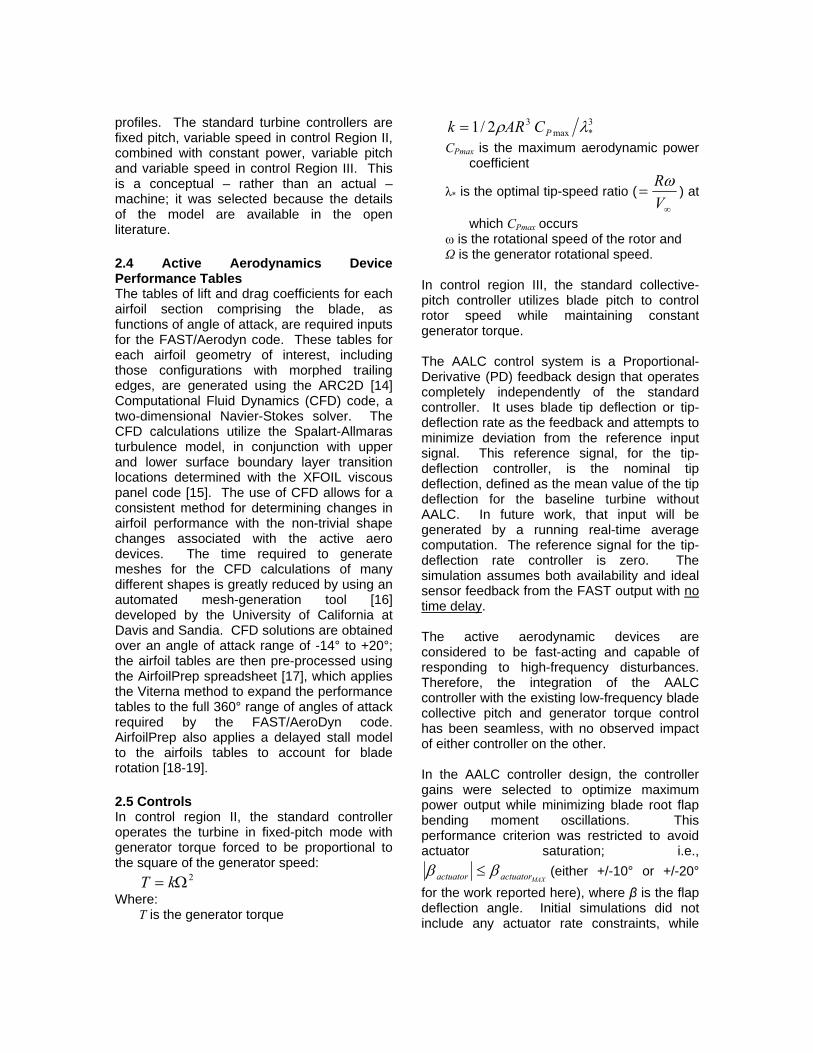
actuator rate to 100°/sec. Additional information on the developthcompanion paper by Wilson et al. [20] In Region II, the use of these AALC controls in conjunction with the normal turbine controller results in some reduction in blade-root flap fatigue accumulation. However, operating AALC in this region also results in loss of energy capture, relative to that found with no AALC, and substantial fatigue of the AALC mechanisms. Fatigue damage accumulation rates are also low in Region II, except in the near vicinity of Vrated. Therefore, we can realize maximum energy capture from a rotor, without significantly increasing turbine fatigue damage accumulation, as well as minimize AALC wear, by simply turning off the AALC controller for wind speeds below 8 m/s. Rayleigh distribution fatigue damage accumulation andrecontrol scenario. 3. Morphing Trailing Edge and GTR Simulations We initially ran a complete set of simulations on the baseline 1.5MW turbine and performed the analysis summarized abfathe critical turbine locations. The FlexSys morphing trailing edge load control hardware (10% chord, +/-20°deflection, with no deflection rate limitation) was added to the outer 25% of blade span in the turbine model. The appropriate control logic was implemented into the simulator logic and the simulations, rainflow cycle counting and fatigue damage accumulations for each mean wind speed (the same wind fields at each mean wind speed as were used for the baseline computations) at the critical locations were recalculated. These AALC results were compared with the baseline results to evaluate the changes in fatigue damage accumulations at each critical location. Typical changes to the root flap bending moment resulting from adding AALC at 18m/s mean wind speed are illustrated in Figure 5. Table 1 compares the
one-million cycle damage equivalent load (DEL) of the standard-size rotor with AALC to the baseline rotor. Adding AALC devices resulted in significant decreases in blade-root flap (30-36%), blade- root pitch (10-19%), tower-base fore-aft (13-22%) and tower-top yaw (27-39%) moment fatigue damage across all wind speeds, with essentially no effect on lotower-base side-side moment fatigue da
Figure 5. Example of Effect of ActivARoot Flap Bending Moment Time
is .
O uivalent Load (AALC/Baseline)
7m/s /s s9m/s 11m 18m/Low Speed Shaft Torque -3 -1.8 -1.1 -3 Blade Root Edge Moment 1 1.3 2.6 -0.9 Blade Root Flap Moment -36.1 .1 -33.5 -30 -30.6Blade Root Pitch Moment -18.5 -13.2 -10.9 -18.7 Tower-Base Side-Side Mom -0.2 -1.9 -1 -6.7 Tower Base Fore-Aft Moment -15.2 -21.7 -22.4 -13.4 Yaw Moment -27.4 -35.3 -39 -36.8 Table 1. Changes to Fatigue Damage Accumulation Resulting from the Addition of FlexSys Morphing Trailing Edge Technology. Trailing Edge is 10% Chord, +/-20° Maximum Deflection, No Deflection
ate Limit. All Damage is % Change from
apital costs), or
Rthe Baseline Levels. This major reduction in the rotor and tower fatigue damage gives the turbine designer two options: either redesign the turbine drive train and tower to capitalize on the reduced fatigue damage (thus reducing cincrease the size of the turbine rotor (thus increasing energy capture).
100 120 140 160 180-1000
-500
0
500
1000
1500
Time (sec)
Bl
ade
1 R
oot F
lap
Ben
ding
Mom
ent (
kNm
)
No FlapsFlaps
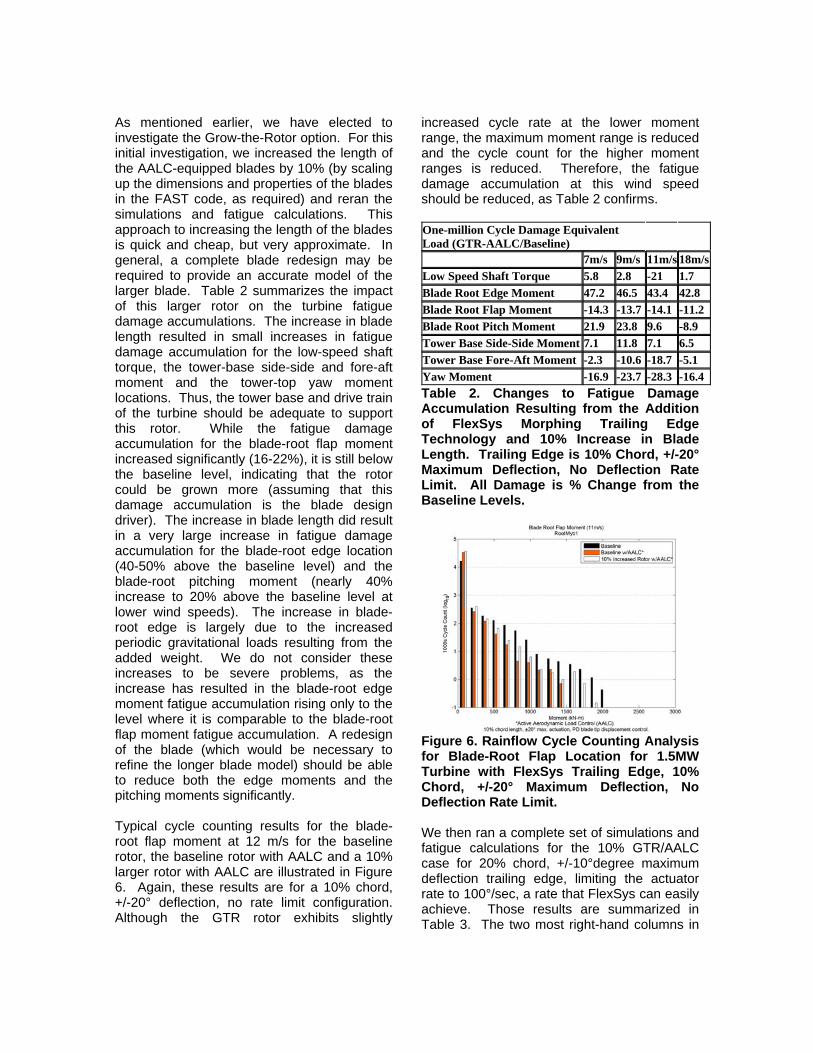
As mentioned earlier, we have elected to investigate the Grow-the-Rotor option. For this initial investigation, we increased the length of the AALC-equipped blades by 10% (by scaling up the dimensions and properties of the blades in the FAST code, as required) and reran the simulations and fatigue calculations. This approach to increasing the length of the blades is quick and cheap, but very approximate. In general, a complete blade redesign may be required to provide an accurate model of the larger blade. Table 2 summarizes the impact of this larger rotor on the turbine fatigue damage accumulations. The increase in blade length resulted in small increases in fatigue damage accumulation for the low-speed shaft torque, the tower-base side-side and fore-aft moment and the tower-top yaw moment locations. Thus, the tower base and drive train of the turbine should be adequate to support this rotor. While the fatigue damage accumulation for the blade-root flap moment increased significantly (16-22%), it is still below the baseline level, indicating that the rotor could be grown more (assuming that this damage accumulation is the blade design driver). The increase in blade length did result in a very large increase in fatigue damage accumulation for the blade-root edge location (40-50% above the baseline level) and the blade-root pitching moment (nearly 40% increase to 20% above the baseline level at lower wind speeds). The increase in blade-root edge is largely due to the increased periodic gravitational loads resulting from the added weight. We do not consider these increases to be severe problems, as the increase has resulted in the blade-root edge moment fatigue accumulation rising only to the level where it is comparable to the blade-root flap moment fatigue accumulation. A redesign of the blade (which would be necessary to refine the longer blade model) should be able
reduce both the edge moments and the
tigue amage accumulation at this wind speed
firm
ne-million Cycle Damage Eque)
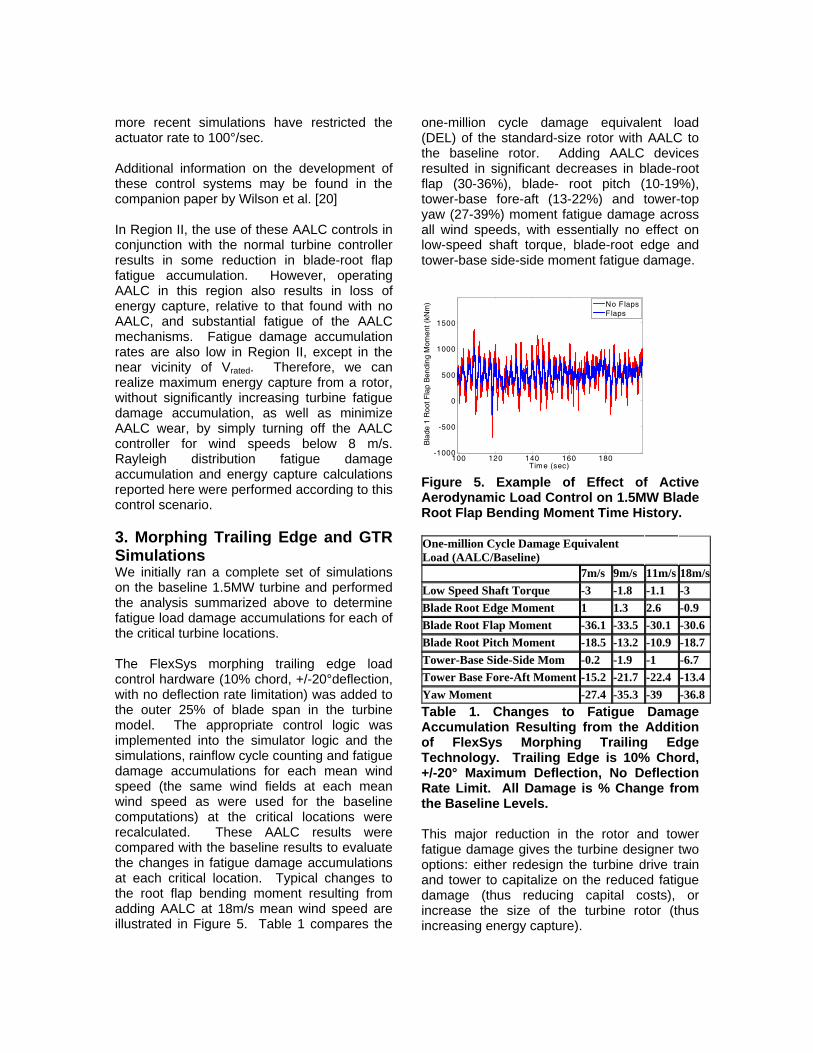
topitching moments significantly. Typical cycle counting results for the blade-root flap moment at 12 m/s for the baseline rotor, the baseline rotor with AALC and a 10% larger rotor with AALC are illustrated in Figure 6. Again, these results are for a 10% chord, +/-20° deflection, no rate limit configuration. Although the GTR rotor exhibits slightly
increased cycle rate at the lower moment range, the maximum moment range is reduced and the cycle count for the higher moment ranges is reduced. Therefore, the fadshould be reduced, as Table 2 con
s.
O ivalent Load (GTR-AALC/Baselin
7m/s 9m/s 11m/s 18m/sLow Speed Shaft Torque 5.8 2.8 -21 1.7 Blade Root Edge Moment 47.2 46.5 43.4 42.8 Blade Root Flap Moment -14.3 -13.7 -14.1 -11.2Blade Root Pitch Moment 21.9 23.8 9.6 -8.9 Tower Base Side-Side Moment 7.1 11.8 7.1 6.5 Tower Base Fore-Aft Moment -2.3 -10.6 -18.7 -5.1 Yaw Moment -16.9 -23.7 -28.3 -16.4 Table 2. Changes to Fatigue Damage Accumulation Resulting from the Addition of FlexSys Morphing Trailing Edge Technology and 10% Increase in Blade Length. Trailing Edge is 10% Chord, +/-20° Maximum Deflection, No Deflection Rate
imit. All Damage is % Change from the
Trailing Edge, 10% hord, +/-20° Maximum Deflection, No
LBaseline Levels.
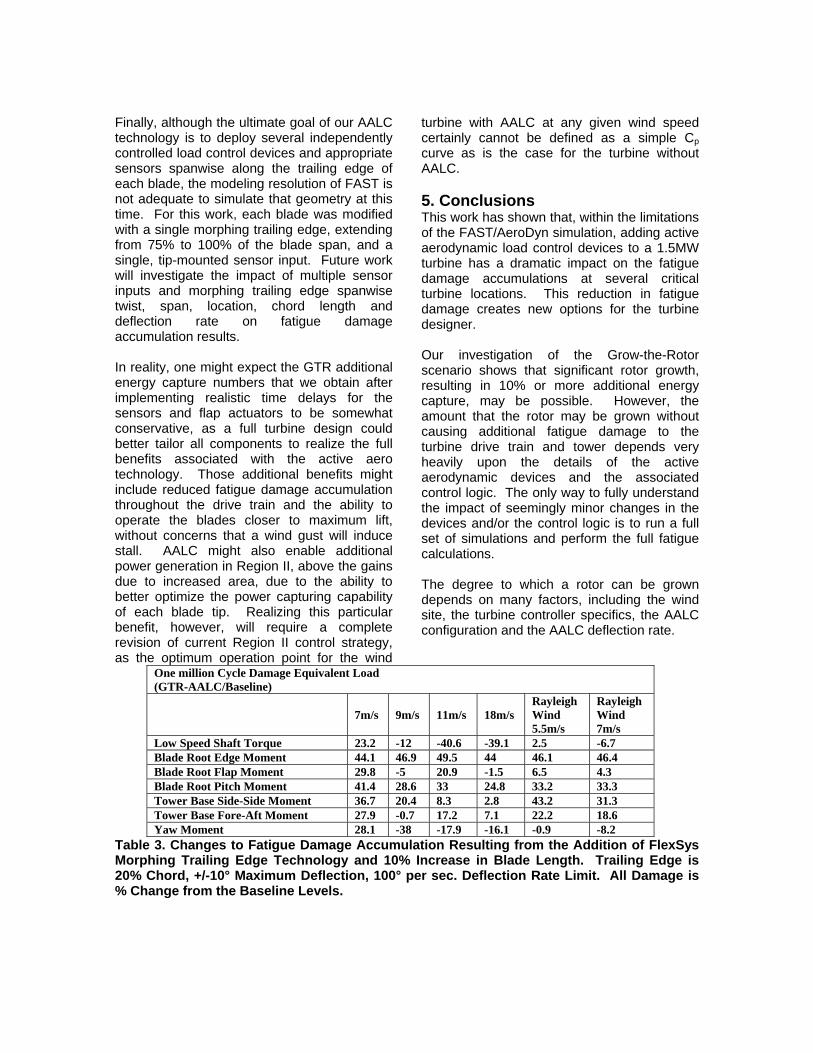
Figure 6. Rainflow Cycle Counting Analysis for Blade-Root Flap Location for 1.5MW Turbine with FlexSysCDeflection Rate Limit. We then ran a complete set of simulations and fatigue calculations for the 10% GTR/AALC case for 20% chord, +/-10°degree maximum deflection trailing edge, limiting the actuator rate to 100°/sec, a rate that FlexSys can easily achieve. Those results are summarized in Table 3. The two most right-hand columns in
the Table summarize the fatigue damage accumulation results for a particular wind speed distribution. For this configuration, the mean wind speed at the turbine site does not appear to have much impact on the blade-root edge, blade-root flap, blade-root pitch, or tower-base fore-aft moment fatigue damage accumulations. However, the low-speed shaft torque, tower-base side-side and yaw moment fatigue damage accumulations are affected by the mean wind speed at the site. Comparison of Tables 2 and 3 shows that the limitation of the actuator rate (and the change in trailing edge configuration) has a major impact on the fatigue load damage accumulation for all the critical locations except for the low-speed shaft torque and blade root edge moment. The small positive value for flap moment indicates that the rotor really should be slightly smaller (perhaps 9% larger than the baseline rotor) to keep the resultant flap moment fatigue damage accumulation equal to that of the baseline rotor. As shown in Figure 7, this GTR configuration results in both increased maximum moment range and increased cycle rate for the maximum moments for the blade-root flap, relative to the baseline rotor. Obviously, for this configuration, the tower design will have to be checked carefully to ensure that it can tolerate the significantly increased fatigue damage accumulations. Only by running through the complete fatigue analysis were we able to determine the impact
f these configuration changes on the turbine fatigue damage accumulations.
o
0 500 1000 1500 2000 2500 3000-2
-1
0
1
2
3
4
5
Blade Root Flap Moment (12m/s)RootMyb1
Cyc
le R
ate,
log 10
(100
0*cy
c/s)
Moment (kN-m)*Active Aerodynamic Load Control (AALC)
20% chord length, +/- 10o max. actuation, PD blade tip displacement control
Baseline
Baseline w/AALC*10% Increased Rotor w/AALC*
Figure 7. Rainflow Cycle Counting Analysis for Blade Root Flap Location for 1.5MW Turbine with FlexSys Trailing Edge, 20%
hord, +/-10° Maximum Deflection, 100° per
capture increase ranges om 13% for a 5.5m/s mean wind Rayleigh
wind distribution to 9% for an 8m/s Rayleigh distribution wind site.
Csec. Deflection Rate Limit.
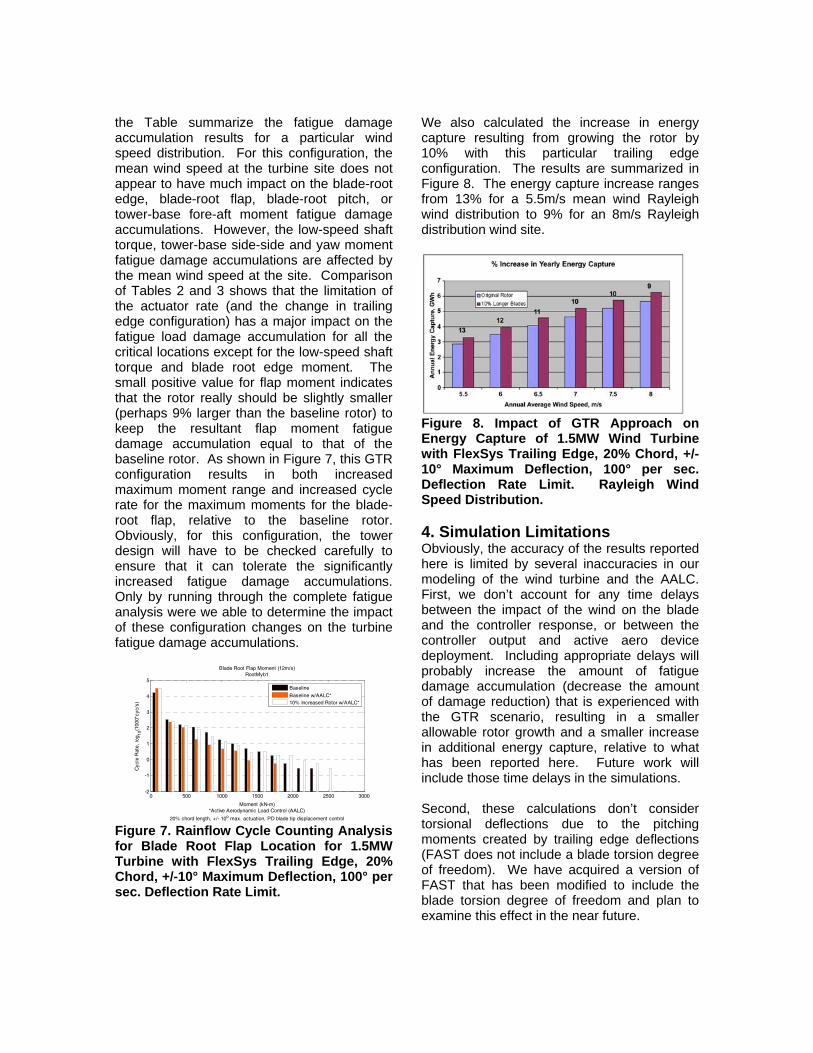
We also calculated the increase in energy capture resulting from growing the rotor by 10% with this particular trailing edge configuration. The results are summarized in Figure 8. The energyfr
Figure 8. Impact of GTR Approach on Energy Capture of 1.5MW Wind Turbine with FlexSys Trailing Edge, 20% Chord, +/-
0° Maximum Deflection, 100° per sec. leigh Wind
additional energy capture, relative to what
rsion of
1Deflection Rate Limit. RaySpeed Distribution. 4. Simulation Limitations Obviously, the accuracy of the results reported here is limited by several inaccuracies in our modeling of the wind turbine and the AALC. First, we don’t account for any time delays between the impact of the wind on the blade and the controller response, or between the controller output and active aero device deployment. Including appropriate delays will probably increase the amount of fatigue damage accumulation (decrease the amount of damage reduction) that is experienced with the GTR scenario, resulting in a smaller allowable rotor growth and a smaller increaseinhas been reported here. Future work will include those time delays in the simulations. Second, these calculations don’t consider torsional deflections due to the pitching moments created by trailing edge deflections (FAST does not include a blade torsion degree of freedom). We have acquired a veFAST that has been modified to include the blade torsion degree of freedom and plan to examine this effect in the near future.
Finally, although the ultimate goal of our AALC technology is to deploy several independently controlled load control devices and appropriate sensors spanwise along the trailing edge of each blade, the modeling resolution of FAST is not adequate to simulate that geometry at this time. For this work, each blade was modified with a single morphing trailing edge, extending from 75% to 100% of the blade span, and a single, tip-mounted sensor input. Future work will investigate the impact of multiple sensor
puts and morphing trailing edge spanwise
revisio , as the e wind
cannot be defined as a simple Cp urve as is the case for the turbine without
his reduction in fatigue amage creates new options for the turbine
ntrol logic is to run a full et of simulations and perform the full fatigue
ind ite, the turbine controller specifics, the AALC
configuration and the AALC deflection rate.
ne million Cycle Damage Equivalent Load (GTR-AALC/Baseline)
intwist, span, location, chord length and deflection rate on fatigue damage accumulation results. In reality, one might expect the GTR additional energy capture numbers that we obtain after implementing realistic time delays for the sensors and flap actuators to be somewhat conservative, as a full turbine design could better tailor all components to realize the full benefits associated with the active aero technology. Those additional benefits might include reduced fatigue damage accumulation throughout the drive train and the ability to operate the blades closer to maximum lift, without concerns that a wind gust will induce stall. AALC might also enable additional power generation in Region II, above the gains due to increased area, due to the ability to better optimize the power capturing capability of each blade tip. Realizing this particular benefit, however, will require a complete
turbine with AALC at any given wind speed certainly
n of current Region II control strategy optimum operation point for th
cAALC. 5. Conclusions This work has shown that, within the limitations of the FAST/AeroDyn simulation, adding active aerodynamic load control devices to a 1.5MW turbine has a dramatic impact on the fatigue damage accumulations at several critical turbine locations. Tddesigner. Our investigation of the Grow-the-Rotor scenario shows that significant rotor growth, resulting in 10% or more additional energy capture, may be possible. However, the amount that the rotor may be grown without causing additional fatigue damage to the turbine drive train and tower depends very heavily upon the details of the active aerodynamic devices and the associated control logic. The only way to fully understand the impact of seemingly minor changes in the devices and/or the coscalculations. The degree to which a rotor can be grown depends on many factors, including the ws
O
7m/s 9m/s
h d
s
igh 11m/s 18m/s
RayleigWin5.5m/
RayleWind7m/s
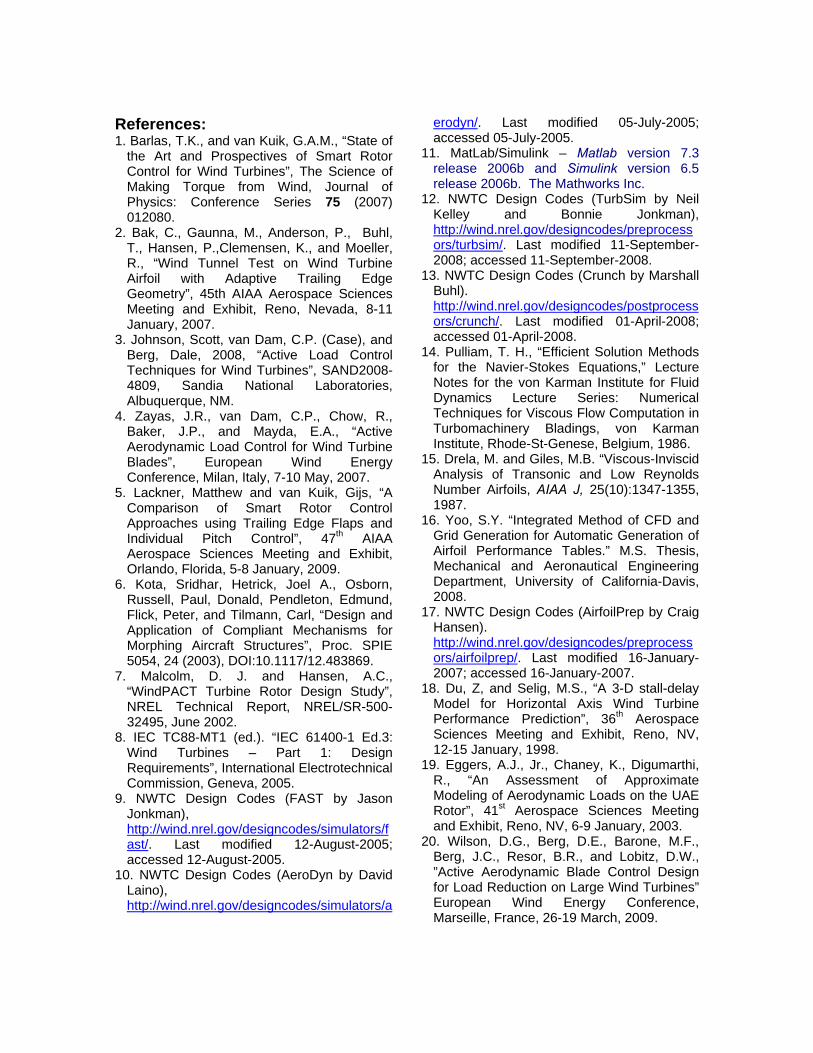
Low Speed Shaft Torque 23.2 -12 -40.6 -39.1 2.5 -6.7 Blade Root Edge Moment 44.1 46.9 49.5 44 46.1 46.4 Blade Root Flap Moment 29.8 -5 20.9 -1.5 6.5 4.3 Blade Root Pitch Moment 41.4 28.6 33 24.8 33.2 33.3 Tower Base Side-Side Moment 36.7 20.4 8.3 2.8 43.2 31.3 Tower Base Fore-Aft Moment 27.9 -0.7 17.2 7.1 22.2 18.6 Yaw Moment 28.1 -38 -17.9 -16.1 -0.9 -8.2
Table 3. Changes to Fatigue Damage Accumulation Resulting from the Addition of FlexSys Morphing Trailing Edge Technology and 10% Increase in Blade Length. Trailing Edge is 20% Chord, +/-10° Maximum Deflection, 100° per sec. Deflection Rate Limit. All Damage is % Change from the Baseline Levels.
References: 1. Barlas, T.K., and van Kuik, G.A.M., “State of
the Art and Prospectives of Smart Rotor Control for Wind Turbines”, The Science of Making Torque from Wind, Journal of Physics: Conference Series 75 (2007) 012080.
2. Bak, C., Gaunna, M., Anderson, P., Buhl, T., Hansen, P.,Clemensen, K., and Moeller, R., “Wind Tunnel Test on Wind Turbine Airfoil with Adaptive Trailing Edge Geometry”, 45th AIAA Aerospace Sciences Meeting and Exhibit, Reno, Nevada, 8-11 January, 2007.
3. Johnson, Scott, van Dam, C.P. (Case), and Berg, Dale, 2008, “Active Load Control Techniques for Wind Turbines”, SAND2008-4809, Sandia National Laboratories, Albuquerque, NM.
4. Zayas, J.R., van Dam, C.P., Chow, R., Baker, J.P., and Mayda, E.A., “Active Aerodynamic Load Control for Wind Turbine Blades”, European Wind Energy Conference, Milan, Italy, 7-10 May, 2007.
5. Lackner, Matthew and van Kuik, Gijs, “A Comparison of Smart Rotor Control Approaches using Trailing Edge Flaps and Individual Pitch Control”, 47th AIAA Aerospace Sciences Meeting and Exhibit, Orlando, Florida, 5-8 January, 2009.
6. Kota, Sridhar, Hetrick, Joel A., Osborn, Russell, Paul, Donald, Pendleton, Edmund, Flick, Peter, and Tilmann, Carl, “Design and Application of Compliant Mechanisms for Morphing Aircraft Structures”, Proc. SPIE 5054, 24 (2003), DOI:10.1117/12.483869.
7. Malcolm, D. J. and Hansen, A.C., “WindPACT Turbine Rotor Design Study”, NREL Technical Report, NREL/SR-500-32495, June 2002.
8. IEC TC88-MT1 (ed.). “IEC 61400-1 Ed.3: Wind Turbines – Part 1: Design Requirements”, International Electrotechnical Commission, Geneva, 2005.
9. NWTC Design Codes (FAST by Jason Jonkman), http://wind.nrel.gov/designcodes/simulators/fast/. Last modified 12-August-2005; accessed 12-August-2005.
10. NWTC Design Codes (AeroDyn by David Laino), http://wind.nrel.gov/designcodes/simulators/a
erodyn/. Last modified 05-July-2005; accessed 05-July-2005.
11. MatLab/Simulink – Matlab version 7.3 release 2006b and Simulink version 6.5 release 2006b. The Mathworks Inc.
12. NWTC Design Codes (TurbSim by Neil Kelley and Bonnie Jonkman), http://wind.nrel.gov/designcodes/preprocessors/turbsim/. Last modified 11-September-2008; accessed 11-September-2008.
13. NWTC Design Codes (Crunch by Marshall Buhl). http://wind.nrel.gov/designcodes/postprocessors/crunch/. Last modified 01-April-2008; accessed 01-April-2008.
14. Pulliam, T. H., “Efficient Solution Methods for the Navier-Stokes Equations,” Lecture Notes for the von Karman Institute for Fluid Dynamics Lecture Series: Numerical Techniques for Viscous Flow Computation in Turbomachinery Bladings, von Karman Institute, Rhode-St-Genese, Belgium, 1986.
15. Drela, M. and Giles, M.B. “Viscous-Inviscid Analysis of Transonic and Low Reynolds Number Airfoils, AIAA J, 25(10):1347-1355, 1987.
16. Yoo, S.Y. “Integrated Method of CFD and Grid Generation for Automatic Generation of Airfoil Performance Tables.” M.S. Thesis, Mechanical and Aeronautical Engineering Department, University of California-Davis, 2008.
17. NWTC Design Codes (AirfoilPrep by Craig Hansen). http://wind.nrel.gov/designcodes/preprocessors/airfoilprep/. Last modified 16-January-2007; accessed 16-January-2007.
18. Du, Z, and Selig, M.S., “A 3-D stall-delay Model for Horizontal Axis Wind Turbine Performance Prediction”, 36th Aerospace Sciences Meeting and Exhibit, Reno, NV, 12-15 January, 1998.
19. Eggers, A.J., Jr., Chaney, K., Digumarthi, R., “An Assessment of Approximate Modeling of Aerodynamic Loads on the UAE Rotor”, 41st Aerospace Sciences Meeting and Exhibit, Reno, NV, 6-9 January, 2003.
20. Wilson, D.G., Berg, D.E., Barone, M.F., Berg, J.C., Resor, B.R., and Lobitz, D.W., ”Active Aerodynamic Blade Control Design for Load Reduction on Large Wind Turbines” European Wind Energy Conference, Marseille, France, 26-19 March, 2009.