The Herschel view of massive star formation in G035.39-00.33: dense and cold filament of W48...
11
arXiv:1109.3584v3 [astro-ph.SR] 17 Oct 2011 Astronomy & Astrophysics manuscript no. ms c ESO 2011 October 18, 2011 The Herschel ⋆ view of massive star formation in G035.39–00.33: Dense and cold filament of W48 undergoing a mini-starburst ⋆⋆ Q. Nguy ˜ ˆ en Lu ’ o ’ ng 1 , F. Motte 1 , M. Hennemann 1 , T. Hill 1 , K. L. J. Rygl 2 , N. Schneider 1 , S. Bontemps 3 , A. Men’shchikov 1 , Ph. Andr´ e 1 , N. Peretto 1 , L. D. Anderson 4,5 , D. Arzoumanian 1 , L. Deharveng 4 , P. Didelon 1 , J. Di Francesco 6 , M. J. Griffin 7 , J. M. Kirk 7 , V. K¨ onyves 1 , P. G. Martin 8 , A. Maury 9 , V. Minier 1 . S. Molinari 2 , M. Pestalozzi 2 , S. Pezzuto 2 , M. Reid 8 , H. Roussel 10 , M. Sauvage 1 , F. Schuller 11 , L. Testi 9 , D. Ward-Thompson 7 , G. J. White 12,13 , A. Zavagno 4 1 Laboratoire AIM Paris-Saclay, CEA/IRFU - CNRS/INSU - Universit´ e Paris Diderot, Service d’Astrophysique, Bˆ at. 709, CEA- Saclay, F-91191 Gif-sur-Yvette Cedex, France e-mail: [email protected] 2 INAF-IFSI, Via del Fosso del Cavaliere 100, 00133 Roma, Italy 3 Laboratoire d’Astrophysique de Bordeaux, CNRS/INSU – Universit´ e de Bordeaux, BP 89, 33271, Floirac cedex, France 4 Laboratoire d’Astrophysique de Marseille , CNRS/INSU – Universit´ e de Provence, 13388, Marseille cedex 13, France 5 Physics Department, West Virginia University, Morgantown, WV 26506, USA 6 National Research Council of Canada, Herzberg Institute of Astrophysics, University of Victoria, Department of Physics and Astronomy, Victoria, Canada 7 Cardiff University School of Physics and Astronomy, UK 8 CITA & Dep. of Astronomy and Astrophysics, University of Toronto, Toronto, Canada 9 ESO, Karl Schwarzschild Str. 2, 85748, Garching, Germany 10 Institut d’Astrophysique de Paris, UMR7095 CNRS, Universit´ e Pierre & Marie Curie, 98 bis Boulevard Arago, 75014 Paris, France 11 Max-Planck-Institut f¨ ur Radioastronomie, Auf dem H¨ ugel 69, D-53121 Bonn, Germany 12 The Rutherford Appleton Laboratory, Chilton, Didcot, OX11 0NL, UK 13 Department of Physics and Astronomy, The Open University, Milton Keynes, UK Received 05 Aug 2011; accepted 16 Sep 2011 ABSTRACT The filament IRDC G035.39–00.33 in the W48 molecular complex is one of the darkest infrared clouds observed by Spitzer. It has been observed by the PACS (70 and 160 µm) and SPIRE (250, 350, and 500 µm) cameras of the Herschel Space Observatory as part of the W48 molecular cloud complex in the framework of the HOBYS key programme. The observations reveal a sample of 28 compact sources (deconvolved FWHM sizes <0.3 pc) complete down to ∼5 M ⊙ in G035.39–00.33 and its surroundings. Among them, 13 compact sources are massive dense cores with masses >20 M ⊙ . The cloud characteristics we derive from the analysis of their spectral energy distributions are masses of 20 − 50 M ⊙ , sizes of 0.1–0.2 pc, and average densities of 2 − 20 × 10 5 cm −3 , which make these massive dense cores excellent candidates to form intermediate- to high-mass stars. Most of the massive dense cores are located inside the G035.39–00.33 ridge and host IR-quiet high-mass protostars. The large number of protostars found in this filament suggests that we are witnessing a mini-burst of star formation with an efficiency of ∼15% and a rate density of ∼40 M ⊙ yr −1 kpc −2 within ∼8 pc 2 ,a large area covering the full ridge. Part of the extended SiO emission observed towards G035.39–00.33 is not associated with obvious protostars and may originate from low-velocity shocks within converging flows, as advocated by previous studies. Key words. ISM: cloud - Submillimeter: ISM - Stars: formation - Stars: protostars - ISM: G035.39–00.33 - ISM: W48 1. Introduction The Herschel observatory (Pilbratt et al. 2010), operating at far- infrared to submilimeter wavelengths, is an excellent tool for studying the early phases of star formation and the connection of star precursors to the ambient cloud. To address fundamen- tal questions of massive star formation, the guaranteed-time key programme “Herschel imaging survey of OB Young Stellar ob- jects” (HOBYS 1 ) has observed all of the regions forming high- mass stars within a distance of 3 kpc from the Sun, one of which ⋆ Herschel is an ESA space observatory with science instruments pro- vided by European-led Principal Investigator consortia and with impor- tant participation from NASA. See http://herschel.esac.esa.int/ ⋆⋆ Figures 9–11 are only available in electronic form at http://www.aanda.org 1 http://hobys-herschel.cea.fr is the W48 molecular complex. This survey will ultimately provide an unbiased view of the formation of OB-type stars and the influence of the ambient environment on that process (see Motte et al. 2010; Schneider et al. 2010b; Hennemann et al. 2010; di Francesco et al. 2010; Hill et al. 2011). A picture is starting to emerge that high-mass stars are formed from more dynamical processes than low-mass stars. Massive dense cores (MDCs, ∼0.1 pc, >10 5 cm −3 ) either IR-bright or IR-quiet, where the mid-infrared flux threshold is used as a proxy for the pres- ence/absence of a high-mass stellar embryo (see Motte et al. 2007), have short lifetimes. The high-mass class 0-like pro- tostars forming within IR-quiet MDCs (Bontemps et al. 2010) are observed to be fed on small scales by supersonic gas flows (Csengeri et al. 2011). These short timescales and fast gas flows are consistent with molecular clouds and dense filaments dynam- ically formed by colliding flows of H I gas (e.g. Schneider et al.
Transcript of The Herschel view of massive star formation in G035.39-00.33: dense and cold filament of W48...
arX
iv:1
109.
3584
v3 [
astr
o-ph
.SR
] 17
Oct
201
1Astronomy & Astrophysicsmanuscript no. ms c© ESO 2011October 18, 2011
The Herschel ⋆ view of massive star formation in G035.39–00.33:Dense and cold filament of W48 undergoing a mini-starburst ⋆⋆
Q. Nguyen Lu’o’ng1, F. Motte1, M. Hennemann1, T. Hill1, K. L. J. Rygl2, N. Schneider1, S. Bontemps3,A. Men’shchikov1, Ph. Andre1, N. Peretto1, L. D. Anderson4,5, D. Arzoumanian1, L. Deharveng4, P. Didelon1,J. Di Francesco6, M. J. Griffin7, J. M. Kirk7, V. Konyves1, P. G. Martin8, A. Maury9, V. Minier1. S. Molinari2,
M. Pestalozzi2, S. Pezzuto2, M. Reid8, H. Roussel10, M. Sauvage1, F. Schuller11, L. Testi9, D. Ward-Thompson7,G. J. White12,13, A. Zavagno4
1 Laboratoire AIM Paris-Saclay, CEA/IRFU - CNRS/INSU - Universite Paris Diderot, Service d’Astrophysique, Bat. 709, CEA-Saclay, F-91191 Gif-sur-Yvette Cedex, France e-mail:[email protected]
2 INAF-IFSI, Via del Fosso del Cavaliere 100, 00133 Roma, Italy3 Laboratoire d’Astrophysique de Bordeaux, CNRS/INSU – Universite de Bordeaux, BP 89, 33271, Floirac cedex,France4 Laboratoire d’Astrophysique de Marseille , CNRS/INSU – Universite de Provence, 13388, Marseille cedex 13, France5 Physics Department, West Virginia University, Morgantown, WV 26506, USA6 National Research Council of Canada, Herzberg Institute ofAstrophysics, University of Victoria, Department of Physics and
Astronomy, Victoria, Canada7 Cardiff University School of Physics and Astronomy, UK8 CITA & Dep. of Astronomy and Astrophysics, University of Toronto, Toronto, Canada9 ESO, Karl Schwarzschild Str. 2, 85748, Garching, Germany
10 Institut d’Astrophysique de Paris, UMR7095 CNRS, Universite Pierre & Marie Curie, 98 bis Boulevard Arago, 75014 Paris, France11 Max-Planck-Institut fur Radioastronomie, Auf dem Hugel69, D-53121 Bonn, Germany12 The Rutherford Appleton Laboratory, Chilton, Didcot, OX110NL, UK13 Department of Physics and Astronomy, The Open University, Milton Keynes, UK
Received 05 Aug 2011; accepted 16 Sep 2011
ABSTRACT
The filament IRDC G035.39–00.33 in the W48 molecular complexis one of the darkest infrared clouds observed bySpitzer. It hasbeen observed by the PACS (70 and 160µm) and SPIRE (250, 350, and 500µm) cameras of theHerschel Space Observatory as part ofthe W48 molecular cloud complex in the framework of the HOBYSkey programme. The observations reveal a sample of 28 compactsources (deconvolved FWHM sizes<0.3 pc) complete down to∼5 M⊙ in G035.39–00.33 and its surroundings. Among them, 13compact sources are massive dense cores with masses>20 M⊙. The cloud characteristics we derive from the analysis of their spectralenergy distributions are masses of 20− 50 M⊙, sizes of 0.1–0.2 pc, and average densities of 2− 20× 105 cm−3, which make thesemassive dense cores excellent candidates to form intermediate- to high-mass stars. Most of the massive dense cores are located insidethe G035.39–00.33 ridge and host IR-quiet high-mass protostars. The large number of protostars found in this filament suggests thatwe are witnessing a mini-burst of star formation with an efficiency of∼15% and a rate density of∼40 M⊙ yr−1 kpc−2 within ∼8 pc2, alarge area covering the full ridge. Part of the extended SiO emission observed towards G035.39–00.33 is not associated with obviousprotostars and may originate from low-velocity shocks within converging flows, as advocated by previous studies.
Key words. ISM: cloud - Submillimeter: ISM - Stars: formation - Stars: protostars - ISM: G035.39–00.33 - ISM: W48
1. Introduction
TheHerschel observatory (Pilbratt et al. 2010), operating at far-infrared to submilimeter wavelengths, is an excellent toolforstudying the early phases of star formation and the connectionof star precursors to the ambient cloud. To address fundamen-tal questions of massive star formation, the guaranteed-time keyprogramme “Herschel imaging survey of OB Young Stellar ob-jects” (HOBYS1) has observed all of the regions forming high-mass stars within a distance of 3 kpc from the Sun, one of which
⋆ Herschel is an ESA space observatory with science instruments pro-vided by European-led Principal Investigator consortia and with impor-tant participation from NASA. Seehttp://herschel.esac.esa.int/⋆⋆ Figures 9–11 are only available in electronic form athttp://www.aanda.org
1 http://hobys-herschel.cea.fr
is the W48 molecular complex. This survey will ultimatelyprovide an unbiased view of the formation of OB-type starsand the influence of the ambient environment on that process(see Motte et al. 2010; Schneider et al. 2010b; Hennemann et al.2010; di Francesco et al. 2010; Hill et al. 2011). A picture isstarting to emerge that high-mass stars are formed from moredynamical processes than low-mass stars. Massive dense cores(MDCs,∼0.1 pc,>105 cm−3) either IR-bright or IR-quiet, wherethe mid-infrared flux threshold is used as a proxy for the pres-ence/absence of a high-mass stellar embryo (see Motte et al.2007), have short lifetimes. The high-mass class 0-like pro-tostars forming within IR-quiet MDCs (Bontemps et al. 2010)are observed to be fed on small scales by supersonic gas flows(Csengeri et al. 2011). These short timescales and fast gas flowsare consistent with molecular clouds and dense filaments dynam-ically formed by colliding flows of HI gas (e.g. Schneider et al.

2 Q. Nguyen Lu’o’ng et al.: Massive star formation in G035.39–00.33, a mini-starburst event
2010a; Nguyen Luong et al. 2011). Cold and dense filamentary
Fig. 1. The three-colour image built fromHerschel images withred= 250µm, green=160µm, and blue=70µm. The bright dif-fuse emission on the right corresponds to the Galactic plane.H II regions are prominent blue loops/bubbles, while earlier stagestar-forming sites are red filaments.
structures in molecular clouds are potential sites to find the pre-cursors of high-mass stars. One such example are Infrared darkclouds (IRDCs), which are dark extinction features againsttheGalactic background at mid-IR wavelengths. They have ratherhigh column densities (>1022 cm−2), cold temperatures (<20 K),and filamentary structures (e.g. Peretto & Fuller 2010), bearingresemblances to the swept-up gas features in the simulationsof colliding atomic gas (e.g. Heitsch et al. 2009; Banerjee et al.2009).
The IRDC G035.39–00.33 (also called G035.49-00.30) isan IRDC filament located in the W48 molecular complex at adistance of∼3 kpc (Rygl et al. 2010). Using13CO emission,Simon et al. (2006) estimate that the filament has a mass of∼9000M⊙ in an area with an effective radius of∼10 pc and a me-dian column density of 1×1022 cm−2. Jimenez-Serra et al. (2010)observed that extended SiO emission is associated with thisfila-ment, which they interpreted as being produced by low-velocityshocks associated with colliding gas flows and/or shocks fromprotostellar outflows. Here we useHerschel data to investi-gate the star formation activity in G035.39–00.33 and determinewhether any of the SiO emission could be associated with con-verging flows.
2. Herschel observations and ancillary data
The entire W48 molecular complex was observed on 18 and19 September 2010 using PACS (Poglitsch et al. 2010) at70/160µm and SPIRE (Griffin et al. 2010) at 250/350/500µmin the parallel scan-map mode with a scanning speed of 20′′/s.Two perpendicular scans were taken to cover a SPIRE/PACScommon area of 2.5◦ x 2.5◦. The data were reduced in twosteps. The raw data (level-0) of the individual scans from both
PACS and SPIRE were calibrated and deglitched using HIPE2
pipeline version 7.0. The SPIRE and PACS level-1 data werethen fed to version 4 of the Scanamorphos software package3
(Roussel 2011, submitted), which subtracts brightness driftsby exploiting the redundancy of observed points on the sky,masks remaining glitches, and produces maps. The final imageshave angular resolutions of∼6′′, 12′′, 18′′, 25′′, and 37′′ and1σ rms of 0.02 Jy/1.4′′-pixel, 0.08 Jy/2.8′′-pixel, 1 Jy/beam,1.1 Jy/beam, and 1.2 Jy/beam for 70µm, 160µm, 250µm,350µm, and 500µm, respectively. AllHerschel images wereconverted to MJy/sr by multiplying the aforementioned mapsby 21706, 5237, 115, 60, and 27 for 70µm, 160µm, 250µm,350µm, and 500µm, respectively. The final maps of W48 areshown as a three-colour image in Fig. 1 and individual imagesinFigs. 9a-e.
To complement the spectral energy distributions (SEDs)of young stellar objects, we have usedSpitzer data at 3.6,8, and 24µm (from the GLIMPSE and MIPSGAL surveys;Benjamin et al. 2003, Carey et al. 2009)4, LABOCA data at870 µm (from the ATLASGAL survey; Schuller et al. 2009)5,and BOLOCAM data at 1.1 mm (from the BGPS survey;Bally et al. 2010)6. We note that we used the images but not thecompact source catalogues produced by these surveys since weextracted sources using a new algorithm simultaneously on allten images (see Sect. 4.1).
In the present study, we did not apply colour corrections forPACS, SPIRE, or ancillary data. These flux corrections wouldbe rather small (<10% in the case ofHerschel) and are coveredby the 30% absolute calibration uncertainty we use when fittingSEDs (see Sect. 4.3).
3. The G035.39–00.33 ridge characterized byHerschel
W48 is a massive molecular cloud complex (8×10⁵ M⊙ that hasbeen identified in the extinction map of Bontemps et al. in prep.)located slightly south of the Galactic plane. The numerous HII regions (see Fig. 1) indicate that this region has actively formedhigh-mass stars. Figure 1 also clearly displays future (high-mass) star-forming sites, such as the cold and dense filamentIRDC G035.39–00.33, which is a prominent elongated struc-ture oriented north-south in theHerschel maps (see Figs. 2a-d).This site appears as a dark feature fromHerschel 70µm down toSpitzer 3.6µm, and in emission from 160µm upward.
Prior to deriving any physical parameters, we added zero off-sets, which were determined from the correlation withPlanckandIRAS data following the procedure of Bernard et al. (2010).
2 HIPE is a joint development software by the Herschel ScienceGround Segment Consortium, consisting of ESA, the NASA HerschelScience Center, and the HIFI, PACS, and SPIRE consortia.
3 http://www2.iap.fr/users/roussel/herschel/4 The Galactic Legacy Infrared Mid-Plane Survey Extraordinaire
(GLIMPSE) and the Multiband Imaging Photometer forSpitzerGALactic plane survey (MIPSGAL) provide 3.6− 24µm images of theinner Galactic plane with 1.5′′ − 18′′ resolutions. Detailed informationand reduced images are available athttp://www.astro.wisc.edu/sirtf/ andhttp://mipsgal.ipac.caltech.edu/
5 The APEX Telescope Large Area Survey of the GALaxy(ATLASGAL) provides 870µm images of the inner Galactic planewith 19′′ resolution. Reduced images will soon be available athttp://www.mpifr-bonn.mpg.de/div/atlasgal/index.html
6 The BOLOCAM Galactic Plane Survey (BGPS) provides 1.1 mmimages of the inner Galactic plane with 33′′ resolution. Reduced imagesare available athttp://irsa.ipac.caltech.edu/data/BOLOCAM GPS/
Q. Nguyen Lu’o’ng et al.: Massive star formation in G035.39–00.33, a mini-starburst event 3
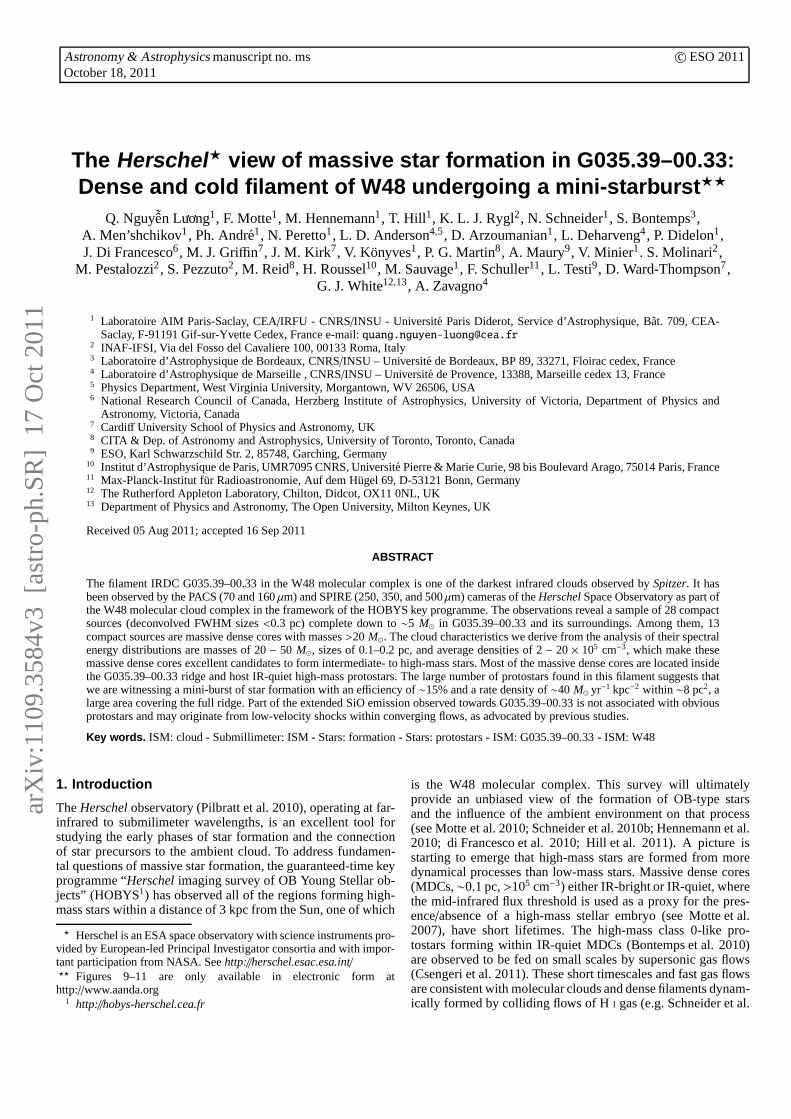
Fig. 2. (a) PACS 70µm image of the G035.39–00.33 filament; (b) PACS 70µm image of the G035.39–00.33 filament and itssurroundings; (c) SPIRE 250µm image of the G035.39–00.33 filament and its surroundings; (d) Temperature (colour) and columndensity (contours from 1.5 to 9 by 1.5 × 1022 cm−2) images. The dense cores with mass>20 M⊙ are indicated by black ellipses,those with mass<20 M⊙ by white ellipses. The elliptical sizes represent theFWHM sizes at 160µm. The extent of the IRDC(>3 × 1022 cm−2) is indicated by a white polygon inb-d.
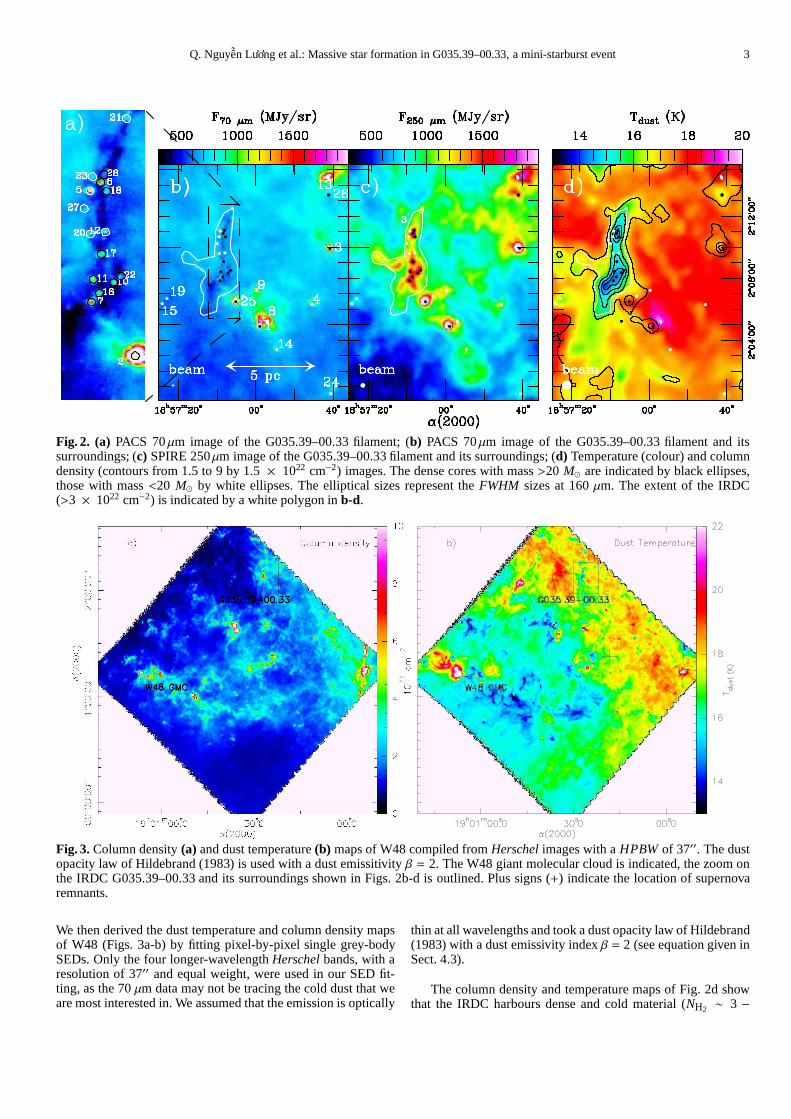
Fig. 3.Column density(a) and dust temperature(b) maps of W48 compiled fromHerschel images with aHPBW of 37′′. The dustopacity law of Hildebrand (1983) is used with a dust emissitivity β = 2. The W48 giant molecular cloud is indicated, the zoom onthe IRDC G035.39–00.33 and its surroundings shown in Figs. 2b-d is outlined. Plus signs (+) indicate the location of supernovaremnants.
We then derived the dust temperature and column density mapsof W48 (Figs. 3a-b) by fitting pixel-by-pixel single grey-bodySEDs. Only the four longer-wavelengthHerschel bands, with aresolution of 37′′ and equal weight, were used in our SED fit-ting, as the 70µm data may not be tracing the cold dust that weare most interested in. We assumed that the emission is optically
thin at all wavelengths and took a dust opacity law of Hildebrand(1983) with a dust emissivity indexβ = 2 (see equation given inSect. 4.3).
The column density and temperature maps of Fig. 2d showthat the IRDC harbours dense and cold material (NH2 ∼ 3 −
4 Q. Nguyen Lu’o’ng et al.: Massive star formation in G035.39–00.33, a mini-starburst event
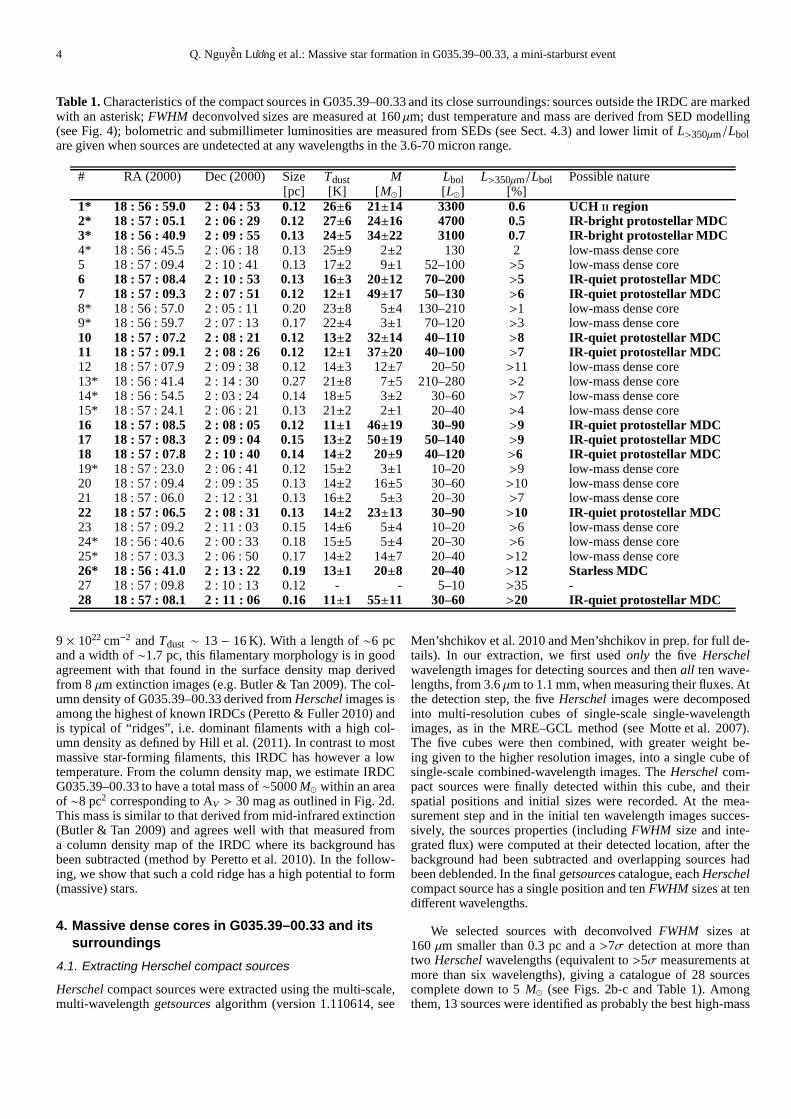
Table 1.Characteristics of the compact sources in G035.39–00.33 and its close surroundings: sources outside the IRDC are markedwith an asterisk;FWHM deconvolved sizes are measured at 160µm; dust temperature and mass are derived from SED modelling(see Fig. 4); bolometric and submillimeter luminosities are measured from SEDs (see Sect. 4.3) and lower limit ofL>350µm/Lbolare given when sources are undetected at any wavelengths in the 3.6-70 micron range.
# RA (2000) Dec (2000) Size Tdust M Lbol L>350µm/Lbol Possible nature[pc] [K] [ M⊙] [ L⊙] [%]
1* 18 : 56 : 59.0 2 : 04 : 53 0.12 26±6 21±14 3300 0.6 UCHII region2* 18 : 57 : 05.1 2 : 06 : 29 0.12 27±6 24±16 4700 0.5 IR-bright protostellar MDC3* 18 : 56 : 40.9 2 : 09 : 55 0.13 24±5 34±22 3100 0.7 IR-bright protostellar MDC4* 18 : 56 : 45.5 2 : 06 : 18 0.13 25±9 2±2 130 2 low-mass dense core5 18 : 57 : 09.4 2 : 10 : 41 0.13 17±2 9±1 52–100 >5 low-mass dense core6 18 : 57 : 08.4 2 : 10 : 53 0.13 16±3 20±12 70–200 >5 IR-quiet protostellar MDC7 18 : 57 : 09.3 2 : 07 : 51 0.12 12±1 49±17 50–130 >6 IR-quiet protostellar MDC8* 18 : 56 : 57.0 2 : 05 : 11 0.20 23±8 5±4 130–210 >1 low-mass dense core9* 18 : 56 : 59.7 2 : 07 : 13 0.17 22±4 3±1 70–120 >3 low-mass dense core10 18 : 57 : 07.2 2 : 08 : 21 0.12 13±2 32±14 40–110 >8 IR-quiet protostellar MDC11 18 : 57 : 09.1 2 : 08 : 26 0.12 12±1 37±20 40–100 >7 IR-quiet protostellar MDC12 18 : 57 : 07.9 2 : 09 : 38 0.12 14±3 12±7 20–50 >11 low-mass dense core13* 18 : 56 : 41.4 2 : 14 : 30 0.27 21±8 7±5 210–280 >2 low-mass dense core14* 18 : 56 : 54.5 2 : 03 : 24 0.14 18±5 3±2 30–60 >7 low-mass dense core15* 18 : 57 : 24.1 2 : 06 : 21 0.13 21±2 2±1 20–40 >4 low-mass dense core16 18 : 57 : 08.5 2 : 08 : 05 0.12 11±1 46±19 30–90 >9 IR-quiet protostellar MDC17 18 : 57 : 08.3 2 : 09 : 04 0.15 13±2 50±19 50–140 >9 IR-quiet protostellar MDC18 18 : 57 : 07.8 2 : 10 : 40 0.14 14±2 20±9 40–120 >6 IR-quiet protostellar MDC19* 18 : 57 : 23.0 2 : 06 : 41 0.12 15±2 3±1 10–20 >9 low-mass dense core20 18 : 57 : 09.4 2 : 09 : 35 0.13 14±2 16±5 30–60 >10 low-mass dense core21 18 : 57 : 06.0 2 : 12 : 31 0.13 16±2 5±3 20–30 >7 low-mass dense core22 18 : 57 : 06.5 2 : 08 : 31 0.13 14±2 23±13 30–90 >10 IR-quiet protostellar MDC23 18 : 57 : 09.2 2 : 11 : 03 0.15 14±6 5±4 10–20 >6 low-mass dense core24* 18 : 56 : 40.6 2 : 00 : 33 0.18 15±5 5±4 20–30 >6 low-mass dense core25* 18 : 57 : 03.3 2 : 06 : 50 0.17 14±2 14±7 20–40 >12 low-mass dense core26* 18 : 56 : 41.0 2 : 13 : 22 0.19 13±1 20±8 20–40 >12 Starless MDC27 18 : 57 : 09.8 2 : 10 : 13 0.12 - - 5–10 >35 -28 18 : 57 : 08.1 2 : 11 : 06 0.16 11±1 55±11 30–60 >20 IR-quiet protostellar MDC
9 × 1022 cm−2 andTdust ∼ 13− 16 K). With a length of∼6 pcand a width of∼1.7 pc, this filamentary morphology is in goodagreement with that found in the surface density map derivedfrom 8µm extinction images (e.g. Butler & Tan 2009). The col-umn density of G035.39–00.33 derived fromHerschel images isamong the highest of known IRDCs (Peretto & Fuller 2010) andis typical of “ridges”, i.e. dominant filaments with a high col-umn density as defined by Hill et al. (2011). In contrast to mostmassive star-forming filaments, this IRDC has however a lowtemperature. From the column density map, we estimate IRDCG035.39–00.33 to have a total mass of∼5000M⊙ within an areaof ∼8 pc2 corresponding to AV > 30 mag as outlined in Fig. 2d.This mass is similar to that derived from mid-infrared extinction(Butler & Tan 2009) and agrees well with that measured froma column density map of the IRDC where its background hasbeen subtracted (method by Peretto et al. 2010). In the follow-ing, we show that such a cold ridge has a high potential to form(massive) stars.
4. Massive dense cores in G035.39–00.33 and itssurroundings
4.1. Extracting Herschel compact sources
Herschel compact sources were extracted using the multi-scale,multi-wavelengthgetsourcesalgorithm (version 1.110614, see
Men’shchikov et al. 2010 and Men’shchikov in prep. for full de-tails). In our extraction, we first usedonly the five Herschelwavelength images for detecting sources and thenall ten wave-lengths, from 3.6µm to 1.1 mm, when measuring their fluxes. Atthe detection step, the fiveHerschel images were decomposedinto multi-resolution cubes of single-scale single-wavelengthimages, as in the MRE–GCL method (see Motte et al. 2007).The five cubes were then combined, with greater weight be-ing given to the higher resolution images, into a single cubeofsingle-scale combined-wavelength images. TheHerschel com-pact sources were finally detected within this cube, and theirspatial positions and initial sizes were recorded. At the mea-surement step and in the initial ten wavelength images succes-sively, the sources properties (includingFWHM size and inte-grated flux) were computed at their detected location, afterthebackground had been subtracted and overlapping sources hadbeen deblended. In the finalgetsourcescatalogue, eachHerschelcompact source has a single position and tenFWHM sizes at tendifferent wavelengths.
We selected sources with deconvolvedFWHM sizes at160µm smaller than 0.3 pc and a>7σ detection at more thantwo Herschel wavelengths (equivalent to>5σ measurements atmore than six wavelengths), giving a catalogue of 28 sourcescomplete down to 5M⊙ (see Figs. 2b-c and Table 1). Amongthem, 13 sources were identified as probably the best high-mass
Q. Nguyen Lu’o’ng et al.: Massive star formation in G035.39–00.33, a mini-starburst event 5
star precursor candidates (M > 20 M⊙), which we refer toas massive dense cores. We consider these 28 sources as robustsources because 92% of them were also identified by thecutexandcsar algorithms (Molinari et al. 2011; Kirk in prep.).
The sources studied here and more generally by the HOBYSkey programme are cloud fragments that are strongly centrallyconcentrated but do not have firm outer boundaries when stud-ied from subparcsec to parcsec scales. Their inner part can befitted by a Gaussian with a∼0.1 pcFWHM size (e.g. Motte et al.2007), which can only be resolved by the PACS cameras at the0.7 − 3 kpc distances of HOBYS molecular cloud complexes.From submillimeter observations, these MDCs have been foundto be quasi-spherical sources with a radial density distributionvery close to theρ(r) ∝ r−2 law for r ∼ 0.1 − 1 pc (e.g.Beuther et al. 2002; Mueller et al. 2002). This density powerlawand thus a mass radial power-law ofM(< r) ∝ r are theoreti-cally expected for dense cores formed by their own gravity, fromsingular isothermal spheres (Shu 1977) to protocluster clumps(Adams 2000). For optically thin dust emission and a weak tem-perature gradient (T (r) ∝ r−q with q = 0 for starless or IR-quietMDCs andq = 0.4 for IR-bright MDCs), one expects the fluxesintegrated within the apertures to vary (close to) linearlywith theangular radius:F(< θ) ∝ θ for IR-quiet protostellar dense coresandF(< θ) ∝ θ0.6 for IR-bright protostellar dense cores (see e.g.Motte & Andre 2001 for more details in the case of protostellarenvelopes). We thus expect that the deconvolved sizes and in-tegrated fluxes of the dense cores extracted here vary with thebeam size and in practice increase from 160 to 500µm, in linewith the increase by a factor of>3 in theHerschel HPBW. Thisbehaviour is indeed observed here (see Table 2), which we stressis independent of the compact source extraction technique usedbecause it has also been observed for sources extracted by theMRE–GCL (Motte et al. 2010) and the Cutex (Giannini et al.submitted) algorithms.
Table 2. Scaled fluxes and quality of SED fits for the catalogueof Table. 1
Wavelength [µm] 160 250 350 500HPBW [′′] 12 18 25 37< FWHMdec
λ> [pc]a 0.18 0.30 0.40 0.60
FscaledForiginal
b- 53% 39% 27%
∣
∣
∣
∣
∣
Foriginal−Foriginal,GB
∣
∣
∣
∣
∣
Foriginal,GB
c
- 90% 220% 510%∣
∣
∣
∣Fscaled−Fscaled,GB
∣
∣
∣
∣
Fscaled,GB
d
- 15% 20% 60%
Notes:(a): The deconvolved FWHM sizes at wavelengthλ werecalculated from the average FWHM sizes measured bygetsourcesand the beam sizes asFWHMdec
λ=√
< FWHMλ >2 −HPBW2
(b): Foriginal andFscaledare the original and scaled fluxes.(c): Foriginal,GB is the grey-body flux fitted to the original fluxes.(d): Fscaled,GBis the grey-body flux fitted to the scaled fluxes.
4.2. Scaling Herschel fluxes for compiling SEDs
To limit the influence of differentHerschel resolutions and re-strict ourselves entirely to the MDCs/dense cores size (∼0.1 pc),we followed the procedure introduced by Motte et al. (2010).
We kept the PACS 70 and 160µm fluxes unchanged and linearlyscaled the SPIRE 250, 350, and 500µm fluxes to the source sizemeasured at 160µm. This process assumes that (1) the size mea-sured at 160µm reflects the spatial scale of the dense cores; (2)the 250, 350, and 500µm emission are mainly optically thin;and (3) theF(<θ) ∝ θ relation mentioned in Sect. 4.1 applies.In contrast to the≥160µm emission, compact 70µm emissionoriginates from hot dust close to the protostar and does not tracethe cold component of a dense core. The relationF(<θ) ∝ θis correct if the density and temperature power laws mentionedabove apply to a large portion of the dense cores, roughly fromhalf the resolution at 160µm to the resolution at 500µm, i.e.from 0.02-0.09 pc to 0.1-0.6 pc depending on the cloud distance.However it does not preclude the subfragmentation, inner den-sity flattening, and/or inner heating of the (massive) dense cores.As explained in Sect. 4.1, these are reasonable assumptionsforMDCs. In contrast, if an HII region develops, the density andtemperature structures of its parent dense core will probably bestrongly modified and such a scaling cannot apply. TheHerschelfluxes (and other submillimeter measurements here) are scaledfollowing the simple equation
FSEDλ = Fλ ×
FWHMdec160
FWHMdecλ
, (1)
whereFλ andFWHMdecλ
are the measured flux and deconvolvedFWHM size at wavelengthsλ ≥ 250µm. For simplicity andbecause their characteristics do not impact our discussion, wekept a linear scaling for IR-bright MDCs #1, #2, and #3.
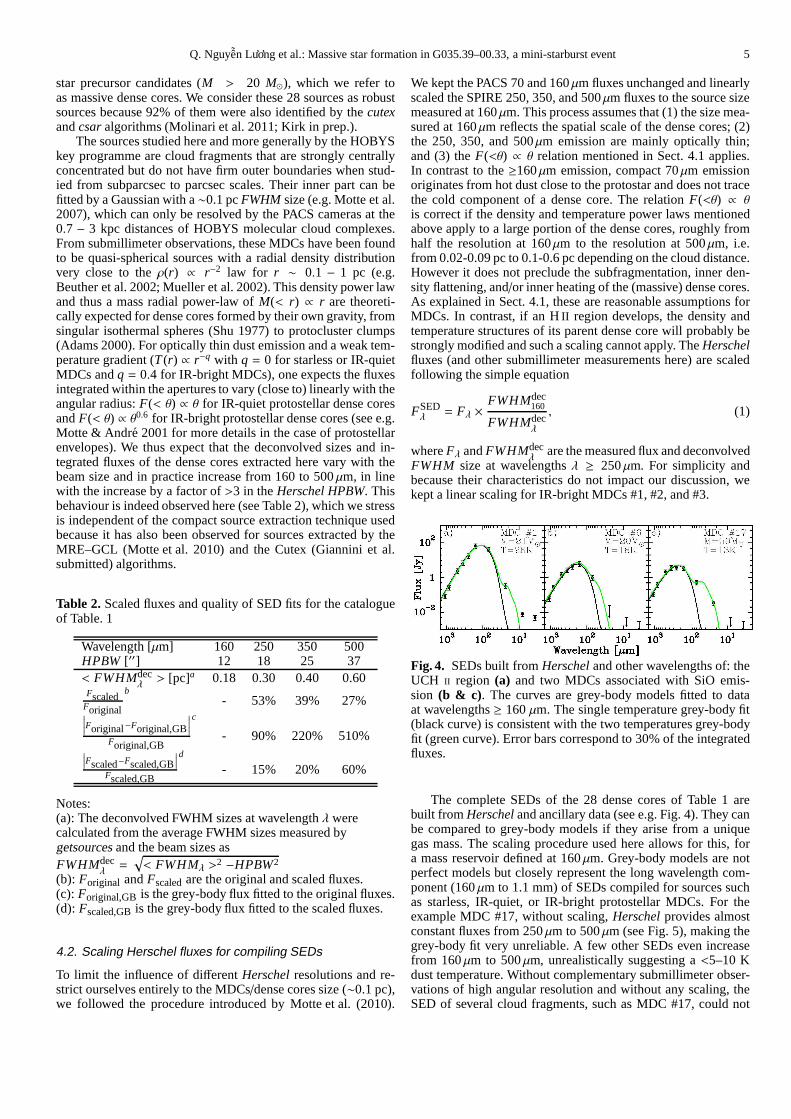
Fig. 4. SEDs built fromHerschel and other wavelengths of: theUCH II region (a) and two MDCs associated with SiO emis-sion (b & c) . The curves are grey-body models fitted to dataat wavelengths≥ 160µm. The single temperature grey-body fit(black curve) is consistent with the two temperatures grey-bodyfit (green curve). Error bars correspond to 30% of the integratedfluxes.
The complete SEDs of the 28 dense cores of Table 1 arebuilt from Herschel and ancillary data (see e.g. Fig. 4). They canbe compared to grey-body models if they arise from a uniquegas mass. The scaling procedure used here allows for this, fora mass reservoir defined at 160µm. Grey-body models are notperfect models but closely represent the long wavelength com-ponent (160µm to 1.1 mm) of SEDs compiled for sources suchas starless, IR-quiet, or IR-bright protostellar MDCs. Fortheexample MDC #17, without scaling,Herschel provides almostconstant fluxes from 250µm to 500µm (see Fig. 5), making thegrey-body fit very unreliable. A few other SEDs even increasefrom 160µm to 500µm, unrealistically suggesting a<5–10 Kdust temperature. Without complementary submillimeter obser-vations of high angular resolution and without any scaling,theSED of several cloud fragments, such as MDC #17, could not

6 Q. Nguyen Lu’o’ng et al.: Massive star formation in G035.39–00.33, a mini-starburst event
Fig. 5. Example SED compiled from fluxes with (in black) andwithout (in red) scaling for MDC #17. The SED with scaledfluxes portrays a more classical behaviour for the Rayleigh-Jeanspart of the protostellar dense core.
be fit at all. As shown in Fig. 5, the scaled SPIRE fluxes por-tray a more classical behaviour for the Rayleigh-Jeans partofa protostellar dense core SED. As can be seen in Table 2, the250µm, 350µm, and 500µm fluxes are quantitatively lower butthese flux changes help to improve the SED fit by a grey-bodymodel. Indeed, the variations between the measuredHerschelfluxes and the fitted grey-body fluxes are∼5− 10 times larger inthe case of the original fluxes than for scaled fluxes (see Fig.6).
Fig. 6. The absolute value of the normalized difference betweenthe original fluxes with their best-fit grey-body fluxes (crosses)and between the scaled fluxes with their best-fit grey-body fluxes(circles).
After flux scaling, the dust temperatures obtained from thegrey-body models of sources within G035.39–00.33 are dis-tributed around<Tdust>∼ 14.5 K (see Fig. 7a). They are in closeragreement with those measured from the dust temperature im-age (∼16.5 K, see Fig. 2d and 7a) and are∼20% higher thanthose obtained from grey-body models for the original fluxes(∼11 K). Most dust temperatures derived from SED fits to theoriginal SPIRE fluxes are too cold. We do expect the temper-ature of compact cloud fragments to differ from that of theirsurrounding cloud and in practice to be lower if the protostel-lar dense cores are barely evolved as in IR-quiet massive densecores. However, a∼5 K drop in temperature is quite extremewhen averaged over only a three times smaller cloud fragment
and a<Tdust>∼ 11.3 K for MDCs is unusually cold. For in-stance, a temperature of∼20 K has been measured in Cygnus Xmassive dense cores from ammonia measurements andHerschelSEDs (Motte et al. 2007; Hennemann et al. in prep.).
Fig. 7. Dust temperature(a) and mass(b) distributions of the28 compact sources derived from fitting a grey-body model tothe original (in black) and scaled (in red) fluxes at wavelengthsλ ≥ 160µm. The green histogram is the temperature distributionof the filament IRDC G0.35.39-00.33 taken from Fig. 2d.
4.3. Deriving physical parameters for the compact sources
After scaling the fluxes, we compiled a SED and fit a singlegrey-body to the 160µm-1 mm wavelength data (see Figs. 4a-c and 11a-e) to derive the mass and the average dust tem-perature of each dense core. We assumed a dust opacity law
κλ = κ0 ×(
λ300 µm
)−βwith κ0 = 0.1 g cm2 and a dust emissiv-
ity index ofβ = 2. Our limited knowledge of the dust emissivitymakes masses systematically uncertain by a factor of∼2. Themass and dust temperature uncertainties quoted in Table 1 reflectthose of SED fits to fluxes varying by 30% with a constant emis-sivity. We successfully counterchecked our results obtained withsingle grey-body fits to the long wavelength (>160µm) compo-nent of SEDs by fitting two-temperature grey-body models tothe data (see Fig. 4).
We also derived the bolometric luminosityLbol and submil-limeter luminosityL>350µm by integrating fluxes below the mea-surement points i.e., from 3.6µm to 1.1 mm and from 350µm to1.1 mm, respectively. When sources were not detected at mid-infrared wavelengths, Table 1 gives a range of bolometric lumi-nosities using the 3.6, 8, and 24µm noise levels as upper limitsor setting them to 0.
Cloud fragments in our sample have masses ranging from1 M⊙ to∼50M⊙ with deconvolvedFWHM sizes at 160µm rang-ing from 0.1 to 0.3 pc and temperatures from 10 to 30 K. Themass of the gas reservoir selected at 160µm and measured bya grey-body fit is, on average, 40% that obtained from the SEDfit of original fluxes (see Fig. 7b). The shrinking, by a factorof∼2, of the mass reservoir arises from the decision to focus on thegas contained within the 160µm sizes, which are twice as smallas the mean sizes at the SED peak (generally close to 250µm).Without such a scaling, the present study would have consideredcloud fragments that are, on average, twice as massive but also∼8 times less dense. These fragments would thus not correspondas well to the typical scale and density of MDCs and would logi-cally have a less efficient transfer of matter from the clump gas tostar. For the reasons given in Sects. 4.1-4.2 and despite themodi-
Q. Nguyen Lu’o’ng et al.: Massive star formation in G035.39–00.33, a mini-starburst event 7
fications implied, we estimate that the rescaling of SPIRE fluxesis a necessary step in a simple SED fitting approach applied tolarge samples of compact sources.
5. Discussion
5.1. A burst of star formation activity
We have focused here on the 13 best high-mass star pre-cursor candidates, or MDCs, which are the most massive(M > 20 M⊙) and dense (FWHM averaged density of>2 × 105 cm−3) cloud fragments, and thus the most compact(FWHM < 0.19 pc). Several MDCs lie within the clumps identi-fied by Rathborne et al. (2006) at 1.3 mm, which are larger (0.2-0.9 pc) cloud structures.
The MDC #1 was classified as an Ultra-Compact HII
(UCH II) region based on its free-free emission at 1.4 and 5 GHz(Becker et al. 1994). The MDC #2 is an UCHII candidate ac-cording to the Red MSX Source survey (Mottram et al. 2011)but no centimeter free-free emission has yet been detected.Watermaser emission was detected towards MDC #2 (Chambers et al.2009). These two MDCs together with MDC #3 are the mostluminous MDCs in our sample, i.e,Lbol ∼ 3000− 5000 L⊙,while others haveLbol < 300L⊙. The high luminosity of MDCs#1, #2, and #3, their warm dust and high mass imply that theyare already evolved massive star-forming sites such as IR-brightMDCs (#2 and #3) or UCHIIs (#1). These three MDCs alsohave distinct 24µm fluxes (>1 Jy) compared to the remainingcores (<1 Jy). This flux limit is close to that used to define IR-quiet MDCs (see Motte et al. 2007 after distance correction).The separation based on 24µm fluxes is also consistent with theL>350µm/Lbol ratio, which is small (< 1%) for IR-bright MDCsor UCH II regions and large (> 1-20%) for IR-quiet MDCs har-bouring high-mass class 0s or for starless dense core candi-dates. Andre et al. (2000) used this ratio to separate low-massclass 0 and class I protostars (size∼ 0.01− 0.1 pc) with 1%as the dividing line. Since MDCs are larger-scale cloud struc-tures (∼ 0.1 pc), theL>350µm/Lbol ratio of IR-quiet MDCs is ex-pected to be substantially larger than those of low-mass class 0s.Among the remaining ten MDCs with low 24µm emission, one(MDC #26, outside the G035.39–00.33) is a good candidate star-less dense core since it has no emission at wavelengths shorterthan 70µm.
Interestingly, 55% (15) of the dense cores and 70% (9) ofthe MDCs are located inside the filament G035.39–00.33, whichhas a mass density of 600M⊙ pc−2 and a mass per unit lengthof 800 M⊙ pc−1. It is much higher than those of the highly ex-tincted regions (AV > 30 mag) of Perseus and Ophiuchus (seeHeiderman et al. 2010). This high concentration of (massive)dense cores indicates that the gravitational potential of G035.39–00.33 helped them to build up. From their SED, the MDCsin the G035.39–00.33 filament are IR-quiet protostellar densecores and thus harbour young protostars (see Table 1). Thispredominance of IR-quiet MDCs suggests that most of thesedense cores have been formed simultaneously and are probablyforming just following the formation of the filament. In agree-ment with the presence of an UCHII region and previous stud-ies (e.g. Motte et al. 2007; Russeil et al. 2010), we assumed a20− 40% mass transfer from MDC to stellar mass. We there-fore estimate that between four and nine of the MDCs (thosewith >20− 40 M⊙, see Table 1) would indeed form high-massstars in G035.39–00.33. With nine high-mass protostars form-ing in this 5000M⊙ filament and assuming the initial mass func-tion of Kroupa (2001), the star formation efficiency (SFE) could
be as high as∼15%. The numerous protostars (being detectedat 70µm) observed within the G035.39–00.33 filament (area of∼8 pc2) shown in Fig. 2a, are estimated to have a mean masson the main sequence of∼2 M⊙ (meaning that stars form in5− 50 M⊙ dense cores with 25% mass transfer efficiency) and alifetime of ∼105 yr, close to the dense-core free-fall time. Thisimplies a star formation rate (SFR) of∼300 M⊙ Myr−1, whichexceeds the mean SFR of Gould Belt clouds by a factor of seven(see Heiderman et al. 2010) and is close to that of the W43 mini-starburst region (Motte et al. 2003; Nguyen Luong et al. 2011).The SFR density within this∼8 pc2 high column-density (AV >30 mag) filament,ΣS FR ∼ 40 M⊙ yr−1 kpc−2, is high and hasonly been measured in Gould Belt dense clumps (10–100 timessmaller areas with Av>20–40 mag, see Heiderman et al. 2010;Maury et al. 2011) and in extragalactic circumnuclear starburstregions (e.g. Kennicutt 1998).
The measurements (SFE, SFR,ΣS FR) of this high star for-mation activity are uncertain by a factor>2, coming essentiallyfrom the uncertainty in the number of high-mass protostars andthe mass transfer efficiency from dense cores to stars (see above).In contrast, the flux scaling should have a relatively low influ-ence on our results. Indeed, without scaling, massive clumps aretwice as massive but would form stars of the same stellar masson the main sequence. Despite these limitations, the SFE, SFR,andΣS FR values above suggest that a mini-starburst event, i.e. aminiature model of events in starburst galaxies, is occurring inthis filament. To keep the SFE in the entire W48 complex con-sistent with those seen in other clouds (1-3% per 107 yrs, Silk1997) and reconcile the SFE and SFR values given above, thestar formation event should be short (∼106 yr). If confirmed, thismini-burst of recent star formation would be consistent with thefilament G035.39–00.33 being formed through a rapid processsuch as converging flows. Another interpretation could be thatstar formation has recently been triggered, but a nearby trigger-ing source has not been found.
5.2. Are protostars responsible for the SiO emission?
Jimenez-Serra et al. (2010) mapped the filament G035.39–00.33in SiO (2–1) (HPBW≃ 28′′, see Fig. 8) finding 0.01 −0.05 K km s−1 widespread emission along part of this filament.They proposed that it could be produced by low-velocity shocksassociated with converging flows and/or outflows from proto-stars. SiO is indeed an excellent tracer of shocked gas associ-ated with molecular outflows (e.g. Schilke et al. 1997) and isparticularly prevalent towards early-stage high-mass protostars(e.g. Hatchell et al. 2001; Motte et al. 2007). It has also beenproposed that low-velocity shocks in a high-density mediumcould sputter dust grains and enhance SiO in the gas phase(Lesaffre, P., Gusdorf, A. priv. comm.).
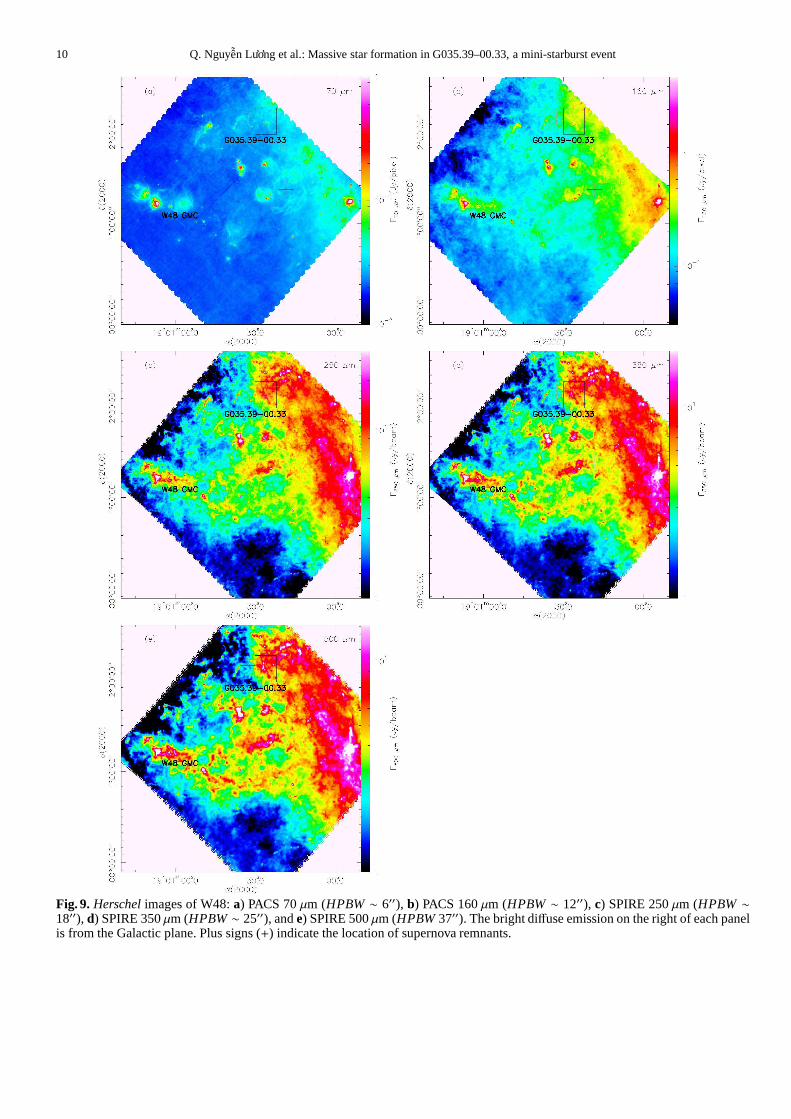
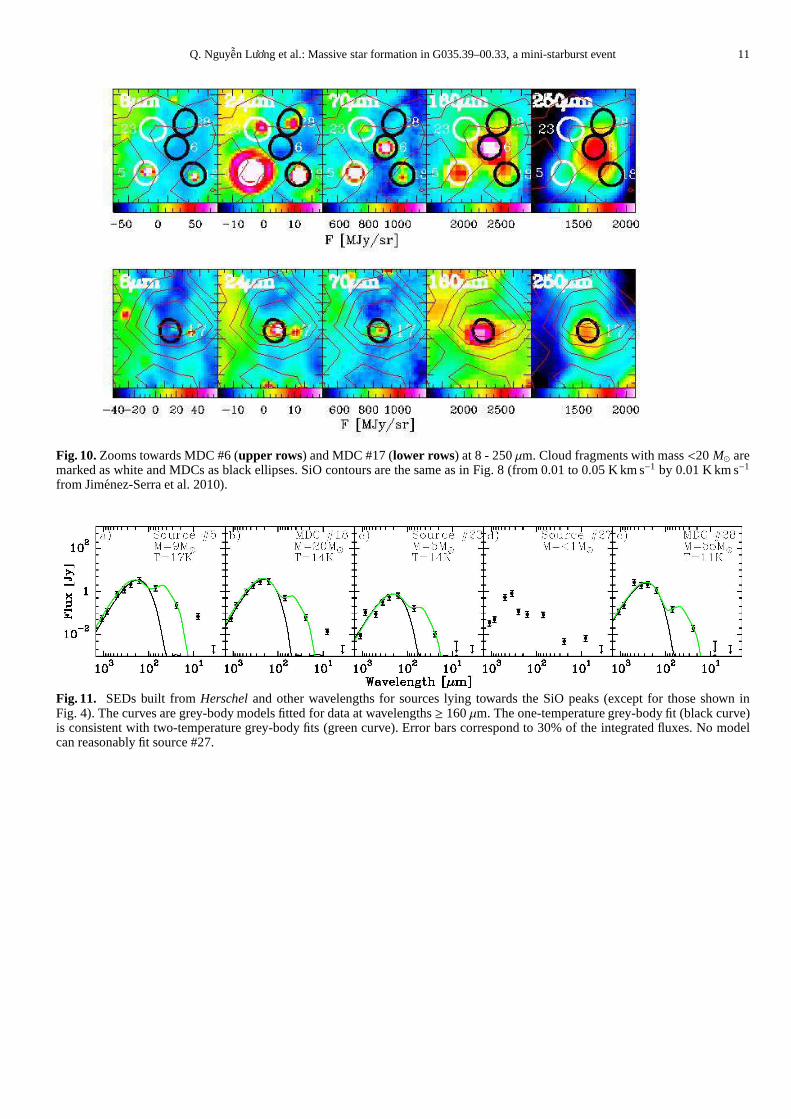
We investigated the origin of this SiO emission by correlat-ing its spatial distribution with that of young protostars detectedby Herschel (see Sect. 5.1 and Table 1). Two of the three peaksof SiO (North and South) coincide with IR-quiet massive densecores: MDCs #6 and #17 (see Figs. 8 and 10). Given that theSED of MDC #17 displays a dominating cold and massive enve-lope and a warm component detected withSpitzer (see Fig. 4c),it most probably hosts an early-stage high-mass protostar.TheMDC #6 is not detected at wavelengths shorter than 24µm (seeFig. 4b) but its compact 70µm emission is three times that of theflux predicted by the grey-body model that fits its cold envelope.This MDC also coincides with a 40′′-beam water maser source(Rygl et al. 2010) suggesting that it harbours an intermediate-or high-mass protostar. The SiO emission at these two positions

8 Q. Nguyen Lu’o’ng et al.: Massive star formation in G035.39–00.33, a mini-starburst event
Fig. 8. (a) Part of G035.39–00.33 seen at 70µm (colour) and inSiO (contours from 0.01 to 0.05 K·km s−1 by 0.01 K km s−1 fromJimenez-Serra et al. 2010). The dense cores with mass>20 M⊙are indicated by red ellipses, those with mass<20 M⊙ bywhite ellipses. (b) Zoom towards source #27 seen at 8–160µm.Red and black boxes indicate the 8µm–only and 24µm–onlysources, respectively.
could easily originate from shocks within protostellar outflowsbecause they are comparable to the weakest ones associated withIR-quiet MDCs in Cygnus X (Motte et al. 2007 after distancecorrection).
In contrast, the eastern SiO peak, although detected inSiO (2–1) at∼0.04 K km s−1, does not coincide with any reliableprotostar candidate. Source #27, which lies within the SiO beam,is only detected shortwards of 160µm (see Fig. 8b). A specificrun of getsources, allowing low-reliability measurements (a 3σdetection at a single Herschel wavelength), has in fact beendoneat the location of the eastern SiO peak to extract source #27.The SED of this source (see Fig. 11d) consists of two unrelatedcomponents: one mid-IR source of unknown nature detectedat 8, 24, and 70µm plus some nearby cloud structure whose160 µm-1.1 mm emission extends until the location of source#27. Re-examining theHerschel andSpitzer images, we estimatethat source #27 could be at most a 1M⊙ dense core containingan evolved low-mass class I protostar. Since SiO outflows areknown to be rare and confined to the proximity of intermediate-mass class 0 and high-mass protostars (e.g. Martin-Pintadoet al.1997; Gueth et al. 1998; Motte et al. 2007), there is only a lowprobability that such a protostar could drive a strong-enoughoutflow to be responsible for the SiO emission of the easternpeak. Two other sources observed within the SiO beam are onlydetected at 8µm or 24µm and are thus probably even more
evolved young stellar objects or variations in the backgroundemission. Outflows from neighbouring low- to high-mass pro-tostars,>0.7 pc away from the eastern SiO peak, would alsobe unable to create such a SiO emission. Indeed, the extremeSiO outflow arising from the intermediate-mass star L1157 hasemission peaks that are at less than 0.2 pc from the protostar(Gueth et al. 1998). The protostars here are unlikely to be ex-treme and less confined.
Since no definite protostar is detected byHerschel towardsthe eastern SiO peak, the interpretation that the SiO emissioncould partly originate from large-scale converging-flows maybe valid, at least at this location. Higher-resolution and higher-sensitivity observations would be necessary to definitively reachthis conclusion. Further studies of the SiO emission and itsrela-tion to other high-density gas tracers, as well as the dust proper-ties, will be presented by Henshaw et al. (in prep).
6. Conclusion
We have used PACS and SPIRE maps ofHerschel to investigatethe star formation activity in the IRDC G035.39–00.33, a cold(13−16 K) and dense (NH2 up to 9×1022 cm−2) filament, whichwe have qualified as a “ridge”. We have proposed a new ap-proach to analysing the SED of compact sources compiled fromHerschel fluxes. We fitted single grey-body models to fluxesthat had been linearly scaled downwards to correspond moreclosely to the mass reservoir emitting at 160µm, the wavelengthat which emission from the cold envelope of compact source isprobed with highest angular resolution. On the basis of thispro-cedure, we have found thatHerschel detected a total of 28 densecores (FWHM∼0.15 pc), among them 13 MDCs with masses of20–50M⊙ and densities of 2–20×105 cm−3, which are poten-tially forming high-mass stars. Given their concentrationin theIRDC G035.39–00.33, they may be participating in a mini-burstof star formation activity withSFE∼ 15%,SFR∼ 300M⊙Myr−1,andΣS FR ∼ 40 M⊙ yr−1 kpc−2. Two IR-quiet MDCs could be theorigin of most of the extended SiO emission observed, the re-mainder possibly originating from a low-velocity shock withinconverging flows.
Acknowledgements. SPIRE has been developed by a consortiumof insti-tutes led by Cardiff Univ. (UK) and including Univ. Lethbridge (Canada);NAOC (China); CEA, LAM (France); IFSI, Univ. Padua (Italy);IAC (Spain);Stockholm Observatory (Sweden); Imperial College London,RAL, UCL-MSSL, UKATC, Univ. Sussex (UK); Caltech, JPL, NHSC, Univ. colourado(USA). This development has been supported by national funding agencies: CSA(Canada); NAOC (China); CEA, CNES, CNRS (France); ASI (Italy); MCINN(Spain); SNSB (Sweden); STFC (UK); and NASA (USA).PACS has been developed by a consortium of institutes led by MPE (Germany)and including UVIE (Austria); KU Leuven, CSL, IMEC (Belgium); CEA,LAM (France); MPIA (Germany); INAF-IFSI/OAA/OAP/OAT, LENS, SISSA(Italy); IAC (Spain). This development has been supported by the funding agen-cies BMVIT (Austria), ESA-PRODEX (Belgium), CEA/CNES (France), DLR(Germany), ASI/INAF (Italy), and CICYT/MCYT (Spain).Part of this work was supported by the ANR (Agence Nationale pour laRecherche) project “PROBeS”, number ANR-08-BLAN-0241. Tracey Hill issupported by a CEA/Marie-Curie Eurotalents Fellowship. Kazi Rygl is sup-ported by an ASI fellowship under contract number I/005/07/1. We thankIzaskun Jimenez-Serra for providing the SiO image. We thank the anonymousreferee, whose comments contributed to improve the manuscript.
ReferencesAdams, F. C. 2000, ApJ, 542, 964Andre, P., Ward-Thompson, D., & Barsony, M. 2000, Protostars and Planets IV,
59Bally, J., Aguirre, J., Battersby, C., et al. 2010, ApJ, 721,137Banerjee, R., Vazquez-Semadeni, E., Hennebelle, P., & Klessen, R. S. 2009,
MNRAS, 398, 1082

Q. Nguyen Lu’o’ng et al.: Massive star formation in G035.39–00.33, a mini-starburst event 9
Becker, R. H., White, R. L., Helfand, D. J., & Zoonematkermani, S. 1994, ApJS,91, 347
Benjamin, R. A., Churchwell, E., Babler, B. L., et al. 2003, PASP, 115, 953Bernard, J.-P., Paradis, D., Marshall, D. J., et al. 2010, A&A, 518, L88+Beuther, H., Schilke, P., Menten, K. M., et al. 2002, ApJ, 566, 945Bontemps, S., Motte, F., Csengeri, T., & Schneider, N. 2010,A&A, 524, A18+Butler, M. J. & Tan, J. C. 2009, ApJ, 696, 484Carey, S. J., Noriega-Crespo, A., Mizuno, D. R., et al. 2009,PASP, 121, 76Chambers, E. T., Jackson, J. M., Rathborne, J. M., & Simon, R.2009, ApJS, 181,
360Csengeri, T., Bontemps, S., Schneider, N., Motte, F., & Dib,S. 2011, A&A, 527,
A135+di Francesco, J., Sadavoy, S., Motte, F., et al. 2010, A&A, 518, L91+Griffin, M. J., Abergel, A., Abreu, A., et al. 2010, A&A, 518, L3+Gueth, F., Guilloteau, S., & Bachiller, R. 1998, A&A, 333, 287Hatchell, J., Fuller, G. A., & Millar, T. J. 2001, A&A, 372, 281Heiderman, A., Evans, II, N. J., Allen, L. E., Huard, T., & Heyer, M. 2010, ApJ,
723, 1019Heitsch, F., Ballesteros-Paredes, J., & Hartmann, L. 2009,ApJ, 704, 1735Hennemann, M., Motte, F., Bontemps, S., et al. 2010, A&A, 518, L84+Hildebrand, R. H. 1983, QJRAS, 24, 267Hill, T., Motte, F., Didelon, P., et al. 2011, A&A, 533, A94+Jimenez-Serra, I., Caselli, P., Tan, J. C., et al. 2010, MNRAS, 406, 187Kennicutt, Jr., R. C. 1998, ApJ, 498, 541Kroupa, P. 2001, MNRAS, 322, 231Martin-Pintado, J., de Vicente, P., Fuente, A., & Planesas,P. 1997, ApJ, 482,
L45+Maury, A., Andre, P., Men’shchikov, A., Konyves, V., & Bontemps, S. 2011,
ArXiv e-printsMen’shchikov, A., Andre, P., Didelon, P., et al. 2010, A&A,518, L103+Molinari, S., Schisano, E., Faustini, F., et al. 2011, A&A, 530, A133+Motte, F. & Andre, P. 2001, A&A, 365, 440Motte, F., Bontemps, S., Schilke, P., et al. 2007, A&A, 476, 1243Motte, F., Schilke, P., & Lis, D. C. 2003, ApJ, 582, 277Motte, F., Zavagno, A., Bontemps, S., et al. 2010, A&A, 518, L77+Mottram, J. C., Hoare, M. G., Urquhart, J. S., et al. 2011, A&A, 525, A149+Mueller, K. E., Shirley, Y. L., Evans, II, N. J., & Jacobson, H. R. 2002, ApJS,
143, 469Nguyen Luong, Q., Motte, F., Schuller, F., et al. 2011, A&A, 529, A41+Peretto, N. & Fuller, G. A. 2010, ApJ, 723, 555Peretto, N., Fuller, G. A., Plume, R., et al. 2010, A&A, 518, L98+Pilbratt, G. L., Riedinger, J. R., Passvogel, T., et al. 2010, A&A, 518, L1+Poglitsch, A., Waelkens, C., Geis, N., et al. 2010, A&A, 518,L2+Rathborne, J. M., Jackson, J. M., & Simon, R. 2006, ApJ, 641, 389Russeil, D., Zavagno, A., Motte, F., et al. 2010, A&A, 515, A55+Rygl, K. L. J., Wyrowski, F., Schuller, F., & Menten, K. M. 2010, A&A, 515,
A42+Schilke, P., Walmsley, C. M., Pineau des Forets, G., & Flower, D. R. 1997, A&A,
321, 293Schneider, N., Csengeri, T., Bontemps, S., et al. 2010a, ArXiv e-printsSchneider, N., Motte, F., Bontemps, S., et al. 2010b, A&A, 518, L83+Schuller, F., Menten, K. M., Contreras, Y., et al. 2009, A&A,504, 415Shu, F. H. 1977, ApJ, 214, 488Silk, J. 1997, ApJ, 481, 703Simon, R., Rathborne, J. M., Shah, R. Y., Jackson, J. M., & Chambers, E. T.
2006, ApJ, 653, 1325
7. Online figures
10 Q. Nguyen Lu’o’ng et al.: Massive star formation in G035.39–00.33, a mini-starburst event
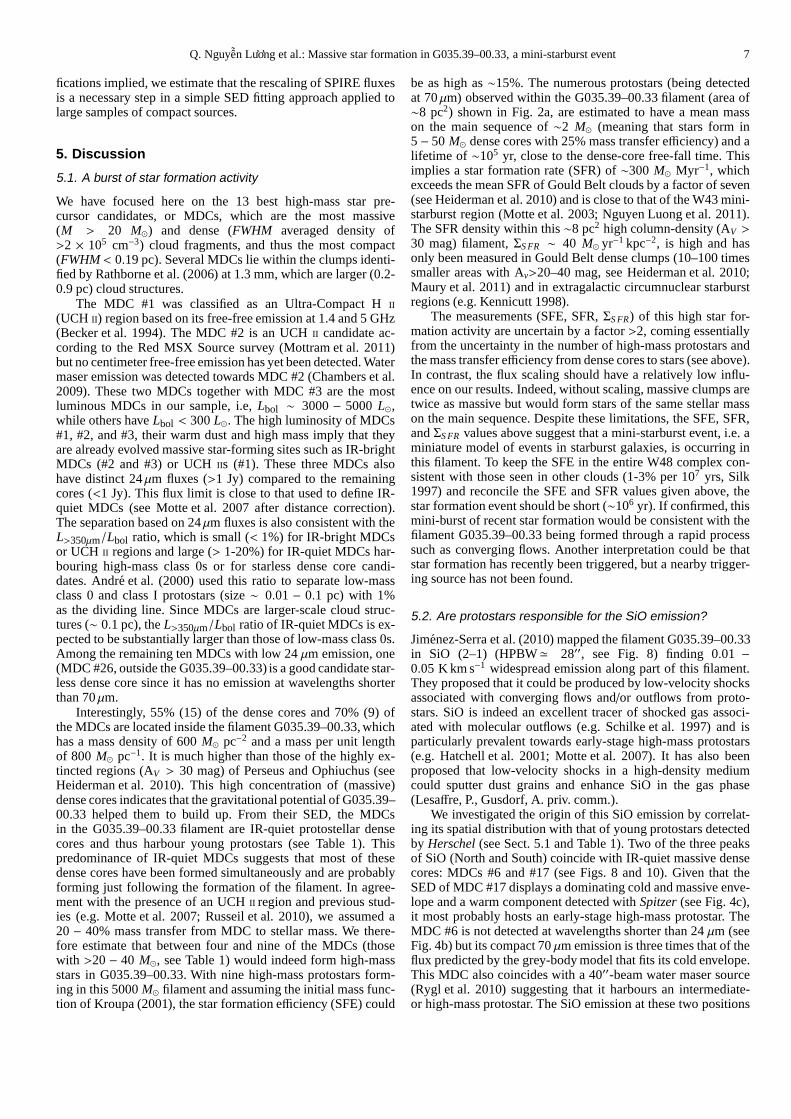
Fig. 9. Herschel images of W48:a) PACS 70µm (HPBW ∼ 6′′), b) PACS 160µm (HPBW ∼ 12′′), c) SPIRE 250µm (HPBW ∼18′′), d) SPIRE 350µm (HPBW ∼ 25′′), ande) SPIRE 500µm (HPBW 37′′). The bright diffuse emission on the right of each panelis from the Galactic plane. Plus signs (+) indicate the location of supernova remnants.
Q. Nguyen Lu’o’ng et al.: Massive star formation in G035.39–00.33, a mini-starburst event 11
Fig. 10.Zooms towards MDC #6 (upper rows) and MDC #17 (lower rows) at 8 - 250µm. Cloud fragments with mass<20 M⊙ aremarked as white and MDCs as black ellipses. SiO contours are the same as in Fig. 8 (from 0.01 to 0.05 K km s−1 by 0.01 K km s−1
from Jimenez-Serra et al. 2010).
Fig. 11. SEDs built fromHerschel and other wavelengths for sources lying towards the SiO peaks (except for those shown inFig. 4). The curves are grey-body models fitted for data at wavelengths≥ 160µm. The one-temperature grey-body fit (black curve)is consistent with two-temperature grey-body fits (green curve). Error bars correspond to 30% of the integrated fluxes. No modelcan reasonably fit source #27.