The elongation rate of RNA polymerase determines the fate of transcribed nucleosomes
18
The elongation rate of RNA polymerase determines the fate of transcribed nucleosomes Lacramioara Bintu 1,6,7 , Marta Kopaczynska 2,6,7 , Courtney Hodges 3,6 , Lucyna Lubkowska 4 , Mikhail Kashlev 4 , and Carlos Bustamante 1,2,3,5 1 Jason L. Choy Laboratory of Single-Molecule Biophysics and Department of Physics, University of California, Berkeley, Berkeley, California, USA 2 California Institute for Quantitative Biosciences, University of California, Berkeley, Berkeley, California, USA 3 Biophysics Graduate Group, University of California, Berkeley, Berkeley, California, USA 4 National Cancer Institute-Frederick, National Institutes of Health, Center for Cancer Research, Frederick, Maryland, USA 5 Howard Hughes Medical Institute, Department of Chemistry and Molecular & Cell Biology, University of California, Berkeley, Berkeley California, USA Abstract Upon transcription, histones can either detach from DNA or transfer behind the polymerase through a process believed to involve template looping. The details governing nucleosomal fate during transcription are not well understood. Our atomic force microscopy images of RNA polymerase II-nucleosome complexes confirm the presence of looped transcriptional intermediates and provide mechanistic insight into the histone-transfer process via the distribution of transcribed nucleosome positions. Significantly, we find that a fraction of the transcribed nucleosomes are remodeled to hexasomes, and that this fraction depends on the transcription elongation rate. A simple model involving the kinetic competition between transcription elongation, histone transfer, and histone-histone dissociation quantitatively rationalizes our observations and unifies results obtained with other polymerases. Factors affecting the relative magnitude of these processes provide the physical basis for nucleosomal fate during transcription and, therefore, for the regulation of gene expression. DNA in eukaryotic cells is tightly wrapped into nucleosomes, which constitute a physical barrier for RNA polymerase II (Pol II) and function as important and ubiquitous regulators of transcription elongation 1–3 . In vivo, nucleosomes are disrupted to varying degrees by transcription elongation, with outcomes ranging from partial loss to complete removal and exchange of histones 4–9 . Since these different outcomes can influence further binding of chromatin remodeling factors and the advancement of subsequent transcribing polymerases Correspondence should be addressed to C.B. ([email protected]). 6 Present addresses: Division of Biology, California Institute of Technology, Pasadena, California, USA (L.B.); Institute of Biomedical Engineering and Instrumentation, Wroclaw University of Technology, Wroclaw, Poland (M.K.); Department of Pathology, Stanford University School of Medicine, Stanford, California, USA (C.H.). 7 These authors contributed equally to this work. Author Contributions: L.B., M.Ko., C.H. & C.B. designed the research. M.Ko., L.B. & C.H. prepared materials and conducted experiments. L.B. & M.Ko. performed the data analysis. L.L. & M.Ka. contributed materials and discussion of the manuscript. L.B., M.Ko., C.H. & C.B. wrote the paper. Competing Interests: The authors declare no competing financial interests. NIH Public Access Author Manuscript Nat Struct Mol Biol. Author manuscript; available in PMC 2012 June 01. Published in final edited form as: Nat Struct Mol Biol. ; 18(12): 1394–1399. doi:10.1038/nsmb.2164. NIH-PA Author Manuscript NIH-PA Author Manuscript NIH-PA Author Manuscript
Transcript of The elongation rate of RNA polymerase determines the fate of transcribed nucleosomes

The elongation rate of RNA polymerase determines the fate oftranscribed nucleosomes
Lacramioara Bintu1,6,7, Marta Kopaczynska2,6,7, Courtney Hodges3,6, Lucyna Lubkowska4,Mikhail Kashlev4, and Carlos Bustamante1,2,3,5
1Jason L. Choy Laboratory of Single-Molecule Biophysics and Department of Physics, Universityof California, Berkeley, Berkeley, California, USA2California Institute for Quantitative Biosciences, University of California, Berkeley, Berkeley,California, USA3Biophysics Graduate Group, University of California, Berkeley, Berkeley, California, USA4National Cancer Institute-Frederick, National Institutes of Health, Center for Cancer Research,Frederick, Maryland, USA5Howard Hughes Medical Institute, Department of Chemistry and Molecular & Cell Biology,University of California, Berkeley, Berkeley California, USA
AbstractUpon transcription, histones can either detach from DNA or transfer behind the polymerasethrough a process believed to involve template looping. The details governing nucleosomal fateduring transcription are not well understood. Our atomic force microscopy images of RNApolymerase II-nucleosome complexes confirm the presence of looped transcriptional intermediatesand provide mechanistic insight into the histone-transfer process via the distribution of transcribednucleosome positions. Significantly, we find that a fraction of the transcribed nucleosomes areremodeled to hexasomes, and that this fraction depends on the transcription elongation rate. Asimple model involving the kinetic competition between transcription elongation, histone transfer,and histone-histone dissociation quantitatively rationalizes our observations and unifies resultsobtained with other polymerases. Factors affecting the relative magnitude of these processesprovide the physical basis for nucleosomal fate during transcription and, therefore, for theregulation of gene expression.
DNA in eukaryotic cells is tightly wrapped into nucleosomes, which constitute a physicalbarrier for RNA polymerase II (Pol II) and function as important and ubiquitous regulatorsof transcription elongation1–3. In vivo, nucleosomes are disrupted to varying degrees bytranscription elongation, with outcomes ranging from partial loss to complete removal andexchange of histones4–9. Since these different outcomes can influence further binding ofchromatin remodeling factors and the advancement of subsequent transcribing polymerases
Correspondence should be addressed to C.B. ([email protected]).6Present addresses: Division of Biology, California Institute of Technology, Pasadena, California, USA (L.B.); Institute of BiomedicalEngineering and Instrumentation, Wroclaw University of Technology, Wroclaw, Poland (M.K.); Department of Pathology, StanfordUniversity School of Medicine, Stanford, California, USA (C.H.).7These authors contributed equally to this work.
Author Contributions: L.B., M.Ko., C.H. & C.B. designed the research. M.Ko., L.B. & C.H. prepared materials and conductedexperiments. L.B. & M.Ko. performed the data analysis. L.L. & M.Ka. contributed materials and discussion of the manuscript. L.B.,M.Ko., C.H. & C.B. wrote the paper.
Competing Interests: The authors declare no competing financial interests.
NIH Public AccessAuthor ManuscriptNat Struct Mol Biol. Author manuscript; available in PMC 2012 June 01.
Published in final edited form as:Nat Struct Mol Biol. ; 18(12): 1394–1399. doi:10.1038/nsmb.2164.
NIH
-PA Author Manuscript
NIH
-PA Author Manuscript
NIH
-PA Author Manuscript

on that gene10, it is important to understand the mechanistic details that determine the fate ofthe nucleosome during transcription.
In vitro studies with the phage SP6 RNA polymerase and RNA Polymerase III (Pol III) haveshown that, upon transcription, the histone octamer moves upstream by 40–95 basepairs11–13. Surprisingly, later experiments suggested that transcription through a nucleosomeby Pol II leads to H2A–H2B dimer loss, and the formation of a hexamer whose position onDNA is unchanged14,15; similar results were obtained with the E. coli RNA polymerase16.This transfer process is believed to involve looping of the DNA template, but claims oftemplate looping for Pol II have so far relied on indirect evidence17–19. Moreover, despiteextensive work on characterizing the nucleosomal barrier11–18,20–25, there is still littlemechanistic understanding of how transcription dynamics affects histone turnover, and littlebasis for rationalizing differences among polymerases.
Here, we describe experiments that make it possible to image concurrently the polymeraseand the nucleosome with atomic force microscopy (AFM) in order to obtain snapshots ofindividual Pol II-nucleosome complexes before, during and after transcription. These imagesallow us to directly visualize the nucleosome integrity and its position after transcription, tolook for DNA looping during histone transfer, and to explore conditions that favor partialversus complete histone transfer.
RESULTSIdentification of transcribed complexes
Briefly, Pol II elongation complexes were assembled on a 96 bp DNA template14,17 andligated to 574 bp of DNA containing a single nucleosome loaded on the 601 nucleosomepositioning sequence (NPS)26 (Methods, Supplementary Fig. 1). Complexes prepared in thismanner were incubated either in the absence (“stalled sample,” Fig. 1a) or presence (“chasedsample,” Fig. 1b) of nucleotide triphosphates (NTPs), then fixed with formaldehyde,deposited on mica, and imaged using AFM (Methods). Because Pol II has a significantlylarger molecular weight (~550 kDa) than the nucleosome (~190 kDa), it is possible tounambiguously distinguish the two complexes by their different sizes in the images (Fig.1a–c). We measured the lengths of the different segments of free DNA (i.e. the DNA notcovered by protein, Fig. 1c), as well as the heights of the proteins for complexes that haveboth the nucleosome and the polymerase27 (Methods).
The position of the polymerase in stalled samples is centered at the start site of transcription(Fig. 1a, Supplementary Fig. 2a). In contrast, after addition of all four nucleotides, Pol II isdistributed along the entire length of the DNA template, indicating that transcription hasensued (Fig. 1b, Supplementary Fig. 2b).
To determine which complexes in the chased sample have completed transcription throughthe nucleosome, we made use of the fact that the DNA upstream of the nucleosome,containing the start site of Pol II, is about three times longer than the DNA downstream ofthe nucleosome. When Pol II is on the long arm and does not contact the nucleosome, wereason that transcription has not yet proceeded into the nucleosomal region, and label thesenucleosomes as “untranscribed”. Conversely, when Pol II is on the short arm, we infer thattranscription through the nucleosome was completed, and we deem these nucleosomes“transcribed” (Fig. 1d, Supplementary Fig. 2b). In order to correctly identify transcribednucleosomes, we assume that even if their positions change from the original NPS, theyremain on the same half of DNA after transcription. We use a boot-strapping method tocheck this assumption: if the nucleosome moved on the other half of the DNA, we wouldexpect a change in the position distribution of nucleosomes that we deemed untranscribed.
Bintu et al. Page 2
Nat Struct Mol Biol. Author manuscript; available in PMC 2012 June 01.
NIH
-PA Author Manuscript
NIH
-PA Author Manuscript
NIH
-PA Author Manuscript

However, for complexes identified as untranscribed in the chased sample, the position of thenucleosome is unchanged compared to untranscribed nucleosomes imaged in the absence ofPol II (Fig. 2a, p = 0.3, t-test), indicating that our identification of these nucleosomes asuntranscribed is valid.
Nucleosome position after transcriptionIn order to get an accurate measurement of the changes in position of the nucleosomes(Methods, Supplementary Discussion 1, Supplementary Table 1), we compared the length ofthe free DNA segment upstream of transcribed nucleosomes (Fig. 2b, red) to that ofuntranscribed nucleosomes from a sample without Pol II (Fig. 2b, blue). The distribution fortranscribed nucleosomes is broader and there is a modest but statistically significant shift toshorter lengths (6 nm, p = 5·10−8, t-test). The partial overlap with the correspondingdistribution of untranscribed nucleosomes suggests that the majority of the nucleosomes areplaced at the same location after transcription, in accordance with previously publishedresults14. However, our single-molecule method, used in conjunction with a DNA sequencethat positions the nucleosome uniquely, allows us to observe that a small subpopulation ofthe transcribed nucleosomes (approximately 20%) move immediately upstream of theiroriginal position by 24 nm (72 bp) on average (Fig. 2b). This upstream relocation of thehistones hints at a looping mechanism of histone transfer, mechanism initially proposed forphage polymerases, which were used as a substitute system for eukaryotic transcription11,21,and more recently for Pol II17.
DNA looping during histone transferIn models of DNA looping during nucleosomal transcription, the histones from a partiallyunwrapped nucleosome situated downstream of the transcribing polymerase are assumed tosimultaneously contact a DNA segment upstream of the polymerase forming a loop.According to such models, this process eventually leads to the transfer of histones behindthe polymerase and permits transcription to resume. In agreement with this idea, we findmany intermediate complexes where Pol II is in the process of transcribing the nucleosomethat show the histones contacting the DNA segments both upstream and downstream of PolII (Fig. 3a).
The distribution of total free DNA lengths for intermediate complexes where Pol II is in theprocess of transcribing the nucleosome is different from that of complexes where Pol II hasstarted transcribing but has not yet reached the nucleosome (p = 0.009, Kolmogorov-Smirnov test, see Supplementary Fig. 2 for populations selected). Because the free-DNAlengths distribution for these intermediate complexes is not well described by a singleGaussian (p = 0.03, Lilliefors test), we fit this distribution with two Gaussians (Fig. 3b). Themain peak is identical with the corresponding distribution for complexes where Pol II hasstarted transcribing but has not yet reached the nucleosome (Fig. 3c). The second peakcorresponds to an additional population of intermediates where the DNA outside thepolymerase-nucleosome complex is shorter by ~30 nm. We interpret this shortening asevidence that the template in the proximity of the nucleosome participates in a loop thatfacilitates histone transfer behind the polymerase, and that cannot be resolved because of thebroadening effect of the AFM tip (inset, Fig. 3b). The estimated size of these DNA loops(~90 bp) is smaller than the persistence length of DNA (~150 bp) and they may befacilitated by the putative 90° bend that Pol II introduces in its DNA template18,19,28,29.
Pol II transcription produces hexamers and octamersAs Pol II advances onto the nucleosomal template, the DNA is being detached from the corehistones, exposing them to the surrounding conditions. Since the octamer consists of acollection of positively charged histones, it is unstable at salt concentrations under 1 M30,31.
Bintu et al. Page 3
Nat Struct Mol Biol. Author manuscript; available in PMC 2012 June 01.
NIH
-PA Author Manuscript
NIH
-PA Author Manuscript
NIH
-PA Author Manuscript

Thus, unless the core histones contact another piece of DNA that could neutralize theircharges and stabilize their association, the octamer may dissociate with partial loss of itscomponents. Indeed, loss of an H2A–H2B dimer and the formation of a hexasome upontranscription by Pol II has been reported previously14,15. Consistent with these results, weobserve a reduction in the apparent physical size of transcribed nucleosomes (Fig. 4a). Theirheight consists of two populations: one similar to untranscribed nucleosomes (3 ±0.4 nm,Fig. 4b) and the other one corresponding to subnucleosomal particles with lower height (2.1±0.3 nm, Fig. 4c).
In order to identify the transcribed particles with decreased height, we reconstituted andimaged histone tetramers on DNA using the same methods as for octamers32, except withH2A and H2B histones omitted. The height of tetramers, 1.6±0.2 nm, is substantially lowerthan that of the transcribed particle, 2.1±0.3 nm (Fig. 4d). Moreover, when we destabilizedcomplete octameric nucleosomes by incubating them in 1 M KCl, we obtained 3nucleosomal species, consistent with octamers, hexamers and tetramers (Fig. 4e). The heightof the middle peak, which we identify as a hexamer, matches the height of thesubnucleosomal particles resulting from transcription.
Hexamers to octamers ratio depends on the elongation rateMost significantly, we find that the fraction of smaller subnucleosomal particles observedafter transcription depends on the rate of elongation. When transcription was performed atlow NTP concentrations (100 µM), only 10±3% of the transcribed nucleosomes wereconverted to hexasomes (Fig. 5a). Increasing the NTPs concentration to 200 µM NTPaugments the percentage of hexasomes to 17±3% (Fig. 5b). At saturating NTPs (1000 µM),25±5% of the transcribed nucleosomes were converted to hexasomes (Fig. 5c). No changeswere observed in the sizes of untranscribed nucleosomes in these samples (Fig. 5d–e).
We attribute these different outcomes of transcription to the kinetic competition betweenhistone dissociation from a partially unwrapped nucleosome and histone transfer to theupstream DNA. Initially, as the nucleosome partially unwraps during Pol II advancement,enough of the histone core is exposed to allow contact with the upstream DNA through atemporary DNA loop, but not so much as to cause H2A–H2B dissociation. During slowtranscription (100 µM NTPs) this partially exposed histone intermediate lasts long enough toallow transfer of the intact octamer onto the upstream DNA. However, if the rate oftranscription is increased slightly, more of the nucleosome will unwrap and, as enough ofthe histone core becomes exposed, dimer dissociation starts competing with octamer transferto the upstream DNA. Under these conditions, representative for transcription at 200 µM and1000 µM NTPs, both octamers and hexamers can be found as a result of transcription.Finally, when the rates of transcription are even higher, enough DNA is unwrapped from thesurface of the histone core that the complete histone detachment from DNA greatlyoutcompetes the rates of histone transfer and histone-histone dissociation, thus leading tobare DNA formation.
Elongation, looping, and histone dissociation competeThe dependence of the outcome of transcription on the speed of elongation indicates that akinetic competition exists between the net rate of nucleosome unwrapping during elongation(kue), octamer transfer (kt), and dimer dissociation (kd) during transcription through thenucleosome (Fig. 6a).
In this competition model, the probabilities of observing a hexamer (Phex), an octamer (Poct),or bare DNA (Pbare) after transcription can be written as:
Bintu et al. Page 4
Nat Struct Mol Biol. Author manuscript; available in PMC 2012 June 01.
NIH
-PA Author Manuscript
NIH
-PA Author Manuscript
NIH
-PA Author Manuscript

where N is the number of base pairs unwrapped that allow octamer transfer but not dimerdissociation, and where we assume the competition happens at every base transcribed, alongthe entire length of the nucleosome, which contains NT = 147 base pairs of wrapped DNA33
(see Supplementary Discussion 2 for derivation). According to these expressions, as theoverall elongation rate through the nucleosome (kue) becomes larger, the probability ofcomplete histone removal and the resulting production of bare DNA (Pbare) should increasemonotonically, while the production of transferred octamers (Poct) should instead decreasemonotonically. Significantly, this model predicts that the probability of hexamer formationshould increase when elongation from low to moderate Pol II elongation rates because as therate of elongation-dependent octamer unwrapping increases, the probability of histonedissociation effectively competes with that of octamer transfer, enhancing the production ofhexamers as observed in this study (first term in Phex dominates). However, as the rate ofelongation and nucleosome unwrapping increases further, the rate of histone dissociation isoutcompeted by the rate of complete histone removal and the production of hexamers shouldattain a maximum and eventually decrease (the last term in Phex dominates).
To test this model, we sought to determine the rates involved in this process. The net rate ofnucleosome unwrapping during elongation is equal to the average overall velocity oftranscription through the nucleosome (including pausing due to backtracking), which atsaturating NTPs (1000 µM) is kue = 1 bp s−1 (ref. 17). Since the average Km of Pol II forNTP hydrolysis is 100 µM (Supplementary Fig. 3 and Supplementary Discussion 3), we canuse Michaelis-Menten kinetics to estimate the net rates of transcription through thenucleosome at 200 µM and 100 µM NTPs; this analysis yields about 0.7 bp s−1 and 0.5 bps−1 for these two rates, respectively. Finally, to determine the rate of H2A–H2B dimer lossfor pre-assembled octamers directly exposed to the salt concentration used in these studies(300 mM KCl), we performed an ensemble FRET-based assay with fluorescently labeledH2B and H431. These experiments gave kd = 0.027 ± 0.007 s−1 (Supplementary Fig. 4 andSupplementary Discussion 4).
Fit of the experimental data (Fig. 6b) shows that this simple competition model capturescorrectly the details of hexamer and octamer transfer probabilities, as well as that ofcomplete histone removal, if the initial DNA unwrapped region allowing only octamertransfer (but no dimer dissociation) is N = 40 ± 5 bp and the rate of histone transfer is kt =0.02 ± 0.005 s−1. Notice that the value of N obtained here is consistent with the amount ofDNA contacted by the H2A–H2B dimer (~30 bp33). Therefore, we predict that histone orDNA modifications that destabilize the wrapping of this 40 bp region would favour hexamerformation. The rate of histone transfer is slow and similar to that of dimer dissociation. Forhistone transfer, the rate-limiting process is most likely the actual hand-off of the histonesfrom the downstream to the upstream DNA, as looping resulting from DNA bendingfluctuations is known to be much faster34.
Note that our mathematical model of histone transfer takes into consideration the increasedprobability of pausing due to backtracking at low NTPs concentrations and its effect on theoverall transcription rate (Supplementary Discussion 3). However, in addition to slowingdown the overall elongation rates, extensive backtracking may allow the upstream DNA to
Bintu et al. Page 5
Nat Struct Mol Biol. Author manuscript; available in PMC 2012 June 01.
NIH
-PA Author Manuscript
NIH
-PA Author Manuscript
NIH
-PA Author Manuscript

rotate so as to face towards the unwrapped histone core, facilitating histone transferfurther18.
DISCUSSIONOur results support a model where nucleosome unwrapping during elongation exposes thehistones so that they dissociate from the core octamer unless they interact with anothersegment of DNA. We propose that because Pol II sharply bends the DNA, it positions theexposed histones very close to the DNA immediately upstream of the polymerase, thusmediating histone transfer to the same DNA molecule via looping. This positioninghypothesis has been proposed before18,19 and explains both the small size of the loops thatallow histone transfer by bridging upstream and downstream DNA, and the small upstreamshift in the position of transcribed nucleosomes. Note that our observation that only aminority of nucleosomes change position after transcription may be influenced by our use ofa strong NPS that could bias the histones to transfer and rewrap at the same location asbefore transcription. The total percentage of shifted nucleosomal particles (hexamer andoctamers together) decrease slightly at the NTP concentration is lowered (SupplementaryTable 2). Presumably, the slower transcription is more likely to allow the histones toequilibrate on their original position during rewrapping.
In this model of nucleosomal transcription, faster transcription leads to faster overallnucleosome unwrapping, favouring histone dissociation. However, other factors affectingthe rewrapping of the histones could influence the outcome of the competition. For example,a trailing polymerase blocking access of the unwrapped histones to upstream DNA15,35 andhistone mutations that destabilize histone-DNA wrapping36 were both shown to inhibithistone transfer and to promote histone dissociation in vitro, as expected according to ourmodel.
This competition model also explains why faster polymerases produce a mix of octamersand bare DNA but yield little or no hexamers upon transcription. For instance, in vitro, themajority of Pol III complexes complete transcription through a nucleosome in approximately30 seconds12 (Fig. 6b, vertical black line), so we predict that octamer transfer is likely –approximately 40%, while bare DNA production should be about 50%. To obtainhexasomes, on the other hand, two slow processes have to occur before Pol III can finishtranscription: dimer dissociation and histone transfer, making the probability of hexamertransfer very unlikely, approximately 10%, under these fast transcription conditions. Notethat here we only consider histone transfer within the same DNA molecule and do notinclude the probability of histone rebinding to other DNA molecules after completedissociation. These predictions match previous experimental studies with Pol III reporting~50% octamers and ~50% bare DNA12 in the presence of competitor DNA, when onlytransfer in cis is measured.
Moreover, in vitro transcription by the even faster SP6 polymerase also leads to theformation of octamers and bare DNA, without hexamer formation, with the percentage ofbare DNA increasing as the speed of elongation is increased11. Since we estimate that SP6RNAP is faster than 5bp s−1, our model predicts that the outcome of transcription should bedominated by bare DNA. This prediction might seem contradictory at first with theexperimental results, where much lower levels of bare DNA were observed, especially in theabsence of competitor DNA11. However, our model only considers transfer of the histonesin cis (within the same DNA molecule). While for Pol II this is the prevalent scenario, webelieve that for faster polymerases (such as SP6) a lot of the histone transfer happens intrans. Since Pol II moves slower, the histones have time to equilibrate with the DNAupstream (which is at a higher local concentration than other pieces of DNA). In contrast,
Bintu et al. Page 6
Nat Struct Mol Biol. Author manuscript; available in PMC 2012 June 01.
NIH
-PA Author Manuscript
NIH
-PA Author Manuscript
NIH
-PA Author Manuscript

for faster polymerases, the histone octamer detaches quickly, and since it’s floating free insolution, it is now just as likely to bind to any piece of DNA (in cis or trans). Thisinterpretation is supported by the observation that for the SP6 polymerase, addition ofcompetitor DNA to the reaction increases the amount of bare transcribed DNA11. Moreover,it appears that transfer in trans is seen at higher NTPs concentrations, while at lower NTPs,transfer in cis dominates, in agreement with our model. However, a quantitative comparisonwith data obtained for the SP6 RNAP is difficult, since there are multiple – and unknown –transcription rounds for each DNA molecule, leading to a higher probability of completehistone dissociation than described by our model. In addition, since we propose that thegeometry of the elongation complex influences histone transfer, we expect that polymerasesof significantly different sizes and structures could lead to different positions distributionsand transfer probabilities of the transcribed nucleosomes; the importance of these effectsremains to be tested.
Gene regulation in vivo may result from the modification of any one of the competing ratesinvolved in elongation on a nucleosomal template. While we use a DNA sequence with ahigher affinity for the nucleosome than other naturally occurring sequences, we predict thattranscription through a weaker nucleosome is faster (an increased kue rate, because of higherprobability of finding the nucleosome locally unwrapped17) and the transfer probabilitydecreases (because of lowered rewrapping rates of histones to the upstream DNA). Boththese effects would result in higher percentage of bare DNA and hexasomes formations aftertranscription of weaker positioning sequences. More importantly, elongation factors thatincrease the net transcription rate of Pol II through the nucleosome would result in anincreased probability of complete histone removal from DNA. Alternatively, dimerdissociation from the partially unwrapped octamer could be faster for certain histonevariants of H2A37 or in the presence of histone chaperones that bind the dimer, increasingthe probability of hexasome formation, as has been shown in vitro38. Such transcription-induced alterations in chromatin structure may affect gene expression in vivo by reducing oreliminating nucleosomal barriers for future transcription elongation events in a similarmanner to results obtained in vitro15,18, or by altering the accessibility of transcription factorbinding sites39. Finally, we point out that the findings communicated here might also berelevant to other processes that involve advancement of molecular motors through DNAwrapped in nucleosomes, such as processive DNA replication and chromatin remodeling40.
METHODSProteins and DNA purification
His-tagged RNA polymerase II (S. cerevisiae, unphosphorylated C-terminal domain) waspurified as previously described41. The 574 bp DNA template was prepared by PCR from amodified pUC19 plasmid42 containing the 601 nucleosome positioning sequence26.Octamers were reconstituted from recombinant yeast histones32 and loaded onto thetemplate DNA using salt dialysis43.
Assembly of elongation complexes with nucleosomesPol II was assembled on DNA using the same method and sequences as previouslydescribed17, and the resulting TECs were ligated to downstream DNA containing a pre-loaded nucleosome (Supplementary Fig. 1). The assembly and ligation were performed inTB40 (20 mM HEPES pH 7.8, 40 mM KCl, 10 mM MgCl2, 10 µM ZnCl2, 1 mM β-mercaptoethanol). Transcription was performed at 25 °C in TB300 (the same as TB40,except with 300 mM KCl instead of 40 mM KCl), using 1 mM of each nucleotidetriphosphate (NTP) - unless otherwise specified - and 1 µM pyrophosphate, for 30 minutes.
Bintu et al. Page 7
Nat Struct Mol Biol. Author manuscript; available in PMC 2012 June 01.
NIH
-PA Author Manuscript
NIH
-PA Author Manuscript
NIH
-PA Author Manuscript

In the sample used for calculating the position of untranscribed nucleosomes (Fig. 2, blue),the 93 bp double stranded DNA (Integrated DNA Technologies) was ligated in excess to the574 bp nucleosomal DNA in the absence of Pol II.
Sample preparation for AFM and imagingFollowing transcription, samples were fixed by incubating with 1% (w/v) formaldehyde for2 hours at room temperature. We removed the formaldehyde by dialyzing in TB40 for 45minutes at room temperature. For deposition, the samples were diluted in TB40 to 2 nMDNA concentrations, placed on freshly cleaved ultra-clean mica (Grade V, Ted Pella, Inc.),and incubated at room temperature for about 2 minutes. The mica discs were then rinsedwith purified 18.2 MΩ deionized water and dried using a gentle N2 gas flow, perpendicularto the mica surface.
AFM measurements were performed with a Multimode AFM Nanoscope V (VeecoInstruments Inc.) equipped with a type E-scanner (10-micron × 10-micron × 2.5-micronvertical range). The samples were imaged in tapping mode using a commercial siliconcantilevers (Nanosensors), with a high-resonance frequency in the range of 260–410 kHzand a spring constant of 46 N m−1. Images (512 × 512 pixels) were captured in the tracedirection, at a scan size of 1.5 µm, with a scan rate of 1.5 Hz. The imaging amplitude(amplitude set-point) of the cantilever was maintained by the feedback circuitry to 80–85%of the free oscillation amplitude and the scan angle was maintained at 0. All samples weremeasured at room temperature in air, at a relative humidity 30%.
Image analysisImage processing and data analysis were performed using Matlab (MathWorks), withsoftware based on ALEX27,44. We imported the images into Matlab, automatically maskedall the points higher than 9 nm, and flattened the images by subtracting from each line apolynomial of degree 2 fit to that line. We then identified all the objects higher than 0.2 nmin this flattened image, used these points as a mask, and performed a new line by lineflattening on the original with a polynomial of degree 4.
For each complex, the DNA path (passing through the proteins) was digitized and fit by apolynomial of degree 3 (ref. 44). The polymerase and nucleosome center positions wererecorded as the centers of the highest and second highest Gaussians respectively along theidentified DNA path (Fig. 1c). The nucleosome heights were measured as the maximumheight in a 4-nm box centered at the position of the nucleosome, to correct for cases whenthe DNA path does not pass through the center of the nucleosome. To account for smallheight variation among different depositions, we corrected the height of transcribednucleosomes using the height of untranscribed nucleosomes as a standard. In the chasedsamples, we first identified the molecules that have Pol II but where Pol II has not yetcrossed the nucleosome (as shown in Fig. 1d). We fit the heights of these untranscribednucleosomes with a Gaussian function for each sample (different tip and deposition), andshift all these distributions such that the Gaussian peak of each one is at 3 nm (which is theheight we get when imaging nucleosomes alone with high frequency tips). Finally, we shiftall the other nucleosome heights in that sample by exactly the same amount as theuntranscribed nucleosomes. In general, this correction shift is between 0.2–0.8 nm for eachsample, with the higher shifts for samples imaged with low frequency tips.
Percentages of hexamers were calculated as the fraction of transcribed particles with heightsunder 2.4 nm. Amounts of bare DNA are estimated as the percentage of molecules withoutnucleosomes in the chased samples minus the corresponding percentage in the stalledsamples.
Bintu et al. Page 8
Nat Struct Mol Biol. Author manuscript; available in PMC 2012 June 01.
NIH
-PA Author Manuscript
NIH
-PA Author Manuscript
NIH
-PA Author Manuscript
Throughout the main manuscript, we use the length of free DNA (DNA not covered byprotein) to estimate the position of the nucleosome on the template. Before Pol II passes thenucleosome, it covers part the upstream arm of the nucleosome; in contrast, aftertranscription, the upstream arm of the nucleosome is completely unobscured. Therefore, inorder to obtain an accurate measurement of the length of the upstream arm of thenucleosome before transcription, we imaged a sample that lacks the polymerase, but has afull length template containing the nucleosome.
Supplementary MaterialRefer to Web version on PubMed Central for supplementary material.
AcknowledgmentsWe thank Manchuta Dangkulwanich, Toyotaka Ishibashi, Bibiana Onoa, and Patrick Visperas for experimentalassistance and helpful discussions, and Claudio Rivetti for sharing the ALEX code. Supported by NIH grantGM32543 (C.B.).
References1. Churchman LS, Weissman JS. Nascent transcript sequencing visualizes transcription at nucleotide
resolution. Nature. 2011; 469:368–373. [PubMed: 21248844]
2. Subtil-Rodríguez A, Reyes JC. BRG1 helps RNA polymerase II to overcome a nucleosomal barrierduring elongation, in vivo. EMBO reports. 2010; 11:751–757. [PubMed: 20829883]
3. Gaykalova DA, et al. A polar barrier to transcription can be circumvented by remodeler-inducednucleosome translocation. Nucleic Acids Research. 2011; 39:3520–3528. [PubMed: 21245049]
4. Thiriet C, Hayes JJ. Replication-independent core histone dynamics at transcriptionally active lociin vivo. Genes & Development. 2005; 19:677–682. [PubMed: 15769942]
5. Thiriet C, Hayes J. Histone dynamics during transcription: exchange of H2A–H2B dimers and H3/H4 tetramers during pol II elongation. Chromatin Dynamics in Cellular Function. 2006; 41:77–90.
6. Dion MF, et al. Dynamics of replication-independent histone turnover in budding yeast. Science.2007; 315:1405–1408. [PubMed: 17347438]
7. Kimura H, Cook PR. Kinetics of core histones in living human cells little exchange of H3 and H4and some rapid exchange of H2B. Journal of Cell Biology. 2001; 153:1341–1354. [PubMed:11425866]
8. Schwabish MA, Struhl K. Asf1 mediates histone eviction and deposition during elongation by RNApolymerase II. Molecular Cell. 2006; 22:415–422. [PubMed: 16678113]
9. Jamai A, Imoberdorf RM, Strubin M. Continuous histone H2B and transcription-dependent histoneH3 exchange in yeast cells outside of replication. Molecular Cell. 2007; 25:345–355. [PubMed:17289583]
10. Workman JL. Nucleosome displacement in transcription. Genes & Development. 2006; 20:2009–2017. [PubMed: 16882978]
11. Studitsky VM, Clark DJ, Felsenfeld G. A histone octamer can step around a transcribingpolymerase without leaving the template. Cell. 1994; 76:371–382. [PubMed: 8293470]
12. Studitsky VM, Kassavetis GA, Geiduschek EP, Felsenfeld G. Mechanism of transcription throughthe nucleosome by eukaryotic RNA polymerase. Science. 1997; 278:1960–1963. [PubMed:9395401]
13. Clark DJ, Felsenfeld G. A nucleosome core is transferred out of the path of a transcribingpolymerase. Cell. 1992; 71:11–22. [PubMed: 1394427]
14. Kireeva ML, et al. Nucleosome remodeling induced by RNA polymerase II loss of the H2A–H2Bdimer during transcription. Molecular Cell. 2002; 9:541–552. [PubMed: 11931762]
15. Kulaeva OI, Hsieh FK, Studitsky VM. RNA polymerase complexes cooperate to relieve thenucleosomal barrier and evict histones. Proceedings of the National Academy of Sciences. 2010;107:11325–11330.
Bintu et al. Page 9
Nat Struct Mol Biol. Author manuscript; available in PMC 2012 June 01.
NIH
-PA Author Manuscript
NIH
-PA Author Manuscript
NIH
-PA Author Manuscript
16. Walter W, Kireeva ML, Studitsky VM, Kashlev M. Bacterial polymerase and yeast polymerase IIuse similar mechanisms for transcription through nucleosomes. Journal of Biological Chemistry.2003; 278:36148–36156. [PubMed: 12851391]
17. Hodges C, Bintu L, Lubkowska L, Kashlev M, Bustamante C. Nucleosomal fluctuations governthe transcription dynamics of RNA polymerase II. Science. 2009; 325:626–628. [PubMed:19644123]
18. Kulaeva OI, et al. Mechanism of chromatin remodeling and recovery during passage of RNApolymerase II. Nature Structural & Molecular Biology. 2009; 16:1272–1278.
19. Kulaeva OI, Studitsky VM. Mechanism of histone survival during transcription by RNApolymerase II. Transcription. 2010; 1:85–88. [PubMed: 21326897]
20. Izban MG, Luse DS. Transcription on nucleosomal templates by RNA polymerase II in vitro:inhibition of elongation with enhancement of sequence-specific pausing. Genes & Development.1991; 5:683–696. [PubMed: 2010092]
21. Bednar J, Studitsky VM, Grigoryev SA, Felsenfeld G, Woodcock CL. The nature of thenucleosomal barrier to transcription direct observation of paused intermediates by electroncryomicroscopy. Molecular Cell. 1999; 4:377–386. [PubMed: 10518218]
22. Walter W, Studitsky VM. Facilitated transcription through the nucleosome at high ionic strengthoccurs via a histone octamer transfer mechanism. Journal of Biological Chemistry. 2001;276:29104–29110. [PubMed: 11390400]
23. Kireeva ML, et al. Nature of the nucleosomal barrier to RNA polymerase II. Molecular Cell. 2005;18:97–108. [PubMed: 15808512]
24. Bondarenko VA, et al. Nucleosomes can form a polar barrier to transcript elongation by RNApolymerase II. Molecular Cell. 2006; 24:469–479. [PubMed: 17081995]
25. Luse DS, Spangler LC, Újvári A. Efficient and rapid nucleosome traversal by RNA polymerase IIdepends on a combination of transcript elongation factors. Journal of Biological Chemistry. 2011;286:6040–6048. [PubMed: 21177855]
26. Lowary PT, Widom J. New DNA sequence rules for high affinity binding to histone octamer andsequence-directed nucleosome positioning. Journal of Molecular Biology. 1998; 276:19–42.[PubMed: 9514715]
27. Rivetti C, Codeluppi S. Accurate length determination of DNA molecules visualized by atomicforce microscopy: evidence for a partial B-to A-form transition on mica. Ultramicroscopy. 2001;87:55–66. [PubMed: 11310542]
28. Gnatt AL, Cramer P, Fu J, Bushnell DA, Kornberg RD. Structural basis of transcription: an RNApolymerase II elongation complex at 3.3 A resolution. Science. 2001; 292:1876–1882. [PubMed:11313499]
29. Cramer P, Bushnell DA, Kornberg RD. Structural basis of transcription: RNA polymerase II at 2.8angstrom resolution. Science. 2001; 292:1863–1876. [PubMed: 11313498]
30. Eickbush TH, Moudrianakis EN. The histone core complex: an octamer assembled by two sets ofprotein-protein interactions. Biochemistry. 1978; 17:4955–4964. [PubMed: 718868]
31. Park YJ, Dyer PN, Tremethick DJ, Luger K. A new fluorescence resonance energy transferapproach demonstrates that the histone variant H2AZ stabilizes the histone octamer within thenucleosome. Journal of Biological Chemistry. 2004; 279:24274–24282. [PubMed: 15020582]
32. Wittmeyer J, Saha A, Cairns B. DNA translocation and nucleosome remodeling assays by the RSCchromatin remodeling complex. Methods in Enzymology. 2004; 377:322–343. [PubMed:14979035]
33. Luger K, Mäder AW, Richmond RK, Sargent DF, Richmond TJ. Crystal structure of thenucleosome core particle at 2.8 Å resolution. Nature. 1997; 389:251–260. [PubMed: 9305837]
34. Huang J, Schlick T, Vologodskii A. Dynamics of site juxtaposition in supercoiled DNA.Proceedings of the National Academy of Sciences. 2001; 98:968–973.
35. Jin J, et al. Synergistic action of RNA polymerases in overcoming the nucleosomal barrier. NatureStructural & Molecular Biology. 2010; 17:745–752.
36. Hsieh FK, Fisher M, Újvári A, Studitsky VM, Luse DS. Histone Sin mutations promotenucleosome traversal and histone displacement by RNA polymerase II. EMBO reports. 2010;11:705–710. [PubMed: 20706221]
Bintu et al. Page 10
Nat Struct Mol Biol. Author manuscript; available in PMC 2012 June 01.
NIH
-PA Author Manuscript
NIH
-PA Author Manuscript
NIH
-PA Author Manuscript

37. Bao Y, et al. Nucleosomes containing the histone variant H2A. Bbd organize only 118 base pairsof DNA. The EMBO journal. 2004; 23:3314–3324. [PubMed: 15257289]
38. Belotserkovskaya R, et al. FACT facilitates transcription-dependent nucleosome alteration.Science. 2003; 301:1090–1093. [PubMed: 12934006]
39. Hayes JJ, Wolffe AP. Histones H2A–H2B inhibit the interaction of transcription factor IIIA withthe Xenopus borealis somatic 5S RNA gene in a nucleosome. Proceedings of the NationalAcademy of Sciences of the United States of America. 1992; 89:1229–1233. [PubMed: 1741376]
40. Bruno M, et al. Histone H2A–H2B dimer exchange by ATP-dependent chromatin remodelingactivities. Molecular Cell. 2003; 12:1599–1606. [PubMed: 14690611]
41. Kireeva ML, Lubkowska L, Komissarova N, Kashlev M. Assays and affinity purification ofbiotinylated and nonbiotinylated forms of double-tagged core RNA polymerase II fromSaccharomyces cerevisiae. Methods in Enzymology. 2003; 370:138–155. [PubMed: 14712640]
42. Zhang Y, et al. DNA translocation and loop formation mechanism of chromatin remodeling bySWI/SNF and RSC. Molecular Cell. 2006; 24:559–568. [PubMed: 17188033]
43. Thåström A, Lowary PT, Widom J. Measurement of histone–DNA interaction free energy innucleosomes. Methods. 2004; 33:33–44. [PubMed: 15039085]
44. Rivetti C, Guthold M, Bustamante C. Scanning force microscopy of DNA deposited onto mica:equilibration versus kinetic trapping studied by statistical polymer chain analysis. Journal ofMolecular Biology. 1996; 264:919–932. [PubMed: 9000621]
Bintu et al. Page 11
Nat Struct Mol Biol. Author manuscript; available in PMC 2012 June 01.
NIH
-PA Author Manuscript
NIH
-PA Author Manuscript
NIH
-PA Author Manuscript

Figure 1.Snapshots of transcription. AFM images of (a) stalled (no NTPs added) and (b) chasedcomplexes (all four NTPs added). Only complexes that contain both the polymerase andnucleosome are included for analysis (unless otherwise specified); white arrows indicate PolII in these complexes. (c) The height profile of an example complex (inset) is plotted alongthe DNA path as black circles. The Pol II and nucleosome heights are fit to Gaussians shownin purple and blue respectively. The free DNA segment lengths (black part of the fit) aredefined as the lengths of the paths that start two standard deviations away from the centersof the proteins. (d) Schematic of the algorithm used to identify Pol II-nucleosomecomplexes. When Pol II (blue) is on the long arm of the nucleosome (gray) and its centerhas not yet reached the middle of the DNA template (green vertical line), we deem thecomplex untranscribed. When Pol II has passed the middle line of the template, and the PolII and nucleosome edges are within 5 nm or less of each other, the complexes are tagged asintermediate. When Pol II is on the short arm of the nucleosome, the complex is tagged astranscribed.
Bintu et al. Page 12
Nat Struct Mol Biol. Author manuscript; available in PMC 2012 June 01.
NIH
-PA Author Manuscript
NIH
-PA Author Manuscript
NIH
-PA Author Manuscript

Figure 2.Nucleosome position. (a) The length of the downstream free DNA segments foruntranscribed nucleosomes (red) and complexes without Pol II (blue). (b) The length of theupstream free DNA segment for transcribed nucleosomes (red) and complexes without PolII (blue).
Bintu et al. Page 13
Nat Struct Mol Biol. Author manuscript; available in PMC 2012 June 01.
NIH
-PA Author Manuscript
NIH
-PA Author Manuscript
NIH
-PA Author Manuscript
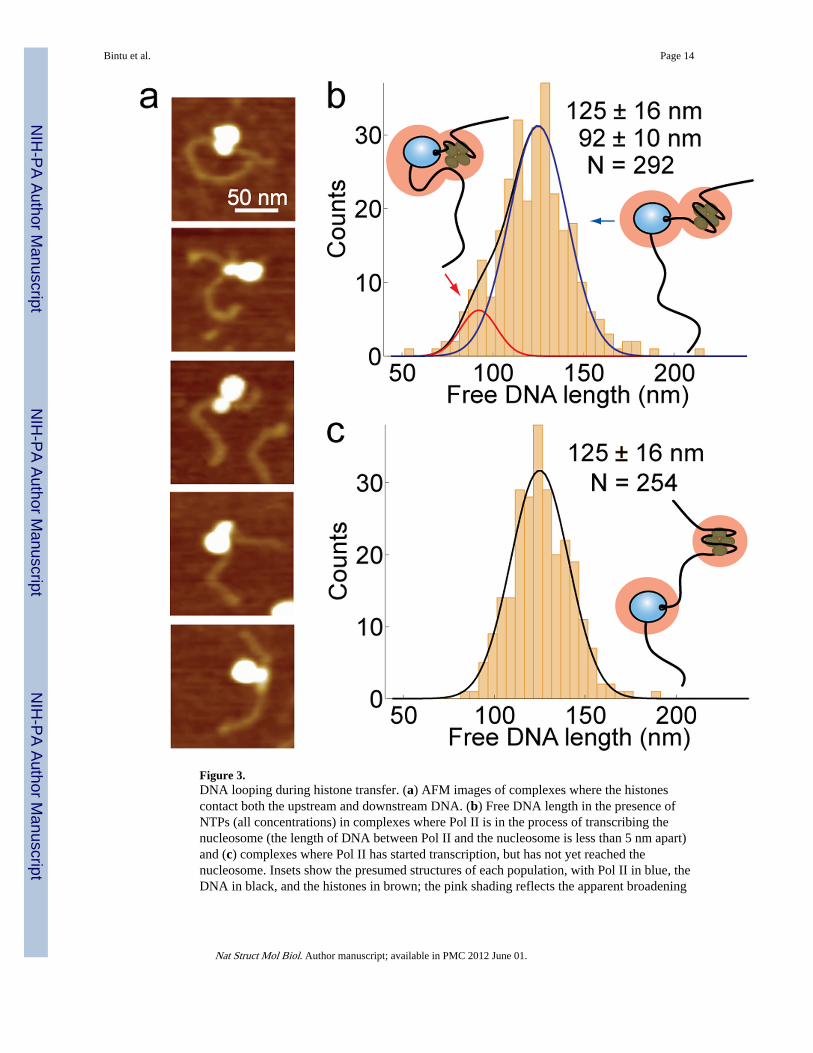
Figure 3.DNA looping during histone transfer. (a) AFM images of complexes where the histonescontact both the upstream and downstream DNA. (b) Free DNA length in the presence ofNTPs (all concentrations) in complexes where Pol II is in the process of transcribing thenucleosome (the length of DNA between Pol II and the nucleosome is less than 5 nm apart)and (c) complexes where Pol II has started transcription, but has not yet reached thenucleosome. Insets show the presumed structures of each population, with Pol II in blue, theDNA in black, and the histones in brown; the pink shading reflects the apparent broadening
Bintu et al. Page 14
Nat Struct Mol Biol. Author manuscript; available in PMC 2012 June 01.
NIH
-PA Author Manuscript
NIH
-PA Author Manuscript
NIH
-PA Author Manuscript

of the molecules due to the geometry and size of the AFM tip. Numbers indicate the meanand standard deviations of the total free DNA lengths.
Bintu et al. Page 15
Nat Struct Mol Biol. Author manuscript; available in PMC 2012 June 01.
NIH
-PA Author Manuscript
NIH
-PA Author Manuscript
NIH
-PA Author Manuscript

Figure 4.Transcription leads to hexamer formation. (a) Images illustrating change in nucleosomereduction upon transcription. The nucleosomes with reduced height are shown next tonormal-sized nucleosomes for comparison. Histograms of nucleosome heights for (b)untranscribed nucleosomes and (c) transcribed nucleosomes at all NTPs concentrationsshow the appearance of subnucleosomal particle with reduced height (fit by the red curve).(d) Heights of octamers (blue fit) compared with tetramers (green fit). (e) Height ofnucleosomes destabilized by incubation in high salt (1 M KCl). We identify the three peaksas tetramers (green), hexamers (red) and octamers (blue).
Bintu et al. Page 16
Nat Struct Mol Biol. Author manuscript; available in PMC 2012 June 01.
NIH
-PA Author Manuscript
NIH
-PA Author Manuscript
NIH
-PA Author Manuscript
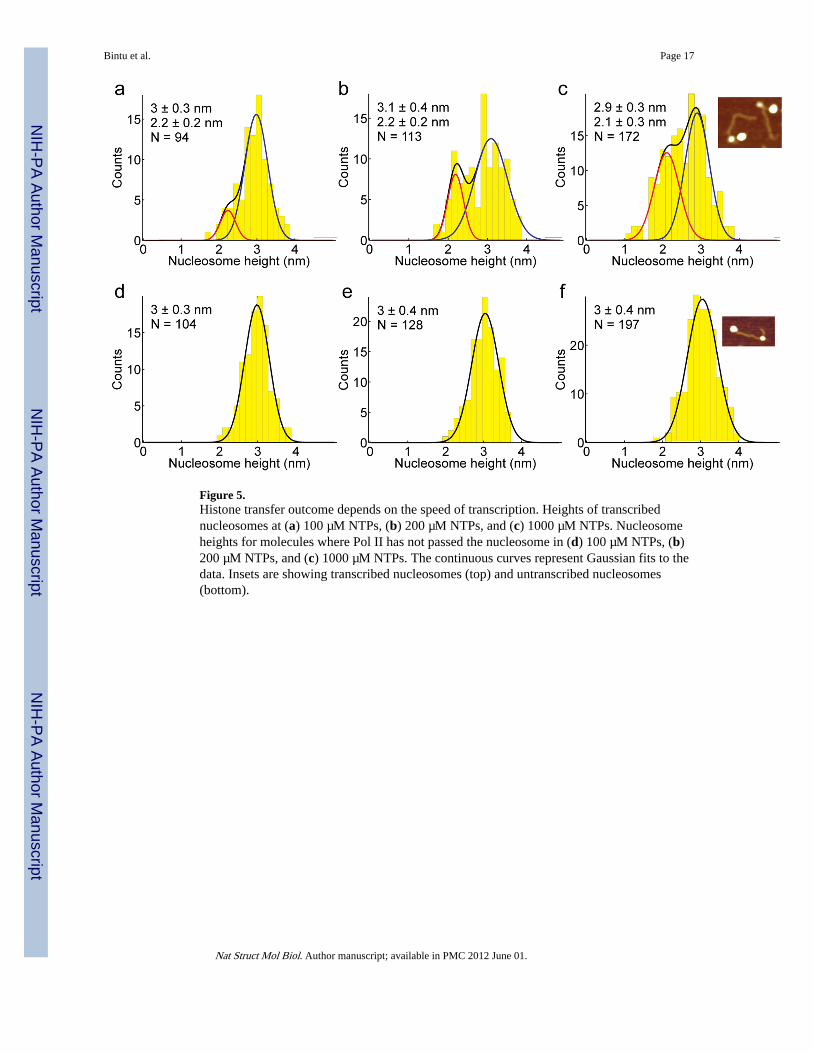
Figure 5.Histone transfer outcome depends on the speed of transcription. Heights of transcribednucleosomes at (a) 100 µM NTPs, (b) 200 µM NTPs, and (c) 1000 µM NTPs. Nucleosomeheights for molecules where Pol II has not passed the nucleosome in (d) 100 µM NTPs, (b)200 µM NTPs, and (c) 1000 µM NTPs. The continuous curves represent Gaussian fits to thedata. Insets are showing transcribed nucleosomes (top) and untranscribed nucleosomes(bottom).
Bintu et al. Page 17
Nat Struct Mol Biol. Author manuscript; available in PMC 2012 June 01.
NIH
-PA Author Manuscript
NIH
-PA Author Manuscript
NIH
-PA Author Manuscript

Figure 6.Histone transfer model. (a) Kinetic scheme of transcription and histone transfer. Pol II inblue, H2A–H2B dimers in red, H3–H4 dimers in brown, DNA in black. (b) Hexamer (red)and octamer (blue) transfer probabilities, as well as bare DNA formation (green) are plottedas a function of the net nucleosome unwrapping rate during elongation (kue). Experimentaldata are shown as circles; the shaded areas represent the model predictions, with the widthreflecting uncertainties in kt and N, as indicated in the text. The black line marks theelongation rate for the faster polymerase Pol III.
Bintu et al. Page 18
Nat Struct Mol Biol. Author manuscript; available in PMC 2012 June 01.
NIH
-PA Author Manuscript
NIH
-PA Author Manuscript
NIH
-PA Author Manuscript