An assessment of tropical cyclones rainfall erosivity for Taiwan
Upload
khangminh22Category
view
2download
0
Journal of the Meteorological Society of Japan, Vol. 89A, pp. 123--139, 2011. 123
DOI:10.2151/jmsj.2011-A08
The E¤ect of Tropical Cyclones on Southwest Monsoon Rainfall in the Philippines
Esperanza O. CAYANAN
Philippine Atmospheric, Geophysical and Astronomical Services Administration (PAGASA), Quezon City, Philippines
Tsing-Chang CHEN
Department of Geological and Atmospheric Sciences, Iowa State University, Ames, Iowa, U.S.A.
Josefina C. ARGETE
Institute of Environmental Science & Meteorology, College of Science, University of the Philippines,
Quezon City, Philippines
Ming-Cheng YEN
Department of Atmospheric Science, National Central University, Chung-Li, Taiwan
and
Prisco D. NILO
Philippine Atmospheric, Geophysical and Astronomical Services Administration (PAGASA), Quezon City, Philippines
(Manuscript received 30 May 2010, in final form 6 October 2010)
Abstract
Intense southwest monsoon (SWM) rainfall events causing massive landslides and flash floods along the west-ern sections of the Philippines were studied. These rainfall events, are not directly coming from the tropical cy-clones (TCs) for they are situated far north to northeast of Luzon Island. The heavy rainfall is hypothesized ascaused by the interaction of strong westerlies with the mountain ranges along the west coast of Luzon that pro-duces strong vertical motion and consequently generates heavy rainfall. Four of heavy SWM rainfall cases wereexamined to determine how the presence and position of tropical cyclones in the Philippine vicinity a¤ect theseSWM rainfall events; three cases with TC of varying positions within the Philippine area of responsibility (PAR)and the fourth case without TC. Using a spatial Fourier decomposition approach, the total streamfunction is de-composed into two flow regimes: monsoon basic flow (Waves 0–1) and tropical cyclone perturbation flow (Waves2–23) over a domain of (20�E–140�W, 5�S–35�N). The purpose of this flow decomposition is to determine thelatter’s e¤ect on or contribution to the monsoon activity. The analysis utilized the NCEP Final (FNL) data with1� long.� 1� lat. resolution. Results show that the tropical cyclones over the Pacific Ocean located northeast ofLuzon generate strong southwesterly winds over the west coast of Luzon. These in addition to the southwesterliesfrom the basic flow strengthened the southwest winds that interact with the high Cordillera Mountain ranges
Corresponding author: Esperanza O. Cayanan, Philip-pine Atmospheric, Geophysical and AstronomicalServices Administration (PAGASA), Science Garden,Agham Road, Diliman, Quezon City 1100, Philippines.E-mail: [email protected] 2011, Meteorological Society of Japan

along the west coast of Luzon. When the tropical cyclone is located north or north-northwest of Luzon, it gener-ates northwesterlies which converge with the southwesterlies from the basic flow. This results to enhancementof rising motion over western Luzon. The much stronger westerlies are then forced to rise above the mountainsresulting to strong vertical motion that brings about heavy rainfall.
1. Introduction
Lying in the vast Pacific Ocean and regarded astyphoon belt, the Philippines experiences an aver-age of 19 to 20 tropical cyclones per year and thepeak occurs during the months of July and August.From later part of May to September, southwest-erly winds or southwest monsoon (Habagat) prevailover the country (Flores and Balagot 1969; Wil-liams and Jung 1993), hence typhoon season coin-cides with the southwest monsoon months.
Monsoon is traditionally defined in terms ofthe annual reversal of the prevailing wind regime(Ramage 1971) and a contrast between a rainysummer and a dry winter. It is driven by the di¤er-ential heating between the huge land mass of Asia(with Tibetan Plateau as a raised platform of heatsource) and the huge water mass of Indian Ocean.During northern summer or southwest monsoon,winds began to blow from the cooler sea towardsthe land (Das 1986) arriving over the western Phil-ippines as southwesterlies.
On Philippine topography, mountain ranges withheights more than 500 m cover almost half of theLuzon Island. On the east coast of northern andcentral Luzon, lies the Sierra Madre Range (fromCagayan to Quezon Province). Along the westerncoast of northern Luzon, the Cordillera MountainRange runs down to central Luzon (the longest onFig. 1) and linked by the Cordillera Range withSierra Madre Range on the east.
Statistics show that 43% of the average annualrainfall in the Philippines is derived from the south-west monsoon (SWM; Asuncion and Jose 1980).The average SWM rainfall distribution has a maxi-mum rainfall of about 2,000 mm (or greater) con-centrated over mountain areas (Iba, 3,011 mm andBaguio, 2,645 mm) and heavy rains in the range1,500–1,999 mm are found along the western por-tion of Luzon (Asuncion et al. 1981). During theSWM season, the heavy rainfall events in the west-ern sections of Luzon cause flash floods over lowlying areas and landslides along mountain slopes.In these disastrous events, it is noted that the heavyrainfall are not directly coming from the tropicalcyclones (TCs) but due to the SWM surge enhancedby the presence of tropical cyclones situated north
to northeast of Luzon. A good example of this isthe big flash floods on the last week of August2004 which inundated four western and centralprovinces in Luzon putting them under state ofcalamity. The massive floodings were reported ascaused by heavy monsoon rains induced by Ty-phoon Marce which was over the Pacific Oceaneast to northeast of Luzon Island. A similar heavyrainfall event happened on the last week of August1990 was caused by intense SWM due to the pas-sage of three (3) consecutive TCs north of the Phil-ippines (Cayanan 1995). Another devastating eventof this kind was the historical Philippine floods inJuly 1972 where the Lingayen Gulf and the Manila
Fig. 1. Location of western Luzon stationsplotted on topographical map of the Phil-ippines. (Topographical map from Aka-saka, 2008 PMS presentation).
124 Journal of the Meteorological Society of Japan Vol. 89A
Bay, due to flood waters joined to become an in-land sea (Gordon 1973). For the same flood event,Asuncion and Jose (1980) noted that this unusualcondition was brought about by the presence oftropical cyclones that enhanced the monsoon ac-tivity at the time when the tropical disturbancewas north to northeast of the region. This kind ofweather condition was frequently observed, how-ever, no scientific study has yet been done to ex-plain this phenomenon.
It is hypothesized that the heavy rainfall in thewestern section of Luzon is caused by the monsoonsouthwesterly flow enhanced by the TC and its in-teraction with the mountains along the west coast.The strong southwesterlies are said to be a resultof the combination of the monsoon southwesterliesand the westerlies generated by TCs present in thevicinity of Luzon Island. During the rainy season,rainfall amount on the west coasts of the Philip-pines peaks when southwesterlies are strongest(Akasaka et al. 2007). The strength of these wester-lies is modulated by the position of the northwardpropagating 30–60 day monsoon trough and west-ern north Pacific anticyclone (Chen et al. 2000;Chen and Murakami 1988). Four TCs movedthrough the vicinity of the Philippines were ana-lyzed to substantiate the hypothesis introducedabove.
2. Data and methodology
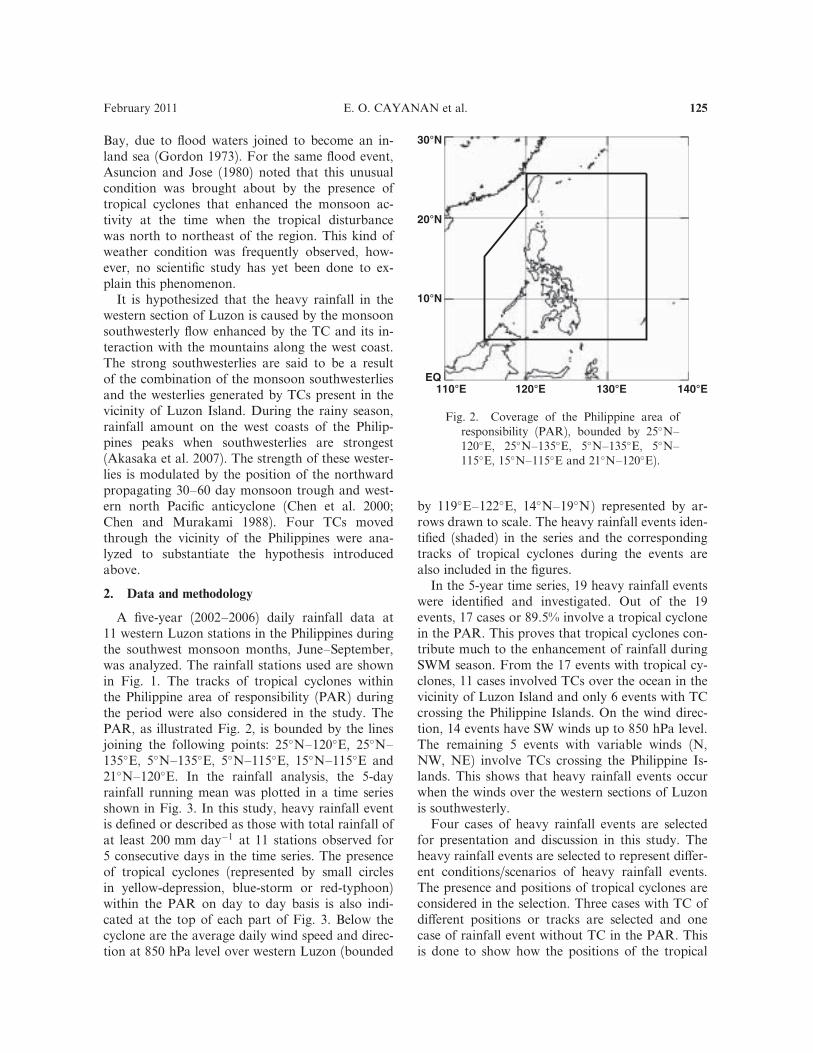
A five-year (2002–2006) daily rainfall data at11 western Luzon stations in the Philippines duringthe southwest monsoon months, June–September,was analyzed. The rainfall stations used are shownin Fig. 1. The tracks of tropical cyclones withinthe Philippine area of responsibility (PAR) duringthe period were also considered in the study. ThePAR, as illustrated Fig. 2, is bounded by the linesjoining the following points: 25�N–120�E, 25�N–135�E, 5�N–135�E, 5�N–115�E, 15�N–115�E and21�N–120�E. In the rainfall analysis, the 5-dayrainfall running mean was plotted in a time seriesshown in Fig. 3. In this study, heavy rainfall eventis defined or described as those with total rainfall ofat least 200 mm day�1 at 11 stations observed for5 consecutive days in the time series. The presenceof tropical cyclones (represented by small circlesin yellow-depression, blue-storm or red-typhoon)within the PAR on day to day basis is also indi-cated at the top of each part of Fig. 3. Below thecyclone are the average daily wind speed and direc-tion at 850 hPa level over western Luzon (bounded
by 119�E–122�E, 14�N–19�N) represented by ar-rows drawn to scale. The heavy rainfall events iden-tified (shaded) in the series and the correspondingtracks of tropical cyclones during the events arealso included in the figures.
In the 5-year time series, 19 heavy rainfall eventswere identified and investigated. Out of the 19events, 17 cases or 89.5% involve a tropical cyclonein the PAR. This proves that tropical cyclones con-tribute much to the enhancement of rainfall duringSWM season. From the 17 events with tropical cy-clones, 11 cases involved TCs over the ocean in thevicinity of Luzon Island and only 6 events with TCcrossing the Philippine Islands. On the wind direc-tion, 14 events have SW winds up to 850 hPa level.The remaining 5 events with variable winds (N,NW, NE) involve TCs crossing the Philippine Is-lands. This shows that heavy rainfall events occurwhen the winds over the western sections of Luzonis southwesterly.
Four cases of heavy rainfall events are selectedfor presentation and discussion in this study. Theheavy rainfall events are selected to represent di¤er-ent conditions/scenarios of heavy rainfall events.The presence and positions of tropical cyclones areconsidered in the selection. Three cases with TC ofdi¤erent positions or tracks are selected and onecase of rainfall event without TC in the PAR. Thisis done to show how the positions of the tropical
Fig. 2. Coverage of the Philippine area ofresponsibility (PAR), bounded by 25�N–120�E, 25�N–135�E, 5�N–135�E, 5�N–115�E, 15�N–115�E and 21�N–120�E).
February 2011 E. O. CAYANAN et al. 125
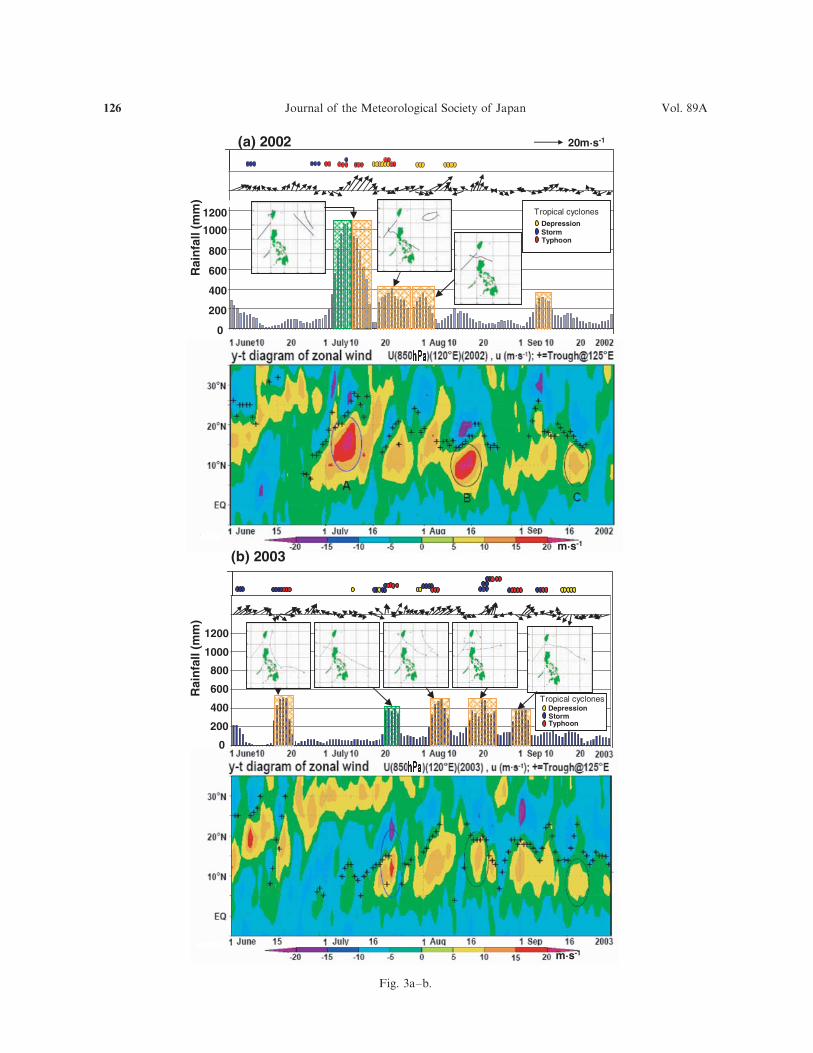
Fig. 3a–b.
126 Journal of the Meteorological Society of Japan Vol. 89A
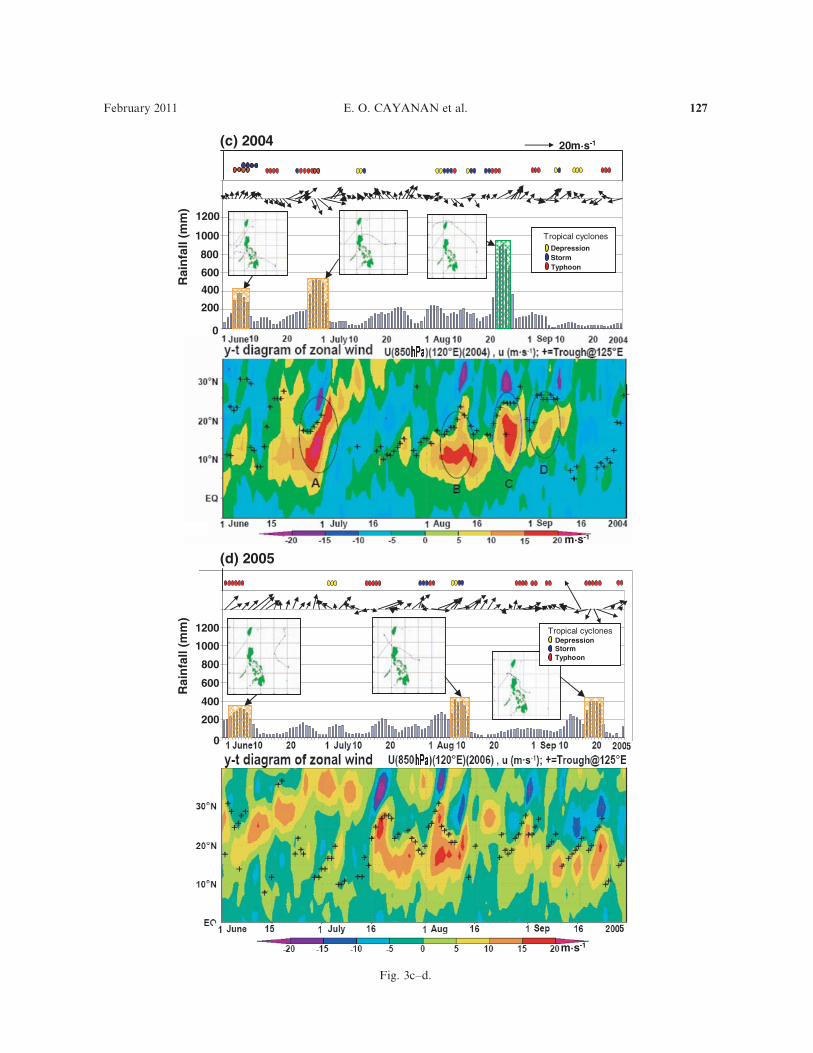
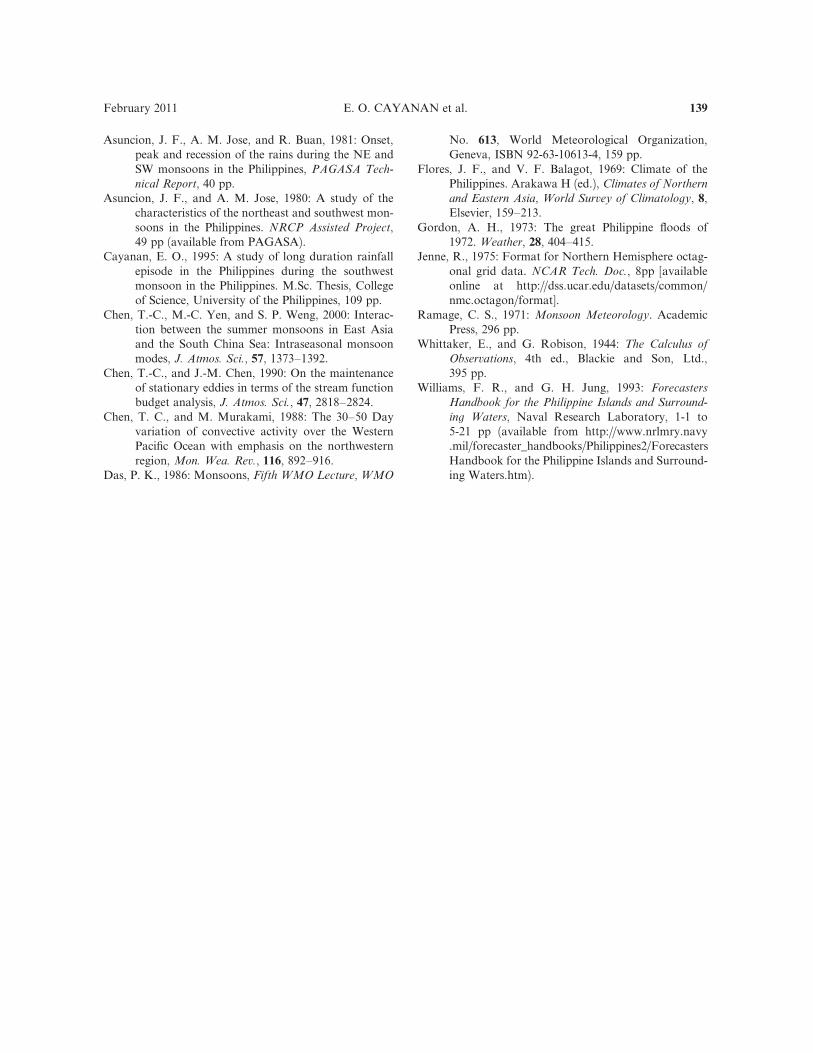
Fig. 3c–d.
February 2011 E. O. CAYANAN et al. 127

cyclones a¤ect the intensity of southwest monsoonrainfall. The first case (5–9 July 2002) involves aTC far NE of Luzon and another over Taiwan.The second case (19–23 July 2003) has a TC cross-ing northern Luzon and the daily winds up to850 hPa are not totally southwesterly. The thirdcase (23–27 August 2004) involves a TC locatedeast to north-northeast of Luzon over the PacificOcean and the fourth case with no TC within thePAR. The rainfall time series with the selected casesshaded green and the corresponding tropical cy-clones involved are shown in Fig. 3. To prove thehypothesis that the heavy rainfall is due to strongwesterlies, the latitude-time cross-section charts(y-t diagram) of the zonal wind (U ) at 850 hPawere prepared and presented below the time series.
The total 5-day rainfall for all the cases are pre-sented in Fig. 4b while Fig. 4a illustrates the aver-age wind distribution and the tracks of the TCs.
A spatial Fourier decomposition approach is ap-plied to decompose the wind wave pattern into thebase flow and the tropical cyclone perturbationflow. This is done to delineate the e¤ects or contri-butions of the two flow regimes on the heavy rain-fall over the western section of Luzon. Streamfunc-tion is the parameter used in the analysis since itcan represent the wind velocity field with singlevariable and it can very well depict the circulationin the tropics (Chen and Chen 1990). The NCEPFinal (FNL) gridded data at 950 hPa level with 1�
long.� 1� lat., a resolution of one (1) degree, wasutilized in the diagnostic analysis. In order to
Fig. 3. Time series of 5-daily rainfall running mean (bar graph) at 11 western Luzon stations with average850 hPa wind ( f ¼ 20 m s�1) at 119�E–122�E, 14�N–20�N and tropical cyclones (f depression, f stormor f typhoon) within the PAR. Shaded portions in the series are heavy rain events together with corre-sponding track of tropical cyclones. Green shaded events are the selected cases for discussion. The lowerportion of the figure is the latitude-time cross-section (y-t diagram of zonal wind (U ) at 120�E, with lat-itudinal positions of monsoon trough (þ) at 125�E. (a) June–September 2002, (b) June–September 2003, (c)June–September 2004, (d) June–September 2005 and (e) June–September 2006.
128 Journal of the Meteorological Society of Japan Vol. 89A

clearly see the e¤ect of the TC and topography, thevertical velocity over the island of Luzon was com-puted using the equation of continuity. As the bot-tom boundary condition, we used the equation
ws ¼ Vs � ‘h, where ws and Vs are vertical velocityand wind vector at surface, and h is topography.The 1� � 1� FNL data were interpolated into the18 km� 18 km grid in terms of a 16-point Bessel
Fig. 4. (a) The average 850 hPa windfield and tracks of tropical cyclones of the four cases of rainfall events.(b) distribution of observed total rainfall of the four cases of heavy rainfall event. Dark solid lines are theaverage trough positions.
February 2011 E. O. CAYANAN et al. 129

interpolation scheme which was designed by Jenne(1975), following the mathematical theory devel-oped by Whittaker and Robinson (1944). Then,the vertical motion is computed with the 18 km res-olution in the domain bounded by 118E–124E and14N–19N. The rainfall along the windward sideof the western Luzon Island is proportional to ver-tical velocity, caused by the interaction of the west-erly flow with the north-south oriented mountains.Thus, the amount of additional rainfall derivedfrom the tropical cyclone westerlies is proportionalto the di¤erence of vertical motion between thosegenerated by the base flow and the total flow(which includes the basic and perturbation flow).
3. The SWM heavy rainfall events
The four cases of heavy rainfall events selectedare described and compared to see how the pres-ence and positions of the TCs a¤ect the rainfallalong the western sections of Luzon.
Case 1: July 5–9, 2002, involves two tropical cy-clones (the upper panel of Fig. 3a): TY Gloria witha north-northwest track from July 7–9 to the fareast of Luzon near the boundary of the PAR andTS Hambalos on July 9 over Taiwan area. Thiscase is the heaviest and longest rainfall event in thetime series of 2002 summer months. It has a dura-tion of about 10 days (05–14 July 2002) but onlythe first 5-day rainfall activity was investigated.The maximum 24-hr rainfall (346 mm) was re-corded in Baguio City, the station of highest alti-tude of about 1,500 meters above mean sea level.The total 5-day rainfall distribution in Fig. 4b clearlyshows that the rainfall is maximum over westernLuzon decreasing eastward. The strength and ex-tent of the 850 hPa westerlies during the heavyrainfall events are shown in the latitude-time crosssection chart (y-t diagram) of the zonal wind (U ) at120�E longitude (the bottom panel of Fig. 3a). It isnoted that strong westerlies in the y-t diagram cor-respond to maximum rainfall in the time series (theupper panel of Fig. 3a). The latitudinal positions ofthe monsoon trough (þ) indicated in the y-t dia-gram reveals that at 125�E longitude, the trough ispresent to the north of the maximum westerly. It isnoted that there is about 35 days di¤erence betweenthe two maximum westerlies A and B, and around30 days between maxima B and C which supportsthe 30–60 day oscillation of monsoon trough(Chen et al. 2000). The average 850 hPa wind fieldin Fig. 4a indicates that the southwesterly flow overthe western Philippines is stronger than 10 m s�1. It
also shows the daily positions the two tropical cy-clones ({|) located along the monsoon trough. TheseTCs strengthened the monsoon trough which en-hanced the SW flow and consequently the rainfallover western Luzon as shown in Fig. 4b.
The Case 2 rainfall event on 19–23 July 2003 wasselected to study the impact of a TC crossing north-ern Luzon to the SWM rainfall. In Fig. 3b, the y-tdiagram of the 850 hPa zonal wind showed strongwesterlies below 15�N (southern part of the ty-phoon) and easterlies above 18�N (northern partof the typhoon) during the event (blue encircledarea). It is also noted that strong westerlies corre-spond to heavy rainfall events in the rainfall timeseries in the upper panel of Fig. 3b. It is again im-portant to note that the rainfall only covers the sta-tions from 14�N to 19�N latitude. The 30–60 daymonsoon trough oscillation is also projected in thisperiod by strong westerlies on the third weeks ofJuly, August and September. The average 850 hPawind field for the 5-day event in Fig. 4a illustratessouthwesterlies over the Philippines convergingwith the easterlies and forming the ITCZ or mon-soon trough. It is noted that the winds over thewestern section of Luzon are more southerly thanwesterly. From the rainfall pattern in Fig. 4b, it isclearly seen that the rainfall in Case 2 is due to theTC that passed over Luzon Island.
The Case 3 rainfall episode in August 2004 isconsidered to be one of the wettest SWM events ex-perienced in northern Luzon. The time series in theupper panel of Fig. 3c shows Case 3 event hasthe highest rainfall for the summer of 2004 as wellas heaviest among the four cases being studied(Fig. 4b). This event involves a TC which origi-nated over the Pacific Ocean moved northwest andpassed north of Luzon Island. The y-t diagram inthe bottom panel of Fig. 3c clearly shows the strongwesterlies (blue encircled) at longitude 120�E from10�N–22�N latitude correspond to maximum rain-fall on August 23–27, 2004 in the time series. Thesecond maximum (labeled B) at 5�N–15�N latitudebetween August 1–15 is not reflected in the rainfalltime series in the upper panel of Fig. 3c because therainfall plotted only cover stations from 14�N–19�N. Above the westerlies are strong easterlies at25�N–30�N north of the typhoon. Troughs (de-noted by þ) are also noted to be present north ofstrong westerlies. The 30–60 day oscillation is re-flected by the maximum westerlies; B and D for 30days, and A and C for 60 days. For the winds,strong southwesterlies prevailed over the Philip-
130 Journal of the Meteorological Society of Japan Vol. 89A

pines from the surface up to the 850 hPa level as in-dicated in the average wind field in Fig. 4a. As indi-cated in the figure, another cyclone, TY Chaba ap-proached on Aug 25–27 but did not enter the PAR.There actually are two cyclones within the domainthat are the embedded in the trough which enhancedthe southwest monsoon flow during the event.
For Case 4, the August 2006 case does not in-volve a tropical cyclone within the PAR. The rain-fall event which is the least among the cases studiedoccurred on 17–21 August 2006. The August 2006rainfall event as seen in the time series in the upperpanel of Fig. 3e and in the total rainfall distributionin Fig. 4b is comparably weaker than the otherevents under study. The maximum 24-hour rainfallobserved in Baguio and Dagupan (140 mm) ismuch less compared to 346 mm (Baguio) in July2002 and 400 mm (Vigan) in August 2004. Thedirect relationship of the strength of westerly windsand rainfall is still evident in the y-t diagram of thezonal wind (the bottom panel of Fig. 3e) and rain-fall time series (the upper panel of Fig. 3e). TheCase 4 westerly winds on 17–21 August 2006 inthe y-t diagram (blue encircled area in the y-t dia-gram) are weaker as well as the corresponding rain-fall intensity compared to the other rainfall events.The 30-day oscillation is also noted to occur on thethird week of July (A) and August (B). The rainfallcorresponding to B is not reflected in the time seriesbecause the area a¤ected is below 14�N latitudewhich is not covered by the rainfall stations plotted.Event A which involves tropical cyclone is noted tohave intense rainfall compared to Case 4. The aver-age 850 hPa wind field in Fig. 4a only shows asmall cyclonic circulation at the end of the mon-soon trough located north-northeast of Luzon.This trough is instrumental to the generation ofsouthwest wind flow over the country. The averageposition of monsoon trough compared to the otherheavy rainfall events is more to the east (up to129�E) and at higher latitude (in the vicinity of25�N). It is also noted that the soutwesterlies areweaker (only about 10 m s�1).
From the four cases of rainfall events selected, itis important to stress that the rainfall in Cases 1and 3 are not directly coming from the cloud bandsof the tropical cyclones but due to the strong south-west flow over western Luzon. As mentionedearlier, the southwest flow is hypothesized to bestrengthened by the addition of the westerlies gen-erated by the tropical cyclone and the orographice¤ect of the Cordillera mountains enhanced the lift-
ing mechanism resulting to heavy rainfall over thewestern Luzon. It is also important to note thatthe rainfall events follow the 30–60 day oscillationsof the monsoon trough. This information on mon-soon trough propagation could serve as a goodbasis for monsoon rainfall forecasting.
4. Diagnostic analysis
Diagnostic analysis was applied to SW monsoonheavy rainfall events with tropical cyclones ofvarying positions or tracks (Cases 1–3) and with-out tropical cyclone in the PAR (Case 4). Usingthe spatial Fourier decomposition approach, the950 hPa streamflow was separated into the basicmonsoon flow (Waves 0–1) and the tropical cy-clone perturbation flow (Waves 2–23) to see howeach of them a¤ect or contribute to the rainfallover western Luzon. Although the analysis in-volved the expanded horizontal domain of 20�E–140�W, the figures (Figs. 5, 8, 10) presented onlycover the target domain of 100�E–140�E. In thestreamfunction diagram, the dark shaded portionsare the positive values which correspond to anti-cyclonic flow and the negative areas (unshaded) ascyclonic flow.
4.1 Tropical cyclone north-northeast of Luzon
Case 1 (5–9 July 2002), involves two tropicalcyclones in the PAR: TY Gloria which originatedover the Pacific Ocean east of northern Luzon,moved on a NNW track from July 7–9; and TSHambalos which barely stay on July 9 over northof Luzon in the vicinity of Formosa Strait. Themaximum rainfall occurred on July 8. In order tosave space we shall focus our presentation on thisdate. Upon application of the spatial Fourier de-composition, the streamfunction diagrams are pre-sented in Fig. 5. The actual or total streamfunction(cT ), the basic flow (cB), and the tropical cycloneperturbation flow (cTC) are shown in the first row(Fig. 5a). In the basic flow, westerly to southwest-erly winds flow over Luzon Island for the whole du-ration of the rainfall event. A trough (heavy dashedline) is also dominating, moving northward withtime extending from southern China to the Philip-pine Sea. On the other hand, the TC perturbationflow (cTC) shows a TC far NNE of Taiwan with atrough extending down to Formosa Strait. Thecombination of the basic and the TC flow deepenedthe trough in the actual flow and the northwardmovement of the TC made the east end of thetrough shift to the north (Fig. 5a). The streamlineanalysis in Fig. 5b shows southwesterly winds pre-
February 2011 E. O. CAYANAN et al. 131

vailing over Luzon in all the regimes (total flow,basic flow and TC perturbation flow) during thewhole period of rain event. Convergence of north-westerlies was generated when the TC is locatednorth to northwest of Luzon and southwesterliesfrom the basic flow over western Luzon. The com-bination of the westerlies from the basic flow andthose generated by the TC flow strengthened thetotal westerlies and the vertical wind over westernLuzon in the actual flow.
The vertical motion (W in m s�1) over westernLuzon which is computed using zonal wind and to-pography is shown in Fig. 5c; the first row, WT isthe total vertical motion, the second panel, WB
is the vertical velocity of the basic flow and thirdpanel, WTC corresponds to vertical motion in thetropical cyclone flow. The positive values (shaded)denote upward motion and the negative valuesmean downward motion. It is visible that in the ba-sic monsoon flow, strong vertical motion occurred
Fig. 5. (a) Stream function (c) diagram at 950 hPa level for 8 July 2002. By Fourier analysis, total streamfunction (cT ) is decomposed into basic flow, cB (Waves 0–1) and tropical cyclone streamflow, cTC (Waves2–23). The heavy dashed lines represent monsoon troughs. (b) Daily mean streamline chart superimposedwith p vertical velocity (o) for 8 July 2002 generated from actual windflow, basic windflow and TC wind-flow. (c) Vertical motion (W , m s�1) computed from Ws ¼ Vs � ‘h; WT for total flow, WB for basic flow,and WTC for tropical cyclone flow for 8 July 2002 of case1.
132 Journal of the Meteorological Society of Japan Vol. 89A

during the rainfall event. In fact, the tropical cy-clone induced vertical motion over the western sec-tions on July 8. On the July 5, a cyclonic circulationnorth of Taiwan enhanced the southwest flow overwestern Luzon while the two TCs over Taiwan andPhilippine Sea are responsible on July 8. The nu-merical contributions of the TC and the basic flowin the vertical motion over the entire period of theevent for 5–9 July 2002 are presented in Table 1.These are the maximum point values at 120�Efrom the grid data of Fig. 5. The TC contributesabout to 44% (6/18) for 1st day (July 5), 27% (8/30) for 4th day (July 8) and 32.5% (12/32) for 5thday.
Strong vertical motion due to westerlies andtopography correspond to the increase in theamount of rainfall. This direct proportionality ofvertical motion and rainfall is depicted in the lati-tude-time cross section (y-t diagram) of verticalmotion (Fig. 6a) and observed station rainfall (Fig.6d). Note that maximum rainfall is observedaround 17�N latitude where strong vertical motionalso exists on the 4th and 5th day (July 8–9). Theincrease is due to the contribution of the TCs onJuly 7–9.
Another event with a TC NE of Luzon is Case 3:23–27 Aug. 2004. It involves one TC within thePAR with a northwest track from the Pacific Oceanfrom Aug. 20–25. Another TC developed northeastoutside of the PAR and moved NNW towardsJapan from Aug. 25–27. The spatial Fourier de-composition was also applied to Case 3 and the re-sulting vertical motions of the total, basic and TCflows are summarized in Table 3. It is noted fromthe table that only the TC within the PAR onAug. 23–25 contributed to the vertical motion.The basic southwest flow is sole responsible for thevertical motion on Aug. 26–27. Fig. 7a–c (verticalmotion) and Fig. 7d (rainfall) show that the maxi-
Table 1. Maximum values of 950 hPa vertical motion(�10�3 m s�1) at 120�E derived from zonal wind andtopography for Case 1: 5–9 July 2002.
5 July 6 July 7 July 8 July 9 July
Total 18.0 12.0 22.0 30.0 32.0Basic 10.0 12.0 20.0 22.0 20.0TC 6.0 0.0 2.0 8.0 12.0
Fig. 6. Time-latitude cross section of vertical motion (m s�1)at 120�E, 950 hPa level of (a) total flow, (b) basic flow and(c) tropical cyclone flow, and (d) rainfall (mm day�1) at120�E for case 1: 5–9 July 2002.
February 2011 E. O. CAYANAN et al. 133

mum rainfall on Aug. 27 is mainly from the strongbasic southwest flow.
4.2 Tropical cyclone crossing northern Luzon
For Case 2: 19–23 July 2003, which involves aTC crossing northern Luzon, Fig. 8a shows the to-tal streamfunction left panel decomposed into thebasic flow (middle panel) and tropical cyclone per-turbation flow (right panel) on July 22. In the totalflow, a monsoon trough (NW-SE oriented) extendsfrom southern China down to the Philippines. Thetrough weakens on the last two days as the two cy-clonic circulations embedded in the trough movedto the northwest. The monsoon trough is also de-picted in the basic flow but it is relatively shallowcompared to the total flow. The tropical cyclone
perturbation flow clearly illustrates the passage ofTyphoon Harurot which was over northern Luzonon July 22. In the streamlines analysis south-westerly winds prevailed over western Luzon dur-ing the 5-day period in the basic flow. However thewinds are weaker because the streamlines are farapart. The addition of the tropical cyclone flowstrengthened the westerlies making the streamlinescloser in the total or actual flow. Vertical windsare only noted to be present over western Luzonduring the passage of the typhoon over the islandon July 22 (Fig. 8b). The vertical motion generatedby the interaction of westerlies and topography areillustrated in Fig. 8c and summarized in Table 2. Itis seen in the total flow that strong positive vertical
Table 2. Maximum 950 hPa vertical motion(�10�3 m s�1) at 120�E derived from zonal wind andtopography for Case 2: 19–23 July 2003.
19 July 20 July 21 July 22 July 23 July
Total/Actual �10.0 0.8 6.8 14.0 �1.0Basic Flow 8.0 8.3 4.6 6.0 8.0TC Flow �18.0 �7.5 2.2 8.0 �9.0
Fig. 7. Same as Fig. 6, except for case 3: 23–27 Aug 2004.
Table 3. Maximum 950 hPa vertical motion(�10�3 m s�1) at 120�E derived from zonal wind andtopography for Case 3: 23–27 Aug. 2004.
23 Aug 24 Aug 25 Aug 26 Aug 27 Aug
Total/Actual 20.0 22.0 22.0 22.0 22.0Basic Flow 10.0 18.0 20.0 22.0 22.0TC Flow 10.0 4.0 2.0 0.0 0.0
134 Journal of the Meteorological Society of Japan Vol. 89A

motion on the western section of Luzon are onlyobserved on July 21 (not shown) and maximum onJuly 22 during the passage of the TC over theisland. The corresponding relationship verticalmotion and rainfall is illustrated in Fig. 9.
4.3 No tropical cyclone in the PAR
In Case 4 rain event, no tropical cyclone is withinthe PAR but initially, there is a cyclonic vortex farto the northeast at 132�E, 34�N (over southernJapan) on the 1st day (August 17) (total flow) and(TC flow). The TC moved to the NE leaving atrough extending from southern Japan to the SWpassing Taiwan. The trough is initially NE-SW ori-
ented. In the basic flow, Fig. 10a, the monsoontrough on August 20 is positioned horizontally inW-E direction from southern China to southernJapan. In the TC flow, the trough which is the rem-nant of the TC that moved NE expanded to SWcovering Luzon. The combination of the basic andthe TC flow resulted to a monsoon trough in thetotal flow which is initially extending from southernJapan oriented NE–SW becoming horizontally ori-ented from Pacific Ocean extending to the west overHainan on the 5th day.
In the streamline analysis (Fig. 10b) and verti-cal wind diagram, southwesterly winds blow overnorthern Luzon in the basic flow (center panel of
Fig. 8. Same as Fig. 5, except for 22 July 2003.
February 2011 E. O. CAYANAN et al. 135

Fig. 10b). Vertical winds are also noted over thewestern sections of Luzon. In the TC flow, windconvergence are noted over northwestern Luzonand moderate wind convergence over southwesternLuzon. The combination of VB and VTC resultedin slightly stronger westerlies over northwesternLuzon. A change in wind direction over north-western Luzon is also noted in the total flow; thewind is initially southwesterly to westerly then be-came northwesterly on the last two days.
Checking on the vertical motion generated bywesterlies and topography, the total flow in Fig.10c, shows that there is a total upward motion ofabout 12–14� 10�3 m s�1 over western Luzon.The lifting motion is clearly seen to be due to thebasic flow. No vertical motion at all is generatedby Waves 2–23 (supposed to be tropical cycloneflow) in the target area throughout the duration ofthe rainfall event. The values of vertical motionover western Luzon are listed in Table 4. The lati-tude-time cross section of vertical motion at 120�E(Fig. 11a) clearly summarizes the daily contributionof the basic flow and the tropical cyclone flow onvertical motion. There is maximum upward motionat latitude 17�N on August 18 and August 20 and
minimum on August 21 (Fig. 11a). This upwardmotion is caused by the basic flow which is higheston August 20 (Fig. 11b). Lifting motion is mini-mum on August 21 because of the sinking motiongenerated by Wave Numbers 2–23 (Fig. 11c).
Based alone on the rainfall observed during thefour di¤erent cases of events in Fig. 4b, it is alreadyvisible that the case without TC in the PAR (Case4) has the least amount. Also, the rainfall distribu-tion pattern already revealed that the rainfall inCase 2 is directly due to the crossing TC in Luzon.After the diagnostic analysis, it is clearly shown andexplained how the presence and position of tropi-cal cyclone a¤ect the rainfall over western Luzon.When the TC is located to the northeast of Luzon,it generates southwesterlies that add strength to thesouthwesterlies from the basic flow. When the TC islocated north to northwest of Luzon, it generatesnorthwesterlies or westerlies which converge withthe southwesterlies from the basic flow resulting torising motion. In addition to the strengthened west-erlies accumulated from the TC and the basic flow,the convergence induced greater rising motion overthe mountain areas. It is shown in Case 4 thatSWM rain event without TC (Fig. 11d) occurs
Fig. 9. Same as Fig. 6, except for case 2: 19–23 July 2003.
136 Journal of the Meteorological Society of Japan Vol. 89A

due to strong southwesterlies. The westerlies arestrengthened by the trough located northeast ofLuzon.
5. Conclusion
In the study, it is observed that majority (about89.5%) of the heavy rainfall events involve tropicalcyclones. However, only 31% of these events in-volve TCs crossing Luzon Island which means thatthe heavy rains during rest (69%) of the events arenot directly coming from the tropical cyclone rainbands. Excessive rainfalls were also recorded at thewestern stations even if the tropical cyclones areover the ocean north-northeast of Luzon Island.
Based on previous studies and on the observationalanalysis, strong westerlies up to 850 hPa over west-ern Luzon correspond to heavy rainfall. The heavyrains are therefore attributed to the strong and hu-mid SW wind blowing over western Luzon but thepresence of the tropical cyclones also has an indi-rect dominating e¤ect on the intensity of rainfall.It was hypothesized that the tropical cyclones overthe ocean generate westerlies in addition to theSW monsoon airstream. The mountain range alongwestern Luzon is also a contributing factor becauseit serves as the lifting mechanism for the humidwesterlies to rise and condense into clouds.
To prove the hypothesis, the tropical cyclone
Fig. 10. Same as Fig. 5, except for 20 Aug 2006.
February 2011 E. O. CAYANAN et al. 137

flow was isolated from the basic monsoon flowusing the spatial Fourier decomposition. This wasdone to determine the contribution of each toSWM rainfall. Results reveal that tropical cycloneslocated to the northeast of Luzon generate strongsouthwesterlies over western Luzon which add tothe strength of the southwesterlies from the basicflow. Meanwhile, tropical cyclones located northto northwest of Luzon generate northwesterlieswhich converge with southwesterlies and enhancethe rising motion over the windward slopes of themountain. These in addition to the southwesterliesfrom the basic flow strengthened the southwestwinds that interact with the high Cordillera Moun-tain ranges along the west coast of Luzon. Themuch stronger westerlies are then forced to riseabove the mountains resulting in stronger vertical
motion that brings about heavy rainfall. However,when the southwest flow is very strong, heavy rainsare possible even when there is only a trough in-stead of a cyclone northeast of Luzon.
Acknowledgement
This research study is undertaken through thesupport and assistance of the Philippine Atmo-spheric, Geophysical and Astronomical ServicesAdministration (PAGASA), Department of Scienceand Technology (DOST), the Institute of Environ-mental Science and Meteorology (IESM), Collegeof Science, University of the Philippines, the Atmo-spheric Science Department, National CentralUniversity, Taiwan and Department of Geologicaland Atmospheric Sciences, Iowa State University,U.S.A. Comments/suggestions made by two re-viewers are helpful to improve the presentation ofthis paper. The technical support provided by Mr.Jenq-Dar Tsay to prepare this manuscript is highlyappreciated.
References
Akasaka, I., W. Morishima, and T. Mikami, 2007: Sea-sonal march and its spatial di¤erence of rainfall inthe Philippines, Int. J. Climatol., 27, 715–725.
Fig. 11. Same as Fig. 6, except for case 4: 17–21 Aug 2006.
Table 4. Maximum 950 hPa vertical motion(�10�3 m s�1) at 120�E derived from zonal wind andtopography for Case 4: 17–21 Aug. 2006.
17 Aug 18 Aug 19 Aug 20 Aug 21 Aug
Total/Actual 12.0 14.0 12.0 14.0 6.0Basic Flow 12.0 14.0 16.0 20.0 16.0TC Flow 0.0 0.0 �4.0 �6.0 �10.0
138 Journal of the Meteorological Society of Japan Vol. 89A
Asuncion, J. F., A. M. Jose, and R. Buan, 1981: Onset,peak and recession of the rains during the NE andSW monsoons in the Philippines, PAGASA Tech-
nical Report, 40 pp.Asuncion, J. F., and A. M. Jose, 1980: A study of the
characteristics of the northeast and southwest mon-soons in the Philippines. NRCP Assisted Project,49 pp (available from PAGASA).
Cayanan, E. O., 1995: A study of long duration rainfallepisode in the Philippines during the southwestmonsoon in the Philippines. M.Sc. Thesis, Collegeof Science, University of the Philippines, 109 pp.
Chen, T.-C., M.-C. Yen, and S. P. Weng, 2000: Interac-tion between the summer monsoons in East Asiaand the South China Sea: Intraseasonal monsoonmodes, J. Atmos. Sci., 57, 1373–1392.
Chen, T.-C., and J.-M. Chen, 1990: On the maintenanceof stationary eddies in terms of the stream functionbudget analysis, J. Atmos. Sci., 47, 2818–2824.
Chen, T. C., and M. Murakami, 1988: The 30–50 Dayvariation of convective activity over the WesternPacific Ocean with emphasis on the northwesternregion, Mon. Wea. Rev., 116, 892–916.
Das, P. K., 1986: Monsoons, Fifth WMO Lecture, WMO
No. 613, World Meteorological Organization,Geneva, ISBN 92-63-10613-4, 159 pp.
Flores, J. F., and V. F. Balagot, 1969: Climate of thePhilippines. Arakawa H (ed.), Climates of Northern
and Eastern Asia, World Survey of Climatology, 8,Elsevier, 159–213.
Gordon, A. H., 1973: The great Philippine floods of1972. Weather, 28, 404–415.
Jenne, R., 1975: Format for Northern Hemisphere octag-onal grid data. NCAR Tech. Doc., 8pp [availableonline at http://dss.ucar.edu/datasets/common/nmc.octagon/format].
Ramage, C. S., 1971: Monsoon Meteorology. AcademicPress, 296 pp.
Whittaker, E., and G. Robison, 1944: The Calculus of
Observations, 4th ed., Blackie and Son, Ltd.,395 pp.
Williams, F. R., and G. H. Jung, 1993: Forecasters
Handbook for the Philippine Islands and Surround-
ing Waters, Naval Research Laboratory, 1-1 to5-21 pp (available from http://www.nrlmry.navy.mil/forecaster_handbooks/Philippines2/ForecastersHandbook for the Philippine Islands and Surround-ing Waters.htm).
February 2011 E. O. CAYANAN et al. 139
Copyright © 2022 FDOKUMEN