Fluorescence-based characterization of phycoerythrin-containing cyanobacterial communities in the...
22
* Corresponding author. Fax: 001-03-346-2364. E-mail address: miche@darkwing.uoregan.edu (A. Michelle Wood) Deep-Sea Research II 46 (1999) 1769}1790 Fluorescence-based characterization of phycoerythrin-containing cyanobacterial communities in the Arabian Sea during the Northeast and early Southwest Monsoon (1994}1995) A. Michelle Wood!,",*, Michael Lipsen!, Paula Coble# !Department of Biology, University of Oregon, Eugene, OR 97403, USA "Naval Research Laboratory, Stennis Space Center, MS 39529, USA #Department of Marine Science, University of South Florida, St. Petersburg, FL 33701, USA Received 25 September 1997; received in revised form 23 July 1998; accepted 18 October 1998 Abstract Scanning #uorescence spectroscopy was used to investigate the spatial and temporal variabil- ity in the #uorescence signature of phycoerythrin-containing organisms in the Arabian Sea during the early Northeast and early Southwest Monsoon (1994}1995). Phycoerythrin (PE) emission spectra were relatively invariant among all the samples collected on either cruise; the relatively symmetrical PE emission peaks showed maxima at wavelengths ranging from 563}572 nm. PE excitation spectra always showed either a strong shoulder or a peak at wavelengths absorbed maximally by phycourobilin (PUB) chromophores as well as a peak at wavelengths absorbed maximally by phycoerythrobilin (PEB) chromophores. Thus, the Ara- bian Sea appears to be di!erent from the Black Sea or Gulf of Maine in that PUB-lacking forms of PE rarely, if ever, dominate the PE signal. Fluorescence excitation signatures di!ered in the relative excitation of PE emission by wavelengths absorbed by PUB (&495 nm, Ex PUB ) and by wavelengths absorbed by PEB (&550 nm, Ex PEB ); these were distinguished by having either very low (&0.6), very high (&1.8), or intermediate Ex PUB :Ex PEB ratios. The distribution of samples with di!erent PE #uorescence signatures was investigated extensively during the early Southwest Monsoon, and communities characterized by the low Ex PUB :Ex PEB ratios were closely associated with cooler (24}273C), fresher (35.7}36.25 psu) water in#uenced by coastal upwelling. In general, `ambienta surface water of the Arabian Sea during the early Southwest 0967-0645/99/$ - see front matter ( 1999 Elsevier Science Ltd. All rights reserved. PII: S 0 9 6 7 - 0 6 4 5 ( 9 9 ) 0 0 0 4 3 - 0
-
Upload
independent -
Category
Documents
-
view
0 -
download
0
Transcript of Fluorescence-based characterization of phycoerythrin-containing cyanobacterial communities in the...

*Corresponding author. Fax: 001-03-346-2364.E-mail address: [email protected] (A. Michelle Wood)
Deep-Sea Research II 46 (1999) 1769}1790
Fluorescence-based characterization ofphycoerythrin-containing cyanobacterial
communities in the Arabian Sea during theNortheast and early Southwest Monsoon
(1994}1995)
A. Michelle Wood!,",*, Michael Lipsen!, Paula Coble#!Department of Biology, University of Oregon, Eugene, OR 97403, USA
"Naval Research Laboratory, Stennis Space Center, MS 39529, USA#Department of Marine Science, University of South Florida, St. Petersburg, FL 33701, USA
Received 25 September 1997; received in revised form 23 July 1998; accepted 18 October 1998
Abstract
Scanning #uorescence spectroscopy was used to investigate the spatial and temporal variabil-ity in the #uorescence signature of phycoerythrin-containing organisms in the Arabian Seaduring the early Northeast and early Southwest Monsoon (1994}1995). Phycoerythrin (PE)emission spectra were relatively invariant among all the samples collected on either cruise; therelatively symmetrical PE emission peaks showed maxima at wavelengths ranging from563}572 nm. PE excitation spectra always showed either a strong shoulder or a peak atwavelengths absorbed maximally by phycourobilin (PUB) chromophores as well as a peak atwavelengths absorbed maximally by phycoerythrobilin (PEB) chromophores. Thus, the Ara-bian Sea appears to be di!erent from the Black Sea or Gulf of Maine in that PUB-lacking formsof PE rarely, if ever, dominate the PE signal. Fluorescence excitation signatures di!ered in therelative excitation of PE emission by wavelengths absorbed by PUB (&495 nm, Ex
PUB) and by
wavelengths absorbed by PEB (&550 nm, ExPEB
); these were distinguished by having eithervery low (&0.6), very high (&1.8), or intermediate Ex
PUB:Ex
PEBratios. The distribution of
samples with di!erent PE #uorescence signatures was investigated extensively during the earlySouthwest Monsoon, and communities characterized by the low Ex
PUB:Ex
PEBratios were
closely associated with cooler (24}273C), fresher (35.7}36.25 psu) water in#uenced by coastalupwelling. In general, `ambienta surface water of the Arabian Sea during the early Southwest
0967-0645/99/$ - see front matter ( 1999 Elsevier Science Ltd. All rights reserved.PII: S 0 9 6 7 - 0 6 4 5 ( 9 9 ) 0 0 0 4 3 - 0

Monsoon was of intermediate temperature (27}293C) and salinity (36.15}36.4 psu) and showedintermediate or high values for Ex
PUB:Ex
PEB. This suggests that the PE #uorescence signature
can be used to follow the fate of upwelling-in#uenced water masses and the populations theytransport. ( 1999 Elsevier Science Ltd. All rights reserved.
1. Introduction
Most planktonic marine Synechococcus contain phycoerythrin (PE) as their princi-pal light-harvesting pigment (Waterbury et al., 1976). The characteristic orange/yellow #uorescence from phycoerythrin that dominates the #uorescence emission ofmarine Synechococcus is routinely used to distinguish chroococcoid cyanobacteriafrom small eukaryotes and prochlorophytes using #ow cytometry and epi#uorescencemicroscopy (Li and Wood, 1988; Booth, 1987; Olson et al., 1988,1990; Campbell andVaulot, 1993). In the Arabian Sea, HPLC and #ow cytometric studies show marineSynechoccocus to be an important component of the phytoplankton biomass (Burkillet al., 1993; Pollehne et al., 1993; Veldhuis and Kraay, 1993; Jochem, 1995; Bidigare etal., 1997; Veldhuis et al., 1997; Campbell et al., 1999). Veldhuis and Kraay (1993)identi"ed two distinct populations of cells based on #ow cytometric signature: cellswith very bright #uorescence in both green (PE) and red (chlorophyll) emission whenexcited at 488 nm, and cells with very dim #uorescence under the same conditions. Ingeneral, they found that the `brighta or `Type Aa cells were a greater proportion ofthe total population in samples collected from deeper depths, and the `dima or `TypeBa cells were a greater proportion of the total population in samples collected fromshallower depths where irradiance was at least 5% of surface values (Veldhuis andKraay, 1993).`Brighta and `dima Synechococcus populations have been seen in #ow cytograms
obtained in the Atlantic and Paci"c Oceans by other workers. Olson et al. (1988)sorted `brighta and `dima populations from the Sargasso Sea and found that theyretained their `brighta and `dima phenotype when maintained in cultures. Based onthis result, they concluded that the `brighta and `dima populations in the originalsample were genetically distinct. However, as discussed by Olson et al. (1988),mixtures of `brightsa and `dimsa in natural samples cannot always be assumed torepresent genetically distinct populations because mixtures of `brighta and `dima cellswould be expected if cells that had been growing in low light were mixed with cellsgrowing in high light. In this case, `brightsa would represent cells with greaterphycoerythrin (and hence greater phycoerythrin #uorescence) per cell and `dimsawould represent cells with lower amounts of PE per cell.
Genetically determined di!erences in the form(s) of PE synthesized by the cells arethe primary cause of genetic di!erences in the #uorescence yield and #uorescencesignature of di!erent strains of marine Synechococcus (Alberte et al., 1984; Wood et al.,1985; Ong and Glazer, 1991). While the basic structure of all PEs is highly conserved,there is considerable variation in the relative abundance of phycoerythrobilin andphycourobilin chromophores that may be attached to the protein. Phycoerythrobilin
1770 A. Michelle Wood et al. / Deep-Sea Research II 46 (1999) 1769}1790

(PEB, jA"4M!9
+540}570 nm) is found in all known forms of PE (Glazer, 1985; Sidler,1994). In cryptomonads, red algae, Trichodesmium, and many marine Synechoccocus,the green absorbance of PEB is complemented with shorter wavelength absorbanceby the presence of phycourobilin chromophores (PUB; j
A"4M!9+495}500 nm, Glazer,
1985; Sidler, 1994).Maximum PE emission tends to occur at longer wavelengths in strains containing
only PUB-lacking PEs than in strains that synthesize PEs composed of both PUBand PEB (Alberte et al., 1984; Wood et al., 1985; Shalapenok and Shalapenok, 1997).This feature of in vivo PE emission has been used in the Atlantic Ocean and Black Seato identify patterns in the distribution of Synechococcus communities dominated byorganisms with either PUB-lacking or PUB-containing PEs (Shalapenok andShalapenok, 1997; Wood et al., 1998; Hoge et al., 1999). In both ecosystems, communi-ties characterized by the predominance of PUB-lacking PEs occurred in more turbidwaters, particularly over the continental shelf in the northwest Atlantic.Phycourobilin-containing PEs predominated in highly transparent waters. None ofthese studies were able to discriminate among water masses dominated by organismssynthesizing di!erent types of PUB-containing PEs because there appears to be littledi!erence in j
.!9of in vivo PE emission among the di!erent forms of PUB-containing
PEs. There are a wide range of PUB-containing PEs synthesized by marineSynechococcus, and they di!er in the relative abundance of PUB and PEB chromo-phores (Ong and Glazer, 1991); Synechocystis, another chroococcoid marine cyano-bacterium, synthesizes a PE with the highest known PUB content (Swanson et al.,1991). While it is di$cult to infer the relative abundance of PUB and PEB chromo-phores from the j
.!9of PE emission, #uorescence excitation spectra provide informa-
tion about both the chromophore content and relative abundance of PUB and PEB.Campbell and Iturriaga (1988) used single-cell #uorescence excitation spectroscopy
to demonstrate that most marine Synechococcus in the central north Atlantic producea PE very high in PUB. Two #ow cytometric studies that used dual lasers to excitecells at 488 and 514 nm obtained similar results from both the North Atlantic andPaci"c Oceans (Olson et al., 1988,1990). These three studies serve as the principalbasis for the widespread assumption that the `high PUBa type of marine Synechococ-cus dominate most open-water habitats. Recent work by Campbell et al. (1998), andthe `brightsa and `dimsa described by Veldhuis and Kraay (1993), however, suggestthat at least two PE types occur in o!shore waters of the Arabian Sea.
In fall 1994 we developed a protocol for sampling the #uorescence excitation andemission signature of photosynthetic pigments of PE-containing phytoplankton in theArabian Sea. Samples were found to be stable with respect to the wavelength andrelative height of peaks and shoulders in the PE #uorescence excitation and emissionspectra for extended periods (e.g., weeks) when stored at low temperature (&43C) inthe dark. In this paper, we describe the development of the method and present resultsthat show that a low PUB-form of PE, spectrally similar to the major PE ofSynechococcus strain WH7803, tended to dominate upwelling-in#uenced surfacewaters during the early Southwest Monsoon in 1995. To our knowledge, this is the"rst time PE-excitation spectra have been used to evaluate the distribution ofspectrally distinct forms of PE in the sea.
A. Michelle Wood et al. / Deep-Sea Research II 46 (1999) 1769}1790 1771

Fig. 1. Cruise track for TN048 (early Southwest Monsoon). Surface samples were collected from the ship's#ow-through sampling system every 2 h while the ship towed a SeaSoar instrument package as described inthe text; these samples were collected between 21 June and 4 July, 1995 beginning at 23.133N, 59.683E andending at 14.463N, 64.983E. Station locations and sampling dates are given in Table 2. Inset shows SeaSoartrack during the Northeast Monsoon (TN042).
2. Methods
2.1. Study area and cruise descriptions
Data reported here are from cruises TN042 (Nov. 28}Dec. 17, 1994) and TN048(June 21}July 13,1997) aboard the R.V. Thomas G. Thompson. These cruises occurredduring the early Northeast Monsoon (TN042) and early Southwest Monsoon(TN048). The cruise tracks for both cruises were similar (Fig. 1), and included most ofthe western and southern portions of the standard U.S. JGOFS sampling area (e.g.,the regions covered by U.S. JGOFS Process Study Stations N1 and S1-S11, compareFig. 1 with Fig. 1 in Smith et al. (1998). Each cruise consisted of two approximately10-day sampling periods. During the "rst 10-day period, the ship traveled at a con-stant speed, towing a SeaSoar instrument package used to measure hydrographic andoptical properties of the upper water column. During the second 10-day period, theship stopped for a variety of operations at representative stations along the SeaSoar
1772 A. Michelle Wood et al. / Deep-Sea Research II 46 (1999) 1769}1790

Fig. 2. Sea surface temperature composite image for early June, 1995. The SeaSoar sampling track forTN048 is shown as a solid white line; lighter gray shades represent the cooler water.
track. TN048 occurred during the beginning of the Southwest Monsoon (Weller et al.,1998), and the cruise track included regions heavily in#uenced by coastal upwelling(Fig. 2).
2.2. Sample collection
When the ship was towing the SeaSoar, samples were collected from the ship'scontinuous seawater system which had an intake at the bow of the ship, &3 m below
A. Michelle Wood et al. / Deep-Sea Research II 46 (1999) 1769}1790 1773
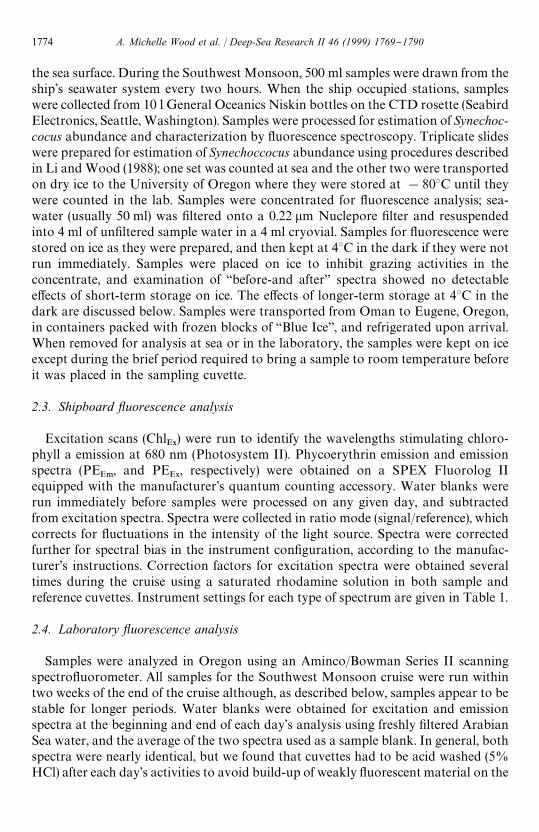
the sea surface. During the Southwest Monsoon, 500 ml samples were drawn from theship's seawater system every two hours. When the ship occupied stations, sampleswere collected from 10 l General Oceanics Niskin bottles on the CTD rosette (SeabirdElectronics, Seattle, Washington). Samples were processed for estimation of Synechoc-cocus abundance and characterization by #uorescence spectroscopy. Triplicate slideswere prepared for estimation of Synechoccocus abundance using procedures describedin Li and Wood (1988); one set was counted at sea and the other two were transportedon dry ice to the University of Oregon where they were stored at !803C until theywere counted in the lab. Samples were concentrated for #uorescence analysis; sea-water (usually 50 ml) was "ltered onto a 0.22 lm Nuclepore "lter and resuspendedinto 4 ml of un"ltered sample water in a 4 ml cryovial. Samples for #uorescence werestored on ice as they were prepared, and then kept at 43C in the dark if they were notrun immediately. Samples were placed on ice to inhibit grazing activities in theconcentrate, and examination of `before-and aftera spectra showed no detectablee!ects of short-term storage on ice. The e!ects of longer-term storage at 43C in thedark are discussed below. Samples were transported from Oman to Eugene, Oregon,in containers packed with frozen blocks of `Blue Icea, and refrigerated upon arrival.When removed for analysis at sea or in the laboratory, the samples were kept on iceexcept during the brief period required to bring a sample to room temperature beforeit was placed in the sampling cuvette.
2.3. Shipboard yuorescence analysis
Excitation scans (ChlE9
) were run to identify the wavelengths stimulating chloro-phyll a emission at 680 nm (Photosystem II). Phycoerythrin emission and emissionspectra (PE
E., and PE
E9, respectively) were obtained on a SPEX Fluorolog II
equipped with the manufacturer's quantum counting accessory. Water blanks wererun immediately before samples were processed on any given day, and subtractedfrom excitation spectra. Spectra were collected in ratio mode (signal/reference), whichcorrects for #uctuations in the intensity of the light source. Spectra were correctedfurther for spectral bias in the instrument con"guration, according to the manufac-turer's instructions. Correction factors for excitation spectra were obtained severaltimes during the cruise using a saturated rhodamine solution in both sample andreference cuvettes. Instrument settings for each type of spectrum are given in Table 1.
2.4. Laboratory yuorescence analysis
Samples were analyzed in Oregon using an Aminco/Bowman Series II scanningspectro#uorometer. All samples for the Southwest Monsoon cruise were run withintwo weeks of the end of the cruise although, as described below, samples appear to bestable for longer periods. Water blanks were obtained for excitation and emissionspectra at the beginning and end of each day's analysis using freshly "ltered ArabianSea water, and the average of the two spectra used as a sample blank. In general, bothspectra were nearly identical, but we found that cuvettes had to be acid washed (5%HCl) after each day's activities to avoid build-up of weakly #uorescent material on the
1774 A. Michelle Wood et al. / Deep-Sea Research II 46 (1999) 1769}1790

Table 1Instrument settings for acquisition of spectra. Units in nanometers
Instrument andspectum type
Scanrange
Excitationmonochrometer
Bandwidth(Ex)
Emissionmonochrometer
Bandwidth(Em)
Scanspeed
SPEX (Ship)Chl
EX400}650 Variable 5 680 5 4 nm s~1
PEE9
400}560 Variable 5 564 5 4 nm s~1
PEE.
510}800 500 5 Variable 5 4 nm s~1
AMINCO (Lab)Chl
EX400}660 Variable 8 680 8 2 nm s~1
PEE9
400}560 Variable 4 568 4 2 nm s~1
PEE.
510}800 500 4 Variable 4 2 nm s~1
cuvette walls. Spectra were collected in ratio mode (signal/reference) and corrected forspectral bias in the instrument con"guration using factory-installed correction algo-rithms. The correction algorithm for excitation spectra was obtained using rhodamineas the quantum counter. Instrument settings for each type of spectrum are given inTable 1.
2.5. Characterization of PE types using PE excitation spectra
As noted above, #uorescence emission spectroscopy distinguishes between PEscomposed only of PEB chromophores and PEs composed of both PUB and PEBchromophores, but cannot distinguish among PUB-containing PEs which di!er in therelative abundance of the two chromophores. Thus, we relied on #uorescence excita-tion spectroscopy to distinguish among PE types because it is sensitive to both thepresence or absence of PUB, and to the relative abundance of PUB and PEBchromophores. PEB and PUB chromophores are revealed as separate peaks and/orshoulders in the in vivo excitation spectra for both PE and chlorophyll a emission,and the relative height of these peaks and shoulders is indicative of the relativeconcentration of the two chromophores (cf Wood et al., 1985; Olson et al., 1988; Ongand Glazer, 1991). These peaks or shoulders occur near the wavelengths of maximumabsorption of each chromophore (&495 nm for PUB and &550 nm for PEB), withthe precise wavelength determined by protein}chromophore interactions that varyamong PEs. Essentially all the PE
E9spectra we collected showed either a shoulder or
a peak at about 500 nm, presumably due to the presence of PUB, and a peak at about550 nm, presumably due to the presence of PEB (e.g., Fig. 3C, F, I). In order tocompare di!erences among excitation spectra quantitatively, we calculated the value`Ex
PUB:Ex
PEB'', which is the ratio of peak (or shoulder) heights at +500 nm and
+550 nm; this ratio is always obtained from the PE excitation spectra (PEE9
). For thefresh samples (solid lines) in Fig. 3C, F, and I, the values for Ex
PUB:Ex
PEBare 0.76, 1.0,
and 1.5, respectively. The notation `ExPUB
:ExPEBa rather than `PUB:PEBa was used
to emphasize the fact that we are inferring the relative abundance of PUB and PEB
A. Michelle Wood et al. / Deep-Sea Research II 46 (1999) 1769}1790 1775

Fig. 3. Representative spectra obtained on board the ship during TN042; ChlE9
spectra are in the left-handcolumn , PE
E.spectra are in the center column, and PE
E9are on the right. Each series of three panels across
(A}C; D}F, and G}I) were obtained from the same sample. In panels B,C,E,F,H, and I, solid lines show datacollected on board the ship, and dotted lines show data collected from the same samples more than twomonths later in the laboratory. Results from triplicate runs of the same PE excitation spectra, run withinminutes of one another, are plotted in panel I to show the high degree of repeatability in the PE
E9spectra; it
is di$cult to see individual replicates, but the overall shipboard spectrum is slightly darker in Panel I thanother panels because all three replicates are plotted. Maximum PE emission in panels B, E, and H was at567, 567, and 570 nm, respectively.
chromophores from excitation spectra; we are not measuring chromophore abund-ance directly.
In general, we relied on visual inspection to determine whether or not peaks couldbe distinguished from instrument noise in the #uorescence spectra. However, duringthe SW Monsoon, when there were very few PE-containing cells in some samples,peak heights in the PE
E9spectra were sometimes hard to distinguish from the
instrument noise because there was so little overall signal. In these cases, we discardeddata from the samples if the signal-to-noise ratio in the PE
E9spectrum was (10.0.
For these purposes, the `signala in the PE excitation spectrum was the maximumvalue measured between 500 and 550 nm, and the `noisea in the PE excitationspectrum was the average value measured between 420 and 440 nm. The region420}440 nm was selected for quanti"cation of instrument noise since thesewavelengths do not excite PE emission in vivo; examination of water blanks indicatedthat instrument noise in the range 420}440 nm was comparable to that between 500and 550 nm.
1776 A. Michelle Wood et al. / Deep-Sea Research II 46 (1999) 1769}1790

Fig. 4. Time course of change in the spectral properties for three samples run repeatedly over a period of 12days during the Northeast Monsoon.
2.6. Sample storage and intercomparison of instruments
Three of the "rst samples collected on TN042 were run repeatedly throughout thecruise as a measure of sample stability. In two of the samples, the intensity of PE#uorescence decreased after 48 h, and then remained relatively constant for more thana week; in the third sample, #uorescence yield was essentially constant throughout thestudy (Fig. 4A). Despite repeated sample handling, the Ex
PUB:Ex
PEBratio of three
samples with di!ering #uorescence properties was essentially the same at the end of an11-day measurement period as it was at the beginning, although one sample did showmore day-to-day variation than the other two (Fig. 4B).
During the Southwest Monsoon, time constraints did not permit analysis of all thesamples on board the ship, so a selected set of twelve samples were run on the ship andthen again in the laboratory to provide an assessment of the e!ects of sample storageand/or systematic di!erences associated with spectral data obtained using the twodi!erent instruments. Both #uorescence yield and the Ex
PUB:Ex
PEBratio measured on
fresh samples at sea were highly correlated with the same measurements made on thesame samples in the lab (Fig. 5). Over a period of a four to eight weeks, no majorchanges were observed in the wavelength of maximum PE emission or in theEx
PUB:Ex
PEBratios. In some samples, these parameters appeared to remain stable for
many months (Fig. 3). The great di!erence between storage temperature (&43C) andambient water temperature ('243C in surface waters) may have facilitated successfulsample storage; the e!ectiveness of this approach needs to be carefully re-established ifapplied to samples collected from colder environments.
Chlorophyll a emission in the PEE.
spectra deteriorated more rapidly with timethan emission from PE (Fig. 3B, E, H). Since the wavelength used to excite #uores-cence emission in these spectra (500 nm) also excites in vivo chlorophyll a #uorescencein many taxa of phytoplankton, this di!erential degradation of emission by chloro-phyll a may have resulted from faster degradation of the spectral properties ofdiatoms, dino#agellates, or other non-cyanobacterial taxa. This interpretation seemsreasonable since the chlorophyll a emission peak and its degradation are much more
A. Michelle Wood et al. / Deep-Sea Research II 46 (1999) 1769}1790 1777

Fig. 5. Relationship between spectral properties of 12 intercalibration samples measured at sea and in thelab. Solid line shows linear regression, and the dotted lines delimit 95% con"dence intervals for theregressions; R2 for the regressions are 0.98 (A) and 0.71 (B).
pronounced in Fig. 3B and 3E than in Fig. 3H, and the ChlE9
spectra from these samesamples indicates that Fig. 3B and 3E were obtained from samples with relatively highconcentrations of eukaryotes or prochlorophytes whereas Fig. 3H was obtained froma sample composed primarily of PE-containing cyanobacteria (see below).
3. Results
3.1. Excitation spectra for chlorophyll a emission
ChlE9
spectra consistently showed excitation peaks or strong shoulders between 500and 550 nm (Fig. 3A, D, G), and usually showed strong peaks in the blue region of thespectrum (400}450 nm). The Chl
E9spectrum shown in Fig. 3G is a contrast to this
pattern, in that there is relatively little participation of blue light in the excitation ofchlorophyll a emission at 680 nm; although there are strong peaks at 495 and 500 nm.
1778 A. Michelle Wood et al. / Deep-Sea Research II 46 (1999) 1769}1790

Blue wavelengths (i.e., 400}450 nm) do not excite Photosystem II in cyanobacteria orred algae (Haxo and Blinks, 1950; Wood, 1985; Neori et al., 1986), which indicatesthere were more eukaryotic phytoplankters or prochlorophytes in the "rst twosamples, and a predominance of PE-containing picocyanobacteria in the third.
ChlE9
spectra will not be discussed in further detail since they cannot be used todistinguish the type of phycoerythrin in the samples. This is because, in bulk watersamples, the accessory pigments of diatoms and other phytoplankton taxa alsocontribute to the excitation of chlorophyll a emission in the green and blue-greenregion of the spectrum (cf Wood, 1985; Neori et al., 1986; Lazzara et al., 1996). Thus,while Chl
E9spectra were run for each sample, their signi"cance in this study lies in the
fact that they never suggested the presence of cyanobacteria, which use phycocyaninas the principal light-harvesting pigment or the presence of highly unusual phycobilip-roteins that might not be excited at conventional wavelengths.
3.2. Spectral forms of PE identixed during the early Northeast Monsoon
While peak heights varied among samples, there was very little variation in j.!9
ofPE emission. PE
E.spectra usually showed a symmetrical peak between 560 and 570
nm (xN "567$3 nm, n"28), and often showed an additional relatively symmetricalpeak at 680 nm, the wavelength of maxium emission by chlorophyll a (e.g., Fig. 3B, E,H). The longer wavelength peak is particularly noteworthy in Fig. 3B and 3E wherethe chlorophyll a emission is probably due to #uorescence by both PE-containingpicocyanobacteria and other photosynthetic plankton (see discussion above). In thesample that contained relatively few of these other phytoplankton taxa, the PEemission at 570 nm is much greater than the peak at 680 nm (Fig. 3H). We can assumethat emission at 570 nm is due to PE since it is the only photosynthetic pigment that#uoresces in this region of the spectrum.
As illustrated in Fig. 3, the overall shape of PEE9
spectra was more variable thanthat of PE
E.spectra. PE
E9spectra obtained during the early Northeast Monsoon
could be divided into three major types based the ExPUB
:ExPEB
ratio: those where theexcitation at &500 nm (Ex
PUB) is much less than the Ex
PEBat &550 nm (Fig. 3C),
those where ExPUB
is greater than ExPEB
(Fig. 3I), and those where the ExPUB
:ExPEB
ratio is about equal (Fig. 3F). When replicate spectra from the same sample werecollected within minutes of one another, they were nearly identical from replicate toreplicate (Fig. 3I).
Trichodesmium, a "lamentous cyanobacterium, is often abundant in tropical watersand is a potential source of PE #uorescence in bulk water samples. We did not observeTrichodesmium blooms on our cruises, and it was only rarely found in the small-volume samples we "ltered for epi#uorescence microscopy. Samples for routine#uorescence measurements were always examined for the presence of Trichodesmium"laments and, on the rare occasion when they were present, they were removed.Filaments of Trichodesmium were, however, occasionally abundant in plankton nettows. Since there are only a few published #uorescence spectra for the PEs ofTrichodesmium, we picked several "laments by hand from a net tow and suspendedthem in "ltered seawater to produced the spectra shown in Fig. 6. Peak emission from
A. Michelle Wood et al. / Deep-Sea Research II 46 (1999) 1769}1790 1779

Fig. 6. PEE.
(left) and PEE9
(right) spectra for "laments of Trichodesmium obtained from surface waters inDecember, 1994 (TN042).
PE in this sample occurred at 567 nm, and there is a strong emission signal fromchlorophyll a. This peak is not always observed in PE emission spectra fromTrichodesmium (A. Subramian, National Oceanographic and Atmospheric Adminis-tration, personal communication). The Ex
PUB:Ex
PEBratio ranged from 1.11 to 1.18 in
triplicate runs of the sample, indicating that the unidenti"ed species of Trichodesmiumwe collected has relatively high amounts of PUB. Variability among replicate scans ofthe Trichodesmium sample was slightly higher than variability among triplicate runs ofpicocyanobacteria samples, which may re#ect an optical e!ect of the packaging of thepigment in a few larger cells, or it may mean that the di!erent "laments in the samplecontained slightly di!erent forms of PE. Sinking or stirring could have changed therelative intensity of excitation of di!erent "laments as measurements were made,increasing the variability between replicates.
3.3. Spectral variation in PE from surface waters
3.3.1. Early Southwest MonsoonAs noted below, most samples collected from Niskin bottles were subsurface
samples (c.f. Table 2). In this section, we report data collected from &3 m using theship's #ow-through system while the ship towed the SeaSoar (Fig. 2). Fluorescencesamples were collected at a total of 145 positions. This covered an area over whichSynechococcus cell numbers ranged from 103 to nearly 106 cells ml~1 in surfacewaters. Cell numbers were especially low at sampling locations east of 61.53E. Becauseof the very low cell abundances at some locations, PE concentration was also very low
1780 A. Michelle Wood et al. / Deep-Sea Research II 46 (1999) 1769}1790

Table 2Spectral data from samples collected at hydrographic stations
Station GMT date Lat/long Sample depth PEemission
PE excitation
jM!9
j.!9(PUB)
j.!9(PEB)
ExPEB
:ExPUB
ratio
1 6/25/95 23.843N/58.993E 16 564 498 547 0.6626 568 500 545 0.7546 563 498 546 0.8466 566 496 548 1.08
2 6/25/95 20.03N/59.443E 18 571 503 545 0.7813 7/5/95 15.173N/63.583E 86 571 494 545 1.6916 7/5/95 16.063N/61.923E 46 586 494 549 1.49
67 568 493 550 1.5217 7/6/95 15.513N/61.473E 65 567 492 545 1.1019 7/6/95 16.603N/60.913E 24 564 494 549 1.2327 7/8/95 17.403N/57.503E 16 572 492 545 0.70
26 570 497 543 0.6246 570 496 543 0.66
34 7/9/95 19.03N/58.423E 11 569 497 545 0.5816 572 499 548 0.61
39 7/10/95 19.003N/60.503E 25 575 497 544 0.8140 7/10/95 19.713N/59.833E 9 575 497 545 0.67
15 571 493 545 0.6847 7/12/95 22.353N/60.603E 5 569 496 547 0.6049 7/12/95 22.703N/60.403E 16 m 568 nm 495 nm 544 nm 0.55
and the PEE9
spectra were, therefore, very di$cult to interpret. Approximately half ofthe samples were discarded on the basis of a combination of low overall signal and lowsignal-to-noise ratio (see methods). A total of 65 acceptable spectra were obtainedfrom the surface samples collected while we towed the SeaSoar, and they provide datafrom surface water along the coast of Oman and along the western half of theonshore-to-o!shore transect covered by SeaSoar.
Phycoerythrin spectral properties showed variations comparable to those observedon TN042 during the Northeast Monsoon. All PE
E.spectra were relatively similar,
with a single peak at about 567 nm ($2.72 nm s.d., n"65; Fig. 7). The ExPUB
:ExPEB
ratio observed in PEE9
spectra ranged from 0.41 to 1.60, and there was alwaysa shoulder or peak at &495 nm as well as a peak at &550 nm (Fig. 7). As describedearlier, the shorter wavelength shoulder or peak was de"ned as the Ex
PUBpeak, and
the longer wavelength peak de"ned as the ExPEB
peak. On average, the ExPUB
peakoccurred at 497 nm ($4.14 s.d., n"65) and the Ex
PEBpeak occurred at 546 nm
($4.06 nm, s.d., n"65). As on TN042, spectra were observed with low, high, andintermediate Ex
PUB:Ex
PEBratios, with a distinctly trimodal distribution frequency for
phycoerythrin spectral types based on this ratio (Fig. 8). Samples in which the PEE9
spectra were characterized by relatively low PUB excitation (ExPUB
:ExPEB
+0.7) were
A. Michelle Wood et al. / Deep-Sea Research II 46 (1999) 1769}1790 1781

Fig. 7. Representative PEE9
spectra (left) and PEE.
spectra (right) from TN048 (early Southwest Monsoon).Samples were obtained from the following locations: 2314}19.223N, 58.943E; 2316}19.453N, 59.083E;2320.5}20.03N, 59.453E; 2801}17.423N, 59.763E; 2805}17.833N, 60.03E; 2809}18.243N, 60.243E.
Fig. 8. Frequency distribution for ExPUB
:ExPEB
ratios obtained in samples collected from surface watersduring the early Southwest Monsoon.
most common, but about 20% of the samples had ExPUB
:ExPEB
values 51.5, andanother 20% showed intermediate Ex
PUB:Ex
PEBratios (Fig. 8). Examples of the PE
E9spectra obtained from samples with di!erent Ex
PUB:Ex
PEBratios are shown in Fig. 7.
Samples with low ExPUB
:ExPEB
ratios generally were found along the coast (Fig. 9) and
1782 A. Michelle Wood et al. / Deep-Sea Research II 46 (1999) 1769}1790

Fig. 10. Distribution of samples with di!ering ExPUB
:ExPEB
ratios plotted against ¹/S properties. Symbolsas in Fig. 10; points labeled &A' and &B' are discussed in the text.
Fig. 9. Geographic distribution of samples with di!ering ExPUB
:ExPEB
ratios during the early SouthwestMonsoon. Ex
PUB:Ex
PEBratios (0.75 (closed circles), *0.75 W (1.0 (open circles); *1.0 W(1.25 (closed
triangles); *1.25 (open triangles). Samples were collected between 21 June and 29 June, 1995, while towingthe SeaSoar instrument array (cf. Fig. 2).
in relatively cooler, less saline waters (Fig. 10). One notable exception to these trendswas observed at 160N and 63.50W (Fig. 9). This exception (marked &B' on Fig. 10) wascollected in water that was exceptionally warm and salty by comparison to most of theo!shore water masses we sampled. It should be noted that the concentration of
A. Michelle Wood et al. / Deep-Sea Research II 46 (1999) 1769}1790 1783
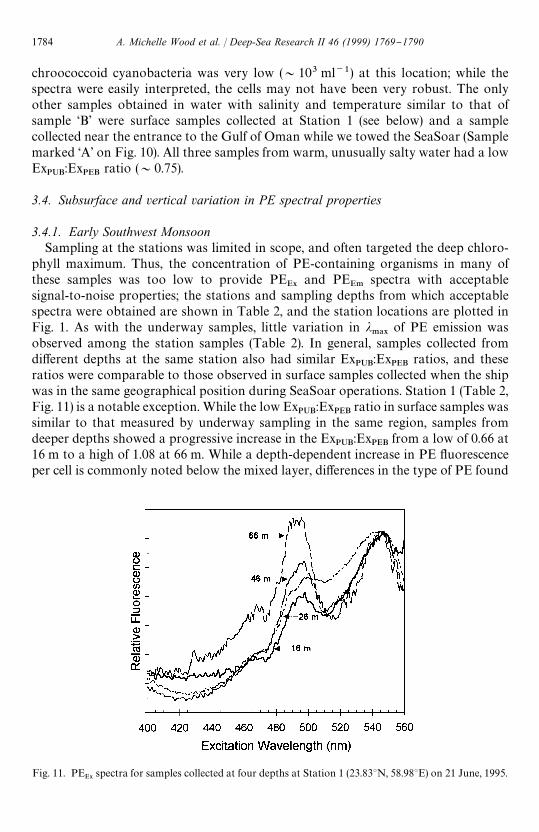
Fig. 11. PEE9
spectra for samples collected at four depths at Station 1 (23.833N, 58.983E) on 21 June, 1995.
chroococcoid cyanobacteria was very low (&103 ml~1) at this location; while thespectra were easily interpreted, the cells may not have been very robust. The onlyother samples obtained in water with salinity and temperature similar to that ofsample &B' were surface samples collected at Station 1 (see below) and a samplecollected near the entrance to the Gulf of Oman while we towed the SeaSoar (Samplemarked &A' on Fig. 10). All three samples from warm, unusually salty water had a lowEx
PUB:Ex
PEBratio (&0.75).
3.4. Subsurface and vertical variation in PE spectral properties
3.4.1. Early Southwest MonsoonSampling at the stations was limited in scope, and often targeted the deep chloro-
phyll maximum. Thus, the concentration of PE-containing organisms in many ofthese samples was too low to provide PE
E9and PE
E.spectra with acceptable
signal-to-noise properties; the stations and sampling depths from which acceptablespectra were obtained are shown in Table 2, and the station locations are plotted inFig. 1. As with the underway samples, little variation in j
.!9of PE emission was
observed among the station samples (Table 2). In general, samples collected fromdi!erent depths at the same station also had similar Ex
PUB:Ex
PEBratios, and these
ratios were comparable to those observed in surface samples collected when the shipwas in the same geographical position during SeaSoar operations. Station 1 (Table 2,Fig. 11) is a notable exception. While the low Ex
PUB:Ex
PEBratio in surface samples was
similar to that measured by underway sampling in the same region, samples fromdeeper depths showed a progressive increase in the Ex
PUB:Ex
PEBfrom a low of 0.66 at
16 m to a high of 1.08 at 66 m. While a depth-dependent increase in PE #uorescenceper cell is commonly noted below the mixed layer, di!erences in the type of PE found
1784 A. Michelle Wood et al. / Deep-Sea Research II 46 (1999) 1769}1790
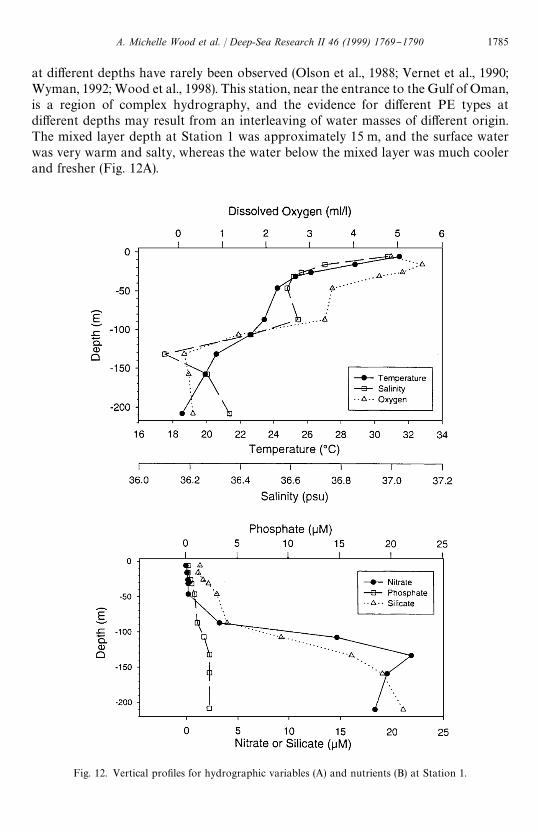
Fig. 12. Vertical pro"les for hydrographic variables (A) and nutrients (B) at Station 1.
at di!erent depths have rarely been observed (Olson et al., 1988; Vernet et al., 1990;Wyman, 1992; Wood et al., 1998). This station, near the entrance to the Gulf of Oman,is a region of complex hydrography, and the evidence for di!erent PE types atdi!erent depths may result from an interleaving of water masses of di!erent origin.The mixed layer depth at Station 1 was approximately 15 m, and the surface waterwas very warm and salty, whereas the water below the mixed layer was much coolerand fresher (Fig. 12A).
A. Michelle Wood et al. / Deep-Sea Research II 46 (1999) 1769}1790 1785
4. Discussion
PE excitation spectra in our samples always showed either a strong shoulder ora peak at wavelengths absorbed maximally by PUB as well as a peak at wavelengthsabsorbed maximally by PEB; this, combined with the relatively narrow range inj.!9
for PE emission (567$2.72 nm s.d., n"65 on TN048), indicate that PUB-containing PEs were responsible for the PE #uorescence signature. The absence of anywater masses dominated by organisms that make a PUB-lacking PE is intriguingsince this pigment type is common on the continental shelf o!North America (Woodet al., 1998), and strains of picocyanobacteria that synthesize a PUB-lacking PE havebeen isolated from the Arabian Sea, (A.M. Wood, unpublished data). Campbell et al.(1998) report high abundances of cells which appear to contain a PUB-lacking PE atonly one station from their four cruises (N1, TN054).
Aircraft-operated lidar (AOL) can be used to evaluate the amount of PE in surfacewaters of the ocean and to distinguish between water masses dominated by PUB-lacking PEs and water masses dominated by PUB-containing PEs (Hoge et al., 1999).AOL data were collected repeatedly along a #ight line which corresponds to thesouthern JGOFS line during TN048. The lidar data con"rm the low abundance ofPE-containing organisms o!shore when we sampled that region, and also indicatethat water masses dominated by PUB-lacking PEs may occur on the continental shelfof Oman, in regions that we did not sample (F. Hoge and R. Swift, Wallops FlightCenter, personal communication). Wood et al. (1998) suggest that organisms syn-thesizing PUB-lacking PEs as the predominant light-harvesting pigment occur prim-arily in Case 2 waters; this could easily restrict such organisms to continental shelfwaters in the Arabian Sea. Our sampling locations, while relatively close to thecontinental margin, were mostly seaward of the shelf-break where Case 1 opticalconditions generally prevailed (R. Arnone and R. Gould, Naval Research Laboratory,personal communication).
The demonstration that PUB-lacking PEs were associated with Case 2 waters in theNorthwest Atlantic Ocean was based on a method that did not distinguish amongdi!erent PUB-containing PEs (Wood et al., 1998). Thus, while that study showed thatPUB-containing PEs occurred almost exclusively in Case 1 waters, it was not possible todetermine whether or not there was any pattern in the distribution of di!erent PUB-containing PEs. In the current study, PE excitation spectra provide a basis for distinguish-ing among di!erent PUB-containing PEs, and di!erences in the Ex
PUB:Ex
PEBratio show
clear association of low-PUB PEs and high PUB-PEs with di!erent water masses.Many samples had #uorescence excitation spectra for PE emission that were very
similar to the excitation spectra of the predominant PE synthesized by the commonlystudied laboratory strain WH7803, ("DC2; compare top panels of Fig. 7 with Fig. 4in Wood et al., 1985 and Fig. 11 in Ong and Glazer, 1991). While the distribution ofchroococcoid cyanobacteria that synthesize high-PUB PEs is relatively well de-scribed, little is known about the biogeography of organisms that primarily synthesizethis low PUB-form of PE.
The results of our survey of the distribution of di!erent spectral forms of PE at thebeginning of the Southwest Monsoon are presented in Figs. 9 and 10; data reported in
1786 A. Michelle Wood et al. / Deep-Sea Research II 46 (1999) 1769}1790
these "gures are from samples collected over a nine-day period and are nearlysynoptic. PE
E9spectra from sampling locations marked with a solid circle
(ExPUB
:ExPEB
(0.75) were similar to those shown in the top panels of Fig. 7. As notedabove, they are very similar to that of strain WH7803 and other isolates with a similarPE (cf Alberte et al., 1983; Wood et al., 1985). Samples collected at locations notedwith a triangle in Figs. 9 and 10 yielded PE
E9spectra that were similar to those shown
in the bottom panels of Fig. 7, indicative of a predominance of PE-containingorganisms that synthesize PEs more similar to those of the `high urobilinaSynechococcus strain WH8103 than the PEs of strain WH7803 (Ong et al., 1984).
Samples characterized by low ExPUB
:ExPEB
ratios occurred almost exclusively alongthe shelf-break where AVHRR imagery reveals signi"cant upwelling of cool water(compare Figs. 2 and 9). This explains the association of low Ex
PUB:Ex
PEBratios with
low-temperature, low-salinity water shown in Fig. 10. The cluster of samples with lowEx
PUB:Ex
PEBratios collected slightly o!shore between 18 and 203 N coincide with the
presence of a "lament of cool, upwelled water in the upper levels of the water column.This "lament is believed to represent the o!shore de#ection of currents that #ownorth along the shelf break (Brink et al., 1998). Nitrate levels are high (&10 lM) in the"lament and much lower ((1 lM) in the warmer (&283C), saltier (36.15}36.4 psu)surface water outside the "lament (Brink et al., 1998). As the "lament moved o!shore,it subducted below this low-nutrient `ambienta water and, as indicated by the clusterof samples with high Ex
PUB:Ex
PEBratios seen near 17.53N and 603E, the community of
PE-containing organisms in the `ambienta surface water was dominated by organ-isms with high PUB PEs (Figs. 2 and 10; Brink et al., 1998).
Nearly all the samples we collected at the beginning of the Southwest Monsoon hadT/S properties that linked them to either water in#uenced by coastal upwelling, or towarmer water with a salinity (36.4 psu (Fig. 10); as indicated above, each of thesewater-mass types was dominated by PE-containing cells with di!erent PE excitationspectra. On this basis we propose that there are at least two physiological types ofPE-containing chroococcoid cyanobacteria in the region we sampled: those thatpredominate in `ambienta oligotrophic surface waters and contain PUB-rich PEs,and those that predominate in upwelling-in#uenced waters and synthesize PEs thatcontains PUB, but in proportions similar to those of Synechococcus strain WH7803.
Two underway samples were collected from a third water-mass type, which is aboutthe same temperature as the `ambienta water described above but is much saltier.These samples, noted &A' and &B' in Fig. 10, are both characterized by a lowEx
PUB:Ex
PEBratio similar to that of the cells found in the upwelling region. Sample &A'
was collected at the entrance to the Gulf of Oman, and Sample &B' is the lowEx
PUB:Ex
PEBsample collected at 15.763N, 63.523E (cf Fig. 9). Station 1, located near
the entrance to the Gulf of Oman, provides a third example of a sample in which a lowEx
PUB:Ex
PEBratio characterized the PE-containing organisms in a warm, very salty
water mass.This study represents the "rst systematic e!ort to characterize the distribution of
di!erent PEs in seawater using #uorescence excitation spectroscopy. Most othermethods that have been applied to bulk seawater rely on di!erences in #uorescenceemission properties (cf Shalapenok and Shalapenok, 1997; Wood et al., 1998; Hoge
A. Michelle Wood et al. / Deep-Sea Research II 46 (1999) 1769}1790 1787

et al., 1999). These methods would have been insensitive to the close association ofdi!erent forms of PUB-containing PEs with di!erent water masses discovered in thisstudy. The distinctive Ex
PUB:Ex
PEBratios of the PEs dominating di!erent water masses
may be useful tracers of the fate of particular water masses. In particular, the closeassociation between picocyanobacteria with low PUB-PEs and recently upwelledwater in the Arabian Sea raises the interesting possibility that their distinctive#uorescence signature can be used to follow the fate of upwelling-in#uenced watermasses and the organisms they contain.
Acknowledgements
We thank R. Arnone and M. Routhier for Fig. 2, B. Jones and Z. Zheng for Fig. 12,Dave Phinney, Doug Phinney, and M. Cervantes for assistance with sampling andsample preparation at sea; C. del Castillo for technical assistance, L. Campbell forpreliminary versions of her manuscript, D. Young and J. Kindle for critical review ofthe manuscript, S. Smith for editorial suggestions, and the captains and crew of theR/V ¹homas G ¹hompson for the overall success of the Arabian Sea "eld program.The research was supported through the NASA grant NAGW-3950 (to PC), and byONR/NRL 6.1 ARI `Forced Upper Ocean Dynamicsa through ONR grant N00014-94-1-0429 (to AMW), ONR grant N00014-94-1-0362 (to B. Jones), and under ONRProgram Element 61153N through a NRL/ASEE summer faculty fellowship program(to AMW). This is U.S. JGOFS contribution number 416.
References
Alberte, R.S., Wood, A.M., Kursar, T.A., Guillard, R.R.L., 1984. Novel phycoerythrins in marineSynechococcus spp. Characterization and evolutionary and ecological implications. Plant Physiology75, 732}739.
Bidigare, R.R., Latasa, M., Johnson, Z., Barber, R.T., Trees, C.C., Balch, W.M., 1997. Observations ofa Synechococcus-dominated cyclonic eddy in open-oceanic waters of the Arabian Sea. ProceedingsSociety of Photo-Optical Instrumentation Engineers 2963, 260}265.
Booth, B.C., 1987. The use of auto#uorescence for analyzing oceanic phytoplankton communities. BotanicaMarina 30, 101}108.
Brink, K., Arnone, R., Coble, P., Flagg, C., Jones, B., Kindle, J., Lee, C., Phinney, D., Wood, M., Yentsch,C., Young, D., 1998. Monsoons boost biological productivity in Arabian Sea EOS 79 (165),168}169.
Burkill, P.H., Leakey, R.J.G., Owens, N.J.P., Mantoura, R.F.C., 1993. Synechococcus and its importance tothe microbial foodweb of the northwestern Indian Ocean. Deep-Sea Research 40, 773}782.
Campbell, L., Iturriaga, R., 1988. Identi"cation of Synechococcus spp. in the Sargasso Sea by immuno-#uorescence and #uorescence excitation spectroscopy performed on individual cells. Limnology andOceanography 33, 1196}1201.
Campbell, L., Vaulot, D., 1993. Photosynthetic picoplankton community structure in the subtropicalPaci"c near Hawaii (Station ALOHA). Deep-Sea Research 40, 2043}2060.
Campbell, L., Landry, M.R., Constantinou, J., Nolla, H.A., Liu, H., Brown, S.L., Caron, D.A., 1998.Response of microbial community structure to environmental forcing in the Arabian Sea. Deep-SeaResearch 45, 2301}2326.
1788 A. Michelle Wood et al. / Deep-Sea Research II 46 (1999) 1769}1790
Glazer, A.N., 1985. Light harvesting by phycobilisomes. Annual Reviews of Biophysics and Chemistry 14,47}77.
Haxo, F.T., Blinks, L.R., 1950. Photosynthetic action spectra of marine algae. Journal of General Physi-ology 33, 389}422.
Hoge, F.E., Wright, C.W., Kana, T., Swift, R.N., Yungel, J.K., 1999. Spatial variability of oceanicphycoerythrin types derived from airborne laser-induced #uorescence emissions. Applied Optics. (InPress)
Jochem, F.J., 1995. Phototrophic picoplankton community structure in three di!erent pelagic regimes inthe Arabian Sea. Marine Ecology Progress Series 117, 307}314.
Lazzara, L., Bricaud, A., Claustre, H., 1996. Spectral absorption and #uorescence excitation properties ofphytoplanktonic populations at a mesotrophic and an oligotrophic site in the tropical North Atlantic(EUMELI program). Deep-Sea Research 43, 1215}1240.
Li, W.K.W., Wood, A.M., 1988. Vertical distribution of North Atlantic ultraphytoplankton: analysis by#ow cytometry and epi#uorescence microscopy. Deep-Sea Research 35, 1615}1638.
Neori, A., Vernet, M., Holm-Hansen, O., Haxo, F.T., 1986. Comparison of chlorophyll far-red and redexcitation spectra with photosynthetic action spectra for Photosystem II in algae. Marine EcologyProgress Series 44, 297}302.
Olson, R.J., Chisholm, S.W., Zettler, E.R., Armbrust, E.V., 1988. Analysis of Synechococcus pigment typesin the sea using single and dual beam #ow cytometry. Deep-Sea Research 35, 425}440.
Olson, R.J., Chisholm, S.W., Zettler, E.R., Armbrust, E.V., 1990. Pigments, size, and distributionof Synechococcus in the North Atlantic and Paci"c Oceans. Limnology and Oceanography 35,45}58.
Ong, L.I., Glazer, A.N., 1991. Phycoerythrins of marine unicellular cyanobacteria. I. Bilin types andlocation of energy transfer pathways in Synechococcus spp. phycoerythrins. Journal of BiologicalChemistry 262, 9515}9527.
Ong, L.J., Glazer, A.N., Waterbury, J.B., 1984. An unusual phycoerythrin from a marine cyanobacterium.Science 224, 80}83.
Pollehne, F., Klein, B., Zeithschel, B., 1993. Low light adaptation and export production in the deepchlorophyll maximum layer in the Northern Indian Ocean. Deep-Sea Research 40, 737}752.
Shalapenok, L.S., Shalapenok, A.A., 1997. Heterogenous pigment composition of phycoerythrin-containingpicocyanobacteria Synechococcus in the Black Sea. Microbiology 66, 80}84.
Sidler, W.A., 1994. Phycobilisome and phycobiliprotein structures. In: Bryant, D.A. (Ed.), The MolecularBiology of Cyanobacteria. Kluwer, Amsterdam, pp. 139}216.
Smith, S.L., Codispoti, L.A., Morrison, J., Barber, T.T., 1998. The 1994}1996 Arabian Sea Expedition: anintegrated interdisciplinary investigation of the response of the northwest Indian Ocean to MonsoonalForcing. Deep-Sea Research 45, 1905}1916.
Swanson, R.V., Ong, L.J., Wilbanks, S.M., Glazer, A.N., 1991. Phycoerythrins of marine unicellularcyanobacteria. II. Characterization of phycobiliproteins with unusually high phycourobilin content.Journal of Biological Chemistry 266, 9528}9534.
Veldhuis, M.J.W., Kraay, G.W., 1993. Cell abundance and #uorescence of picoplankton in relation togrowth irradiance and nitrogen availability in the Red Sea. Netherlands Journal of Sea Research 31,135}145.
Veldhuis, M.J.W., Kraay, G.W., Van Bleijswijk, J.D.L., Baars, M.A., 1997. Seasonal and spatial variabilityin phytoplankton biomass, productivity, and growth in the northwestern Indian Ocean: the southwestand northeast monsoon, 1992}93. Deep-Sea Research 44, 425}449.
Vernet, M., Mitchell, B.G., Holm-Hansen, O., 1990. Adaptation of Synechococcus in situ determined byvariability in intracellular phycoerythrin-543 at a coastal station o! the southern California coast. USA.Marine Ecology Progress Series 63, 9}16.
Waterbury, J.B., Watson, S.W., Valois, F.W., Franks, D.G., 1976. Biological and ecological characterizationof the marine unicellular cyanobacterium Synechococcus. Canadian Bulletin of Fisheries and AquaticSciences 214, 71}120.
Wood, A.M., 1985. Adaptation of photosynthetic apparatus of marine ultraphytoplankton to natural light"elds. Nature 316, 253}255.
A. Michelle Wood et al. / Deep-Sea Research II 46 (1999) 1769}1790 1789

Wood, A.M., Horan, P.K., Muirhead, K., Phinney, D.A., Yentsch, C.M., Waterbury, J.B., 1985. Discrimina-tion between types of pigments in marine Synechococcus by scanning spectroscopy, epi#uorescencemicroscopy, and #ow cytometry. Limnology and Oceanography 30, 1303}1315.
Wood, A.M., Phinney, D.A., Yentsch, C.S., 1998. Water column transparency and the distribution ofspectrally distinct forms of phycoerythrin-containing organisms. Marine Ecology Progress Series 162,25}31.
Wyman, M., 1992. An in vivo method for the estimation of phycoerythrin concentrations in marinecyanobacteria (Synechococcus spp.). Limnology and Oceanography 37, 1300}1306.
1790 A. Michelle Wood et al. / Deep-Sea Research II 46 (1999) 1769}1790