
Past 100 ky surface salinity-gradient response in the Eastern Arabian Sea to the summer monsoon...
8
Past 100 ky surface salinity-gradient response in the Eastern Arabian Sea to the summer monsoon variation recorded by y 18 O of G. sacculifer Anjali R. Chodankar a , Virupaxa K. Banakar a, * , Tadamichi Oba b a National Institute of Oceanography, Geological Oceanography Division, Donalpaula, Goa-403 004, India b Environmental Earth Science Division, Hokkaido University, Sapporo, 060-810, Japan Received 21 January 2004; accepted 29 October 2004 Abstract Northward flowing coastal currents along the western margin of India during winter–spring advect low-salinity Bay of Bengal water in to the Eastern Arabian Sea producing a distinct low-salinity tongue, the strength of which is largely governed by the freshwater flux to the bay during summer monsoons. Utilizing the sedimentary records of y 18 O G. sacculifer , we reconstructed the past salinity-gradient within that low-salinity tongue, which serves as a proxy for the variation in freshwater flux to the Bay of Bengal and hence summer monsoon intensity. The north–south contrast in the sea level corrected (residual)-y 18 O G. sacculifer can be interpreted as a measure of surface salinity-contrast between those two locations because the modern sea surface temperature and its past variation in the study region is nearly uniform. The core-top residual-y 18 O G. sacculifer contrast of 0.45x between the two cores is assumed to reflect the modern surface salinity difference of 1 psu and serves as a calibration for past variations. The residual-y 18 O G. sacculifer contrast varies between ~0.2x at ~75 ky B.P. (i.e., late-Marine Isotope Stage 5) and ~0.7x at ~20 ky B.P. (i.e., Last Glacial Maximum), suggesting that the overall salinity difference between the northern- and southern-end of the low-salinity tongue has varied between ~0.6 and ~1.6 psu. Considerably reduced difference during the former period than the modern suggests substantially intensified and northward-extended low-salinity tongue due to intense summer monsoons than today. On the other hand, larger difference (~1.6 psu) during the latter period indicates that the low-salinity tongue was significantly weakened or withdrawn due to weaker summer monsoons. Thus, the salinity-gradient in the eastern Arabian Sea low-salinity tongue can be used to understand the past variations in the Indian summer monsoons. D 2004 Elsevier B.V. All rights reserved. Keywords: Northern Indian Ocean; Eastern Arabian Sea; planktonic foraminifera; stable isotopes; palaeomonsoons; surface circulation 0921-8181/$ - see front matter D 2004 Elsevier B.V. All rights reserved. doi:10.1016/j.gloplacha.2004.10.008 * Corresponding author. Tel.: +91 832 2450361; fax: +91 832 2450602. E-mail address: [email protected] (V.K. Banakar). Global and Planetary Change 47 (2005) 135 – 142 www.elsevier.com/locate/gloplacha
-
Upload
independent -
Category
Documents
-
view
1 -
download
0
Transcript of Past 100 ky surface salinity-gradient response in the Eastern Arabian Sea to the summer monsoon...

www.elsevier.com/locate/gloplacha
Global and Planetary Chang
Past 100 ky surface salinity-gradient response in the Eastern
Arabian Sea to the summer monsoon variation recorded
by y18O of G. sacculifer
Anjali R. Chodankara, Virupaxa K. Banakara,*, Tadamichi Obab
aNational Institute of Oceanography, Geological Oceanography Division, Donalpaula, Goa-403 004, IndiabEnvironmental Earth Science Division, Hokkaido University, Sapporo, 060-810, Japan
Received 21 January 2004; accepted 29 October 2004
Abstract
Northward flowing coastal currents along the western margin of India during winter–spring advect low-salinity Bay of
Bengal water in to the Eastern Arabian Sea producing a distinct low-salinity tongue, the strength of which is largely
governed by the freshwater flux to the bay during summer monsoons. Utilizing the sedimentary records of y18OG.
sacculifer, we reconstructed the past salinity-gradient within that low-salinity tongue, which serves as a proxy for the
variation in freshwater flux to the Bay of Bengal and hence summer monsoon intensity.
The north–south contrast in the sea level corrected (residual)-y18OG. sacculifer can be interpreted as a measure of surface
salinity-contrast between those two locations because the modern sea surface temperature and its past variation in the study
region is nearly uniform. The core-top residual-y18OG. sacculifer contrast of 0.45x between the two cores is assumed to reflect
the modern surface salinity difference of 1 psu and serves as a calibration for past variations.
The residual-y18OG. sacculifer contrast varies between ~0.2x at ~75 ky B.P. (i.e., late-Marine Isotope Stage 5) and ~0.7x at
~20 ky B.P. (i.e., Last Glacial Maximum), suggesting that the overall salinity difference between the northern- and southern-end
of the low-salinity tongue has varied between ~0.6 and ~1.6 psu. Considerably reduced difference during the former period than
the modern suggests substantially intensified and northward-extended low-salinity tongue due to intense summer monsoons
than today. On the other hand, larger difference (~1.6 psu) during the latter period indicates that the low-salinity tongue was
significantly weakened or withdrawn due to weaker summer monsoons. Thus, the salinity-gradient in the eastern Arabian Sea
low-salinity tongue can be used to understand the past variations in the Indian summer monsoons.
D 2004 Elsevier B.V. All rights reserved.
Keywords: Northern Indian Ocean; Eastern Arabian Sea; planktonic foraminifera; stable isotopes; palaeomonsoons; surface circulation
0921-8181/$ - s
doi:10.1016/j.gl
* Correspondi
E-mail addr
e 47 (2005) 135–142
ee front matter D 2004 Elsevier B.V. All rights reserved.
oplacha.2004.10.008
ng author. Tel.: +91 832 2450361; fax: +91 832 2450602.
ess: [email protected] (V.K. Banakar).

A.R. Chodankar et al. / Global and Planetary Change 47 (2005) 135–142136
1. Introduction
The northern Indian Ocean is characterised by
distinct surface salinity (henceforth dsalinityT) differ-ence between its two major basins viz., Arabian Sea
(AS) and Bay of Bengal (BOB; Wyrtki, 1973). The
net loss (gain) of freshwater from the western basin
(to the eastern basin) gives rise to high salinity in the
AS and low salinity in the BOB. The formation of
Arabian Sea high-salinity water (ASHSW) in the
northern AS (Prasannakumar and Prasad, 1999;
Shenoi et al., 1993) and the presence of low-salinity
BOB water in the southern AS result in northward-
increasing east–west-trending isohalines in the basin
(Fig. 1). This general east–west trend of the isoha-
lines sharply deviates towards north in the eastern-AS
(EAS) due to the presence of low-salinity tongue
along the western margin of India (Fig. 1; see Levitus
and Boyer, 1994; annual mean salinity from
www.nodc.noaa.gov). The northward-flowing pole-
ward coastal current (PCC) along the western margin
(Shetye et al., 1991), which is a part of the winter
monsoon circulation (WMC), transports on an aver-
age 6 Sv of low-salinity BOB water in to the EAS,
beginning with the decay of summer monsoons
Fig. 1. Locations of the GC-8 (northern) and CR-4 (southern) sediment c
MD900 is the sediment core (MD900963: 5 804V N, 73 853V E) studied by
sediment core (128 30V N, 718 15V E) having AMS 14C chronology (Sar
contours with corresponding values in psu. Dotted curved arrows are s
monsoon circulations. AS—Arabian Sea, BOB—Bay of Bengal, EC—Eq
South equatorial currents, SC—Somali currents.
through the winter–spring (Shankar et al., 2002).
Thus, the PCC is responsible for the existence of the
low-salinity tongue in the EAS. The presence of low-
salinity tongue and its dependence on the summer
monsoon freshwater flux to the BOB is largely
unambiguous (Shankar et al., 2002; Shetye et al.,
1991). The summer monsoon rainfall in the Hima-
layan region that drains in to the BOB through one of
the world’s largest fluvial systems viz., Ganges–
Brahmaputra, together discharging nearly 1000 km3/y
freshwater (Rao, 1979) and excess overhead precip-
itation determines the freshness of the BOB. It has
been shown that the alongshore pressure gradient
dominates the winter-wind stress in the EAS region
because of the strong density gradient developed due
to the presence of high-salinity water in the north and
low-salinity water in the south, which largely drives
the PCC (Shetye et al., 1991). However, the strength
of PCC depends on several other parameters such as
details in the decay of summer monsoon and
evolution of winter monsoons, seasonal wind patterns
and sea level changes along the coasts of India, and
the wind gap between Sri Lanka and India (D.
Shankar, personal communication, 2004). Therefore,
the strength and northward extension of the low-
ores used in the present study (open stars). Open circle-labelled as
Rostek et al. (1993) for palaeo-salinity and -labelled as 3104G is the
kar et al., 2000). Continuous lines are the annual average salinity
ummer monsoon circulations, and solid curved arrows are winter
uatorial currents, SECC—South-equatorial counter currents, SEC—

A.R. Chodankar et al. / Global and Planetary Change 47 (2005) 135–142 137
salinity tongue need not covary with the PCC but
certainly depends upon the freshness of BOB-water
entering in to the EAS and influence of the ASHSW
on the northern-EAS. Further, in addition to overhead
precipitation, the freshwater discharge in to the
northern-AS by Indus River (~210 km3/y: Rao,
1979) and by several medium seasonal rivers in to
the EAS (~100 km3/y) during the summer monsoon
determine the evaporation minus precipitation bal-
ance (E�P), in turn intensity of the ASHSW. Thus,
the interplay between the southerly low-salinity
tongue and the northerly ASHSW appears to be
responsible for the salinity-gradient in the EAS
(Shenoi et al., 1993). The changes in salinity-gradient
between two well-separated locations within the low-
salinity tongue may therefore provide a potential tool
for understanding the past variation in the intensity of
Indian summer monsoons.
In response to past fluctuations in the summer-
and winter-monsoon intensity, the salinities in both
the basins have oscillated (Duplessy, 1982; Kudrass
et al., 2001; Rostek et al., 1993), and hence, the
salinity-gradient in EAS must have fluctuated accord-
ingly. If we could track the changes in the past
salinity-gradient between northern- and southern-
regions of the low-salinity tongue, then it should be
possible to understand past changes in the strength of
low-salinity tongue and ASHSW, in turn the summer
monsoon intensity. The oxygen isotopes of the
planktonic foraminifera from sediment cores provide
an opportunity to monitor the past changes in the
salinity (Duplessy et al., 1981; Rostek et al., 1993)
because both of them covary in response to E�P in
the region (Delaygue et al., 2001). Few previous
studies from the EAS have utilized the calcite-y18Ofor reconstructing the past variations in E�P and the
summer-monsoons (Cayre and Bard, 1999; Duplessy,
1982; Rostek et al., 1997; Sarkar et al., 2000;
Thamban et al., 2001). But past variation in summer
monsoon-dependant low-salinity tongue, which has
considerable contribution to the freshening of the AS,
has not been looked into. In this study, utilizing the
calcite-y18O of the upper mixed layer dwelling
foraminifera Globigerinodes (G.) sacculifer (Hem-
bleben et al., 1989) from sediment cores collected
from the region of the low-salinity tongue in EAS, we
reconstruct the past variations in the summer monsoon
intensity.
2. Material and methods
Two sediment cores from differing salinity (by ~1
psu) regions of the low-salinity tongue in the EAS
are used for the present study. One core (SK-117/GC-
08: 15829V N and 71801V E, water depth=2500 m) is
from the northern high-salinity region (hereafter
dnorthern coreT), and the other core (SK-129/CR-04:
6830V N and 75859V E, water depth=2000 m) is from
the southern low-salinity region (hereafter dsoutherncoreT) of the modern low-salinity tongue (Fig. 1). The
salinity at the northern location is ~35.8 psu and at
the southern location is ~34.8 psu. Around 30 clean
and intact tests of G. sacculifer (without terminal-
sacs) from 250–350 Am size-range were hand picked
under microscope from 4-cm interval subsections of
the cores. The crushed and cleaned tests were reacted
with 100% phosphoric acid at 60F1 8C in a reaction
vessel to release the CO2 gas, which was then
subjected to a three-step purification in a glass-line
maintained under vacuum. The 18O/16O of the
purified CO2 was measured in a Finnigan MAT-251
mass-spectrometer against PDB calibrated NBS-20
standard. The measured isotopic ratios are expressed
as y18O in per mil (x) unit with reference to PDB.
The precision obtained by six-replicate measurement
was within F0.01x. The chronology for both the
cores was established by tuning the down-core
y18OG. sacculifer profiles (Fig. 2) to the tropical stack
of the SPECMAP marine isotope stages (MIS;
Bassinot et al., 1994), which is a modified SPEC-
MAP of Imbrie et al. (1984). Further, to evaluate the
accuracy of our age models, we compared: (a)
Holocene sedimentation rate in the northern-core
with a published record of AMS 14C-based sedimen-
tation rate for a nearby core 3104G (Fig. 1) from
nearly similar water depth (Sarkar et al., 2000). Both
the cores yield similar Holocene sedimentation rate of
~2.4 cm/ky; (b) LGM sedimentation rate in the
southern-core with nearby MD900963 core (Fig. 1)
from nearly similar water depth (Rostek et al., 1997).
Both these cores yield closely comparable sedimen-
tation rates of ~4.5 cm/ky; and (c) correspondence of
MIS5.1 and MIS5.3 interstadials between the north-
ern- and southern-cores, which superimpose fairly
well (Fig. 2). These comparisons clearly indicate that
the age-models derived for the present cores are
accurate, and hence, time-series variations in the

A.R. Chodankar et al. / Global and Planetary Change 47 (2005) 135–142138
y18OG. sacculifer of both the records exhibit good
correspondence. Nevertheless, AMS 14C-dating
would provide most accurate age models for the
studied cores particularly for the Holocene-LGM
sections, which presently not available to us.
The global ice-volume (sea level) and local-SST
and E�P together determine the seawater-y18O
composition (Emiliani, 1955; Imbrie et al., 1984;
Shackleton, 1967; 2000; Shackleton and Opdyke,
1973). As the geographical SST variation is small in
the northern Indian Ocean (within ~1 8C: www.nodc.noaa, 2002), the E�P variation leads to significant
changes in the local salinity. Therefore, the salinity
and seawater-y18O exhibit covariation in this region
(Delaygue et al., 2001). The modern SST is uniform
~28 8C in the EAS, and the last glacial cooling also
appears to be nearly uniform ~2 8C for the study
region (see Cayre and Bard, 1999; Rostek et al., 1993;
Sonzogni et al., 1998). Therefore, the SST-effect on
the surface water-y18O would be similar at both
locations. The down-core y18OG. sacculifer records of
both the cores were interpolated to 1-ky interval for
obtaining the variations on a time-scale similar to the
sea level curve (see Fig. 3; Shackleton, 2000) to
facilitate ice-volume correction to our y18OG. sacculifer.
Although this correction does not make any differ-
ence, the structure of the ice volume corrected
(residual)-y18OG. sacculifer helps appreciate the salinity
variations. A careful evaluation of the available SST
reconstructions for the EAS region (Cayre and Bard,
1999; Rostek et al., 1993; Uk37-SST data for LGM
section of the northern core: Banakar et al., in press)
suggests that, in general, the fluctuations of ~F0.5 8Coccur within each climate period. A 0.5 8C SST
variation is equivalent to ~0.1x change in the y18OG.
sacculifer (Duplessy et al., 1981). Further, the Uk37-SST
estimates contain certain uncertainty depending upon
the calibration used (see Cayre and Bard, 1999;
Sonzogni et al., 1998), and preservation of the surface
temperature signals in the sediment (Conte et al.,
2001). However, to minimise short time-scale
fluctuations, we smoothed the residual-y18OG. sacculifer
variations by 3-ky moving averages and assume that
Fig. 2. Depth vs. age relationship derived from tuning the down-
core y18OG. sacculifer of GC-8 (upper panel) and CR-4 (lower panel)
with the tropical-SPECMAP. The SPECMAP-based marine isotope
stage boundaries identified in the cores are shown with vertica
lines, while their corresponding ages are shown with horizonta
lines. Marine isotope stages are labelled with numbers. Vertica
broken line represents the depth at which the Youngest Toba Tuff
(YTT: ~72 Ka) occurs in the cores. Vertical dotted lines labelled as
5.1 and 5.3 are interstadials of the last warm period. Two downward
arrows on top of the upper panel are the AMS 14C-ages (6.7 and
15.2 ky B.P.) obtained for nearby sediment core (3104G, see Fig. 1)
by Sarkar et al. (2000).
l
l
l
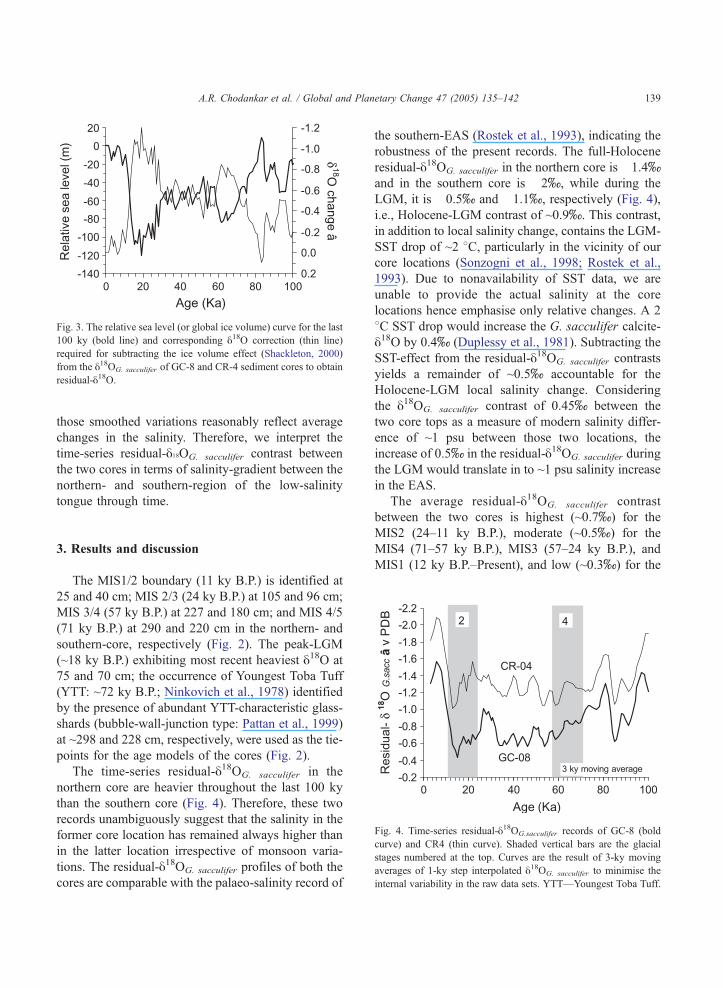
Fig. 3. The relative sea level (or global ice volume) curve for the last
100 ky (bold line) and corresponding y18O correction (thin line)
required for subtracting the ice volume effect (Shackleton, 2000)
from the y18OG. sacculifer of GC-8 and CR-4 sediment cores to obtain
residual-y18O.
A.R. Chodankar et al. / Global and Planetary Change 47 (2005) 135–142 139
those smoothed variations reasonably reflect average
changes in the salinity. Therefore, we interpret the
time-series residual-y18OG. sacculifer contrast between
the two cores in terms of salinity-gradient between the
northern- and southern-region of the low-salinity
tongue through time.
Fig. 4. Time-series residual-y18OG.sacculifer records of GC-8 (bold
curve) and CR4 (thin curve). Shaded vertical bars are the glacia
stages numbered at the top. Curves are the result of 3-ky moving
averages of 1-ky step interpolated y18OG. sacculifer to minimise the
internal variability in the raw data sets. YTT—Youngest Toba Tuff
3. Results and discussion
The MIS1/2 boundary (11 ky B.P.) is identified at
25 and 40 cm; MIS 2/3 (24 ky B.P.) at 105 and 96 cm;
MIS 3/4 (57 ky B.P.) at 227 and 180 cm; and MIS 4/5
(71 ky B.P.) at 290 and 220 cm in the northern- and
southern-core, respectively (Fig. 2). The peak-LGM
(~18 ky B.P.) exhibiting most recent heaviest y18O at
75 and 70 cm; the occurrence of Youngest Toba Tuff
(YTT: ~72 ky B.P.; Ninkovich et al., 1978) identified
by the presence of abundant YTT-characteristic glass-
shards (bubble-wall-junction type: Pattan et al., 1999)
at ~298 and 228 cm, respectively, were used as the tie-
points for the age models of the cores (Fig. 2).
The time-series residual-y18OG. sacculifer in the
northern core are heavier throughout the last 100 ky
than the southern core (Fig. 4). Therefore, these two
records unambiguously suggest that the salinity in the
former core location has remained always higher than
in the latter location irrespective of monsoon varia-
tions. The residual-y18OG. sacculifer profiles of both the
cores are comparable with the palaeo-salinity record of
the southern-EAS (Rostek et al., 1993), indicating the
robustness of the present records. The full-Holocene
residual-y18OG. sacculifer in the northern core is �1.4xand in the southern core is �2x, while during the
LGM, it is �0.5x and �1.1x, respectively (Fig. 4),
i.e., Holocene-LGM contrast of ~0.9x. This contrast,
in addition to local salinity change, contains the LGM-
SST drop of ~2 8C, particularly in the vicinity of our
core locations (Sonzogni et al., 1998; Rostek et al.,
1993). Due to nonavailability of SST data, we are
unable to provide the actual salinity at the core
locations hence emphasise only relative changes. A 2
8C SST drop would increase the G. sacculifer calcite-
y18O by 0.4x (Duplessy et al., 1981). Subtracting the
SST-effect from the residual-y18OG. sacculifer contrasts
yields a remainder of ~0.5x accountable for the
Holocene-LGM local salinity change. Considering
the y18OG. sacculifer contrast of 0.45x between the
two core tops as a measure of modern salinity differ-
ence of ~1 psu between those two locations, the
increase of 0.5x in the residual-y18OG. sacculifer during
the LGM would translate in to ~1 psu salinity increase
in the EAS.
The average residual-y18OG. sacculifer contrast
between the two cores is highest (~0.7x) for the
MIS2 (24–11 ky B.P.), moderate (~0.5x) for the
MIS4 (71–57 ky B.P.), MIS3 (57–24 ky B.P.), and
MIS1 (12 ky B.P.–Present), and low (~0.3x) for the
l
.

A.R. Chodankar et al. / Global and Planetary Change 47 (2005) 135–142140
later half of the MIS5 (100–72 ky B.P.; Fig. 5). The
residual-y18OG. sacculifer contrast of 0.3x to 0.7xwould translate in to ~0.6 to 1.6 psu salinity-contrast
variation (i.e., ~F50% of the modern gradient) on
glacial–interglacial time-scale. However, the time-
series residual-y18OG. sacculifer contrast curve contains
short-term higher amplitude oscillations (0.2x to
0.9x; Fig. 5), suggesting rapid and larger changes
in the salinity-contrast (~0.4–2 psu), indicating
salinity-gradient change from ~60% less to almost
double than the modern gradient between northern
and southern locations of the low-salinity tongue.
The fluctuations in the salinity-gradient between
the northern- and southern-region of the low-salinity
tongue reflect the relative changes in the salinity of
those regions. The salinity of the northern location
depends upon the intensity of ASHSWand strength of
the Deccan Rivers discharging in to the EAS.
Whereas, the salinity in the southern location depends
mainly on the freshness of the BOB because of greatly
reduced influence of ASHSW in the upper mixed
Fig. 5. Time-series variation in the residual-y18OG. sacculifer contrast
between the northern- and southern-core (referred as salinity-
contrast in the text for clarity). The contrast was obtained for 1-
ky step interpolated residual-y18OG. sacculifer, and then the resultant
curve is smoothed by 3-ky moving average. Horizontal broken line
is the modern salinity-contrast of 1 psu assumed to be equivalent to
0.45x of residual-y18OG. sacculifer contrast between the two core-
tops. This line facilitates ready assessment of the changes in palaeo-
salinity-gradient. Grey shaded vertical bars are the glacial stages
numbered at the top. (A) Sector representing lowered salinity-
contrast than the modern contrast. Contrast tending towards d0Tindicates diminishing salinity-gradient; (B) Sector with increased
salinity-gradient than the modern. E�P=evaporation minus precip-
itation: higher E�P indicates reduced freshwater flux to the region
and vice versa.
layer (Prasannakumar and Prasad, 1999) and the river
input. The intense summer monsoons associating with
increased freshwater flux to the northern-AS, EAS,
and BOB not only intensify the freshening of the BOB
but also weaken the ASHSW due to reduced E�P.
The cumulative effect of the above should result in
strengthened low-salinity tongue and its further north-
ward extension in the EAS leading to a reduced
salinity-gradient. On the other hand, the ASHSW
intensifies with increased E�P due to increased winter
evaporation and weakened summer precipitation
(Shenoi et al., 1993). The latter also results in reduced
freshwater flux to the BOB and EAS by decreased
freshwater discharge from the Himalayan and Deccan
rivers respectively, in addition to reduced overhead
precipitation. In such circumstance, the northern core
location comes under increased influence of ASHSW
and reduced influence of low-salinity tongue. The net
effect is to increase the salinity-gradient between
northern and southern locations. This conceptual
scenario essentially suggests that the intensified
summer monsoons reduce the salinity-gradient within
the low-salinity tongue, resulting in decreased resid-
ual-y18OG. sacculifer contrast between the present two
core locations.
The high north–south salinity-contrast (up to ~1.6
psu) in the EAS during the LGM (Fig. 5) therefore
suggests weakened low-salinity tongue; that is, the
northward deviation of the isohalines was signifi-
cantly decreased during that time. This is clearly
reflected in the previously reported LGM-salinity
structure of the AS (see Fig. 3 in Duplessy, 1982).
The diminished low-salinity tongue might have been
the result of nearly collapsed communication between
the EAS and BOB due to significant reduction in the
freshwater flux to the latter and intensified northeast-
erly winter monsoon winds enhancing the alongshore
component opposing the PCC in the EAS. There are
several evidences to suggest that the LGM-monsoon
system was dominated by the winter winds. For
example: (a) the mean position of the summer
monsoons shifted southward (Sirocko et al., 1991),
and summer precipitation and southerly wind velocity
were greatly reduced (Niitsuma et al., 1991; Prell and
Kutzbach, 1992); (b) the minimum surface water-y18Ocontrast between the AS and BOB (Duplessy, 1982)
suggested significant reduction in freshwater transfer
from the AS to the Indian subcontinent; (c) enhanced

A.R. Chodankar et al. / Global and Planetary Change 47 (2005) 135–142 141
abundance of high-salinity fauna in LGM sections of
the sedimentary records (Cullen, 1981); (d) increased
salinity in the southern-EAS during the LGM (Rostek
et al., 1993); (e) dominant Mediterranean type pollens
characteristic of intense arid climate in the LGM
sediment of the AS (Van Campo et al., 1982); and (f)
enhanced deep-water nutrient injection in to the
photic-zone of the EAS, leading to high productivity
(Cayre and Bard, 1999; Rostek et al., 1997; Banakar et
al., in press). Large-scale climate models have
suggested that intense winter and extended snow cover
over the Tibet and Himalayas during the spring delays
the onset and weakens the following summer monsoon
(Yang, 1996); that is, the extreme long winters of the
LGM might have forced the summer monsoons to
decline. Thus, the weakened low-salinity tongue in the
LGM–EAS is in accordance with then existed ocean-
atmosphere coupling. Further, the earlier suggested
enhanced low-salinity water transport from the BOB to
the AS during the LGM due to intensified winter
circulation (Sarkar et al., 1990) does not appear to be
feasible, considering the circulation dynamics of the
northern Indian Ocean (Shankar et al., 2002; Shetye et
al., 1991) and present record of the salinity-gradient.
There are very few events during the last 100 ky
exhibiting lower salinity-gradient than the Holocene
(Fig. 5). They are evident particularly in the MIS5, in
that, closing of the MIS5 (~75 Ka) has recorded lowest
contrast (residual-y18OG. sacculifer contrast of ~0.2xequating to ~0.4 psu salinity-contrast), suggesting
significant (~60%) reduction in the salinity-gradient.
Thus, the last warm period (MIS5) appears to have
witnessed more intense summer monsoons than the
present warm period (Holocene). Whereas, the LGM–
EAS appears to have witnessed weakest summer
monsoons of the last 100 ky as evident in significantly
increased (nearly doubled) salinity-gradient than the
modern (Fig. 5). The pre-Holocene high-amplitude (up
to four-times the Holocene amplitude) fluctuations in
the residual-y18OG. sacculifer contrast indicate consid-
erable variability in the past summer monsoons.
4. Conclusion
The time-series residual-y18OG. sacculifer contrast
between the northern- and southern-region of the low-
salinity tongue in the Eastern Arabian Sea records
significant variations in the past salinity-gradient of
the region, in turn summer monsoon-driven changes
in the strength of low-salinity tongue.
The highest residual-y18OG. sacculifer contrast indi-
cating largest salinity-gradient during the LGM
appears to be the result of greatly reduced freshness
in the coastal current system responsible for freshening
the Eastern Arabian Sea due to reduced freshening of
the Bay of Bengal, suggesting weakest summer
monsoons. On the other hand, the lowest contrast
indicating smallest salinity-gradient during the last
warm period suggests increased freshness in the
eastern Arabian Sea due to northward extension of
the low-salinity tongue and weakened formation of the
high-salinity water in the northern Arabian Sea region,
together resulting from intense summer monsoons.
Thus, it is possible to understand past variations in the
Indian monsoon system by monitoring the time-series
changes in the salinity-gradient of the eastern Arabian
Sea characteristic low-salinity tongue.
Acknowledgements
We have greatly benefited from discussions with S.
R. Shetye, D. Shankar, and suggestions of Keith
Alverson and two anonymous reviewers. VKB thanks
the CSIR for the award of Raman Fellowship and
many colleagues of the Geosphere Laboratory, Hok-
kaido University for help during isotope measure-
ments. ARC thanks NIO for providing her an
opportunity to work for a doctoral thesis, EMR, CSIR
for awarding SRF, and START-TWAS for an oppor-
tunity to present this work during the Young Scientists
Global Change Conference-2003, Italy. The ship-time
for sampling was provided by DOD (this is NIO
contribution No. 3943).
References
Banakar, V.K., Oba, T., Chodankar, A.R., Kuramoto, T., Yamamoto,
M., Minagawa, M., in press. Monsoon related changes in sea
surface productivity and water column denitrification in the
Eastern Arabian Sea during the last glacial cycle. Mar. Geol.
Bassinot, F.C., Labeyrie, L.D., Vincent, E., Quidelleur, X.,
Shackleton, N.J., Lancelot, Y., 1994. The astronomical theory
of climate and the age of the Brunhes–Matuyama magnetic
reversal. Earth Planet. Sci. Lett. 126, 91–108.

A.R. Chodankar et al. / Global and Planetary Change 47 (2005) 135–142142
Cayre, O., Bard, E., 1999. Planktonic foraminiferal and alkenone
records of the last deglaciation from the eastern Arabian Sea.
Quat. Res. 52, 337–342.
Conte, M.H., Weber, J.C., King, L.L., Wakeham, S.G., 2001. The
alkenone temperature signal in Western North Atlantic surface
waters. Geochim. Cosmochim. Acta 65, 4275–4287.
Cullen, J.L., 1981. Microfossil evidence for changing salinity
pattern in the Bay of Bengal over the last 20,000 years.
Palaeogeogr. Palaeoclimatol. Palaeoecol. 35, 315–356.
Delaygue, G., Bard, E., Rollion, C., Jouzel, J., Stievenard, M.,
Duplessy, J.C., 2001. Oxygen isotope/salinity relationship in the
northern Indian Ocean. J. Geophys. Res. 106, 4565–4574.
Duplessy, J.C., 1982. Glacial to interglacial contrast in the northern
Indian Ocean. Nature 295, 494–498.
Duplessy, J.C., Be, A.W.H., Blank, P.L., 1981. Oxygen and carbon
isotopic composition and biogeographic distribution of plank-
tonic foraminiferain the Indian Ocean. Palaeogeogr. Palae-
oclimatol. Palaeoecol. 33, 9–46.
Emiliani, C., 1955. Pleistocene temperatures. J. Geol. 63, 538–578.
Hembleben, C., Spindler, M., Anderson, R.O., 1989. Modern
Planktonic Foraminifera. Springer-Verlag, NY, pp. 363.
Imbrie, J., Hays, J.D., Martinson, D.G., McIntyre, A.C., Mix, A.C.,
Morley, J.J., Pisias, N.G., Prell, W.L., Shackleton, N.J., 1984.
The orbital theory of Pleistocene climate: support from revised
chronology of the marine y18O record. In: Berger, A., Imbrie, J.,
Hays, J., Kukla, G., Saltzman, B. (Eds.), Milankovitch and
Climate Part-1. Plenum Reidel, pp. 269-305.
Kudrass, H.R., Hofmann, A., Doose, H., Emeis, K., Erlenkeuser, H.,
2001. Modulation and amplification of climatic changes in the
northern hemisphere by the Indian summer monsoon during the
past 80 k.y. Geology 29, 63–66.
Levitus, S., Boyer, T.P., 1994. World Ocean Atlas, vol. 94. NOAA/
NESDIS/OCL, Washington, DC, pp. 1–4.
Niitsuma, N., Oba, T., Okada, M., 1991. Oxygen and carbon isotope
stratigraphy at site 729, Oman margin. Proc. ODP, Sci. Results
117, 321–341.
Ninkovich, D., Shackleton, N.J., Abdel-Monem, A.A., Obradovich,
J.D., Izett, G., 1978. K–Ar age of thelate Pleistocene eruption of
Toba, north Sumatra. Nature 276, 574–577.
Pattan, J.N., Shane, P., Banakar, V.K., 1999. New occurrence of
youngest Toba Tuff in abyssal sediments of the central Indian
basin. Mar. Geol. 155, 243–248.
Prasannakumar, S., Prasad, T.G., 1999. Formation and spreading of
Arabian Sea high-salinity water mass. J. Geophys. Res. 104,
1455–1464.
Prell, W.L., Kutzbach, J.E., 1992. Sensitivity of the Indian monsoon
to forcing parameters and implications for its evolution. Nature
360, 647–652.
Rao, K.L., 1979. India’s Water Wealth: Its Assessment, Uses, and
Projections. Orient Longman, p. 261.
Rostek, F., Ruhland, G., Bassinot, F.C., Muller, P.J., Labeyrie, L.D.,
Lancelot, Y., Bard, E., 1993. Reconstructing sea surface
temperature and salinity using y18O and alkenone records.
Nature 364, 319–321.
Rostek, F., Bard, E., Beaufort, L., Sonzogni, C., Ganssen, G., 1997.
Sea surface temperature and productivity records for the past
240 kyr in the Arabian Sea. Deep-Sea Res. II 44, 1461–1480.
Sarkar, A., Ramesh, R., Bhattacharya, S.K., Rajagopalan, G., 1990.
Oxygen isotope evidence for stronger winter monsoon current
during the last glaciation. Nature 343, 549–551.
Sarkar, A., Ramesh, R., Somayajulu, B.L.K., Agnihotri, R., Jull,
A.J.T., Burr, G.S., 2000. High resolution Holocene monsoon
record from the eastern Arabian Sea. Earth Planet. Sci. Lett.
177, 209–218.
Shackleton, N.J., 1967. Oxygen isotope analyses and Pleistocene
temperatures re-assessed. Nature 215, 15–17.
Shackleton, N.J., 2000. A 100,000 year ice-age cycle identified and
found to lag temperature, carbon-dioxide, and orbital eccen-
tricity. Science 289, 1897–1902.
Shackleton, N.J., Opdyke, N.D., 1973. Oxygen isotopes and
paleomagnetic stratigraphy of equatorial Pacific core V28-238:
oxygen isotope temperatures and ice-volume on a 105-year and
106-year scale. Quat. Res. 3, 39–55.
Shankar, D., Vinayachandran, P.N., Unnikrishnan, A.S., 2002. The
monsoon currents in the north Indian Ocean. Prog. Oceanogr.
52, 63–120.
Shenoi, S.S.C., Shetye, S.R., Gouveia, A.D., Michael, G.S., 1993.
Salinity extrema in the Arabian Sea. In: Ittekkot, V., Nair, R.R.
(Eds.), Monsoon Biogeochemistry, vol. 76. SCOPE/UNEP
Sonderband, pp. 37–50.
Shetye, S.R., Gouveia, A.D., Shenoi, S.S.C., Michael, G.S., Sundar,
D., Almeida, A.M., Santanam, K., 1991. The coastal current off
western India during the northeast monsoon. Deep-Sea Res. 38,
1517–1529.
Sirocko, F., Sarnthein, M., Lange, H., Erlenkeuser, H., 1991.
Atmospheric summer circulation and coastal upwelling in the
Arabian Sea during the Holocene and the last glaciation. Quat.
Res. 36, 72–93.
Sonzogni, C., Bard, E., Rostek, F., 1998. Tropical sea-surface
temperatures during the last glacial period: a view based on
alkenones in Indian Ocean sediments. Quat. Sci. Rev. 17,
1185–1201.
Thamban, M., Rao, V.P., Schneider, R.R., Grootes, P.M., 2001.
Glacial to Holocene fluctuations in hydrography and produc-
tivity along the southwestern continental margin of India.
Palaeogeogr. Palaeoclimatol. Palaeoecol. 165, 113–127.
Van Campo, E., Duplessy, J.C., Rossignol-Strick, M., 1982.
Climatic conditions deduced from a 100 kyr oxygen isotope-
pollen record from Arabian Sea. Nature 296, 56–59.
Wyrtki, K., 1973. Physical oceanography of the Indian Ocean. In:
Zeitzschel, B. (Ed.), The Biology of the Indian Ocean. Springer,
Berlin, pp. 18–36.
Yang, S., 1996. Snow–monsoon associations and seasonal–inter-
annual prediction. Int. J. Climatol. 16, 125–134.


![ky; - tkscusj 303329] ftyk t;iqj ¼jktLFkku½](https://static.fdokumen.com/doc/165x107/6326926d6d480576770cda5c/ky-tkscusj-303329-ftyk-tiqj-jktlfkku.jpg)


![ijh{kk lfefr] iVuk fcgkj fo|ky - CareerIndia](https://static.fdokumen.com/doc/165x107/631d66063ba403638902bf06/ijhkk-lfefr-ivuk-fcgkj-foky-careerindia.jpg)

