An assessment of tropical cyclones rainfall erosivity for Taiwan
14
1 SCIENTIFIC REPORTS | (2019) 9:15862 | https://doi.org/10.1038/s41598-019-52028-5 www.nature.com/scientificreports An assessment of tropical cyclones rainfall erosivity for Taiwan Jayalakshmi Janapati 1,7 , Balaji Kumar Seela 1,2,7 , Pay-Liam Lin 1,3* , Pao K. Wang 4,5 & Utpal Kumar 6 Rainfall erosivity (or water erosion) has severe implications on agriculture, water, and land use management. Though, there were Rainfall erosivity studies on regional and global scale, tropical cyclones’ Rainfall erosivity is poorly assessed and have not been documented for one of the most cyclones affecting regions of the world like Taiwan. Here, using 15-years of raindrop size distributions (RSD) and 60-years of hourly rain gauges data, we estimated cyclones (also called typhoons) rainfall erosivity over Taiwan, and establish that typhoons’ mean rainfall erosivity is higher than the global mean rainfall erosivity. Moreover, regional variability of typhoons rainfall erosivity showed an increasing pattern from north to south (Taipei to Pingtung), with relatively higher values over eastern and southern parts of Taiwan. The annual mean erosivity of typhoons rainfall showed raising trends over eastern and southern Taiwan during 1958–2017. Our results provide an insight in assessing the land use and agricultural management for Taiwan. Tropical cyclones cause devastating loss of life and property globally 1,2 . Taiwan is one of the most intense tropical cyclones (typhoons) prone areas in the world 3 with an average number of 3–4 typhoons striking the island every year 4 . Typhoons’ rainfall extremes over Taiwan are accountable for more sediment discharge 5,6 , natural hazards like floods, debris flow, and landslides 7–10 . Typhoons-induced rainfall kinetic energy (KE) is the driving force for surface runoff and landslide, and can be used as a proxy to determine the landslides triggering 11 . e rainfall KE is the key parameter in the estimation of rainfall erosivity factor (or R-factor), a substantial factor for soil erosion risk assessment in Universal Soil Loss Equation (USLE), Revised Universal Soil Loss Equation (RUSLE), and RUSLE2 12–15 . e ability of rainfall to cause soil erosion can be described in terms of R-factor, and its variability immensely influences the agriculture, water, and land use management. e R-factor of a given location is defined as the annual accumulation of EI 30 index (in M J mm ha −1 h −1 ): the product of kinetic energy of each event (E) and its maximum 30-min rainfall intensity (I 30 ) 12,14 . An apprehending of R-factor can prominently improves an accurate assessment of soil erosion. Since the direct measurement of rainfall KE requires a precise and expensive experimental setup 16,17 , alter- native approaches have been developed to compute the rainfall KE from rainfall intensity (I) 18,19 , which require empirical relations between KE and I. As the KE of raindrop is proportional to the third power of diameter and square of fall velocity, the combined information of raindrop size and fall velocity of rain allows us to derive KE-I relations 18–21 . e KE-I relations have been developed in the form of linear 22 , exponential 18,23 , power 24 , and logarithmic 25 , which are effective for the observational site or to the regions with similar geographical and meteorological characteristics 21,23–25 , and vary with geographical location, local climate and precipitation microphysics 18,20,23 . Although, most of the previous studies on R-factor were devoted to seasonal or annual basis at regional, national, continental and global level 26–31 , limited studies were reported on the basis of storm types 32 , even such study has the limitation due to the adaptation of elsewhere KE-I relations in evaluating the R-factor. Here ‘else- where’ refers to the other country’s KE-I relations. Due to the paucity of local KE-I relations, vast majority of 1 Institute of Atmospheric Physics, Department of Atmospheric Sciences, National Central University, Jhong-Li Region, Tao-Yuan City, Taiwan. 2 Taiwan International Graduate Program (TIGP), Earth System Science Program, Research Center for Environmental Changes, Academia Sinica, Taipei, Taiwan. 3 Earthquake-Disaster & Risk Evaluation and Management Center, National Central University, Jhong-Li Region, Tao-yuan City, Taiwan. 4 Department of Atmospheric and Oceanic Sciences, University of Wisconsin-Madison, Madison, Wisconsin, USA. 5 Research Center for Environmental Changes, Academia Sinica, Taipei, Taiwan. 6 Taiwan International Graduate Program (TIGP), Earth System Science Program, Institute of Earth Sciences, Academia Sinica, Taipei, and National Central University, Jhong-Li Region, Tao-Yuan City, Taiwan. 7 These authors contributed equally: Jayalakshmi Janapati and Balaji Kumar Seela. *email: [email protected] OPEN
-
Upload
khangminh22 -
Category
Documents
-
view
2 -
download
0
Transcript of An assessment of tropical cyclones rainfall erosivity for Taiwan

1Scientific RepoRtS | (2019) 9:15862 | https://doi.org/10.1038/s41598-019-52028-5
www.nature.com/scientificreports
An assessment of tropical cyclones rainfall erosivity for taiwanJayalakshmi Janapati1,7, Balaji Kumar Seela 1,2,7, Pay-Liam Lin1,3*, Pao K. Wang 4,5 & Utpal Kumar6
Rainfall erosivity (or water erosion) has severe implications on agriculture, water, and land use management. Though, there were Rainfall erosivity studies on regional and global scale, tropical cyclones’ Rainfall erosivity is poorly assessed and have not been documented for one of the most cyclones affecting regions of the world like Taiwan. Here, using 15-years of raindrop size distributions (RSD) and 60-years of hourly rain gauges data, we estimated cyclones (also called typhoons) rainfall erosivity over Taiwan, and establish that typhoons’ mean rainfall erosivity is higher than the global mean rainfall erosivity. Moreover, regional variability of typhoons rainfall erosivity showed an increasing pattern from north to south (Taipei to Pingtung), with relatively higher values over eastern and southern parts of Taiwan. The annual mean erosivity of typhoons rainfall showed raising trends over eastern and southern Taiwan during 1958–2017. Our results provide an insight in assessing the land use and agricultural management for Taiwan.
Tropical cyclones cause devastating loss of life and property globally1,2. Taiwan is one of the most intense tropical cyclones (typhoons) prone areas in the world3 with an average number of 3–4 typhoons striking the island every year4. Typhoons’ rainfall extremes over Taiwan are accountable for more sediment discharge5,6, natural hazards like floods, debris flow, and landslides7–10. Typhoons-induced rainfall kinetic energy (KE) is the driving force for surface runoff and landslide, and can be used as a proxy to determine the landslides triggering11. The rainfall KE is the key parameter in the estimation of rainfall erosivity factor (or R-factor), a substantial factor for soil erosion risk assessment in Universal Soil Loss Equation (USLE), Revised Universal Soil Loss Equation (RUSLE), and RUSLE212–15. The ability of rainfall to cause soil erosion can be described in terms of R-factor, and its variability immensely influences the agriculture, water, and land use management. The R-factor of a given location is defined as the annual accumulation of EI30 index (in M J mm ha−1 h−1): the product of kinetic energy of each event (E) and its maximum 30-min rainfall intensity (I30)12,14. An apprehending of R-factor can prominently improves an accurate assessment of soil erosion.
Since the direct measurement of rainfall KE requires a precise and expensive experimental setup16,17, alter-native approaches have been developed to compute the rainfall KE from rainfall intensity (I)18,19, which require empirical relations between KE and I. As the KE of raindrop is proportional to the third power of diameter and square of fall velocity, the combined information of raindrop size and fall velocity of rain allows us to derive KE-I relations18–21. The KE-I relations have been developed in the form of linear22, exponential18,23, power24, and logarithmic25, which are effective for the observational site or to the regions with similar geographical and meteorological characteristics21,23–25, and vary with geographical location, local climate and precipitation microphysics18,20,23.
Although, most of the previous studies on R-factor were devoted to seasonal or annual basis at regional, national, continental and global level26–31, limited studies were reported on the basis of storm types32, even such study has the limitation due to the adaptation of elsewhere KE-I relations in evaluating the R-factor. Here ‘else-where’ refers to the other country’s KE-I relations. Due to the paucity of local KE-I relations, vast majority of
1Institute of Atmospheric Physics, Department of Atmospheric Sciences, National Central University, Jhong-Li Region, Tao-Yuan City, Taiwan. 2Taiwan International Graduate Program (TIGP), Earth System Science Program, Research Center for Environmental Changes, Academia Sinica, Taipei, Taiwan. 3Earthquake-Disaster & Risk Evaluation and Management Center, National Central University, Jhong-Li Region, Tao-yuan City, Taiwan. 4Department of Atmospheric and Oceanic Sciences, University of Wisconsin-Madison, Madison, Wisconsin, USA. 5Research Center for Environmental Changes, Academia Sinica, Taipei, Taiwan. 6Taiwan International Graduate Program (TIGP), Earth System Science Program, Institute of Earth Sciences, Academia Sinica, Taipei, and National Central University, Jhong-Li Region, Tao-Yuan City, Taiwan. 7These authors contributed equally: Jayalakshmi Janapati and Balaji Kumar Seela. *email: [email protected]
open

2Scientific RepoRtS | (2019) 9:15862 | https://doi.org/10.1038/s41598-019-52028-5
www.nature.com/scientificreportswww.nature.com/scientificreports/
rainfall erosivity studies have adopted elsewhere KE-I relations15,31,32 and only limited researchers used their local KE-I relations33. Similar scenario can be seen even for Taiwan in estimating the typhoons rainfall KE/erosivity11, which may lead to overestimation or underestimation of typhoons rainfall erosivity for this island19,33–35. Though, there were reports on local KE-I relations for Taiwan, they are limited to the seasonal rainfall or combination of monsoon and typhoon rainfall36,37. Moreover, the raindrop size distribution (RSD) characteristics of tropical cyclones and their KE-I relations were found to be different from that of the non-tropical cyclones precipita-tion19,38–40. Henceforth, it is crucial to explore Taiwan typhoons R-factor by adopting indigenous KE-I relations.
Here, we use the long-term RSD of 65 typhoons (2002–2017) and dense network of hourly rain gauges data (1958–2017). We investigate and evaluate the KE-I relations for typhoon rainfall, and demonstrate that the power form of KE-I relation is appropriate. Furthermore, the rainfall erosivity (R-factor) and erosivity density (R-factor density) are assessed for 393 typhoon rainfall events (occurred during 1958–2017) by adopting the estimated power form of KE-I relation to all rain gauge stations distributed over Taiwan. Also, trends in typhoons’ rainfall erosivity across the Island are discussed.
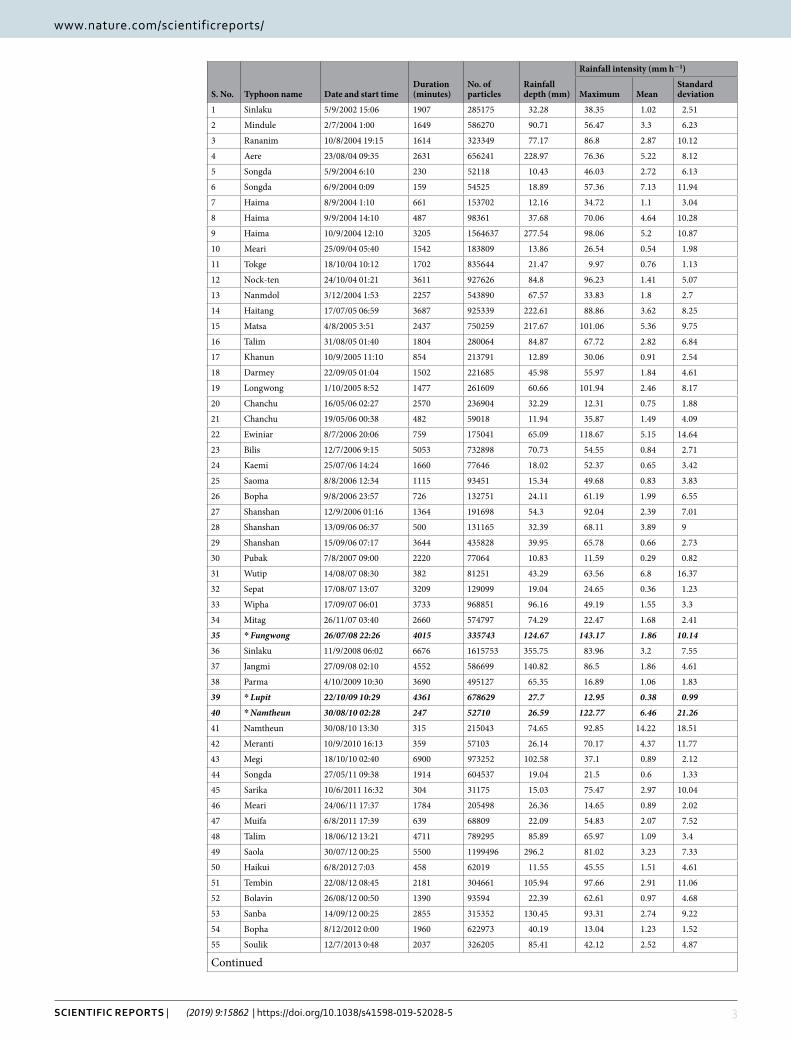
ResultsThe rainfall statistics of 75 typhoon rainfall erosive events computed from RSD measurements of disdrometer during 2002–2017 are summarized in Table 1. The rainfall depth, number of particles, duration of the event, maximum and mean rainfall intensity of these 75 typhoon events varies from 10.43–355.75 mm, 31175–1615753, 159–6900 min, 9.97–143.17 mm h−1 and 0.24–14.22 mm h−1, respectively. The number of particles range, 31175 to 1615753, represents the number of raindrops recorded by the JWD for 75 typhoon rainfall events. Out of 75 typhoon rainfall events, we used 72 events (70600 data points) to establish the empirical relations between kinetic energy (Kinetic energy expenditure - KEtime, and kinetic energy content - KEmm) and rainfall intensity (I) by using nonlinear least square regression analysis. The rest three events (Fungwong, Lupit, and Namtheun: designated with * symbol, in bold and italic font in Table 1) are used to validate the derived KE-I (KEtime-I and KEmm-I) relations.
Establishment of kinetic energy-rainfall intensity (KE-I) relations. Figure 1a depicts the scatter plot for kinetic energy expenditure (KEtime) and intensity (I) data points (70600) for 72 typhoon rainfall events. The KEtime ranges from 0.1–3517.9 J m−2 h−1, corresponding to rainfall intensities of 0.1–123.4 mm h−1. The mean value of KEtime is 72.65 J m−2 h−1 with standard deviation of 194.75 J m−2 h−1. The best estimates for power24,41 and linear22 forms of KEtime-I relations from the regression analysis are given Fig. 1a. The regression line derived for the data points showed relatively higher coefficient of determination for both power and linear equations. Even so, for rainfall intensity >50 mm h−1, the KEtime is underestimated by the linear equation and the power equation created good estimates with its regression line approximately passing through middle of data points, and the data points are relatively least scattered with uniform distribution over power regression line.
A total number of 70600 one-min data points of kinetic energy content (KEmm) and intensity (I) are shown in Fig. 1b. The KEmm varies from 1.05–39.11 J m−2 mm−1 for the rainfall intensity values of 0.1–123.4 mm h−1 with mean and standard deviation of 11.14 J m−2 mm−1 and 5.79 J m−2 mm−1, respectively. The maximum KEmm of current typhoons is higher than the global average maximum KEmm (28.3 ± 2.9 J m−2 mm−1)20. The KEmm data points are more scattered at lower rainfall intensities (<15 mm h−1) and are getting narrowed with the increase of rainfall intensity. By excluding the higher KEmm values at lower rainfall intensities (<15 mm h−1), a maximum KEmm of 35.71 J m−2 mm−1 is noticed. For rainfall intensity greater than 75 mm h−1, the KEmm ranges from 23.61–34.11 J m−2 mm−1 with mean and standard deviation of 26.4 J m−2 mm−1, 1.61 J m−2 mm−1, respectively. The established power, linear, logarithmic25, and exponential18,23 fitting curves for KEmm and I are depicted in Fig. 1b.
Among four models (Fig. 1b), power model showed relatively higher performance, and other two models (exponential and logarithmic) are significantly underestimated the KEmm for rainfall intensities >30 mm h−1. The exponential form of KEmm-I relation in the present study is different from that of the Chang et al.37 (KEmm = 32.19 [1-0.725e−0.029I]), which is due to their collective consideration of both seasonal and typhoon rainfall RSD in deriving KEmm-I relations. Present exponential form of KEmm-I relation is also found to be different from that of the Van Dijk et al.20 generalized equation (KEmm = 28.3 [1-0.52 exp(−0.042I)]) and evidently shows that the KE-I relations of typhoon rainfall are different from that of the non-typhoon rainfall, and confirms that, there is need to adopt local tropical cyclones KE-I relations in computing the rainfall KE/erosivity of tropical cyclones of a given region.
The goodness-of-fit statistics in terms of coefficient of determination (R2), root mean square error (RMSE), and normalized RMSE (NRMSE) for power, linear, logarithmic and exponential equations of KE-I relations for 72 events are provided in Table 2. From the Table 2, amid four regression models (power, linear, logarithmic and exponential), statistically the power law showed higher predictive capability for the two erosivity indices (KEtime and KEmm, Fig. 1). Similar characteristics were reported by the previous researchers elsewhere40.
Validation of kinetic energy-rainfall intensity (KE-I) relations. It is important to endorse the esti-mated KE-I relations before using them in rainfall erosivity assessment, and so, we validated the derived empirical (KE-I) relations with three typhoon events (Event no. 35, 39, and 40 in Table 1). Among these three events, two events have higher rainfall intensities with long (Event no. 35. Fungwong) and short (Event no. 40. Namtheun) duration, and the third one (Event no. 39. Lupit) has long duration and relatively low rainfall intensities, but this is quite erosive if the whole event is considered. Figure 2a–c represents KEtime versus I for three events with linear and power relations. For Fungwong and Namtheun events (Fig. 2a,c), estimation of KEtime by power law showed a good performance and underestimated by linear law at higher rainfall intensity (>35 mm h−1). In the case of the Lupit event (Fig. 2b), even if both power and linear laws overestimated, the power law shows more predictive capability than liner law. The goodness-of-fit statistics (R2, RMSE, and NRMSE) for power and liner forms of
3Scientific RepoRtS | (2019) 9:15862 | https://doi.org/10.1038/s41598-019-52028-5
www.nature.com/scientificreportswww.nature.com/scientificreports/
S. No. Typhoon name Date and start timeDuration (minutes)
No. of particles
Rainfall depth (mm)
Rainfall intensity (mm h−1)
Maximum MeanStandard deviation
1 Sinlaku 5/9/2002 15:06 1907 285175 32.28 38.35 1.02 2.51
2 Mindule 2/7/2004 1:00 1649 586270 90.71 56.47 3.3 6.23
3 Rananim 10/8/2004 19:15 1614 323349 77.17 86.8 2.87 10.12
4 Aere 23/08/04 09:35 2631 656241 228.97 76.36 5.22 8.12
5 Songda 5/9/2004 6:10 230 52118 10.43 46.03 2.72 6.13
6 Songda 6/9/2004 0:09 159 54525 18.89 57.36 7.13 11.94
7 Haima 8/9/2004 1:10 661 153702 12.16 34.72 1.1 3.04
8 Haima 9/9/2004 14:10 487 98361 37.68 70.06 4.64 10.28
9 Haima 10/9/2004 12:10 3205 1564637 277.54 98.06 5.2 10.87
10 Meari 25/09/04 05:40 1542 183809 13.86 26.54 0.54 1.98
11 Tokge 18/10/04 10:12 1702 835644 21.47 9.97 0.76 1.13
12 Nock-ten 24/10/04 01:21 3611 927626 84.8 96.23 1.41 5.07
13 Nanmdol 3/12/2004 1:53 2257 543890 67.57 33.83 1.8 2.7
14 Haitang 17/07/05 06:59 3687 925339 222.61 88.86 3.62 8.25
15 Matsa 4/8/2005 3:51 2437 750259 217.67 101.06 5.36 9.75
16 Talim 31/08/05 01:40 1804 280064 84.87 67.72 2.82 6.84
17 Khanun 10/9/2005 11:10 854 213791 12.89 30.06 0.91 2.54
18 Darmey 22/09/05 01:04 1502 221685 45.98 55.97 1.84 4.61
19 Longwong 1/10/2005 8:52 1477 261609 60.66 101.94 2.46 8.17
20 Chanchu 16/05/06 02:27 2570 236904 32.29 12.31 0.75 1.88
21 Chanchu 19/05/06 00:38 482 59018 11.94 35.87 1.49 4.09
22 Ewiniar 8/7/2006 20:06 759 175041 65.09 118.67 5.15 14.64
23 Bilis 12/7/2006 9:15 5053 732898 70.73 54.55 0.84 2.71
24 Kaemi 25/07/06 14:24 1660 77646 18.02 52.37 0.65 3.42
25 Saoma 8/8/2006 12:34 1115 93451 15.34 49.68 0.83 3.83
26 Bopha 9/8/2006 23:57 726 132751 24.11 61.19 1.99 6.55
27 Shanshan 12/9/2006 01:16 1364 191698 54.3 92.04 2.39 7.01
28 Shanshan 13/09/06 06:37 500 131165 32.39 68.11 3.89 9
29 Shanshan 15/09/06 07:17 3644 435828 39.95 65.78 0.66 2.73
30 Pubak 7/8/2007 09:00 2220 77064 10.83 11.59 0.29 0.82
31 Wutip 14/08/07 08:30 382 81251 43.29 63.56 6.8 16.37
32 Sepat 17/08/07 13:07 3209 129099 19.04 24.65 0.36 1.23
33 Wipha 17/09/07 06:01 3733 968851 96.16 49.19 1.55 3.3
34 Mitag 26/11/07 03:40 2660 574797 74.29 22.47 1.68 2.41
35 * Fungwong 26/07/08 22:26 4015 335743 124.67 143.17 1.86 10.14
36 Sinlaku 11/9/2008 06:02 6676 1615753 355.75 83.96 3.2 7.55
37 Jangmi 27/09/08 02:10 4552 586699 140.82 86.5 1.86 4.61
38 Parma 4/10/2009 10:30 3690 495127 65.35 16.89 1.06 1.83
39 * Lupit 22/10/09 10:29 4361 678629 27.7 12.95 0.38 0.99
40 * Namtheun 30/08/10 02:28 247 52710 26.59 122.77 6.46 21.26
41 Namtheun 30/08/10 13:30 315 215043 74.65 92.85 14.22 18.51
42 Meranti 10/9/2010 16:13 359 57103 26.14 70.17 4.37 11.77
43 Megi 18/10/10 02:40 6900 973252 102.58 37.1 0.89 2.12
44 Songda 27/05/11 09:38 1914 604537 19.04 21.5 0.6 1.33
45 Sarika 10/6/2011 16:32 304 31175 15.03 75.47 2.97 10.04
46 Meari 24/06/11 17:37 1784 205498 26.36 14.65 0.89 2.02
47 Muifa 6/8/2011 17:39 639 68809 22.09 54.83 2.07 7.52
48 Talim 18/06/12 13:21 4711 789295 85.89 65.97 1.09 3.4
49 Saola 30/07/12 00:25 5500 1199496 296.2 81.02 3.23 7.33
50 Haikui 6/8/2012 7:03 458 62019 11.55 45.55 1.51 4.61
51 Tembin 22/08/12 08:45 2181 304661 105.94 97.66 2.91 11.06
52 Bolavin 26/08/12 00:50 1390 93594 22.39 62.61 0.97 4.68
53 Sanba 14/09/12 00:25 2855 315352 130.45 93.31 2.74 9.22
54 Bopha 8/12/2012 0:00 1960 622973 40.19 13.04 1.23 1.52
55 Soulik 12/7/2013 0:48 2037 326205 85.41 42.12 2.52 4.87
Continued

4Scientific RepoRtS | (2019) 9:15862 | https://doi.org/10.1038/s41598-019-52028-5
www.nature.com/scientificreportswww.nature.com/scientificreports/
KEtime-I relations are quantified in Table 2. Even though two equations showed relatively higher coefficient of determination (R2), the power law showed lower RMSE and NRMSE, indicating that the power law has better performance than linear in estimating the KEtime from rainfall intensity.
Validation of power, linear, logarithmic, and exponential forms of KEmm-I relations with three events (Event no. 35, 39, and 40) are shown in Fig. 2d–f. In all the three events (Fig. 2d–f), power, logarithmic and exponen-tial relations showed similar prediction capability for lower rainfall intensities (<5 mm h−1). Exponential and logarithmic fits severely underestimated the KEmm for event no. 35 (for I > 30 mm h−1) and event no. 40 (for I > 40 mm h−1). The KEmm is well predicted by the power equation for long duration- high intensity rainfall event (Event no. 35. Fungwong, Fig. 2d), nonetheless, KEmm is overestimated for remaining two events (Event no. 39 and 40). The goodness-of-fit statistics (R2, RMSE, and NRMSE) for power, linear, logarithmic and exponential equations of KEmm-I relations are provided in Table 2 for the three typhoon events. Further, estimated KE-I mod-els (KEtime-I: linear, power, KEmm-I: linear, power, logarithmic, and exponential) are cross-validated by using leave p out cross validation method (where p = 3 events), and the iterations were performed for 1000 times. We found that the power model is more reliable than the other models for both KEtime-I and KEmm-I relations.
S. No. Typhoon name Date and start timeDuration (minutes)
No. of particles
Rainfall depth (mm)
Rainfall intensity (mm h−1)
Maximum MeanStandard deviation
56 Soulik 14/07/13 07:25 1821 79771 12.82 22.26 0.42 1.6
57 Kongrey 28/08/13 00:24 2856 545091 111.84 104.98 2.35 8.02
58 Toraji 30/08/13 00:00 3469 719941 46.65 54.87 0.81 2.47
59 Usagi 19/09/13 19:16 4002 270513 44.07 58.44 0.66 3.69
60 Fitow 4/10/2013 0:29 3691 300156 31.2 68.99 0.51 2.93
61 Matmo 22/07/14 08:00 2400 244233 55.24 48.12 1.38 3.03
62 Fungwang 21/09/14 08:00 1080 194242 89.98 123.4 5 13.79
63 Vongfong 8/10/2014 17:39 4660 422190 39.18 54.11 0.5 2.48
64 Noul 11/5/2015 0:18 1422 85864 16.45 56.4 0.69 4.24
65 Chanchom 9/7/2015 2:05 2225 337854 42.67 63.18 1.15 4.41
66 Soudelor 6/8/2015 11:29 322 37851 19.87 91.08 3.7 13.05
67 Soudelor 7/8/2015 0:00 1301 213187 73.9 69.41 3.41 7.02
68 Goni 22/08/15 13:12 2088 104937 17.69 86.26 0.51 4.14
69 Goni 24/08/15 20:58 344 165002 22.11 47.36 3.86 6.14
70 Dujuan 26/09/15 03:52 4088 976602 91.77 52.2 1.35 3.6
71 Meranti 12/9/2016 1:52 3263 326550 13.32 35.43 0.24 1.17
72 Malakas 16/09/16 07:18 2442 592981 45.43 52.86 1.12 3.54
73 Megi 26/09/16 02:46 2595 589245 136.59 66.95 3.16 6.62
74 Nesat/Haitang 29/07/17 01:47 1333 113150 13.59 22.35 0.61 1.44
75 Talim 12/09/17 16:47 2113 196436 21.93 69.06 0.62 3.59
Table 1. Rainfall statistics (Date, duration, no. of particles, rainfall depth, and intensity) of 75 typhoon rainfall erosive events observed by disdrometer. The “No. of particles” column represents the number of raindrops measured by the disdrometer for each typhoon event.
Figure 1. Scatter plot of typhoon rainfall (a) kinetic energy expenditure (KEtime) and Intensity (I) fitted with linear and power laws (b) kinetic energy content (KEmm) and Intensity (I) fitted with linear, power, logarithmic and exponential equations for 73 typhoon rainfall events (70600 1-min data points).
5Scientific RepoRtS | (2019) 9:15862 | https://doi.org/10.1038/s41598-019-52028-5
www.nature.com/scientificreportswww.nature.com/scientificreports/
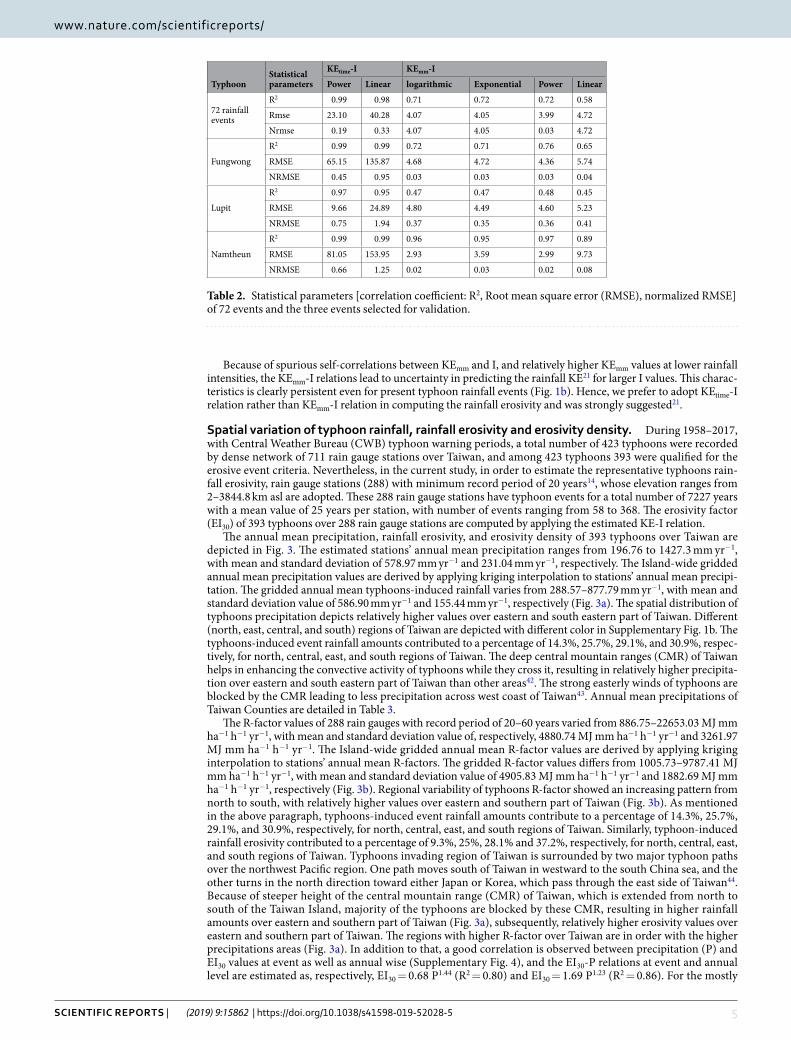
Because of spurious self-correlations between KEmm and I, and relatively higher KEmm values at lower rainfall intensities, the KEmm-I relations lead to uncertainty in predicting the rainfall KE21 for larger I values. This charac-teristics is clearly persistent even for present typhoon rainfall events (Fig. 1b). Hence, we prefer to adopt KEtime-I relation rather than KEmm-I relation in computing the rainfall erosivity and was strongly suggested21.
Spatial variation of typhoon rainfall, rainfall erosivity and erosivity density. During 1958–2017, with Central Weather Bureau (CWB) typhoon warning periods, a total number of 423 typhoons were recorded by dense network of 711 rain gauge stations over Taiwan, and among 423 typhoons 393 were qualified for the erosive event criteria. Nevertheless, in the current study, in order to estimate the representative typhoons rain-fall erosivity, rain gauge stations (288) with minimum record period of 20 years14, whose elevation ranges from 2–3844.8 km asl are adopted. These 288 rain gauge stations have typhoon events for a total number of 7227 years with a mean value of 25 years per station, with number of events ranging from 58 to 368. The erosivity factor (EI30) of 393 typhoons over 288 rain gauge stations are computed by applying the estimated KE-I relation.
The annual mean precipitation, rainfall erosivity, and erosivity density of 393 typhoons over Taiwan are depicted in Fig. 3. The estimated stations’ annual mean precipitation ranges from 196.76 to 1427.3 mm yr−1, with mean and standard deviation of 578.97 mm yr−1 and 231.04 mm yr−1, respectively. The Island-wide gridded annual mean precipitation values are derived by applying kriging interpolation to stations’ annual mean precipi-tation. The gridded annual mean typhoons-induced rainfall varies from 288.57–877.79 mm yr−1, with mean and standard deviation value of 586.90 mm yr−1 and 155.44 mm yr−1, respectively (Fig. 3a). The spatial distribution of typhoons precipitation depicts relatively higher values over eastern and south eastern part of Taiwan. Different (north, east, central, and south) regions of Taiwan are depicted with different color in Supplementary Fig. 1b. The typhoons-induced event rainfall amounts contributed to a percentage of 14.3%, 25.7%, 29.1%, and 30.9%, respec-tively, for north, central, east, and south regions of Taiwan. The deep central mountain ranges (CMR) of Taiwan helps in enhancing the convective activity of typhoons while they cross it, resulting in relatively higher precipita-tion over eastern and south eastern part of Taiwan than other areas42. The strong easterly winds of typhoons are blocked by the CMR leading to less precipitation across west coast of Taiwan43. Annual mean precipitations of Taiwan Counties are detailed in Table 3.
The R-factor values of 288 rain gauges with record period of 20–60 years varied from 886.75–22653.03 MJ mm ha−1 h−1 yr−1, with mean and standard deviation value of, respectively, 4880.74 MJ mm ha−1 h−1 yr−1 and 3261.97 MJ mm ha−1 h−1 yr−1. The Island-wide gridded annual mean R-factor values are derived by applying kriging interpolation to stations’ annual mean R-factors. The gridded R-factor values differs from 1005.73–9787.41 MJ mm ha−1 h−1 yr−1, with mean and standard deviation value of 4905.83 MJ mm ha−1 h−1 yr−1 and 1882.69 MJ mm ha−1 h−1 yr−1, respectively (Fig. 3b). Regional variability of typhoons R-factor showed an increasing pattern from north to south, with relatively higher values over eastern and southern part of Taiwan (Fig. 3b). As mentioned in the above paragraph, typhoons-induced event rainfall amounts contribute to a percentage of 14.3%, 25.7%, 29.1%, and 30.9%, respectively, for north, central, east, and south regions of Taiwan. Similarly, typhoon-induced rainfall erosivity contributed to a percentage of 9.3%, 25%, 28.1% and 37.2%, respectively, for north, central, east, and south regions of Taiwan. Typhoons invading region of Taiwan is surrounded by two major typhoon paths over the northwest Pacific region. One path moves south of Taiwan in westward to the south China sea, and the other turns in the north direction toward either Japan or Korea, which pass through the east side of Taiwan44. Because of steeper height of the central mountain range (CMR) of Taiwan, which is extended from north to south of the Taiwan Island, majority of the typhoons are blocked by these CMR, resulting in higher rainfall amounts over eastern and southern part of Taiwan (Fig. 3a), subsequently, relatively higher erosivity values over eastern and southern part of Taiwan. The regions with higher R-factor over Taiwan are in order with the higher precipitations areas (Fig. 3a). In addition to that, a good correlation is observed between precipitation (P) and EI30 values at event as well as annual wise (Supplementary Fig. 4), and the EI30-P relations at event and annual level are estimated as, respectively, EI30 = 0.68 P1.44 (R2 = 0.80) and EI30 = 1.69 P1.23 (R2 = 0.86). For the mostly
TyphoonStatistical parameters
KEtime-I KEmm-I
Power Linear logarithmic Exponential Power Linear
72 rainfall events
R2 0.99 0.98 0.71 0.72 0.72 0.58
Rmse 23.10 40.28 4.07 4.05 3.99 4.72
Nrmse 0.19 0.33 4.07 4.05 0.03 4.72
Fungwong
R2 0.99 0.99 0.72 0.71 0.76 0.65
RMSE 65.15 135.87 4.68 4.72 4.36 5.74
NRMSE 0.45 0.95 0.03 0.03 0.03 0.04
Lupit
R2 0.97 0.95 0.47 0.47 0.48 0.45
RMSE 9.66 24.89 4.80 4.49 4.60 5.23
NRMSE 0.75 1.94 0.37 0.35 0.36 0.41
Namtheun
R2 0.99 0.99 0.96 0.95 0.97 0.89
RMSE 81.05 153.95 2.93 3.59 2.99 9.73
NRMSE 0.66 1.25 0.02 0.03 0.02 0.08
Table 2. Statistical parameters [correlation coefficient: R2, Root mean square error (RMSE), normalized RMSE] of 72 events and the three events selected for validation.

6Scientific RepoRtS | (2019) 9:15862 | https://doi.org/10.1038/s41598-019-52028-5
www.nature.com/scientificreportswww.nature.com/scientificreports/
associated tropical cyclones rainfall over Pacific coast of Mexico, García-Oliva et al.45 perceived mean annual erosivity of 6525.2 MJ mm ha−1 h−1
. Recently, Laceby et al.32 demonstrated that tropical cyclones contributed 22% of precipitation and 40% of rainfall erosivity over Fukushima region of Japan, and they illustrated that the annual mean precipitation and R-factor ranged from, respectively, 68 to 639 mm yr−1 (mean: 422 mm yr−1) and 142 to 4547 MJ mm ha−1 h−1 yr−1 (mean: 1462 MJ mm ha−1 h−1 yr−1). Storm wise variation of mean precipitation and EI30 ranged from 41–240 mm and 118–1695 MJ mm ha−1 h−1, respectively, (Table S1. of Laceby et al.32). However, for Taiwan region, event mean precipitation and EI30 of typhoons varied, respectively, from 12.5–3059.5 mm and 0.47–92144.9 MJ mm ha−1 h−1, which are greater than the values over Japan. This demonstrates that the typhoons rainfall over Taiwan has much influence with intense rainfall and higher EI30/R factor values. Further, annual
Figure 2. Validation of estimated KEtime-I relations (a–c), KEmm-I (d–f) in the form of linear (blue color), power (red color), exponential (green color), and logarithmic (pink color) laws with Fungwong (Event no. 35), Lupit (Event no. 39), and Namtheun (Event no. 40) typhoon events, respectively.
Figure 3. Spatial distribution of typhoons-induced (a) mean annual precipitation (b) R-factor, and (c) R-factor density map plotted with kriging over Taiwan during 1958–2017.

7Scientific RepoRtS | (2019) 9:15862 | https://doi.org/10.1038/s41598-019-52028-5
www.nature.com/scientificreportswww.nature.com/scientificreports/
mean precipitation, rainfall erosivity for each county are computed and given in Table 3. Counties’ mean accu-mulated precipitation varied from 5517.5–19368.39 mm yr−1 with minimum precipitation over Changhua and maximum over Taitung. Annual mean R-factor ranges from 1433.59–7441.02 MJ mm ha−1 h−1 yr−1 with mini-mum value over Changhua and maximum value over Pingtung. Lee and Lin46 estimated rainfall erosivity of 16560 storm events for Kaohsiung City and Pingtung County in south Taiwan. They found mean annual total rainfall between 1376–4070 mm yr−1 and annual rainfall erosivity between 15000–70000 MJ mm ha−1 h−1 yr−1. The dis-crepancy in annual mean rainfall and rainfall erosivity values between present study and Lee and Lin46 is might be due to their adaptation of elsewhere KE-I relations or due to different sampling (10-min) of the rainfall data.
In order to identify the regions with high risk due to erosive events, typhoons rainfall erosivity density (ratio of annual R-factor to the annual mean precipitation) is computed for each station. For all the 288 rain gauges sta-tions, erosivity density varies from 3.11–19.17 MJ ha−1 h−1 with mean and standard deviation of 7.92 MJ ha−1 h−1, and 2.79 MJ ha−1 h−1, respectively. The Island-wide gridded R-factor density values are derived by applying krig-ing interpolation to stations’ R-factor density values. The R-factor density map of Taiwan (Fig. 3c) ranges from 4.57–9.68 MJ ha−1 h−1 with mean and standard deviation of 7.77 MJ ha−1 h−1 and 0.99 MJ ha−1 h−1, respectively. Areas with higher erosivity density are an indication of locations with higher rainfall intensity events with shorter duration29. Higher erosivity density values are noticed over southern part of Taiwan, which imply that southern part is most prone to the soil loss and high flood risk than other regions of Taiwan. The R-factor density values of each county of Taiwan are illustrated in Table 3. County wise R-factor density show minimum for Hsinchu (5.25 MJ ha−1 h−1) and maximum for Kaohsiung (10.52 MJ ha−1 h−1).
Trends in typhoons precipitation and erosivity. Quite diverse results were reported for rainfall ero-sivity trends over different parts of the world on seasonal and annual scale32,33,47–52. For instance, Webster et al.53, Emanuel1, and Mei and Xie54 noticed an increasing trend in the intensity of tropical cyclones, and in contrast, other researchers55,56 claim small or no trends. For Taiwan region, Tu et al.57 demonstrated that an abrupt shift in typhoon count series from 3.3 (1970–1999) typhoons per year to 5.7 (2000–2006). Tu and Chou58 analyzed the frequency, intensity, and duration of typhoon-induced rainfall over Taiwan by considering 21 rain gauge stations distributed over this Island for July to October months during 1970–2010. They perceived a significant increase in typhoon-induced rainfall over Taiwan which is due to the increase in number of typhoon days that affecting the Island rather than number of typhoons that pass through the typhoons invading region (18N–29.5N, 116E–126E). Recently, trend analysis for typhoon-induced rainfall at six rain gauges stations (along west coast: Taipei, Taichung, and Tainan; along east coast: Hualien, Taitung, and Hengchun) located over Taiwan was carried out by Liang et al.59. They showed that variations in the typhoon-induced rainfall trends at the selected six stations are related to the poleward shift of tropical cyclones over northwest Pacific, which is due to the weakening of the steering flow and western north Pacific subtropical high. Albeit, long-term trends in global tropical cyclones properties (number, intensity, duration, and destructive potential) have been documented1,53,54,60,61, trends in erosivity triggered by tropical cyclones rests unidentified.
Because of complex orography of Taiwan43, we performed trend analysis for Taiwan by considering differ-ent regions/counties rather than complete Island. Regions of this Island are classified into north (which include Taipei, Hsinchu, Taoyuan counties), central (Miaoli, Taichung, Changhua, Nantou, Yunlin, Chiayi), south (Tainan, Kaohsiung, Pingtung), and east (Yilan, Hualien, Taitung), and these regions are depicted with different color in Supplementary Fig. 1b. Trends in typhoons-induced annual mean precipitation and the corresponding
County
No. of rain gauges
Number of years
Accumulated precipitation (mm)
Annual mean precipitation(mm yr−1)
EI30(MJ ha−1 mm h−1)
R-factor(MJ ha−1 mm h−1 yr−1)
R-factor density(MJ ha−1 h−1)
Min. Max Mean SD Mean SD Mean SD Mean SD Mean SD
Taipei 28 20 60 17269.3 15165.9 553.2 223.0 99874.0 108511.8 3095.5 1725.2 5.3 1.01
Tauyoun 8 20 26 10317.7 5363.0 453.5 248.9 56569.6 56277.3 2539.3 2752.2 4.7 1.95
Hsinchu 11 21 26 11432.2 5382.3 456.7 196.1 68901.7 62573.2 2720.5 2366.3 5.2 1.83
Yilan 23 20 59 18828.8 6299.0 781.8 228.9 147759.0 67813.5 6222.1 3023.5 7.8 2.66
Hualien 25 20 60 17682.9 6122.5 760.7 167.5 143527.1 74744.8 6184.0 2968.1 7.8 1.99
Taitung 17 20 60 19368.4 11110.3 703.2 170.8 145901.5 85452.8 5412.3 2336.4 7.4 1.91
Tainan 24 20 39 10604.4 3305.6 458.0 118.6 88351.5 48149.4 3804.4 1873.1 8.0 1.55
Kaohsiung 32 20 58 16089.5 6228.7 675.1 227.2 169071.1 92288.1 7127.7 3515.3 10.5 2.68
Pingtung 28 20 59 16500.1 6801.8 697.1 189.6 175038.0 97840.0 7441.0 3642.6 10.3 2.48
Miaoli 13 20 27 11554.1 4309.7 474.3 153.2 99973.8 56532.2 4088.8 2162.1 8.2 2.37
Taichung 13 20 57 11290.5 4613.7 426.4 195.1 101241.0 73276.8 4052.5 3824.4 8.6 3.14
Changhua 6 20 24 5517.5 582.9 254.2 14.5 31201.6 5918.3 1433.6 205.3 5.6 0.55
Nantou 35 20 60 12990.1 6947.6 499.5 137.8 98448.1 52217.4 3901.6 1981.5 7.7 2.76
Yunlin 12 20 24 7070.5 3143.2 323.4 130.3 49891.5 37044.1 2261.2 1565.6 6.6 1.55
Chiyayi 16 21 60 15732.1 13295.2 543.6 262.5 162113.1 174868.6 5481.0 4492.6 8.8 2.99
Table 3. County wise mean and standard deviation values of accumulated precipitation, annual mean precipitation, EI30, R-factor and R-factor density. Where Min. Max, SD represents the minimum, maximum, and standard deviation, respectively.

8Scientific RepoRtS | (2019) 9:15862 | https://doi.org/10.1038/s41598-019-52028-5
www.nature.com/scientificreportswww.nature.com/scientificreports/
erosivity for 15 counties of Taiwan are illustrated in Figs 4 and 5, respectively. The linear trends for all 15 counties are performed by least square regression analysis. A trend is considered as significant if ‘p’ value is less than 0.1 (90% confidence level).
Over north Taiwan, for the annual mean precipitations of typhoons-induced rainfall, except for Taipei county, which shows statistically significant decreasing trend (Fig. 4a), the other two counties (Taoyuan and Hsinchu; Fig. 4b,c) show slightly raising trends. For eastern Taiwan, Yilan and Hualien counties show raising trend (Fig. 4d,e) and the other county (Taitung) shows decreasing trend (Fig. 4f). On the other hand, all the three counties of south Taiwan show raising trends (Fig. 4g–i), with statistically significant raising trend only at Kaohsiung. Over Central Taiwan, except for Chiayi and Miaoli, which show decreasing trend (Fig. 4j,o), the other four counties (Miaoli, Taichung, Nantou, Changhua, and Yunlin (Fig. 4k–n) show raising trends, with statistically significant only at Yunlin.
Figure 5 depicts the time series of typhoons-induced rainfall erosivity for 15 counties of Taiwan. For north Taiwan, Taipei and Taoyuan show decreasing trends (Fig. 5a,b) and Hsinchu shows raising trend (Fig. 5c). However, the trends at these three counties are statistically insignificant. Increasing trends can be noticed for the three counties of eastern Taiwan (Fig. 5d–f), nevertheless, the trend is statistically significant only at Yilan county. Raising trends are also found for the three counties of south Taiwan (Fig. 5g–i) with statistically insignificant at Pingtung and significant at Kaohsiung and Tainan. Among six counties of central Taiwan, statistically signifi-cant raising trend at Yunlin (Fig. 5n), statistically insignificant decreasing trends at Miaoli (Fig. 5j) and Chiayi (Fig. 5o), and increasing trends at Taichung (Fig. 5k), Nantou (Fig. 5l) and Changhua (Fig. 5m) can be seen.
Figure 4. Time series of mean annual precipitation induced by typhoon rainfall events for 15 counties of Taiwan during 1958–2017. The rain gauge stations at Taoyuan, Hsinchu, and Maiaoli counties are available from the year 1991, and for Changhua and Yunlin from 1992. The slope of the trend line is depicted with ‘s’ in the legend. The gaps in mean annual precipitations lines denotes unavailability of data for the corresponding year.

9Scientific RepoRtS | (2019) 9:15862 | https://doi.org/10.1038/s41598-019-52028-5
www.nature.com/scientificreportswww.nature.com/scientificreports/
DiscussionIn computation of rainfall erosivity, most of the previous studies used either long-term rainfall data of few rain gauge stations47,52,62 or short-term data with dense rain gauges26,27,29 by using elsewhere KE-I relations rather than adopting region specific relations. Conversely, some researchers used modified Fournier index30 in estimation of erosivity, if there were no records of high temporal resolution precipitation data, and only few studies adopted the region specific KE-I relation in the reckoning of erosivity33. Nonetheless, globally, least attention was paid for the tropical cyclones-induced rainfall erosivity. Taiwan being most tropical cyclones affecting country, it is para-mount to investigate the R-factor for typhoons rainfall.
In this study we used long-term raindrop size distribution information of typhoons to estimate the KE-I relations, and we establish that power law is more appropriate in estimating the Taiwan typhoons R-factor. The estimated KE-I relation is adopted in computing the typhoons R-factor with 60 years (1958–2017) of hourly rain-fall data over Taiwan. The annual mean typhoons precipitation for Taiwan is noticed as 586.90 (SD 155.44) mm yr−1 with annual mean typhoons rainfall erosivity of 4905.83 (SD 1882.69) MJ mm ha−1 h−1 yr−1, which is much higher than the global mean31. Higher R-factor values are found over eastern and southern part of Taiwan, and higher R-factor density values are perceived for southern Taiwan. The typhoons invading region of Taiwan is sur-rounded by two major typhoons tracks in east and south direction (see Fig. 1 of Tu et al.44), and the interaction of typhoons that pass through these two major tracks interact with the CMR of the island resulting in an enormous rainfall amounts over eastern and southern region of Taiwan.
The county wise trend analysis performed for Taiwan showed increasing trends in rainfall and erosivity of typhoon events for eastern and southern Taiwan. Over northwest Pacific, during 1977–2013, Mei and Xie54 per-formed the trend analysis for frequency of four types of typhoon clusters (cluster 1–4). Among the four clusters, they demonstrated an increase in high intense (category 4 and 5) typhoons of cluster-1 and cluster-2, which are covered respectively, by eastern and southern Taiwan (Supplementary Fig. 8 of Mei and Xie54). An increasing
Figure 5. Same as Fig. 4 except for rainfall erosivity (EI30).

1 0Scientific RepoRtS | (2019) 9:15862 | https://doi.org/10.1038/s41598-019-52028-5
www.nature.com/scientificreportswww.nature.com/scientificreports/
trends in rainfall and erosivity over the eastern and southern region of this island is due to an increase in high intense, long-lasting typhoons and their shift to northward44,54,58.
In analyzing the trends for Taiwan, we consider all the typhoons that occurred throughout the year (Jan-Dec) during 1958–2017, and these typhoons should met an erosive event criteria as mentioned in methods sections. Also, we selected the rain gauge stations that are available for greater than or equal to 20 years of observation (≥20 years) during typhoon-induced rainfall periods of 1958–2017. It should be noted that the typhoons whose rainfall amounts are not meeting the erosive event criteria are missing in the trend analysis. Moreover, because of complex topography of Taiwan, a given typhoon need not to produce the rainfall for the complete Island. Further, for a given typhoon-induced rainfall, all the rain gauges distributed over Taiwan may not get a rainfall event that satisfy the erosive event criteria, hence, some rain gauge stations record a rainfall event and some may not. Although there were reports on trends for typhoon-induced rainfall at different regions of Taiwan59, because of the above mentioned reasons, rainfall erosive events are not the representative of total rainfall of typhoons and their characteristics need not to be similar to that of the total rainfall amounts. Our findings can contribute to better assessment of soil erosion modeling, agricultural, effective-land use and flood risk assessment for Taiwan.
MethodsStudy area. Taiwan is a subtropical island in the Western North Pacific (~36197 km2) with geological com-position of sedimentary and metamorphic rocks, and deep topographic CMR of average height 2 km. Taiwan is influenced by highest annual frequency of tropical cyclones which are contributing to 47.5% of the total annual rainfall63. The geographical location of Taiwan with its topography, 711 rain gauge stations, and the Joss-Waldvogel disdrometer (JWD)64 is shown in Supplementary Fig. 1.
Typhoons tracks data. The typhoon track data is based on the World Meteorological Organization’s Joint Typhoon Warning Center (JTWC) (http://www.usno.navy.mil/NOOC/nmfc-ph/RSS/jtwc/best_tracks/). The JTWC provides 6-hourly records of typhoon track information.
Disdrometer data selection criteria for typhoons rainfall. During 2002–2017, the raindrop size distribution measurements of disdrometer (1-min sample data) are treated as typhoon-induced rainfall when typhoon center (supplementary Fig. 2) is within a radius of 500 km from the disdrometer site65 and they are within the CWB typhoon warning periods.
Definition of erosive rainfall event. A rainfall episode with minimum duration of 30-min and rainfall depth of greater than or nearly equal to 12.5 mm and a 6-hours of continuous non-rainfall gap between two con-secutive rainfall episodes is considered as erosive rainfall event13. Here we use erosive rainfall event criteria with rainfall depth of greater than or nearly equal to 10 mm. With this rainfall classification criteria, a total number of 75 rainfall events from 66 typhoons are identified from the disdrometer measurements for the period 2002–2017.
Validation of Disdrometer data. The disdrometer rainfall amounts of selected typhoon rainfall events are validated by comparing with collocated rain gauge. The scatter plot of event rainfall depths between disdrometer and collocated rain gauge is depicted in Supplementary Fig. 3. A good correlation is found between the rain gauge and disdrometer measurements.
Computation of rainfall intensity (I) and kinetic energy (KEmm and KEtime). The rainfall intensity (I, mm h−1), kinetic energy expenditure (KEtime, J m−2 h−1), and kinetic energy content (KEmm, J m−2 mm−1) for 75 typhoon rainfall events are computed from the RSD information of JWD.
The rainfall kinetic energy (KE) is half the product of raindrop mass and the square of its velocity, and can be expressed in two forms as time specific kinetic energy (KEtime, in J m−2 h−1) and volume specific kinetic energy (KEmm, J m−2 mm−1). KEtime is kinetic energy per unit area per hour and KEmm is the kinetic energy per unit area per unit depth18–21.
The rainfall intensity and kinetic energy are computed by using below equations.Rainfall intensity (I, mm h−1),
∑=
π
.
=I
63 610
1A T
n D(1)3
i 1
20
i i3
Kinetic energy expenditure (KEtime, J m−2 h−1),
∑=
π
=KE
121
103600
T1A
n D V(D )(2)time 6
i 1
20
i i i2
Kinetic energy content (KEmm, J m−2 mm−1),
=KE KEI (3)mmtime
where A = 0.005 m2 is the sampling area of the sensor, T = 60 s is the sampling time, ni the number of drops of diameter Di, V(Di) is the fall velocity of drops with diameter (Di)66.
In this study, data points with rainfall intensities less than 0.1 mm h−1 are discarded67. The KEtime-I and KEmm-I empirical relations are derived for linear, exponential, logarithmic, and power laws by using non-linear regression analysis.
1 1Scientific RepoRtS | (2019) 9:15862 | https://doi.org/10.1038/s41598-019-52028-5
www.nature.com/scientificreportswww.nature.com/scientificreports/
Rain gauge data selection criteria for typhoons rainfall. For the period of 1958–2017, hourly rain gauges data during central weather Bureau (CWB) typhoon warning periods (http://rdc28.cwb.gov.tw/TDB/ntdb/pageControl/typhoon) of Taiwan are considered as typhoons attributed rainfall.
Rain gauge stations selection criteria. In this study, we selected the rain gauge stations with minimum record of 20 years for the estimation of R-factor, with this threshold, among the dense network of 711 rain gauge stations distributed over Taiwan, a total number of 288 stations are qualified for typhoons rainfall record periods of 20 years or higher during 1958–2017. At these 288 rain gauge station, during 1958–2017, a typhoon-induced rainfall amount is considered for further analysis (estimation of R-factor and R-factor density) if it satisfy the erosive rainfall event criteria as mentioned above.
Calculation of R-factor (EI30). The average annual typhoon rainfall erosivity (R) is computed as:
∑ ∑== =
R 1n
(EI )(4)j 1
n
k 1
m
30 k
j
where R-factor is the average annual rainfall erosivity (MJ mm ha−1 h−1 yr−1), n is the number of years of record, mj is the number of erosive events of a given year j, and EI30 is the typhoon rainfall erosivity index of a single event k.
The single event erosivity EI30 (MJ mm ha−1 h−1) is defined as:
= =EI EI eI (5)30 30
where I30 is the maximum 30-min rainfall intensity (I, mm h−1) and is calculated by adopting the method of Yin et al.68. Where e is the rainfall kinetic energy per unit depth of rain and is obtained by using power law of KEtime-I relation:
=KE aItimeb
where ‘a’ and ‘b’ are empirical coefficients
= = = −e KEI
aII
aI (6)time
bb 1
Annual R-factor values are used to drive rainfall erosivity maps by using ordinary kriging.The annual mean precipitation value at each rain gauge station is computed by using the expression as men-
tioned below.
=∑ ∑= = P
mAnnual mean precipitation at each rain gauge station (7)
jm
in
i j1 1 ,
where ‘n’ represents the number of events in a given year for a given station, and ‘m’ represents the number of years that have typhoon-induced rainfall events for a given station, and “Pi,j” is typhoon-induced rainfall accu-mulation of nth event in mth year.
The annual mean EI30 value at each rain gauge station is computed by using the expression as mentioned below.
=∑ ∑= = X
mAnnual mean EI at each rain gauge station (8)
jm
in
i j30
1 1 ,
where ‘n’ represents the number of events in a given year for a given station, and ‘m’ represents the number of years that have typhoon-induced rainfall events for a given station, and “Xi,j” is EI30 of a typhoon-induced rainfall of nth event in mth year.
Kriging interpolation is applied to annual mean precipitation and annual EI30 values available at Island wide distributed 288 rain gauge stations (whose record period ≥ 20 years during 1958–2017) to plot the spatial distri-bution (Island-wide gridded data) map for annual mean precipitation and annual EI30.
Received: 29 March 2019; Accepted: 8 October 2019;Published: xx xx xxxx
References 1. Emanuel, K. Increasing Destructiveness of Tropical Cyclones Over the Past 30 Years. Nature 436, 686–688, https://doi.org/10.1038/
nature03906 (2005). 2. Peduzzi, P. et al. Global Trends in Tropical Cyclone Risk. Nat. Clim. Change 2, 289 (2012). 3. Lin, I. I. & Chan, J. C. Recent Decrease in Typhoon Destructive Potential and Global Warming Implications. Nat. Commun. 6, 7182,
https://doi.org/10.1038/ncomms8182 (2015). 4. Wu, C.-C. & Kuo, Y.-H. Typhoons Affecting Taiwan: Current Understanding and Future Challenges. Bull. Amer. Meteor. Soc. 80,
67–80, 10.1175/1520-0477(1999)080<0067:TATCUA>2.0.CO;2 (1999). 5. Galewsky, J. et al. Tropical Cyclone Triggering of Sediment Discharge in Taiwan. J. Geophys. Res.: Earth Surface 111, n/a-n/a, https://
doi.org/10.1029/2005jf000428 (2006). 6. Montgomery, D. R., Huang, M. Y. F. & Huang, A. Y. L. Regional Soil Erosion in Response to Land use and Increased Typhoon
Frequency and Intensity, Taiwan. Quat. Res. 81, 15–20, https://doi.org/10.1016/j.yqres.2013.10.005 (2014).
1 2Scientific RepoRtS | (2019) 9:15862 | https://doi.org/10.1038/s41598-019-52028-5
www.nature.com/scientificreportswww.nature.com/scientificreports/
7. Dadson, S. J. et al. Links between erosion, runoff variability and seismicity in the Taiwan orogen. Nature 426, 648, https://doi.org/10.1038/nature02150, https://www.nature.com/articles/nature02150#supplementary-information (2003).
8. Chen, Y.-C., Chang, K.-T., Chiu, Y.-J., Lau, S.-M. & Lee, H.-Y. Quantifying Rainfall Controls on Catchment-Scale landslide Erosion in Taiwan. Earth Surf. Process Landf. 38, 372–382, https://doi.org/10.1002/esp.3284 (2013).
9. Chen, Y.-C., Chang, K.-T., Lee, H.-Y. & Chiang, S.-H. Average Landslide Erosion Rate at the Watershed Scale in Southern Taiwan Estimated from Magnitude and Frequency of Rainfall. Geomorphology 228, 756–764, https://doi.org/10.1016/j.geomorph.2014.07.022 (2015).
10. Chen, C.-W. et al. Assessing Landslide Characteristics in a Changing Climate in Northern Taiwan. Catena 175, 263–277, https://doi.org/10.1016/j.catena.2018.12.023 (2019).
11. Lin, G.-W. & Chen, H. The Relationship of Rainfall Energy with Landslides and Sediment Delivery. Eng. Geol. 125, 108–118, https://doi.org/10.1016/j.enggeo.2011.11.010 (2012).
12. Wischmeier, W. H. A Rainfall Erosion Index for a Universal Soil-Loss Equation 1. Soil Sci. Soc. Am. J. 23, 246–249, https://doi.org/10.2136/sssaj1959.03615995002300030027x (1959).
13. Wischmeier, W. H. & Smith, D. D. Predicting Rainfall Erosion Losses - A Guide to Conservation Planning. (USDA, Science and Education Administration, 1978).
14. Renard, K. G., Foster, G. R., Weesies, G. A., McCool, D. K. & Yoder, D. C. Predicting Soil Erosion byWater: A Guide to Conservation Planning with the Revised Universal Soil Loss Equation (RUSLE) (Agricultural Handbook 703). (US Department of Agriculture, 1997).
15. Borrelli, P. et al. An Assessment of the Global Impact of 21st Century Land Use Change on Soil Erosion. Nat. Commun. 8, 2013, https://doi.org/10.1038/s41467-017-02142-7 (2017).
16. Madden, L. V., Wilson, L. L. & Ntahimpera, N. Calibration and Evaluation of an Electronic Sensor for Rainfall Kinetic Energy. Phytopathology 88, 950–959, https://doi.org/10.1094/PHYTO.1998.88.9.950 (1998).
17. Jayawardena, A. W. & Rezaur, R. B. Measuring Drop Size Distribution and Kinetic Energy of Rainfall Using a Force Transducer. Hydrol. Process. 14, 37–49, 10.1002/(SICI)1099-1085(200001)14:1<37::AID-HYP908>3.0.CO;2-M (2000).
18. Kinnell, P. I. A. Rainfall Intensity-Kinetic Energy Relationships for Soil Loss Prediction1. Soil Sci. Soc. Am. J. 45, 153–155, https://doi.org/10.2136/sssaj1981.03615995004500010033x (1981).
19. Fornis, R. L., Vermeulen, H. R. & Nieuwenhuis, J. D. Kinetic Energy–Rainfall Intensity Relationship For Central Cebu, Philippines for Soil Erosion Studies. J. Hydrol. 300, 20–32, https://doi.org/10.1016/j.jhydrol.2004.04.027 (2005).
20. van Dijk, A. I. J. M., Bruijnzeel, L. A. & Rosewell, C. J. Rainfall Intensity–Kinetic Energy Relationships: A Critical Literature Appraisal. J. Hydrol. 261, 1–23, https://doi.org/10.1016/S0022-1694(02)00020-3 (2002).
21. Salles, C., Poesen, J. & Sempere-Torres, D. Kinetic Energy of Rain and Its Functional Relationship With Intensity. J. Hydrol. 257, 256–270, https://doi.org/10.1016/S0022-1694(01)00555-8 (2002).
22. Sempere-Torres, D., Salles, C., Creutin, J. D. & Delrieu, G. In Erosion and Sediment Transport Monitoring Programmes in River Basins (Proceedings of the Oslo Symposium, August 1992) Vol. 210 115–124 (IAHS Publ., 1992).
23. Rosewell, C. J. Rainfall Kinetic Energy in Eastern Australia. J. Appl. Meteorol. Climatol . 25 , 1695–1701, 10.1175/1520-0450(1986)025<1695:RKEIEA>2.0.CO;2 (1986).
24. Uijlenhoet, R. & Stricker, J. N. M. A Consistent Rainfall Parameterization Based on the Exponential Raindrop Size Distribution. J. Hydrol. 218, 101–127, https://doi.org/10.1016/S0022-1694(99)00032-3 (1999).
25. Wischmeier, W. H. & Smith, D. D. Rainfall Energy and its Relationship to Soil Loss. T. Am. Geophys. Un. 39, 285–291, https://doi.org/10.1029/TR039i002p00285 (1958).
26. Sadeghi, S. H., Zabihi, M., Vafakhah, M. & Hazbavi, Z. Spatiotemporal Mapping of Rainfall Erosivity Index for Different Return Periods in Iran. Nat. Hazards 87, 35–56, https://doi.org/10.1007/s11069-017-2752-3 (2017).
27. Borrelli, P., Diodato, N. & Panagos, P. Rainfall Erosivity in Italy: a National Scale Spatio-temporal. Assessment. Int. J. Digit. Earth 9, 835–850, https://doi.org/10.1080/17538947.2016.1148203 (2016).
28. Mondal, A., Khare, D. & Kundu, S. Change in Rainfall Erosivity in the Past and Future due to Climate Change in the Central Part of India. Int. Soil Water Conserv. Res. 4, 186–194, https://doi.org/10.1016/j.iswcr.2016.08.004 (2016).
29. Panagos, P. et al. Rainfall Erosivity in Europe. Science of Total Environment 511, 801–814, https://doi.org/10.1016/j.scitotenv.2015.01.008 (2015).
30. Fenta, A. A. et al. Spatial Distribution and Temporal Trends of Rainfall and Erosivity in the Eastern Africa Region. Hydrol. Process. 31, 4555–4567, https://doi.org/10.1002/hyp.11378 (2017).
31. Panagos, P. et al. Global Rainfall Erosivity Assessment Based on High-temporal Resolution Rainfall Records. Sci. Rep. 7, 4175, https://doi.org/10.1038/s41598-017-04282-8 (2017).
32. Laceby, J. P. et al. Rainfall Erosivity in Catchments Contaminated with Fallout from the Fukushima Daiichi Nuclear Power Plant Accident. Hydrol. Earth Syst. Sci. 20, 2467–2482, https://doi.org/10.5194/hess-20-2467-2016 (2016).
33. Verstraeten, G., Poesen, J., Demarée, G. & Salles, C. Long-term (105 years) Variability in Rain Erosivity as Derived from 10-min Rainfall Depth Data for Ukkel (Brussels, Belgium): Implications for Assessing Soil Erosion Rates. J Geophys. Res. 111, https://doi.org/10.1029/2006jd007169 (2006).
34. Parsons, A. J. & Gadian, A. M. Uncertainty in Modelling the Detachment of Soil by Rainfall. Earth Surf. Process Landf. 25, 723–728, 10.1002/1096-9837(200007)25:7<723::AID-ESP127>3.0.CO;2-X (2000).
35. Catari, G., Latron, J. & Gallart, F. Assessing the Sources of Uncertainty Associated with the Calculation of Rainfall Kinetic Energy and Erosivity – Application to the Upper Llobregat Basin, NE Spain. Hydrol. Earth Syst. Sci. 15, 679–688, https://doi.org/10.5194/hess-15-679-2011 (2011).
36. Lu, J. Y., Su, C. C., Lu, T. F. & Maa, M. M. Number and Volume Raindrop Size Distributions in Taiwan. Hydrol. Process. 22, 2148–2158, https://doi.org/10.1002/hyp.6814 (2008).
37. Chang, J. M., Chen, H. E., Jou, B. J. D., Tsou, N. C. & Lin, G. W. Characteristics of Rainfall Intensity, Duration, and Kinetic Energy for Landslide Triggering in Taiwan. Eng. Geol. 231, 81–87, https://doi.org/10.1016/j.enggeo.2017.10.006 (2017).
38. Kumar, S. B. & Reddy, K. K. Rain Drop Size Distribution Characteristics of Cyclonic and North East Monsoon Thunderstorm Precipitating Clouds Observed over Kadapa (14.47°N, 78.82°E), Tropical Semi-arid Region of India. Mausam 64, 35–48 (2013).
39. Deo, A. & Walsh, K. J. E. Contrasting Tropical Cyclone and Non-tropical Cyclone Related Rainfall Drop Size Distribution at Darwin, Australia. Atmos. Res. 181, 81–94, https://doi.org/10.1016/j.atmosres.2016.06.015 (2016).
40. Nanko, K., Moskalski, S. M. & Torres, R. Rainfall Erosivity–Intensity Relationships for Normal Rainfall Events and a Tropical Cyclone on the US Southeast Coast. J. Hydrol. 534, 440–450, https://doi.org/10.1016/j.jhydrol.2016.01.022 (2016).
41. Steiner, M. & Smith, J. A. Reflectivity, Rain Rate, and Kinetic Energy Flux Relationships Based on Raindrop Spectra. J. Appl. Meteorol. 39, 1923–1940, 10.1175/1520-0450(2000)039<1923:RRRAKE>2.0.CO;2 (2000).
42. Chang, C. P., Yeh, T. C. & Chen, J. M. Effects of Terrain on the Surface Structure of Typhoons over Taiwan. Mon. Weather Rev. 121, 734–752, 10.1175/1520-0493(1993)121<0734:EOTOTS>2.0.CO;2 (1993).
43. Cheung, K. K. W., Huang, L. R. & Lee, C. S. Characteristics of Rainfall During Tropical Cyclone Periods in Taiwan. Nat. Hazards Earth Syst. Sci. 8, 1463–1474, https://doi.org/10.5194/nhess-8-1463-2008 (2008).
44. Tu, J.-Y., Chou, C. & Chu, P.-S. The Abrupt Shift of Typhoon Activity in the Vicinity of Taiwan and Its Association with Western North Pacific–East Asian Climate Change. J. Climate 22, 3617–3628, https://doi.org/10.1175/2009JCLI2411.1 (2009).

13Scientific RepoRtS | (2019) 9:15862 | https://doi.org/10.1038/s41598-019-52028-5
www.nature.com/scientificreportswww.nature.com/scientificreports/
45. García-Oliva, F., Maass, J. M. & Galicia, L. Rainstorm Analysis and Rainfall Erosivity of a Seasonal Tropical Region with a Strong C y c l o n i c I n f l u e n c e o n t h e P a c i f i c C o a s t o f M e x i c o . J . A p p l . M e t e o r o l . 3 4 , 2 4 9 1 – 2 4 9 8 , 10.1175/1520-0450(1995)034<2491:RAAREO>2.0.CO;2 (1995).
46. Lee, M.-H. & Lin, H.-H. Evaluation of Annual Rainfall Erosivity Index Based on Daily, Monthly, and Annual Precipitation Data of Rainfall Station Network in Southern Taiwan. Int. J. Distr. Sensor Net. 11, https://doi.org/10.1155/2015/214708 (2015).
47. Sadeghi, S. H. R. & Hazbavi, Z. Trend analysis of the rainfall erosivity index at different time scales in Iran. Nat. Hazards 77, 383–404, https://doi.org/10.1007/s11069-015-1607-z (2015).
48. Huang, J., Zhang, J., Zhang, Z. & Xu, C.-Y. Spatial and Temporal Variations in Rainfall Erosivity During 1960–2005 in the Yangtze River Basin. Stoch Environ Res Risk Assess. 27, 337–351, https://doi.org/10.1007/s00477-012-0607-8 (2013).
49. Fiener, P., Neuhaus, P. & Botschek, J. Long-term Trends in Rainfall Erosivity–Analysis of High Resolution Precipitation Time Series (1937–2007) from Western Germany. Agric. For. Meteorol. 171–172, 115–123, https://doi.org/10.1016/j.agrformet.2012.11.011 (2013).
50. Xin, Z., Yu, X., Li, Q. & Lu, X. X. Spatiotemporal Variation in Rainfall Erosivity on the Chinese Loess Plateau During the Period 1956–2008. Reg. Environ. Change 11, 149–159, https://doi.org/10.1007/s10113-010-0127-3 (2011).
51. Li, X. & Ye, X. Variability of Rainfall Erosivity and Erosivity Density in the Ganjiang River Catchment, China: Characteristics and Influences of Climate Change. Atmosphere 9, https://doi.org/10.3390/atmos9020048 (2018).
52. Angulo-Martínez, M. & Beguería, S. Trends in Rainfall Erosivity in NE Spain at Annual, Seasonal and Daily Scales. Hydrol. Earth Syst. Sci. 16, 3551–3559, https://doi.org/10.5194/hess-16-3551-2012 (2012).
53. Webster, P. J., Holland, G. J., Curry, J. A. & Chang, H.-R. Changes in Tropical Cyclone Number, Duration, and Intensity in a Warming Environment. Science 309, 1844–1846 (2005).
54. Mei, W. & Xie, S.-P. Intensification of landfalling typhoons over the northwest Pacific since the late 1970s. Nat. Geosci. 9, 753, https://doi.org/10.1038/ngeo2792, https://www.nature.com/articles/ngeo2792#supplementary-information (2016).
55. Landsea, C. W. Hurricanes and global warming. Nature 438, E11–E12, https://doi.org/10.1038/nature04477 (2005). 56. Chan, J. C. Comment on “Changes in tropical cyclone number, duration, and intensity in a warming environment”. Science 311,
1713–1713 (2006). 57. Tu, J.-Y., Chou, C., Huang, P. & Huang, R. An abrupt increase of intense typhoons over the western North Pacific in early summer.
Environ. Res. Lett. 6, 034013, https://doi.org/10.1088/1748-9326/6/3/034013 (2011). 58. Tu, J.-Y. & Chou, C. Changes in precipitation frequency and intensity in the vicinity of Taiwan: typhoon versus non-typhoon events.
Environ. Res. Lett. 8, 014023, https://doi.org/10.1088/1748-9326/8/1/014023 (2013). 59. Liang, A., Oey, L., Huang, S. & Chou, S. Long-term Trends of Typhoon-induced Rainfall Over Taiwan: In-situ Evidence of Poleward
Shift of Typhoons in Western North Pacific in Recent Decades. J. Geophys. Res. Atmos. 122, 2750–2765, https://doi.org/10.1002/2017JD026446 (2017).
60. Chan, J. C. L. & Shi, J.-E. Long-term Trends and Interannual Variability in Tropical Cyclone Activity over the Western North Pacific. Geophy. Res. Lett. 23, 2765–2767, https://doi.org/10.1029/96GL02637 (1996).
61. Knutson, T. R. et al. Tropical cyclones and climate change. Nat. Geosci. 3, 157, https://doi.org/10.1038/ngeo779, https://www.nature.com/articles/ngeo779#supplementary-information (2010).
62. Zhao, Q. et al. Spatiotemporal Variations in Rainfall Erosivity During the Period of 1960–2011 in Guangdong Province, Southern China. Theoritical and Applied Climatology 128, 113–128, https://doi.org/10.1007/s00704-015-1694-5 (2017).
63. Chen, J.-M., Li, T. & Shih, C.-F. Tropical Cyclone– and Monsoon-Induced Rainfall Variability in Taiwan. J. Climate 23, 4107–4120, https://doi.org/10.1175/2010jcli3355.1 (2010).
64. Joss, J. & Waldvogel, A. Raindrop Size Distribution and Sampling Size Errors. J. Atmos. Sci . 26 , 566–569, 10.1175/1520-0469(1969)026<0566:RSDASS>2.0.CO;2 (1969).
65. Jiang, H. & Zipser, E. J. Contribution of Tropical Cyclones to the Global Precipitation from Eight Seasons of TRMM Data: Regional, Seasonal, and Interannual Variations. J. Climate 23, 1526–1543, https://doi.org/10.1175/2009jcli3303.1 (2010).
66. Gunn, R. & Kinzer, G. D. The Terminal Velocity of Fall for Water Droplets in Stagnant Air. J. Meteor. 6, 243–248, 10.1175/1520-0469(1949)006<0243:TTVOFF>2.0.CO;2 (1949).
67. Tokay, A. & Short, D. A. Evidence from Tropical Raindrop Spectra of the Origin of Rain from Stratiform versus Convective Clouds. J. Appl. Meteorol. 35, 355–371, 10.1175/1520-0450(1996)035<0355:EFTRSO>2.0.CO;2 (1996).
68. Yin, S., Xie, Y., Nearing, M. A. & Wang, C. Estimation of Rainfall Erosivity Using 5- to 60-minute Fixed-interval Rainfall Data from China. Catena 70, 306–312, https://doi.org/10.1016/j.catena.2006.10.011 (2007).
AcknowledgementsThe authors would like to acknowledge the Central Weather Bureau, Taiwan for providing the rain gauge stations data. All the authors are also thank Joint typhoon warning center (JTWC) for providing the typhoon track information. This work is supported by Ministry of Science and Technology (MOST), Taiwan under grants no. MOST 104–2923-M-008-003-MY5, MOST 106-2625-M-008-013 and MOST 106-2811-M-008-084, partially by “Earthquake-Disaster & Risk Evaluation and Management Center, E-DREaM” from The Featured Areas Research Center Program within the framework of the Higher Education Sprout Project by the Ministry of Education (MOE), Taiwan. The first author, JJ acknowledges MOST, Taiwan to carry out this research work under grants MOST 104-2811-M-008-064, MOST 106-2811-M-008-084, MOST 107-2811-M-008-2551 and MOST 108-2811-M-008-558. BKS acknowledges the Academia Sinica, Taiwan for providing the graduate fellowship under Taiwan international Graduate Program (TIGP), and also to MOST, Taiwan, R.O.C for providing the fellowship under the grant numbers MOST 106-2625-M-008-013 and MOST 107-2625-M-008-002.
Author contributionsJ.J., B.K.S. and P.L.L. provided the study concept. J.J. and B.K.S. performed data analysis and interpretation. P.L.L. archived the data, conceived the project, and provided the fund opportunities. J.J. and B.K.S. wrote the manuscript. J.J., B.K.S., P.L.L. and P.K.W. involved in drafting and revising the manuscript. UK involved in data analysis. All the authors reviewed and commented the manuscript.
competing interestsThe authors declare no competing interests.
Additional informationSupplementary information is available for this paper at https://doi.org/10.1038/s41598-019-52028-5.Correspondence and requests for materials should be addressed to P.-L.L.

1 4Scientific RepoRtS | (2019) 9:15862 | https://doi.org/10.1038/s41598-019-52028-5
www.nature.com/scientificreportswww.nature.com/scientificreports/
Reprints and permissions information is available at www.nature.com/reprints.Publisher’s note Springer Nature remains neutral with regard to jurisdictional claims in published maps and institutional affiliations.
Open Access This article is licensed under a Creative Commons Attribution 4.0 International License, which permits use, sharing, adaptation, distribution and reproduction in any medium or
format, as long as you give appropriate credit to the original author(s) and the source, provide a link to the Cre-ative Commons license, and indicate if changes were made. The images or other third party material in this article are included in the article’s Creative Commons license, unless indicated otherwise in a credit line to the material. If material is not included in the article’s Creative Commons license and your intended use is not per-mitted by statutory regulation or exceeds the permitted use, you will need to obtain permission directly from the copyright holder. To view a copy of this license, visit http://creativecommons.org/licenses/by/4.0/. © The Author(s) 2019