The role of the Indian monsoon onset in the West African monsoon onset: observations and AGCM nudged...
19
The role of the Indian monsoon onset in the West African monsoon onset: observations and AGCM nudged simulations Emmanouil Flaounas • Serge Janicot • Sophie Bastin • Re ´my Roca • Elsa Mohino Received: 1 January 2011 / Accepted: 18 February 2011 Ó Springer-Verlag 2011 Abstract In spring the inland penetration of the West African Monsoon (WAM) is weak and the associated rainband is located over the Guinean coast. Then within a few days deep convection weakens considerably and the rainband reappears about 20 days after over the Sahel, where it remains until late September signalling the sum- mer rainy season. Over the period 1989–2008 a telecon- nection induced by the Indian monsoon onset is shown to have a significant impact on the WAM onset, by per- forming composite analyses on both observational data sets and atmospheric general circulation model simulations ensembles where the model is nudged to observations over the Indian monsoon sector. The initiation of convective activity over the Indian subcontinent north of 15°N at the time of the Indian monsoon onset results in a westward propagating Rossby wave establishing over North Africa 7–15 days after. A back-trajectory analysis shows that during this period, dry air originating from the westerly subtropical jet entrance is driven to subside and move southward over West Africa inhibiting convection there. At the same time the low-level pressure field over West Africa reinforces the moisture transport inland. After the passage of the wave, the dry air intrusions weaken drastically. Hence 20 days after the Indian monsoon onset, convection is released over the Sahel where thermodynamic conditions are more favourable. This scenario is very similar in the observations and in the nudged simulations, meaning that the Indian monsoon onset is instrumental in the WAM onset and its predictability at intraseasonal scale. Keywords West African monsoon onset Á Indian monsoon onset Á Dry-air intrusions Á Madden-Julian Á Oscillation Á Atmospheric general circulation models Á Nudging 1 Introduction The summer West African monsoon (WAM) circulation is accompanied by strong rainfalls which contribute benefi- cially to the water resources and agricultural production of the region. The dynamics of the WAM system results from rather complicated interactions between dynamics, ther- modynamics and surface conditions. Sultan and Janicot (2000) showed that deep convection over West Africa presents a strong intra-seasonal vari- ability with a non progressive evolution: from spring to early summer, the rain band associated with the WAM Inter-Tropical Convergence Zone (ITCZ) is located along the Guinean coast (5°N). Then within about 15 days in E. Flaounas (&) LATMOS/IPSL, Universite ´ Pierre et Marie Curie, Boite 102, 4 Place Jussieu, 75252 Paris cedex 05, France e-mail: emmanouil.fl[email protected] S. Janicot LOCEAN/IPSL, IRD, Universite ´ Pierre et Marie Curie, Paris, France S. Bastin LATMOS/IPSL, CNRS, Universite ´ Pierre et Marie Curie, Paris, France R. Roca LMD/IPSL, CNRS, Universite ´ Pierre et Marie Curie, Paris, France E. Mohino LOCEAN/IPSL, CNRS, Universite ´ Pierre et Marie Curie, Paris, France E. Mohino Universidad de Sevilla, Sevilla, Spain 123 Clim Dyn DOI 10.1007/s00382-011-1045-x
-
Upload
independent -
Category
Documents
-
view
1 -
download
0
Transcript of The role of the Indian monsoon onset in the West African monsoon onset: observations and AGCM nudged...

The role of the Indian monsoon onset in the West Africanmonsoon onset: observations and AGCM nudged simulations
Emmanouil Flaounas • Serge Janicot •
Sophie Bastin • Remy Roca • Elsa Mohino
Received: 1 January 2011 / Accepted: 18 February 2011
� Springer-Verlag 2011
Abstract In spring the inland penetration of the West
African Monsoon (WAM) is weak and the associated
rainband is located over the Guinean coast. Then within a
few days deep convection weakens considerably and the
rainband reappears about 20 days after over the Sahel,
where it remains until late September signalling the sum-
mer rainy season. Over the period 1989–2008 a telecon-
nection induced by the Indian monsoon onset is shown to
have a significant impact on the WAM onset, by per-
forming composite analyses on both observational data sets
and atmospheric general circulation model simulations
ensembles where the model is nudged to observations over
the Indian monsoon sector. The initiation of convective
activity over the Indian subcontinent north of 15�N at the
time of the Indian monsoon onset results in a westward
propagating Rossby wave establishing over North Africa
7–15 days after. A back-trajectory analysis shows that
during this period, dry air originating from the westerly
subtropical jet entrance is driven to subside and move
southward over West Africa inhibiting convection there. At
the same time the low-level pressure field over West Africa
reinforces the moisture transport inland. After the passage
of the wave, the dry air intrusions weaken drastically.
Hence 20 days after the Indian monsoon onset, convection
is released over the Sahel where thermodynamic conditions
are more favourable. This scenario is very similar in the
observations and in the nudged simulations, meaning that
the Indian monsoon onset is instrumental in the WAM
onset and its predictability at intraseasonal scale.
Keywords West African monsoon onset � Indian
monsoon onset � Dry-air intrusions � Madden-Julian �Oscillation � Atmospheric general circulation models �Nudging
1 Introduction
The summer West African monsoon (WAM) circulation is
accompanied by strong rainfalls which contribute benefi-
cially to the water resources and agricultural production of
the region. The dynamics of the WAM system results from
rather complicated interactions between dynamics, ther-
modynamics and surface conditions.
Sultan and Janicot (2000) showed that deep convection
over West Africa presents a strong intra-seasonal vari-
ability with a non progressive evolution: from spring to
early summer, the rain band associated with the WAM
Inter-Tropical Convergence Zone (ITCZ) is located along
the Guinean coast (5�N). Then within about 15 days in
E. Flaounas (&)
LATMOS/IPSL, Universite Pierre et Marie Curie, Boite 102,
4 Place Jussieu, 75252 Paris cedex 05, France
e-mail: [email protected]
S. Janicot
LOCEAN/IPSL, IRD, Universite Pierre et Marie Curie,
Paris, France
S. Bastin
LATMOS/IPSL, CNRS, Universite Pierre et Marie Curie,
Paris, France
R. Roca
LMD/IPSL, CNRS, Universite Pierre et Marie Curie,
Paris, France
E. Mohino
LOCEAN/IPSL, CNRS, Universite Pierre et Marie Curie,
Paris, France
E. Mohino
Universidad de Sevilla, Sevilla, Spain
123
Clim Dyn
DOI 10.1007/s00382-011-1045-x

average, it is abruptly displaced over the Sahel (10�N). The
transitional phase needed for this migration towards the
north is characterized both by a weakening of deep con-
vection over the Guinean coast, and by an increased
moisture flux over the Sahel which is the driver for the
reorganization of deep convection over this region and
indicates the summer WAM onset. This transitional phase
is centred on June 24th with a standard deviation of 8 days
(Sultan and Janicot 2003). However the mechanisms con-
trolling the WAM onset phase are not clearly elucidated.
The Saharan Heat-Low (SHL), which represents a low-
pressure region of dry convection, is the most solicited
actor to play the main role in the WAM onset dynamics.
Defined as the geopotential height thickness between 700
and 925 hPa, which is proportional to the mean tempera-
ture between these two levels, it is driven by the solar cycle
and sets-up within the mountains of Atlas and Ahaggar
(both mountains form a chain in north-west Africa with a
north-west to south-east orientation; Fig. 1), on the cli-
matological date of June 20th (Lavaysse et al. 2009).
Sultan and Janicot (2003) suggested that during late June
the interaction of the shallow north-east Harmattan (a
warm and dry wind) with the Atlas-Ahaggar mountainous
chain leads to an abrupt intensification of the SHL, due to
low pressures imposed on the leeward side of the moun-
tains. In consequence, the meridional gradient of pressure
drives the WAM to a deeper inland propagation. In the
same time, the return branch of the divergent circulation at
the top of the SHL (approximately at 700 hPa) is driven to
subside within the region of deep convection. These events
lead both to an increased humidity advection over the Sahel
and the inhibition of deep convection due to the dry air
advection in the mid-troposphere. Ramel et al. (2006),
Sijikumar et al. (2006) and Lavaysse et al. (2009) proposed
similar mechanisms where the abrupt displacement of the
SHL over its favourite location induces the acceleration of
the WAM and the northward propagation of the rain band,
where thermodynamic conditions are more favourable for
convection.
The meridional surface temperature gradient between
the cold sea surface temperatures (SST) in the Gulf of
Guinea and the continent is also suggested to play a crucial
role in the WAM onset. De Coetlogon et al. (2010) showed
that colder SST than normal increases the surface meridi-
onal temperature gradient between the equator and the
continent, accelerating the WAM and favouring its inland
propagation. This induces a positive correlation between
the timing of the cold oceanic tongue in the gulf of Guinea
and the WAM onset (Brandt et al. 2010). This mechanism
is fed by a positive feedback due to the continuous
upwelling of cold oceanic waters as a response to the
WAM acceleration (Okumura and Xie 2004).
Finally, Hagos and Cook (2007) suggested that the
abrupt character of the WAM onset is imposed by inertial
instability. Their study was based on regional modelling
with forcing the model by climatological lateral boundary
conditions. According to the authors, during spring the
moisture advection over the Sahel is continuous resulting
to a net supply of humidity over the region. In early
summer, heating of lower troposphere occurs due to con-
densation and while middle troposphere cools due to
radiation and rain evaporation. The imposed meridional
pressure gradient due to these processes leads to favourable
conditions for the inertial instability to take place over the
Guinean region. Hence, moisture advection over the Sahel
increases, due to the WAM acceleration, and consequently
the rain band migrates over the interior of the continent.
All the above mechanisms are based on regional
dynamics only. However, Madden-Julian Oscillation
(MJO; Madden and Julian 1994) events are also shown to
have an impact on the intraseasonal variability of deep
convection over West Africa (e.g. Maloney and Shaman
2008; Janicot et al. 2009; Lavender and Matthews 2009;
Pohl et al. 2009), which could include the WAM onset
phase. Janicot and Sultan (2001) showed that strong vari-
ability between 25 and 60 days is observed for rainfall over
the Sahel. Large scale dynamics linked to MJO has been
proven to be dominant at this time scale. Matthews (2004)
showed that 20 days after a MJO event, deep convection
over West Africa is enhanced due to large scale dynamics
associated with the propagation of equatorial Rossby and
Kelvin waves. According to the author, both waves meet
over West Africa and destabilize the atmosphere favouring
convection. Janicot et al. (2009) also showed that negative
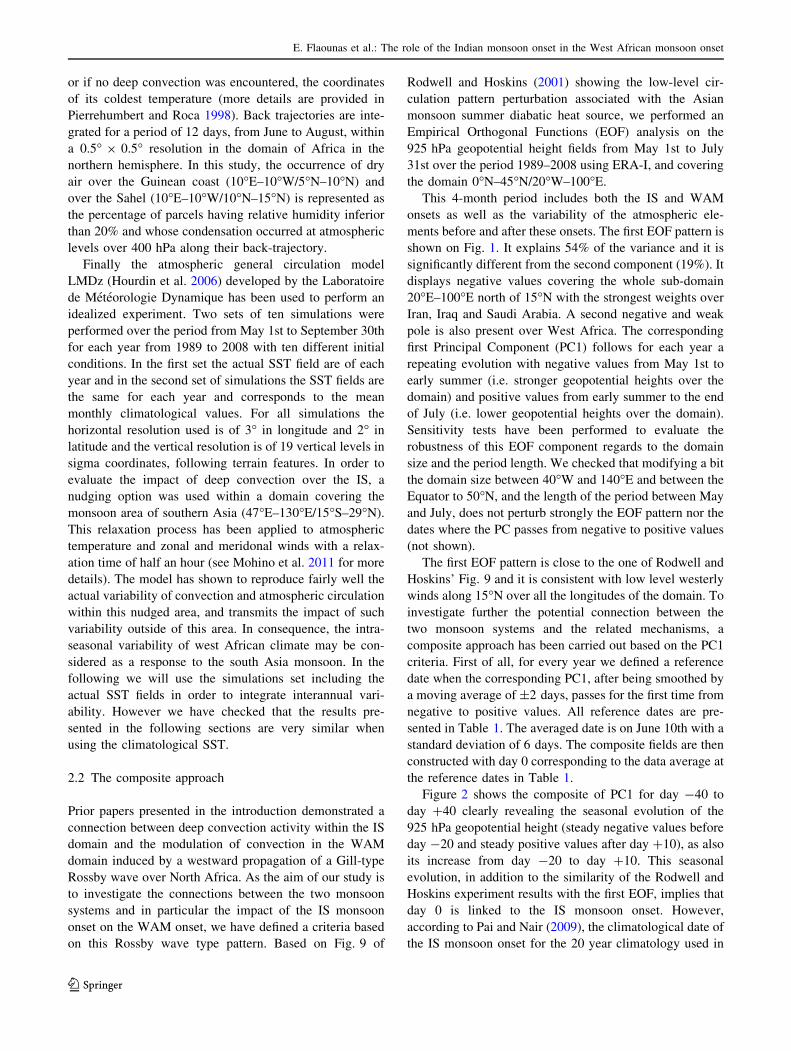
Fig. 1 First EOF of 925 hPa
geopotential field from May 1st
to July 31st over 1989–2008
(in contour) and orography
(in colour)
E. Flaounas et al.: The role of the Indian monsoon onset in the West African monsoon onset
123

and positive phases of deep convection at this time scale
over West Africa are associated with MJO, and highlighted
the role of the Rossby waves. In addition, they showed that
these events are linked with the northward propagation of a
dipole of OLR anomalies over the Indian Subcontinent
(IS), showing a teleconnection between the two monsoon
systems. Idealized experiments with a primitive equations
model were performed in order to evaluate the impact of
deep convection over the IS on West Africa. According to
the results, when deep convection is located over the IS and
north of 10�N, a westward propagating Gill-type Rossby
wave induces lower pressures over the Sahel leading to the
acceleration of the WAM and the enhanced moisture
advection over the continent 15–20 days after. Lavender
and Matthews (2009), and more recently Mohino et al.
(2011), also modelled the effect of MJO on West Africa
convection and confirmed that Rossby waves are most
likely to destabilise the atmosphere and enhance deep
convection over the Sahel.
Similar results were also shown in the prior studies of
Rodwell and Hoskins (1996, 2001) who analyzed the
impact of an Indian monsoon diabatic heat source on the
large scale atmospheric circulation. Ten to fifteen days
after the initialization of the model, with the diabatic
source installed over the IS, a westward propagating
Rossby wave is observed to pass over East Mediterranean.
This event leads to a double effect on atmospheric
dynamics: on one hand, air masses of high troposphere and
mid-latitudes origin are forced to subside over North
Africa, favouring dry air intrusions towards West Africa,
and on the other hand, the low level westerly winds in the
WAM circulation are reinforced due to lower pressures
imposed over West Africa, favouring rainfall increase.
Roca et al. (2005) identified such intrusions of high tro-
pospheric air over the Sahel in July–August 1992. It was
shown that high extra-tropical dry air, originating from the
subtropical westerly jet (SWJ) was redirected to subside
over the Sahel. It is noteworthy that such dry air intrusions
were also detected during the WAM onset of the year 2006
(Janicot et al. 2008). Recently Flaounas et al. (2011)
showed that in 2006 this onset was partly driven by a
synoptic scale pattern favourable to these dry air intrusions.
Flaounas et al. (2011) also suggested in their case study
on 2006 that this atmospheric synoptic scale pattern could
be linked with the IS monsoon onset which may trigger a
mechanism as described by Rodwell and Hoskins (1996).
In a climatological study based on observational data sets,
Camberlin et al. (2010) analyzed the impact of the Indian
monsoon onset detected over Kerala (located at 10�N) on
the African climate. They showed that convection is
weakened over West Africa 10–15 days after the IS mon-
soon onset and they also involved the MJO and associated
westward Rossby wave propagation. On the other hand,
Mohino et al. (2011) showed that during the summer a
strong proportion of MJO events occur in June and then
might be a link between the IS monsoon onset and the
WAM onset with a lag of about 15 days.
In contrast with the previous studies on the WAM onset,
which are based on regional climate features, here it is
large scale dynamics that are investigated in regards to the
initialization of the rainy season over the Sahel. Hence, in
this paper we address the potential role of IS monsoon
onset on West Africa and in particular on the WAM onset.
This study has been performed by using observations over
the period 1989–2008 taking advantage of the ERA-
Interim new reanalysis, and by using atmospheric general
circulation model (AGCM) simulations ensemble nudged
over the IS region. Comparing results from these two sets
of data will enable to discriminate the role of the IS
monsoon. The data and the composite method are pre-
sented in Sect. 2. Section 3 describes the results of the
composite approach on rainfall and convection data. Sec-
tion 4 presents the atmospheric mechanisms of the
IS-WAM connection at high and low levels including the
dry-air intrusions. Conclusion and some discussion are
given in Sect. 5.
2 Data and methods
2.1 Data and models
This study focuses on the climatological period of
1989–2008. The data used for the analysis of deep con-
vection are taken from the National Oceanic and Atmo-
spheric Administration (NOAA) archive of Outgoing
Longwave Radiation (OLR), 2.5� 9 2.5� daily interpolated
fields (Liebmann and Smith 1996). In addition, rainfall
fields are used, taken from the daily 1� 9 1� interpolated
analysis of the Global Precipitation Climate Project
(GPCP; Huffman et al. 2000), available for the period
1997–2008. Finally, all meteorological fields used in this
study derive from the Interim reanalysis of the European
Centre for Medium-Range Weather Forecasts (ECMWF),
0.75� 9 0.75� daily averaged fields (Dee and Uppala
2009). The ECMWF-Interim reanalises (ERA-I) are of
finer vertical and horizontal resolution and they present
significant advances compared to the previous ERA-40
reanalysis, nottably on data assimilation.
An idealized advection—subsidence model which
reconstructs water vapour fields through back-trajectories
is used to detect the dry air intrusions over West Africa.
Forced by the meteorological data from the ECMWF
Interim reanalysis, the model provides the location and the
atmospheric level of the last saturation of an air parcel i.e.
the coordinates of its last encounter with deep convection,
E. Flaounas et al.: The role of the Indian monsoon onset in the West African monsoon onset
123
or if no deep convection was encountered, the coordinates
of its coldest temperature (more details are provided in
Pierrehumbert and Roca 1998). Back trajectories are inte-
grated for a period of 12 days, from June to August, within
a 0.5� 9 0.5� resolution in the domain of Africa in the
northern hemisphere. In this study, the occurrence of dry
air over the Guinean coast (10�E–10�W/5�N–10�N) and
over the Sahel (10�E–10�W/10�N–15�N) is represented as
the percentage of parcels having relative humidity inferior
than 20% and whose condensation occurred at atmospheric
levels over 400 hPa along their back-trajectory.
Finally the atmospheric general circulation model
LMDz (Hourdin et al. 2006) developed by the Laboratoire
de Meteorologie Dynamique has been used to perform an
idealized experiment. Two sets of ten simulations were
performed over the period from May 1st to September 30th
for each year from 1989 to 2008 with ten different initial
conditions. In the first set the actual SST field are of each
year and in the second set of simulations the SST fields are
the same for each year and corresponds to the mean
monthly climatological values. For all simulations the
horizontal resolution used is of 3� in longitude and 2� in
latitude and the vertical resolution is of 19 vertical levels in
sigma coordinates, following terrain features. In order to
evaluate the impact of deep convection over the IS, a
nudging option was used within a domain covering the
monsoon area of southern Asia (47�E–130�E/15�S–29�N).
This relaxation process has been applied to atmospheric
temperature and zonal and meridonal winds with a relax-
ation time of half an hour (see Mohino et al. 2011 for more
details). The model has shown to reproduce fairly well the
actual variability of convection and atmospheric circulation
within this nudged area, and transmits the impact of such
variability outside of this area. In consequence, the intra-
seasonal variability of west African climate may be con-
sidered as a response to the south Asia monsoon. In the
following we will use the simulations set including the
actual SST fields in order to integrate interannual vari-
ability. However we have checked that the results pre-
sented in the following sections are very similar when
using the climatological SST.
2.2 The composite approach
Prior papers presented in the introduction demonstrated a
connection between deep convection activity within the IS
domain and the modulation of convection in the WAM
domain induced by a westward propagation of a Gill-type
Rossby wave over North Africa. As the aim of our study is
to investigate the connections between the two monsoon
systems and in particular the impact of the IS monsoon
onset on the WAM onset, we have defined a criteria based
on this Rossby wave type pattern. Based on Fig. 9 of
Rodwell and Hoskins (2001) showing the low-level cir-
culation pattern perturbation associated with the Asian
monsoon summer diabatic heat source, we performed an
Empirical Orthogonal Functions (EOF) analysis on the
925 hPa geopotential height fields from May 1st to July
31st over the period 1989–2008 using ERA-I, and covering
the domain 0�N–45�N/20�W–100�E.
This 4-month period includes both the IS and WAM
onsets as well as the variability of the atmospheric ele-
ments before and after these onsets. The first EOF pattern is
shown on Fig. 1. It explains 54% of the variance and it is
significantly different from the second component (19%). It
displays negative values covering the whole sub-domain
20�E–100�E north of 15�N with the strongest weights over
Iran, Iraq and Saudi Arabia. A second negative and weak
pole is also present over West Africa. The corresponding
first Principal Component (PC1) follows for each year a
repeating evolution with negative values from May 1st to
early summer (i.e. stronger geopotential heights over the
domain) and positive values from early summer to the end
of July (i.e. lower geopotential heights over the domain).
Sensitivity tests have been performed to evaluate the
robustness of this EOF component regards to the domain
size and the period length. We checked that modifying a bit
the domain size between 40�W and 140�E and between the
Equator to 50�N, and the length of the period between May
and July, does not perturb strongly the EOF pattern nor the
dates where the PC passes from negative to positive values
(not shown).
The first EOF pattern is close to the one of Rodwell and
Hoskins’ Fig. 9 and it is consistent with low level westerly
winds along 15�N over all the longitudes of the domain. To
investigate further the potential connection between the
two monsoon systems and the related mechanisms, a
composite approach has been carried out based on the PC1
criteria. First of all, for every year we defined a reference
date when the corresponding PC1, after being smoothed by
a moving average of ±2 days, passes for the first time from
negative to positive values. All reference dates are pre-
sented in Table 1. The averaged date is on June 10th with a
standard deviation of 6 days. The composite fields are then
constructed with day 0 corresponding to the data average at
the reference dates in Table 1.
Figure 2 shows the composite of PC1 for day -40 to
day ?40 clearly revealing the seasonal evolution of the
925 hPa geopotential height (steady negative values before
day -20 and steady positive values after day ?10), as also
its increase from day -20 to day ?10. This seasonal
evolution, in addition to the similarity of the Rodwell and
Hoskins experiment results with the first EOF, implies that
day 0 is linked to the IS monsoon onset. However,
according to Pai and Nair (2009), the climatological date of
the IS monsoon onset for the 20 year climatology used in
E. Flaounas et al.: The role of the Indian monsoon onset in the West African monsoon onset
123

this study (1989–2008) is June 3rd, i.e. a lag of a week
from our reference dates in Table 1. Nevertheless, June
10th is consistent with the IS monsoon onset over central
India (approximately at 20�N), as detected by the India
Meteorological Department (www.imd.gov.in/section/
nhac/dynamic/Monsoon_frame.htm). Further investigation
shows that the correlation coefficient between the onset
dates as defined by Pai and Nair (2009) and as defined by
the PC1 criteria is rather weak (0.22). However, excluding
the years 1990, 1999 and 2006 the same correlation coef-
ficient reaches 0.67 and the mean lag between the sets of
onset dates is 5 days, consistent with the northern propa-
gation of the IS monsoon. On the other hand, the average
lag between the two sets of dates for 1990, 1999 and 2006
is 23 days (with a standard deviation of 3 days) and it is the
largest observed. This important lag is due to to the criteria
applied for the definition of the IS onset. Pai and Nair
(2009) detected the IS monsoon onset over Kerala (10�N)
using local factors directly linked to the monsoon onset
characteristics (wind field, precipitation and so on),
whereas our method is based on large scale geopotential
fields. In fact, Rodwell and Hoskins (1996) showed that
setting the convection heat source over the IS at 25�N has a
stronger impact on large scale low-level pressure fields
than setting it over 10�N. In consequence, the EOF analysis
attributes the seasonal change of the PC1 index at the
timing that convection reaches northern latitudes than
10�N, i.e. when the impact of convection over the IS on
large scale low-level geopotential is stronger. In 1990,
1999 and 2006 the cycle of convection over the IS was
rather anomalous and convection over 20�N came several
days after the IS monsoon onset over Kerala, which
explains the 23 days lag for these 3 years between our
dates and Pai and Nair (2009). In the next section,
the physical interpretation of the composite PC1 of the
925 hPa geopotential is further developed reveling the
teleconnection between the WAM onset and the IS mon-
soon onset.
The same composite approach has also been applied to
other atmospheric fields by following the same computa-
tion process based on the PC1 criteria. First all fields have
been smoothed by applying a 5-day moving average in
order to remove high frequency perturbations and to better
focus on intraseasonal variability. Then the composite
computation has been applied either on raw fields (Figs. 3,
5) or on deseasonalized fields (Figs. 4, 6) where the day by
day 20-year (1989–2008) average was removed from the
raw values. To test whether composite data are statistically
significant, we applied a one-sided t test with the null
hypothesis of zero population mean. A confidence level of
95% of rejection of this null hypothesis has been applied.
3 Evidence of the link between the IS monsoon onset
and the WAM onset
3.1 Time-latitude diagrams of OLR and rainfall fields
In order to bring some light on the physical meaning of the
PC1 in regards to the two monsoons, Fig. 3a, b display the
composite time-latitude diagrams respect to PC1 for
respectively the raw composite fields of OLR and rainfall,
as observed over the IS (averaged over 70�E–90�E) and
West Africa (averaged over 10�W–10�E). In addition, an
insight on the weakening and reinforcement phases of deep
convection over the two regions, respect to the mean sea-
sonal cycle, is provided in Fig. 4 by the composite desea-
sonalized fields of OLR and of rainfall.
Over the IS sector, day 0 represents the date of a clear
monsoon onset signal centered at this time over the lati-
tudes between 10�N and 15�N in terms of OLR and 15�N
and 20�N in terms of precipitation (Fig. 3a, b). It could be
argued that the onset for precipitation takes place on day
-10, i.e. when rainfall starts to develop. However, in
contrast to OLR, fewer years are available for the recon-
struction of the precipitation composite fields and hence
these fields are noisier. The rainfall maximum gives a
clearer and more robust signal and since it is in phase with
the OLR minimum, it is day 0 which we consider as the
Table 1 Dates when PC1 passes from negative to positive values and
the dates of the Indian monsoon onset over Kerala according to Pai
and Nair (2009)
Year PC1—day 0 Pai and Nair (2009)
1989 June 9 June 4
1990 June 10 May 18
1991 June 6 June 2
1992 June 15 June 5
1993 June 10 June 3
1994 June 1 May 28
1995 June 10 June 10
1996 June 13 June 9
1997 June 18 June 12
1998 June 18 June 3
1999 June 12 May 22
2000 May 26 June 1
2001 June 1 May 26
2002 June 8 June 9
2003 June 11 June 13
2004 June 12 June 3
2005 June 12 June 7
2006 June 22 May 26
2007 June 7 May 28
2008 June 5
E. Flaounas et al.: The role of the Indian monsoon onset in the West African monsoon onset
123

reference date for the IS monsoon onset at approximately
15�N to 20�N. This onset is embedded in a progressive
northward propagation of heavy rainfall and low OLR
values from 5�N (day -10) to 20�N (day ?10). It is
noteworthy, that the first half of this propagation (from 5�N
to 10�N) comes as an average of two distinctive centers of
deep convection, one over the Bay of Bengal and another
over the Arabian sea (due to the high climatological SST
values in these basins; not shown). After day 0, the highest
precipitation and lowest OLR values over the IS are close
to the ones of these oceanic basins. Prior to the IS monsoon
onset, a composite phase of enhanced convection is
observed around day -35 on both rainfall and OLR data.
The IS monsoon onset represents a complicated issue since
Fig. 2 Composite time series of
the first EOF Principal
Component of the 925 hPa
geopotential field (see Fig. 1)
from day-40 to day ?40. The
composite time series is centred
on day 0 when the value of the
Principal Component for each
year overpasses the threshold of
zero for the first time after May
15th. The length of each barequals twice the standard
deviation. The mean date ‘‘0’’ is
June 10th. The curve is
smoothed with a 5-day moving
average
Fig. 3 a Time-latitude diagram
of the composite field of daily
OLR (W m-2) observations
from day-40 to day ?60 over
West Africa (averaged on
10�W–10�E; colour) and over
the Indian subcontinent
(averaged on 70�E–90�E;
contours every 5 W m-2 equal
and below 220 W m-2);
b Same as in a but for the
composite field of daily rainfall
(GPCP; mm day-1)
observations (contours every
1 mm day-1 equal and above
6 mm day-1). Data are
smoothed with a 5-day moving
average
E. Flaounas et al.: The role of the Indian monsoon onset in the West African monsoon onset
123
convective phases may take place prior to the ‘‘real’’ onset
and induce ‘‘bogus’’ onset (Flatau et al. 2001). This is
probably what is highlighted here.
The composite fields of OLR and rainfall over West
Africa, respect to PC1, are also shown on Fig. 3a, b. The
abrupt meridional shift of the ITCZ described in the
introduction is evident after day ?15. From day -40 to day
0, deep convection is located over the Guinean coast
(approximately at 5�N) where rainfall (OLR) is maximum
(minimum). From day 0 to day ?10, convection weakens
drastically over this area, and the transitional phase of
minimum of convection characterizing the WAM onset is
present from day ?10 to day ?20. It is noteworthy that
from day ?10 to day ?15, the OLR field over west Africa
(Fig. 3a) shows that convection is more weakened over the
Gulf of Guinea rather than over the Guinean coast (set
approximately at 5�N). After day ?20, convection takes
place over the Sahel (10�N and northward) signaling the
onset of the summer rain season of the African monsoon. It
is interesting to notice that this transitional phase over West
Africa is centered at day ?15, that is around 25th of June,
which is similar to the mean WAM onset date as defined in
Sultan and Janicot (2003). However, as for the IS monsoon
onset, the WAM onset consists a complicated issue.
Although the rainy season over the Sahel is clearly set on
day ?20, it is only after day ?30 that convection is
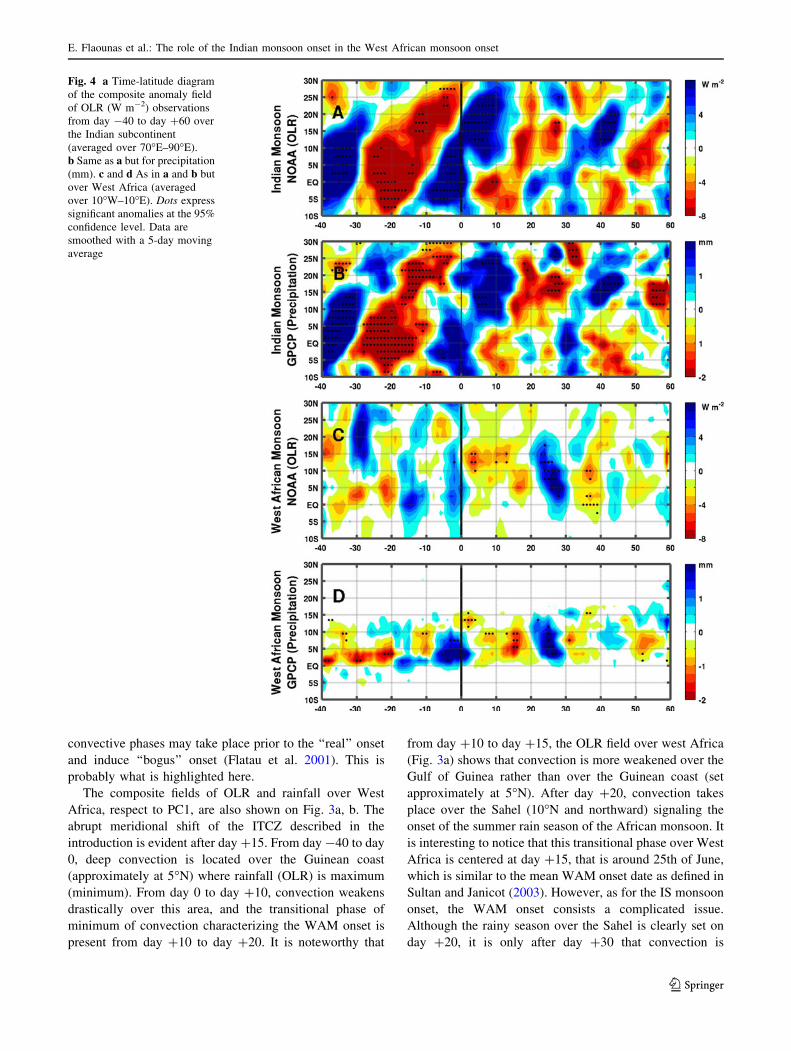
Fig. 4 a Time-latitude diagram
of the composite anomaly field
of OLR (W m-2) observations
from day -40 to day ?60 over
the Indian subcontinent
(averaged over 70�E–90�E).
b Same as a but for precipitation
(mm). c and d As in a and b but
over West Africa (averaged
over 10�W–10�E). Dots express
significant anomalies at the 95%
confidence level. Data are
smoothed with a 5-day moving
average
E. Flaounas et al.: The role of the Indian monsoon onset in the West African monsoon onset
123

definitely weak over the Guinean coast. In consequence the
WAM onset appears as a three-step mechanism: (1) the
transitional phase of minimum of convective activity cen-
tered around day ?15 preceding the Sahel rainy season
start, (2) a reactivation of convection over all of West
Africa between day ?20 and day ?30, preceding the end
of convective activity over the Guinean coast, and (3) a
slight decrease of convective activity around day ?35. Of
course what we show here is not the mean convective or
rainfall fields seasonal evolution over West Africa but a
composite associated with the IS monsoon onset. So this
three-step evolution can include a specific fingerprint of the
IS monsoon. The deseasonalized OLR and rainfall fields
shown on Fig. 4 capture very well these steps. From day
-20 to day ?30, the OLR and rainfall fields show a
sequence of increased convection over the Guinean coast
(day -20 to day 0), of decreased convection over both the
Sahel and the Guinean coast (day 0 to day ?20), of
increased convection over the Sahel (day ?20 to day ?30)
and a last decreased convective sequence between day ?30
and day ?40. These sequences show statistically signifi-
cant anomalies of OLR and rainfall. That means that, sta-
tistically speaking, there is a link between the timing of the
IS monsoon onset and the WAM onset with a lag of about
15 days.
In order to evaluate if a physical connection can be set-
up and confirm the statistical connection, the similar
composite fields of OLR and rainfall, but from the LMDz
simulations nudged over the IS domain, are shown
respectively in Fig. 5a, b for the raw fields and in Fig. 6 for
the deseasonalized fields. In agreement with the observa-
tions, the composite pattern marks very well the IS mon-
soon onset over the latitudes of 15�N to 20�N at day 0
(Fig. 5) as well as the preceding northward propagation of
convection around day -35 characterizing a bogus onset.
The LMDz fields show however a weaker northward
propagation of the ITCZ. The deseasonalized fields of OLR
and rainfall (Fig. 6) also reveal strong and statistically
significant phases of northward propagating dipole anom-
alies, a bit weaker than the observations but very consistent
with them. The very interesting point is of course the
simulated fields evolution over West Africa. Whereas, as
over the IS domain, the ITCZ in LMDz moves less
northward after the WAM onset (which is characteristic of
this model in control runs), the fields are in close agree-
ment with the observations, showing very clearly the rainy
season over the Guinean coast ending at day ?10, the
transitional phase of weakened convection centered on day
?15, and the start of the Sahel rainy season at day ?20, as
well as the slight intraseasonal phase between day ?20 and
Fig. 5 Same as in Fig. 3a, b but
for the LMDz model
simulations ensemble
E. Flaounas et al.: The role of the Indian monsoon onset in the West African monsoon onset
123
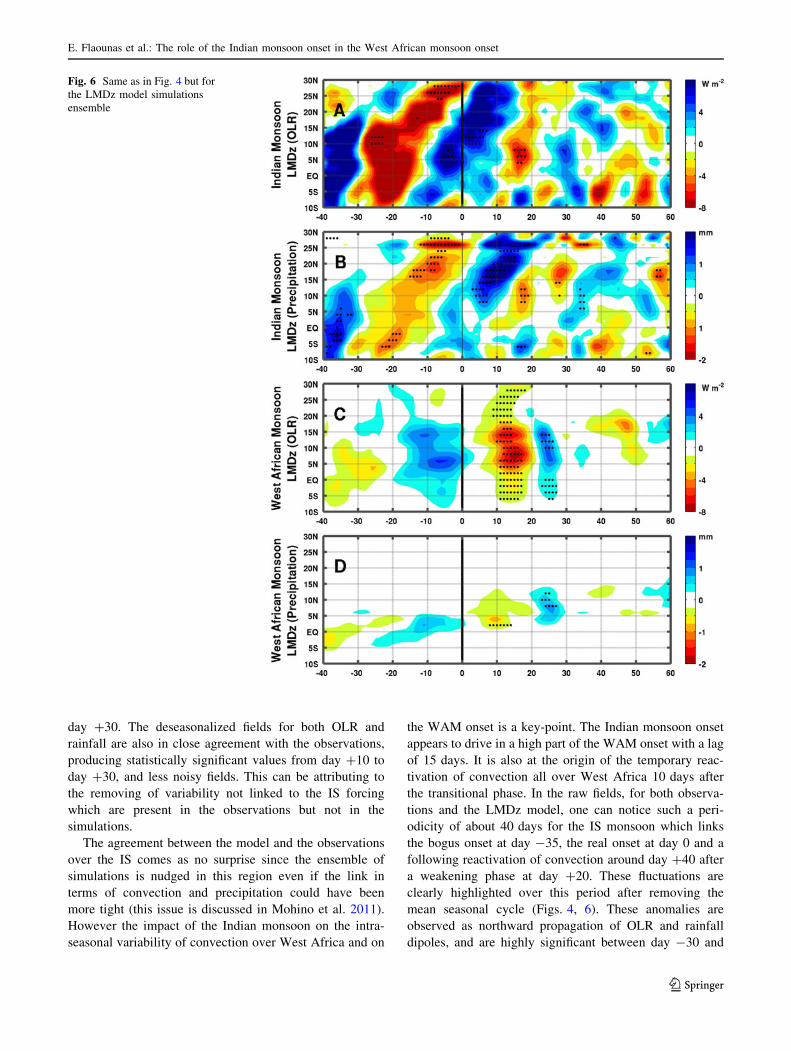
day ?30. The deseasonalized fields for both OLR and
rainfall are also in close agreement with the observations,
producing statistically significant values from day ?10 to
day ?30, and less noisy fields. This can be attributing to
the removing of variability not linked to the IS forcing
which are present in the observations but not in the
simulations.
The agreement between the model and the observations
over the IS comes as no surprise since the ensemble of
simulations is nudged in this region even if the link in
terms of convection and precipitation could have been
more tight (this issue is discussed in Mohino et al. 2011).
However the impact of the Indian monsoon on the intra-
seasonal variability of convection over West Africa and on
the WAM onset is a key-point. The Indian monsoon onset
appears to drive in a high part of the WAM onset with a lag
of 15 days. It is also at the origin of the temporary reac-
tivation of convection all over West Africa 10 days after
the transitional phase. In the raw fields, for both observa-
tions and the LMDz model, one can notice such a peri-
odicity of about 40 days for the IS monsoon which links
the bogus onset at day -35, the real onset at day 0 and a
following reactivation of convection around day ?40 after
a weakening phase at day ?20. These fluctuations are
clearly highlighted over this period after removing the
mean seasonal cycle (Figs. 4, 6). These anomalies are
observed as northward propagation of OLR and rainfall
dipoles, and are highly significant between day -30 and
Fig. 6 Same as in Fig. 4 but for
the LMDz model simulations
ensemble
E. Flaounas et al.: The role of the Indian monsoon onset in the West African monsoon onset
123

day ?10. A similar 40 days periodicity of reinforcement
and weakening of convection is also observed over West
Africa. The role of the MJO is suggested in this telecon-
nection mechanism. This indicates that the WAM onset is
strongly sensitive to large scale atmospheric dynamics and
is not only a regional scale phenomenon. Finally, it also
confirms the right choice of our criteria, the PC1 of
925 hPa geopotential height field, to detect and monitor
this teleconnection.
3.2 The possible role of the Madden-Julian Oscillation
We have shown that the link between the IS monsoon onset
and the WAM onset is embedded in high intraseasonal time
scale variability with a dominant 40 days periodicity. Such
a periodicity is notably linked with MJO events over the IS
region (Janicot et al. 2009). In order to investigate further
this issue we followed the composite approach carried out
in Mohino et al. (2011) and we applied it to the PC1 dates
defined here. The observed OLR fields are filtered to retain
the 20–90 day variability. Then, an EOF analysis is per-
formed on the non-standardized anomalies over the region
between 50�E–125�E/10�S–27.5�N on the period May 16th
to September 15th for the years 1979–2008. The first EOF
(Fig. 7a; 22% of filtered variance) depicts a dipole of
convection with a decrease over the equatorial Indian
Ocean and an increase to the north in a southeasterly-tilted
band that spans the Arabian Sea, India, the Bay of Bengal,
Indochina, the South China Sea and the Philippines. The
second EOF (Fig. 7b; 16% of filtered variance) shows
large-scale reduced convection over most of the domain,
with a pole off the western coast of India. It also shows a
weak increase of convection in the central Indian Ocean.
These first two EOFs are strongly correlated and the lead-
lag correlation of their associated PCs shows that PC1
leads PC2. This suggests an eastward and northward
propagation of the convective anomalies associated with
the summer MJO, in agreement with previous studies.
The first two EOFs are therefore capturing the summer
MJO and its propagative properties, so their two associated
PCs can be used to build the composite MJO cycle. This
cycle is decomposed into eight phases. Phases 5–8 repre-
sent the time span during which the enhanced convection
envelope moves from the southern tip of India (phase 5) to
its northernmost location (phase 8); see Fig. 4 of Mohino
et al. (2011). The dates that we determined from our cri-
teria (PC1 of 925 hPa geopotential height fields) have been
projected onto the MJO standardized PC1–PC2 MJO dia-
gram (Fig. 7c). 16 out of the 20 dates are located during the
MJO phases 5–8, which is consistent with the timing of the
Indian monsoon onset. 12 out of these 16 dates are also
outside of the circle indicating weak values of MJO activity
(less than one standard deviation). 3 other dates belong to
phase 4, that is a bit before the MJO convective envelop
reaches the southern limit of India, bur this signal is not
very strong. The last date is in phase 2 but for a weak MJO
signal. So more than half of our dates belong to a strong
MJO event whose phase is also consistent with the IS
monsoon onset. It is noteworthy that among the years with
no strong MJO signal, there are cases where the detection
technique was rather shown to be poor for capturing such
an event. For instance, in 2003 the convection center over
the bay of Bengal was very weak and thus it didn’t
Fig. 7 a EOF1 pattern of OLR (W m-2) filtered between 20 and
90 days computed for the period May 16th—September 15th over the
years 1979–2008. b Same as a but for EOF2. c Location of the
reference dates ‘‘day 0’’ from 1989 to 2008 (see Table 1) in
the standardized PC1–PC2 diagram. MJO phases 1–8 are displayed.
The circle displays one standard deviation
E. Flaounas et al.: The role of the Indian monsoon onset in the West African monsoon onset
123

correspond to the EOF based criteria as shown in Fig. 7a.
The issue of an objective criteria for the detection of MJO
events should be further investigated in future studies.
To go further into the teleconnection pattern between
the two monsoons, Figs. 8 and 9 display the composite
sequence from day ?1 to day ?31 of deseasonalized OLR
fields, for the observations and LMDz, respectively. Again,
these fields are in close agreement and significant anoma-
lies cover an important part of West Africa. Over the IS
domain the northward propagation of convection, as
described above, is very clear. From day ?1 to day ?15
significant enhanced convection envelop propagates pro-
gressively from the Equator to 25�N, followed by signifi-
cant positive OLR anomalies from day ?17 to day ?27.
South of Sahara, convective activity modulation appears to
be due to a westward propagation signal, this propagation
being clearer in the model. It is consistent with the time-
latitude diagrams in Figs. 4a and 6a. The transitional phase
of the WAM onset (day ?15) is characterized by signifi-
cant positive anomalies of OLR, followed by the start of
the rainy season over the Sahel, as denoted by significantly
enhanced convection (from day ?19). This global evolu-
tion is also very similar to the one of the main mode of
25–90-day filtered OLR variability and attributed to MJO
(see Fig. 2 of Janicot et al. 2009).
4 The mechanism of IS-WAM teleconnection
4.1 Higher troposphere response to the IS monsoon
onset over West Africa
According to Rodwell and Hoskins (1996), when the
convective activity linked to the IS monsoon onset reaches
the northern latitudes of India, a Gill-type Rossby wave
should be expected to propagate westwards passing over
the Mediterranean and promoting air masses to subside on
its western flank. Their idealized simulations showed that
the subsiding air was baroclinically deflected from the SWJ
over North Africa sliding on the 320–330 K isentropic
surface. Isentropic deseasonalized composite fields of the
three wind components and of the atmospheric pressure,
interpolated on the 330 K surface have been computed
from ERA-I and from LMDz simulations and displayed
from day ?1 to day ?19 on Figs. 10 and 11 respectively.
This isentropic surface is located on the atmospheric levels
of 250–350 hPa over the Mediterranean sea and on the
atmospheric levels of 400–500 hPa over the Guinean coast.
In both figures, a westward baroclinic wave passes over
North Africa imposing low pressures from day ?5 to day
?11 and high pressures from day ?13 to day ?23 (at day
?23 these high pressure anomalies are over the Atlantic;
not shown). Over eastern Mediterranean, the zonal gradient
of atmospheric pressure is at its highest from day ?7 to day
?13. Hence, the air masses moving eastward over this
region within the SWJ are subjected to subside from low
pressures anomalies to high pressure anomalies (see the
core of downward wind velocity over eastern Mediterra-
nean). Furthermore, the cyclonic cell imposed by Potential
Vorticity anomalies (PV; not shown) on the northeast of
the subsiding area, as well as the anticyclonic cell centered
over 25�N/0�E, drive the subsiding air masses equatorward
as suggested by Rodwell and Hoskins (1996). Hence,
during this period, a flux of high tropospheric air is directed
towards West Africa along an axis oriented northeast to
southwest (35�N/20�E–5�N/0�E). Notice that this anomaly
pattern looks like the mean climatological pattern (not
shown), meaning an enhancement effect over this region.
By day ?19, the synoptic scale anomaly pattern has
reversed due to the Rossby wave westward displacement.
In consequence, the gradient of pressure anomalies is
reversed too and the air masses subsidence over eastern
Mediterranean is weakened, being opposite to the mean
climatological pattern. This configuration, unfavorable to
dry air intrusions, is present up to day ?30 (not shown).
Again, similar results are shown in the LMDz simulations
(Fig. 11). Although the negative anomalies are weaker
prior to the passage of the high pressure anomalies over
North Africa, a similar structure of the wave and of the
subsidence is observed. This indicates that this synoptic
scale pattern, favorable for dry-air intrusion over West
Africa, is the basis of the teleconnection with the Indian
monsoon onset.
In accordance with the Rodwell and Hoskins mecha-
nism, we suggest that the subsiding air is directed over
West Africa, resulting to the weakening of convection
during the transitional phase of the WAM onset. Figure 12
shows the ERA-I composite time series of the deseason-
alized index of the occurrence of dry air intrusions over the
Guinean coast and over the Sahel. The composite desea-
sonalized vertical wind speed over eastern Mediterranean
at 300 hPa is also shown. In accordance with our previous
results, significant subsidence enhancement is observed
over eastern Mediterranean from day ?6 to day ?10 (prior
to the WAM transitional phase), due to the zonal gradient
of atmospheric pressure imposed by the Rossby wave
(Fig. 10). The associated dynamics induces the subsidence
and the deflection of high tropospheric air masses towards
West Africa, resulting to a significant increase of occur-
rence of dry air intrusions over the Sahel on days ?13 and
day ?14 (during the transitional phase). At the end and
after the transitional phase (around and after day ?20), the
zonal gradient of atmospheric pressure anomalies reverses
over eastern Mediterranean. Dry air intrusions are then
disfavored, presenting negative significant anomalies from
day ?20 to day ?35. This is concomitant with the
E. Flaounas et al.: The role of the Indian monsoon onset in the West African monsoon onset
123

Fig. 8 Composite anomaly fields of OLR (W m-2) observations from day ?1 to day ?31. Dots express anomalies significant at the 95%
confidence level. Data are smoothed with a 5-day moving average
E. Flaounas et al.: The role of the Indian monsoon onset in the West African monsoon onset
123

Fig. 9 Same as Fig. 8 but for the LMDz model simulations ensemble
E. Flaounas et al.: The role of the Indian monsoon onset in the West African monsoon onset
123

reactivation of convection over all of West Africa between
day ?20 and day ?30. In addition to the significant
anomalies highlighted on Fig. 12, it is interesting to notice
the strong similarity in the time series of the vertical
velocity index and the Sahel dry air intrusion index after
day 0 with a quasi-constant lag of about 5 days. It is
noteworthy that during the WAM onset transitional phase,
the dry air intrusions are rather massive covering most part
of West Africa. Investigating each year of the climatology
(1989–2008), it was shown that these intrusions may cover
more than 60% of the Sahel and of the Guinean coast,
imposing relative humidity values inferior to 5% (not
shown). However, Fig. 12 shows no significant values over
the Guinean coast but only a distinctive increase of dry air
intrusions (but some of the negative anomalies after day
?20 are significant). This lack of detection of significant
values is mostly due to the composite approach based on
the IS monsoon onset signal (and not directly on the WAM
onset) and the fact that these dry air events over the
Guinean coast have a rather small duration of 1–5 days.
In their case study of the WAM onset in 2006 where the
regional model WRF was used, Flaounas et al. (2011)
identified a similar synoptic scale pattern bringing dry air
from the Mediterranean within the African ITCZ. They
also showed with a specific sensitivity experiment with
WRF that an atmospheric vertical profile including such a
dry air intrusion leads to a drastic rainfall decrease in the
ITCZ. Finally it is interesting to rise that the 2006 WAM
onset was concomitant with a strong MJO event (see
Fig. 7c).
Fig. 10 ERA-I composite
anomaly fields from day ?1 to
day ?19 of pressure (hPa),
horizontal wind component
(vectors) and vertical wind
component (contours, solid for
positive values, dashed for
negative values, starting from 1
and -1 hPa s-1 respectively
with a step of 0.4 hPa s-1)
interpolated on the isentropic
surface 330 K. Dots express
anomalies significant at the 95%
confidence level. Only vectors
significant on the same
confidence level are plotted
Data are smoothed with a 5-day
moving average
E. Flaounas et al.: The role of the Indian monsoon onset in the West African monsoon onset
123

Fig. 11 Same as Fig. 9 but for
the LMDz model simulations
ensemble
Fig. 12 Time series from
day-30 to day ?60 of the
ERA-I vertical wind component
(hPa s-1) averaged over
10�E–30�E/25�N–35�N (greenline), of dry air intrusions over
the Guinean region
(10�W–10�E/5�N–10�N; solidblack line) and of dry air
intrusions over the Sahel
(10�W–10�E/10�N–15�N;
dashed black line) expressed in
% of the coverage area.
Significant values at the 95%
confidence level are denoted by
circles
E. Flaounas et al.: The role of the Indian monsoon onset in the West African monsoon onset
123

4.2 Lower troposphere response to the IS monsoon
onset over West Africa
In the previous section, the weakening of convection dur-
ing the transitional phase of the WAM onset has been
associated with the dry air intrusions over West Africa.
However, in order to get a complete view of the mecha-
nism associated with the IS monsoon onset, we examine
the low-level circulation evolution over West Africa during
the transitional period. Figure 13a, b show the composite
fields sequence of deseasonalized integrated moisture flux
from the surface to 800 hPa, deseasonalized and desea-
sonalized negative values of mean sea level pressure for
ERA-I and LMDz.
During the transitional phase (from day ?13 to day
?21), the negative pressure anomalies along the Sahel are
reinforced and propagate westwards. As a result, moisture
transport towards the northeast increases with its maximum
propagating in phase with the negative pressure anomalies.
Furthermore, the humidity flux is convergent over the
Fig. 13 a ERA-I composite anomalies from day ?13 to day ?21 of
integrated humidity flux from the surface to 800 hPa (module in
colour and flux in vectors) and negative mean sea level pressure (hPa;
contour). b As in a but for LMDz. Only vectors of the integrated
humidity flux significant at the 95% confidence level are plotted. Data
are smoothed with a 5-day moving average
E. Flaounas et al.: The role of the Indian monsoon onset in the West African monsoon onset
123

Sahel and divergent over the coast of Guinea. This mois-
ture flux divergence maximum is consistently coincidental
with the minimum of precipitation on day ?15. Over the
Sahel, moisture flux convergence does not lead to rainfall
increase, probably due to the maximum phase of dry air
intrusions aloft. After the transitional phase (not shown) of
the WAM onset (from day ?21 to day ?30), the pressure
deseasonalized anomalies are weaker all over West Africa
and moisture transports are not well organized on the south
(not shown). Then, we suggest that the intraseasonal rain-
fall increase over West Africa is mainly due to the drastic
weakening of dry air intrusions observed both over the
Sahel and the Guinean coast. After that time (day ?30) the
seasonal cycle forcing maintains the ITCZ over the Sahel
up to the end of the summer WAM season.
The LMDz simulations (Fig. 13b) do not show very
similar mean sea level pressure anomalies at the regional
scale and these anomalies are rather weaker. However over
West Africa the moisture transports and its divergence/
convergence patterns are in agreement with the observa-
tions. Moreover, the westward propagation of the maxi-
mum of humidity flux is much clearer and in phase with the
negative anomalies of mean sea level pressure over the
Sahel. The clear signal in LMDz is likely due to to the
limited influence of regional dynamics.
5 Conclusion and discussion
In this study, the impact of the Indian onset on the West
African monsoon onset and the related teleconnection
mechanism were investigated over the 20 years
1989–2008, by using ERA-I observations and an ensemble
of 10 LMDz simulations nudged over the Indian sector.
The composite fields of several atmospheric variables were
reconstructed, based on the dates of the Indian monsoon
onset of each year. These dates were based on the first
principal component of the 925 hPa geopotential height
fields which displays a pattern covering the Indian-African
domain. The variables used for the composite analysis were
first deseasonalized in order to reveal their climate anom-
alies respect to the mean seasonal cycle of the Indian and
African monsoons. Three periods have been distinguished:
Pre-transitional phase (day -10 to day ?10): The Indian
monsoon onset is taking place on the climatological date of
June 10th with a standard deviation of 6 days. Ten days
prior to this climatological date, deep convection propa-
gates towards the north with two distinctive centers over
the Arabic sea and over the Bay of Bengal. Then deep
convection is installed over India on the latitudes 15�N–
20�N imposing low pressures all over southwest Asia. This
signal presents a periodicity of 40 days and in 12 out of the
20 years the Indian monsoon onsets are associated with
strong MJO events with a consistent phase timing. During
that period, a westward Gill-type baroclinic Rossby wave is
released between 20�N and 30�N. Over West Africa, the
moisture flux anomalies are becoming progressively
divergent over the Guinean coast in accordance with the
rainfall decrease. This is also associated with anomalies of
cooling waters in the gulf of Guinea (not shown).
Transitional phase (day ?10 to day ?20): Ten days after
the Indian monsoon onset, the induced Gill-type Rossby
wave reaches Saudi Arabia and extends westward. This
wave pattern induces a zonal gradient of atmospheric
pressure anomalies around 300 hPa over eastern Mediter-
ranean. These anomalies enhance subsidence of high tro-
pospheric air masses which are then redirected
equatorwards due to a dynamical PV barrier. As a result,
dry air is invading the Sahel and the Guinean coast
approximately at the level of 500 hPa. These intrusions
suppress convection over the Guinean coast most probably
due to an inversion of temperature within middle
troposphere.
In lower levels, the wave imposes negative pressure
anomalies over the Sahel, accelerating the zonal compo-
nent of the WAM. Moisture flux increases over the Sahel
and diverges over the Guinean coast. According to both
dynamic forcings in the middle and lower troposphere,
convection is weakened over the Guinean coast and
inhibited over the Sahel due to the dry air intrusions.
Post-transitional phase (day ?20 to day ?30): The wave
is displaced towards the west and the zonal gradient of
atmospheric pressure anomalies is reversed. As a result,
subsidence over the Mediterranean is disfavored and dry
air intrusions are decreased. Atmospheric instability is
released over the Sahel where thermodynamic conditions
are more favorable for deep convection and precipitation
increases. After day ?30 the seasonal cycle forcing
maintains the ITCZ over the Sahel up to the end of the
summer African monsoon season.
The above mechanism was confirmed by the LMDz
simulations. The response of the West African monsoon to
the Indian monsoon forcing is significant in terms of OLR
and precipitation anomalies from day ?10 to day ?30, as it
is in the ERA-I data, while anomalies are also consistent
before day?10. Hence the Indian monsoon controls
significantly the transitional and the post-transitional
phases of the African monsoon onset. Flaounas et al.
(2011) have shown on the case study of the 2006 African
monsoon onset, the occurrence of a similar synoptic scale
scenario over North Africa and the Mediterranean, and
suggested the hypothesis of a connection with the Indian
monsoon onset. Figure 7 highlights the occurrence of the
strong MJO event in 2006 linking the Indian and the
E. Flaounas et al.: The role of the Indian monsoon onset in the West African monsoon onset
123

African monsoons onsets and confirms the hypothesis
raised in Janicot et al. (2008) for this year. Some other
issues are discussed below.
Our results are consistent with those of Camberlin et al.
(2010). They studied the climate adjustments over Africa
accompanying the Indian monsoon onset. They used the
dates of the Indian monsoon onset over Kerala (10�N) as
defined by Pai and Nair (2009) as reference in order to do a
climatological study based on composite of observational
fields. They showed that convection is weakened over West
Africa 10–20 days (depending of the variable they chose)
after the Indian monsoon onset and they also suggested the
MJO and associated westward Rossby wave propagation as
a factor for this connection. However, their results appear
less significant than ours over West Africa, most probably
due to the different dates used for the Indian monsoon
onset. Besides large-scale monsoon dynamics, these dates
incorporate some regional-scale signals (specific to the IS)
in contrast to the index defined here which is strongly
associated but not strictly equivalent to the monsoon onset.
According to Pai and Nair (2009), the climatological date
of the Indian monsoon onset for the 20 year climatology
used in this paper is June 3rd with a standard deviation of
6 days, i.e. a lag of a week with our dates presented in
Table 1. But out criteria detects Indian onset dates when
the rain belt is located north of Kerala, around 20�N. This
lag is consistent with the northward propagation speed of
the IS monsoon onset over central India, and also with the
lag that we pointed out associated with the African
monsoon onset. However, for several years, the IS
monsoon onset over 20�N did not follow the onset over
Kerala as in climatology. In consequence, for 3 years
(1990, 1999, 2006) we found approximately a 20 days later
monsoon onset over 20�N than over Kerala.
At the regional scale, the Saharan heat low has ben
involved specifically in the West African monsoon onset
(see Sect. 1). Lavaysse et al. (2009) defined this low as the
geopotential height thickness between 925 and 700 hPa,
i.e. the increase of mean atmospheric temperature between
these two layers. They found June 20th as this low onset
climatological date. The results of our study come in
accordance. During the transitional period, the passage of
the Rossby wave over the Mediterranean sea imposes
negative (positive) geopotential anomalies at 925 hPa
(700 hPa) over north Africa. These anomalies propagate
in phase with the wave and reach the Saharan heat low
favourite location on day ?9 to day ?13, i.e. on June 19th
to June 23rd.
However of course not all the West African monsoon
dynamics is controlled by the Indian monsoon whereas it
appears to exert a strong control. We showed that the only
time when the LMDz simulations fields are not very close
to the observations is on the low level composite fields
(Fig, 13a, b). That means that local surface conditions play
a role in this monsoon onset, and especially the develop-
ment of the cold oceanic tongue in the gulf of Guinea
which may impact the African monsoon onset (Brandt
et al. 2010). On a larger scale, Chauvin et al. (2010)
identified an east–west mode of intraseasonal variability of
the Saharan heat low, connected to a specific Rossby wave
pattern over North Africa, southern Europe and the
Mediterranean which shows some resemblance with our
pattern. They indicate that the western phase of this mode
is very similar to the atmospheric pattern associated with
the dry air intrusions detected in 1992 by Roca et al.
(2005). It appears also close to the meteorological condi-
tions associated with cold surges from the Mediterranean
identified by Vizy and Cook (2009) which modulates
convection over the Sahel through a westward propagating
signal. These issues deserve more investigation.
The criteria that we have chosen, based on the first
principal component of the 925 hPa geopotential height
fields, enables to monitor the evolution of an atmospheric
pattern which is linked both with the Indian and the West
African monsoon onsets. It can be updated every day by
simply projecting the geopotential field of the day onto the
first eigenvector, providing an operational monitoring of
the Indian monsoon onset and some predictability at about
a 15-day range of the African monsoon. Forecasted
925 hPa geopotential height fields provided by meteoro-
logical centers like ECMWF can also be used in this
context. However the link between this criteria and
convection variability over India is not always tight year
by year, and the transition from negative to positive values
of the principal component, used to define our date of
reference day 0, does not always display a steep slope. In
any way we have shown that the Indian monsoon
variability and especially its onset is definitely instrumental
in the predictability of the African monsoon.
Acknowledgments The authors are grateful to Laurent Li (LMD)
for making available his LMDz nudged simulations and to Helene
Brogniez (LATMOS) for providing the data on the back-trajectories.
We are also thankful to the Climate Diagnostics Center (NOAA,
Boulder, CO) and to the NCEP for the OLR data. Based on French
initiative, AMMA was built by an international scientific group and is
currently funded by a large number of agencies, especially from
France, UK, US and Africa. It has been the beneficiary of a major
financial contribution from the European Community’s Sixth
Framework Research Programme. Detailed information on scientific
coordination and funding is available on the AMMA International
website http://www.amma-international.org.
References
Brandt P, Caniaux G, Bourles B, Lazar A, Dengler M, Funk A,
Hormann V, Giordani H, Marin F (2010) Equatorial upper-ocean
dynamics and their interaction with the West African monsoon.
Atmos Sci Lett (Special issue on AMMA, submitted)
E. Flaounas et al.: The role of the Indian monsoon onset in the West African monsoon onset
123

Camberlin P, Fontaine B, Louvet S, Oettli P, Valimba P (2010)
Climate adjustments over Africa accompanying the Indian
Monsoon onset. J Clim 23(8):2047–2064
Chauvin F, Roehrig R, Lafore JP (2010) Intraseasonal variability of
the Saharan heat low and its link with midlatitudes. J Clim
23:2544–2561
De Coetlogon G, Janicot S, Lazar A (2010) Intraseasonal variability
of the ocean-atmosphere coupling in the Gulf of Guinea during
boreal spring and summer. Q J R Meteor Soc. doi:10.1002/qj.554
Dee DP, Uppala S (2009) Variational bias correction of satellite
radiance data in the ERA-Interim reanalysis. QJR Meteorol Soc
135:1830–1841
Flaounas E, Janicot S, Bastin S, Roca R (2011) The West African
Monsoon onset in 2006: sensitivity to surface albedo, orography,
SST and synoptic scale dry-air intrusions using WRF. In revision
to Climate Dynamics
Flatau MK, Flatau PJ, Rudnick D (2001) The dynamics of double
monsoon onsets. J Clim 14:4130–4146
Hagos SM, Cook KH (2007) Dynamics of the West African monsoon
jump. J Clim 20:5264–5284
Hourdin F, Musat I, Bony S, Braconnot P, Codron F, Dufresne JL,
Fairhead L, Filiberti MA, Friedlingstein P, Grandpeix JY,
Krinner G, LeVan P, Li ZX, Lott F (2006) The LMDZ4 general
circulation model: climate performance and sensitivity to
parametrized physics with emphasis on tropical convection.
Clim Dyn 27:787–813
Huffman GJ, Adler RF, Morrissey MM, Curtis S, Joyce R, McGavock
B, Susskind J (2000) Global precipitation at 1 degree daily
resolution from multi-satellite observations. J Hydrometeorol
2:36–50
Janicot S, Sultan B (2001) Intra-seasonal modulation of convection in
the West African monsoon. Geophys Res Lett 28:523–526
Janicot S, Thorncroft C et al (2008) Large scale overview of the
summer monsoon over the summer monsoon in West Africa
during the AMMA field experiment in 2006. Ann Geophys
26:2569–2595
Janicot S, Mounier F, Hall NMJ, Leroux S, Sultan B, Kiladis GN
(2009) Dynamics of the West African Monsoon. Part IV:
analysis of 25–90-day variability of convection and the role of
the Indian monsoon. J Clim 22:1541–1565
Lavaysse C, Flamant C, Janicot S, Parker DJ, Lafore JP, Sultan B,
Pelon J (2009) Seasonal evolution of the West African heat low:
a climatological perspective. Clim Dyn. doi:10.1007/s00382-
009-0553-4
Lavender SL, Matthews AJ (2009) Response of the West African
monsoon to the Madden-Julian Oscillation. J Clim 11:4097–4116
Liebmann B, Smith C (1996) Description of a complete (interpolated)
outgoing longwave radiation dataset. Bull Am Meteor Soc
106:1275–1277
Madden RA, Julian PR (1994) Observations of the 40–50 tropical
oscillation–a review. Mon Weather Rev 122:814–837
Maloney ED, Shaman J (2008) Intraseasonal variability of the West
African monsoon and Atlantic ITCZ. J Clim 21:2898–2918
Matthews AJ (2004) Intraseasonal variability over tropical Africa
during northern summer. J Clim 17:2427–2440
Mohino E, Janicot S, Douville H, Li L (2011) Impact of summer MJO
on West Africa using nudged climate simulations. In revision to
Climate Dynamics
Okumura Y, Xie SP (2004) Interaction of the Atlantic equatorial cold
tongue and the African monsoon. J Clim 17:3589–3602
Pai DS, Nair RM (2009) Summer monsoon onset over Kerala: New
definition and prediction. J Earth Syst Sci 118:123–135
Pierrehumbert RT, Roca R (1998) Evidence for control of Atlantic
subtropical humidity by large scale advection. Geophys Res Lett
25:4537–4540
Pohl B, Janicot S, Fontaine B, Marteau R (2009) Implication of the
Madden-Julian oscillation in the 40-day variability of the West
African Monsoon. J Clim 22:3769–3785
Ramel R, Gallee H, Messager C (2006) On the northward shift of the
West African monsoon. Clim Dyn 26. doi:10.1007/s00,382–
005–0093–5
Roca R, Lafore JP, Piriou C, Redelsperger JL (2005) Extratropical
dry-air intrusions into the West African monsoon midtropo-
sphere: an important factor for the convective activity over the
Sahel. J Atmos Sci 62:390–407
Rodwell MJ, Hoskins BJ (1996) Monsoons and the dynamics of
deserts. Q J R Met Soc 122:1385–1404
Rodwell MJ, Hoskins BJ (2001) Subtropical anticyclones and summer
monsoons. J Clim 14:3192–3211
Sijikumar S, Roucou P, Fontaine B (2006) Monsoon onset over
Sudan-Sahel: simulation by the regional scale model MM5.
Geophys Res Lett 33:L03814. doi:10.1029/2005GL024819
Sultan B, Janicot S (2000) Abrupt shift of the ITCZ over West Africa
and intra-seasonal variability. Geophys Res Lett 27:3353–3356
Sultan B, Janicot S (2003) The West African monsoon dynamics. Part
II: the ‘‘preonset’’ and ‘‘onset’’ of the summer monsoon. J Clim
16:3389–3406
Vizy EK, Cook KH (2009) A mechanism for African monsoon
breaks: mediterranean cold air surges. J Geophys Res 114:
D01104. doi:10.1029/2008JD010654
E. Flaounas et al.: The role of the Indian monsoon onset in the West African monsoon onset
123