
Small Screen in the Indian Subcontinent - Media Watch Journal
Upload
independentCategory
view
0download
0
Precipitation Recycling in the Indian Subcontinent during Summer Monsoon
AMEY PATHAK
Department of Civil Engineering, Indian Institute of Technology Bombay, Mumbai, India
SUBIMAL GHOSH
Department of Civil Engineering, and Interdisciplinary Program in Climate Studies, Indian Institute of
Technology Bombay, Mumbai, India
PRAVEEN KUMAR
Civil and Environmental Engineering, University of Illinois at Urbana–Champaign, Urbana, Illinois
(Manuscript received 24 October 2013, in final form 13 June 2014)
ABSTRACT
The Indian summer monsoon rainfall is dominated by oceanic sources of moisture. However, land surface
processes also have a significant role in the generation of precipitation within the Indian subcontinent.
Evapotranspiration over a region supplies moisture to the atmosphere, which may lead to precipitation in the
same region. This is known as recycled precipitation. The role of evapotranspiration as an additional source of
moisture to precipitation has been investigated in earlier studies at continental scales; however, the amount of
monsoon precipitation generated from evapotranspiration has not been quantified at the daily scale for the
Indian subcontinent. To examine the role of land surface hydrology in regional precipitation and to quantify
recycled precipitation, the dynamic recycling model at a daily scale with NCEP Climate Forecast System
Reanalysis (CFSR) data for the period of 1980–2010 is used. A high precipitation recycling ratio, that is, the
ratio of recycled precipitation to total precipitation, is found at the end of the monsoon (September). As the
monsoon progresses in India, enhanced soil moisture and vegetation cover lead to increased evapotranspiration
and recycled precipitation. The recycling ratio is highest (around 25%) in northeastern India, which has high
vegetation cover leading to high evapotranspiration. Recycled precipitation over central and northeastern India
in September is responsible for delaying the withdrawal of the summer monsoon over these regions. A trend
analysis of recycled precipitation shows a statistically significant decreasing trend in northeastern India.
1. Introduction
The Indian summer monsoon rainfall (ISMR) during
June–September (JJAS) is part of the Asian monsoon
(Rajeevan et al. 2010) and is the major source of annual
precipitation over the Indian subcontinent. A large
population relying on agriculture is highly dependent on
the seasonal characteristics of ISMR. Though ISMR is
dominated by an oceanic source, evapotranspiration
from terrestrial sources is also an important contributor
to precipitation. The development of low pressure over
subcontinental land during premonsoon months (i.e.,
April and May), owing to the land–sea thermal con-
trast between Indian land regions and the Indian
Ocean, results in advection of evaporated oceanic
moisture toward the Indian region (Krishnamurthy
and Kinter 2003). Although the land–sea thermal
contrast is one of the major mechanisms influencing
summer monsoon precipitation characteristics, several
land surface processes, such as soil moisture, evapo-
transpiration, and topography and land use, are also
associated with seasonal monsoon precipitation dy-
namics (Meehl 1994; Yasunari 2007; Bellon 2010; Saha
et al. 2012). The spatial and temporal variability of
rainfall is often regulated by the strength of land sur-
face feedbacks (Shukla and Mintz 1982; Yasunari
2007). For example, evapotranspiration over a region
provides additional moisture to the atmosphere, which
leads to precipitation in the same region, and this is
Corresponding author address: Subimal Ghosh, Department of
Civil Engineering, Indian Institute of Technology Bombay,Mumbai
400 076, India.
E-mail: [email protected]
2050 JOURNAL OF HYDROMETEOROLOGY VOLUME 15
DOI: 10.1175/JHM-D-13-0172.1
� 2014 American Meteorological Society

known as recycled precipitation. Significant variations
in the strength of these feedbacks through evapo-
transpiration can affect regional precipitation charac-
teristics during the monsoon season. Therefore,
understanding and modeling of the feedback processes
from the land surface to the atmosphere are of major
importance for the study of any regional climate system.
Here, we model precipitation recycling in the Indian
subcontinent during a monsoon to understand the
feedback processes with the land surface and their
strength and variability.
Land surface interacts with the adjoining atmosphere
by exchanging energy,mass, andmomentum (Dominguez
and Kumar 2008), and this significantly affects the
characteristics of regional climate system (Dirmeyer and
Shukla 1993; Higgins and Gochis 2007;Watts et al. 2007).
Moreover, recent studies (Wang 2006, and references
therein; Yasunari 2007; Bellon 2010; Saha et al. 2012)
have also revealed that the geophysical processes asso-
ciated with ISMR originate from land, ocean, and
atmospheric interactions. Unlike ocean–atmosphere
interactions through sea surface temperature (SST) var-
iations, the role of land–atmosphere interaction in ISMR
at the regional scale has not been extensively investigated
and quantified.
To get a holistic view of the regional precipitation
process during summer monsoon, the quantification of
precipitation generated by local evapotranspiration is
required. The impact of precipitation recycling on total
precipitation has been identified through a variety of
approaches using analytical models that are derived
from the principle of conservation of atmospheric wa-
ter vapor (Budyko 1974; Lettau et al. 1979; Brubaker
et al. 1993; Eltahir and Bras 1996; Burde and Zangvil
2001; Dominguez et al. 2006). Eltahir and Bras (1996)
studied the potential impacts of local land surface
processes on the regional water cycle over the Amazon
basin. The study explained that the amount of precipitable
water contained in the atmospheric control volume over
any particular land region is mainly composed of two
components: (i) the advected component that includes
both oceanic as well as remote terrestrial sources and (ii)
the internal component that includes local terrestrial
sources. The partitioning of precipitable water, based on
geographic locations of their evaporative sources, can
give detailed information about the role of local land
surface characteristics in regional precipitation (Eltahir
and Bras 1994).
In the context of ISMR, literature shows the possi-
bility of impacts of land surface hydrology on ISMR
through feedback mechanisms (Meehl 1994; Yasunari
2007; Asharaf et al. 2011; Tuinenburg et al. 2012; Saha
et al. 2012). Bosilovich and Schubert (2002) identified
local and remote sources of moisture used in summer
monsoon precipitation over North America and India
by implementing three-dimensional water vapor tracers
(WVTs) in general circulation model (GCM) simula-
tions. It was observed that the southern and western
Indian Ocean significantly contribute to the monsoon
precipitation over the Indian subcontinent, with the
highest amount in June and lowest amount in August.
Gimeno et al. (2010) used a three-dimensional Lagrang-
ian transport model, Flexible Particle Dispersion Model
(FLEXPART; Stohl and James 2004, 2005), to identify
the oceanic moisture sources for the continental pre-
cipitation. Six different oceanic sources (i.e., Indian
Ocean, Arabian Sea, Zanzibar Current, Agulhas Cur-
rent, tropical SouthAfrica, andRed Sea) were identified
for the Indian monsoon rainfall during June–August
(JJA). Gimeno et al. (2012) studied the oceanic and
terrestrial sources of continental precipitation. The au-
thors investigated the source and sink regions of atmo-
spheric water vapor using an analytical box model,
numerical water vapor tracers, and isotopes. Different
terrestrial and oceanic regions across the globe were
identified as sources or sinks. The source of water vapor
for monsoon precipitation over the Indian subcontinent
is mainly from local recycling over the continent and
moisture inflow from neighboring oceanic sources.
However, the impact of local terrestrial sources is ob-
served to be less as compared to the oceanic sources.
Van der Ent et al. (2010) used a water accounting model
to study the importance of terrestrial evaporation
through moisture recycling. The study demonstrated
the importance of terrestrial moisture sources (i.e.,
continental evaporation) in the monsoon precipitation,
with a maximum continental moisture recycling ratio
(;20%–40%), which is observed during July. Tuinenburg
et al. (2012) studied the moisture recycling for the
Ganges River basin using the Interim European Centre
for Medium-Range Weather Forecasts (ECMWF) Re-
Analysis (ERA-Interim) data corresponding to the
period of 1990–2009. A moisture recycling ratio of al-
most 5% was observed during the monsoon season for
this basin. Asharaf et al. (2011) performed a perturbation-
based simulation using the Consortium for Small-Scale
Modelling in Climate Mode (COSMO-CLM), where
a nonhydrostatic regional climatemodel was forced with
ERA-Interim data to investigate the soil moisture–
precipitation feedback over the Indian region. Both
positive and negative feedbacks were observed during
the summer monsoon period. The existence of a domi-
nant negative feedback mechanism over western and
northern regions was the most important conclusion of
their study. The study was based on numerical experi-
ments of atmospheric circulations under simulated
OCTOBER 2014 PATHAK ET AL . 2051
conditions with or without perturbation of soil moisture
and evaporation from land surface. The quantification of
the feedbacks of land surface processes on ISMR at daily
time scales was not addressed by that study.
Themain objective of the present work is to investigate
and quantify the role of precipitation recycling in ISMR
and the associated intraseasonal rainfall variability.
ISMR has huge variability in both spatial and temporal
scales (Gadgil and Joseph 2003; Krishnamurthy and
Shukla 2007; Rajeevan et al. 2010). The subseasonal
rainfall variability during themonsoon is associated with
active (wet spell) and break (dry spell) phases with a
duration of about 3–8 days (Lawrence and Webster
2001; Gadgil 2003; Rajeevan et al. 2010). The changes in
land surface energy exchanges during these periods can
induce significant variability in the monsoon rainfall
characteristics over a region. Hence, the time scale to be
used for recycling studies of ISMR should be shorter
than a week. Most of the earlier recycling models (e.g.,
Budyko 1974; Brubaker et al. 1993; Eltahir and Bras
1994) are based on the common assumption that the
change in the storage of atmospheric water vapor is
small and hence can be neglected. This assumption is
valid for monthly or longer time scales, and this restricts
the applicability of these models to a shorter time scale
such as daily or weekly. The importance of moisture
storage at the daily scale in precipitation recycling anal-
ysis was addressed by Dominguez et al. (2006) through
the development of a dynamic recycling model (DRM).
This approach facilitated the recycling analysis at various
time scales ranging from daily to seasonal. The dynamic
recycling model is derived from the equation of conser-
vation of atmospheric water vapor with the assumption of
a well-mixed atmosphere. The dynamic recycling model
is a simple and computationally efficient approach for
analyzing the potential impact of regional evapotranspi-
ration on regional precipitation. The model is best suited
for the present study analyzing daily recycled pre-
cipitation for Indian monsoon. Here, we use DRM at
a spatial resolution of 0.58 3 0.58 and daily temporal
resolution. The dataset from the National Centers for
Environmental Prediction (NCEP) Climate Forecast
System Reanalysis (CFSR; Saha et al. 2010) corre-
sponding to the period of 1980–2010 is used in the present
study. The entire area of Indian subcontinent is first
subdivided into 11 different rectangular zones (Fig. 1) to
study the proportion of the precipitation within each
zone, originating from the evapotranspiration of the same
zone. The analysis is performed at the daily scale for
JJAS. The analysis is also performed considering the
subcontinent as one region to study the impacts of the
entire subcontinental land evapotranspiration on ISMR.
Trends and intraseasonal variations of the computed
recycled precipitation are studied to understand their
association with the temporal variability of ISMR.
This paper is organized as follows. Section 2 provides
detailed information about the datasets used in the
present study and illustrates a detailed methodology of
dynamic recycling model used for ISMR. Section 3 dis-
cusses the important results obtained from this analysis.
Finally, a summary and the conclusions of the major
results of this study are presented in section 4.
2. Data and methodology
a. CFSR
The Indian subcontinent has large topographic and
climatic variations with six different climate subtypes
(Peel et al. 2007). Monsoon precipitation characteristics
over India show significant spatial and temporal vari-
ability (Gadgil 2003). A high-resolution reanalysis data-
set is thus required to study the impacts of land surface
feedbacks on regional precipitation. In the present
analysis, we use NCEP CFSR, version ds093.0, for the
time period 1980–2010 at 0.58 3 0.58 spatial resolution.The spatial resolution of other reanalysis data, such as
NCEP reanalysis (2.58 3 2.58), 15-yr ECMWF Re-
Analysis (ERA-15; T106, 2.58 3 2.58), 40-yr ECMWF
Re-Analysis (ERA-40; 1.1258 3 1.1258 and 2.58 3 2.58),Japanese 25-year Reanalysis Project (JRA-25; 1.1258 31.1258 and 2.58 3 2.58), and National Aeronautics and
Space Administration (NASA) Modern-Era Retrospec-
tive Analysis for Research and Applications (MERRA;
0.58 3 0.6678), are coarse (Dee et al. 2014), and hence, we
do not use them for the present study. CFSR is a third-
generation reanalysis product that provides the best es-
timate of the land–ocean–atmosphere coupled domain at
high resolution and for a long duration (Saha et al. 2010).
The CFSR atmospheric model considers observed var-
iations in carbon dioxide (CO2), together with changes
in aerosols, other trace gases, and solar variations. The
model also considers inputs from all available conven-
tional and satellite observations. The output data from
the Noah land surface model in terms of mean vegeta-
tion percentage and vegetation type are also included in
NCEP CFSR. The dataset is available at 6-hourly,
monthly, and selected hourly time scales. Table 1 shows
the detailed description of NCEP CFSR variables used
in the study. We consider precipitation and evapo-
transpiration at the surface level. Zonal and meridional
wind and specific humidity are vertically integrated at
1000–300mb pressure levels. The 6-hourly CFSR data
are averaged to daily mean values and are used at 0.58 30.58 spatial resolutions. The variables that are not at 0.58 30.58 spatial resolutions are brought to this resolution
using bilinear interpolation.
2052 JOURNAL OF HYDROMETEOROLOGY VOLUME 15

b. Study area
We first subdivide the Indian subcontinent study re-
gion into 11 different rectangular boxes (hereafter re-
ferred as zones), as presented in Fig. 1.These 11 zones
are different from the regions specified by the Indian
Meteorological Department (IMD) or global climatic
zones based on latitudes. We keep areas of all the zones
nearly the same to avoid the impact of the size of the
area on the estimation of recycling ratio (Dominguez
et al. 2006). Since the Indian subcontinent has a long
coastline, the zones are created in such a way that each
of the zones cover maximum land area and retain uni-
form climate properties to the maximum extent possi-
ble. Table 2 shows the percentage area of different
climate subtypes, as specified by IMD, under each zone.
We also apply the same recycling model separately by
considering the entire subcontinent as one zone.
c. Precipitation recycling
The total amount of water vapor present in a zone’s
atmospheric column (i.e., precipitable water) has two
sources: advective water vapor from a different zone and
evapotranspiration from the same zone. The total pre-
cipitation P is the sum of advective Pa and recycled Pr
components of water vapor:
P5Pa1Pr . (1)
The locally evaporated and advective water vapors are
assumed to be well mixed in the atmospheric column,
and therefore,
TABLE 1. Description of NCEP CFSR data used in the present
study.
Variable Notation Source Units
Evapotranspiration E NCEP CFSR mm
Total precipitation P NCEP CFSR mmday21
Specific humidity q NCEP CFSR kgkg21
Precipitable water w NCEP CFSR kgm22
Zonal component
of wind
u NCEP CFSR ms21
Meridional component
of wind
y NCEP CFSR ms21
FIG. 1. Zonation of India for modeling precipitation recycling. The Indian subcontinent is di-
vided into 11 equal-sized zones in such a way that each zone covers the max land region. Zones 6
and 7 cover the northeastern part,whereas zone 3 covers the northwestern part of the subcontinent.
OCTOBER 2014 PATHAK ET AL . 2053

Pr
Pa
5locally evaporated water vapor
advective water vapor. (2)
Figure 2 illustrates various fluxes associated with pre-
cipitation processes in a region. The upward evaporative
flux is represented by E. The precipitation over the re-
gion is composed of recycled and advective pre-
cipitation. The inflow and outflow of advective moisture
is represented by Fin and Fout, respectively.
The relative contributions of advective and recycled
water vapor to precipitation depend on the location,
season, and size of the zone (or region) considered. The
local recycling ratio denoted by Rl is given by ratio of
recycled precipitation to the total precipitation at
a particular grid (here, the CFSR grids with spatial res-
olution 0.58 3 0.58). For instance, in a uniformly spaced
gridded zone (or region), the recycling ratio Rln in
a particular grid n is given as
Rln 5Prn
Pn
5wrn
wn
. (3)
Here, Pn and Prn are the total precipitation and recycled
precipitation, respectively. Following the grid-based
approach similar to Eltahir and Bras (1994), the regional
recycling ratio, a representative value of precipitation
recycling within a zone (composed of n 5 1, 2, . . . , N,
number of grids) of size [N(DA)] is given by
Rz 5Pr
P5
�N
n51
(RlnPnDA)
�N
n51
(PnDA)
. (4)
The time period during which water vapor stays in
a zone provides important information about the po-
tential role of precipitation recycling in the precipitation
TABLE 2. Percentage area under different climate subtypes for each zone [classification source: Peel et al. (2007)].
Zone
1 2 3 4 5 6 7 8 9 10 11
Land area (%) 100 100 95.02 100 100 97.29 100 52.49 91.9 38.01 46.15
Sea area (%) 0 0 4.98 0 0 2.71 0 47.51 8.14 61.99 53.85
1. Humid subtropical (Cwa) 5.88 10.4 0 31.221 74.67 27.6 33.48 0.9 8.14 6.33 2.71
2. Warm semiarid (BWh) 13.12 7.23 28.05 28.5 0 0 0 28.05 22.2 0 3.16
3. Tropical monsoon (Am) 0 0 0 0 0 6.78 10.4 5.88 0 0 6.33
4. Highland subtropical (CWb) 0 7.69 0 5.42 21.27 13.57 24.88 0 0 0 5.43
5. Warm desert (Bwk) 23.07 2.26 57.91 9.95 0 0 0 0 0 0 0
6. Warm Mediterranean (Csa) 0 2.71 4.52 0 0 0 0 0 0 0 0
7. Cold desert (Bwk) 19 50.22 0 0 0 3.62 3.16 0 0 0 0
8. Cold semiarid (Bsk) 24.89 0 0.45 0 0 7.7 3.16 0 0 0 0
9. Tropical savanna (Aw) 0 1.35 3.61 24.88 4.07 24.88 21.26 19.45 60.6 33.48 29.41
10. Cold dry region (Dwc) 0 0 0 0 0 4.52 0 0 0 0 0
11. Cold dry region (Dwb) 5.43 2.71 0 0 0 10.4 3.62 0 0 0 0
12. Polar tundra (ET) 0 0 0 0 0 0 0 0 0 0 0
13. Cool continental (Dsc) 8.6 15.38 0 0 0 0 0 0 0 0 0
TABLE 3. A list of derived variables with their derivation equation. [See model derivation in Dominguez et al. (2006) for detailed
explanation.]
Variable Notation Equation
Moisture-weighted zonal flux:
moisture-weighted vertically
integrated zonal wind.
um um 51
wgð ðp0
0
qbu dp1 ðp00
q0 bu0 dpÞMoisture-weighted meridional flux:
moisture-weighted vertically
integrated meridional wind.
ym ym 51
wgð ðp0
0
qby dp1 ðp00
q0 by0 dpÞLocal recycling ratio Rl Rl 5
Recycled precipitation at nth grid
Total precipitation at nth grid5 12 exp
�2
ðt0
�(x, j, t)
v(x, j, t)›t0
�
Regional recycling ratio Rz Rz 5Total recycled precipitation over zone
Total precipitation over zone5
�N
n5 1
(RlnpnDA)
�N
n5 1
(pnDA)
2054 JOURNAL OF HYDROMETEOROLOGY VOLUME 15

process. The length of this period is known as the
moisture residence time. We use a numerical scheme,
following the method used by Merrill et al. (1986), to
trace the path traversed by the water vapor within the
zone’s geographical boundary before precipitation.
d. Dynamic recycling model
The vertically integrated moisture balance equation
for total atmospheric water vapor as well as locally
evaporated water vapor are expressed as (Dominguez
et al. 2006)
›w
›t1
›(wum)
›x1
›(wym)
›y5E2P , (5)
›wr
›t1
›(wrum)
›x1
›(wrym)
›y5E2Pr, and (6)
w›Rl
›t1wum
›Rl
›x1wym
›Rl
›y5E(12Rl) . (7)
The amount of total water vapor and locally evaporated
water vapor present in the atmospheric column is rep-
resented by w and wr, respectively. The moisture-
weighted zonal and meridional winds are represented
by um and ym, respectively. The local recycling ratio at
a certain grid is estimated as
R(x, j, t)5 12 exp
�2
ðt0
�(x, j, t)
v(x, j, t)›t0
�. (8)
Here, �(x, j, t),v(x, j, t), and R(x, j, t) represent the
evapotranspiration, precipitable water, and local re-
cycling ratio in a grid. The regional recycling ratio Rz is
calculated for each zone by using Eq. (4). Table 3 shows
a list of derived variables with their derivation equation.
The recycling ratio expressed in Eq. (8) is analytically
derived and, hence, computationally efficient [see model
derivation in Dominguez et al. (2006) for detailed ex-
planation]. The recycling ratio increases with the increase
of moisture residence time over the region. The estimate
of local recycling ratio at any grid shows the precipitation
contribution of land evapotranspiration from the zone to
which the grid point belongs. The recycling ratio com-
puted with Eq. (8) is used to assess the regional recycling
ratio and recycled precipitation [Eqs. (3) and (4)]. Here,
we calculate the recycling ratio for two cases, first by di-
viding the subcontinent into 11 different zones and
then by considering the entire Indian subcontinent as
one zone. The first case provides information about the
contribution of local/zonal evapotranspiration toward
precipitation, whereas the second case computes the
contribution of entire subcontinental evapotranspiration.
3. Results and discussion
Here, we present the variability of precipitation recy-
cling estimates and their impact on monsoon precipitation
for different months and zones. First, we discuss the
recycling estimates computed with DRM by considering
11 different zones that cover the Indian subcontinent.
a. Spatial and temporal variation of recycling
To study the spatial and temporal variability of recy-
cling estimates, the climatological mean of regional
recycled precipitation and regional recycling ratio for
different zones are presented in Fig. 3. Here, day 1
corresponds to 1 June, the first day of JJAS. The regional
recycled precipitation increases almost in all the zones
after the onset of the monsoon and decreases toward the
end of the monsoon because of the reduction of pre-
cipitable water in the atmosphere. We observe high re-
gional recycled precipitation in zones 5 (maximum
FIG. 2. Schematic representation of zonal atmospheric fluxes for a single zone. The area of
individual grid is represented by DA.
OCTOBER 2014 PATHAK ET AL . 2055
1.5mmday21), 6 (maximum 1.5mmday21), and 7 (max-
imum 2.5mmday21). The seasonal variation of regional
recycled precipitation in zone 7 is relatively low com-
pared to the other zones, indicating that the regional
source of moisture (i.e., local recycling) during monsoon
season in this zone is stable. High regional recycling ratios
are observed in zones 2, 5, 6, and 7 during JJAS. Higher
values of regional recycling ratio in zones 5 (maximum
0.2), 6 (maximum 0.16), and 7 (maximum 0.17) are due to
the strong land surface feedback through evapotranspi-
ration, whereas the same in zone 2 (maximum 0.25) is due
to low precipitable water. The regional recycling ratio
also increases aftermonsoon onset, with the highest value
during September.
To study the spatial variability of recycling estimates
across different zones, we compare them (Fig. 4) for
summermonsoonmonths.Wefindhigh spatial variability
of the recycling estimates, with the highest amount ob-
served in the northeastern part of the subcontinent and
the lowest amount in northwestern India. High values of
recycled precipitation in zones 6 and 7 (i.e., northeastern
India) indicate the possible influence of land surface
feedback on regional precipitation (Fig. 4). On the con-
trary, such dominant influence of precipitation recycling
is not observed in the remaining zones (Fig. 4). The
precipitation over the Western Ghats (zones 8 and 11),
which receives high monsoon rainfall throughout the
summer monsoon season, is also influenced by pre-
cipitation recycling, but this is not as prominent as in
northeastern India. This is probably because of the
proximity of these zones (i.e., zones 8 and 11) to the
Arabian Sea and the orography of Western Ghats.
Consistently high values of local recycling ratio (.0.15)
aswell as high recycled precipitation (;3mmday21; Fig. 4)
are observed over almost the entire northeastern zones
(zones 6 and 7) during JJAS. These results demonstrate
the influence of local land surface processes in regional
precipitation for these zones. Although the local re-
cycling ratios during September show higher values in
central (;0.15) as well as northern (;0.25) zones, the
amounts of recycled precipitation are comparatively low
in these zones (Fig. 4). Low recycled precipitation in
central India (zone 4) is due to the dominance of ad-
vection of locally evaporated water from other zones.
The northern zones (i.e., zones 1 and 2) receive rela-
tively low recycled precipitation (Fig. 4); however, the
recycling ratio is high because of low precipitable water
(Fig. 5), which is the denominator inEq. (8). The recycled
precipitation in the northwestern zone is very low, and
hence, the recycling ratio is also low. Even the low value
FIG. 3. Climatological mean of (top) recycled precipitation and (bottom) recycling ratio, over
different zones during JJAS. The peak of recycling ratios is observed during September.
2056 JOURNAL OF HYDROMETEOROLOGY VOLUME 15

of total precipitable water is not sufficient to improve the
ratio for this region. The overall high evapotranspiration
rate (Fig. 5) over northeastern India (zones 6 and 7), in
comparison to the other zones, during the entire summer
monsoon is responsible for high recycling.
The advective moisture from the oceanic sources is
responsible for the monsoon initiation, but the local
moisture through evapotranspiration may enhance the
total amount of precipitation. The peak of total pre-
cipitation is observed during July and August, followed
by a reduction in September. However, the local recy-
cling ratio shows a slightly different pattern of intra-
seasonal variations among different monsoon months
(Fig. 4). The local recycling ratio increases as monsoon
season progresses over the Indian subcontinent, with the
highest amount in September due to increased evapo-
transpiration (Fig. 5). The high recycling ratio (.0.10 in
Fig. 4) over most of the Indian region during September
indicates that local evapotranspiration is an important
factor in sustaining the monsoon. The relatively low
recycling ratio during June and July (when compared
with September) over the northeastern zone (Fig. 4) of
the Indian subcontinent is because of a stronger in-
fluence of oceanic sources with a high amount of ad-
vective moisture.
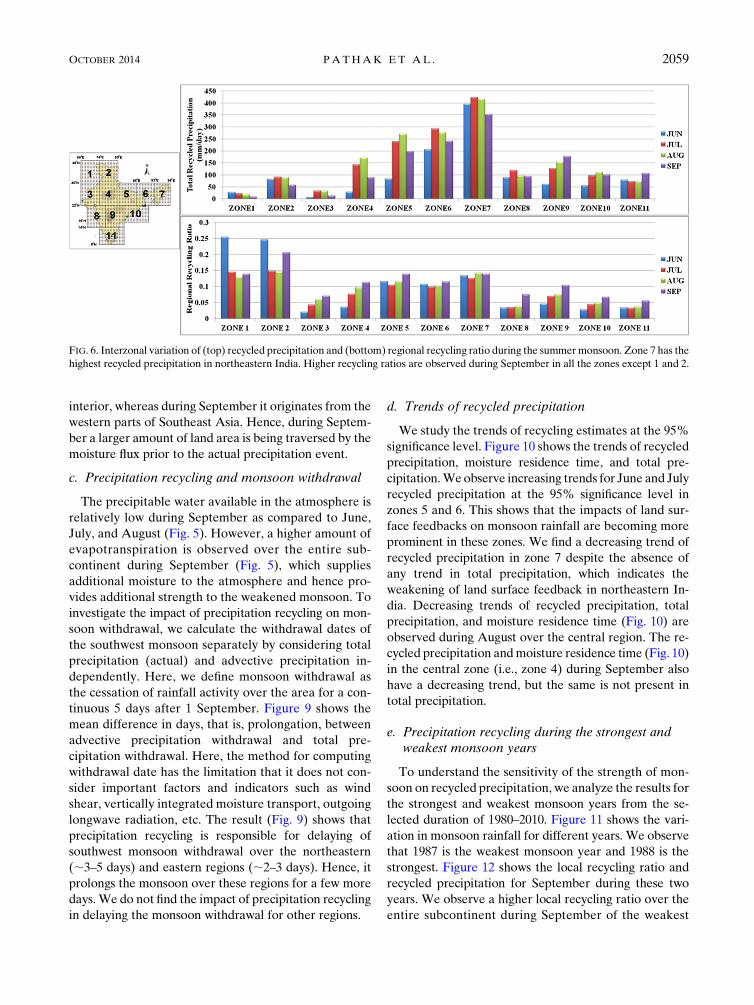
Figure 6 shows the estimates of regional recycled pre-
cipitation and recycling ratio in different zones for sum-
mer monsoon months. High values of regional recycled
precipitation (;200–400mmday21) as well as regional
recycling ratio (;10%–15%) are observed over zones 5–
7. The low recycling ratio over zones 8–11 (southwestern,
southeastern, and southern regions) are due to the
dominance of oceanic sources (Arabian Sea and Bay of
Bengal) of moisture in the precipitation process. The
total recycled precipitation over the western and north-
ern parts of the Indian subcontinent (i.e., zones 1–3) is
relatively low in comparison to the other zones (Fig. 6).
However, the recycling ratios are on the higher side.
The results for the interior of India, that is, zones 4–7,
do not fully represent the impacts of the entire sub-
continental evapotranspiration. The above-mentioned
results for a specific zone only show the impacts of
FIG. 4. (top) Recycled precipitation (mmday21), (middle) recycling ratio, and (bottom) total precipitation (mmday21) over different
zones during the summer monsoon months (JJAS).
OCTOBER 2014 PATHAK ET AL . 2057
evapotranspiration from the same zone and not the
evapotranspiration from the entire subcontinent. This
motivates us to applyDRMto the entire subcontinent as a
single zone.
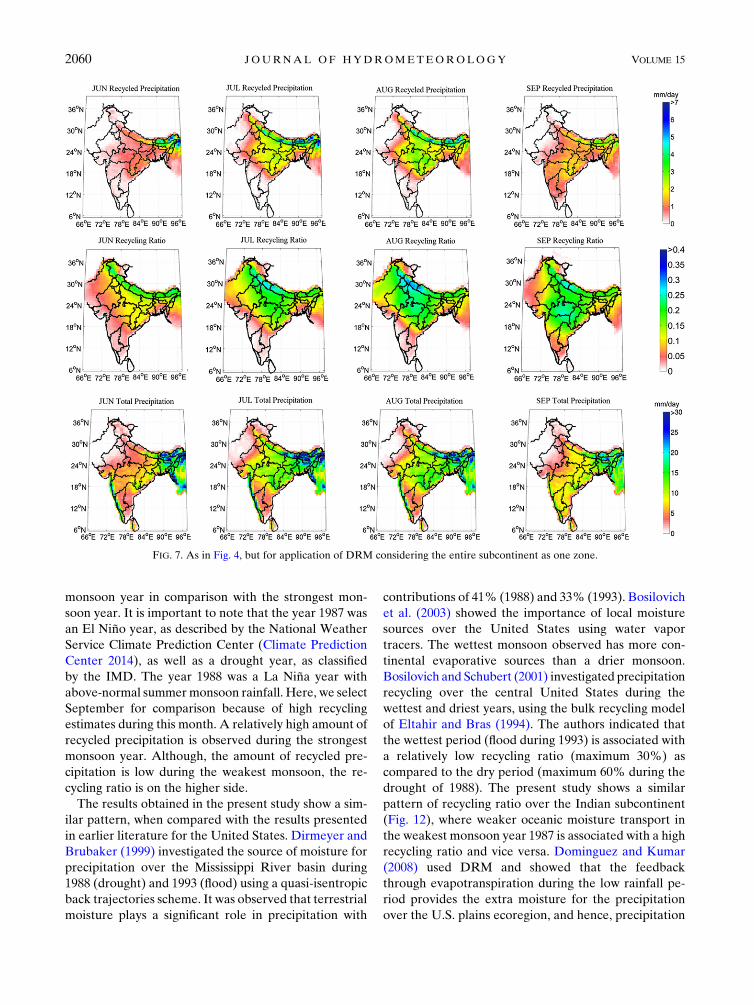
b. Impact of the subcontinent’s evapotranspiration onprecipitation recycling
The contribution of the entire subcontinent’s evapo-
transpiration to the monsoon precipitation is studied by
applying DRM and considering the entire subcontinent
as a single zone. The results are compared with those
obtained earlier that considered the entire subcontinent
as 11 different zones. We observe a similar pattern of
intraseasonal variability in recycled precipitation
amount, with an increase during the later half (August
and September) of the monsoon (Fig. 7). Overall, we
find a higher amount of recycled precipitation with this
present approach, specifically in central India and the
Gangetic Plain. However, significant differences are not
observed in northeastern India.
Analyzing the path followed by atmospheric moisture
(water vapor) prior to precipitation is important for
understanding the role of monsoon circulation on pre-
cipitation. Figure 8 shows the mean moisture flux vectors
during the monsoon season (i.e., JJAS) over the entire
subcontinent. The increased moisture circulation over
central India and the Gangetic Plain promotes the use of
water vapor from subcontinental evapotranspiration in
the precipitation process. This explains the occurrences of
high recycled precipitation over the Gangetic Plain dur-
ing August and September (Fig. 7). Small differences
between recycled precipitation in northeastern India
obtained from zonal (Fig. 4) and subcontinental (Fig. 7)
analyses suggest that the higher amount of moisture
resulting from evapotranspiration comes from the same
zone, which is not true for Gangetic Plain. For south-
western India, the source of moisture is theArabian Sea,
and hence, the recycled precipitation is very low. On the
western coast of India, low recycled precipitation and
high total precipitation result in a very low recycling
ratio. The direction of moisture flux vectors over north-
eastern India changes as the monsoon season progresses.
We find that during June and July, it originates from the
Bay of Bengal and propagates toward the continental
FIG. 5. (top) Evapotranspiration (mmday21), (middle) precipitable water (mm), and (bottom) moisture residence time (mmday21) in
the Indian subcontinent during summer monsoon months (JJAS). The overall high values of evapotranspiration over the northeastern
region during JJAS contribute to the higher recycling ratio over this region.
2058 JOURNAL OF HYDROMETEOROLOGY VOLUME 15
interior, whereas during September it originates from the
western parts of Southeast Asia. Hence, during Septem-
ber a larger amount of land area is being traversed by the
moisture flux prior to the actual precipitation event.
c. Precipitation recycling and monsoon withdrawal
The precipitable water available in the atmosphere is
relatively low during September as compared to June,
July, and August (Fig. 5). However, a higher amount of
evapotranspiration is observed over the entire sub-
continent during September (Fig. 5), which supplies
additional moisture to the atmosphere and hence pro-
vides additional strength to the weakened monsoon. To
investigate the impact of precipitation recycling on mon-
soon withdrawal, we calculate the withdrawal dates of
the southwest monsoon separately by considering total
precipitation (actual) and advective precipitation in-
dependently. Here, we define monsoon withdrawal as
the cessation of rainfall activity over the area for a con-
tinuous 5 days after 1 September. Figure 9 shows the
mean difference in days, that is, prolongation, between
advective precipitation withdrawal and total pre-
cipitation withdrawal. Here, the method for computing
withdrawal date has the limitation that it does not con-
sider important factors and indicators such as wind
shear, vertically integrated moisture transport, outgoing
longwave radiation, etc. The result (Fig. 9) shows that
precipitation recycling is responsible for delaying of
southwest monsoon withdrawal over the northeastern
(;3–5 days) and eastern regions (;2–3 days). Hence, it
prolongs the monsoon over these regions for a few more
days. We do not find the impact of precipitation recycling
in delaying the monsoon withdrawal for other regions.
d. Trends of recycled precipitation
We study the trends of recycling estimates at the 95%
significance level. Figure 10 shows the trends of recycled
precipitation, moisture residence time, and total pre-
cipitation.Weobserve increasing trends for June and July
recycled precipitation at the 95% significance level in
zones 5 and 6. This shows that the impacts of land sur-
face feedbacks on monsoon rainfall are becoming more
prominent in these zones. We find a decreasing trend of
recycled precipitation in zone 7 despite the absence of
any trend in total precipitation, which indicates the
weakening of land surface feedback in northeastern In-
dia. Decreasing trends of recycled precipitation, total
precipitation, and moisture residence time (Fig. 10) are
observed during August over the central region. The re-
cycled precipitation andmoisture residence time (Fig. 10)
in the central zone (i.e., zone 4) during September also
have a decreasing trend, but the same is not present in
total precipitation.
e. Precipitation recycling during the strongest andweakest monsoon years
To understand the sensitivity of the strength of mon-
soon on recycled precipitation, we analyze the results for
the strongest and weakest monsoon years from the se-
lected duration of 1980–2010. Figure 11 shows the vari-
ation in monsoon rainfall for different years. We observe
that 1987 is the weakest monsoon year and 1988 is the
strongest. Figure 12 shows the local recycling ratio and
recycled precipitation for September during these two
years. We observe a higher local recycling ratio over the
entire subcontinent during September of the weakest
FIG. 6. Interzonal variation of (top) recycled precipitation and (bottom) regional recycling ratio during the summermonsoon. Zone 7 has the
highest recycled precipitation in northeastern India. Higher recycling ratios are observed during September in all the zones except 1 and 2.
OCTOBER 2014 PATHAK ET AL . 2059
monsoon year in comparison with the strongest mon-
soon year. It is important to note that the year 1987 was
an El Niño year, as described by the National WeatherService Climate Prediction Center (Climate Prediction
Center 2014), as well as a drought year, as classified
by the IMD. The year 1988 was a La Niña year withabove-normal summermonsoon rainfall. Here, we selectSeptember for comparison because of high recyclingestimates during this month. A relatively high amount ofrecycled precipitation is observed during the strongestmonsoon year. Although, the amount of recycled pre-cipitation is low during the weakest monsoon, the re-cycling ratio is on the higher side.The results obtained in the present study show a sim-
ilar pattern, when compared with the results presented
in earlier literature for the United States. Dirmeyer and
Brubaker (1999) investigated the source of moisture for
precipitation over the Mississippi River basin during
1988 (drought) and 1993 (flood) using a quasi-isentropic
back trajectories scheme. It was observed that terrestrial
moisture plays a significant role in precipitation with
contributions of 41% (1988) and 33% (1993). Bosilovich
et al. (2003) showed the importance of local moisture
sources over the United States using water vapor
tracers. The wettest monsoon observed has more con-
tinental evaporative sources than a drier monsoon.
Bosilovich and Schubert (2001) investigated precipitation
recycling over the central United States during the
wettest and driest years, using the bulk recycling model
of Eltahir and Bras (1994). The authors indicated that
the wettest period (flood during 1993) is associated with
a relatively low recycling ratio (maximum 30%) as
compared to the dry period (maximum 60% during the
drought of 1988). The present study shows a similar
pattern of recycling ratio over the Indian subcontinent
(Fig. 12), where weaker oceanic moisture transport in
the weakest monsoon year 1987 is associated with a high
recycling ratio and vice versa. Dominguez and Kumar
(2008) used DRM and showed that the feedback
through evapotranspiration during the low rainfall pe-
riod provides the extra moisture for the precipitation
over the U.S. plains ecoregion, and hence, precipitation
FIG. 7. As in Fig. 4, but for application of DRM considering the entire subcontinent as one zone.
2060 JOURNAL OF HYDROMETEOROLOGY VOLUME 15

recycling provides the stability to the seasonal rainfall.
Similarly, evapotranspiration over the Indian sub-
continent during a low rainfall period (i.e., September)
is responsible for a higher recycling ratio, and thus, it
strengthens the monsoon rainfall (Fig. 7).
4. Conclusions
We analyze the impact of local and subcontinental
evapotranspiration on regional precipitation character-
istics. The results show the potential impacts of land
surface feedbacks through evapotranspiration on re-
gional precipitation variability. This analysis reveals that
precipitation recycling is an integral part of monsoon
rainfall. The increase in soil wetness after the onset of
monsoon increases evapotranspiration in the summer
monsoon season, which in turn is responsible for a
higher recycling ratio.We find that the significant amount
of precipitation comes from precipitation recycling in the
Gangetic Plain and northeastern India. However, south-
ern, western, and southeastern parts receive less recycled
precipitation, owing to dominance of oceanic moisture
and high advective moisture transport. The high regional
recycling ratios for almost all years over zones 6 and 7
(eastern and northeastern India) suggest a strong role of
land surface in the generation of precipitation over that
zone. The recycling ratio as well as recycled precipitation
over northeastern India is found to be consistently higher
(during JJAS) as compared to other zones, with the
highest value observed during September. The increased
recycled precipitation during September provides addi-
tional strength to the weakened monsoon, and it is also
FIG. 8. Moisture flux vectors during JJAS over the Indian subcontinent. Local moisture contributes significantly to
precipitation over central and northeastern India.
OCTOBER 2014 PATHAK ET AL . 2061

responsible for delaying the monsoon withdrawal over
the eastern and northeastern zones.
The role of precipitation recycling in providing
strength to the overall rainfall, as discussed by Dirmeyer
and Brubaker (1999), Bosilovich and Schubert (2001),
Bosilovich et al. (2003), and Dominguez and Kumar
(2008) over the central U.S. region and Dominguez et al.
(2008) over the North American monsoon region, is also
observed over the Indian subcontinent. Furthermore,
the weakest monsoon is observed to have a high re-
cycling ratio when compared with strongest monsoon,
consistent with prior studies. The high recycling ratio
during the weakest period is due to the low availability of
precipitable water.
The DRM used in this study is based on the assump-
tion of well-mixed atmospheric conditions. This may not
be always true for the Indian monsoon, and this is a
possible limitation of the present study. Lettau et al.
(1979), Burde (2006), and Burde et al. (2006) addressed
the issue of incomplete vertical mixing of water vapor in
the atmosphere by using a dimensionless parameter K
[Eqs. (3.5) and (3.13) in Burde (2006)]. The estimation of
parameterK involves usage of the ratios Pm/P andwm/w,
which are generally obtained from a GCM WVT exper-
iment. The involvement of a GCM WVT experiment
output may increase the accuracy of the recycling esti-
mate, but they are computationally expensive.
The DRM, like any other two-dimensional approxima-
tion model, neglects the effect of the vertical distribution
of moisture. The inhomogeneities in wind are normally
generated because of the presence of directional wind
shear, and as a result, there can be incomplete or weak
mixing ofwater vapor.Goessling andReick (2012) showed
the importance of incomplete vertical mixing due to di-
rectional wind shear in vertical levels. The study showed
that the two-dimensional approximation models are less
accurate over tropical regions than extratropical regions,
where the effect of directional shear is at its maximum.
FIG. 9. Impacts of precipitation recycling on summer monsoon withdrawal. Precipitation
recycling delays the monsoon withdrawal in northeastern and eastern India.
2062 JOURNAL OF HYDROMETEOROLOGY VOLUME 15

Van der Ent et al. (2013) also showed that the as-
sumption of well-mixed water vapor has the largest in-
fluence on the results over the tropics, when compared
using three different tracking methods, namely, regional
climate model (RCM) tagging, water accounting model
(WAM), and three-dimensional trajectories analysis.
RCM tagging, which includes all of the atmospheric
processes, gives more accurate results when compared
with the other two approaches that are based on the
well-mixed assumption. However, the study also con-
cluded that the effect due to incomplete mixing
of water vapor is not significant over the Indian
region. The modification of the well-mixed atmosphere
assumption by allowing the effect due to ‘‘fast recycling’’
FIG. 10. Trends of (top) recycled precipitation, (middle) moisture residence time, and (bottom) total precipitation in India during the
summer monsoon months. The trends are computed at the 95% significance level. Decreasing trends of recycled precipitation are
observed over northeastern India during JJAS.
FIG. 11. JJAS total recycled precipitation and total precipitation for the period 1980–2010. Highest and lowest
monsoon rainfalls are observed during 1988 and 1987, respectively.
OCTOBER 2014 PATHAK ET AL . 2063

(Lettau et al. 1979, page 231) can further improve the
accuracy; hence, a future attempt can bemade to improve
the analysis.
The topography of the region may also play an im-
portant role in enhancing the recycling ratio and recy-
cled precipitation. The Himalayan mountain ranges are
possibly responsible for moisture circulation within the
subcontinent resulting in a high recycling ratio in the
central and northeastern regions. Such a hypothesis may
be tested with model-based analysis. It should be noted
that, while computing the moisture flux, we have con-
sidered the pressure levels from 1000 to 300mb. How-
ever, for the Himalayan mountainous region, the
elevation is too high as compared to 1000mb. This is a
major limitation of the present analysis, and consider-
ation of orography in DRM may be considered as an
area of future research.
The recycling ratio for mountainous regions (western
coast and northeastern India), with a high precipitation
amount and spatial variability, may be sensitive to the
spatial resolution, and coarse-resolution data may fail to
capture orographic effects. However, precipitation on the
western coast (Western Ghats mountainous region) pri-
marily results from oceanic sources, and hence, a major
difference in recycled precipitation may not be expected
with changes in spatial resolution. The effect of resolution
may be prominent in the computed recycled precipitation
of the northeastern region because of high orography and
FIG. 12. (a),(b) Recycling ratio and (c),(d) recycled precipitation in India during September of the weakest (1987)
and strongest monsoon (1988) years. A higher amount of recycled precipitation is observed during the strongest
monsoon year over all of India.
2064 JOURNAL OF HYDROMETEOROLOGY VOLUME 15

recycling ratio, and the study of such sensitivity may be
considered as a potential future research area.
Acknowledgments.The authors sincerely acknowledge
Francina Dominguez, University of Arizona, for her
suggestions on this work. The first author thanks Beas
Barik for her help in editing the manuscript.
REFERENCES
Asharaf, S., A. Dobler, and B. Ahrens, 2011: Soil moisture ini-
tialization effects in the Indian monsoon system. Adv. Sci.
Res., 6, 161–165, doi:10.5194/asr-6-161-2011.
Bellon, G., 2010: Monsoon intraseasonal oscillation and land–
atmosphere interaction in an idealized model. Climate Dyn.,
37, 1081–1096, doi:10.1007/s00382-010-0893-0.
Bosilovich,M. G., and S. D. Schubert, 2001: Precipitation recycling
over the central United States diagnosed from the GEOS-1
Data Assimilation System. J. Hydrometeor., 2, 26–35,
doi:10.1175/1525-7541(2001)002,0026:PROTCU.2.0.CO;2.
——, and ——, 2002: Water vapor tracers as diagnostics of the
regional hydrologic cycle. J. Hydrometeor., 3, 149–165,
doi:10.1175/1525-7541(2002)003,0149:WVTADO.2.0.CO;2.
——,Y. C. Sud, S. D. Schubert, andG. K.Walker, 2003: Numerical
simulation of the large-scale North American monsoon water
sources. J.Geophys. Res., 108, 8614, doi:10.1029/2002JD003095.
Brubaker, K. L., D. Entekhabi, and P. S. Eagleson, 1993: Estima-
tion of continental precipitation recycling. J. Climate, 6, 1077–
1089, doi:10.1175/1520-0442(1993)006,1077:EOCPR.2.0.CO;2.
Budyko, M. I., 1974: Climate and life. Academic Press, 508 pp.
Burde, G. I., 2006: Bulk recycling models with incomplete vertical
mixing. Part I: Conceptual framework and models. J. Climate,
19, 1461–1472, doi:10.1175/JCLI3687.1.——, and A. Zangvil, 2001: The estimation of regional precipitation
recycling. Part II: A new recycling model. J. Climate, 14, 2509–
2527, doi:10.1175/1520-0442(2001)014,2509:TEORPR.2.0.CO;2.
——, C. Gandush, and Y. Bayarjargal, 2006: Bulk recycling models
with incomplete vertical mixing. Part II: Precipitation re-
cycling in the Amazon basin. J. Climate, 19, 1473–1489,
doi:10.1175/JCLI3688.1.
Climate Prediction Center, cited 2014: Historical El Niño/La Niñaepisodes (1950–present). [Available online at www.cpc.ncep.noaa.
gov/products/analysis_monitoring/ensostuff/ensoyears.shtml.]
Dee, D., and Coauthors, cited 2014: The Climate Data Guide: At-
mospheric reanalysis: Overview and comparison tables. [Avail-
able online at https://climatedataguide.ucar.edu/climate-data/
atmospheric-reanalysis-overview-comparison-tables.]
Dirmeyer, P. A., and J. Shukla, 1993: Observational and modeling
studies of the influence of soil moisture anomalies on the atmo-
spheric circulation.Predictions of Interannual Climate Variations,
J. Shukla, Ed., NATO Series: I, Vol. 6, Springer-Verlag, 1–23.
——, and K. L. Brubaker, 1999: Contrasting evaporative moisture
sources during the drought of 1988 and the flood of 1993.
J.Geophys. Res., 104, 19 383–19 398, doi:10.1029/1999JD900222.
Dominguez, F., and P. Kumar, 2008: Precipitation recycling vari-
ability and ecoclimatological stability—A study using NARR
data. Part I: Central U.S. plains ecoregion. J. Climate, 21,
5165–5186, doi:10.1175/2008JCLI1756.1.
——, ——, X. Liang, and M. Ting, 2006: Impact of atmospheric
moisture storage on precipitation recycling. J. Climate, 19,
1513–1530, doi:10.1175/JCLI3691.1.
——, ——, and E. R. Vivoni, 2008: Precipitation recycling vari-
ability and ecoclimatological stability—A study using NARR
data. Part II: North American monsoon region. J. Climate, 21,
5187–5203, doi:10.1175/2008JCLI1760.1.
Eltahir, E. A. B., and L. B. Bras, 1994: Precipitation recycling in the
Amazon basin. Quart. J. Roy. Meteor. Soc., 120, 861–880,
doi:10.1002/qj.49712051806.
——, and ——, 1996: Precipitation recycling. Rev. Geophys., 34,
367–378, doi:10.1029/96RG01927.
Environmental Modeling Center, 2010: NCEP Climate Forecast
System Reanalysis (CFSR) selected hourly time-series
products, January 1979 to December 2010. Research Data
Archive at the National Center for Atmospheric Research,
Computational and Information Systems Laboratory, Boul-
der, CO. [Available online at http://rda.ucar.edu/datasets/
ds093.1.]
Gadgil, S., 2003: Indian monsoon and its variability.
Annu. Rev. Earth Planet. Sci., 31, 429–467, doi:10.1146/
annurev.earth.31.100901.141251.
——, and P. V. Joseph, 2003: On breaks of the Indian monsoon.
J. Earth Syst. Sci., 112, 529–558, doi:10.1007/BF02709778.
Gimeno, L., A. Drumond, R. Nieto, R. M. Trigo, and A. Stohl,
2010: On the origin of continental precipitation.Geophys. Res.
Lett., 37, L13804, doi:10.1029/2010GL043712.
——, and Coauthors, 2012: Oceanic and terrestrial sources of con-
tinental precipitation. Rev. Geophys., 50, RG4003, doi:10.1029/
2012RG000389.
Goessling, H. F., and C. H. Reick, 2012: Atmospheric water
vapour tracers and the significance of the vertical dimension.
Atmos. Chem. Phys. Discuss., 12, 30 119–30 176, doi:10.5194/
acpd-12-30119-2012.
Higgins, W., and D. Gochis, 2007: Synthesis of results from the
North American Monsoon Experiment (NAME) process
study. J. Climate, 20, 1601–1607, doi:10.1175/JCLI4081.1.Krishnamurthy, V., and J. L. Kinter III, 2003: The Indian mon-
soon and its relation to global climate variability. Global
Climate, X. Rodó and F. A. Comín, Eds., Springer-Verlag,186–236.
——, and J. Shukla, 2007: Intraseasonal and seasonally persisting
patterns of Indian monsoon rainfall. J. Climate, 20, 3–20,
doi:10.1175/JCLI3981.1.
Lawrence, D. M., and P. J. Webster, 2001: Interannual varia-
tions of the intraseasonal oscillation in the South Asian
summer monsoon region. J. Climate, 14, 2910–2922,
doi:10.1175/1520-0442(2001)014,2910:IVOTIO.2.0.CO;2.
Lettau, H., K. Lettau, and L. C. B. Molion, 1979: Amazonia’s
hydrologic cycle and the role of atmospheric recycling in as-
sessing deforestation effects. Mon. Wea. Rev., 107, 227–238,
doi:10.1175/1520-0493(1979)107,0227:AHCATR.2.0.CO;2.
Meehl, G. A., 1994: Influence of land surface in the Asian summer
monsoon: External conditions versus internal feedbacks.
J. Climate, 7, 1033–1049, doi:10.1175/1520-0442(1994)007,1033:
IOTLSI.2.0.CO;2.
Merrill, J. T., R. Bleck, and D. Boudra, 1986: Techniques of La-
grangian trajectory analysis in isentropic coordinates. Mon.
Wea. Rev., 114, 571–581, doi:10.1175/1520-0493(1986)114,0571:
TOLTAI.2.0.CO;2.
Peel, M. C., B. L. Finlayson, and T. A. McMahon, 2007: Updated
worldmapof theKoppen–Geiger climate classification.Hydrol.
Earth. Syst. Sci., 11, 1633–1644, doi:10.5194/hess-11-1633-2007.
Rajeevan,M., S. Gadgil, and J. Bhate, 2010:Active and break spells
of Indian summer monsoon. J. Earth. Syst. Sci., 119, 229–247,
doi:10.1007/s12040-010-0019-4.
OCTOBER 2014 PATHAK ET AL . 2065

Saha, S., and Coauthors, 2010: TheNCEPClimate Forecast System
Reanalysis. Bull. Amer. Meteor. Soc., 91, 1015–1057,
doi:10.1175/2010BAMS3001.1.
Saha, S.K., S.Halder,A. Suryachandrarao, andB.N.Goswami, 2012:
Modulation of ISOs by land–atmosphere feedback and contri-
bution to the interannual variability of Indian summermonsoon.
J. Geophys. Res., 117, D13101, doi:10.1029/2011JD017291.
Shukla, J., and Y. Mintz, 1982: Influence of land-surface evapo-
transpiration on the earth’s climate. Science, 215, 1498–1501,
doi:10.1126/science.215.4539.1498.
Stohl, A., and P. James, 2004: A Lagrangian analysis of the
atmospheric branch of the global water cycle. Part I:
Method description, validation, and demonstration for
the August 2002 flooding in central Europe. J. Hydrome-
teor., 5, 656–678, doi:10.1175/1525-7541(2004)005,0656:
ALAOTA.2.0.CO;2.
——, and ——, 2005: A Lagrangian analysis of the atmospheric
branch of the global water cycle. Part II: Moisture trans-
ports between Earth’s ocean basins and river catchments.
J. Hydrometeor., 6, 961–984, doi:10.1175/JHM470.1.
Tuinenburg, O.A., R.W.A.Hutjes, and P. Kabat, 2012: The fate of
evaporated water from the Ganges basin. J. Geophys. Res.,
117, D01107, doi:10.1029/2011JD016221.
van der Ent, R. J., H. G. Savenije, B. Schaefli, and S. C. Steele-
Dunne, 2010: Origin and fate of atmospheric moisture over
continents. Water Resour. Res., 46, W09525, doi:10.1029/
2010WR009127.
——, O. Tuinenburg, H.-R. Knoche, H. Kunstmann, and
H. Savenije, 2013: Should we use a simple or complex model
for moisture recycling and atmospheric water tracking?
Hydrol. Earth Syst. Sci., 17, 4869–4884, doi:10.5194/
hess-17-4869-2013.
Wang, B., 2006: The Asian Monsoon. Praxis Publishing, 459 pp.
Watts, C. J., R. Scott, J. Garatuza-Payan, J. C. Rodriguez, J. H.
Prueger, W. P. Kustas, and M. Douglas, 2007: Changes in
vegetation condition and surface fluxes during NAME 2004.
J. Climate, 20, 1810–1820, doi:10.1175/JCLI4088.1.
Yasunari, T., 2007: Role of land–atmosphere interaction on Asian
monsoon climate. J. Meteor. Soc. Japan, 85B, 55–75,
doi:10.2151/jmsj.85B.55.
2066 JOURNAL OF HYDROMETEOROLOGY VOLUME 15
Copyright © 2022 FDOKUMEN