Variations of physicochemical properties in Kalpakkam coastal waters, east coast of India, during...
14
Environ Monit Assess (2010) 171:411–424 DOI 10.1007/s10661-009-1287-9 Variations of physicochemical properties in Kalpakkam coastal waters, east coast of India, during southwest to northeast monsoon transition period Kamala Kanta Satpathy · Ajit K. Mohanty · Gouri Sahu · Santosh K. Sarkar · Usha Natesan · R. Venkatesan · M. V. R. Prasad Received: 10 July 2008 / Accepted: 15 December 2009 / Published online: 8 January 2010 © Springer Science+Business Media B.V. 2009 Abstract A significant variation in physicochem- ical properties of the Kalpakkam coastal waters, eastern part of India, was observed during the event of southwest to northeast monsoon tran- sition. Increase in nitrate, total nitrogen, and silicate concentrations were noticed during post- transition period. Ammonia concentration was at peak during transition period as compared K. K. Satpathy (B ) · A. K. Mohanty · G. Sahu · M. V. R. Prasad Environmental and Industrial Safety Section, Indira Gandhi Centre for Atomic Research, Kalpakkam 603 102, Tamil Nadu, India e-mail: [email protected] A. K. Mohanty e-mail: [email protected] G. Sahu e-mail: [email protected] M. V. R. Prasad e-mail: [email protected] U. Natesan Centre for Environmental Studies, Anna University, Chennai 600 025, India R. Venkatesan National Institute of Ocean Technology, Chennai 601 302, India S. K. Sarkar Department of Marine Science, University of Calcutta, Kolkata 700 019, India to pre- and post-transition periods. Hypo-saline condition (∼23 psu) was observed during post- transition as the surface water salinity decreased by ∼10 psu from the pre-transitional values. Tur- bidity, suspended particulate matter, phosphate and total phosphorous values decreased mar- ginally, coinciding with northward to southward current reversal. A drastic decrease (eightfold) in chlorophyll-a concentration was observed in the coastal water during post-transition period. Keywords Monsoon transitions · Coastal waters · Physicochemical properties · Nutrients · Bay of Bengal · East cost of India Introduction Seasonal monsoon reversal of wind is a unique feature of Indian Ocean that results in consequent change in the circulation pattern (Anonymous 1952; La Fond 1957; Wyrtki 1973). The wind reversal occurs during the transition period between the southwest (SW) monsoon and northeast (NE) monsoon. In general, the SW to NE monsoon transition occurs during September/October and the NE to SW transition occurs during February/March. The pole-ward current during SW monsoon changes to equator- ward during the SW to NE monsoon transition, whereas, a reverse current pattern is observed
-
Upload
independent -
Category
Documents
-
view
0 -
download
0
Transcript of Variations of physicochemical properties in Kalpakkam coastal waters, east coast of India, during...

Environ Monit Assess (2010) 171:411–424DOI 10.1007/s10661-009-1287-9
Variations of physicochemical properties in Kalpakkamcoastal waters, east coast of India, during southwestto northeast monsoon transition period
Kamala Kanta Satpathy · Ajit K. Mohanty ·Gouri Sahu · Santosh K. Sarkar · Usha Natesan ·R. Venkatesan · M. V. R. Prasad
Received: 10 July 2008 / Accepted: 15 December 2009 / Published online: 8 January 2010© Springer Science+Business Media B.V. 2009
Abstract A significant variation in physicochem-ical properties of the Kalpakkam coastal waters,eastern part of India, was observed during theevent of southwest to northeast monsoon tran-sition. Increase in nitrate, total nitrogen, andsilicate concentrations were noticed during post-transition period. Ammonia concentration wasat peak during transition period as compared
K. K. Satpathy (B) · A. K. Mohanty · G. Sahu ·M. V. R. PrasadEnvironmental and Industrial Safety Section,Indira Gandhi Centre for Atomic Research,Kalpakkam 603 102, Tamil Nadu, Indiae-mail: [email protected]
A. K. Mohantye-mail: [email protected]
G. Sahue-mail: [email protected]
M. V. R. Prasade-mail: [email protected]
U. NatesanCentre for Environmental Studies, Anna University,Chennai 600 025, India
R. VenkatesanNational Institute of Ocean Technology,Chennai 601 302, India
S. K. SarkarDepartment of Marine Science,University of Calcutta, Kolkata 700 019, India
to pre- and post-transition periods. Hypo-salinecondition (∼23 psu) was observed during post-transition as the surface water salinity decreasedby ∼10 psu from the pre-transitional values. Tur-bidity, suspended particulate matter, phosphateand total phosphorous values decreased mar-ginally, coinciding with northward to southwardcurrent reversal. A drastic decrease (eightfold) inchlorophyll-a concentration was observed in thecoastal water during post-transition period.
Keywords Monsoon transitions · Coastal waters ·Physicochemical properties · Nutrients ·Bay of Bengal · East cost of India
Introduction
Seasonal monsoon reversal of wind is aunique feature of Indian Ocean that resultsin consequent change in the circulation pattern(Anonymous 1952; La Fond 1957; Wyrtki 1973).The wind reversal occurs during the transitionperiod between the southwest (SW) monsoonand northeast (NE) monsoon. In general, theSW to NE monsoon transition occurs duringSeptember/October and the NE to SW transitionoccurs during February/March. The pole-wardcurrent during SW monsoon changes to equator-ward during the SW to NE monsoon transition,whereas, a reverse current pattern is observed

412 Environ Monit Assess (2010) 171:411–424
during the transition period between NE and SWmonsoon (Varkey et al. 1996; Vinayachandranet al. 1999; Haugen et al. 2003). Subsequent tothe change in the current pattern, the alterationsof coastal water quality have been reported(Somayajulu 1987; Ramaraju et al. 1992; Babu1992; Saravanane et al. 2000). Though severalauthors have studied the circulation pattern inBay of Bengal (BOB) during the transitionperiods, the studies have been confined to somehydrographical parameters like temperature andsalinity (Ramaraju et al. 1992; Babu 1992) andrarely the plankton (Saravanane et al. 2000).Detailed investigation on the alteration of thecoastal water quality of BOB in general and atKalpakkam coast in particular during transitionperiod is meager. Against this backdrop thepresent study was designed to investigate for acomprehensive account of the physico-chemicalalterations of the coastal waters and its impacton the productivity of this area during thesummer monsoon to winter monsoon transition.Data generated in this study were subjected tomultivariate statistical methods such as clusteranalysis and principle component analysis so asto elucidate the physico-chemical state of thecoastal waters during pre-transition, transition,and post-transition periods.
Materials and methods
Study area
Kalpakkam is situated at 12◦33′ N Lat. and 80◦11′E Long. along the Indian east coast (Fig. 1). Ac-cording to the climatology of this area the wholeyear has been divided into three seasons viz: (1)post-monsoon/summer (February–May), (2) pre-monsoon or SW monsoon (June–September), and(3) NE monsoon (October–January) (Satpathy1996). The NE monsoon is active in this area andbulk (80%) of rainfall occurs during this period.Due to the geographic location of this area, themonsoon reversal of wind and the subsequentchange in the current pattern is prominent hereleading to a visible alternation of the coastalmilieu.
Fig. 1 Map of study area showing sampling location
Methods
Surface seawater samples were collected dailyfor a period of 2 months (14th September to13th November, 2006) covering the transition pe-riod. A fixed location at the jetty of the MadrasAtomic Power Station, ∼500 m inside the seawas chosen for sampling (Fig. 1). Current speedand direction was measured following the driftbottle technique. A mercury thermometer having0.1◦C resolution was used for measurement ofwater temperature. Winkler’s titrimetric methodwas followed for the estimation of dissolved oxy-gen (DO). Salinity measurements were carriedout by Knudsen’s method (Grasshoff et al. 1983).Biochemical oxygen demand (BOD) of the sam-ples was calculated after an incubation periodof 5 days in BOD incubator. pH measurementwas carried out by a pH meter (CyberScan PCD5500) having a resolution of 0.01. Turbidity of thewater samples was measured by turbidity meter

Environ Monit Assess (2010) 171:411–424 413
(CyberScan IR TB 100) having 0.01 NTU resolu-tion. Suspended particulate matter (SPM) of thesamples was measured following the method ofGrasshoff et al. (1983). The dissolved micronu-trients such as, nitrite, nitrate, ammonia, silicate,phosphate along with TN and TP were estimatedby following standard methods (Grasshoff et al.1983; Parsons et al. 1984), after filtering the watersamples through 0.45 μ Millipore filter paper.Chlorophyll-a was analyzed by spectrophotome-try following the method of Parsons et al. (1984).For all the spectrophotometric analyses, a doublebeam UV-Visible Spectrophotometer (ChemitoSpectrascan UV 2600) was used. All the data ob-tained during the present study were categorizedinto five groups such as north, NE, east, southeast(SE), and south, based upon the direction of thewater current during the daily observations. Sta-tistical analyses such as correlation matrix, clusteranalysis, and principal component analysis (PCA)were carried out by using XLStat Pro software.
Results and discussion
Current direction and speed
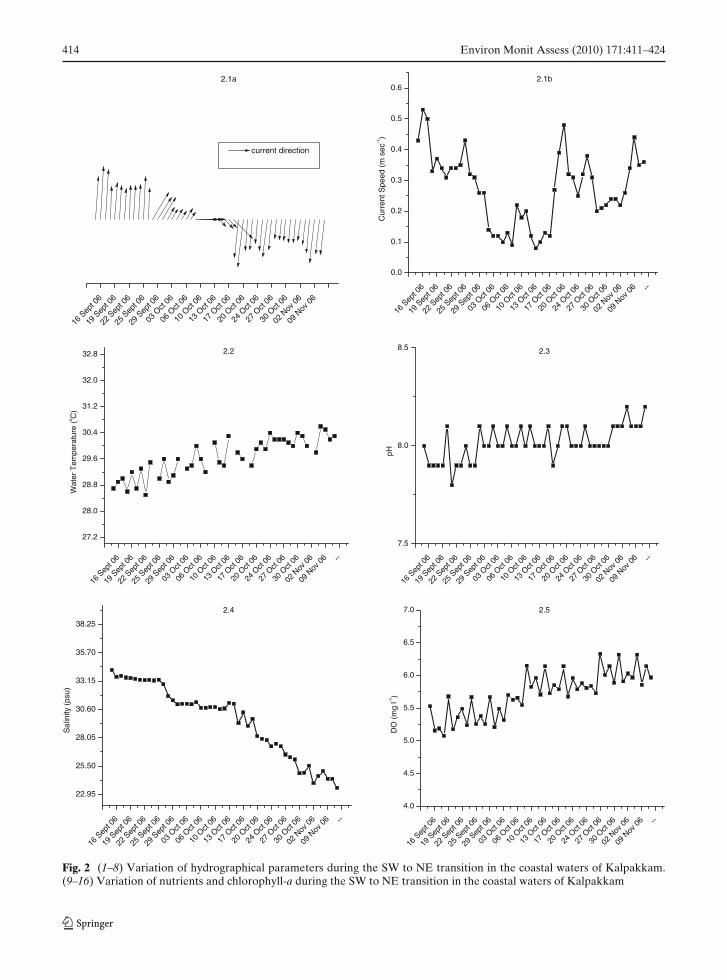
Current direction during the study showed a typ-ical step-by-step change from north to south withtransitional directions towards NE, east, and SE.Though the transitional directions were observedfor a shorter period, it was prominent enoughto be detected. The NE direction was observedfor more than a week, whereas, the other twoperiods such as east and SE direction of circu-lation together existed for a week. The presentstudy clearly showed that a transition (when thecurrent was shifting from north to south) periodof about 20 days. The previous study from thislocality, the only one (Saravanane et al. 2000)does not mention about the lull period (northeast,east, and southeast). The highest current veloc-ity value of 0.53 m s−1 was observed during thenorthward circulation whereas, the lowest value(0.08 m s−1) was observed during the eastwardcirculation. The period wise average values ofcurrent velocity showed that it was maximum dur-ing northward circulation and decreased sharplyduring the northeast current direction after which
it gradually increased to attain almost similar ve-locity as that of the northward circulation period(Fig. 2 (1)). During the NE and eastward circu-lation periods the coastal water became almoststable with negligible current velocity. Cur-rent magnitude was relatively high during pre-transition period, which could be due to relativelyhigh intensities of wind stress prevailed during SWmonsoon that gradually decreased during tran-sition period (northeast to southeast current di-rection) resulting in diminution of current speed(Unnikrishnan and Bahulayan 1991). The lowerintensity of current observed during northeastto east direction period might indicate the with-drawal phase of SW monsoon (Somayajulu et al.1987) and beginning of transition before the NEmonsoon sets in. An earlier report by Somayajuluet al. (1987) indicated eastward transport as aresult of the waters brought by a southerly flowfrom the northern bay and a northerly flow fromsouthern bay. This period of transition, before asteady state indicating clear direction of current,reported to range from 2 weeks to 1 month inthe tropical region (Babu 1992). With the onset ofNE monsoon, the surface water of BOB moves to-wards south resulting in arrival of new water massin coastal areas (Muraleedharan 1993; Somayajuluet al. 1987; Unnikrishnan and Bahulayan 1991).Although, it is fairly logical to attribute thesechanges primarily to wind, the role of horizontaldensity differences in this water movement cannotbe ignored. It is worthwhile to mention that theperennial rivers in the north region empty into thebay creating a horizontal salinity gradient, whichintensifies the circulation coupled with the NEmonsoonal wind resulting in a reasonably steadycoastal current in the western boundary of BOB(Shetye et al. 1991, 1993).
Temperature
The surface water temperature during the presentstudy ranged from 28.5 to 30.6◦C. It gradually in-creased with current reversal from north to south(Fig. 2 (2)). A similar variation of temperaturehas been reported earlier (Saravanane et al. 2000)during SW to NE monsoon transition at this lo-cation where it was attributed to the equator-ward flow of low saline and high temperature
414 Environ Monit Assess (2010) 171:411–424
16 S
ept 0
6
19 S
ept 0
6
22 S
ept 0
6
25 S
ept 0
6
29 S
ept 0
6
03 O
ct 06
06 O
ct 06
10 O
ct 06
13 O
ct 06
17 O
ct 06
20 O
ct 06
24 O
ct 06
27 O
ct 06
30 O
ct 06
02 N
ov 0
6
09 N
ov 0
6
2.1a
current direction
16 S
ept 0
6
19 S
ept 0
6
22 S
ept 0
6
25 S
ept 0
6
29 S
ept 0
6
03 O
ct 06
06 O
ct 06
10 O
ct 06
13 O
ct 06
17 O
ct 06
20 O
ct 06
24 O
ct 06
27 O
ct 06
30 O
ct 06
02 N
ov 0
6
09 N
ov 0
6 --
0.0
0.1
0.2
0.3
0.4
0.5
0.6 2.1b
Cur
rent
Spe
ed (
m s
ec-1)
16 S
ept 0
6
19 S
ept 0
6
22 S
ept 0
6
25 S
ept 0
6
29 S
ept 0
6
03 O
ct 06
06 O
ct 06
10 O
ct 06
13 O
ct 06
17 O
ct 06
20 O
ct 06
24 O
ct 06
27 O
ct 06
30 O
ct 06
02 N
ov 0
6
09 N
ov 0
6 --
27.2
28.0
28.8
29.6
30.4
31.2
32.0
32.8 2.2
Wat
er T
empe
ratu
re (
o C)
16 S
ept 0
6
19 S
ept 0
6
22 S
ept 0
6
25 S
ept 0
6
29 S
ept 0
6
03 O
ct 06
06 O
ct 06
10 O
ct 06
13 O
ct 06
17 O
ct 06
20 O
ct 06
24 O
ct 06
27 O
ct 06
30 O
ct 06
02 N
ov 0
6
09 N
ov 0
6 --
7.5
8.0
8.5 2.3
pH
16 S
ept 0
6
19 S
ept 0
6
22 S
ept 0
6
25 S
ept 0
6
29 S
ept 0
6
03 O
ct 06
06 O
ct 06
10 O
ct 06
13 O
ct 06
17 O
ct 06
20 O
ct 06
24 O
ct 06
27 O
ct 06
30 O
ct 06
02 N
ov 0
6
09 N
ov 0
6 --
22.95
25.50
28.05
30.60
33.15
35.70
38.25
2.4
Sal
inity
(ps
u)
16 S
ept 0
6
19 S
ept 0
6
22 S
ept 0
6
25 S
ept 0
6
29 S
ept 0
6
03 O
ct 06
06 O
ct 06
10 O
ct 06
13 O
ct 06
17 O
ct 06
20 O
ct 06
24 O
ct 06
27 O
ct 06
30 O
ct 06
02 N
ov 0
6
09 N
ov 0
6 --
4.0
4.5
5.0
5.5
6.0
6.5
7.0 2.5
DO
(m
g l-1
)
Fig. 2 (1–8) Variation of hydrographical parameters during the SW to NE transition in the coastal waters of Kalpakkam.(9–16) Variation of nutrients and chlorophyll-a during the SW to NE transition in the coastal waters of Kalpakkam

Environ Monit Assess (2010) 171:411–424 415
16 S
ept 0
6
19 S
ept 0
6
22 S
ept 0
6
25 S
ept 0
6
29 S
ept 0
6
03 O
ct 06
06 O
ct 06
10 O
ct 06
13 O
ct 06
17 O
ct 06
20 O
ct 06
24 O
ct 06
27 O
ct 06
30 O
ct 06
02 N
ov 0
6
09 N
ov 0
6 --
0.4
0.6
0.8
1.0
1.2
1.4
1.6
1.8
2.0 2.6
BO
D (
mg
l-1)
16 S
ept 0
6
19 S
ept 0
6
22 S
ept 0
6
25 S
ept 0
6
29 S
ept 0
6
03 O
ct 06
06 O
ct 06
10 O
ct 06
13 O
ct 06
17 O
ct 06
20 O
ct 06
24 O
ct 06
27 O
ct 06
30 O
ct 06
02 N
ov 0
6
09 N
ov 0
6 --
7.5
10.0
12.5
15.0
17.5
20.0
2.7
Tur
bidi
ty (
NT
U)
16 S
ept 0
6
19 S
ept 0
6
22 S
ept 0
6
25 S
ept 0
6
29 S
ept 0
6
03 O
ct 06
06 O
ct 06
10 O
ct 06
13 O
ct 06
17 O
ct 06
20 O
ct 06
24 O
ct 06
27 O
ct 06
30 O
ct 06
02 N
ov 0
6
09 N
ov 0
6 --
9.0
13.5
18.0
22.5
27.0
31.5
36.0
40.5
45.0 2.8
SP
M (
mg
l-1)
16 S
ept 0
6
19 S
ept 0
6
22 S
ept 0
6
25 S
ept 0
6
29 S
ept 0
6
03 O
ct 06
06 O
ct 06
10 O
ct 06
13 O
ct 06
17 O
ct 06
20 O
ct 06
24 O
ct 06
27 O
ct 06
30 O
ct 06
02 N
ov 0
6
09 N
ov 0
6 --
0.00
0.75
1.50
2.25
3.00
3.75 2.9
NO
2 (µ
mol
l-1)
16 S
ept 0
6
19 S
ept 0
6
22 S
ept 0
6
25 S
ept 0
6
29 S
ept 0
6
03 O
ct 06
06 O
ct 06
10 O
ct 06
13 O
ct 06
17 O
ct 06
20 O
ct 06
24 O
ct 06
27 O
ct 06
30 O
ct 06
02 N
ov 0
6
09 N
ov 0
6 --
0.00
5.25
10.50
42.00
47.25
52.50 2.10
NO
3 (µ
mol
l-1)
16 S
ept 0
6
19 S
ept 0
6
22 S
ept 0
6
25 S
ept 0
6
29 S
ept 0
6
03 O
ct 06
06 O
ct 06
10 O
ct 06
13 O
ct 06
17 O
ct 06
20 O
ct 06
24 O
ct 06
27 O
ct 06
30 O
ct 06
02 N
ov 0
6
09 N
ov 0
6 --
0.00
5.25
10.50
15.75
21.00
26.25
31.50
36.75 2.11
NH
3 (µ
mol
l-1)
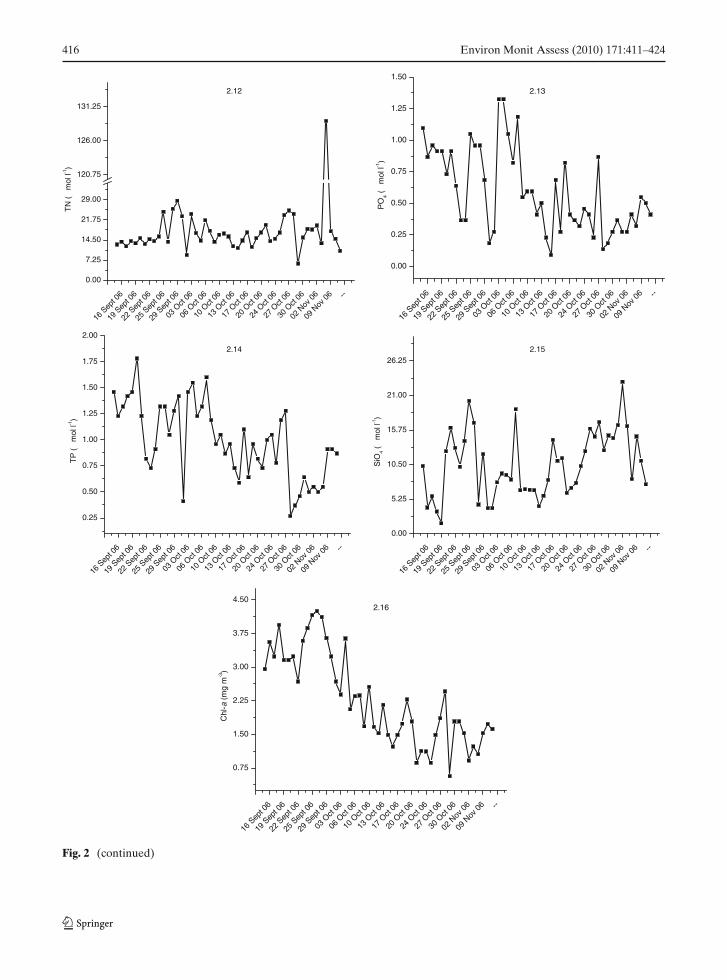
Fig. 2 (continued)
416 Environ Monit Assess (2010) 171:411–424
16 S
ept 0
6
19 S
ept 0
6
22 S
ept 0
6
25 S
ept 0
6
29 S
ept 0
6
03 O
ct 06
06 O
ct 06
10 O
ct 06
13 O
ct 06
17 O
ct 06
20 O
ct 06
24 O
ct 06
27 O
ct 06
30 O
ct 06
02 N
ov 0
6
09 N
ov 0
6 --
0.00
7.25
14.50
21.75
29.00
120.75
126.00
131.25
2.12
TN
(µ
mol
l-1)
16 S
ept 0
6
19 S
ept 0
6
22 S
ept 0
6
25 S
ept 0
6
29 S
ept 0
6
03 O
ct 06
06 O
ct 06
10 O
ct 06
13 O
ct 06
17 O
ct 06
20 O
ct 06
24 O
ct 06
27 O
ct 06
30 O
ct 06
02 N
ov 0
6
09 N
ov 0
6 --
0.00
0.25
0.50
0.75
1.00
1.25
1.50
2.13
PO
4 (µ
mol
l-1)
16 S
ept 0
6
19 S
ept 0
6
22 S
ept 0
6
25 S
ept 0
6
29 S
ept 0
6
03 O
ct 06
06 O
ct 06
10 O
ct 06
13 O
ct 06
17 O
ct 06
20 O
ct 06
24 O
ct 06
27 O
ct 06
30 O
ct 06
02 N
ov 0
6
09 N
ov 0
6 --
0.25
0.50
0.75
1.00
1.25
1.50
1.75
2.00
2.14
TP
(µ
mol
l-1)
16 S
ept 0
6
19 S
ept 0
6
22 S
ept 0
6
25 S
ept 0
6
29 S
ept 0
6
03 O
ct 06
06 O
ct 06
10 O
ct 06
13 O
ct 06
17 O
ct 06
20 O
ct 06
24 O
ct 06
27 O
ct 06
30 O
ct 06
02 N
ov 0
6
09 N
ov 0
6 --
0.00
5.25
10.50
15.75
21.00
26.252.15
SiO
4 (µ
mol
l-1)
16 S
ept 0
6
19 S
ept 0
6
22 S
ept 0
6
25 S
ept 0
6
29 S
ept 0
6
03 O
ct 06
06 O
ct 06
10 O
ct 06
13 O
ct 06
17 O
ct 06
20 O
ct 06
24 O
ct 06
27 O
ct 06
30 O
ct 06
02 N
ov 0
6
09 N
ov 0
6 --
0.75
1.50
2.25
3.00
3.75
4.50 2.16
Chl
-a (
mg
m-3)
Fig. 2 (continued)

Environ Monit Assess (2010) 171:411–424 417
surface water mass form the northern to southernpart of the BOB. Seawater temperature is wellknown to depend on a number of factors such as,atmospheric temperature, wind magnitude, solarradiation, cloud coverage and salinity gradient(due to freshwater discharge). In the southeastcoast of India, air temperature shows a bimodaloscillation with two peaks, one during Apr./Mayand another during Sep./Oct. (Satpathy and Nair1990). The sea surface temperature (SST) regimeof the BOB has been described in detail bySadhuram et al. (2004). The SST variation inthe BOB region is mostly due to the marchof sun. With the onset of SW monsoon (June–September), the temperature decreased, whichcould be due to the loss of energy from thesea surface to the atmosphere by evaporationalcooling as a result of the impact of strong mon-soonal winds. This is coupled with reduction inthe incoming solar radiation by clouds resultingin cooling of sea surface. Moreover, upwelling,a well-known phenomenon during SW monsoonperiod is also responsible for relatively low tem-perature. With the change in current from north tosouth during post-SW monsoon or post-transitionperiod, the depth of mixed layer increases due tothe massive mixing of riverine freshwater (559 ×109 m3) from the rivers of northern BOB resultingin low saline surface water exposed to increasedsolar radiation as the cloud coverage reduced dur-ing October. This explanation is strengthened bythe fact that the heat potential in the BOB duringOctober (>16 k cal/cm2) is relatively high as com-pared to SW monsoon period (10–18 k cal/cm2;Sadhuram et al. 2004). Moreover, temperatureconditions in coastal and estuarine environmentsfluctuate depending upon their bathymetry, in-solation, local atmospheric variation, and landdrainage (Alvarez-Borrego and Alvarez-Borrego1982).
pH
pH values did not show significant variation dur-ing the present study which ranged from 7.8 to8.2. The average values for different periods suchas north, NE, east, SE, and south showed that(Fig. 2 (3)) pH values increased from north toNE observations after which it remained almost
stable except for a marginal decrease during theSE current direction. The observed insignificantvariation in pH observed could be attributed tothe negligible terrestrial runoff and precipitationduring this period coupled with the extensivebuffering capacity of the seawater that causes thechange of pH within a very narrow limit (Rileyand Chester 1971).
Salinity
Decrease in the values of salinity was noticed dur-ing the north to south current reversal. The val-ues ranged from 23.56 to 34.15 psu, lowest beingobserved during southward current and highestbeing observed during northward current pattern(Fig. 2 (4)). The reduction of salinity during thelate transition period could be due to the inflow oflow saline water from the northern BOB, whereinsome of the major perennial rivers debouch hugequantity of freshwater. Salinity showed negativecorrelations of with DO (p ≥ 0.001) and silicate(p ≥ 0.005). Since, solubility of DO decreases withincrease in salinity and freshwater is consideredas the main source of silicate in the coastal envi-ronment, the above negative correlation could bedue to the intrusion of water mass with low salineand high silicate content to this coastal water.Since, phosphate is considered to be of marineorigin in non-polluted environments, the strongpositive correlation (p ≥ 0.001) of salinity withphosphate and TP showed that, the coastal watersalinity and phosphate concentration decreasedwith the intrusion of low saline water mass. Sim-ilar change in salinity concentrations during SWto NE monsoon transition has been reported byothers (Saravanane et al. 2000).
Dissolved oxygen
The dissolved oxygen contents varied between5.08 and 6.33 mg l−1. An increase in DO con-tents was observed from north to east currentchange and then it remained almost stable forthe rest of the study period (Fig. 2 (5)). Thevariation of DO in coastal waters is a function ofphysico-chemical properties of water, which alterits solubility (Aston 1980) and also as a result of

418 Environ Monit Assess (2010) 171:411–424
Tab
le1
Cor
rela
tion
mat
rix
(Pea
rson
)of
the
vari
ous
phys
ico-
chem
ical
para
met
ers
ofth
eco
asta
lw
ater
sof
Kal
pakk
amdu
ring
the
sout
hwes
tto
nort
heas
tm
onso
ontr
ansi
tion
Var
iabl
esT
emp.
pHSa
linit
yD
OB
OD
Tur
bidi
tySP
MN
itri
teN
itra
teA
mm
onia
TN
Silic
ate
Pho
spha
teT
PC
hl-a
Tem
p.1
pH0.
400*
1Sa
linit
y−0
.776
*−0
.575
*1
DO
0.75
3*0.
465*
−0.7
52*
1B
OD
−0.4
57*
−0.3
66*
0.50
9*−0
.448
*1
Tur
bidi
ty−0
.480
*0.
092
0.21
2−0
.262
***
0.07
51
SPM
−0.6
17*
−0.2
250.
604*
−0.5
43*
0.24
9***
0.56
3*1
Nit
rite
0.08
40.
001
−0.1
120.
039
−0.1
58−0
.001
−0.0
511
Nit
rate
0.25
5***
−0.0
76−0
.184
0.22
1−0
.255
***
−0.0
55−0
.055
−0.1
531
Am
mon
ia0.
042
0.02
4−0
.007
−0.0
67−0
.094
0.11
50.
225
0.27
9***
−0.0
571
TN
0.24
1***
−0.0
21− 0
.217
0.22
8−0
.311
**−0
.073
−0.0
340.
006
0.92
2*0.
115
1Si
licat
e0.
110
−0.0
13−0
.354
**0.
192
−0.1
760.
017
−0.3
12**
0.38
1*−0
.036
−0.0
660.
008
1P
hosp
hate
−0.5
38*
−0.3
28**
0.55
1*−0
.494
*0.
309*
*0.
423*
0.43
7*0.
165
−0.0
520.
028
−0.0
69−0
.044
1T
P−0
.556
*−0
.318
**0.
615*
−0.5
55*
0.32
9**
0.32
1**
0.45
0*−0
.016
−0.1
390.
193
−0.1
08−0
.166
0.78
4*1
Chl
-a−0
.634
*−0
.475
*0.
749*
−0.7
37*
0.49
3*0.
278*
**0.
549*
−0.1
18−0
.061
0.09
7−0
.114
−0.1
210.
573*
0.55
6*1
*p
≥0.
001;
**p
≥0.
005;
***
p≥
0.01

Environ Monit Assess (2010) 171:411–424 419
imbalance between the process of photosynthe-sis, degradation of organic matter, and reaeration(Granier et al. 2000). The increase in DO withdecrease in salinity of the coastal waters showedthe classical relationship between these two pa-rameters as mentioned earlier (Table 1). Thougha positive correlation (p ≥ 0.001) was observedbetween DO and temperature, the lower salinitycould be the reason behind the higher oxygen con-tent of the coastal water with marginally highertemperature. The negative correlation (p ≥ 0.001)of DO with chlorophyll showed that the photo-synthetic release of DO during this period wasnegligible. This could be due to the hindrance ofreproduction and survivability in phytoplanktonin a relatively low saline medium.
Biochemical oxygen demand
A gradual decrease in the BOD values was ob-served during the north to southward current re-versal (Fig. 2 (6)). The values ranged from 0.59to 1.59 mg l−1, highest and lowest being observedduring northward and southward circulation, re-spectively. Marine microorganisms including phy-toplankton, responsible for the BOD solely de-pend upon the salinity factor for their growth andreproduction and might have been eliminated dueto lower salinity during the transition and post-transition period, resulting in gradual decrease inBOD contents. Moreover, the lower BOD con-tents could be due to lower pollution load andlow organic matter in the coastal water during thetransition period. The strong positive correlation(p ≥ 0.001) of BOD with chlorophyll-a showedthat phytoplankters significantly contributed tothe BOD of the coastal water. Hence, the BODcontent of the coastal water decreased with grad-ual decrease in the chlorophyll-a contents fromnorth to south current reversal. A weak positivecorrelation (p ≥ 0.01) of BOD with SPM also sup-ported the above observation as the microorgan-isms including plankton significantly contributetowards the SPM content in the coastal waters.
Turbidity
The values of turbidity ranged from 7.63 to20.92 NTU during the present study, highest being
observed during northward current direction andlowest during the southward current direction.Turbidity or water transparency is an importantwater quality parameter, which decides the depthof euphotic zone and thus indirectly acts as oneof the key factors for productivity potential ofcoastal waters. A gradual decrease in turbidityvalue was noticed during the change of current di-rection from north to east after which it remainedalmost stable in the rest of the study period (Fig. 2(7)). Turbidity showed a strong positive correla-tion (p ≥ 0.001) with SPM and a weak positivecorrelation (p ≥ 0.01) with chlorophyll-a confirm-ing that the SPM, including the phytoplankton,mainly contributed to the turbidity of the coastalwater. The turbidity gradually decreased with thedecrease in the SPM and phytoplankton biomasswith reversal of current.
Suspended particulate matter
The SPM values observed, followed almost sim-ilar pattern of variation to that of the turbidity(Fig. 2 (8)). Its values ranged between 11.60 and41.00 mg l−1. Phytoplankton population and tur-bidity, which significantly contribute to the SPMvalues in marine waters, decreased from north-ward to southward circulation which could be thereason for the gradual decrease in SPM content.This is further supported by the strong positivecorrelations (p ≥ 0.001) of SPM with chlorophyll-a and turbidity.
Nitrite
Concentration of nitrite in the coastal watersdid not show any significant variation during thepresent study (Fig. 2 (9)). It ranged from 0.06 to2.91 μmol l−1. The highest and lowest values wereobtained during pre- and post-transition periods,respectively. Nitrite, the intermediate oxidationstate between ammonia and nitrate, can appearas a transient species by the oxidation of ammo-nia or by the reduction of nitrate. Thus, beingthe most unstable form of dissolved inorganicnitrogen species present in seawater, nitrite levelshowed wide fluctuations during the present inves-tigation. According to Santschi et al. (1990) andChandran and Ramamurty (1984) nitrite is often

420 Environ Monit Assess (2010) 171:411–424
released into the water as an extracellular productof the planktonic organisms. Thus, nitrite distrib-ution depicts irregular picture and wide variationsin coastal milieu.
Nitrate
Nitrate values ranged from 1.035 to 48.43 μmol l−1.The lowest value was observed during the transi-tion period (prior to southward current direction),whereas, highest value was observed during thepost-transition period. Its concentration gradu-ally decreased from the pre-transition period withclockwise change in current direction from northto SE, with a visible increase in the post-transitionperiod when the current direction was towardssouth (Fig. 2 (10)). Out of the nine oxidation states(−3 to +5) of nitrogen, nitrate is thermodynami-cally the most stable form of combined inorganicnitrogen in well-oxygenated waters. Variations innitrate and its reduced inorganic compounds arepredominantly the results of biologically activatedreactions. Quick assimilation by phytoplanktonand enhancement by surface runoff results inlarge-scale spatio-temporal variation of nitrate inthe coastal milieu (Qasim 1977; De Souza 1983;Zepp 1997; Choudhary and Panigrahy 1991). Thevisible increase in nitrate concentration during thepost-transition period could be due to the intru-sion of low saline high nitrate content water massfrom northern BOB. Furthermore, the biologicalconsumption, particularly the phytoplankton up-take, during the post-transition period could below leading to increased nitrate content in themedium. Nitrate showed a strong positive corre-lation (p ≥ 0.001) with TN, which shows that itcontributed significantly to the TN concentration.
Ammonia
Ammonia values were bellow detection limit onmany occasions particularly during north, NE,and southward current direction. However, duringeast and SE current flow its values never reducedBDL (below detection limit). It ranged from BDLto 30.70 μmol l−1. Average values for individualperiods of current direction showed a visible in-crease in ammonia content during north-east cur-rent direction after which it gradually decreased
and remained almost stable in the later part of thetransition period (Fig. 2 (11)). The above behaviorof ammonia could be ascribed to the differentdynamic conditions of the sea. During early tran-sition when the dynamics of the sea was at high-est the ammonia produced by the organisms wasremoved or utilized quickly whereas, its removalfrom the medium decreased with the reduced dy-namism of the coastal environment in later pe-riods. It did not show any significant correlationwith any parameter except a weak positive corre-lation (p ≥ 0.01) with nitrite, which could be dueto the fact that oxidation of ammonia results in thesynthesis of nitrite. Ammonia, the chief excretoryproduct of the marine invertebrates, is also wellknown as a nutrient, which is preferred over ni-trate by the phytoplankton community in certainenvironmental conditions. Thus, excretory releaseand utilization by phytoplankton significantly af-fects the concentration of ammonia (Olson 1980;Gilbert et al. 1982) in the marine environment.Relatively high standard deviation observed forammonia indicated wide fluctuation. This irreg-ular trend of ammonia could also be due to itsoxidation to other forms or reduction of nitrateto lower forms in coastal waters as reported bySankaranrayanan and Qasim (1969).
Total nitrogen
TN values ranged from 6.02 to 129.0 μmol l−1 andboth the highest and the lowest values were ob-served during the post-transition period. A mar-ginal increase in TN concentration was noticedafter the current reversal as compared to pre-transition as well as transition period (Fig. 2 (12)).Similar to that of nitrate, the fluctuations wererelatively high during the post-transition period.TN did not show any significant correlation withany parameter except a strong positive correlation(p ≥ 0.001) with nitrate, which showed that nitratecontributed to the TN concentration significantly.
Phosphate and total phosphorous
Concentration of phosphate and TP exhibited al-most similar pattern of variation during this study.The values ranged from 0.09 μmol l−1 during late

Environ Monit Assess (2010) 171:411–424 421
transition (southeast current) to 1.32 μmol l−1 dur-ing early transition (northeast current) for phos-phate. Similarly, highest TP value (1.78 μmol l−1)
was observed during pre-transition (northwardcurrent) and lowest (0.27 μmol l−1) during post-transition (southward current) period. Both, phos-phate and TP contents, remained stable duringnorth and northeast current directions; however,gradually decreased from NE to SE and remainedstable during the later part of transition (Fig. 2(13 and 14)). A strong positive correlation (p ≥0.001) between phosphate and TP showed that in-organic phosphate significantly contributed to theTP concentration. Both phosphate and TP showedstrong positive correlation (p ≥ 0.001) with salin-ity. This showed that lower concentration of phos-phate during the later part of transition is dueto dilution of the coastal water with hypo-salinewater mass with lower phosphate content. More-over, phosphate concentration in coastal watersdepends upon its concentration in the freshwaterthat mixed with the seawater within the land–seainteraction zone, phytoplankton uptake, additionthrough localized upwelling and replenishment asa result of microbial decomposition of organicmatter. A strong positive correlation (p ≥ 0.001)of phosphate and TP with chlorophyll-a showedthat phosphorous, which could be a limiting fac-tor for phytoplankton growth (Cole and Sanford1989), is dominant over nitrogen at this locationduring the study period.
Silicate
Silicate values ranged from 1.58 to 23.10 μmol l−1.A gradual decrease in silicate concentration dur-ing northward to eastward change in currentwas noticed after which it again increased up tothe post-transition period (Fig. 2 (15)). Silicateshowed a moderately strong negative correlation(p ≥ 0.005) with salinity. Since freshwater is themain source of silicate (Lal 1978), the above nega-tive correlation of silicate with salinity describedthe drift of silicate rich hypo-saline water fromnorthern BOB, as the other possibilities like pre-cipitation and land drainage to the coastal wa-ter was not there during this period. Apart fromthe physical mixing of seawater with freshwater(Purushothaman and Venugopalan 1972), factors
like adsorption of reactive silicate into suspendedsedimentary particles (Lal 1978), chemical inter-action with clay minerals (Aston 1980; Goudaand Panigrahy 1992), co-precipitation with humiccompounds and iron (Stephns and Oppenheime1972), and biological removal by phytoplankton,especially by diatoms and silicoflagellates (Rao1969; Aston 1980; Liss and Spencer 1970) cansignificantly affect the spatio-temporal variationof silicate in coastal waters.
Chlorophyll-a
The chlorophyll-a values gradually decreasedfrom north to southward as the current direction
Dendrogram
South-east
East
South
North-east
North
Similarity
Dendrogram
North-east
North
South-east
East
South
0 5 10 15 20 25 30 35
Dissimilarity
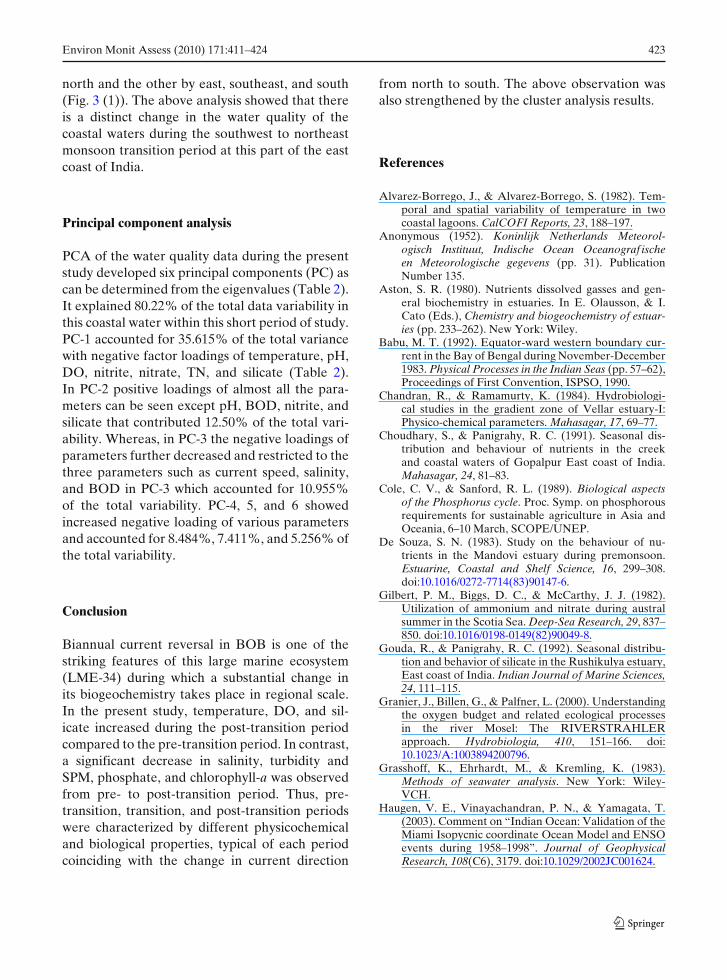
Fig. 3 (1 and 2) Dendrogram showing similarity and dis-similarity clusters of different periods of current directions
422 Environ Monit Assess (2010) 171:411–424
changed and remained almost stable during thelater half of the transition period (Fig. 2 (16)). Itranged from 0.57 mg m−3 during the southwardcirculation to 4.25 mg m−3 during the northwardcurrent direction. Strong positive correlation (p ≥0.001) of chlorophyll-a with salinity showed that∼10 psu decrease in salinity from pre- to post-transition period significantly affected the phyto-plankton growth and reproduction resulting in thelower phytoplankton growth. The Primary pro-ductivity potential of the marine environmentsdepends upon the phytoplankters, which alonecontributes ∼90% of the total marine primaryproduction. Thus, chlorophyll-a, which constitutesthe chief photosynthetic pigment of phytoplank-ters, is an index that would provide the primaryproduction potential upon which the biodiversity,biomass, and carrying capacity of that system de-pends. The increased temperature and pH alsocould have hampered the phytoplankton produc-tivity and the same is reflected with negative cor-relation of these two parameters with chlorophyll-a. As described earlier, phosphate and TP werefound to be the limiting factor for phytoplanktongrowth during this study.
Cluster analysis
Data grouped according to the surface water cur-rent direction were analyzed for both similarityand dissimilarity clusters. The dendrogram forsimilarity showed two clusters (Fig. 3 (1)). Thegroups north and northeast formed the first clus-ter, whereas, east, southeast, and south formedthe other cluster. This showed that during theperiod of north and northeast current directionthe coastal water quality was almost similar. Sim-ilarly, the other cluster formed showed that theperiod of east, southeast, and south current di-rection behaved as a single time period as far asthe water quality is concerned. In the dissimilaritycluster analysis four clusters were formed (Fig. 3(1)). Groups such as north, northeast, and southindividually formed one cluster each, whereas,east and southeast together formed one cluster.A similar pattern of behavior in the coastal waterbody, as was noticed from the similarity cluster,was seen in dissimilarity clusters also. The dissimi-larity between the individual periods of transitionwas less compared to the dissimilarity between thetwo groups they formed, i.e., one by northeast and
Table 2 Eigenvalues andfactor loadings ofprincipal componentanalysis
F1 F2 F3 F4 F5 F6
Eigenvalue 5.698 2.000 1.753 1.357 1.186 0.841Variability (%) 35.615 12.500 10.955 8.484 7.411 5.256Cumulative % 35.615 48.116 59.071 67.555 74.966 80.222Factor loadings
Current speed 0.334 0.241 −0.439 0.129 0.478 0.486Temperature −0.865 0.050 0.015 −0.054 −0.178 0.018pH −0.534 −0.195 0.138 0.628 0.062 −0.191Salinity 0.888 0.017 −0.086 −0.127 −0.244 −0.149DO −0.849 0.028 0.029 0.097 0.057 −0.103BOD 0.597 −0.183 −0.358 −0.180 −0.037 0.114Turbidity 0.448 0.069 0.344 0.566 0.460 −0.036SPM 0.710 0.176 0.215 0.383 −0.092 0.030Nitrite −0.106 −0.265 0.755 −0.361 0.004 0.009Nitrate −0.245 0.936 0.022 −0.115 0.038 −0.103Ammonia 0.071 0.048 0.587 0.179 −0.427 0.608TN −0.270 0.906 0.192 −0.110 −0.016 0.002Silicate −0.256 −0.189 0.347 −0.447 0.644 0.149Phosphate 0.718 0.092 0.334 −0.102 0.184 −0.312TP 0.752 0.068 0.234 −0.007 −0.021 −0.140Chl-a 0.829 0.117 0.012 −0.148 −0.060 0.029
Environ Monit Assess (2010) 171:411–424 423
north and the other by east, southeast, and south(Fig. 3 (1)). The above analysis showed that thereis a distinct change in the water quality of thecoastal waters during the southwest to northeastmonsoon transition period at this part of the eastcoast of India.
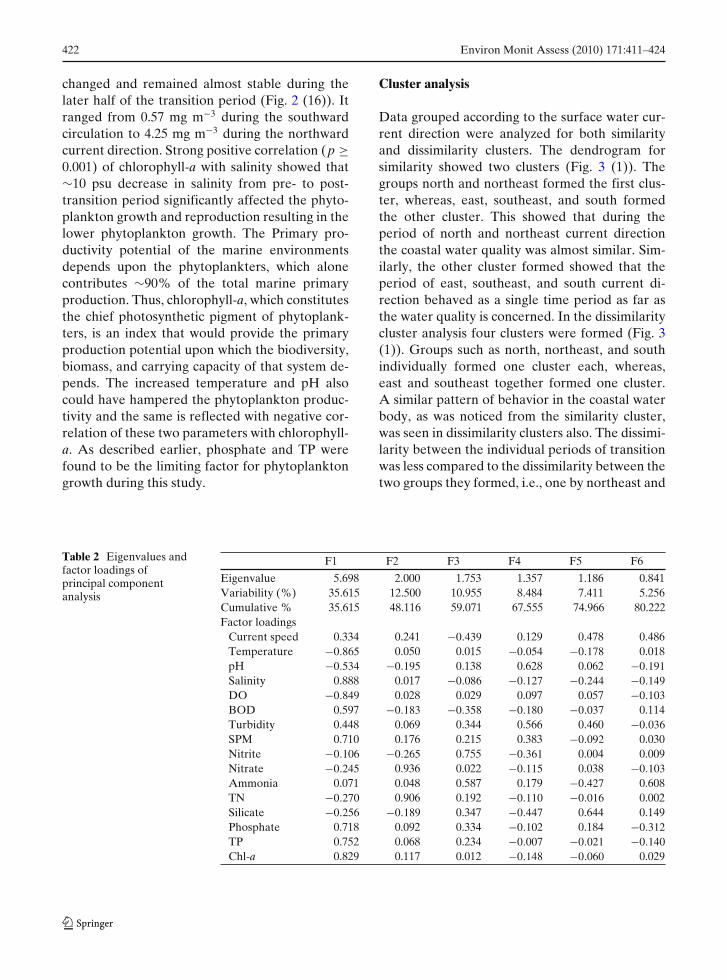
Principal component analysis
PCA of the water quality data during the presentstudy developed six principal components (PC) ascan be determined from the eigenvalues (Table 2).It explained 80.22% of the total data variability inthis coastal water within this short period of study.PC-1 accounted for 35.615% of the total variancewith negative factor loadings of temperature, pH,DO, nitrite, nitrate, TN, and silicate (Table 2).In PC-2 positive loadings of almost all the para-meters can be seen except pH, BOD, nitrite, andsilicate that contributed 12.50% of the total vari-ability. Whereas, in PC-3 the negative loadings ofparameters further decreased and restricted to thethree parameters such as current speed, salinity,and BOD in PC-3 which accounted for 10.955%of the total variability. PC-4, 5, and 6 showedincreased negative loading of various parametersand accounted for 8.484%, 7.411%, and 5.256% ofthe total variability.
Conclusion
Biannual current reversal in BOB is one of thestriking features of this large marine ecosystem(LME-34) during which a substantial change inits biogeochemistry takes place in regional scale.In the present study, temperature, DO, and sil-icate increased during the post-transition periodcompared to the pre-transition period. In contrast,a significant decrease in salinity, turbidity andSPM, phosphate, and chlorophyll-a was observedfrom pre- to post-transition period. Thus, pre-transition, transition, and post-transition periodswere characterized by different physicochemicaland biological properties, typical of each periodcoinciding with the change in current direction
from north to south. The above observation wasalso strengthened by the cluster analysis results.
References
Alvarez-Borrego, J., & Alvarez-Borrego, S. (1982). Tem-poral and spatial variability of temperature in twocoastal lagoons. CalCOFI Reports, 23, 188–197.
Anonymous (1952). Koninlijk Netherlands Meteorol-ogisch Instituut, Indische Ocean Oceanograf ischeen Meteorologische gegevens (pp. 31). PublicationNumber 135.
Aston, S. R. (1980). Nutrients dissolved gasses and gen-eral biochemistry in estuaries. In E. Olausson, & I.Cato (Eds.), Chemistry and biogeochemistry of estuar-ies (pp. 233–262). New York: Wiley.
Babu, M. T. (1992). Equator-ward western boundary cur-rent in the Bay of Bengal during November-December1983. Physical Processes in the Indian Seas (pp. 57–62),Proceedings of First Convention, ISPSO, 1990.
Chandran, R., & Ramamurty, K. (1984). Hydrobiologi-cal studies in the gradient zone of Vellar estuary-I:Physico-chemical parameters. Mahasagar, 17, 69–77.
Choudhary, S., & Panigrahy, R. C. (1991). Seasonal dis-tribution and behaviour of nutrients in the creekand coastal waters of Gopalpur East coast of India.Mahasagar, 24, 81–83.
Cole, C. V., & Sanford, R. L. (1989). Biological aspectsof the Phosphorus cycle. Proc. Symp. on phosphorousrequirements for sustainable agriculture in Asia andOceania, 6–10 March, SCOPE/UNEP.
De Souza, S. N. (1983). Study on the behaviour of nu-trients in the Mandovi estuary during premonsoon.Estuarine, Coastal and Shelf Science, 16, 299–308.doi:10.1016/0272-7714(83)90147-6.
Gilbert, P. M., Biggs, D. C., & McCarthy, J. J. (1982).Utilization of ammonium and nitrate during australsummer in the Scotia Sea. Deep-Sea Research, 29, 837–850. doi:10.1016/0198-0149(82)90049-8.
Gouda, R., & Panigrahy, R. C. (1992). Seasonal distribu-tion and behavior of silicate in the Rushikulya estuary,East coast of India. Indian Journal of Marine Sciences,24, 111–115.
Granier, J., Billen, G., & Palfner, L. (2000). Understandingthe oxygen budget and related ecological processesin the river Mosel: The RIVERSTRAHLERapproach. Hydrobiologia, 410, 151–166. doi:10.1023/A:1003894200796.
Grasshoff, K., Ehrhardt, M., & Kremling, K. (1983).Methods of seawater analysis. New York: Wiley-VCH.
Haugen, V. E., Vinayachandran, P. N., & Yamagata, T.(2003). Comment on “Indian Ocean: Validation of theMiami Isopycnic coordinate Ocean Model and ENSOevents during 1958–1998”. Journal of GeophysicalResearch, 108(C6), 3179. doi:10.1029/2002JC001624.
424 Environ Monit Assess (2010) 171:411–424
La Fond, E. C. (1957). Oceanographic studies in the Bayof Bengal. Proceedings of the Indiana Academy ofSciences, 46, 1–46.
Lal, D. (1978). Transfer of Chemical species through es-tuaries to oceans. In Proc. of UNESCO/SCOR work-shop (pp. 166–170). Melreus, Belgium.
Liss, P. S., & Spencer, C. P. (1970). A biological process inthe removal of silicate from seawater. Geochimica etCosmochimica Acta, 34, 1073–1088.
Muraleedharan, P. M. (1993). Intermonsoonal equatorialjet. Indian Journal of Marine Sciences, 22, 1–7.
Olson, R. J. (1980). Nitrate and ammonium uptake inAntarctic waters. Limnology and Oceanography, 26,1064–1074.
Parsons, T. R., Maita, Y., & Lalli, C. M. (1984). A manualof chemical and biological methods for seawater analy-sis. New York: Pergamon.
Purushothaman, A., & Venugopalan, V. K. (1972). Distrib-ution of dissolved Silicon in the Vellar Estuary. IndianJournal of Marine Sciences, 1, 103–105.
Qasim, S. Z. (1977). Biological productivity of the IndianOcean. Indian Journal of Marine Sciences, 6, 122–137.
Ramaraju, V. S., Sarma, V. V., Rao, P. B., & Rao, V. S.(1992). Physical processes in Indian seas. In Proc. FirstConvention, ISPSO, 1992 (pp. 75–78).
Rao, S. D. V. (1969). Asterionella Japonica bloom anddiscoloration off Waltair, Bay of Bengal. Limnologyand Oceanography, 14, 632–634.
Riley, J. P., & Chester, R. (1971). An introduction to marinechemistry. London: Academic.
Sadhuram, Y., Rao, B. P., Rao, D. P., Shastri, P. N. M.,& Subrahmanyam, M. V. (2004). Seasonal variabil-ity of cyclone heat potential in the Bay of Bengal.Natural Hazards, 31, 191–209. doi:10.1023/B:NHAZ.0000031313.43492.a8.
Sankaranrayanan, V. N., & Qasim, S. Z. (1969). Nutrientsof the Cochin Backwaters in relation to environmentalcharacteristics. Marine Biology (Berlin), 2, 236–247.doi:10.1007/BF00351146.
Santschi, P., Honener, P., Benoit, G., & Brink, M. B.(1990). Chemical process at the sediment–water in-terface. Marine Chemistry, 30, 269–315. doi:10.1016/0304-4203(90)90076-O.
Saravanane, N., Nandakumar, K., Durairaj, G., & Nair, K.V. K. (2000). Plankton as indicators of coastal waterbodies during southwest to northeast monsoon transi-tion at Kalpakkam. Current Science, 78, 173–176.
Satpathy, K. K. (1996). Seasonal distribution of nutrientsin the coastal waters of Kalpakkam, East Coast of
India. Indian Journal of Marine Sciences, 25, 221–224.
Satpathy, K. K., & Nair, K. V. K. (1990). Impact of powerplant discharge on the physico-chemical characteris-tics of Kalpakkam coastal waters. Mahasagar, 23, 117–125.
Shetye, S. R., Gouveia, A. D., Shenoi, S. S. C., Sundar, D.,Michael, G. S., & Nampoothiri, G. (1993). The westernboundary current of the seasonal sub-tropical gyre inthe Bay of Bengal. Journal of Geophysical Research,98, 945–954. doi:10.1029/92JC02070.
Shetye, S. R., Shenoi, S. S. C., Gouveia, A. D., Michael,G. S., Sundar, D., & Nampoothiri, G. (1991). Winddriven coastal upwelling along the western bound-ary of the Bay of Bengal during the southwestmonsoon. Continental Shelf Research, 11, 1397–1408.doi:10.1016/0278-4343(91)90042-5.
Somayajulu, Y. K., Ramanamurthy, T. V., Prasannakumar,S., & Sastry, J. S. (1987). Hydrographic characteriat-ics of central Bay of Bengal waters during southwestmonsoon of 1983. Indian Journal of Marine Sciences,16, 207–217.
Stephns, C., & Oppenheime, C. H. (1972). Silica contentsin the Northwestern Florida Gulf Coast. Contributionto Marine Science. University of Texas, 16, 99–108.
Unnikrishnan, A. S., & Bahulayan, N. (1991). Simulationof barotropic wind driven circulation in the Bay ofBengal and Andaman Sea during pre-monsoon andpost-monsoon seasons. Indian Journal of MarineSciences, 20, 97–101.
Varkey, M. J., Murty, V. S. N., & Suryanaryan, A. (1996).Physical Oceanography of the Bay of Bengal andAndaman Sea. In A. D. Ansell, R. N. Gibson, &M. Barnes (Eds.), Oceanography and marine biology(pp. 34: 1–70). London: UCL.
Vinayachandran, P. N., Masumoto, Y., Mikawa, T., &Ymagata, T. (1999). Intrusion of the southwest mon-soon current into the Bay of Bengal. Journal ofGeophysical Research, 104, 11077–11085. doi:10.1029/1999JC900035.
Wyrtki, K. (1973). Physical oceanography of the IndianOcean. In B. Zeitzshel (Ed.), Biology of the IndianOcean. Berlin: Springer.
Zepp, R. G. (1997). Interactions of marine biogeochemi-cal cycles and the photodegradation of dissolved or-ganic carbon and dissolved organic nitrogen. In A.Gianguzza, E. Pelizzetti, & S. Sammarkano (Eds.),Marine chemistry (pp. 329–352). London: KluwerAcademic.