Advanced X-ray absorption and emission spectroscopy: in situ catalytic studies
Upload
khangminh22Category
view
0download
0
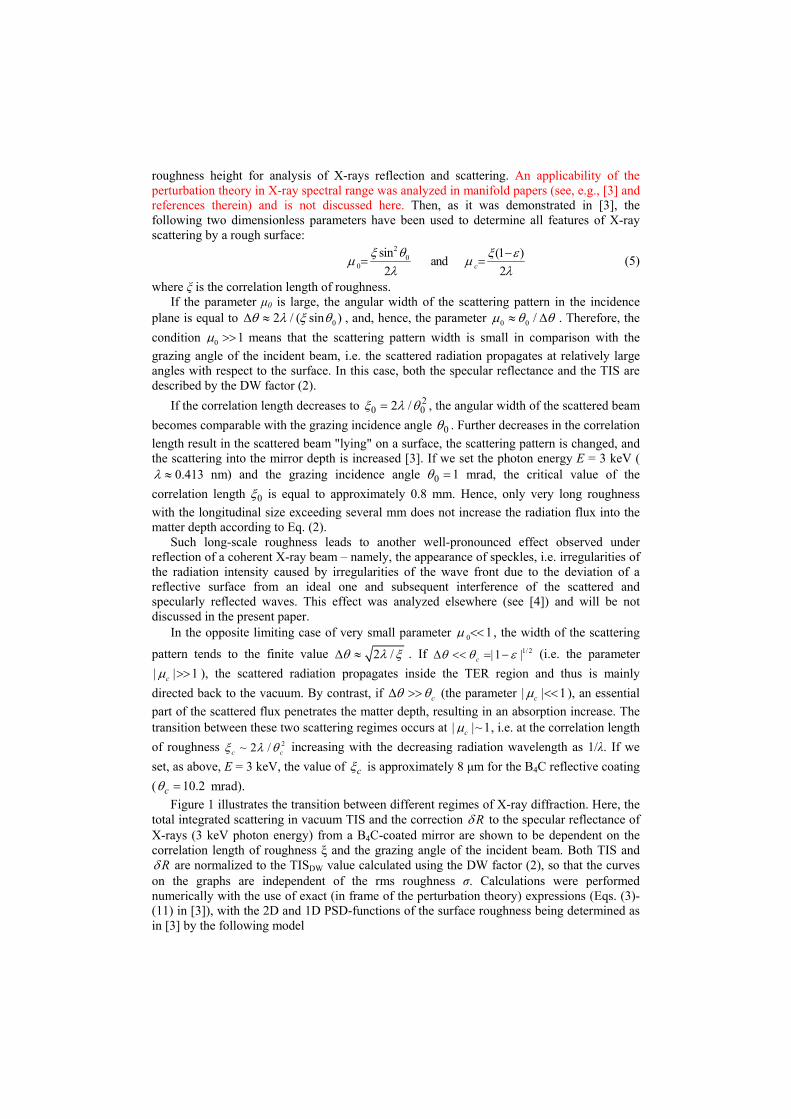
The effect of the surface roughness on X-ray absorption by mirrors operating at extremely small grazing angles
MINGWU WEN,1 IGOR V. KOZHEVNIKOV,2 FRANK SIEWERT,3 ALEKSEY V. BUZMAKOV,2 CHUN XIE,4 QIUSHI HUANG,1 ZHANSHAN WANG,1,* LIUBOV
SAMOYLOVA,5 AND HARALD SINN 5
1MOE Key Laboratory of Advanced Micro-Structured Materials, Institute of Precision Optical Engineering, School of Physics, Science, and Engineering, Tongji University, Shanghai 200092, China 2Shubnikov Institute of Crystallography of Federal Scientific Research Centre “Crystallography and Photonics” of Russian Academy of Sciences, Moscow 119333, Russia 3Helmholtz-Zentrum Berlin für Materialien und Energie GmbH, Albert Einstein Str. 15, 12489 Berlin, Germany 4Sino-German College of Engineering, Tongji University, Shanghai 200092, China 5European XFEL GmbH, Holzkoppel 4, 22869 Schenefeld, Germany *[email protected]
Abstract: This study theoretically analyzes an increase in X-ray absorption by a grazing incidence mirror due to its surface roughness. We demonstrate that the increase in absorption can be several hundred times larger than predicted by the Nevot-Croce formula. As a result, absorption enhances by several times compared to a perfectly smooth mirror despite the extremely small grazing angle of an incident X-ray beam (a fraction of the critical angle of the total external reflection) and the high quality of the reflecting surface (the roughness height was 0.5 nm in modeling). The main contribution to the absorption increase was dictated by the mid-scale roughness (waviness) of the virgin substrate surface, whose quality thus defines an absorption enhancement. The approach was applied to the analysis of two real mirrors used in a synchrotron (BESSY-I) and a European X-ray free-electron laser (XFEL) beamline. The modern surface finishing technology of elastic emission machining provides extremely low substrate waviness, guaranteeing the negligible effect of the surface roughness on the absorption increase.
© 2018 Optical Society of America
OCIS codes: (290.5880) Scattering, rough surfaces; (290.5825) Scattering theory; (010.1030) Absorption; (340.7480) X-rays, soft x-rays, extreme ultraviolet (EUV).
References and links
1. P. Beckmann and A. Spizzichino, The scattering of electromagnetic waves from rough surfaces (Pergamon, 1963).
2. L. Nevot and P. Croce, “Caracterisation des surfaces par reflexion rasante de rayons X. Application à l’etude du polissage de verres silicates,” Rev. Phys. Appl. 15(3), 761-779 (1980).
3. M. Wen, I. V. Kozhevnikov, and Z. Wang, “Reflection of X-rays from a rough surface at extremely small grazing angles,” Opt. Express 23(19), 24220-24235 (2015).
4. V. V. Yashchuk, L. Samoylova, I. V. Kozhevnikov, “Specification of x-ray mirrors in terms of system performance: new twist to an old plot,” Opt. Eng. 54(2), 025108 (2015).
5. A. -L. Barabǎsi and H. E. Stanley, Fractal concepts in surface growth (Syndicate of the University of Cambridge, 1995).
6. The center for X-ray optics, http://henke.lbl.gov/optical_constants/getdb2/html. 7. M. Störmer, F. Siewert, and H. Sinn, “Preparation and characterization of B4C coatings for advanced research
light sources,” J. Synchr. Rad. 23(1), 50-58 (2016). 8. L. Peverini, E. Ziegler, T. Bigault, and I. Kozhevnikov, “Dynamic scaling of roughness at the early stage of
tungsten film growth,” Phys. Rev. B 76(4), 045411 (2007).
brought to you by COREView metadata, citation and similar papers at core.ac.uk
provided by HZB Repository

9. E. O. Filatova, L. Peverini, E. Ziegler, I. V. Kozhevnikov, P. Jonnard, and J. -M. André, “Evolution of surface
morphology at the early stage of Al2O3 film growth on a rough substrate,” J. Phys. Condens. Matter 22(34), 345003 (2010).
10. . H. Petersen, C. Jung, C. Hellwig, W.B. Peatman and W. Gudat, “Review of plane grating focusing for soft X-ray monochromators,” Rev.Sci.Instrum. 66(1), 1-14 (1995).
11. K. Boller, R.-P. Haelbich, H. Hogrefe, W. Jark, and C. Kunz, “Investigation of carbon contamination of mirror surfaces exposed to synchrotron radiation,” Nucl. Instrum. Methods A, 208, 273-279 (1983).
12. I.V. Kozhevnikov, A.V. Buzmakov, F. Siewert, K. Tiedke, M. Stormer, L. Samoylova, H. Sinn, “Growth of nano-dots on the grazing incidence mirror surface under FEL irradiation,” J. Synchr. Rad., 23, 78-90 (2016).
13. K. Yamauchi, H. Mimura, K. Inagaki and Y. Mori, “Figuring with sub-nanometer-level accuracy by numerically controlled elastic emission machining”, Rev. Sci. Instrum. 73(11) 4028-4033 (2002).
14. F. Siewert, J. Buchheim, T. Zeschke, M. Störmer, G. Falkenberg and R. Sankari, “On the characterization of ultra-precise X-ray optical components: advances and challenges in ex situ metrology,” J. Synchrotron Rad. 21, 968-975 (2014).
15. F. Siewert, T. Zeschke, T. Arnold, H. Paetzelt, and V. V. Yashchuk, “Linear chirped slope profile for spatial calibration in slope measuring deflectometry,” Rev. Sci. Instrum. 87, 051907 (2016).
1. Introduction
The mirrors placed in beamlines of 3rd generation synchrotrons and, especially, X-ray free electron lasers must withstand an extremely high radiation load and thus should absorb as small a portion of the incident radiation power as possible. For this purpose, the mirrors should be installed with respect to the incident beam at a very small grazing angle θ0, which should be a fraction of the critical angle θc of the total external reflection (TER). Neglecting the roughness effect and according to the Fresnel formula, the reflectivity at the vanishingly small grazing angle is approximately expressed as
1/2 3/20 0 0( ) 1 4 Im(1 ) 1 2 /F cR (1)
where 1 i is the complex dielectric permittivity of a reflecting coating, δ and γ
represent the refraction and absorption respectively, and the angle θ0 is in radians. The first approximate equality is valid for very small grazing angle 0 c and the last one in Eq. (1)
is valid for low-absorbing materials with / 1 . Equation (1) demonstrates that the
maximal reflectivity RF and, hence, the minimal absorptivity (the ratio of the absorbed power to the incident one) 1F FA R at the fixed 0 c is achieved for a reflective coating
with the minimal value of 3/2/ . The last condition is fulfilled in the hard X-ray region for
the lightest materials, such as carbon, boron carbide, boron, etc., with the first two being the most preferable from a technological point of view. For instance, for carbon layer, if we set photon energy E=6 keV, the grazing angle θ0 = 1 mrad ( c 5 mrad ~ 5 θ0), the value of AF
calculated with Eq. (1) is approximately 0.122%, which is very close to the one calculated with the exact Fresnel formula (0.123%).
Evidently, no real surface can be considered as a perfectly smooth for X-rays. The surface roughness results in the appearance of scattered radiation directed to both the vacuum and the mirror depth and decreases the reflectivity FR R R by the value R . The absorptivity is
thus equal to 1 TIS TISFA R A R , where TIS is the total integrated scattering
into the vacuum, and AF is the absorptivity of a perfectly smooth mirror. Therefore, to analyze a change in the radiation absorption due to the roughness effect, we should evaluate the difference of TISR in dependence on the roughness parameters.
The simplest way to describe the roughness effect is to modify the Fresnel reflectivity by introducing the Debye-Waller (DW) [1] or Nevot-Croce (NC) [2] factors, which are valid in the limiting cases of extremely large or vanishingly small correlation lengths of the roughness ξ, respectively (for more details, see [3] and references therein). If the reflecting surface is very smooth and the grazing angle is small, the factors are written as
2
00 0 0 0
4 sinDW ; ( ) ( ) 1 DW ; TIS( ) ( ) DW;
F FR R R
(2)
2
20 0 0 0 0
4NC sin Re cos ; ( ) ( ) 1 NC ; TIS( ) 0; 0
FR R
(3)
where λ is the radiation wavelength, and the only roughness parameter, the root-mean-squared (rms) value σ, appears in Eqs. (2) and (3).
Equation (2) shows that TISR or, equivalently, TIS FR R in the limiting case of
the large correlation length. In other words, long-scale roughness does not increase the radiation flux directed into the depth of a mirror and, therefore, does not increase the radiation absorption as compared with a perfectly smooth surface.
In the opposite limiting case of a vanishingly small correlation length, the scattered radiation disappears altogether, while the reflectance decreases due to increasing coherent transmittance (and subsequent absorption) of the wave into the matter depth. The small-scale roughness effect, thus, is analogous to that of a smooth and gradual variation of the dielectric constant near a surface. According to Eq. (3), the radiation absorption is increased and the absorptivity is written at very small grazing incidence angles as
2
0 0 03/2
221 ( ) 1 ; ; / 1 ; 0c
cA R
(4)
If the rms roughness is set to 0.5 nm in Eq. (4), where the photon energy E = 3 keV (0.413 nm) and the critical angle 10c mrad, the absorption is increased insignificantly
(by only approximately 0.6 rel.%) in comparison with the perfectly smooth surface (1). Notice that the critical angle of TER is proportional to λ for hard X-rays. Hence, the relative increase in absorption ( ) /F FA A A is independent of the wavelength in Eq. (4).
Therefore, the roughness effect on the absorption of hard X-rays by grazing incidence mirrors seems to be negligible in the limited cases of extremely large and very small correlation lengths of roughness. At first glance, it would be logical to suggest that the roughness effect is also very weak for arbitrary correlation lengths lying between these limiting cases. However, this is not evident. As it was demonstrated in [3], the DW and NC factors for the reflectivity correction are both invalid at extremely small grazing angles, so that the value of R may be many times more than that given in Eqs. (2) and (3). Hence, the roughness effect on absorption should be analyzed in more detail at extremely small grazing angles of incoming X-ray beams.
The goal of the present paper is to estimate the effect of the surface roughness on the increase in absorption of grazing incidence mirrors operating at extremely small grazing incidence angles. Such an analysis is important from the practical point of view as increase in X-ray absorption results in increasing thermal deformations of mirrors. At first, we analyze general principles of the roughness effect on X-ray absorption basing on a simplified roughness model (sections 2 and 3). Then the approach is applied to analysis of two real mirrors used in synchrotron (BESSY-I) and European XFEL beamlines (section 4). The main results of consideration are summarized in section 5.
We consider the present paper as a continuation of [3], which is available in open access. Therefore, below we will refer to formulas, which are sometimes cumbersome, that were obtained in [3] to shorten the present paper volume.
2. X-ray absorption at extremely small grazing incidence angles
Because this study is interested in evaluating very smooth surfaces with the rms roughness of a few angstroms and small grazing angles, we will use the perturbation theory on the
roughness height for analysis of X-rays reflection and scattering. An applicability of the perturbation theory in X-ray spectral range was analyzed in manifold papers (see, e.g., [3] and references therein) and is not discussed here. Then, as it was demonstrated in [3], the following two dimensionless parameters have been used to determine all features of X-ray scattering by a rough surface:
20
0
sin (1 ) and
2 2c
(5)
where ξ is the correlation length of roughness. If the parameter μ0 is large, the angular width of the scattering pattern in the incidence
plane is equal to 02 / ( sin ) , and, hence, the parameter 0 0 / . Therefore, the
condition 0 1 means that the scattering pattern width is small in comparison with the
grazing angle of the incident beam, i.e. the scattered radiation propagates at relatively large angles with respect to the surface. In this case, both the specular reflectance and the TIS are described by the DW factor (2).
If the correlation length decreases to 20 02 / , the angular width of the scattered beam
becomes comparable with the grazing incidence angle 0 . Further decreases in the correlation
length result in the scattered beam "lying" on a surface, the scattering pattern is changed, and the scattering into the mirror depth is increased [3]. If we set the photon energy E = 3 keV (
0.413 nm) and the grazing incidence angle 0 1 mrad, the critical value of the
correlation length 0 is equal to approximately 0.8 mm. Hence, only very long roughness
with the longitudinal size exceeding several mm does not increase the radiation flux into the matter depth according to Eq. (2).
Such long-scale roughness leads to another well-pronounced effect observed under reflection of a coherent X-ray beam – namely, the appearance of speckles, i.e. irregularities of the radiation intensity caused by irregularities of the wave front due to the deviation of a reflective surface from an ideal one and subsequent interference of the scattered and specularly reflected waves. This effect was analyzed elsewhere (see [4]) and will be not discussed in the present paper.
In the opposite limiting case of very small parameter 0 1 , the width of the scattering
pattern tends to the finite value 2 / . If 1/ 2| 1 |c (i.e. the parameter
| | 1c ), the scattered radiation propagates inside the TER region and thus is mainly
directed back to the vacuum. By contrast, if c (the parameter | | 1c ), an essential
part of the scattered flux penetrates the matter depth, resulting in an absorption increase. The transition between these two scattering regimes occurs at | |~ 1c , i.e. at the correlation length
of roughness 2~ 2 /с c increasing with the decreasing radiation wavelength as 1/λ. If we
set, as above, E = 3 keV, the value of с is approximately 8 μm for the B4C reflective coating
( 10.2c mrad).
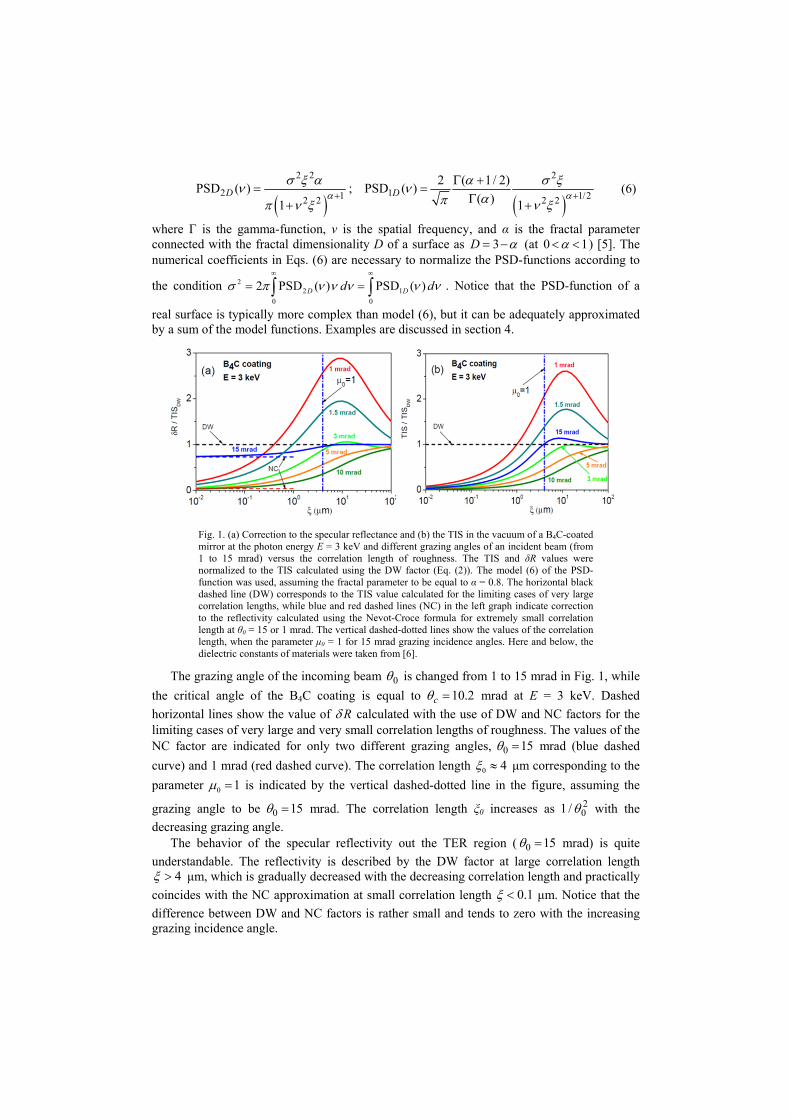
Figure 1 illustrates the transition between different regimes of X-ray diffraction. Here, the total integrated scattering in vacuum TIS and the correction R to the specular reflectance of X-rays (3 keV photon energy) from a B4C-coated mirror are shown to be dependent on the correlation length of roughness ξ and the grazing angle of the incident beam. Both TIS and
R are normalized to the TISDW value calculated using the DW factor (2), so that the curves on the graphs are independent of the rms roughness σ. Calculations were performed numerically with the use of exact (in frame of the perturbation theory) expressions (Eqs. (3)-(11) in [3]), with the 2D and 1D PSD-functions of the surface roughness being determined as in [3] by the following model
2 2 2
2 11 1/22 2 2 2
2 ( 1/ 2)PSD ( ) ; PSD ( )
( )1 1D D
(6)
where Γ is the gamma-function, ν is the spatial frequency, and α is the fractal parameter connected with the fractal dimensionality D of a surface as 3D (at 0 1 ) [5]. The numerical coefficients in Eqs. (6) are necessary to normalize the PSD-functions according to
the condition 22 1
0 0
2 PSD ( ) PSD ( )D Dd d
. Notice that the PSD-function of a
real surface is typically more complex than model (6), but it can be adequately approximated by a sum of the model functions. Examples are discussed in section 4.
Fig. 1. (a) Correction to the specular reflectance and (b) the TIS in the vacuum of a B4C-coated mirror at the photon energy E = 3 keV and different grazing angles of an incident beam (from 1 to 15 mrad) versus the correlation length of roughness. The TIS and δR values were normalized to the TIS calculated using the DW factor (Eq. (2)). The model (6) of the PSD-function was used, assuming the fractal parameter to be equal to α = 0.8. The horizontal black dashed line (DW) corresponds to the TIS value calculated for the limiting cases of very large correlation lengths, while blue and red dashed lines (NC) in the left graph indicate correction to the reflectivity calculated using the Nevot-Croce formula for extremely small correlation length at θ0 = 15 or 1 mrad. The vertical dashed-dotted lines show the values of the correlation length, when the parameter μ0 = 1 for 15 mrad grazing incidence angles. Here and below, the dielectric constants of materials were taken from [6].
The grazing angle of the incoming beam 0 is changed from 1 to 15 mrad in Fig. 1, while
the critical angle of the B4C coating is equal to 10.2с mrad at E = 3 keV. Dashed
horizontal lines show the value of R calculated with the use of DW and NC factors for the limiting cases of very large and very small correlation lengths of roughness. The values of the NC factor are indicated for only two different grazing angles, 0 15 mrad (blue dashed
curve) and 1 mrad (red dashed curve). The correlation length 0 4 μm corresponding to the
parameter 0 1 is indicated by the vertical dashed-dotted line in the figure, assuming the
grazing angle to be 0 15 mrad. The correlation length ξ0 increases as 201 / with the
decreasing grazing angle. The behavior of the specular reflectivity out the TER region ( 0 15 mrad) is quite
understandable. The reflectivity is described by the DW factor at large correlation length 4 μm, which is gradually decreased with the decreasing correlation length and practically
coincides with the NC approximation at small correlation length 0.1 μm. Notice that the
difference between DW and NC factors is rather small and tends to zero with the increasing grazing incidence angle.
The similar behavior demonstrates the total integrated scattering: it is described by the
DW formula at large correlation length and tends to zero proportionally at small ξ [3].
The only feature is the maximum in the TIS curve at the correlation length ~ 8 μm, where
the TIS value exceeds R . This fact means that the integral reflectivity TIS TISFR R R R is greater than the Fresnel reflectivity, i.e. a rough surface
directs a larger part of an incident beam back to vacuum compared with an ideally smooth surface. The effect is only observed, if an X-ray beam falls onto a surface outside the TER region, and its application in X-ray optics is thus unlikely.
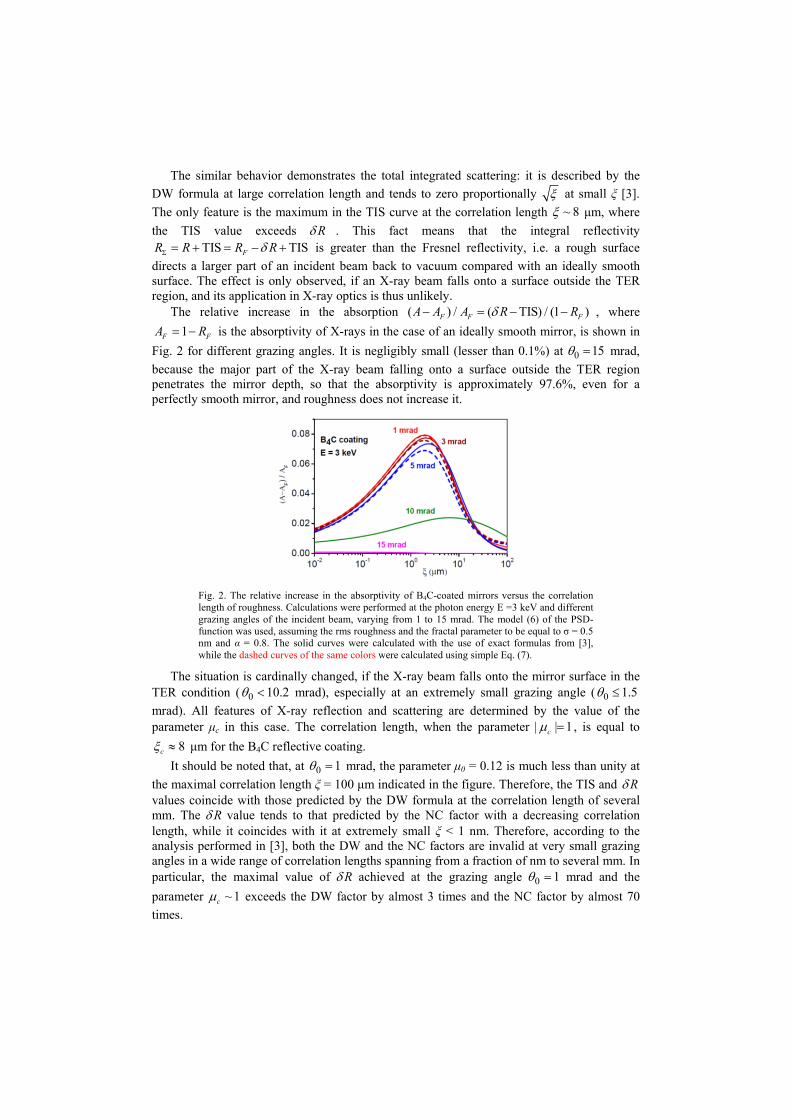
The relative increase in the absorption ( ) / ( TIS) / (1 )F F FA A A R R , where
1F FA R is the absorptivity of X-rays in the case of an ideally smooth mirror, is shown in
Fig. 2 for different grazing angles. It is negligibly small (lesser than 0.1%) at 0 15 mrad,
because the major part of the X-ray beam falling onto a surface outside the TER region penetrates the mirror depth, so that the absorptivity is approximately 97.6%, even for a perfectly smooth mirror, and roughness does not increase it.
Fig. 2. The relative increase in the absorptivity of B4C-coated mirrors versus the correlation length of roughness. Calculations were performed at the photon energy E =3 keV and different grazing angles of the incident beam, varying from 1 to 15 mrad. The model (6) of the PSD-function was used, assuming the rms roughness and the fractal parameter to be equal to σ = 0.5 nm and α = 0.8. The solid curves were calculated with the use of exact formulas from [3], while the dashed curves of the same colors were calculated using simple Eq. (7).
The situation is cardinally changed, if the X-ray beam falls onto the mirror surface in the TER condition ( 0 10.2 mrad), especially at an extremely small grazing angle ( 0 1.5
mrad). All features of X-ray reflection and scattering are determined by the value of the parameter μc in this case. The correlation length, when the parameter | | 1c , is equal to
8c μm for the B4C reflective coating.
It should be noted that, at 0 1 mrad, the parameter μ0 = 0.12 is much less than unity at
the maximal correlation length ξ = 100 μm indicated in the figure. Therefore, the TIS and R values coincide with those predicted by the DW formula at the correlation length of several mm. The R value tends to that predicted by the NC factor with a decreasing correlation length, while it coincides with it at extremely small ξ < 1 nm. Therefore, according to the analysis performed in [3], both the DW and the NC factors are invalid at very small grazing angles in a wide range of correlation lengths spanning from a fraction of nm to several mm. In particular, the maximal value of R achieved at the grazing angle 0 1 mrad and the
parameter ~ 1c exceeds the DW factor by almost 3 times and the NC factor by almost 70
times.
The dependence of TIS on the correlation length is close to that of correction to the reflectivity R . Therefore, the relative increase in absorption (proportional to TISR ) is not so pronounced: it is approximately 8 rel.% only at 0 1 mrad (see Fig. 2), while it is 13
times more when compared to the prediction of the NC formula (4). Notice (see Fig. 2) that a relative increase in absorption is almost independent of θ0 at
small grazing angles less than 5 mrad, what is one-half of the critical angle of TER. To look more closely at the dependence of absorption on the roughness parameters,
grazing angle of an incident beam, and the photon energy, we deduce a simplified expression for the absorptivity based on the results obtained in [3]. We consider the case of extremely small grazing angle 0 c , i.e. 0 | |c , and use Eqs. (19)-(20) from [3]. Then, with a
little algebraic manipulation, we obtain
20 3/ 2 2
( )TIS 2( ) sin ; Im( ) 0
c
cc c
Fc
FR kk d
R
(7)
where 2 /k is the wavenumber, 0| | / (2 )q q is the normalized spatial
frequency, the function F is specified by the 1D PSD-function, the last being assumed to take the form of 2
1PSD ( ) ( )D F and for the model (6) being written as
1/222 ( 1/ 2)( ) 1
( )F
(8)
Expression (7) consists of two summands The first is dictated by the formation of a smooth near surface layer arising because of statistical averaging of stochastic surface relief and leading to an increase in the coherent transmittance in the case of absorbing mirror material, while the second summand describes an increase in the scattering into the mirror depth occurring independently of absorption [3]. Therefore, we neglect the imaginary part of the dielectric constant when deducing the second summand in (7), while we take it into account in the first summand to provide transition to the NC factor (4) with decreasing correlation length.
First, we note that an increase in absorption (7) is proportional to the grazing angle of an incident beam. The same linear dependence on θ0 is inherent to the absorptivity 1F FA R
of a perfectly smooth mirror at an extremely small grazing incidence angle (Eq. (4)). Hence, the relative increase in absorption is independent of the grazing angle at 0 c according
to Fig. 2. To illustrate an accuracy of Eq. (7), we re-calculated results obtained with the use of exact expressions from [3] and presented these in Fig. 2 using colored solid curves. The dashed curves of the same colors were calculated with the use of analytic Eq. (7), which is valid at a small grazing incidence angle 0 c . As the critical angle of B4C coating is equal
to θc = 10.2 mrad at E = 3 keV, we performed analytic calculations at 0 5 mrad only. As
seen, approximate Eq. (7) can be used for quick estimations of the roughness effect to the X-ray absorption by a rough surface at a small grazing incidence angle 0 c , while its
accuracy is impaired with increasing θ0. In the limiting case of extremely small correlation length, we set 0c in (7) and obtain
the following asymptotic representation for the absorption increase for arbitrary function F:
20 1 1 03/ 2
0
TIS 2 1 ( )( ) sin ; ; 1
4c c
F
R Fk k G G d
R
(9)
In the partial case of the model (6), (8) the parameter 1 (1/ 4) / 4 ( 1/ 4) / ( )G .
In the opposite limiting case of the large correlation length 1c , due to the extremely
small grazing incidence angle 0 1 , we use the model representation (8) of the function F.
Taking into account that 1c in the integral in Eq. (7), we neglect unity as compared
with τ2 in Eq. (8), introduce new integration variable / c , and then obtain the
dependence of absorption on the correlation length in an explicit form:
2
20 2 03/ 2
2 2 1 2
1
TIS 2 4 1( ) sin ; 1, 1
12 ( 1/ 2)
( ) 1
с cF
Rk G
R k
dG
(10)
Notice that Eq. (10) is more exact as compared with the expressions obtained in [3], but only valid for the particular case of the PSD-function determined in Eq. (6).
We suggest that the absorptivity peak in Fig. 2 achieves the maximal value at the correlation length corresponding approximately to an intersection of two asymptotic
curves (9) and (10). Then, the dependence on the photon energy E of the correlation length
and the maximal value of the absorptivity can be roughly estimated as
~ ~ ; and max ~ ~FE A A E
(11)
i.e. X-ray absorption by a rough surface is enhanced with the increasing photon energy (at the fixed grazing incidence angle θ0 and the "worst" correlation length ( )E ). By contrast,
the absorptivity of a perfectly smooth B4C-coated mirror 3/ 20 2 /FA decreases with the
photon energy (the parameter 3/ 2/ is equal to 0.83 at E = 3 keV and 0.08 at E = 20 keV).
Therefore, the relative increase in the absorptivity (A–AF)/AF is enhanced quickly with the photon energy, while it is independent of the photon energy in the frame of the NC approximation (4). Notice that these statements are valid, if only the grazing angle θ0 is small as compared with the critical angle θc.
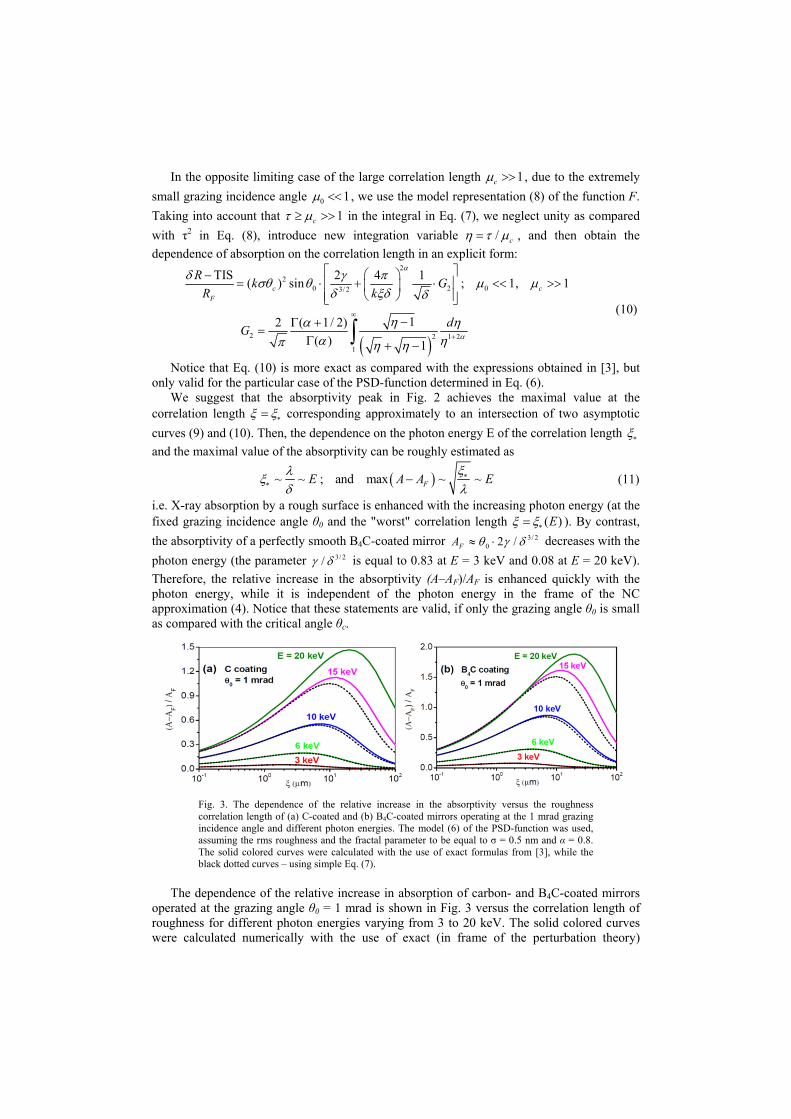
Fig. 3. The dependence of the relative increase in the absorptivity versus the roughness correlation length of (a) C-coated and (b) B4C-coated mirrors operating at the 1 mrad grazing incidence angle and different photon energies. The model (6) of the PSD-function was used, assuming the rms roughness and the fractal parameter to be equal to σ = 0.5 nm and α = 0.8. The solid colored curves were calculated with the use of exact formulas from [3], while the black dotted curves – using simple Eq. (7).
The dependence of the relative increase in absorption of carbon- and B4C-coated mirrors operated at the grazing angle θ0 = 1 mrad is shown in Fig. 3 versus the correlation length of roughness for different photon energies varying from 3 to 20 keV. The solid colored curves were calculated numerically with the use of exact (in frame of the perturbation theory)
expressions (Eqs. (3)-(11) in [3]). As seen, an increasing photon energy, while keeping the grazing incidence angle the same, results in a very quick enhancement in the maximum relative absorptivity from 5.5% (for C coating) or 8.0% (for B4C coating) at E = 3 keV up to 148% (C) or 183% (B4C) at E = 20 keV, the last values being about 250% (C) or 300% (B4C) times larger as compared with the simplest estimation of the roughness effect via the NC formulas (3)-(4) (0.6 rel.% only).
The dotted curves in Fig. 3 were calculated with the use of simple Eqs. (7)-(8). They agree totally with the exact calculations at low photon energies, while the difference between solid and dotted curves increases with increasing energy. The fact is that the grazing incidence angle was fixed at θ0 = 1 mrad, while the critical angle θc decreases inversely proportionally to the photon energy from θc = 10 mrad at E = 3 keV down to 1.5 mrad at E = 20 keV. At the same time, Eq. (7) was obtained under condition θ0 << θc. This circumstance explains the difference between exact calculations and simplified ones based on Eq. (7).
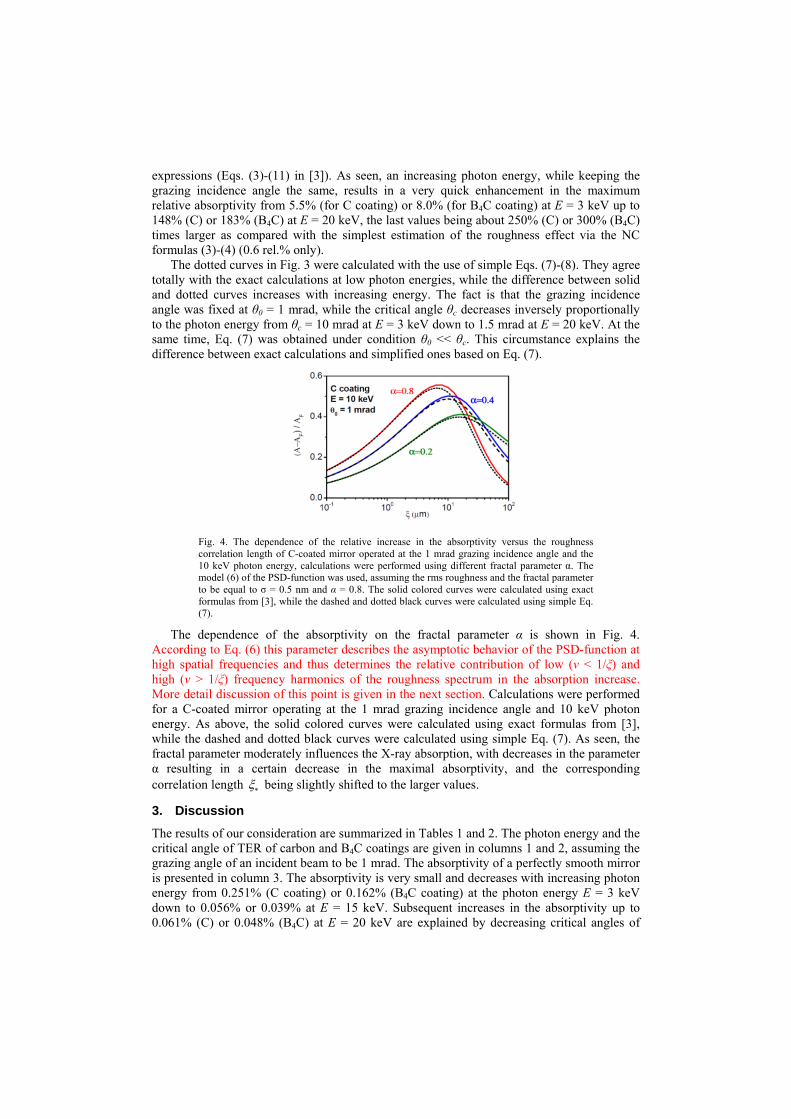
Fig. 4. The dependence of the relative increase in the absorptivity versus the roughness correlation length of C-coated mirror operated at the 1 mrad grazing incidence angle and the 10 keV photon energy, calculations were performed using different fractal parameter α. The model (6) of the PSD-function was used, assuming the rms roughness and the fractal parameter to be equal to σ = 0.5 nm and α = 0.8. The solid colored curves were calculated using exact formulas from [3], while the dashed and dotted black curves were calculated using simple Eq. (7).
The dependence of the absorptivity on the fractal parameter α is shown in Fig. 4. According to Eq. (6) this parameter describes the asymptotic behavior of the PSD-function at high spatial frequencies and thus determines the relative contribution of low (ν < 1/ξ) and high (ν > 1/ξ) frequency harmonics of the roughness spectrum in the absorption increase. More detail discussion of this point is given in the next section. Calculations were performed for a C-coated mirror operating at the 1 mrad grazing incidence angle and 10 keV photon energy. As above, the solid colored curves were calculated using exact formulas from [3], while the dashed and dotted black curves were calculated using simple Eq. (7). As seen, the fractal parameter moderately influences the X-ray absorption, with decreases in the parameter α resulting in a certain decrease in the maximal absorptivity, and the corresponding correlation length being slightly shifted to the larger values.
3. Discussion
The results of our consideration are summarized in Tables 1 and 2. The photon energy and the critical angle of TER of carbon and B4C coatings are given in columns 1 and 2, assuming the grazing angle of an incident beam to be 1 mrad. The absorptivity of a perfectly smooth mirror is presented in column 3. The absorptivity is very small and decreases with increasing photon energy from 0.251% (C coating) or 0.162% (B4C coating) at the photon energy E = 3 keV down to 0.056% or 0.039% at E = 15 keV. Subsequent increases in the absorptivity up to 0.061% (C) or 0.048% (B4C) at E = 20 keV are explained by decreasing critical angles of
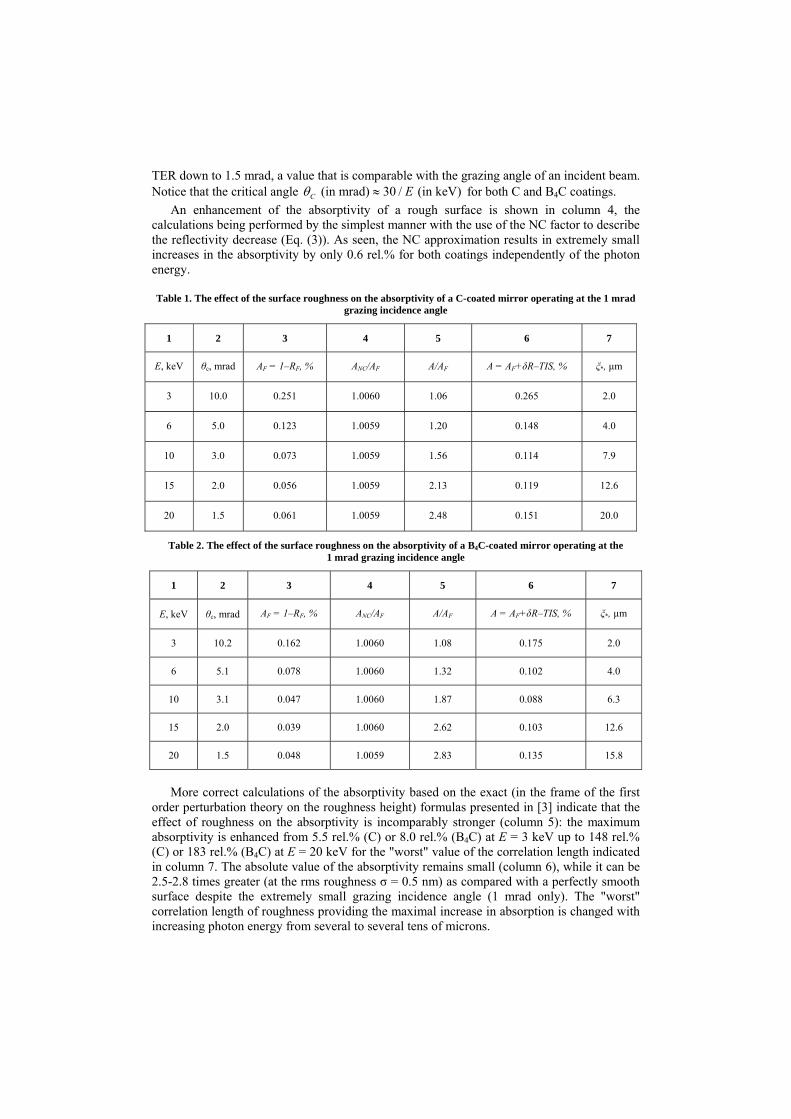
TER down to 1.5 mrad, a value that is comparable with the grazing angle of an incident beam. Notice that the critical angle (in mrad) 30 / (in keV)C E for both C and B4C coatings.
An enhancement of the absorptivity of a rough surface is shown in column 4, the calculations being performed by the simplest manner with the use of the NC factor to describe the reflectivity decrease (Eq. (3)). As seen, the NC approximation results in extremely small increases in the absorptivity by only 0.6 rel.% for both coatings independently of the photon energy.
Table 1. The effect of the surface roughness on the absorptivity of a C-coated mirror operating at the 1 mrad grazing incidence angle
1 2 3 4 5 6 7
E, keV θc, mrad AF = 1–RF, % ANC/AF A/AF A = AF+δR–TIS, % ξ*, μm
3 10.0 0.251 1.0060 1.06 0.265 2.0
6 5.0 0.123 1.0059 1.20 0.148 4.0
10 3.0 0.073 1.0059 1.56 0.114 7.9
15 2.0 0.056 1.0059 2.13 0.119 12.6
20 1.5 0.061 1.0059 2.48 0.151 20.0
Table 2. The effect of the surface roughness on the absorptivity of a B4C-coated mirror operating at the 1 mrad grazing incidence angle
1 2 3 4 5 6 7
E, keV θc, mrad AF = 1–RF, % ANC/AF A/AF A = AF+δR–TIS, % ξ*, μm
3 10.2 0.162 1.0060 1.08 0.175 2.0
6 5.1 0.078 1.0060 1.32 0.102 4.0
10 3.1 0.047 1.0060 1.87 0.088 6.3
15 2.0 0.039 1.0060 2.62 0.103 12.6
20 1.5 0.048 1.0059 2.83 0.135 15.8
More correct calculations of the absorptivity based on the exact (in the frame of the first
order perturbation theory on the roughness height) formulas presented in [3] indicate that the effect of roughness on the absorptivity is incomparably stronger (column 5): the maximum absorptivity is enhanced from 5.5 rel.% (C) or 8.0 rel.% (B4C) at E = 3 keV up to 148 rel.% (C) or 183 rel.% (B4C) at E = 20 keV for the "worst" value of the correlation length indicated in column 7. The absolute value of the absorptivity remains small (column 6), while it can be 2.5-2.8 times greater (at the rms roughness σ = 0.5 nm) as compared with a perfectly smooth surface despite the extremely small grazing incidence angle (1 mrad only). The "worst" correlation length of roughness providing the maximal increase in absorption is changed with increasing photon energy from several to several tens of microns.
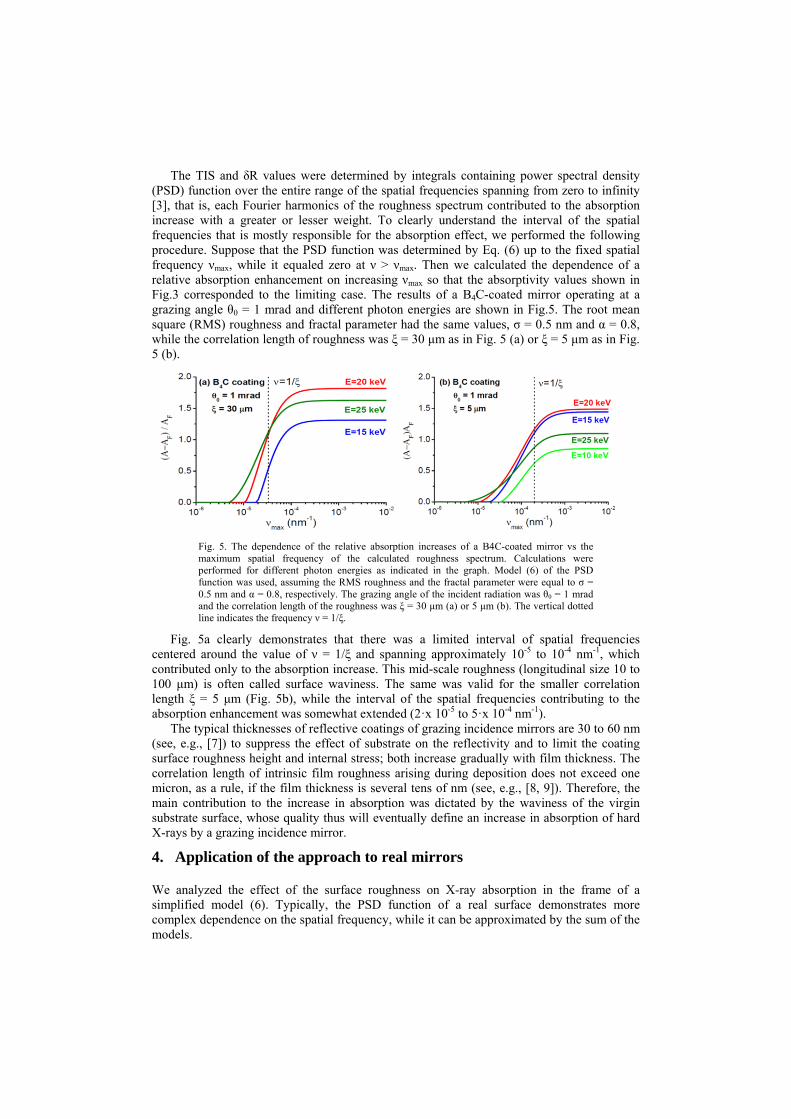
The TIS and δR values were determined by integrals containing power spectral density (PSD) function over the entire range of the spatial frequencies spanning from zero to infinity [3], that is, each Fourier harmonics of the roughness spectrum contributed to the absorption increase with a greater or lesser weight. To clearly understand the interval of the spatial frequencies that is mostly responsible for the absorption effect, we performed the following procedure. Suppose that the PSD function was determined by Eq. (6) up to the fixed spatial frequency νmax, while it equaled zero at ν > νmax. Then we calculated the dependence of a relative absorption enhancement on increasing νmax so that the absorptivity values shown in Fig.3 corresponded to the limiting case. The results of a B4C-coated mirror operating at a grazing angle θ0 = 1 mrad and different photon energies are shown in Fig.5. The root mean square (RMS) roughness and fractal parameter had the same values, σ = 0.5 nm and α = 0.8, while the correlation length of roughness was ξ = 30 μm as in Fig. 5 (a) or ξ = 5 μm as in Fig. 5 (b).
Fig. 5. The dependence of the relative absorption increases of a B4C-coated mirror vs the maximum spatial frequency of the calculated roughness spectrum. Calculations were performed for different photon energies as indicated in the graph. Model (6) of the PSD function was used, assuming the RMS roughness and the fractal parameter were equal to σ = 0.5 nm and α = 0.8, respectively. The grazing angle of the incident radiation was θ0 = 1 mrad and the correlation length of the roughness was ξ = 30 μm (a) or 5 μm (b). The vertical dotted line indicates the frequency ν = 1/ξ.
Fig. 5a clearly demonstrates that there was a limited interval of spatial frequencies centered around the value of ν = 1/ξ and spanning approximately 10-5 to 10-4 nm-1, which contributed only to the absorption increase. This mid-scale roughness (longitudinal size 10 to 100 μm) is often called surface waviness. The same was valid for the smaller correlation length ξ = 5 μm (Fig. 5b), while the interval of the spatial frequencies contributing to the absorption enhancement was somewhat extended (2·x 10-5 to 5·x 10-4 nm-1).
The typical thicknesses of reflective coatings of grazing incidence mirrors are 30 to 60 nm (see, e.g., [7]) to suppress the effect of substrate on the reflectivity and to limit the coating surface roughness height and internal stress; both increase gradually with film thickness. The correlation length of intrinsic film roughness arising during deposition does not exceed one micron, as a rule, if the film thickness is several tens of nm (see, e.g., [8, 9]). Therefore, the main contribution to the increase in absorption was dictated by the waviness of the virgin substrate surface, whose quality thus will eventually define an increase in absorption of hard X-rays by a grazing incidence mirror.
4. Application of the approach to real mirrors
We analyzed the effect of the surface roughness on X-ray absorption in the frame of a simplified model (6). Typically, the PSD function of a real surface demonstrates more complex dependence on the spatial frequency, while it can be approximated by the sum of the models.
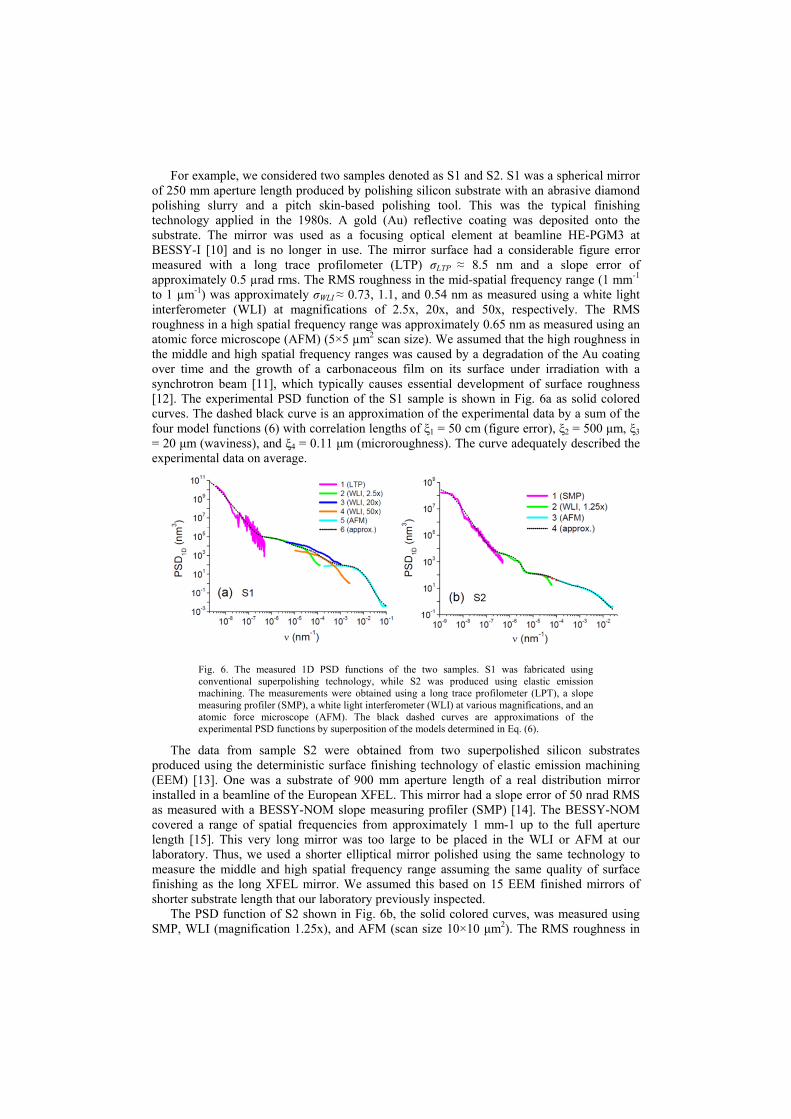
For example, we considered two samples denoted as S1 and S2. S1 was a spherical mirror of 250 mm aperture length produced by polishing silicon substrate with an abrasive diamond polishing slurry and a pitch skin-based polishing tool. This was the typical finishing technology applied in the 1980s. A gold (Au) reflective coating was deposited onto the substrate. The mirror was used as a focusing optical element at beamline HE-PGM3 at BESSY-I [10] and is no longer in use. The mirror surface had a considerable figure error measured with a long trace profilometer (LTP) σLTP ≈ 8.5 nm and a slope error of approximately 0.5 µrad rms. The RMS roughness in the mid-spatial frequency range (1 mm-1 to 1 µm-1) was approximately σWLI ≈ 0.73, 1.1, and 0.54 nm as measured using a white light interferometer (WLI) at magnifications of 2.5x, 20x, and 50x, respectively. The RMS roughness in a high spatial frequency range was approximately 0.65 nm as measured using an atomic force microscope (AFM) (5×5 µm2 scan size). We assumed that the high roughness in the middle and high spatial frequency ranges was caused by a degradation of the Au coating over time and the growth of a carbonaceous film on its surface under irradiation with a synchrotron beam [11], which typically causes essential development of surface roughness [12]. The experimental PSD function of the S1 sample is shown in Fig. 6a as solid colored curves. The dashed black curve is an approximation of the experimental data by a sum of the four model functions (6) with correlation lengths of ξ1 = 50 cm (figure error), ξ2 = 500 μm, ξ3 = 20 μm (waviness), and ξ4 = 0.11 μm (microroughness). The curve adequately described the experimental data on average.
Fig. 6. The measured 1D PSD functions of the two samples. S1 was fabricated using conventional superpolishing technology, while S2 was produced using elastic emission machining. The measurements were obtained using a long trace profilometer (LPT), a slope measuring profiler (SMP), a white light interferometer (WLI) at various magnifications, and an atomic force microscope (AFM). The black dashed curves are approximations of the experimental PSD functions by superposition of the models determined in Eq. (6).
The data from sample S2 were obtained from two superpolished silicon substrates produced using the deterministic surface finishing technology of elastic emission machining (EEM) [13]. One was a substrate of 900 mm aperture length of a real distribution mirror installed in a beamline of the European XFEL. This mirror had a slope error of 50 nrad RMS as measured with a BESSY-NOM slope measuring profiler (SMP) [14]. The BESSY-NOM covered a range of spatial frequencies from approximately 1 mm-1 up to the full aperture length [15]. This very long mirror was too large to be placed in the WLI or AFM at our laboratory. Thus, we used a shorter elliptical mirror polished using the same technology to measure the middle and high spatial frequency range assuming the same quality of surface finishing as the long XFEL mirror. We assumed this based on 15 EEM finished mirrors of shorter substrate length that our laboratory previously inspected.
The PSD function of S2 shown in Fig. 6b, the solid colored curves, was measured using SMP, WLI (magnification 1.25x), and AFM (scan size 10×10 μm2). The RMS roughness in
the entire measurable interval of the spatial frequencies was equal to σ ≈ 0.84 nm, while the SMP, WLI, and AFM measurements were σSMP ≈ 0.80 nm, σWLI ≈ 0.10 nm, and σAFM ≈ 0.25 nm, respectively. The main contribution to the total roughness of the S2 substrate was thus conditioned by the figure error similar to the S1 sample, while the waviness was extremely low, so that we would expect an insignificant increase in X-ray absorption due to the roughness effect. The dashed black curve is an approximation of the experimental PSD function by a sum of four models (6) with correlations lengths of ξ1 = 40 cm (figure error), ξ2
= 300 μm, and ξ3 = 25 μm (waviness), and ξ4 = 0.35 μm (microroughness). When calculating an absorption increase, we used the PSD functions of the samples
shown in Fig. 6 while assuming that their surfaces were coated with a B4C reflecting layer for direct comparison with the previous model calculations.
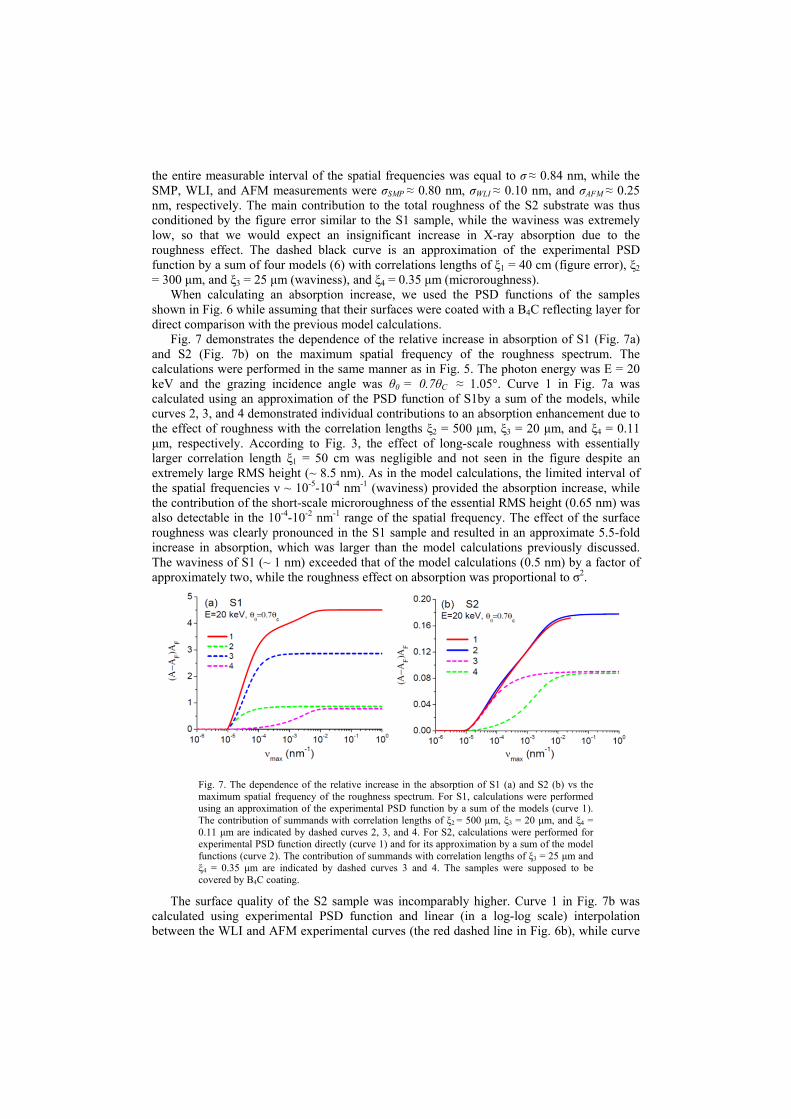
Fig. 7 demonstrates the dependence of the relative increase in absorption of S1 (Fig. 7a) and S2 (Fig. 7b) on the maximum spatial frequency of the roughness spectrum. The calculations were performed in the same manner as in Fig. 5. The photon energy was E = 20 keV and the grazing incidence angle was θ0 = 0.7θC ≈ 1.05°. Curve 1 in Fig. 7a was calculated using an approximation of the PSD function of S1by a sum of the models, while curves 2, 3, and 4 demonstrated individual contributions to an absorption enhancement due to the effect of roughness with the correlation lengths ξ2 = 500 μm, ξ3 = 20 μm, and ξ4 = 0.11 μm, respectively. According to Fig. 3, the effect of long-scale roughness with essentially larger correlation length ξ1 = 50 cm was negligible and not seen in the figure despite an extremely large RMS height (~ 8.5 nm). As in the model calculations, the limited interval of the spatial frequencies ν ~ 10-5-10-4 nm-1 (waviness) provided the absorption increase, while the contribution of the short-scale microroughness of the essential RMS height (0.65 nm) was also detectable in the 10-4-10-2 nm-1 range of the spatial frequency. The effect of the surface roughness was clearly pronounced in the S1 sample and resulted in an approximate 5.5-fold increase in absorption, which was larger than the model calculations previously discussed. The waviness of S1 (~ 1 nm) exceeded that of the model calculations (0.5 nm) by a factor of approximately two, while the roughness effect on absorption was proportional to σ2.
Fig. 7. The dependence of the relative increase in the absorption of S1 (a) and S2 (b) vs the maximum spatial frequency of the roughness spectrum. For S1, calculations were performed using an approximation of the experimental PSD function by a sum of the models (curve 1). The contribution of summands with correlation lengths of ξ2 = 500 μm, ξ3 = 20 μm, and ξ4 = 0.11 μm are indicated by dashed curves 2, 3, and 4. For S2, calculations were performed for experimental PSD function directly (curve 1) and for its approximation by a sum of the model functions (curve 2). The contribution of summands with correlation lengths of ξ3 = 25 μm and ξ4 = 0.35 μm are indicated by dashed curves 3 and 4. The samples were supposed to be covered by B4C coating.
The surface quality of the S2 sample was incomparably higher. Curve 1 in Fig. 7b was calculated using experimental PSD function and linear (in a log-log scale) interpolation between the WLI and AFM experimental curves (the red dashed line in Fig. 6b), while curve
2 was calculated using an approximation of the PSD function by a sum of the models. Curves 3 and 4 demonstrated individual increases in absorption due to the effect of roughness with correlation lengths of ξ3 = 25 μm and ξ4 = 0.35 μm, respectively. As in the model calculations (Fig. 5), only limited intervals of the spatial frequencies centered near the value ν = 1/ξ contributed to the absorption increase ν ~ 10-5-10-3 nm-1 and ν ~ 10-4-10-2 nm-1 for the roughness system with the correlation lengths of 25 μm and 0.35 μm, respectively. The effect of the two other roughness systems with essentially larger correlation lengths was extremely small, so their contribution to the absorption increase is not shown in the figure.
As expected, the low waviness of the S2 substrate so weakly influenced the absorption increase (approximately 10%) that the effect of the microroughness was essentially the same. This agrees with Fig. 3b if we take into account that the absorption increase was proportional to σ2, while the RMS roughness σ was the same value of 0.5 nm in Fig. 3b independently of the correlation length. In the case of the S2 substrate, the RMS value of the mid-scale roughness (waviness) was only 0.1 nm, so that the absorption increase was 25 times less than in Fig. 3b at ξ ~ ξ3 = 25 μm. Concomitantly, the RMS value of microroughness was only half of that in Fig. 3b, so the absorption increase was only 4 times less than in Fig. 3b at ξ ~ ξ4 = 0.35 μm.
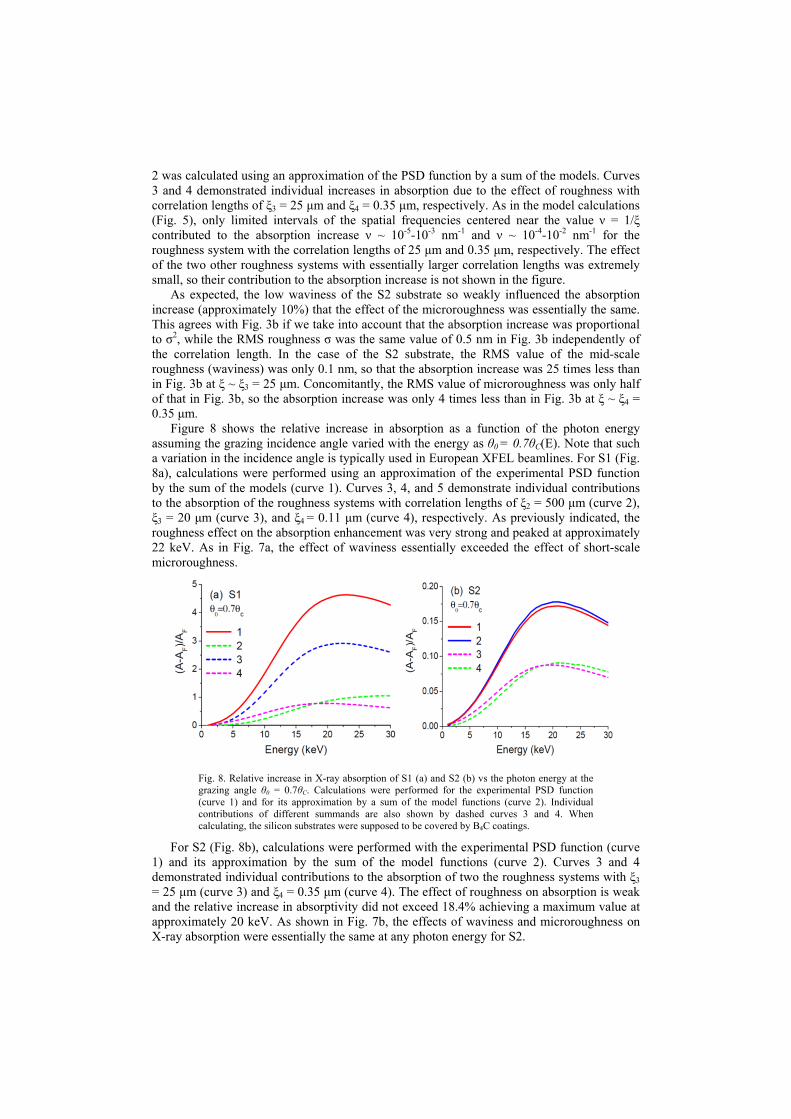
Figure 8 shows the relative increase in absorption as a function of the photon energy assuming the grazing incidence angle varied with the energy as θ0 = 0.7θC(E). Note that such a variation in the incidence angle is typically used in European XFEL beamlines. For S1 (Fig. 8a), calculations were performed using an approximation of the experimental PSD function by the sum of the models (curve 1). Curves 3, 4, and 5 demonstrate individual contributions to the absorption of the roughness systems with correlation lengths of ξ2 = 500 μm (curve 2), ξ3 = 20 μm (curve 3), and ξ4 = 0.11 μm (curve 4), respectively. As previously indicated, the roughness effect on the absorption enhancement was very strong and peaked at approximately 22 keV. As in Fig. 7a, the effect of waviness essentially exceeded the effect of short-scale microroughness.
Fig. 8. Relative increase in X-ray absorption of S1 (a) and S2 (b) vs the photon energy at the grazing angle θ0 = 0.7θC. Calculations were performed for the experimental PSD function (curve 1) and for its approximation by a sum of the model functions (curve 2). Individual contributions of different summands are also shown by dashed curves 3 and 4. When calculating, the silicon substrates were supposed to be covered by B4C coatings.
For S2 (Fig. 8b), calculations were performed with the experimental PSD function (curve 1) and its approximation by the sum of the model functions (curve 2). Curves 3 and 4 demonstrated individual contributions to the absorption of two the roughness systems with ξ3 = 25 μm (curve 3) and ξ4 = 0.35 μm (curve 4). The effect of roughness on absorption is weak and the relative increase in absorptivity did not exceed 18.4% achieving a maximum value at approximately 20 keV. As shown in Fig. 7b, the effects of waviness and microroughness on X-ray absorption were essentially the same at any photon energy for S2.
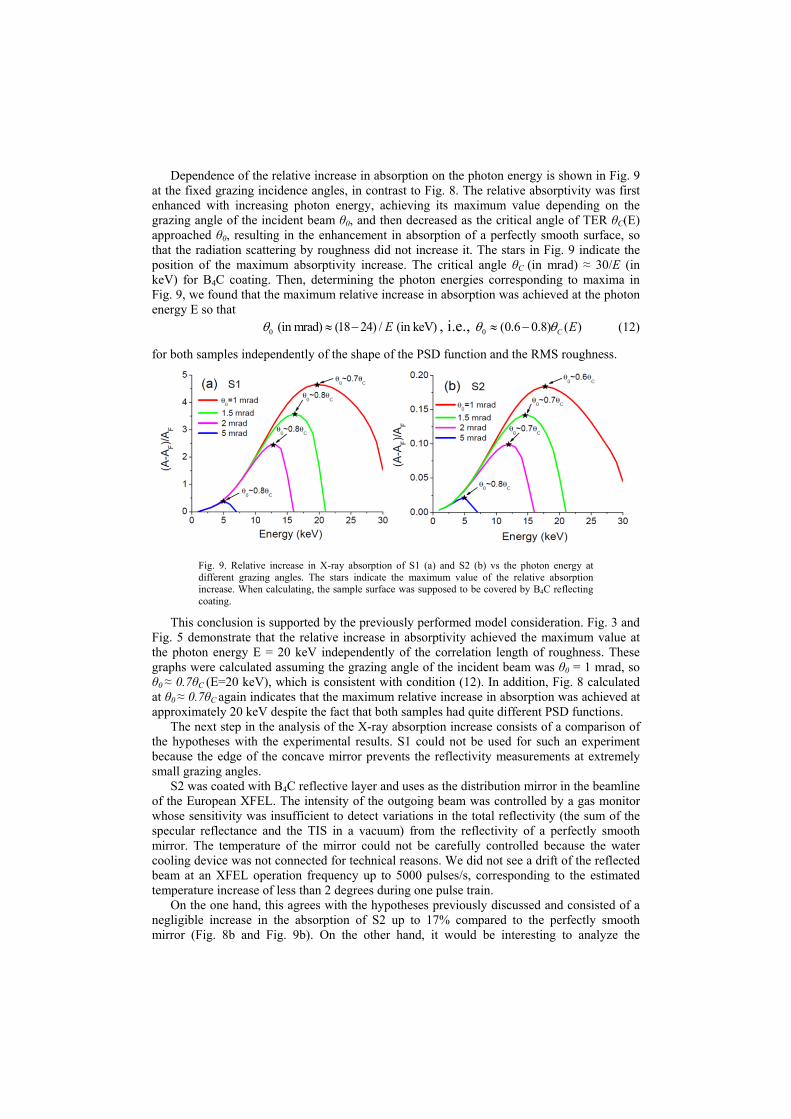
Dependence of the relative increase in absorption on the photon energy is shown in Fig. 9 at the fixed grazing incidence angles, in contrast to Fig. 8. The relative absorptivity was first enhanced with increasing photon energy, achieving its maximum value depending on the grazing angle of the incident beam θ0, and then decreased as the critical angle of TER θC(E) approached θ0, resulting in the enhancement in absorption of a perfectly smooth surface, so that the radiation scattering by roughness did not increase it. The stars in Fig. 9 indicate the position of the maximum absorptivity increase. The critical angle θC (in mrad) ≈ 30/E (in keV) for B4C coating. Then, determining the photon energies corresponding to maxima in Fig. 9, we found that the maximum relative increase in absorption was achieved at the photon energy E so that
0 (in mrad) (18 24) / (in keV)E , i.e., 0 (0.6 0.8) ( )С E (12)
for both samples independently of the shape of the PSD function and the RMS roughness.
Fig. 9. Relative increase in X-ray absorption of S1 (a) and S2 (b) vs the photon energy at different grazing angles. The stars indicate the maximum value of the relative absorption increase. When calculating, the sample surface was supposed to be covered by B4C reflecting coating.
This conclusion is supported by the previously performed model consideration. Fig. 3 and Fig. 5 demonstrate that the relative increase in absorptivity achieved the maximum value at the photon energy E = 20 keV independently of the correlation length of roughness. These graphs were calculated assuming the grazing angle of the incident beam was θ0 = 1 mrad, so θ0 ≈ 0.7θC (E=20 keV), which is consistent with condition (12). In addition, Fig. 8 calculated at θ0 ≈ 0.7θC again indicates that the maximum relative increase in absorption was achieved at approximately 20 keV despite the fact that both samples had quite different PSD functions.
The next step in the analysis of the X-ray absorption increase consists of a comparison of the hypotheses with the experimental results. S1 could not be used for such an experiment because the edge of the concave mirror prevents the reflectivity measurements at extremely small grazing angles.
S2 was coated with B4C reflective layer and uses as the distribution mirror in the beamline of the European XFEL. The intensity of the outgoing beam was controlled by a gas monitor whose sensitivity was insufficient to detect variations in the total reflectivity (the sum of the specular reflectance and the TIS in a vacuum) from the reflectivity of a perfectly smooth mirror. The temperature of the mirror could not be carefully controlled because the water cooling device was not connected for technical reasons. We did not see a drift of the reflected beam at an XFEL operation frequency up to 5000 pulses/s, corresponding to the estimated temperature increase of less than 2 degrees during one pulse train.
On the one hand, this agrees with the hypotheses previously discussed and consisted of a negligible increase in the absorption of S2 up to 17% compared to the perfectly smooth mirror (Fig. 8b and Fig. 9b). On the other hand, it would be interesting to analyze the
reflectivity from a mirror with a higher mid-scale roughness (waviness) and to more clearly verify our theory. However, the reflectivity measurements at ultimately small grazing angles (1 mrad or less) require plane substrate of at least several tens of cm in length. Fabrication of such a sample is rather expensive; therefore, we have delayed this experiment until a suitable sample is available.
5. Conclusions
No mirror surface can be considered perfectly smooth for hard X-rays. The surface roughness scatters part of the incident beam into the mirror depth, resulting in increasing radiation absorption and thus enhancing the thermal deformation of a mirror placed in a synchrotron, especially XFEL beamlines. The analysis of the X-ray absorption increase by a grazing incidence mirror due to the surface roughness was the goal of the present study.
We first analyzed the general principles of the roughness effect on the X-ray absorption based on a simplified roughness model using the PSD function determined in Eq. (6). We demonstrated that the increase in absorption could be several hundred times larger than predicted by the Nevo-Croce formula. As a result, the absorption enhanced by several times compared to a perfectly smooth mirror despite the extremely small grazing angle of the incident X-ray beam (a fraction of the TER critical angle) and the high quality of the reflecting surface (0.5 nm RMS roughness over the entire range of the spatial frequencies). The main contribution to the absorption increase was dictated by the mid-scale roughness (waviness) with a longitudinal size from several to several hundred microns, which typically conforms with the substrate roughness. Therefore, the waviness of the virgin substrate surface eventually defined the absorption enhancement of the grazing incidence mirror and thus the mirror fabrication technology should be chosen to provide the lowest feasible mid-scale roughness. These statements are the main conclusion of practical importance.
We demonstrated that increasing the photon energy while maintaining the same grazing incidence angle results in a very quick enhancement in the absorptivity compared to that of a perfectly smooth mirror. The maximum relative increase in absorption was achieved if the grazing incidence angle θ0 was approximately 0.6-0.8 of the critical angle of TER.
This approach was applied to the analysis of two real mirrors used in a synchrotron (BESSY-I) and European XFEL beamline. We demonstrated that our analysis conducted first to model the PSD functions was also valid for the real samples, because experimental PSD function can always be approximated by a sum of the models. The modern surface finishing technology of Elastic Emission Machining enabled us to obtain extremely low substrate waviness, indicating the negligible effect of the surface roughness on the absorption increase.
Funding
Four of the authors (MW, CX, QH, ZW) were supported by the National Natural Science Foundation of China (NSFC) (11443007, 11505129); National Natural Science Foundation of China Academy of Engineering Physics (NSAF) (U1430131); National Key Scientific Instrument and Equipment Development Project ( 2012YQ13012505, 2012YQ04016403); and Shanghai Pujiang Program (15PJ1408000). Two of the authors (IVK, AVB) were supported by the Russian Federal Agency of Scientific Organizations (Agreement No 007-ГЗ/Ч3363/26). They acknowledge the Russian Ministry of Education and Science for financial support of their visits to the European XFEL via the program "Physics at the accelerators and reactors of the West Europe (excluding CERN)".
Copyright © 2022 FDOKUMEN


![Magnetic-field-induced spin-crossover transition in [Mn $^{\ textrm {III}} $(taa)] studied by X-ray absorption spectroscopy](https://static.fdokumen.com/doc/165x107/6324707858da543341064674/magnetic-field-induced-spin-crossover-transition-in-mn-textrm-iii-taa.jpg)