Advanced X-ray absorption and emission spectroscopy: in situ catalytic studies
14
This article was published as part of the In-situ characterization of heterogeneous catalysts themed issue Guest editor Bert M. Weckhuysen Please take a look at the issue 12 2010 table of contents to access other reviews in this themed issue Downloaded by Universita di Torino on 17 November 2010 Published on 16 November 2010 on http://pubs.rsc.org | doi:10.1039/C0CS00054J View Online
-
Upload
independent -
Category
Documents
-
view
2 -
download
0
Transcript of Advanced X-ray absorption and emission spectroscopy: in situ catalytic studies

This article was published as part of the
In-situ characterization of heterogeneous catalysts themed issue
Guest editor Bert M. Weckhuysen
Please take a look at the issue 12 2010 table of contents to
access other reviews in this themed issue
Dow
nloa
ded
by U
nive
rsita
di T
orin
o on
17
Nov
embe
r 20
10Pu
blis
hed
on 1
6 N
ovem
ber
2010
on
http
://pu
bs.r
sc.o
rg |
doi:1
0.10
39/C
0CS0
0054
JView Online

Advanced X-ray absorption and emission spectroscopy: in situ catalytic
studiesw
Jagdeep Singh,a Carlo Lambertib and Jeroen A. van Bokhoven*ac
Received 26th July 2010
DOI: 10.1039/c0cs00054j
Knowledge of the structure of catalysts is essential to understand their behavior, which further
facilitates development of an active, selective, and stable catalyst. Determining the structure of
a functioning catalyst is essential in this regard. The structure of a catalyst is prone to change
during the catalytic process and needs to be determined in its working conditions. In this
tutorial review, we have summarized studies done at synchrotron radiation facilities that illustrate
the capability to determine catalyst structure using X-ray absorption spectroscopy (XAS) and
X-ray emission spectroscopy (XES). These studies aim at facilitating the determination of the
dynamic structure-performance relationships during a catalytic process.
1. Introduction
It is essential to know the electronic and geometric structures
of materials in order to understand their behavior. Nano-sized
particles are of great interest, especially in catalysis where
noble metal nanoparticles are often supported on various supports
and are used in different reactions such as CO oxidation,1 the
water gas shift reaction,2 hydrogenation1d,3 methanation,4 and
hydrogenolysis.5 The structure of nano-sized particles differs
from that of bulk metals. Bulk metals lose their metallic
character when the size reduces to less than a few nm.6 There
are many techniques to determine the structure of matter, all
with pros and cons; their application depends on the required
information and the conditions of measurement. Because of
the large penetration depth of X-rays, the interaction of X-rays
with matter has been applied extensively. X-ray absorption
spectroscopy (XAS) is one of the most popular techniques for
determining the structure of materials without long-range
order.7 An XAS spectrum can be divided into three regions,
namely the pre-edge, the X-ray absorption near edge structure
(XANES), and the extended X-ray absorption fine structure
(EXAFS). The shape of XANES spectra gives the electronic
structure and the local geometry around the atom that absorbs
the X-ray radiation. It reflects the empty density of states
(DOS) of the electronic transition. EXAFS spectroscopy
provides the coordination geometry, such as bond length
(with an accuracy of about 0.01 A), the number of neighboring
atoms, which indicates the size and shape of the nanoparticles,
and the Debye–Waller factor.8
In an XAS experiment, an electron from a core level is
excited through the absorption of a photon of the incoming
X-rays. The excited electron is pushed above the Fermi level
a Institute for Chemical and Bioengineering, HCI E 127,Wolfgang Paulistrasse 10, 8093, Zurich, Switzerland.Fax: +41446321162; Tel: +41446325542
bDepartment of Inorganic, Physical and Materials Chemistry,NIS Centre of Excellence, and INSTM Reference Center,University of Turin, Torino, Italy
c Paul Scherrer Institute, Villigen, Switzerlandw Part of the themed issue covering recent advances in the in-situcharacterization of heterogeneous catalysts.
Jagdeep Singh
Jagdeep Singh, born andraised in Patiala, India, earneda BE in Chemical Engineeringfrom Thapar University, Patialain 2004 and aMTech degree inChemical Engineering fromIndian Institute of technology,Roorkee, India in 2006. Hecompleted his PhD under theguidance of Prof. Dr JeroenA. van Bokhoven in October2010 at ETH Zurich. HisPhD research focused on theexploration of new tools ofX-ray absorption and emissionspectroscopy for in situ cata-lytic research.
Carlo Lamberti
Carlo Lamberti: born in 1964;degree in Physics in 1988;PhD in solid state physics in1993. He is professor inPhysical Chemistry at theTorino University since 2006.He has performed more than100 experiments with synchro-tron and neutron sources atADONE, LURE, ESRF,Elettra, Daresbury, SLS, APS,ISIS, FRM-II, ILL. He hasbeen member of the reviewcommittees of ESRF and SLS.His research activities arefocused in the multitechnical
characterization of nanostructured materials. He edited thebook Characterization of Semiconductor Heterostructures andNanostructures, Elsevier, 2008.
4754 | Chem. Soc. Rev., 2010, 39, 4754–4766 This journal is �c The Royal Society of Chemistry 2010
TUTORIAL REVIEW www.rsc.org/csr | Chemical Society Reviews
Dow
nloa
ded
by U
nive
rsita
di T
orin
o on
17
Nov
embe
r 20
10Pu
blis
hed
on 1
6 N
ovem
ber
2010
on
http
://pu
bs.r
sc.o
rg |
doi:1
0.10
39/C
0CS0
0054
J
View Online

and obtains a kinetic energy equal to the difference in the
energy of the incoming X-ray and the bonding energy of the
excited electron. As the energy of the incoming X-rays
increases, excitation occurs, causing a sharp increase in the
absorption signal. This energy is referred to as the absorption
edge. XAS is an element-specific technique because the energy
of an absorption edge correlates directly to the core-level
energy.9 As the core electron is excited above the Fermi level,
XAS reveals information about the unoccupied DOS. For
example, the K edge probes the transition of a 1s electron to np
and the L2,3 edges, that of a 2p to (n � 1)d. As a result, the
L3 edge is sensitive to the d DOS and directly probes the
oxidation state of a transition metal. The first intense feature,
also referred to as whiteline, in the L3 edge spectrum also
reveals the anti-bonding state that forms after adsorption of
the reactants.6b,c The shape and intensity provides information
about the electronic and geometric structure of the absorbing
atom, and the structure of the adsorption sites of reactants on
supported metal catalysts can be determined.10 The DmXANES technique emphasizes these characteristics.11
Although XAS and especially EXAFS are well understood
and applied experimental techniques along with full theoretical
support,12 they still have limitations. The technique does not
distinguish neighboring atoms of similar atomic number such
as C, O and N. Furthermore, because an XAS spectrum
records the contribution of all the atoms of the selected atomic
species present in the sample and gives an average signal, it is
difficult to resolve the various geometric and electronic states.
This limitation of traditional XAS can be overcome in part by
selective XAS. In a traditional XAS experiment, the absorp-
tion of X-rays is determined as a function of energy. The core
hole created after the excitation of the electron from the core
level is filled via Auger and fluorescence decay, which can also
be measured to determine the absorption signal. With the
peculiar experimental set-ups described in Section 5, it is
possible to measure the valence-selective XAS by tuning the
fluorescence energy of the detector to the energy of a fluores-
cence line of a particular valence and measuring the XAS
signal. This has been done successfully to distinguish the
coordination of the two different oxidation states of Fe3+
and Fe2+ in Prussian Blue.13 Similarly, spin-selective XAS can
be collected by tuning to the high- or low-spin state of an
element of interest. Several studies of 3d transition metals14
have successfully exploited such techniques to reveal the
presence of different spin states of the metal under different
conditions. Another limitation of XAS is the life-time broadening
of the core hole leading to intrinsically broad XAS spectra,
hindering a detailed interpretation of the spectra. A partial
solution has, however, been found.14a A method for recording
spectra with smaller life-time broadening will be described in
this review (section 2.3).
X-ray emission spectroscopy (XES), a relatively old technique,
has strongly developed in recent years due to developments in
flux density at third-generation synchrotrons using high-
brilliance and tunable X-ray sources.15 In an XES experiment,
excitation can be achieved at a certain energy and the energy-
dispersive X-ray emission can be determined by spectrometers
based on perfect crystal Bragg optics.14a,16 Depending on the
excitation energy, XES spectra are dependent on or indepen-
dent of the incident energy, i.e. resonant or non-resonant XES.
These will be discussed in detail in section 2.1 and 2.2. The
general principle of detecting the fluorescence energy of
photons, emitted after filling the core hole with valence
electrons, is the same for both resonant and non-resonant
XES. In contrast to XAS, XES provides information
about the occupied orbitals. Because in many cases, both
the excited and emitted X-rays are hard X-rays, the in situ
electronic structure of the specific elements of materials can be
investigated.17 This is in contrast to X-ray photoemission
spectroscopy (XPS)18 and ultra-violet photoemission spectro-
scopy (UPS),19 which generally require high vacuum. XES
clearly distinguishes ligands such as carbon, nitrogen and
oxygen,20 which is hardly possible with XAS. The peculiarity
of the ligand can be revealed, even in the liquid phase when
working with organic materials.21 The technique of resonant
XES, also referred to as resonant inelastic X-ray scattering
(RIXS) or X-ray resonance Raman spectroscopy, combines
XAS and XES.
Here a brief overview of XES is given with a focus on
catalysis research. To understand the origin of the activity and
reactivity over the catalysts for a specific reaction, the
geometric and electronic structures of the ensemble of atoms that
form the catalytically active site must be known. Hard X-rays in
XES have made dynamic in situ measurements possible.
The aim of this review is to guide the reader through typical
and recent developments in catalysis, achieved by means of
in situ XAS and XES. Through presenting a limited number of
characteristic examples, the possibilities and limitations will
be discussed; concepts and terminology will be presented.
Applications of XES for 3d and 5d transition metals will be
given, and the instrumentation required to perform XES will
be described.
2. Concepts
2.1 Resonant XES and RIXS
After excitation of an electron from a core level such as 1s, in
the case of the K edge, and 2p or 2s, in the case of the L edge, a
Jeroen A. van Bokhoven
Jeroen A. van Bokhoven wasborn in 1971 and obtained hisdegree in chemistry in 1995and his PhD in inorganicchemistry and catalysis in2000. Since 2010, he holdsa Chair in HeterogeneousCatalysis at the ETH Zurich,Switzerland and is headof the Laboratory for Energyand the Environment at theSwiss Light Source in Villigen,Switzerland. His researchinterests are heterogeneouscatalysis and structuralcharacterization using multiple
techniques. New catalysts and catalytic processes are investigatedthat are related to sustainability.
This journal is �c The Royal Society of Chemistry 2010 Chem. Soc. Rev., 2010, 39, 4754–4766 | 4755
Dow
nloa
ded
by U
nive
rsita
di T
orin
o on
17
Nov
embe
r 20
10Pu
blis
hed
on 1
6 N
ovem
ber
2010
on
http
://pu
bs.r
sc.o
rg |
doi:1
0.10
39/C
0CS0
0054
J
View Online
core hole is generated with a specific life-time broadening. This
broadening determines the width of the XAS spectra. The
electrons from upper levels decay and fill the core hole,
resulting in emission of Auger electrons and fluorescence
radiation. With XES, the emitted fluorescence energy is
recorded by a high-energy resolution spectrometer. The process,
during which the fluorescence energy emitted after the filling of
the core hole becomes a function of the incident energy, is
referred to as resonant XES or RIXS.15c,d,16a,22 A RIXS plane
is obtained when the incident energy is tuned across an
absorption edge, the electronic states are resonantly excited
and decay, and the fluorescence is detected in a energy-
dispersive manner.16a The process is described theoretically
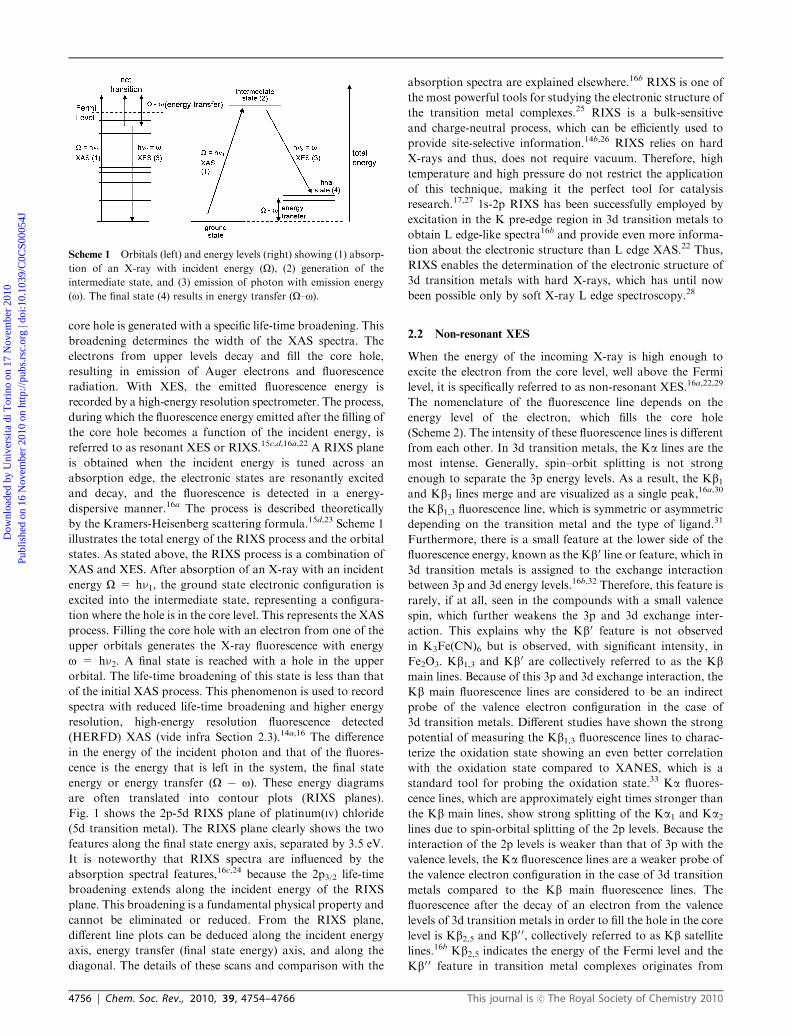
by the Kramers-Heisenberg scattering formula.15d,23 Scheme 1
illustrates the total energy of the RIXS process and the orbital
states. As stated above, the RIXS process is a combination of
XAS and XES. After absorption of an X-ray with an incident
energy O = hn1, the ground state electronic configuration is
excited into the intermediate state, representing a configura-
tion where the hole is in the core level. This represents the XAS
process. Filling the core hole with an electron from one of the
upper orbitals generates the X-ray fluorescence with energy
o = hn2. A final state is reached with a hole in the upper
orbital. The life-time broadening of this state is less than that
of the initial XAS process. This phenomenon is used to record
spectra with reduced life-time broadening and higher energy
resolution, high-energy resolution fluorescence detected
(HERFD) XAS (vide infra Section 2.3).14a,16 The difference
in the energy of the incident photon and that of the fluores-
cence is the energy that is left in the system, the final state
energy or energy transfer (O � o). These energy diagrams
are often translated into contour plots (RIXS planes).
Fig. 1 shows the 2p-5d RIXS plane of platinum(IV) chloride
(5d transition metal). The RIXS plane clearly shows the two
features along the final state energy axis, separated by 3.5 eV.
It is noteworthy that RIXS spectra are influenced by the
absorption spectral features,16c,24 because the 2p3/2 life-time
broadening extends along the incident energy of the RIXS
plane. This broadening is a fundamental physical property and
cannot be eliminated or reduced. From the RIXS plane,
different line plots can be deduced along the incident energy
axis, energy transfer (final state energy) axis, and along the
diagonal. The details of these scans and comparison with the
absorption spectra are explained elsewhere.16b RIXS is one of
the most powerful tools for studying the electronic structure of
the transition metal complexes.25 RIXS is a bulk-sensitive
and charge-neutral process, which can be efficiently used to
provide site-selective information.14b,26 RIXS relies on hard
X-rays and thus, does not require vacuum. Therefore, high
temperature and high pressure do not restrict the application
of this technique, making it the perfect tool for catalysis
research.17,27 1s-2p RIXS has been successfully employed by
excitation in the K pre-edge region in 3d transition metals to
obtain L edge-like spectra16b and provide even more informa-
tion about the electronic structure than L edge XAS.22 Thus,
RIXS enables the determination of the electronic structure of
3d transition metals with hard X-rays, which has until now
been possible only by soft X-ray L edge spectroscopy.28
2.2 Non-resonant XES
When the energy of the incoming X-ray is high enough to
excite the electron from the core level, well above the Fermi
level, it is specifically referred to as non-resonant XES.16a,22,29
The nomenclature of the fluorescence line depends on the
energy level of the electron, which fills the core hole
(Scheme 2). The intensity of these fluorescence lines is different
from each other. In 3d transition metals, the Ka lines are the
most intense. Generally, spin–orbit splitting is not strong
enough to separate the 3p energy levels. As a result, the Kb1and Kb3 lines merge and are visualized as a single peak,16a,30
the Kb1,3 fluorescence line, which is symmetric or asymmetric
depending on the transition metal and the type of ligand.31
Furthermore, there is a small feature at the lower side of the
fluorescence energy, known as the Kb0 line or feature, which in
3d transition metals is assigned to the exchange interaction
between 3p and 3d energy levels.16b,32 Therefore, this feature is
rarely, if at all, seen in the compounds with a small valence
spin, which further weakens the 3p and 3d exchange inter-
action. This explains why the Kb0 feature is not observed
in K3Fe(CN)6 but is observed, with significant intensity, in
Fe2O3. Kb1,3 and Kb0 are collectively referred to as the Kbmain lines. Because of this 3p and 3d exchange interaction, the
Kb main fluorescence lines are considered to be an indirect
probe of the valence electron configuration in the case of
3d transition metals. Different studies have shown the strong
potential of measuring the Kb1,3 fluorescence lines to charac-
terize the oxidation state showing an even better correlation
with the oxidation state compared to XANES, which is a
standard tool for probing the oxidation state.33 Ka fluores-
cence lines, which are approximately eight times stronger than
the Kb main lines, show strong splitting of the Ka1 and Ka2lines due to spin-orbital splitting of the 2p levels. Because the
interaction of the 2p levels is weaker than that of 3p with the
valence levels, the Ka fluorescence lines are a weaker probe of
the valence electron configuration in the case of 3d transition
metals compared to the Kb main fluorescence lines. The
fluorescence after the decay of an electron from the valence
levels of 3d transition metals in order to fill the hole in the core
level is Kb2,5 and Kb0 0, collectively referred to as Kb satellite
lines.16b Kb2,5 indicates the energy of the Fermi level and the
Kb0 0 feature in transition metal complexes originates from
Scheme 1 Orbitals (left) and energy levels (right) showing (1) absorp-
tion of an X-ray with incident energy (O), (2) generation of the
intermediate state, and (3) emission of photon with emission energy
(o). The final state (4) results in energy transfer (O–o).
4756 | Chem. Soc. Rev., 2010, 39, 4754–4766 This journal is �c The Royal Society of Chemistry 2010
Dow
nloa
ded
by U
nive
rsita
di T
orin
o on
17
Nov
embe
r 20
10Pu
blis
hed
on 1
6 N
ovem
ber
2010
on
http
://pu
bs.r
sc.o
rg |
doi:1
0.10
39/C
0CS0
0054
J
View Online

transitions from the ligand 2s energy levels to the transition
metal 1s level.16b,20,34 As these lines are directly influenced by
the valence electron configuration, they are particularly useful
for determining the valence electron configuration of 3d
transition metals. This, however, is at the expense of sensitivity,
because the intensity of the Kb satellite lines is more than
100 times weaker than that of the Ka fluorescence lines. It is
the strong sensitivity of these Kb0 0 lines, which makes XES
superior to EXAFS in discriminating among ligands with a
similar atomic number. To measure the weak Kb2,5 and Kb0 0
lines, an X-ray source with high flux and brilliance is required.
Third-generation synchrotrons now produce such X-rays, and
these methods have developed rapidly.
2.3 High-energy resolution fluorescence detected X-ray
absorption spectroscopy (HERFD XAS)
XAS is employed regularly to study the unfilled electronic
states above the Fermi level. In a conventional XAS experi-
ment, one monitors the transmitted photons or the radiative
and/or non-radiative decay of the sample, while scanning the
incident photons. The fluorescence, detected by XAS, is
applied to diluted samples which show too little absorption
of incoming photons by the element of interest to enable
detection of an absorption edge in the transmission signal.
The use of Ge detectors with a higher energy resolution than
photo-diodes at third-generation synchrotrons with high flux
has revealed the structure of diluted samples. There is a limit
to the energy resolution set by the life-time broadening of the
core hole. To achieve better resolution, it is necessary to
circumvent this limitation. This is possible by the selective
detection of a fluorescence decay channel, which has a core
hole with a longer life-time and, thus, less broadening. This
effectively leads to spectra with a higher energy resolution and
sharper features.16,35 Scheme 3 illustrates the spectral sharpening
of HERFD XAS, showing the life-time broadening of the Pt
2p3/2 core level at around 5 eV.36 The same absorption, which
represents the unoccupied states above the Fermi level, can be
probed by monitoring a selective fluorescence line such as
La1 (hn2 in Scheme 3) which leaves a core hole with a longer
life-time (Dt) and, thus, less broadening (DE), according to
Heisenberg’s indetermination principle (DE B h/Dt), see the
right hand side of Scheme 3. This technique is also efficient for
the fifth row elements of the periodic table, because the final
state effects are almost negligible due to the delocalized
character of 5d electrons. Care should be taken in the event
that the final state effects in resonant excitations close to the
Fig. 1 Total energy with incident and emitted photons (left) and RIXS plane of platinum chloride (right).
Scheme 2 Energy levels and different fluorescence emission lines.78
Scheme 3 Orbitals showing electronic transitions and life-time
broadening.
This journal is �c The Royal Society of Chemistry 2010 Chem. Soc. Rev., 2010, 39, 4754–4766 | 4757
Dow
nloa
ded
by U
nive
rsita
di T
orin
o on
17
Nov
embe
r 20
10Pu
blis
hed
on 1
6 N
ovem
ber
2010
on
http
://pu
bs.r
sc.o
rg |
doi:1
0.10
39/C
0CS0
0054
J
View Online

Fermi level are significant, because they may result in features
in the HERFD scans that may not be real.24,37 Therefore, in
the case of 3d transition metal complexes, special attention
should be given to the interpretation of the spectra, because
the interactions in the final state are not always weak in the
case of the K fluorescence lines. A full theoretical description
provides valuable electronic structural information. An
improved theoretical description is required to interpret
these data. Theoretical calculations, for example, multiplet
calculations and FEFF, enable the verification of the features
in the HERFD spectra, as has been successfully demonstra-
ted.16c,d,17,38 Another important advantage of HERFD XAS is
that the selective detection of a fluorescence decay channel is
element-specific. Thus, HERFD XAS can collect EXAFS
spectra with an extended k range, which would be otherwise
impossible because of the undesired edges that arise from
another element. One of very few examples is the collection
of Mn K edge EXAFS in the multiprotein PS II complex.39
The Fe K edge arises in the EXAFS region of the Mn K edge
and limits the distance resolution of EXAFS. HERFD XAS
enables the collection of spectra without the Fe edge, which
results in better distance resolution and greater precision in the
number of metal–metal scattering pairs.
The time needed to acquire XANES and HERFD XANES
spectra depends on the energy range to be monitored and the
concentration of the absorbing element. Generally, HERFD
XANES (Fig. 2b) can be performed in the time range of
minutes. For RIXS planes (Fig. 1b), step sizes for final state
energy (Y-axis) and incident energy (X-axis) can be varied
depending on the features in the planes. Generally, they take
hours to be recorded.
3. Applications
3.1 Adsorption studies: catalysis
All catalytic processes proceed in at least three basic steps:
(1) adsorption of reactants on the surface of the catalyst,
(2) reaction on the surface, and (3) desorption of the products.
The structure of an active site is prone to change during the
different stages of the catalytic process and must be deter-
mined to understand the actual reaction path on the surface of
the catalyst. This will facilitate the synthesis of new, more
active, selective, and stable catalysts, which often is the basis of
catalyst characterization. This section presents the successful
application of XAS to study the structure of various catalysts
after the first step in the catalytic process: the adsorption of
reactants. When an adsorbate is chemically adsorbed on a
metal surface, new bonding and anti-bonding states are
formed. When the anti-bonding states are pushed above the
Fermi level, the adsorbate bonds to the metal.6a,40 Because L3
edge XAS probes the empty d DOS, the first intense feature,
also referred as the whiteline, and the near-edge structure in L3
edge spectra are sensitive to the anti-bonding state and to
structural changes that occur after adsorption of the reactants
or intermediates.10
CO oxidation is one of the most studied reactions in the field
of heterogeneous catalysis. It is relevant in the automotive
catalysis and in the removal of CO from streams of hydrogen
used in fuels cells. Therefore, studies of the adsorption of
CO on the catalyst surface aid in understanding the key
steps in CO oxidation catalysis. HERFD XAS has potential
for the identification of the mode of bonding of CO to
alumina-supported platinum catalysts.16c Combining
Fig. 2 Pt L3 edge of 5 wt% Pt/Al2O3 after reduction in the presence of different atmospheres: He (black), He(O2) (red), and 1% CO/He (green)
measured using total fluorescence detection (a) and HERFDXAS spectroscopy (b). Theoretical (FEFF8.2) Pt L3 edge of the Pt6 cluster (black) and
the Pt6–CO clusters for CO atop (green), bridged (red), and face bridging (blue) with broadening (c) natural and (d) reduced by �1.6 eV; (e) the
d-DOS for Pt and p-DOS for C and O calculated for a Pt6–CO atop cluster.16c
4758 | Chem. Soc. Rev., 2010, 39, 4754–4766 This journal is �c The Royal Society of Chemistry 2010
Dow
nloa
ded
by U
nive
rsita
di T
orin
o on
17
Nov
embe
r 20
10Pu
blis
hed
on 1
6 N
ovem
ber
2010
on
http
://pu
bs.r
sc.o
rg |
doi:1
0.10
39/C
0CS0
0054
J
View Online

experiments with theoretical calculations based on the FEFF
code41 enabled the determination of the dominant CO adsorp-
tion configuration on nano-sized platinum and the orbitals
involved in the bonding. Fig. 2 shows the spectra collected by
means of conventional XAS and of HERFD XAS spectra
for an alumina-supported platinum catalyst in different gas
environments. The spectral features in the HERFD XAS
spectra were significantly sharper16,35 and showed a higher
intensity of the whiteline in the case of oxidized platinum and a
doublet feature in the whiteline in the spectrum, which was
shown to be typical of CO adsorbed on the surface of the
catalyst in atop configuration. The doublet was not resolved in
the conventional XAS spectrum. The theoretical calculations
confirmed that the CO adsorbed dominantly in the atop
position on the platinum surface, which was also known from
infrared spectroscopy.42 Fig. 2 shows the FEFF41 calculated
spectra with three different CO adsorption configurations. The
Pt d-DOS overlapped with the 2p* orbitals of C and O,
resulting in the feature at the higher energy side of the doublet.
In bridged and face bridging configurations, the orbitals
might not be aligned to overlap sufficiently to form this anti-
bonding state.
To complete the determination of the electronic structure,
the bonding orbitals and change in the d-DOS of the metal
after adsorption of reactants must be determined. Traditionally,
XPS18 of the valence band and UPS19 are used to probe the
structure of the valence band. However, these methods require
high vacuum. RIXS, with all its advantages, was employed to
gain insight into the occupied d-DOS of platinum upon CO
adsorption for alumina-supported platinum catalysts.17 Fig. 3
shows the 2p3/2-5d RIXS planes of reduced metallic platinum
nanoparticles and the planes of these particles upon adsorp-
tion of CO. The features in the RIXS planes show the emission
from the d DOS valence band of platinum. For reduced
platinum nanoparticles, the elastic peak, the feature at zero
energy value of energy transfer, merged with the energy
distribution at higher energy transfer. This confirmed that
the Fermi level cuts through the 5d band of platinum.17 The
energy resolution was lower than typically observed in XPS
and UPS. The energy distribution broadened, and there was a
gap between the elastic peak and the occupied states that
formed after adsorption of CO. These differences clearly
showed the differences in the electronic structure of platinum
before and after CO adsorption. Therefore, HERFD and
RIXS experiments showed that CO adsorption caused
considerable changes in the electronic structure of the
platinum catalysts. As the gap opening suggested that the
centre of d band shifted away from the Fermi level, it rendered
the platinum catalyst to weaker adsorption of reactants.6a,43
Because according to d band theory, metals that have their d
band centre closer to the Fermi level are more active towards
the adsorption of adsorbates than those with a d band centre
farther from the Fermi level.6a,43 Therefore, CO poisoned the
catalyst not only by occupying the sites but also by lowering
the adsorption of other reactants.44
Both HERFD XAS and RIXS were also applied simul-
taneously to study the alloying of platinum nanoparticles with
tin.27a Alloying platinum with tin resulted in the narrowing of
the d band of platinum and a downward shift relative to the
Fermi level. The adsorption of CO resulted in a considerable
modification of the electronic structure. The strong similarity
of the RIXS planes and the HERFD spectra collected after
CO adsorption of both the monometallic platinum and
bimetallic platinum-tin nanoparticles suggested that the strong
adsorption of CO altered the geometric structure of the
bimetallic nanoparticles.
3.2 In situ studies: catalysis
3.2.1 CO oxidation. Hard X-rays make XES one of
the best techniques for studying the electronic structure of
catalysts, element specifically, under real reaction conditions.
The combination of HERFD XAS and kinetic measurements
during CO oxidation over alumina-supported platinum catalysts
gave information about the active species in the reaction.44
They were assumed to be metallic platinum,45–47 oxidic
platinum,48 or a combination of metallic and oxidic phases49,50
The oxidation of CO over platinum catalysts occurs in two
distinctive regimes namely low- and high-activity regime with
low and high rate of CO oxidation respectively.44,45,47,48,51
Fig. 4 shows in situ Pt L3 edge HERFD spectra, collected
during CO oxidation. The spectra established the structure of
the catalyst in two different reaction regimes. The spectra in
the low-activity regime (at low temperature) showed the
doublet in the whiteline, which is characteristic of adsorbed
CO on reduced platinum.16d The adsorbed CO poisoned the
catalyst surface (vide supra) and rendered the catalyst less
active.1c,52 The rate-limiting step, in this regime, is desorption
of CO. The spectra collected in the high-activity regime
showed an intense whiteline, which is characteristic of partially
oxidized platinum.16d Quick EXAFS, collected during the
switch between the two regimes showed that oxidation of
the catalyst occurred during activation.44,53 The structure of
the surface platinum oxide was highly defective with platinum
under-coordinated to oxygen.51e Therefore, the high-activity
regime was characterized by the presence of an active surface
oxide.48,54 The transition from the low-activity regime to the
high-activity regime resulted in depletion of CO from the
platinum surface, which enabled the oxygen interaction and
the formation of the more active catalyst, where the platinum
surface was partially oxidic. This enhanced the catalytic
activity by changing the rate-limiting step.
3.2.2 Selective oxidation. Another study, the first of its
kind to be reported, stressed the advantage of detecting
secondary radiation and involved the well-known framework-
substituted FeZSM-5 catalyst.55 Such a catalyst is very selective
in the oxidation of benzene to phenol in the presence of N2O.56
The activity of the catalyst was strongly dependent on the iron
loading and the structure of the active iron species on the
method of preparation. Because of the very low iron content,
it is difficult to determine the active species of the framework-
substituted FeZSM-5 catalyst compared to over-exchanged
Fe/ZSM-5, where most of the iron active species have been
claimed to be in the form of binuclear iron clusters,57 similar to
active methane monooxygenase in enzymes. The activation
processes involving ion-exchange, calcination, and steaming
can lead to the formation of different kinds of oxo-iron
species. Attempts were made to specify the active species by
This journal is �c The Royal Society of Chemistry 2010 Chem. Soc. Rev., 2010, 39, 4754–4766 | 4759
Dow
nloa
ded
by U
nive
rsita
di T
orin
o on
17
Nov
embe
r 20
10Pu
blis
hed
on 1
6 N
ovem
ber
2010
on
http
://pu
bs.r
sc.o
rg |
doi:1
0.10
39/C
0CS0
0054
J
View Online

Mossbauer spectroscopy58 and ESR spectroscopy.59 The
heterogeneity of the active iron-oxygen species and the non-
quantitative aspect of the mentioned techniques make the
characterization of the catalyst a challenging task. XAS was
employed to correlate the structure of iron in terms of oxida-
tion state and coordination of iron silicates.59,60 The pre-edge
region in K-edge XAS spectra is a measure of symmetry and
oxidation state. However, subtraction of the main edge from
the pre-edge requires appropriate methods to correctly assign
the trends. The Kb-detected XAS spectra, collected by detecting
the intensity of the Kb1,3 fluorescence line as a function of
incident energy,16a,22,25a had sharper spectral features than
conventional XAS spectra (vide supra Section 2.3). This aided
the better isolation of the pre-edge region, which further
facilitated the quantitative determination of the electronic
and geometric structures of active iron species in FeZSM-5
catalyst. Fig. 5 shows the Fe K pre-edge feature, determined in
conventional mode and selectively by detecting the Kb1,3fluorescence line. The features were clearly sharper in the
Kb-detected XAS. Moreover, the pre-edge region was virtually
isolated from the main edge. Therefore, no background
subtraction was required, as was the case with the conven-
tional method. Fig. 6 shows the Kb-detected XANES of the
FeZSM-5 catalyst after different treatments during activation
of the catalyst. All the spectra were measured at 350 1C
in a flow of 7.7% O2 in He. An intense single peak in the
pre-edge region implied the presence of iron in tetrahedral
symmetry.55,59 In octahedral symmetry, the pre-edge feature is
accompanied by a small shoulder. The energy and intensity of
the pre-edge feature are the basis for assigning the structure.61
Iron oxide phases, FeOx, which are considered to be inactive,62
were virtually absent, because the centroid of the pre-edge
feature, after all the treatments, was closer to the 3+ oxida-
tion state (Fig. 7). The decreasing intensity of the pre-edge
Fig. 3 (top) 2p3/2 RIXS planes of supported Pt nanoparticles: (left) metallic and (right) with CO adsorbed. (bottom) Calculated RIXS planes for a
bare Pt6 cluster and the cluster with CO coordinated at three different sites. (top) 2p3/2 RIXS planes of supported Pt nanoparticles: (left) metallic
and (right) with CO adsorbed. (bottom) Calculated RIXS planes for a bare Pt6 cluster and the cluster with CO coordinated at three different sites.17
4760 | Chem. Soc. Rev., 2010, 39, 4754–4766 This journal is �c The Royal Society of Chemistry 2010
Dow
nloa
ded
by U
nive
rsita
di T
orin
o on
17
Nov
embe
r 20
10Pu
blis
hed
on 1
6 N
ovem
ber
2010
on
http
://pu
bs.r
sc.o
rg |
doi:1
0.10
39/C
0CS0
0054
J
View Online

feature following steaming (Fig. 6) revealed that these
treatments extract iron from the zeolite framework and that
iron then migrated to extra-framework positions. Kb-detectedXANES gave greater insight into the structure of FeZSM-5
catalysts under in situ conditions of activation.
4. Soft X-rays
The energy of soft X-rays is lower than 1000 eV. The absorp-
tion K edges of C, N, and O, which are abundant atoms in
reacting species, fall in the soft X-ray range. Moreover, the L
edges of the first row of elements in the periodic table are in
this range. This opens the possibility to look to both adsorbate
and catalytic surface. Determining the structure of adsorbate
on different transition metals, measured by soft XES, has
contributed to understand how these species adsorb and react
with the surface. Using grazing incident radiation, the
XES technique can be made surface sensitive.15e There are
many surface-sensitive spectroscopic techniques for studying
the electronic structure of adsorbates,63 but XES enables to
Fig. 4 (a) Rate of oxidation of carbon monoxide over 2 wt%
Pt/Al2O3 during heating (5 K min�1) at oxygen to carbon monoxide
ratios of 1. (b) Pt L3 edge HERFD XANES of 2 wt% Pt/Al2O3 during
oxidation of carbon monoxide at an oxygen to carbon monoxide ratio
of one measured during heating at 308 K (red), 328 K (green), 361 K
(blue) 394 K (cyan), 425 K (pink), 443 K (orange), 475 K (yellow), and
491 K (grey). The arrows indicate the trends.44
Fig. 5 Fe K pre-edge feature of Fe2SiO4 (fayalite: FeII, Oh).
Below: conventional fluorescence XANES spectrum (solid), cubic
spline function used to model the background (dash), and the isolated
pre-edge (dot). Top: Kb-detected XANES spectrum, no background
subtracted.55a
Fig. 6 (a) Kb-detected XANES of framework-substituted FeZSM-5
samples: tf-FeZSM-5, after template removal (dashed line);H-FeZSM-5,
proton form after calcination of ammonium-exchanged sample
(dotted line); ms-FeZSM-5, mild-steamed sample (dash-dot line); and
hs-FeZSM-5, hard-steamed sample (solid line). (b) Zoom of the pre-edge
region.55
This journal is �c The Royal Society of Chemistry 2010 Chem. Soc. Rev., 2010, 39, 4754–4766 | 4761
Dow
nloa
ded
by U
nive
rsita
di T
orin
o on
17
Nov
embe
r 20
10Pu
blis
hed
on 1
6 N
ovem
ber
2010
on
http
://pu
bs.r
sc.o
rg |
doi:1
0.10
39/C
0CS0
0054
J
View Online

determine the electronic structure element specific.64 XES is,
thus, an ideal tool for determining the nature of the surface
chemical bonds of molecular adsorbates, such as N2, CO65 and
hydrocarbons66 as the structure of either atom can be probed
using high energy-resolved X-rays. These studies elucidated
the orientation of the molecules on the surfaces and identified
the orbitals that are involved in the bonding.
Adsorption of CO
The adsorption studies of adsorbates like N2 and CO
on various transition metals provide a simple and general
platform for understanding the processes and phenomena on
surfaces and are therefore of great significance in the field of
catalysis. Many studies consider the adsorbate as a single
molecular unit and weakening of molecular bond is related
to the increased electronic population of the anti-bonding 2p*state due to back donation by the metal.67 Soft X-ray XES
enables detecting the orbitals involved in the bonding. CO was
shown to adsorb on Ni (100) surfaces preferably on on-top
sites with the carbon atom attached to the surface.68 Fig. 8
compares the XES spectra of adsorbed CO on Ni (100) and
Cu (100) surfaces with that of the gas phase CO. The spectra were
plotted on the common binding energy scale relative to the
Fermi level.69 The spectra were divided into states of p- ands-symmetry that were obtained by detecting in the normal and
grazing X-ray emission modes respectively.70 For gas phase
CO, such division was not possible. These experimental XES
spectra were well reproduced using ground-state calculations
obtained by density functional theory (DFT) calculations,65 as
shown in Fig. 9. In Fig. 8, the 1p state of the free CO molecule
had a much higher intensity in the O K edge emission
spectrum compared to that of the C K edge. This indicated
that the polarization is mainly towards the oxygen atom
within the CO molecule. After adsorption of the CO on either
Ni (100) or Cu (100) surface, the 1~p is less polarised towards
Fig. 7 Integrated pre-edge intensity vs. centroid position for iron
in different FeZSM-5 samples. Framework-substituted FeZSM-5
samples are compared with extraframework cvd-Fe/ZSM-5 samples.
All iron-containing ZSM-5 samples are measured in a flow of oxygen
(7.7 vol% in He) at 350 1C unless indicated by @25, meaning 25 1C:
tf-FeZSM-5, after template removal; H-FeZSM-5, proton form
after calcination of ammonium-exchanged sample; ms-FeZSM-5,
mild-steamed sample; and hs-FeZSM-5, hard-steamed sample. The
pre-edge characteristics are also given for iron model compounds:
FePO4 =4Fe(III), a-Fe2O3 =
6Fe(III), and Fe2SiO4 =6Fe(II).55
Fig. 8 Experimental X-ray emission spectra of the carbon and
oxygen atomic centers (K-edges) for CO gas and adsorbed CO on
Cu(100) and Ni(100). The adsorbates have a c(2�2) superstructure onthe crystal (100) faces, occupying on-top sites.65
Fig. 9 Ground state frozen orbital calculations of carbon and oxygen
K-edge XES for CO gas and CO adsorbed on Cu26- and Ni13-cluster
models. Broadening of 0.5 eV (FWHM).65
4762 | Chem. Soc. Rev., 2010, 39, 4754–4766 This journal is �c The Royal Society of Chemistry 2010
Dow
nloa
ded
by U
nive
rsita
di T
orin
o on
17
Nov
embe
r 20
10Pu
blis
hed
on 1
6 N
ovem
ber
2010
on
http
://pu
bs.r
sc.o
rg |
doi:1
0.10
39/C
0CS0
0054
J
View Online

O as the ratio of the intensities of O to C emission peaks
decreased. For both Ni (100) and Cu (100) surfaces, the broad
features originated between the Fermi level and 5 eV in the
p-symmetry state spectra (shown in the zoom on the left side
of Fig. 8). These were assigned to the dp-band state because
these states arose mainly from the metal d-band.65 The
dp-band had some differences for Ni and Cu surfaces. For
Ni (100) surface, the feature at about 4.5 eV was clearly visible
only in the O K edge spectrum. This state is a characteristic
oxygen lone-pair of p-symmetry.65 The feature at 1.5 eV had
contributions from both O and C K edge spectra. For Cu (100)
surface, similar spectral features were observed but they were
less pronounced. The O K edge spectrum had a broad
distribution tailing towards the Fermi level, which was
centered around 5 eV. The C K edge spectrum distribution
had always lower intensity compared to O K edge spectrum.
These differences between Ni and Cu could be assigned to the
fact that in Cu the energetic mixing of p-band with d-band is
not as favorable as in Ni. This leads to a broad energetic
spread of dp-band state for Cu compared to Ni.
Fig. 8, right side shows the experimental XES spectra of
s-symmetry are shown. The 4s and 5s states that represent
the two occupied outer valence orbitals of s-symmetry
changed in peak position and in relative intensities after
adsorption of CO as indicated by 4~s and 5~s states. The
relative strength of 4~s and 5~s states in O K edge spectrum
is the measure of the degree of polarization upon adsorption.
For gas phase CO, in the O Kedge spectrum, the relative
intensity of 4s is higher than that of 5s state. But, after
adsorption of CO on Ni (100), the relative intensity of 4sbecame less than 5s state, and after adsorption of CO on Cu
(100), the intensities were almost similar. Also the relative
energy positions of 4~s and 5~s states changed as this difference
was decreased to 2.5 eV compared to 5.5 eV for the gas
phase CO. These differences suggested polarization of the
5~s towards the oxygen atom and the 4~s towards the carbon
atom after adsorption of CO on either metal surface. There
were some weak features tailing towards the Fermi level
assigned to the ds band.
These spectra showed how the adsorbate electronic struc-
ture was changed after the adsorption of CO on the metal
surface. These changes strongly effect the bond formation
between the adsorbate and the metal surface. Table 1 summarizes
experimental and theoretical values of the C–O stretch
frequency, C–O bond distance, C–Me bond distance, and
the adsorption energy of gas phase CO and CO adsorbed on
Cu (100) and Ni (100) surfaces. The change in the adsorption
energy directly indicates the overall stability of the system and
the C–O stretch frequency, C–O bond distance, and C–Me
bond distance can be used as the parameters to describe the
local bond characteristics. By applying constrained space
orbital variation analysis,71 and analysing the change in
C–O stretch frequency, C–O bond distance, and C–Me bond
distance, upon changing the p- and s-symmetry orbitals
individually, it was concluded that p- and s-symmetry orbitals
behave opposite to each other. The mixing of the p-symmetry
orbitals of CO with the metal weakens the internal CO
bond and favours the metal CO bond formation whereas
s-symmetry orbitals gives a repulsive contribution to the
metal CO bond and thus leads to strengthening of the internal
CO bond. Therefore, the overall result of these polarizations
between the CO molecule as observed in the XES spectrum
and the p- and s-interaction is the partial breaking of the
internal bonds of CO and formation of metal CO bond.40
5. Instrumentation
XES proceeds by the selective collection of emitted photons
from the sample. Various types of XES spectrometers exist.
With one type of spectrometer, scanning occurs through the
desired energy range along the Bragg angle, and the crystal
used in such spectrometer is referred to as the Bragg crystal. It
is generally a spherically bent crystal16b,72 which increases the
efficiency of the spectrometer in collecting all the fluorescence
lines from the sample with the same Bragg angle. To achieve
this, the sample, the Bragg crystal, and the detector all need
to be in Rowland geometry. This type of setup was first
introduced by Johann72a (Johann-type spectrometer). The
energy resolution of such spectrometers depends for most part
on the quality of the crystal and also on the deviation from the
Rowland geometry.72c The photon efficiency of such spectro-
meter can be increased by increasing the number of crystals
that are all aligned on a Rowland circle. Such setups are
already existing at various beamlines at synchrotron radiation
facilities e.g. ESRF, SSRL, and SLS. The detectors are
generally solid-state72a,c,73 or MYTHEN-II detectors.74 The
type of Bragg crystals depends on the energy range of the XES
study and their number and size effect the sensitivity.
Another type of spectrometer design is based on poly-
chromators, which are either flat crystals75 or cylindrically
bent crystals.76 Because the crystal causes a polychromatic
dispersion of the fluorescence X-rays from the sample, a
position-sensitive detector is required in this type of spectro-
meter. It is not required to scan the Bragg angle across the
spectral range, so that such polychromatic spectrometers are
more suitable for the simultaneous recording of all parts of the
spectrum and are at the forefront of time-dependent studies.
However, due to the lower energy resolution of the detectors
and the lower signal-to-noise ratio because of unwanted
scattering, polychromatic spectrometers are not as suitable
Table 1 CO ground state properties from experiment and calculations65
CO properties
C–O stretch frequency/cm�1 d C–O, D C–Me/A Eads (eV/molecule)
Theory Experiment Theory Experiment Theory Experiment
Gas 2101 2169.8 1.146 1.128Cu (100) 2049 2089.0 1.161, 1.950 1.15 � 0.10, 1.90 � 0.10 �0.6 �0.7Ni (100) 1976 2064.8 1.165, 1.749 1.13 � 0.10, 1.80 � 0.10 �1.7 �1.3
This journal is �c The Royal Society of Chemistry 2010 Chem. Soc. Rev., 2010, 39, 4754–4766 | 4763
Dow
nloa
ded
by U
nive
rsita
di T
orin
o on
17
Nov
embe
r 20
10Pu
blis
hed
on 1
6 N
ovem
ber
2010
on
http
://pu
bs.r
sc.o
rg |
doi:1
0.10
39/C
0CS0
0054
J
View Online
as spectrometers based on Bragg crystals in Rowland geometry.
The combination of both spectrometers and performing
dispersion-compensation correction led to a much better energy
resolution without any loss in the accepted solid angle.77
6. Conclusions
XES is a powerful tool for studying the electronic structure
element specific. The high-energy resolution achieved by selective
detection of a fluorescence channel is employed to study the
behaviour of supported metal catalysts under actual catalytic
conditions (high temperature and various gases). Such measure-
ments play a vital role in following a reaction over a catalyst
surface as the structure of the surface sites can be probed
efficiently with better resolution compared to conventional
XAS technique. RIXS is utilized in in situ studies to determine
the active species of catalysts. The knowledge gained from the
RIXS planes provides complementary information to the XAS
technique and thus assist in gaining the overall picture about
the states involved in the bonding process. HERFD XAS and
RIXS are powerful tools for studying the electronic structure
in an element–specific manner. The structure of various oxides
and effect of dopants on the structure can be studied and
insights into active species involved in various reactions can be
revealed. The use of hard X-rays in XES is essential to
establish structure-performance relationships for real catalysts
and to translate the results from surface-science experiments,
which are often done with single crystals under vacuum
conditions and by means of soft X-rays or electrons. The
dynamism in the structure of catalysts after interaction with
reactants and adsorbates can be apprehended successfully by
means of HERFD XAS and RIXS. The site selective EXAFS
is beneficial in probing the structure of specific catalyst
elements present in certain sites, which can further help
in resolving the queries about the active catalytic centres.
The application of X-ray emission spectrometers at various
beamlines of synchrotrons, the combination of XES and XAS
to provide complementary information, and the involvement
of theory to comprehend the experimental data in this field has
attracted the interest of a large number of researchers in
various fields. The development of setups that combine
complementary methods and fast X-ray sources will open up
a new era for the study of catalytic reactions. A much wider
application of these methods is expected.
Acknowledgements
The authors would like to acknowledge Pieter Glatzel for
valuable discussions and his help during beamtimes at ID 26,
ESRF (European Synchrotron Radiation Facility), France.
The authors also thank Swiss National Science Foundation
for the financial grant. C. L. and J. A. V. B. are thankful for
support from the MaMaSELF consortium (http://etudes.
univ-rennes1.fr/mamaself).
References
1 (a) G. Ertl, Adv. Catal., 1990, 37, 213; (b) R. J. Farrauto andR. M. Heck, Catal. Today, 1999, 51, 351; (c) P. T. Fanson,W. N. Delgass and J. Lauterbach, J. Catal., 2001, 204, 35;
(d) M. Haruta and M. Date, Appl. Catal., A, 2001, 222, 427;(e) P.-A. Carlsson, L. Oesterlund, P. Thormaehlen, A. Palmqvist,E. Fridell, J. Jansson and M. Skoglundh, J. Catal., 2004, 226, 422;(f) N. Lopez, T. V. W. Janssens, B. S. Clausen, Y. Xu,M. Mavrikakis, T. Bligaard and J. K. Nørskov, J. Catal., 2004,223, 232.
2 (a) D. S. Newsome, Catal. Rev. Sci. Eng., 1980, 21, 275;(b) D. Andreeva, V. Idakiev, T. Tabakov and A. Andreev,J. Catal., 1996, 158, 354; (c) H. Sakurai, A. Ueda, T. Kobayashiand M. Haruta, Chem. Commun., 1997, 271; (d) T. Bunluesin,R. J. Gorte and G. W. Graham, Appl. Catal., B, 1998, 15, 107;(e) T. Tabakova, V. Idakiev, D. Andreeva and I. Mitov, Appl.Catal., A, 2000, 202, 91; (f) M. Mokhtar, T. M. Salama andM. Ichikawa, J. Colloid Interface Sci., 2000, 224, 336;(g) S. Hilaire, X. Wang, T. Luo, R. J. Gorte and J. Wagner, Appl.Catal., A, 2001, 215, 271; (h) Q. Fu, A. Weber and M. Flytzani-Stephanopoulos, Catal. Lett., 2001, 77, 87.
3 (a) G. C. Bond and P. A. Sermon, J. Chem. Soc., Chem. Commun.,1973, 444b; (b) Z. Xu, F.-S. Xiao, S. K. Purnell, O. Alexeev,S. Kawi, S. E. Deutsh and B. C. Gates, Nature, 1994, 372, 346;(c) P. Claus, A. Bruckner, C. Mohr and H. Hofmeister, J. Am.Chem. Soc., 2000, 122, 11430; (d) Y. H. Niu, L. K. Yeung andR. M. Crooks, J. Am. Chem. Soc., 2001, 123, 6840; (e) A. Cormaand P. Serna, Science, 2006, 313, 332.
4 (a) M. A. Vannice, J. Catal., 1975, 37, 462; (b) M. Araki andV. Ponec, J. Catal., 1976, 44, 439; (c) R. A. Demminand R. J. Gorte, J. Catal., 1987, 105, 373; (d) J. G. Xu andG. F. Froment, AIChE J., 1989, 35, 88; (e) R. A. Lemons, J. PowerSources, 1990, 29, 251; (f) M. J. Kahlich, H. A. Gasteiger andR. J. Behm, J. Catal., 1997, 171, 93.
5 (a) C. Bianchi, F. Porta, L. Prati and M. Rossi, Top. Catal., 2000,13, 231; (b) F. Porta, L. Prati, M. Rossi, S. Coluccia andG. Martra, Catal. Today, 2000, 61, 165.
6 (a) B. Hammer and J. K. Nørskov, Nature, 1995, 376, 238;(b) D. E. Ramaker and D. C. Koningsberger, Phys. Rev. Lett.,2002, 89, 139701; (c) A. L. Ankudinov, J. J. Rehr, J. J. Low andA. R. Bare, Phys. Rev. Lett., 2002, 89, 139702; (d) G. A. Somorjaiand A. L. Marsh, Philos. Trans. R. Soc. London, Ser. A, 2005, 363,879.
7 D. C. Koningsberger and R. Prins, in X-ray Absorption: Principles,Applications, Techniques of EXAFS, SEXAFS, and XANES, Wiley,New York, 1988.
8 E. A. Stern, D. E. Sayers and F. W. Lytle, Phys. Rev. B: SolidState, 1975, 11, 4836.
9 (a) D. C. Koningsberger, B. L. Mojet, G. E. van Dorssen andD. E. Ramaker, Top. Catal., 2000, 10, 143; (b) J. A. van Bokhoven,T. Ressler, F. M. F. de Groot and G. Knopp-Gericke, in In situSpectroscopy of Catalysts, ed. B. M. Weckhuysen, AmericanScientific Publishers, California, 2004, p. 123.
10 (a) D. E. Ramaker, B. L. Mojet, M. T. G. Oostenbrink, J. T. Millerand D. C. Koningsberger, Phys. Chem. Chem. Phys., 1999, 1, 2293;(b) A. L. Ankudinov, J. J. Rehr, J. Low and S. R. Bare, Phys. Rev.Lett., 2001, 86, 1642; (c) M. K. Oudenhuijzen, J. A. van Bokhoven,J. T. Miller, D. E. Ramaker and D. C. Koningsberger, J. Am.Chem. Soc., 2005, 127, 1530; (d) N. Weiher, E. Bus, L. Delannoy,C. Louis, D. E. Ramaker, J. T. Miller and J. A. van Bokhoven,J. Catal., 2006, 240, 100; (e) E. Bus, D. E. Ramaker and J. A. vanBokhoven, J. Am. Chem. Soc., 2007, 129, 8094.
11 D. E. Ramaker and D. C. Koningsberger, Phys. Chem. Chem.Phys., 2010, 12, 5514.
12 (a) B. K. Teo and P. A. Lee, J. Am. Chem. Soc., 1979, 101, 2815;(b) J. J. Rehr, J. Mustre de Leon, S. I. Zabinsky and R. C. Albers,J. Am. Chem. Soc., 1991, 113, 5135; (c) A. Filipponi, A. DiCiccoand C. R. Natoli, Phys. Rev. B: Condens. Matter, 1995, 52, 15122.
13 P. Glatzel, L. Jacquamet, U. Bergmann, F. M. F. de Groot andS. P. Cramer, Inorg. Chem., 2002, 41, 3121.
14 (a) K. Hamalainen, D. P. Siddons, J. B. Hastings andL. E. Berman, Phys. Rev. Lett., 1991, 67, 2850; (b) X. Wang,F. M. F. de Groot and S. P. Cramer, Phys. Rev. B: Condens.Matter, 1997, 56, 4553.
15 (a) G.Materlik, C. J. Sparks and K. Fischer, inResonant AnomalousX-Ray Scattering: Theory and Applications, North-Holland,Amsterdam, 1994; (b) D. L. Ederer and J. H. McGuire, in RamanEmission by X-Ray Scattering, World Scientific, Singapore, 1996;(c) J. Nordgren and E. Z. Kurmaev, J. Electron Spectrosc. Relat.
4764 | Chem. Soc. Rev., 2010, 39, 4754–4766 This journal is �c The Royal Society of Chemistry 2010
Dow
nloa
ded
by U
nive
rsita
di T
orin
o on
17
Nov
embe
r 20
10Pu
blis
hed
on 1
6 N
ovem
ber
2010
on
http
://pu
bs.r
sc.o
rg |
doi:1
0.10
39/C
0CS0
0054
J
View Online

Phenom., 2000, 110–111, 1; (d) A. Kotani and S. Shin, Rev. Mod.Phys., 2001, 73, 203; (e) N. Wassdahl, A. Nilsson, T. Wiell,H. Tillborg, L. C. Duda, J. Guo, N. Martensson, J. Nordgren,J. N. Andersen and R. Nyholm, Phys. Rev. Lett., 1992, 69, 812.
16 (a) P. Glatzel and U. Bergmann, Coord. Chem. Rev., 2005, 249, 65;(b) J. A. van Bokhoven, C. Louis. J. T. Miller, M. Tromp,O. V. Safonova and P. Glatzel, Angew. Chem., Int. Ed., 2006, 45,4651; (c) O. V. Safonova, M. Tromp, J. A. van Bokhoven,F. M. F. de Groot, J. Evans and P. Glatzel, J. Phys. Chem. B,2006, 110, 16162.
17 P. Glatzel, J. Singh, K. O. Kvashnina and J. A. van Bokhoven,J. Am. Chem. Soc., 2010, 132, 2555.
18 (a) K. Siegbahn, C. Nordling, G. Johansson, J. Hedman,P. F. Heden, K. Hamrin, U. Gelius, T. Bergmark, L. O. Werme,R. Manne and Y. Baer, in ESCA Applied to Free Molecules,North-Holland, Amsterdam, 1969; (b) S. Hufner, in PhotoelectronSpectroscopy, Springer-Verlag, Berlin, 1995; (c) N. Martenssonand A. Nilsson, in Applications of Synchrotron Radiation: HighResolution Studies of Molecules and Molecular Adsorbates,ed. W. Eberhardt, Springer-Verlag, Berlin, 1995, vol. 35.
19 S. D. Kevan, in Angle-Resolved Photoemission, Elsevier, Amsterdam,1992.
20 U. Bergmann, C. R. Horne, T. J. Collins, J. M. Workman andS. P. Cramer, Chem. Phys. Lett., 1999, 302, 119.
21 V. A. Safonova, L. N. Vykhodsteva, Y. M. Polukarov,O. V. Safonova, G. Smolentsev, M. Sikora, S. G. Eeckhout andP. Glatzel, J. Phys. Chem. B, 2006, 110, 23192.
22 F. de Groot, Chem. Rev., 2001, 101, 1779.23 F. Gel’mukhanov and H. Agren, Phys. Rep. Rev. Soc. Phys. Lett.,
1999, 312, 91.24 P. Carra, M. Fabirizio and B. T. Thole, Phys. Rev. Lett., 1995, 74,
3700.25 (a) W. A. Caliebe, C. C. Kao, J. B. Hastings, M. Taguchi,
T. Uozumi and F. M. F. de Groot, Phys. Rev. B: Condens. MatterMater. Phys., 1998, 58, 13452; (b) P. Glatzel, U. Bergmann,W. W. Gu, H. X. Wang, S. Stepanov, B. S. Mandimutsira,C. G. Riordan, C. P. Horwitz, T. Collins and S. P. Cramer,J. Am. Chem. Soc., 2002, 124, 9668; (c) P. Glatzel, U. Bergmann,J. Yano, H. Visser, J. H. Robblee, W. Gu, F. M. F. de Groot,G. Christou, V. L. Pecoraro, S. P. Cramer and V. K. Yachandra,J. Am. Chem. Soc., 2004, 126, 9946; (d) F. M. F. de Groot,P. Glatzel, U. Bergmann, P. A. van Aken, R. A. Barrea,S. Klemme, M. Havecker, A. Knop-Gericke, W. M. Heijboerand B. M. Weckhuysen, J. Phys. Chem. B, 2005, 109, 20751.
26 K. Hamalainen, C. C. Kao, J. B. Hastings, D. P. Siddons,L. E. Berman, V. Stojanoff and S. P. Cramer, Phys. Rev. B:Condens. Matter, 1992, 46, 14274.
27 (a) J. Singh, R. C. Nelson, B. C. Vicente, S. L. Scott and J. A. vanBokhoven, Phys. Chem. Chem. Phys., 2010, 12, 5668; (b) J. A. vanBokhoven, Phys. Chem. Chem. Phys., 2010, 12, 5502.
28 (a) G. van der Laan, B. T. Thole, G. A. Sawatzky andM. Verdaguer, Phys. Rev. B: Condens. Matter, 1988, 37, 6587;(b) J. van Elp, G. Peng, B. G. Searle, S. Mitra-Kirtley,Y. H. Huang, M. K. Johnson, Z. H. Zhou, M. W. W. Adams,M. J. Maroney and S. P. Cramer, J. Am. Chem. Soc., 1994, 116,1918; (c) H. X. Wang, C. Y. Ralston, D. S. Patil, R. M. Jones,W. Gu, M. Verhagen, M. Adams, P. Ge, C. Riordan,C. A. Marganian, P. Mascharak, J. Kovacs, C. G. Miller,T. J. Collins, S. Brooker, P. D. Croucher, K. Wang, E. I. Stiefeland S. P. Cramer, J. Am. Chem. Soc., 2000, 122, 10544.
29 F. M. F. de Groot, J. Electron Spectrosc. Relat. Phenom., 1994, 67,529.
30 U. Bergmann, P. Glatzel, F. De Groot and S. P. Cramer, J. Am.Chem. Soc., 1999, 121, 4926.
31 (a) G. Peng, F. M. F. de Groot, K. Hamalainen, J. A. Moore,X. Wang, M. M. Grush, J. B. Hastings, D. P. Siddons,W. H. Armstrong, O. C. Mullins and S. P. Cramer, J. Am. Chem.Soc., 1994, 116, 2914; (b) P. Glatzel, U. Bergmann, F. M. F. deGroot and S. P. Cramer, Phys. Rev. B: Condens. Matter Mater.Phys., 2001, 64, 045109.
32 K. Tsutsumi, H. Nakamori and K. Ichikawa, Phys. Rev. B: SolidState, 1976, 13, 929.
33 (a) S. D. Gamblin and D. S. Urch, J. Electron Spectrosc. Relat.Phenom., 2001, 113, 179; (b) H. Visser, E. Anxolabehere-Mallart,U. Bergmann, P. Glatzel, J. H. Robblee, S. P. Cramer, J. J. Girerd,
K. sauer, M. P. Klein and V. K. Yachandra, J. Am. Chem. Soc.,2001, 123, 7031; (c) S. A. Pizarro, P. Glatzel, H. Visser,J. H. Robblee, G. Christou, U. Bergmann and V. K. Yachandra,Phys. Chem. Chem. Phys., 2004, 6, 4864.
34 D. S. Urch, in Electron Spectroscopy: Theory, Techniques, andApplications, ed. C. R. Brundle and A. D. Baker, Academic Press,New York, 1979, vol. 3, pp. 1–39.
35 F. de Groot, Coord. Chem. Rev., 2005, 249, 31.36 J. C. Fuggle and J. E. Inglesfield, in Unoccupied Electronic States,
Springer-Verlag, Berlin, 1992.37 P. Glatzel, M. Sikora and M. Fernandez-Garcia, Eur. Phys. J.
Spec. Top., 2009, 169, 207.38 F. M. F. de Groot, M. H. Krisch and J. Vogel, Phys. Rev. B:
Condens. Matter Mater. Phys., 2002, 66, 195112.39 J. Yano, Y. Pushkar, P. Glatzel, A. Lewis, K. Sauer, J. Messinger,
U. Bergmann and V. Yachandra, J. Am. Chem. Soc., 2005, 127,14974.
40 C. Lamberti, A. Zecchina, E. Groppo and S. Bordiga, Chem. Soc.Rev., 2010, 39, DOI: 10.1039/c0cs00117a.
41 (a) A. L. Ankudinov, B. Ravel, J. J. Rehr and S. D. Conradson,Phys. Rev. B: Condens. Matter Mater. Phys., 1998, 58, 7565;(b) A. L. Ankudinov, C. Bouldin, J. J. Rehr, J. Sims andH. Hung, Phys. Rev. B: Condens. Matter Mater. Phys., 2002, 65,104107.
42 (a) R. Barth, R. Pitchai, R. L. Anderson and X. E. Verykios,J. Catal., 1989, 116, 61; (b) R. Barth and A. Ramachandran,J. Catal., 1990, 125, 467.
43 B. Hammer and J. K. Nørskov, Surf. Sci., 1995, 343, 211.44 J. Singh, E. M. Alayon, M. Tromp, O. V. Safonova, P. Glatzel,
M. Nachtegaal, R. Frahm and J. A. van Bokhoven, Angew. Chem.,Int. Ed., 2008, 47, 9260.
45 J. A. Anderson, J. Chem. Soc., Faraday Trans., 1992, 88(8),1197.
46 R. Burch and P. K. Loader, Appl. Catal., A, 1995, 122, 169.47 F. J. Gracia, L. Bollmann, E. E. Wolf, J. T. Miller and A. J. Kropf,
J. Catal., 2003, 220, 382.48 M. D. Ackermann, T. M. Pedersen, B. L. M. Hendriksen,
O. Robach, S. C. Bobaru, I. Popa, C. Quiros, H. Kim,B. Hammer, S. Ferrer and J. W. M. Frenken, Phys. Rev. Lett.,2005, 95, 255505.
49 R. Burch and P. K. Loader, Appl. Catal., B, 1994, 5, 149.50 S. Yang, A. M. Valiente, M. B. Gonzalez, I. R. Ramos and
A. G. Ruiz, Appl. Catal., B, 2000, 28, 223.51 (a) X. Su, P. S. Cremer, Y. R. Shen and G. A. Somorjai, J. Am.
Chem. Soc., 1997, 119, 3994; (b) F. J. Gracia, S. Guerrero,E. E. Wolf, J. T. Miller and A. J. Kropf, J. Catal., 2005, 233,372; (c) E. M. Alayon, J. Singh, M. Nachtegaal, M. Harfouche andJ. A. van Bokhoven, J. Catal., 2009, 263, 228.
52 T. H. Lindstrom and T. T. Tsotsis, Surf. Sci., 1985, 150, 487.53 J. Singh, M. Nachtegaal, E. M. C. Alayon, J. Stotzel and J. A. van
Bokoven, ChemCatChem, 2010, 2, 653.54 M. E. Grass, Y. Zhang, D. R. Butcher, J. Y. Park, Y. Li,
H. Bluhm, K. M. Bratlie, T. Zhang and G. A. Somorjai, Angew.Chem., Int. Ed., 2008, 47, 8893.
55 (a) W. M. Heijboer, P. Glatzel, K. R. Sawant, R. F. Lobo,U. Bergmann, R. A. Barrea, D. C. Koningsberger,B. M. Weckhuysen and F. M. F. de Groot, J. Phys. Chem. B,2004, 108, 10002; (b) A. Zecchina, M. Rivallan, G. Berlier,C. Lamberti and G. Ricchiardi, Phys. Chem. Chem. Phys., 2007,9, 3483.
56 (a) G. I. Panov, A. S. Kharitonov and V. I. Sobolev, Appl. Catal.,A, 1993, 98, 1; (b) G. I. Panov, G. A. Sheveleva, A. S. Kharitonov,V. N. Romannikov and L. A. Vostrikova, Appl. Catal., A, 1992,82, 31.
57 (a) P. Marturano, L. Drozdova, G. D. Pirngruber, A. Kogelbauerand R. Prins, Phys. Chem. Chem. Phys., 2001, 3, 5585;(b) A. A. Battiston, J. H. Bitter, F. M. F. de Groot,A. R. Overweg, O. Stephan, J. A. van Bokhoven,P. J. Kooyman, C. van Der Spek, G. Vanko andD. C. Koningsberger, J. Catal., 2003, 213, 251.
58 K. A. Dubkov, N. S. Ovanesyan, A. A. Shteinman, E. V. Starokonand G. I. Panov, J. Catal., 2002, 207, 341.
59 (a) G. Berlier, G. Spoto, S. Bordiga, G. Ricchiardi, P. Fisicaro,A. Zecchina, I. Rossetti, E. Selli, L. Forni, E. Giamello andC. Lamberti, J. Catal., 2002, 208, 64; (b) S. Bordiga, R. Buzzoni,
This journal is �c The Royal Society of Chemistry 2010 Chem. Soc. Rev., 2010, 39, 4754–4766 | 4765
Dow
nloa
ded
by U
nive
rsita
di T
orin
o on
17
Nov
embe
r 20
10Pu
blis
hed
on 1
6 N
ovem
ber
2010
on
http
://pu
bs.r
sc.o
rg |
doi:1
0.10
39/C
0CS0
0054
J
View Online

F. Geobaldo, C. Lamberti, E. Giamello, A. Zecchina, G. Leofanti,G. Petrini, G. Tozzola and G. Vlaic, J. Catal., 1996, 158, 486.
60 (a) A. M. Ferretti, C. Oliva, L. Forni, G. Berlier, A. Zecchina andC. Lamberti, J. Catal., 2002, 208, 83; (b) G. Berlier, G. Spoto,P. Fisicaro, S. Bordiga, A. Zecchina, E. Giamello and C. Lamberti,Microchem. J., 2002, 71, 101.
61 M. Wilke, F. Farges, P. E. Petit, G. E. Brown and F. Martin,Am. Mineral., 2001, 86, 714.
62 J. Perez-Ramırez, G. Mul, F. Kapteijn, J. A. Moulijn,A. R. Overweg, A. Domenech, A. Ribera and I. W. C. E. Arends,J. Catal., 2002, 207, 113.
63 D. P. Woodruff and T. A. Delchar, in Modern Techniques ofSurface Science, Cambridge University Press, New York, 1986.
64 (a) A. Nilsson, H. Tillborg and N. Martensson, Phys. Rev. Lett.,1991, 67, 1015; (b) A. Nilsson, M. Weinelt, T. Wiell, P. Bennich,O. Karis, N. Wassdahl, J. Stohr and M. Samant, Phys. Rev. Lett.,1997, 78, 2847.
65 A. Fohlisch, M. Nyberg, P. Bennich, L. Triguero, J. Hasselstrom,O. Karis, L. G. M. Pettersson and A. Nilsson, J. Chem. Phys.,2000, 112, 1946.
66 (a) M. Weinelt, N. Wassdahl, T. Wiell, O. Karis, J. Hasselstrom,P. Bennich, A. Nilsson, J. Stohr and M. Samant, Phys. Rev. B:Condens. Matter Mater. Phys., 1998, 58, 7351; (b) L. Triguero,A. Fohlisch, P. Vaterlein, J. Hasselstrom, M. Weinelt, L. G. M.Pettersson, Y. Luo, H. Agren and A. Nilsson, J. Am. Chem. Soc.,2000, 122, 12310.
67 (a) S. S. Sung and R. Hoffman, J. Am. Chem. Soc., 1985, 107, 578;(b) B. Hammer, Y. Morikawa and J. K. Norskov, Phys. Rev. Lett.,1996, 76, 2141; (c) F. Delbecq and P. Sautet, Phys. Rev. B:Condens. Matter Mater. Phys., 1999, 59, 5142.
68 (a) S. Andersson and J. B. Pendry, Phys. Rev. Lett., 1979, 43, 363;(b) J. Stohr and R. Jaeger, Phys. Rev. B: Condens. Matter, 1982, 26,4111.
69 P. Bennich, T. Wiell, O. Karis, M. Weinelt, N. Wassdahl,A. Nilsson, M. Nyberg, L. G. M. Pettersson, J. Stohr andM. Samant, Phys. Rev. B: Condens. Matter Mater. Phys., 1998,57, 9274.
70 (a) A. Nilsson, P. Bennich, T. Wiell, N. Wassdahl, N. Martensson,J. Nordgren, O. Bjorneholm and J. Stohr, Phys. Rev. B: Condens.
Matter, 1995, 51, 10244; (b) A. Fohlisch, J. Hasselstrom,P. Bennich, N. Wassdahl, O. Karis, A. Nilsson, L. Triguero,M. Nyberg and L. G. M. Pettersson, Phys. Rev. B: Condens.Matter Mater. Phys., 2000, 61, 16229.
71 (a) P. S. Bagus, K. Hermann and C. W. Bauschlicher, J. Chem.Phys., 1984, 81, 1966; (b) P. S. Bagus, K. Hermann andC. W. Bauschlicher, Phys. Rev. B: Condens. Matter, 1984, 80, 4378.
72 (a) H. Johann, Z. Phys., 1931, 69, 185; (b) V. Stojanoff,K. Hamalainen, D. Siddons, J. Hastings, L. Berman, S. Cramerand G. Smith, Rev. Sci. Instrum., 1992, 63, 1125; (c) U. Bergmannand S. P. Cramer, Proc. SPIE, 1998, 3448, 198; (d) K. Sakurai andH. Eba, Jpn. J. Appl. Phys., 1999, 1, 650; (e) E. Welter, P. Machek,G. Drager, U. Bruggmann and M. Froba, J. Synchrotron Radiat.,2005, 12, 448.
73 C. C. Kao, K. Hamalainen, M. Krisch, D. P. Siddons,T. Oversluizen and J. B. Hastings, Rev. Sci. Instrum., 1995, 66,1699.
74 (a) A. Mozzanica, A. Bergamaschi, R. Dinapoli, F. Gozzo,B. Henrich, P. Kraft, B. Patterson and B. Schmitt, Nucl. Instrum.Methods Phys. Res., Sect. A, 2009, 607, 250; (b) E. Kleimenov,A. Bergamaschi, J. A. Van Bokhoven, M. Janousch, B. Schmittand M. Nactegaal, J. Phys. Conf. Ser., 2009, 190, 012035.
75 (a) S. Hayakawa, S. Goto, T. Shoji, E. Yamada and Y. Gohshi,J. Synchrotron Radiat., 1998, 5, 1114; (b) B. Dickinson,G. T. Seidler, Z. W. Webb, J. A. Bradley, K. P. Nagle,S. M. Heald, R. A. Gordon and I. M. Chou, Rev. Sci. Instrum.,2008, 79, 123112.
76 (a) L. V. von Hamos, J. Sci. Instrum., 1938, 15, 87; (b) H. Hayashi,M. Kawata, R. Takeda, Y. Udagawa, Y. Watanabe, T. Takano,S. Nanao and N. Kawamura, J. Electron Spectrosc. Relat. Phenom.,2004, 136, 191.
77 S. Huotari, G. Vanko, F. Albergamo, C. Ponchut, H. Graafsma,C. Henriquet, R. Verbeni and G. Monaco, J. Synchrotron Radiat.,2005, 12, 467.
78 A. C. Thompson, D. T. Attwood, E. M. Gullikson, M. R. Howells,J. F. Kortright, A. L. Robinson, J. H. Underwood, K.-Je Kim,J. Kirz, I. Lindau, P. Pianetta, H. Winick, G. P. Williams andJ. H. Scofield, in X-ray Data Booklet, ed. A. C. Thompson andD. Vaughan, 2001.
4766 | Chem. Soc. Rev., 2010, 39, 4754–4766 This journal is �c The Royal Society of Chemistry 2010
Dow
nloa
ded
by U
nive
rsita
di T
orin
o on
17
Nov
embe
r 20
10Pu
blis
hed
on 1
6 N
ovem
ber
2010
on
http
://pu
bs.r
sc.o
rg |
doi:1
0.10
39/C
0CS0
0054
J
View Online