Zero Emission Area Handbook - McKinsey
68
May 2021 Global New Mobility Coalition Zero Emission Area Handbook with knowledge support from McKinsey & Company and in collaboration with the World Economic Forum
-
Upload
khangminh22 -
Category
Documents
-
view
2 -
download
0
Transcript of Zero Emission Area Handbook - McKinsey
May 2021
Global New Mobility Coalition
Zero Emission Area Handbook
with knowledge support from McKinsey & Company and in collaboration with the World Economic Forum

Global New Mobility Coalition 2Global New Mobility Coalition
About us – Introducing the Global New Mobility Coalition
2Global New Mobility Coalition
3Global New Mobility Coalition
Read more on GNMC
3
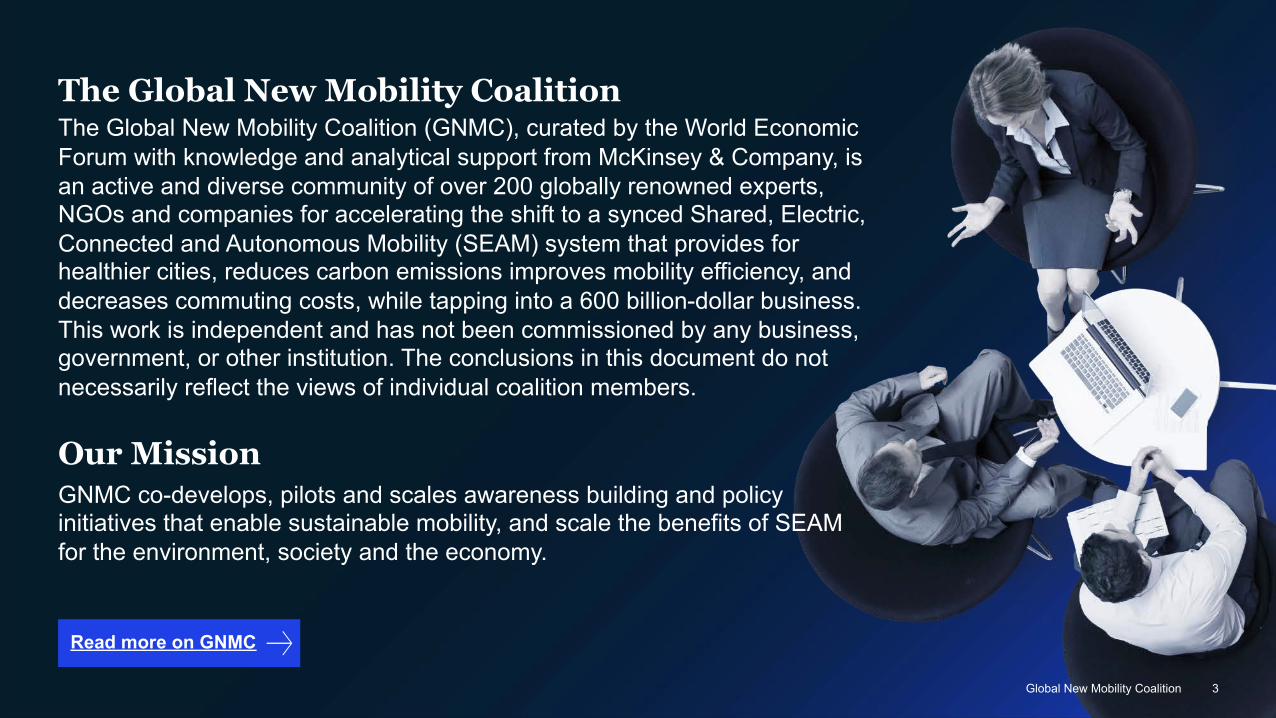
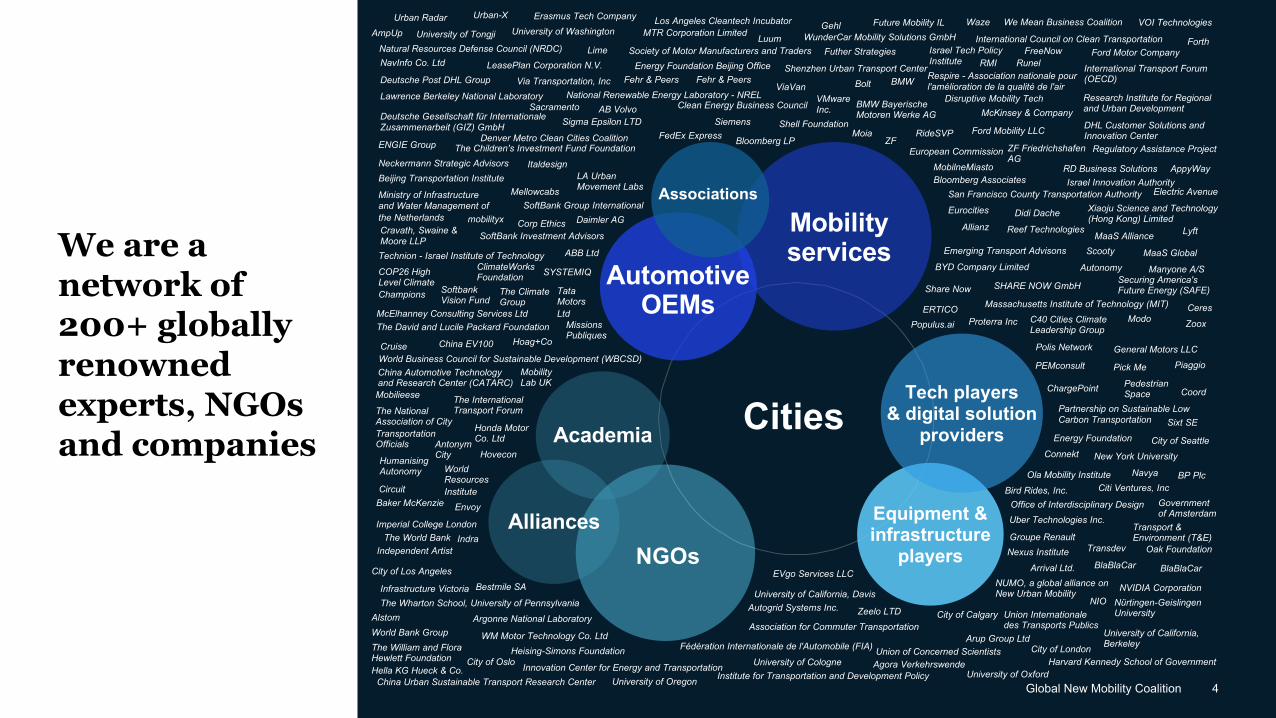
The Global New Mobility CoalitionThe Global New Mobility Coalition (GNMC), curated by the World Economic Forum with knowledge and analytical support from McKinsey & Company, is an active and diverse community of over 200 globally renowned experts, NGOs and companies for accelerating the shift to a synced Shared, Electric, Connected and Autonomous Mobility (SEAM) system that provides for healthier cities, reduces carbon emissions improves mobility efficiency, and decreases commuting costs, while tapping into a 600 billion-dollar business. This work is independent and has not been commissioned by any business, government, or other institution. The conclusions in this document do not necessarily reflect the views of individual coalition members.
Our MissionGNMC co-develops, pilots and scales awareness building and policy initiatives that enable sustainable mobility, and scale the benefits of SEAM for the environment, society and the economy.
Global New Mobility Coalition
4Global New Mobility Coalition
We are a network of 200+ globally renowned experts, NGOs and companies
Argonne National Laboratory
Denver Metro Clean Cities Coalition
Energy Foundation Beijing Office
COP26 High Level Climate Champions
Cravath, Swaine & Moore LLP
China EV100
Beijing Transportation Institute
Corp Ethics
Baker McKenzie
China Automotive Technology and Research Center (CATARC)
ENGIE Group
Circuit
Alstom
Independent Artist
Deutsche Post DHL Group BMW
Heising-Simons Foundation
Disruptive Mobility Tech
Bloomberg LP
AppyWay
DHL Customer Solutions and Innovation Center
Bloomberg Associates
Didi Dache
BYD Company Limited
ChargePoint
Autonomy
C40 Cities Climate Leadership Group
Connekt
BMW Bayerische Motoren Werke AG
Coord
Bird Rides, Inc. Citi Ventures, Inc
Arrival Ltd.
Association for Commuter Transportation
City of LondonAgora Verkehrswende
NGOs
Cities
Equipment & infrastructure
players
Mobility services
Automotive OEMs
Tech players & digital solution
providersAcademia
Associations
Alliances
Allianz
Bolt
Forth
Bestmile SA
Autogrid Systems Inc.
Ford Motor Company
ABB Ltd
Antonym City
Erasmus Tech Company
Fehr & Peers
AB Volvo
Ford Mobility LLC
AmpUp
BlaBlaCar
City of Seattle
Arup Group Ltd
Ceres
China Urban Sustainable Transport Research Center
City of Calgary
City of Los Angeles
City of Oslo
ClimateWorks Foundation
Clean Energy Business Council
Cruise
Daimler AG
Deutsche Gesellschaft für Internationale Zusammenarbeit (GIZ) GmbH
Electric Avenue
Emerging Transport Advisons
Energy Foundation
Envoy
ERTICO
Eurocities
European Commission
EVgo Services LLC
Fédération Internationale de l'Automobile (FIA)
FedEx Express
Harvard Kennedy School of Government
FreeNowFuther Strategies
Future Mobility ILGehl
General Motors LLC
Government of Amsterdam
Groupe Renault
Nürtingen-Geislingen University
Hella KG Hueck & Co.
Hoag+Co
Honda Motor Co. Ltd
HoveconHumanising Autonomy
Imperial College LondonIndra
Infrastructure Victoria
Innovation Center for Energy and TransportationInstitute for Transportation and Development Policy
International Council on Clean Transportation
International Transport Forum (OECD)
Israel Innovation Authority
Israel Tech Policy Institute
ItaldesignLA Urban Movement Labs
Lawrence Berkeley National Laboratory
LeasePlan Corporation N.V.Lime
Los Angeles Cleantech Incubator
Luum
LyftMaaS Alliance
MaaS Global
Massachusetts Institute of Technology (MIT)
Manyone A/S
McElhanney Consulting Services Ltd
McKinsey & Company
MellowcabsMinistry of Infrastructure and Water Management of the Netherlands
Missions Publiques
Mobilieese
Mobility Lab UK
mobilityx
MobilneMiasto
Modo
Moia
MTR Corporation Limited
National Renewable Energy Laboratory - NREL
Natural Resources Defense Council (NRDC)NavInfo Co. Ltd
Navya
Neckermann Strategic Advisors
New York University
Nexus Institute
NIO
NUMO, a global alliance on New Urban Mobility NVIDIA Corporation
Oak Foundation
BlaBlaCar
Office of Interdisciplinary Design
Ola Mobility Institute
Partnership on Sustainable Low Carbon Transportation
Pedestrian Space
PEMconsult PiaggioPick Me
Polis Network
Populus.ai Proterra Inc
RD Business Solutions
Reef Technologies
Regulatory Assistance Project
Research Institute for Regional and Urban Development
Respire - Association nationale pour l'amélioration de la qualité de l'air
RideSVP
RMI Runel
San Francisco County Transportation Authority
Scooty
Securing America's Future Energy (SAFE)Share Now SHARE NOW GmbH
Shell Foundation
Shenzhen Urban Transport Center
SiemensSigma Epsilon LTD
Sixt SE
Society of Motor Manufacturers and Traders
SoftBank Group International
SoftBank Investment Advisors
Softbank Vision Fund
SYSTEMIQ
Tata Motors Ltd
Technion - Israel Institute of Technology
The Children's Investment Fund Foundation
The Climate Group
The David and Lucile Packard Foundation
The International Transport ForumThe National
Association of City Transportation Officials
The Wharton School, University of Pennsylvania
The World Bank
The William and Flora Hewlett Foundation
Transdev
Transport & Environment (T&E)
Uber Technologies Inc.
Union Internationale des Transports Publics
Union of Concerned Scientists
University of California, Berkeley
University of California, Davis
University of Cologne
University of OregonUniversity of Oxford
University of Tongji University of WashingtonUrban Radar Urban-X
Via Transportation, Inc Fehr & PeersViaVan
VMware Inc.
VOI TechnologiesWaze We Mean Business Coalition
WM Motor Technology Co. LtdWorld Bank Group
World Business Council for Sustainable Development (WBCSD)
World Resources Institute
WunderCar Mobility Solutions GmbH
Xiaoju Science and Technology (Hong Kong) Limited
Zeelo LTD
ZFZF Friedrichshafen AG
Zoox
BP Plc
Sacramento
5Global New Mobility Coalition
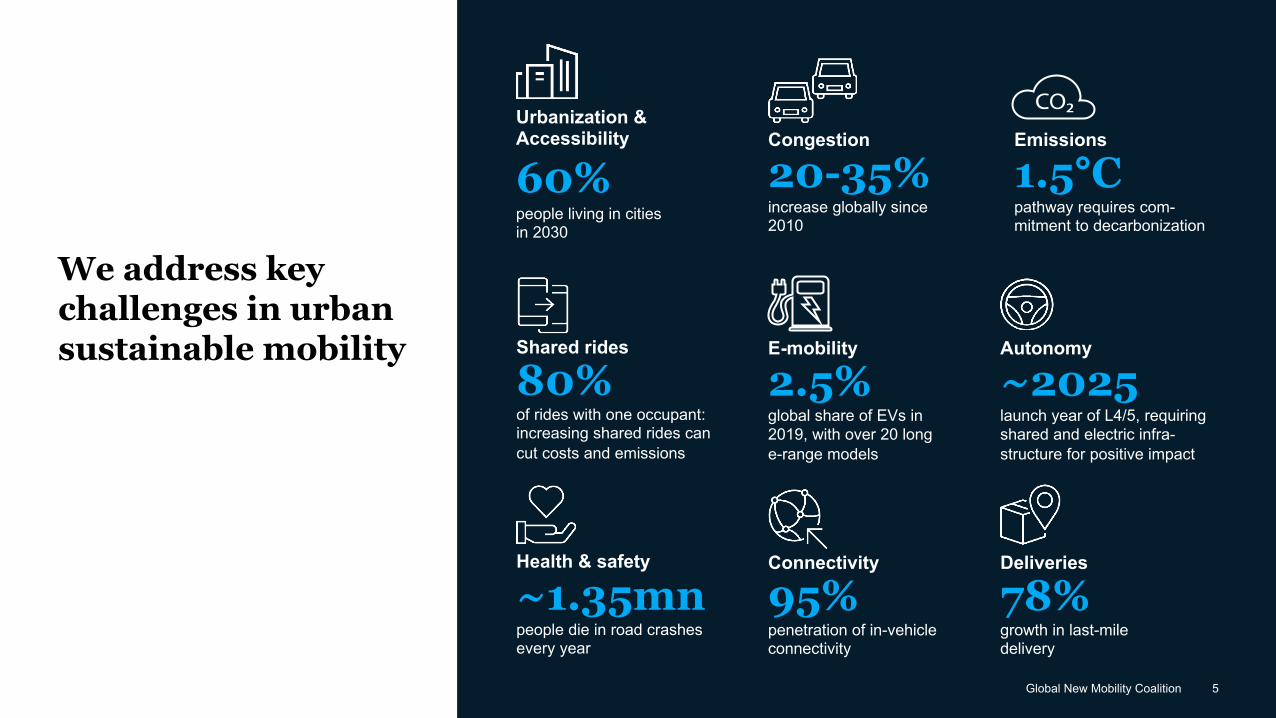
We address key challenges in urban sustainable mobility
Urbanization & Accessibility
60%people living in cities in 2030
Emissions
1.5°C pathway requires com-mitment to decarbonization
Congestion
20-35%increase globally since 2010
E-mobility
2.5%global share of EVs in 2019, with over 20 long e-range models
Autonomy
~2025launch year of L4/5, requiring shared and electric infra-structure for positive impact
Shared rides
80%of rides with one occupant: increasing shared rides can cut costs and emissions
Connectivity
95%penetration of in-vehicle connectivity
Deliveries
78%growth in last-mile delivery
Health & safety
~1.35mnpeople die in road crashes every year
Global New Mobility Coalition 6
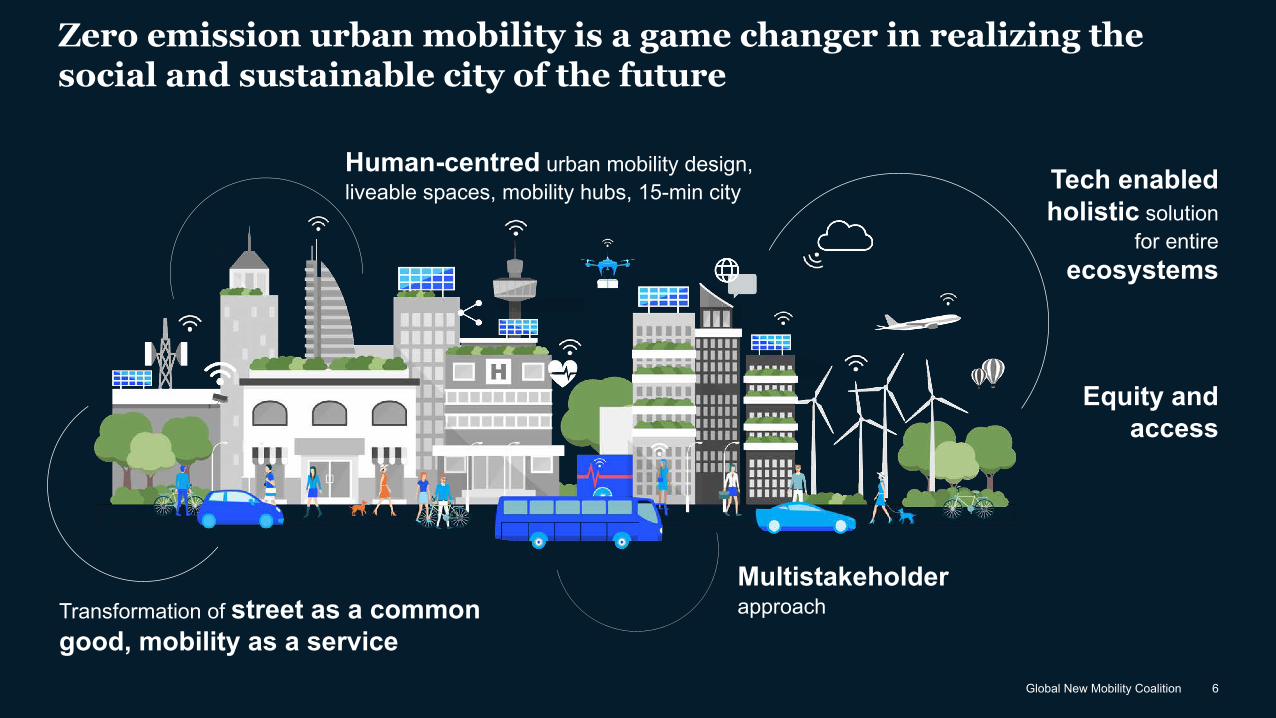
Zero emission urban mobility is a game changer in realizing the social and sustainable city of the future
Transformation of street as a common good, mobility as a service
Tech enabled holistic solution
for entire ecosystems
Multistakeholderapproach
Human-centred urban mobility design, liveable spaces, mobility hubs, 15-min city
Equity and access
7Global New Mobility Coalition
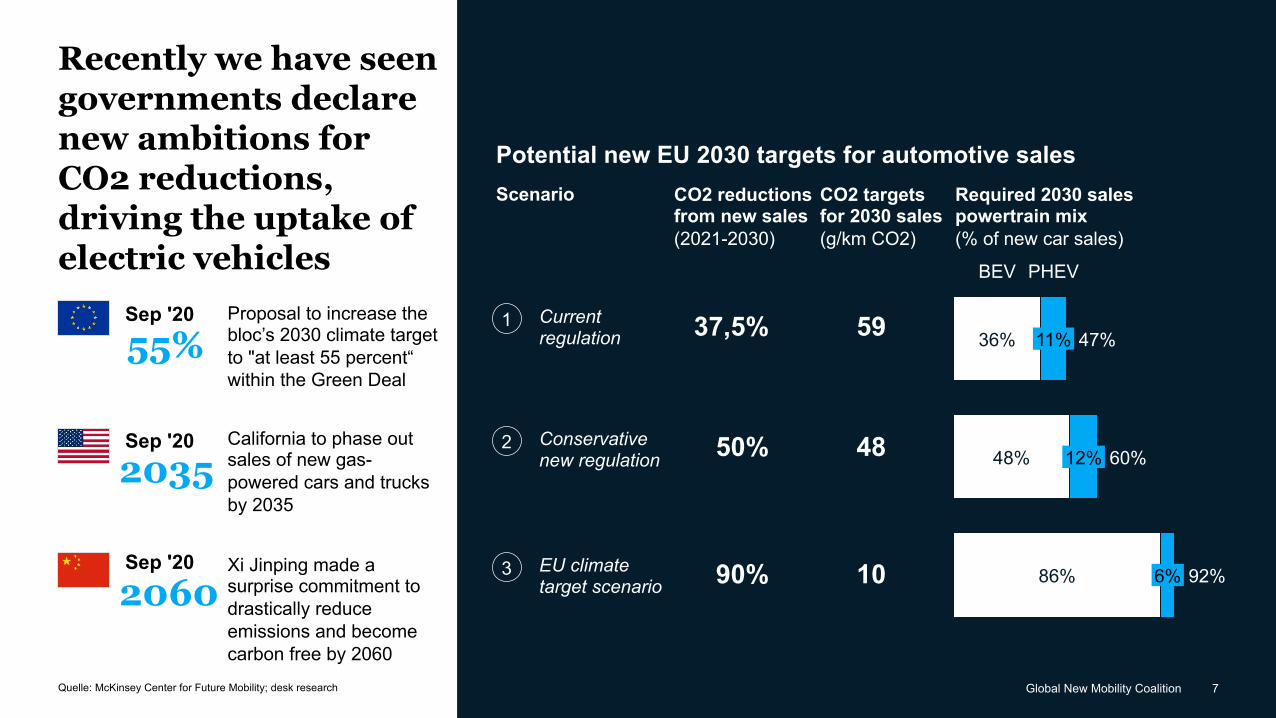
Recently we have seen governments declare new ambitions for CO2 reductions, driving the uptake of electric vehicles
Sep '20
55%Proposal to increase the bloc’s 2030 climate target to "at least 55 percent“ within the Green Deal
Sep '202035
California to phase out sales of new gas-powered cars and trucks by 2035
2060Sep '20 Xi Jinping made a
surprise commitment to drastically reduce emissions and become carbon free by 2060
Quelle: McKinsey Center for Future Mobility; desk research
Potential new EU 2030 targets for automotive salesCO2 reductions from new sales (2021-2030)
CO2 targets for 2030 sales(g/km CO2)
PHEV
48%
BEV
11% 47%36%
86%
12%
6%
60%
92%
Scenario
37,5% 59Current regulation
1
50% 48Conservativenew regulation
2
90% 10EU climate target scenario
3
Required 2030 sales powertrain mix (% of new car sales)
8Global New Mobility Coalition
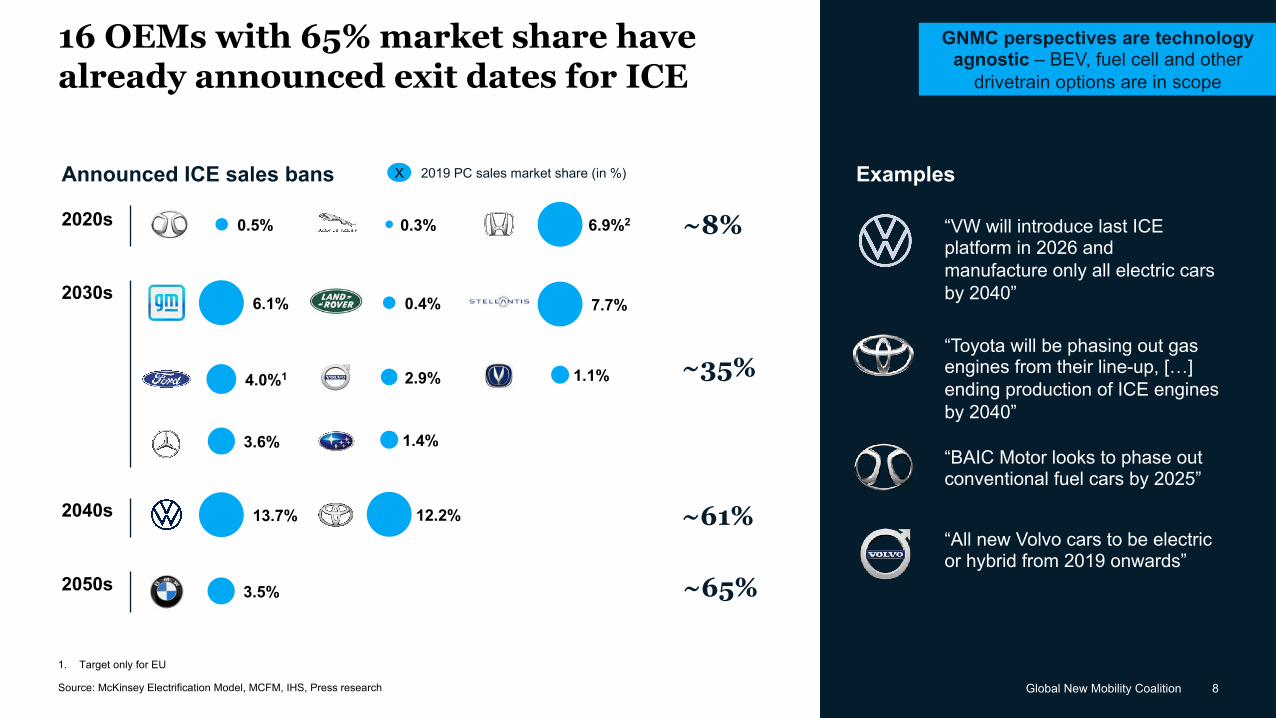
16 OEMs with 65% market share have already announced exit dates for ICE
Source: McKinsey Electrification Model, MCFM, IHS, Press research
Examples
“Toyota will be phasing out gas engines from their line-up, […] ending production of ICE engines by 2040”
“VW will introduce last ICE platform in 2026 and manufacture only all electric cars by 2040”
“BAIC Motor looks to phase out conventional fuel cars by 2025”
X 2019 PC sales market share (in %)
“All new Volvo cars to be electric or hybrid from 2019 onwards”
1. Target only for EU
0.4%6.1% 7.7%
1.4%3.6%
Announced ICE sales bans
2030s
4.0%1 2.9% 1.1% ~35%
2020s 0.5% 0.3% 6.9%2 ~8%
12.2%13.7%2040s ~61%
3.5%2050s ~65%
GNMC perspectives are technology agnostic – BEV, fuel cell and other
drivetrain options are in scope
Global New Mobility Coalition 9
BarcelonaMadrid
Lisbon
Paris
RomeVeniceMilan
HeidelbergBerlinLondon
RotterdamAmsterdam
OsloStockholm
CopenhagenMoscow
Warsaw
DakarAbidjan
AccraLagos
Cape TownDurban (eThekwini)
Ekurhuleni
Dar es SalaamNairobi
Addis Ababa
Tel Aviv- Yafo
Karachi Jaipur
Mumbai
Kolkata
Bengaluru Chennai
Kuala LumpurSingapore
Jakarta
Ho Chi Minh City
Quezon CityBangkokHanoi Hong Kong
FuzhouHangzhouNanjingShanghai
QingdaoSeoul
Yokohama
DalianWuhan
Sydney
MelbourneAuckland
Santiago
Lima
Quito
MedellínBogota
El Salvador
Rio de JaneiroSao Paulo
CuritibaBuenos Aires
BostonNew York
PhiladelphiaWashington
MontrealToronto
Chicago
MiamiNew Orleans
Houston
Austin
VancouverSeattlePortland
San FranciscoPhoenix
Guadalajara
Mexico City
Delhi NCT
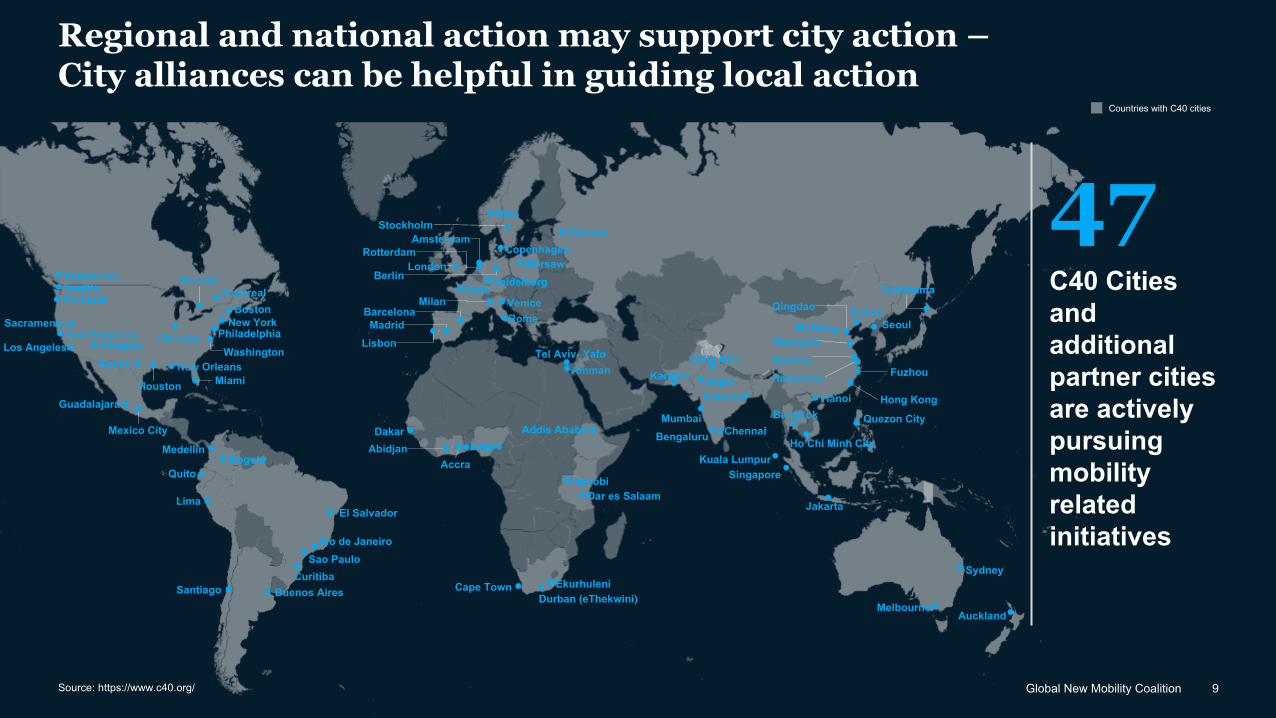
Regional and national action may support city action –City alliances can be helpful in guiding local action
C40 Cities and additional partner cities are actively pursuingmobility relatedinitiatives
47Amman
Countries with C40 cities
Source: https://www.c40.org/
Sacramento
Los Angeles
10Global New Mobility Coalition
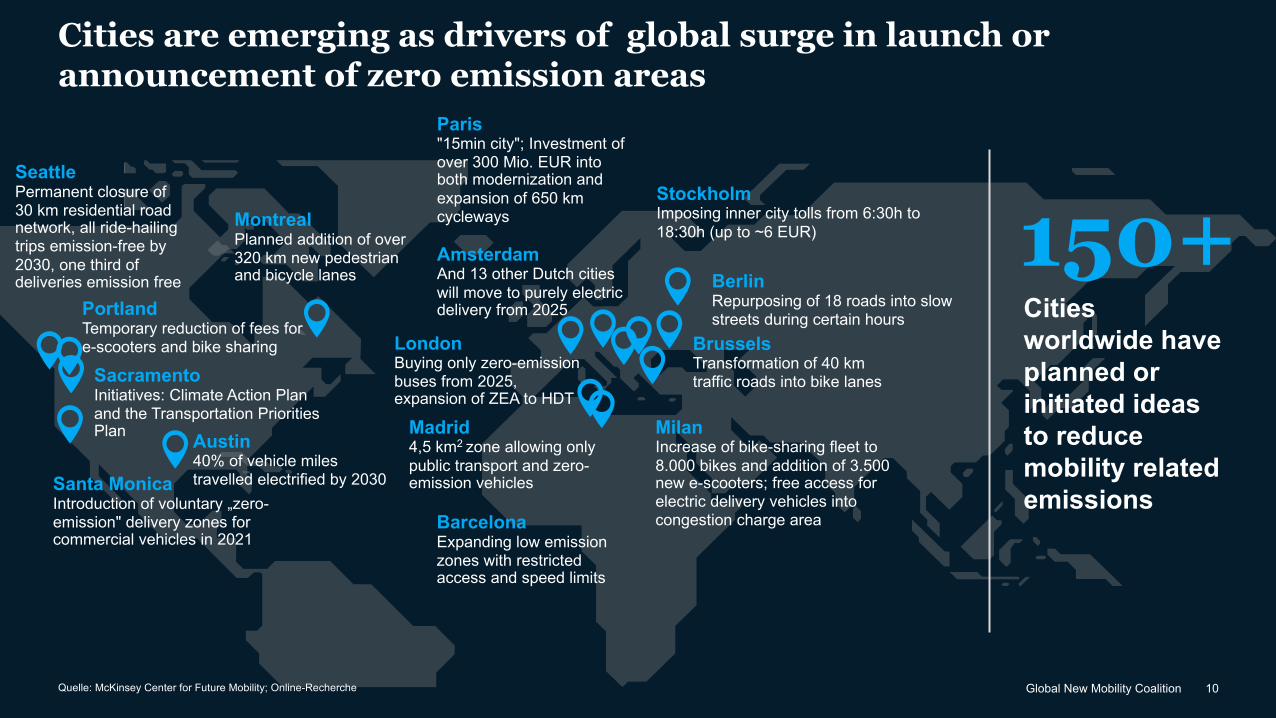
SeattlePermanent closure of 30 km residential road network, all ride-hailing trips emission-free by 2030, one third of deliveries emission free
PortlandTemporary reduction of fees for e-scooters and bike sharing
MontrealPlanned addition of over 320 km new pedestrian and bicycle lanes
Paris"15min city"; Investment of over 300 Mio. EUR into both modernization and expansion of 650 km cycleways
AmsterdamAnd 13 other Dutch cities will move to purely electric delivery from 2025
BrusselsTransformation of 40 km traffic roads into bike lanes
BerlinRepurposing of 18 roads into slow streets during certain hours
MilanIncrease of bike-sharing fleet to 8.000 bikes and addition of 3.500 new e-scooters; free access for electric delivery vehicles into congestion charge area
Santa MonicaIntroduction of voluntary „zero-emission" delivery zones for commercial vehicles in 2021
StockholmImposing inner city tolls from 6:30h to 18:30h (up to ~6 EUR)
Quelle: McKinsey Center for Future Mobility; Online-Recherche
Cities worldwide have planned or initiated ideas to reduce mobility related emissions
150+
Cities are emerging as drivers of global surge in launch or announcement of zero emission areas
Madrid4,5 km2 zone allowing only public transport and zero-emission vehicles
BarcelonaExpanding low emission zones with restricted access and speed limits
LondonBuying only zero-emission buses from 2025, expansion of ZEA to HDT
Austin40% of vehicle miles travelled electrified by 2030
SacramentoInitiatives: Climate Action Plan and the Transportation Priorities Plan
11Global New Mobility Coalition
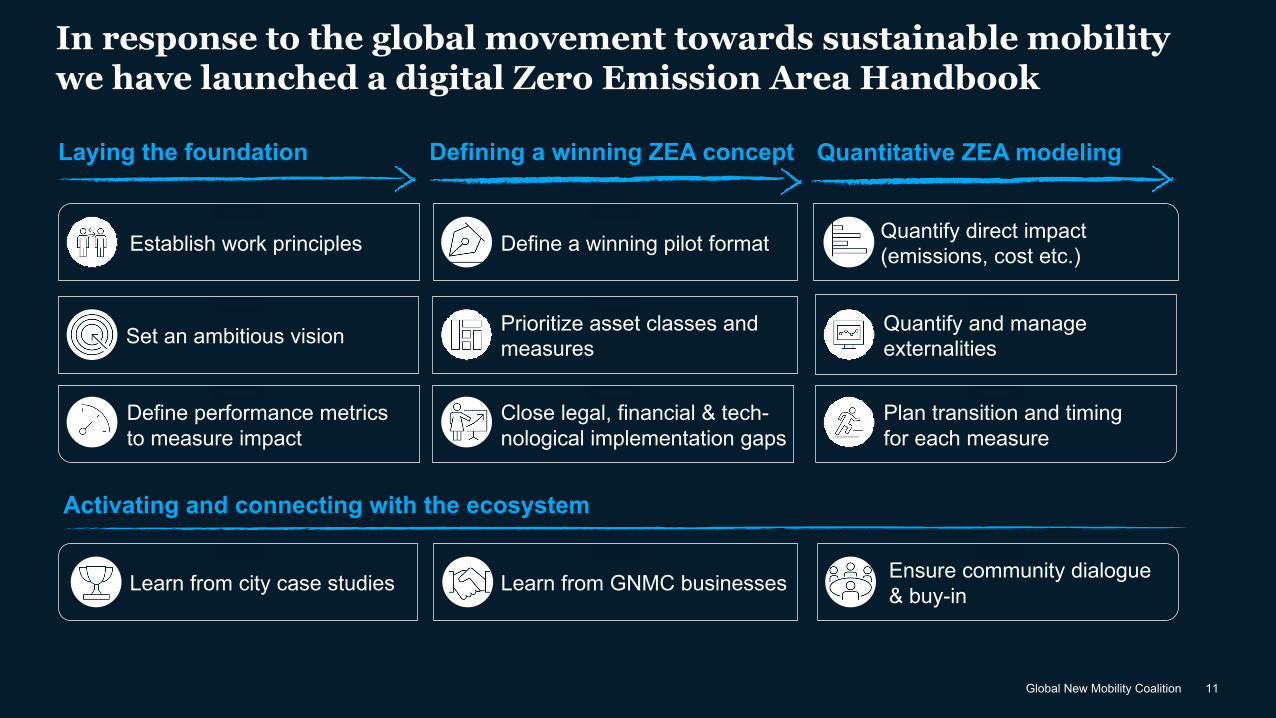
In response to the global movement towards sustainable mobility we have launched a digital Zero Emission Area Handbook
Laying the foundation Defining a winning ZEA concept
Ensure community dialogue & buy-inLearn from city case studies
Activating and connecting with the ecosystem
Learn from GNMC businesses
Quantitative ZEA modeling
Close legal, financial & tech-nological implementation gaps
Establish work principles
Define performance metrics to measure impact
Quantify direct impact (emissions, cost etc.)Define a winning pilot format
Plan transition and timing for each measure
Set an ambitious vision Quantify and manage externalities
Prioritize asset classes and measures

Global New Mobility Coalition 12Global New Mobility Coalition
#1Establish work principles
12
13Global New Mobility Coalition
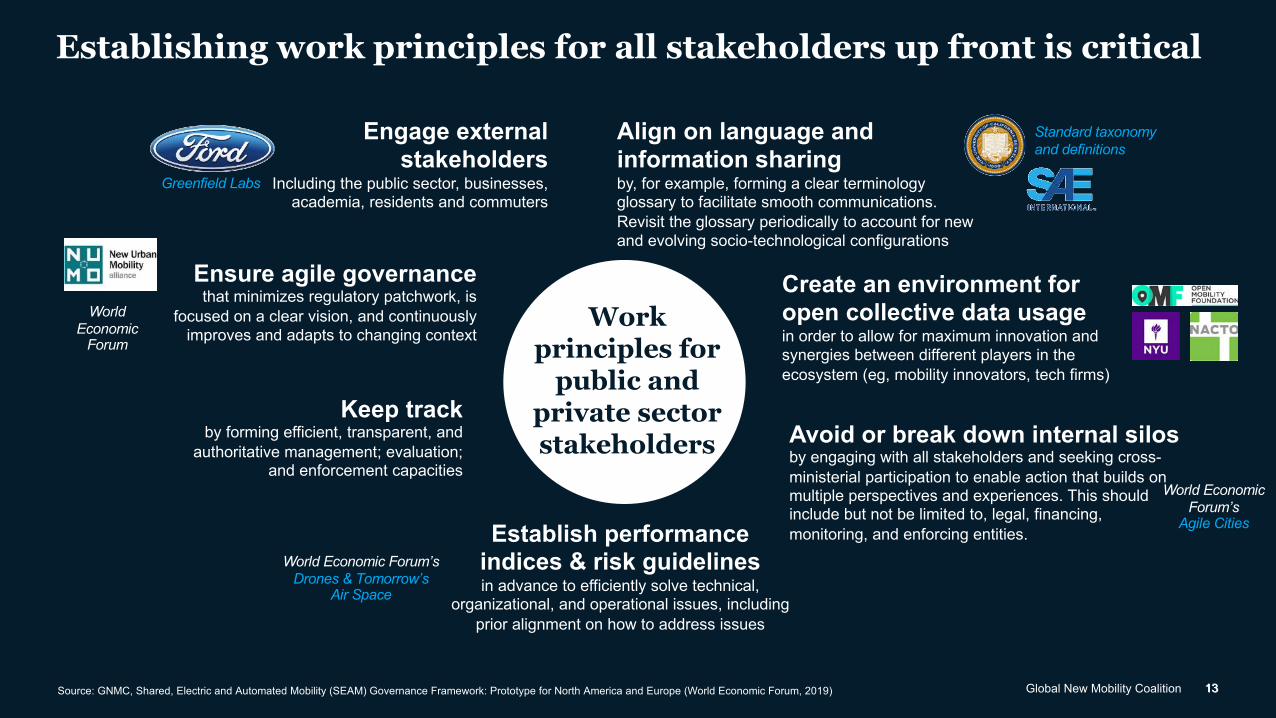
Establishing work principles for all stakeholders up front is critical
13
Avoid or break down internal silosby engaging with all stakeholders and seeking cross-ministerial participation to enable action that builds on multiple perspectives and experiences. This should include but not be limited to, legal, financing, monitoring, and enforcing entities.
Engage external stakeholders
Including the public sector, businesses, academia, residents and commuters
Establish performance indices & risk guidelines in advance to efficiently solve technical,
organizational, and operational issues, including prior alignment on how to address issues
Create an environment for open collective data usagein order to allow for maximum innovation and synergies between different players in the ecosystem (eg, mobility innovators, tech firms)
Ensure agile governancethat minimizes regulatory patchwork, is
focused on a clear vision, and continuously improves and adapts to changing context
Keep trackby forming efficient, transparent, and
authoritative management; evaluation; and enforcement capacities
Work principles for
public and private sector stakeholders
Greenfield Labs
World Economic Forum’s
Agile Cities
World Economic Forum’s Drones & Tomorrow’s
Air Space
Align on language and information sharingby, for example, forming a clear terminology glossary to facilitate smooth communications. Revisit the glossary periodically to account for new and evolving socio-technological configurations
Standard taxonomy and definitions
Source: GNMC, Shared, Electric and Automated Mobility (SEAM) Governance Framework: Prototype for North America and Europe (World Economic Forum, 2019)
World Economic
Forum

Global New Mobility Coalition 14Global New Mobility Coalition
#2Set an ambitious vision
14
15Global New Mobility Coalition
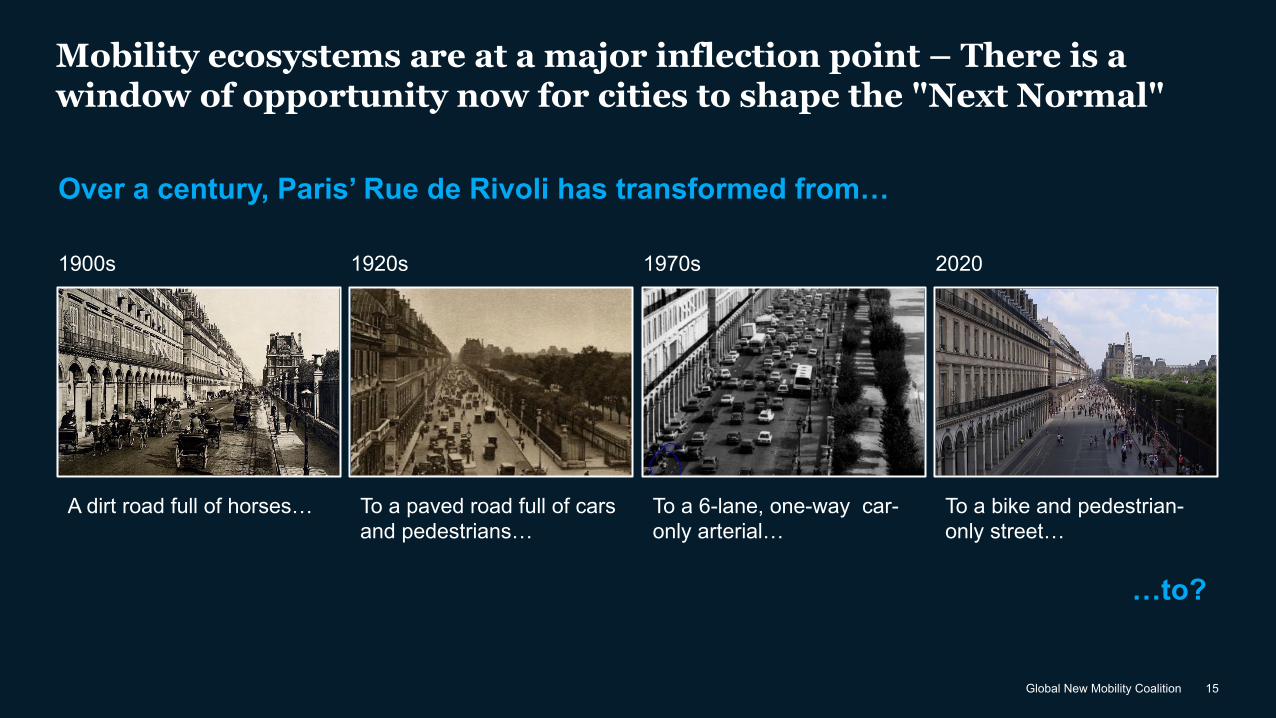
Mobility ecosystems are at a major inflection point – There is a window of opportunity now for cities to shape the "Next Normal"
Over a century, Paris’ Rue de Rivoli has transformed from…
…to?
1900s
A dirt road full of horses…
1920s
To a paved road full of cars and pedestrians…
1970s
To a 6-lane, one-way car-only arterial…
2020
To a bike and pedestrian-only street…
16Global New Mobility Coalition
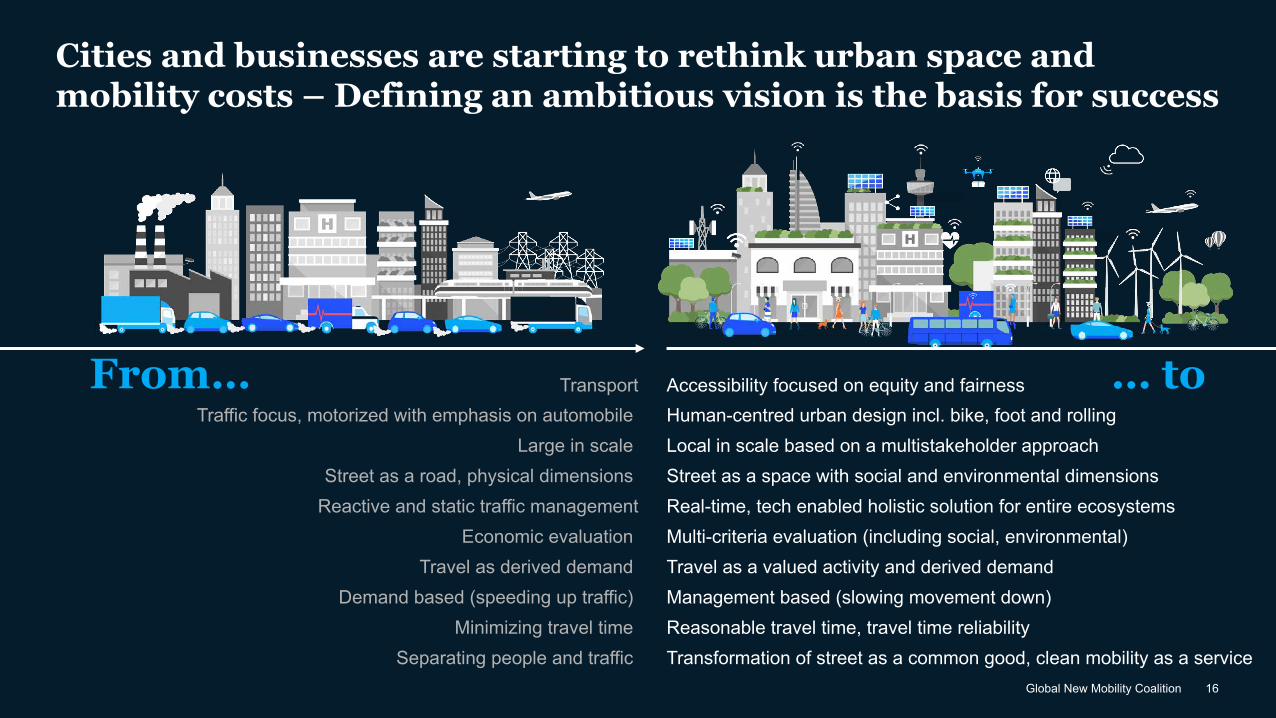
Cities and businesses are starting to rethink urban space and mobility costs – Defining an ambitious vision is the basis for success
TransportTraffic focus, motorized with emphasis on automobile
Large in scale Street as a road, physical dimensions
Reactive and static traffic managementEconomic evaluation
Travel as derived demand Demand based (speeding up traffic)
Minimizing travel time
Accessibility focused on equity and fairness Human-centred urban design incl. bike, foot and rolling Local in scale based on a multistakeholder approach Street as a space with social and environmental dimensions Real-time, tech enabled holistic solution for entire ecosystemsMulti-criteria evaluation (including social, environmental) Travel as a valued activity and derived demand Management based (slowing movement down) Reasonable travel time, travel time reliability Transformation of street as a common good, clean mobility as a service Separating people and traffic
From… … to
17Global New Mobility Coalition
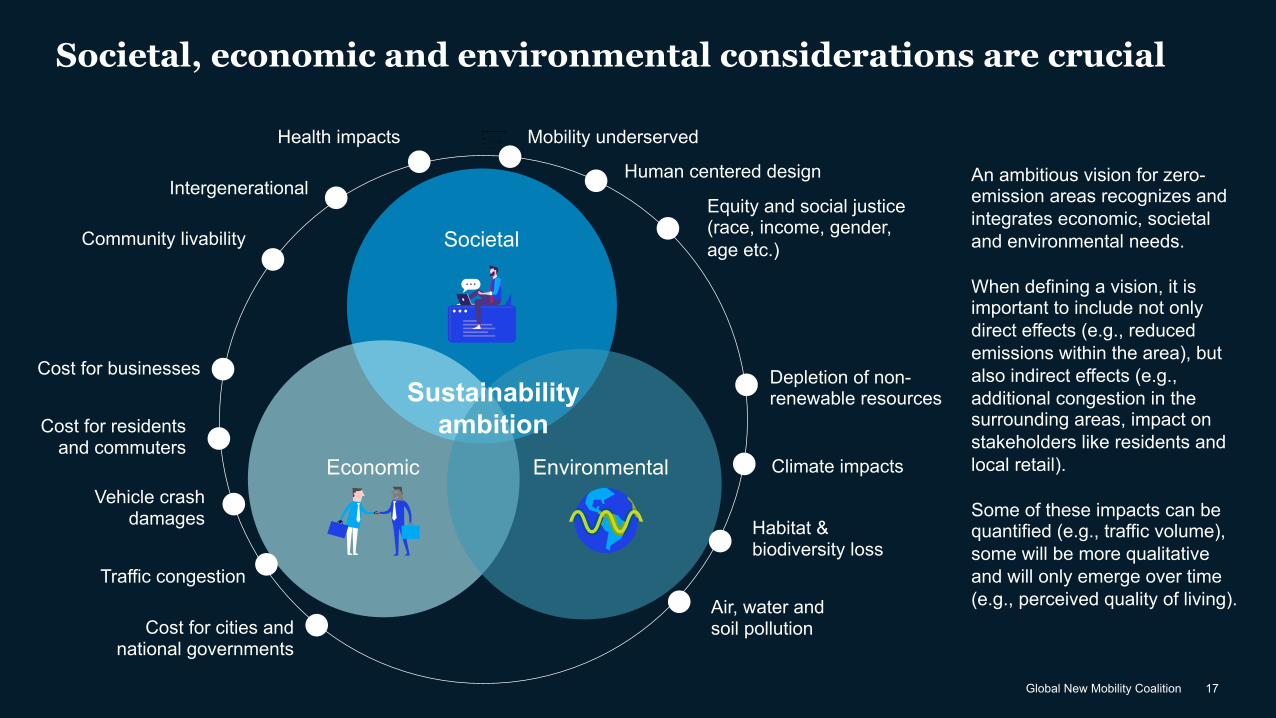
Societal, economic and environmental considerations are crucial
Sustainability ambition
Health impacts
Intergenerational
Mobility underserved
Equity and social justice (race, income, gender, age etc.)Community livability
Air, water and soil pollution
Habitat & biodiversity loss
Climate impacts
Depletion of non-renewable resources
Vehicle crash damages
Cost for businesses
An ambitious vision for zero-emission areas recognizes and integrates economic, societal and environmental needs.
When defining a vision, it is important to include not only direct effects (e.g., reduced emissions within the area), but also indirect effects (e.g., additional congestion in the surrounding areas, impact on stakeholders like residents and local retail).
Some of these impacts can be quantified (e.g., traffic volume), some will be more qualitative and will only emerge over time (e.g., perceived quality of living).
Traffic congestion
Cost for residents and commuters
Cost for cities and national governments
Societal
Economic Environmental
Human centered design
18Global New Mobility Coalition
#3Define performance metrics to measure impact
18Global New Mobility Coalition
19Global New Mobility Coalition
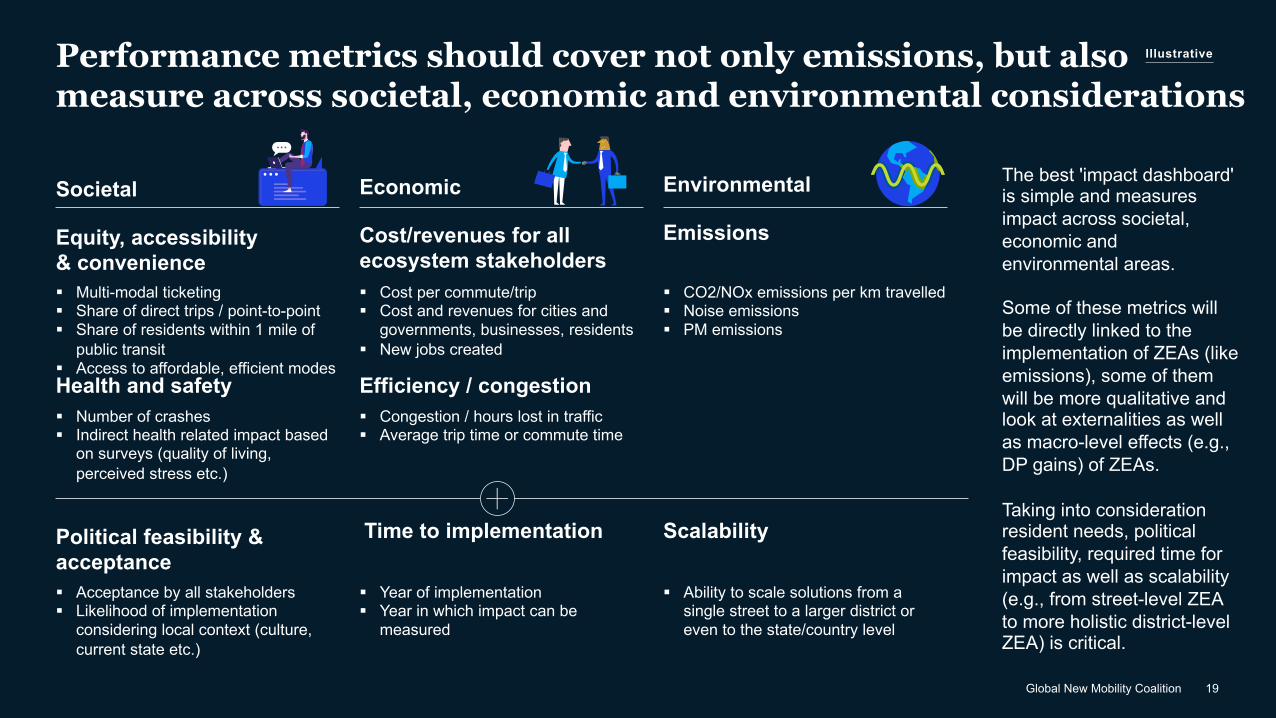
Performance metrics should cover not only emissions, but also measure across societal, economic and environmental considerations
EmissionsEquity, accessibility & convenience
Cost/revenues for all ecosystem stakeholders
Time to implementationPolitical feasibility & acceptance
Efficiency / congestionHealth and safety
Scalability
Societal Economic Environmental The best 'impact dashboard' is simple and measures impact across societal, economic and environmental areas.
Some of these metrics will be directly linked to the implementation of ZEAs (like emissions), some of them will be more qualitative and look at externalities as well as macro-level effects (e.g., DP gains) of ZEAs.
Taking into consideration resident needs, political feasibility, required time for impact as well as scalability (e.g., from street-level ZEA to more holistic district-level ZEA) is critical.
§ Multi-modal ticketing§ Share of direct trips / point-to-point§ Share of residents within 1 mile of
public transit§ Access to affordable, efficient modes
§ Cost per commute/trip§ Cost and revenues for cities and
governments, businesses, residents§ New jobs created
§ CO2/NOx emissions per km travelled§ Noise emissions§ PM emissions
§ Number of crashes§ Indirect health related impact based
on surveys (quality of living, perceived stress etc.)
§ Congestion / hours lost in traffic§ Average trip time or commute time
§ Acceptance by all stakeholders § Likelihood of implementation
considering local context (culture, current state etc.)
§ Year of implementation§ Year in which impact can be
measured
§ Ability to scale solutions from a single street to a larger district or even to the state/country level
Illustrative

20Global New Mobility Coalition
#4Define a winning pilot format
20Global New Mobility Coalition

21Global New Mobility Coalition
A wide variety of stakeholders has to be taken into consider-ation in the design of a ZEA
ResidentsUnderserved
neighborhoods
Private car reliantresidents Commuters1
Private car users
Ride-sharing users
RegulatorCity
regulatorsLocal/national governments
Public transit1
Bus Taxi Train
Tech players MaaS
Commercial traffic
Local businesses
Restaurants
Local retailers
Public and not-for-profit institutions
Public Sector
Private Sector
Private Households
Special purpose trafficPolice
Firefighting
Plumbing
Ambulance
Zero Emission Area
NGOs
Associations Academia
InvestorsPrivate investors
Funds
Automotive OEMs and shared/
micromobility playersAutomotive
OEMs
Parcel Logistics Groceries
Subway
Not comprehensive
Interest groups
Different generations
Logistics players
Shared/ micromobility
players
Infrastructure players
Mobility platforms
Service and crafts
BaaS
MicrotransitRickshaws Motorcycle taxi
1. Including informal mobility networks
Active mobility users
Transit users
SaaS
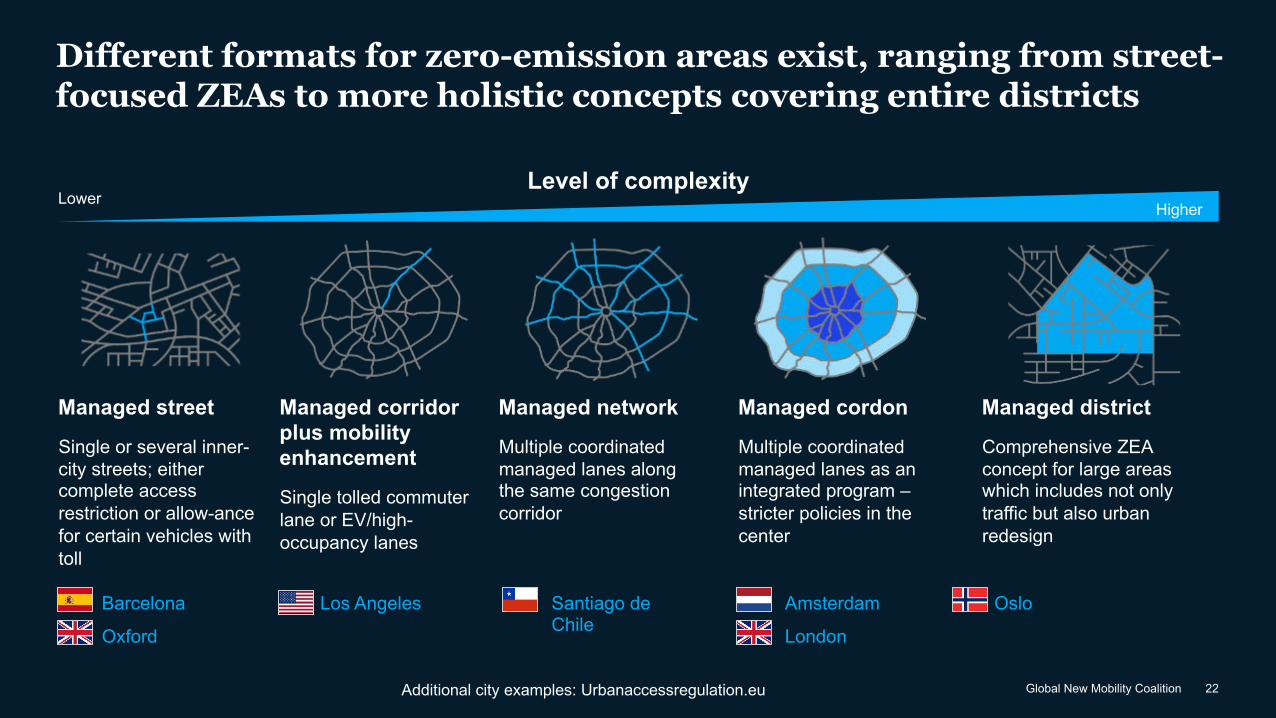
22Global New Mobility CoalitionAdditional city examples: Urbanaccessregulation.eu
Different formats for zero-emission areas exist, ranging from street-focused ZEAs to more holistic concepts covering entire districts
LowerHigher
Level of complexity
Managed street
Single or several inner-city streets; either complete access restriction or allow-ancefor certain vehicles with toll
Managed corridor plus mobility enhancement
Single tolled commuter lane or EV/high-occupancy lanes
Managed network
Multiple coordinated managed lanes along the same congestion corridor
Managed cordon
Multiple coordinated managed lanes as an integrated program –stricter policies in the center
Managed district
Comprehensive ZEA concept for large areas which includes not only traffic but also urban redesign
Barcelona
Oxford
Amsterdam
London
OsloSantiago de Chile
Los Angeles

23Global New Mobility Coalition
#5Prioritize asset classes and measures
23Global New Mobility Coalition
Global New Mobility Coalition 24
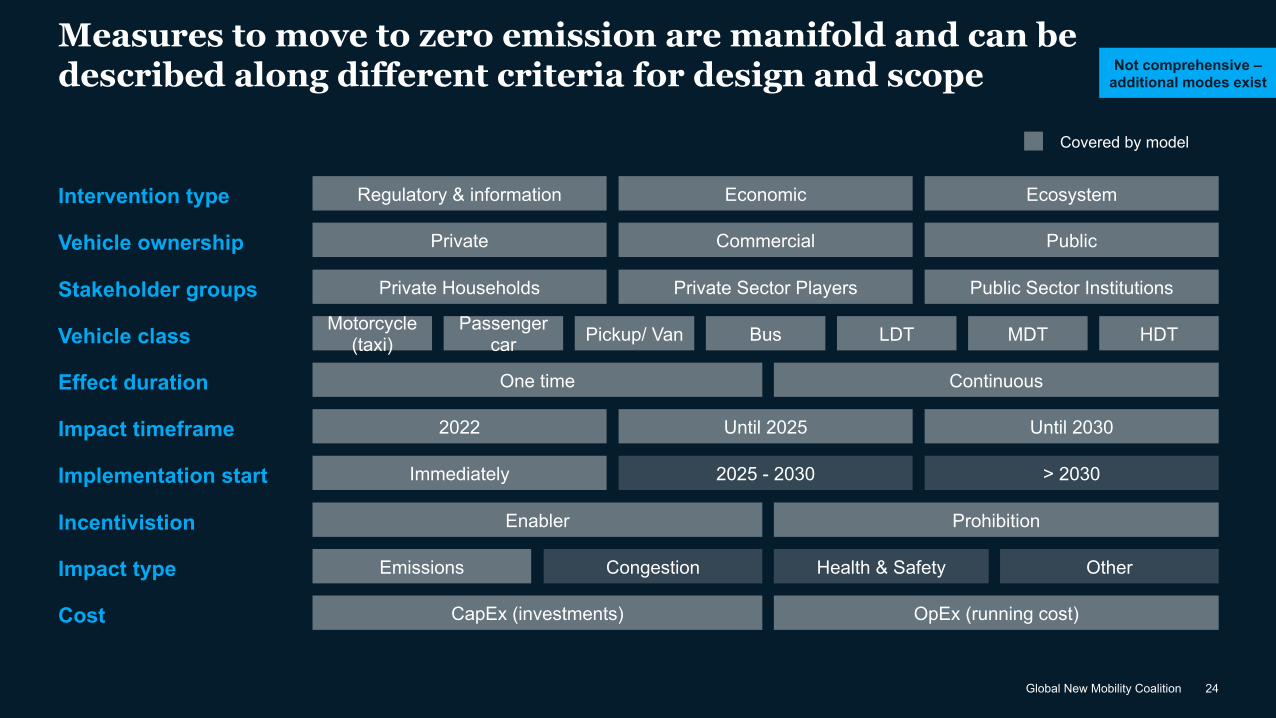
Measures to move to zero emission are manifold and can be described along different criteria for design and scope
Covered by model
Intervention type Regulatory & information Economic Ecosystem
Vehicle ownership Private Commercial Public
Effect duration One time Continuous
Vehicle class Motorcycle (taxi)
Passenger car Pickup/ Van Bus LDT MDT HDT
Impact timeframe 2022 Until 2025 Until 2030
Incentivistion Enabler Prohibition
Impact type Emissions Congestion Health & Safety Other
Cost CapEx (investments) OpEx (running cost)
Implementation start Immediately 2025 - 2030 > 2030
Stakeholder groups Private Households Private Sector Players Public Sector Institutions
Not comprehensive –additional modes exist
25Global New Mobility Coalition
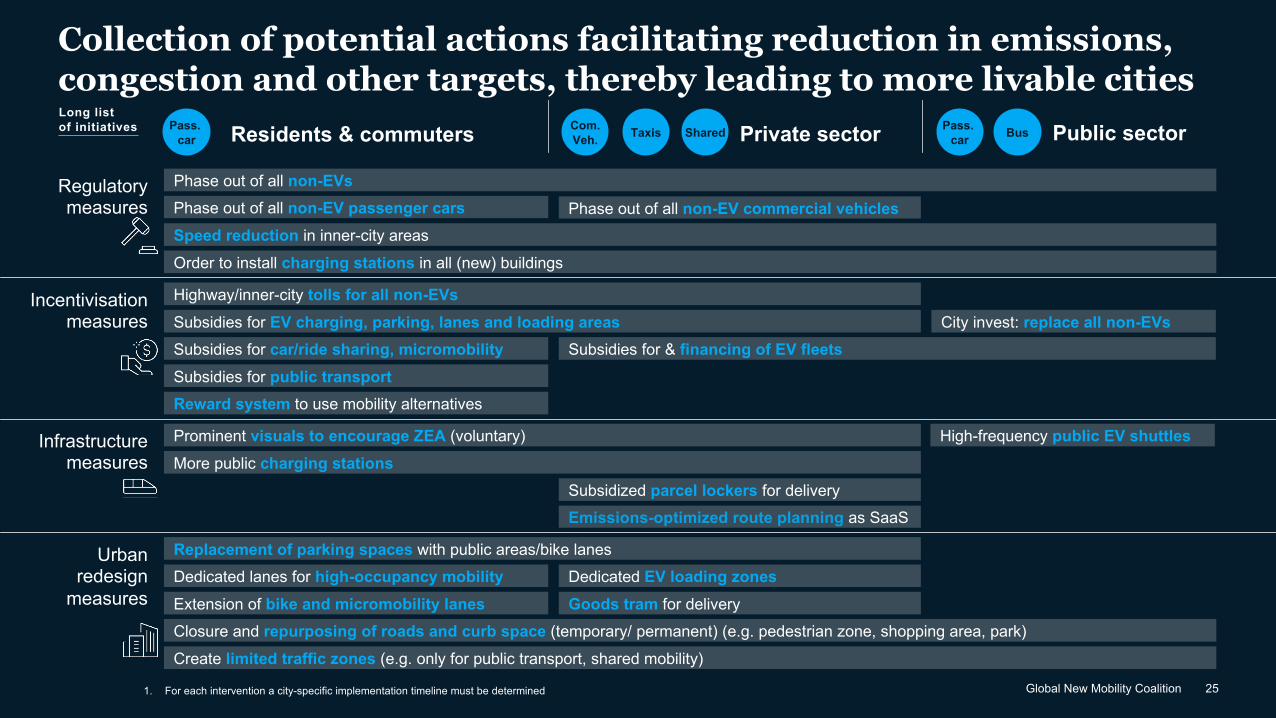
Collection of potential actions facilitating reduction in emissions, congestion and other targets, thereby leading to more livable cities
Residents & commuters Private sector Public sector
Phase out of all non-EV commercial vehiclesPhase out of all non-EV passenger cars
Subsidized parcel lockers for delivery
Subsidies for car/ride sharing, micromobility Subsidies for & financing of EV fleetsSubsidies for public transport
More public charging stations
Goods tram for deliveryExtension of bike and micromobility lanes
Reward system to use mobility alternatives
Phase out of all non-EVs
Highway/inner-city tolls for all non-EVsCity invest: replace all non-EVsSubsidies for EV charging, parking, lanes and loading areas
High-frequency public EV shuttlesProminent visuals to encourage ZEA (voluntary)
Speed reduction in inner-city areas
Order to install charging stations in all (new) buildings
Closure and repurposing of roads and curb space (temporary/ permanent) (e.g. pedestrian zone, shopping area, park)
Pass. car BusTaxis SharedCom.
Veh.Pass.
car
1. For each intervention a city-specific implementation timeline must be determined
Replacement of parking spaces with public areas/bike lanes Dedicated EV loading zonesDedicated lanes for high-occupancy mobility
Create limited traffic zones (e.g. only for public transport, shared mobility)
Incentivisationmeasures
Regulatory measures
Infrastructure measures
Urban redesign
measures
Long list of initiatives
Emissions-optimized route planning as SaaS
26Global New Mobility Coalition
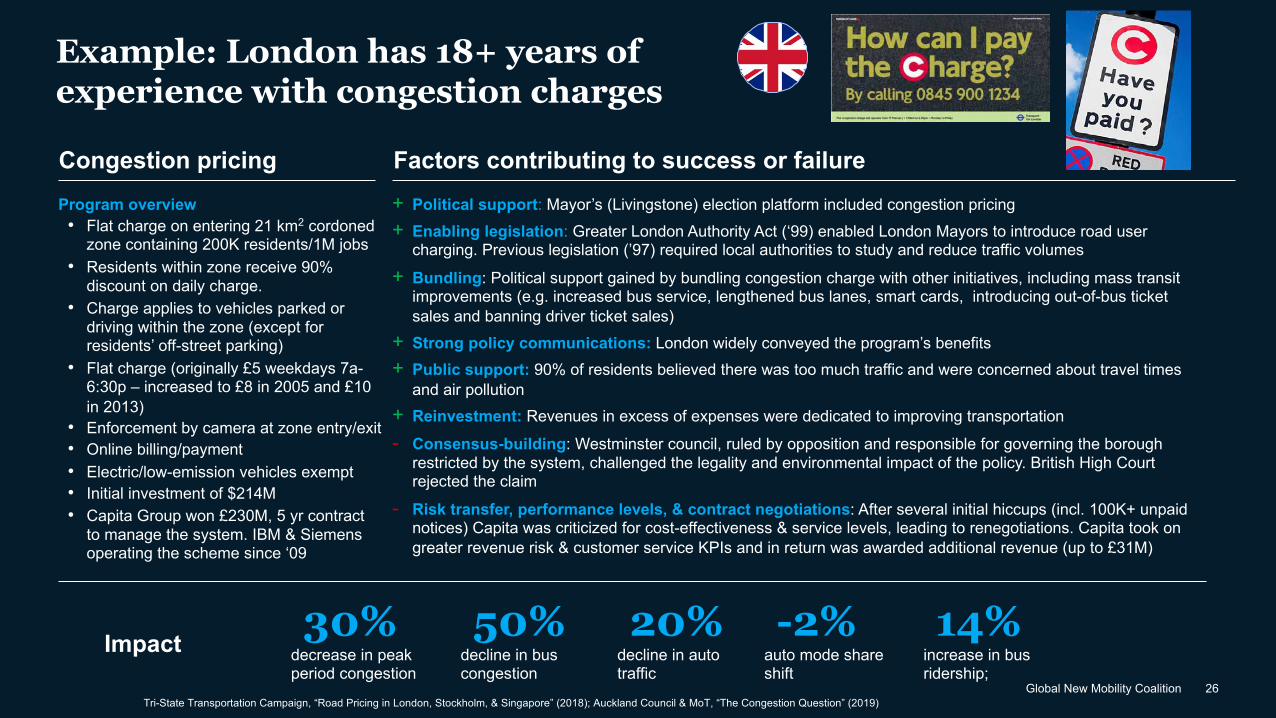
Example: London has 18+ years of experience with congestion charges
Congestion pricing Program overview• Flat charge on entering 21 km2 cordoned
zone containing 200K residents/1M jobs• Residents within zone receive 90%
discount on daily charge. • Charge applies to vehicles parked or
driving within the zone (except for residents’ off-street parking)
• Flat charge (originally £5 weekdays 7a-6:30p – increased to £8 in 2005 and £10 in 2013)
• Enforcement by camera at zone entry/exit• Online billing/payment• Electric/low-emission vehicles exempt• Initial investment of $214M• Capita Group won £230M, 5 yr contract
to manage the system. IBM & Siemens operating the scheme since ‘09
Factors contributing to success or failure+ Political support: Mayor’s (Livingstone) election platform included congestion pricing+ Enabling legislation: Greater London Authority Act (‘99) enabled London Mayors to introduce road user
charging. Previous legislation (’97) required local authorities to study and reduce traffic volumes
+ Bundling: Political support gained by bundling congestion charge with other initiatives, including mass transit improvements (e.g. increased bus service, lengthened bus lanes, smart cards, introducing out-of-bus ticket sales and banning driver ticket sales)
+ Strong policy communications: London widely conveyed the program’s benefits+ Public support: 90% of residents believed there was too much traffic and were concerned about travel times
and air pollution+ Reinvestment: Revenues in excess of expenses were dedicated to improving transportation
- Consensus-building: Westminster council, ruled by opposition and responsible for governing the borough restricted by the system, challenged the legality and environmental impact of the policy. British High Court rejected the claim
- Risk transfer, performance levels, & contract negotiations: After several initial hiccups (incl. 100K+ unpaid notices) Capita was criticized for cost-effectiveness & service levels, leading to renegotiations. Capita took on greater revenue risk & customer service KPIs and in return was awarded additional revenue (up to £31M)
Impact 30%decrease in peak period congestion
50%decline in bus congestion
20% decline in auto traffic
-2%auto mode share shift
14% increase in bus ridership;
Tri-State Transportation Campaign, “Road Pricing in London, Stockholm, & Singapore” (2018); Auckland Council & MoT, “The Congestion Question” (2019)
27Global New Mobility Coalition
#6Close legal, financial & technological implementation gaps
27Global New Mobility Coalition
28Global New Mobility Coalition
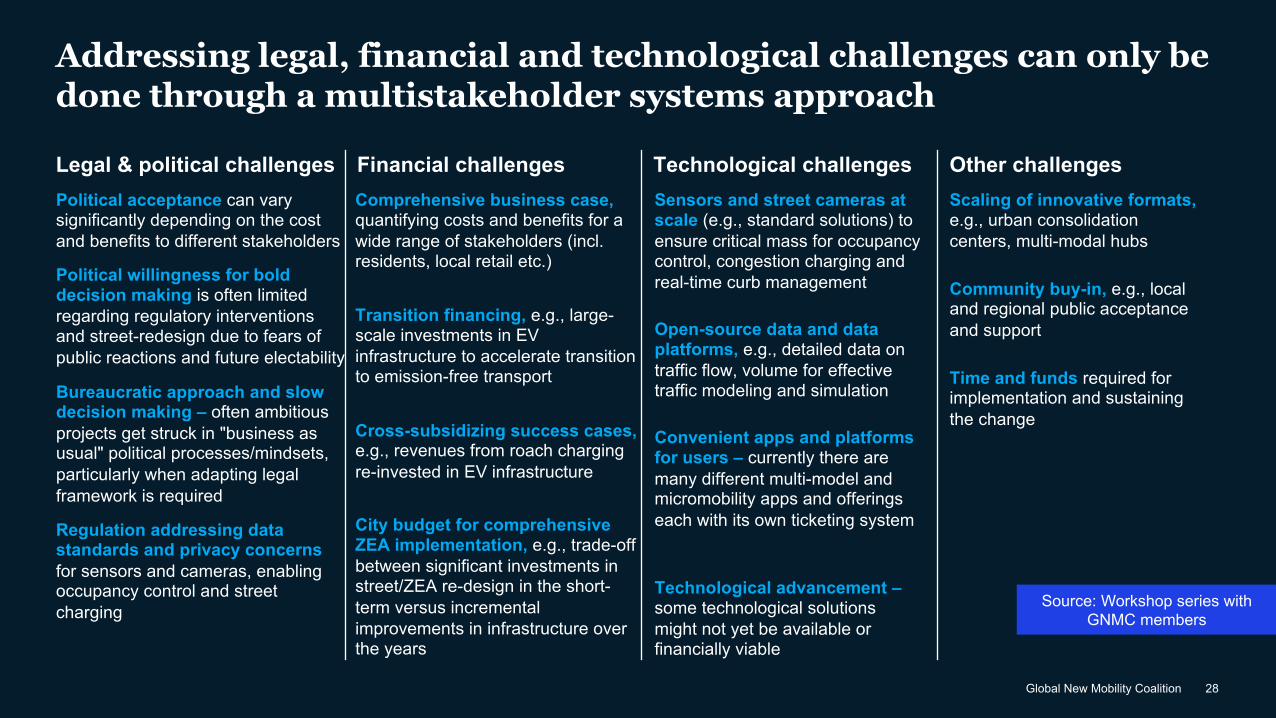
Addressing legal, financial and technological challenges can only be done through a multistakeholder systems approach
Comprehensive business case, quantifying costs and benefits for a wide range of stakeholders (incl. residents, local retail etc.)
Sensors and street cameras at scale (e.g., standard solutions) to ensure critical mass for occupancy control, congestion charging and real-time curb management
Transition financing, e.g., large-scale investments in EV infrastructure to accelerate transition to emission-free transport
Regulation addressing data standards and privacy concerns for sensors and cameras, enabling occupancy control and street charging
Political willingness for bold decision making is often limited regarding regulatory interventions and street-redesign due to fears of public reactions and future electability
City budget for comprehensive ZEA implementation, e.g., trade-off between significant investments in street/ZEA re-design in the short-term versus incremental improvements in infrastructure over the years
Legal & political challenges Financial challenges Technological challenges Other challengesScaling of innovative formats, e.g., urban consolidation centers, multi-modal hubs
Cross-subsidizing success cases, e.g., revenues from roach charging re-invested in EV infrastructure
Open-source data and data platforms, e.g., detailed data on traffic flow, volume for effective traffic modeling and simulation
Community buy-in, e.g., local and regional public acceptance and support
Bureaucratic approach and slow decision making – often ambitious projects get struck in "business as usual" political processes/mindsets, particularly when adapting legal framework is required
Source: Workshop series with GNMC members
Convenient apps and platforms for users – currently there aremany different multi-model and micromobility apps and offerings each with its own ticketing system
Political acceptance can vary significantly depending on the cost and benefits to different stakeholders
Time and funds required for implementation and sustaining the change
Technological advancement –some technological solutions might not yet be available or financially viable

29Global New Mobility Coalition
#7Quantify direct impact
29Global New Mobility Coalition

30Global New Mobility Coalition
The partnership between the World Economic Forum’s GNMC, the city of Sacramento and McKinsey helps solve mobility related climate change challenges
Goals of the partnership Data sources utilized
The World Economic Forum’s GNMC, the city of Sacramento and McKinsey aim to inform policy makers and private stakeholders on future mobility challenges.The findings are supposed to guide decisions on strategies regarding the decarbonization of mobility in urban areas to be utilized in initiatives such as the Mayors’ Commission on Climate Change1
in the city of Sacramento. Results of this partnership are not ready-to-implement mobility policies but rather food for thought in developing these policies.
The data for the quantitative modelling was provided by the city of Sacramento including traffic flow, parking, EV charging infrastructure data, etc.McKinsey complemented this by providing detailed figures on investment cost, utilization projections, emissions, etc.Further data was provided by existing GMNC partners including mobility cost data and existing case studies of new mobility approaches. Expert interviews completed the qualitative findings presented.
1. https://www.lgc.org/climatecommission/
31Global New Mobility Coalition
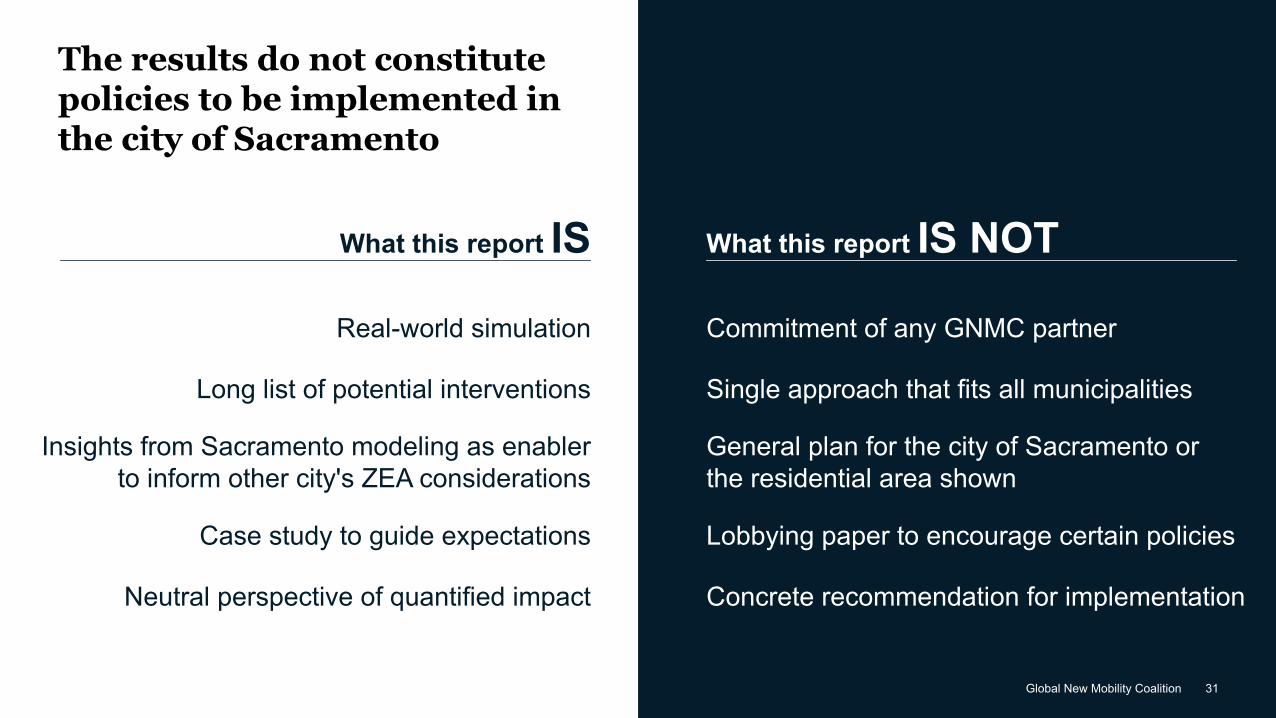
The results do not constitute policies to be implemented in the city of Sacramento
What this report IS NOTWhat this report IS
Neutral perspective of quantified impact
Real-world simulation
General plan for the city of Sacramento or the residential area shown
Lobbying paper to encourage certain policies
Long list of potential interventions
Insights from Sacramento modeling as enabler to inform other city's ZEA considerations
Case study to guide expectations
Commitment of any GNMC partner
Single approach that fits all municipalities
Concrete recommendation for implementation
McKinsey & Company 32
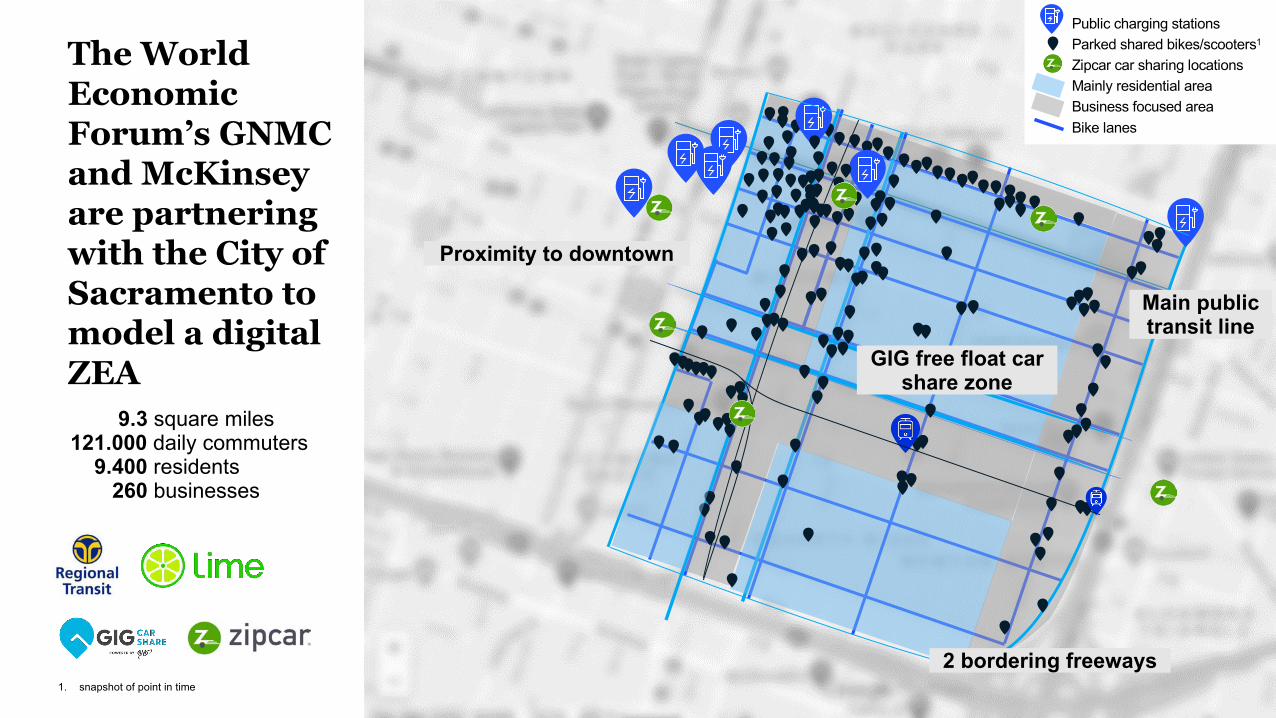
The World Economic Forum’s GNMC and McKinsey are partnering with the City of Sacramento to model a digital ZEA
9.3 square miles 121.000 daily commuters
9.400 residents260 businesses
Proximity to downtown
1. snapshot of point in time
Public charging stationsParked shared bikes/scooters1
Mainly residential areaBusiness focused areaBike lanes
Main public transit line
2 bordering freeways
GIG free float car share zone
Zipcar car sharing locations
33Global New Mobility Coalition
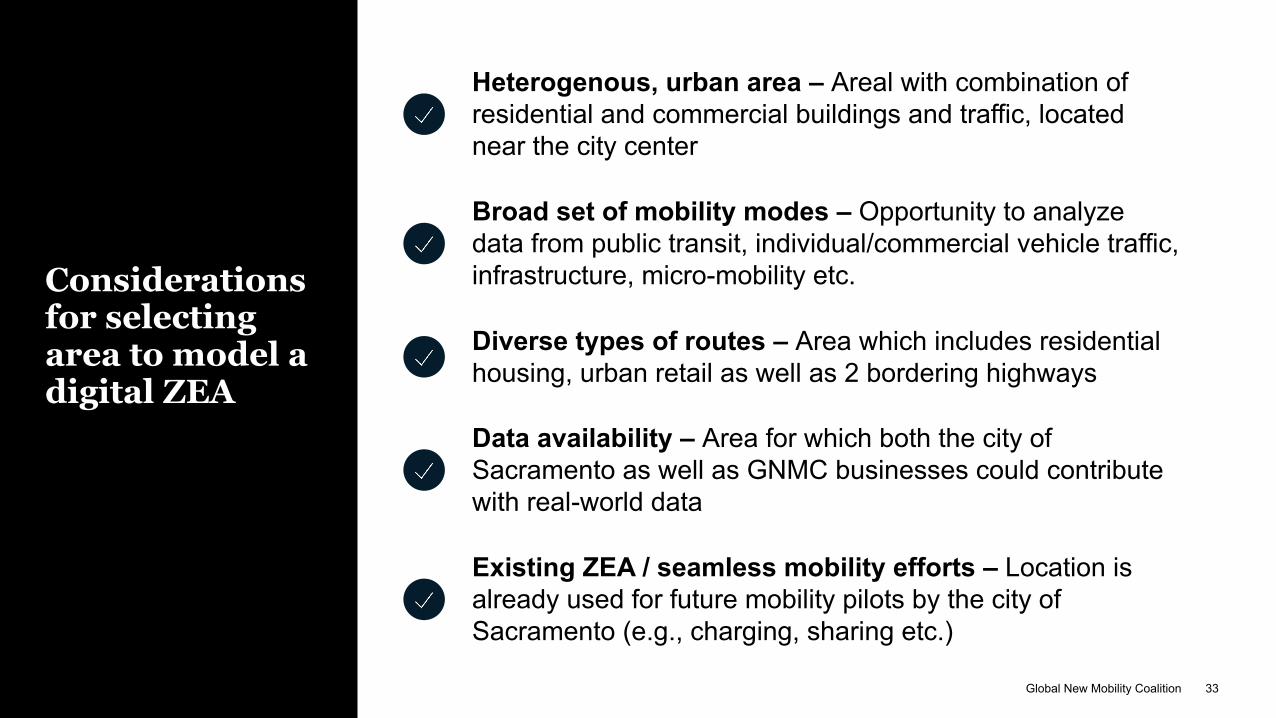
Considerations for selecting area to model a digital ZEA
Heterogenous, urban area – Areal with combination of residential and commercial buildings and traffic, located near the city center
Broad set of mobility modes – Opportunity to analyze data from public transit, individual/commercial vehicle traffic, infrastructure, micro-mobility etc.
Diverse types of routes – Area which includes residential housing, urban retail as well as 2 bordering highways
Data availability – Area for which both the city of Sacramento as well as GNMC businesses could contribute with real-world data
Existing ZEA / seamless mobility efforts – Location is already used for future mobility pilots by the city of Sacramento (e.g., charging, sharing etc.)
34Global New Mobility Coalition
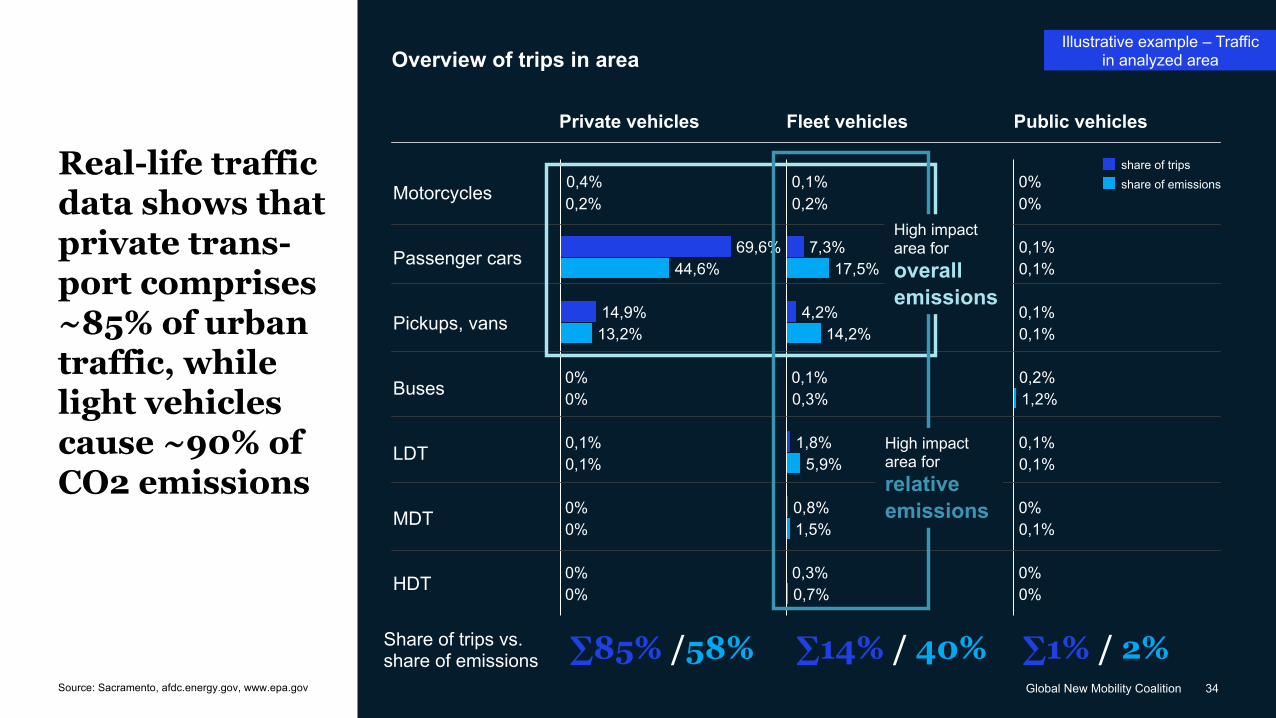
Real-life traffic data shows that private trans-port comprises ~85% of urban traffic, while light vehicles cause ~90% of CO2 emissions
Private vehicles Fleet vehicles Public vehicles
Overview of trips in area
LDT
Motorcycles
Passenger cars
Pickups, vans
HDT
0%Buses
0,4%
13,2%
MDT
0%
0,2%
69,6%44,6%
14,9%
0,1%0,1%
0%0%
0%0%
share of tripsshare of emissions
∑85% /58% ∑14% / 40%Share of trips vs. share of emissions
5,9%
0,2%0,1%
0,1%
17,5%
0,8%
7,3%
4,2%14,2%
0,3%
1,8%
1,5%
0,3%0,7%
0,1%
0%
0,2%
0%
0,1%
0,1%
0,1%
1,2%
0,1%0,1%
0%0,1%
0%0%
∑1% / 2%
High impact area for overall emissions
High impact area for relative emissions
Source: Sacramento, afdc.energy.gov, www.epa.gov
Illustrative example – Traffic in analyzed area
35Global New Mobility Coalition
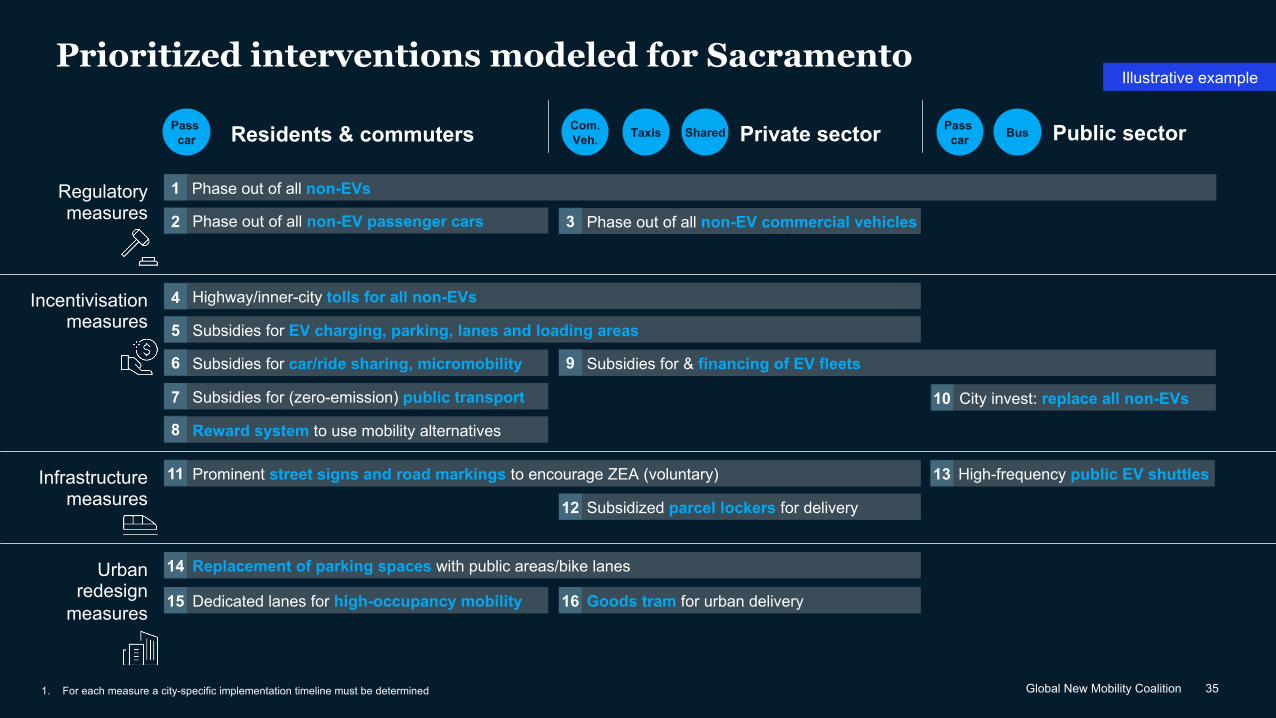
Prioritized interventions modeled for SacramentoIllustrative example
Residents & commuters Private sector Public sectorPass car BusTaxis SharedCom.
Veh.Pass
car
1. For each measure a city-specific implementation timeline must be determined
Subsidies for car/ride sharing, micromobility Subsidies for & financing of EV fleets
Subsidies for (zero-emission) public transport
Reward system to use mobility alternatives
Highway/inner-city tolls for all non-EVs
City invest: replace all non-EVs
Subsidies for EV charging, parking, lanes and loading areas
Incentivisation measures
Phase out of all non-EV commercial vehiclesPhase out of all non-EV passenger cars
Phase out of all non-EVs1Regulatory measures
Subsidized parcel lockers for delivery
High-frequency public EV shuttlesProminent street signs and road markings to encourage ZEA (voluntary)Infrastructure measures
Goods tram for urban deliveryDedicated lanes for high-occupancy mobility
Replacement of parking spaces with public areas/bike lanes Urban redesign
measures
2 3
4
5
6
7
8
9
10
11
12
13
14
15 16
36Global New Mobility Coalition
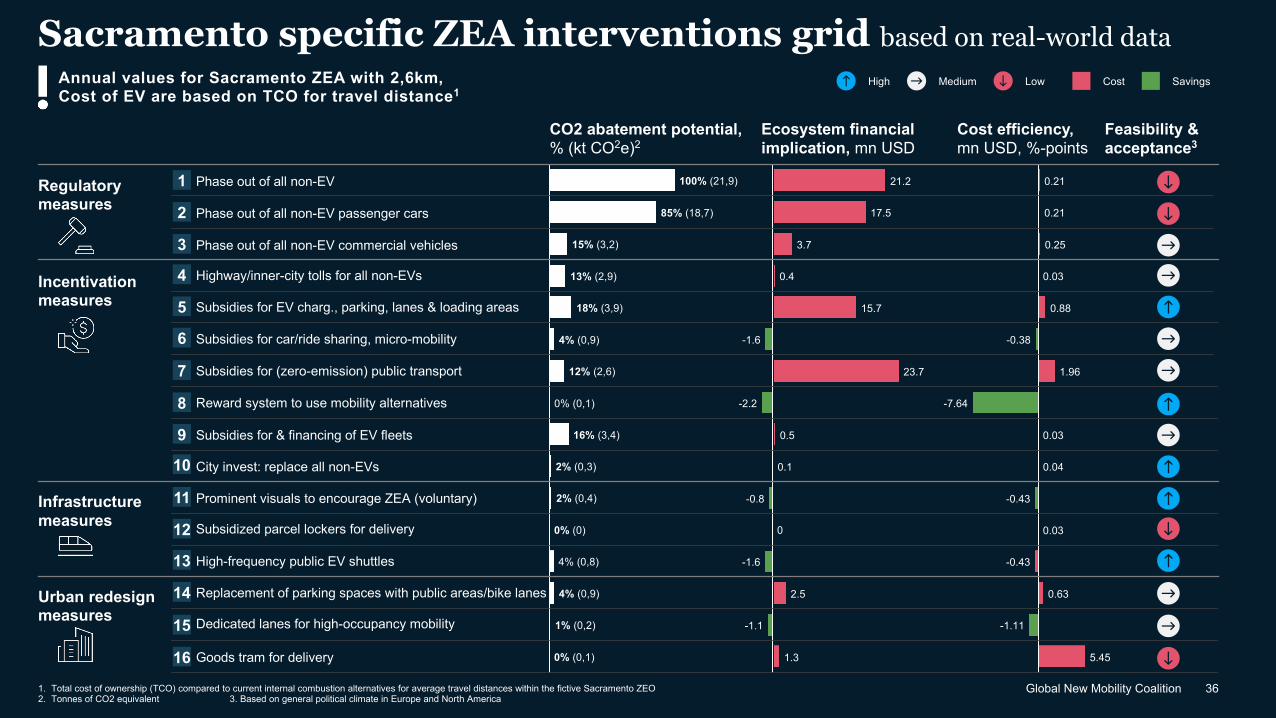
Sacramento specific ZEA interventions grid based on real-world data
1. Total cost of ownership (TCO) compared to current internal combustion alternatives for average travel distances within the fictive Sacramento ZEO 2. Tonnes of CO2 equivalent 3. Based on general political climate in Europe and North America
Cost SavingsHigh Medium Low
CO2 abatement potential,% (kt CO2e)2
Ecosystem financial implication, mn USD
21.2
17.5
3.7
0.4
15.7
-1.6
23.7
-2.2
0.5
0.1
-0.8
-1.6
2.5
-1.1
1.3
0
18% (3,9)
16% (3,4)
4% (0,8)
13% (2,9)
2% (0,3)
85% (18,7)
100% (21,9)
4% (0,9)
15% (3,2)
12% (2,6)
2% (0,4)
0% (0)
4% (0,9)
1% (0,2)
0% (0,1)
0% (0,1)
Cost efficiency,mn USD, %-points
0.21
0.21
0.25
0.03
0.88
-0.38
1.96
-7.64
0.03
0.04
-0.43
0.03
-0.43
0.63
-1.11
5.45
Feasibility & acceptance3
Phase out of all non-EV
Phase out of all non-EV passenger cars
Phase out of all non-EV commercial vehicles
Dedicated lanes for high-occupancy mobility
Goods tram for delivery
Prominent visuals to encourage ZEA (voluntary)
Replacement of parking spaces with public areas/bike lanes Urban redesign measures
Infrastructure measures
Incentivation measures
Regulatory measures
1
2
3
Reward system to use mobility alternatives8
Highway/inner-city tolls for all non-EVs4
Subsidies for EV charg., parking, lanes & loading areas5
Subsidies for car/ride sharing, micro-mobility6
Subsidies for (zero-emission) public transport7
Subsidies for & financing of EV fleets9
City invest: replace all non-EVs10
11
High-frequency public EV shuttles13
Subsidized parcel lockers for delivery12
14
15
16
Annual values for Sacramento ZEA with 2,6km,Cost of EV are based on TCO for travel distance1
37Global New Mobility Coalition
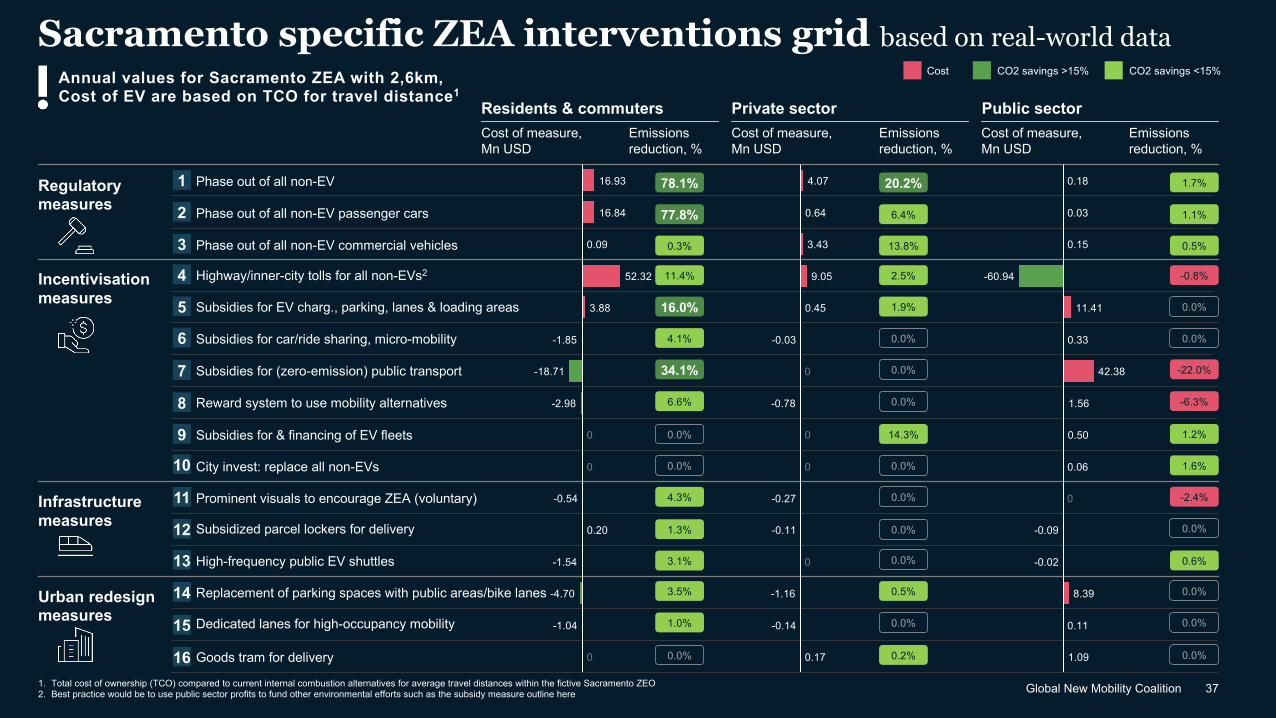
Sacramento specific ZEA interventions grid based on real-world data
1. Total cost of ownership (TCO) compared to current internal combustion alternatives for average travel distances within the fictive Sacramento ZEO 2. Best practice would be to use public sector profits to fund other environmental efforts such as the subsidy measure outline here
Urban redesign measures
Infrastructure measures
Incentivisationmeasures
Regulatory measures
Private sector Public sectorCost of measure,Mn USD
Emissions reduction, %
Residents & commutersCost of measure,Mn USD
Emissions reduction, %
Cost of measure,Mn USD
Emissions reduction, %
3.88
16.93
-18.71
16.84
0.09
52.32
-1.85
0
0
-0.54
0.20
-4.70
-1.04
0
-1.54
-2.98
0
0
4.07
0.64
-0.78
3.43
9.05
-0.03
0.45
0
-0.27
-0.14
-0.11
-1.16
0.17
0
0.18
0.03
0.15
42.38
-60.94
0.33
8.39
11.41
0.50
0.06
0
-0.09
0.11
1.09
-0.02
1.56
Cost CO2 savings >15% CO2 savings <15%
1.7%
1.1%
0.5%
1.2%
1.6%
-2.4%
0.0%
0.0%
0.0%
20.2%
6.4%
13.8%
14.3%
0.0%
0.0%
0.5%
0.0%
0.2%
78.1%
77.8%
0.3%
-6.3%0.0%6.6%
-0.8%
0.0%
0.0%
-22.0%
2.5%
1.9%
0.0%
0.0%
11.4%
16.0%
4.1%
34.1%
0.0%
0.0%
4.3%
0.6%0.0%3.1%
0.0%0.0%1.3%
3.5%
1.0%
0.0%
Phase out of all non-EV
Phase out of all non-EV passenger cars
Phase out of all non-EV commercial vehicles
Dedicated lanes for high-occupancy mobility
Goods tram for delivery
Prominent visuals to encourage ZEA (voluntary)
1
2
3
Reward system to use mobility alternatives8
Highway/inner-city tolls for all non-EVs24
Subsidies for EV charg., parking, lanes & loading areas5
Subsidies for car/ride sharing, micro-mobility6
Subsidies for (zero-emission) public transport7
Subsidies for & financing of EV fleets9
City invest: replace all non-EVs10
11
High-frequency public EV shuttles13
Subsidized parcel lockers for delivery12
14
15
16
Replacement of parking spaces with public areas/bike lanes
Annual values for Sacramento ZEA with 2,6km,Cost of EV are based on TCO for travel distance1
38Global New Mobility Coalition
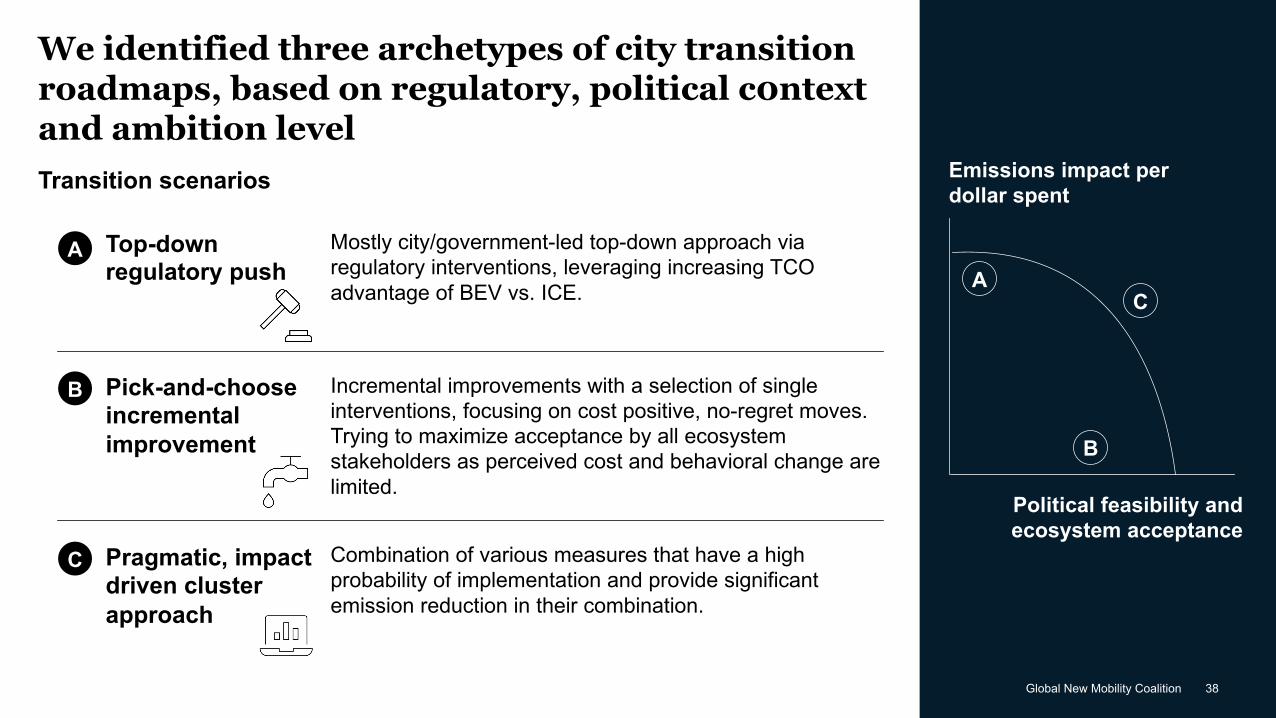
We identified three archetypes of city transition roadmaps, based on regulatory, political c0ntext and ambition level
Top-down regulatory push
Pick-and-choose incremental improvement
Pragmatic, impact driven cluster approach
Mostly city/government-led top-down approach via regulatory interventions, leveraging increasing TCO advantage of BEV vs. ICE.
Incremental improvements with a selection of single interventions, focusing on cost positive, no-regret moves. Trying to maximize acceptance by all ecosystem stakeholders as perceived cost and behavioral change are limited.
Combination of various measures that have a high probability of implementation and provide significant emission reduction in their combination.
Transition scenarios
A
B
C
Emissions impact per dollar spent
Political feasibility and ecosystem acceptance
A
B
C

39Global New Mobility Coalition
-3 3 23
10
24
12
2
222
4
-2 -1 0
8
01
6
16
14
17
16
100
18 19 20 21
Subsidized parcel lockersfor delivery
CO2 abatement costs(mn USD)
City invest: replacementof all non-EVs
Replacement of parking spaceswith public areas/bike lanes
CO2 abatement potential (%)
Dedicated lanes forhigh-occupancy mobility
Prominent visuals toencourage ZEA (voluntary)
Highway/ inner-city tollsfor all non-EVs
Phase out of all non-EVpassenger cars
Phase out of all non-EVcommercial vehicles
Subsidies for car/ridesharing, micromobility
Reward system to usemobility alternatives
Subsidies for EV charging,parking, lanes and loading areas
Subsidies for public transport
Subsidies for & financing of EV fleets
Phase out of all non-EV
High-frequencypublic EV shuttles
Goods tram for delivery
Regulatory Infrastructure Incentivisation Urban redesign
CPragmatic, impact driven cluster approach
B Pick-and-choose incremental improvement
A Top-down regulatory push
Measures
Sacramento specific ZEA interventions grid based on real-world data

40Global New Mobility Coalition
A pragmatic, impact driven strategy will focus on high overall CO2 reduction potential at a high probability for implementation
Regulatory measures Highway & inner city tolls SubsidiesShow the highest overall CO2 abatement potential at low cost per unit of CO2 avoided
Still significant CO2 abatement potential at low overall cost for the ecosystem
The subsidy-based initiatives have a CO2 abatement impact only slightly lower than tolls
Likely meet the strongest resistance from political, residential and private sector stakeholders
Might meet resistance due to high reallocation of funds from residents/ commuters and the private sector to the public sector, especially if these funds are not used appropriately
In combination with the tolls, all subsidies could be financed and provide an appropriate measure to relieve travellers willing so adopt low/zero emissions travelling
Probability for implementationCost for CO2 abatement potential
41Global New Mobility Coalition
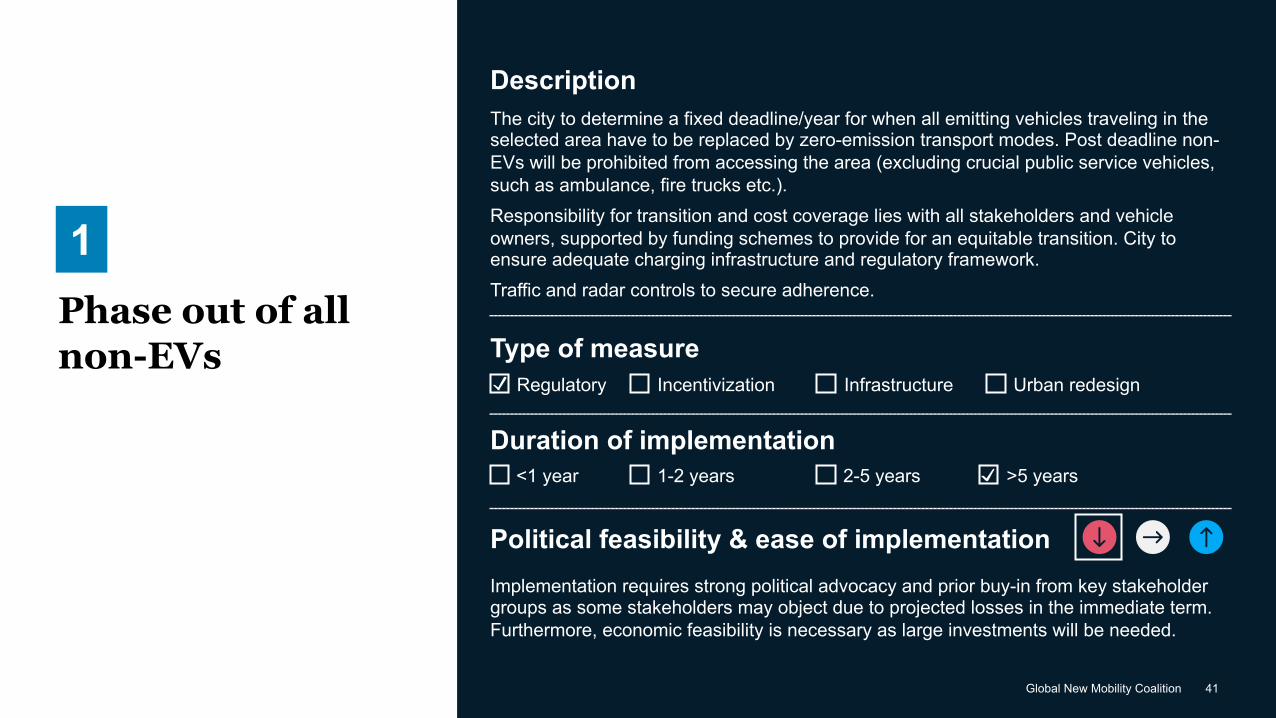
Phase out of all non-EVs
1
DescriptionThe city to determine a fixed deadline/year for when all emitting vehicles traveling in the selected area have to be replaced by zero-emission transport modes. Post deadline non-EVs will be prohibited from accessing the area (excluding crucial public service vehicles, such as ambulance, fire trucks etc.). Responsibility for transition and cost coverage lies with all stakeholders and vehicle owners, supported by funding schemes to provide for an equitable transition. City to ensure adequate charging infrastructure and regulatory framework.Traffic and radar controls to secure adherence.
Duration of implementation<1 year 1-2 years 2-5 years >5 years
Political feasibility & ease of implementationImplementation requires strong political advocacy and prior buy-in from key stakeholder groups as some stakeholders may object due to projected losses in the immediate term. Furthermore, economic feasibility is necessary as large investments will be needed.
Type of measureRegulatory Infrastructure Urban redesignIncentivization
42Global New Mobility Coalition
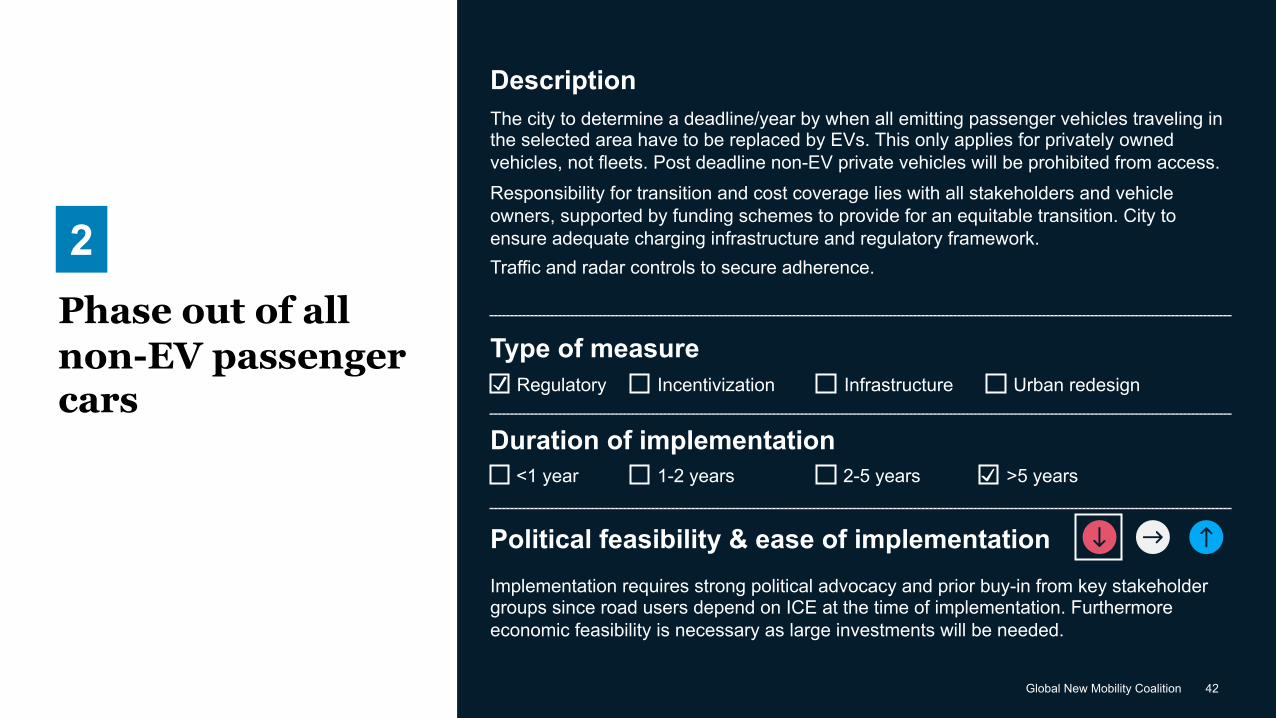
Phase out of all non-EV passenger cars
2
DescriptionThe city to determine a deadline/year by when all emitting passenger vehicles traveling in the selected area have to be replaced by EVs. This only applies for privately owned vehicles, not fleets. Post deadline non-EV private vehicles will be prohibited from access. Responsibility for transition and cost coverage lies with all stakeholders and vehicle owners, supported by funding schemes to provide for an equitable transition. City to ensure adequate charging infrastructure and regulatory framework.Traffic and radar controls to secure adherence.
Duration of implementation<1 year 1-2 years 2-5 years >5 years
Political feasibility & ease of implementationImplementation requires strong political advocacy and prior buy-in from key stakeholder groups since road users depend on ICE at the time of implementation. Furthermore economic feasibility is necessary as large investments will be needed.
Type of measureRegulatory Infrastructure Urban redesignIncentivization
43Global New Mobility Coalition
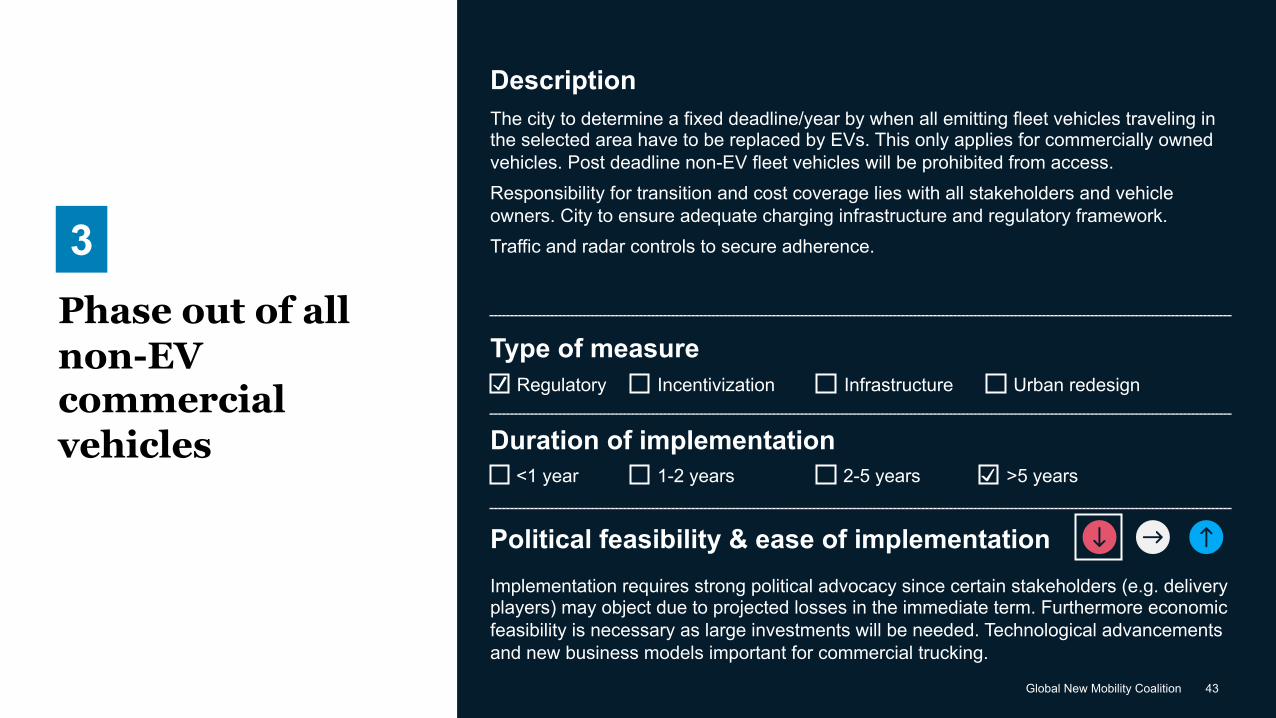
Phase out of all non-EV commercial vehicles
3
DescriptionThe city to determine a fixed deadline/year by when all emitting fleet vehicles traveling in the selected area have to be replaced by EVs. This only applies for commercially owned vehicles. Post deadline non-EV fleet vehicles will be prohibited from access. Responsibility for transition and cost coverage lies with all stakeholders and vehicle owners. City to ensure adequate charging infrastructure and regulatory framework.Traffic and radar controls to secure adherence.
Duration of implementation<1 year 1-2 years 2-5 years >5 years
Political feasibility & ease of implementationImplementation requires strong political advocacy since certain stakeholders (e.g. delivery players) may object due to projected losses in the immediate term. Furthermore economic feasibility is necessary as large investments will be needed. Technological advancements and new business models important for commercial trucking.
Type of measureRegulatory Infrastructure Urban redesignIncentivization
44Global New Mobility Coalition
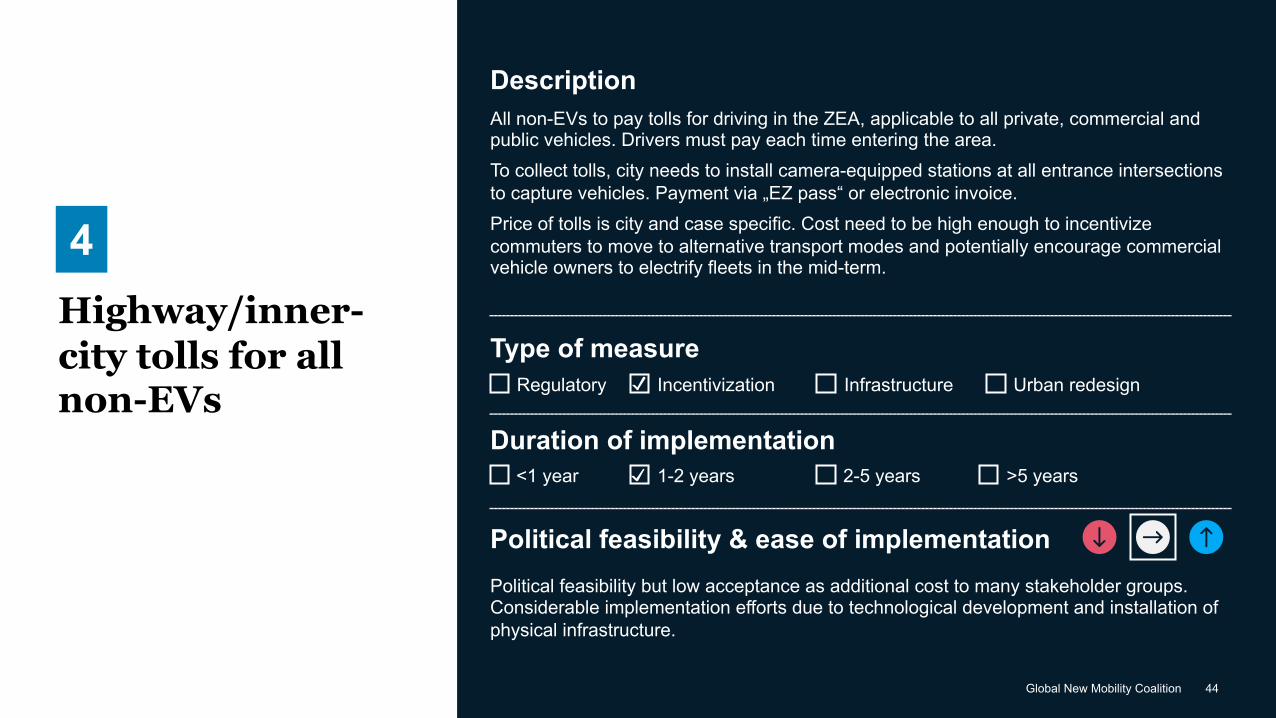
Highway/inner-city tolls for all non-EVs
4
DescriptionAll non-EVs to pay tolls for driving in the ZEA, applicable to all private, commercial and public vehicles. Drivers must pay each time entering the area. To collect tolls, city needs to install camera-equipped stations at all entrance intersections to capture vehicles. Payment via „EZ pass“ or electronic invoice. Price of tolls is city and case specific. Cost need to be high enough to incentivize commuters to move to alternative transport modes and potentially encourage commercial vehicle owners to electrify fleets in the mid-term.
Duration of implementation<1 year 1-2 years 2-5 years >5 years
Political feasibility but low acceptance as additional cost to many stakeholder groups. Considerable implementation efforts due to technological development and installation of physical infrastructure.
Type of measureRegulatory Infrastructure Urban redesignIncentivization
Political feasibility & ease of implementation
45Global New Mobility Coalition
Subsidies for EV charging, parking, lanes and loading areas
5
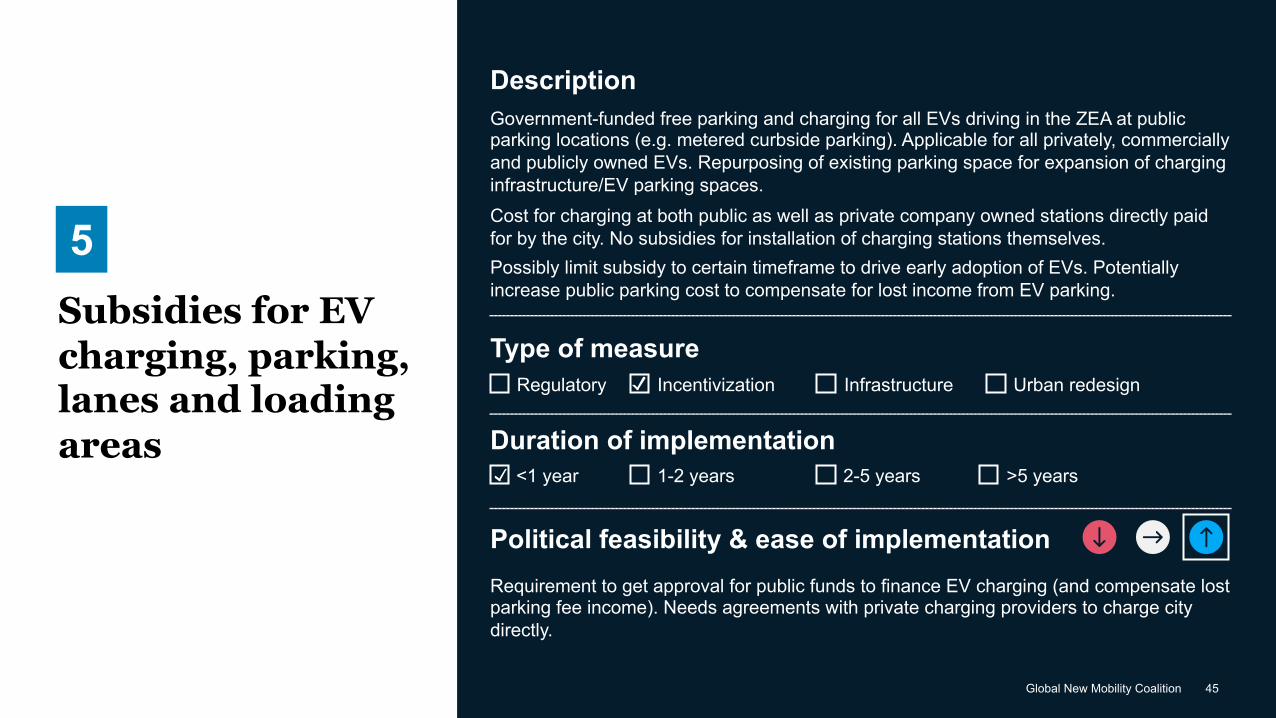
DescriptionGovernment-funded free parking and charging for all EVs driving in the ZEA at public parking locations (e.g. metered curbside parking). Applicable for all privately, commercially and publicly owned EVs. Repurposing of existing parking space for expansion of charging infrastructure/EV parking spaces.Cost for charging at both public as well as private company owned stations directly paid for by the city. No subsidies for installation of charging stations themselves. Possibly limit subsidy to certain timeframe to drive early adoption of EVs. Potentially increase public parking cost to compensate for lost income from EV parking.
Duration of implementation<1 year 1-2 years 2-5 years >5 years
Requirement to get approval for public funds to finance EV charging (and compensate lost parking fee income). Needs agreements with private charging providers to charge city directly.
Type of measureRegulatory Infrastructure Urban redesignIncentivization
Political feasibility & ease of implementation
46Global New Mobility Coalition
Subsidies for car/ride sharing, micromobility
6
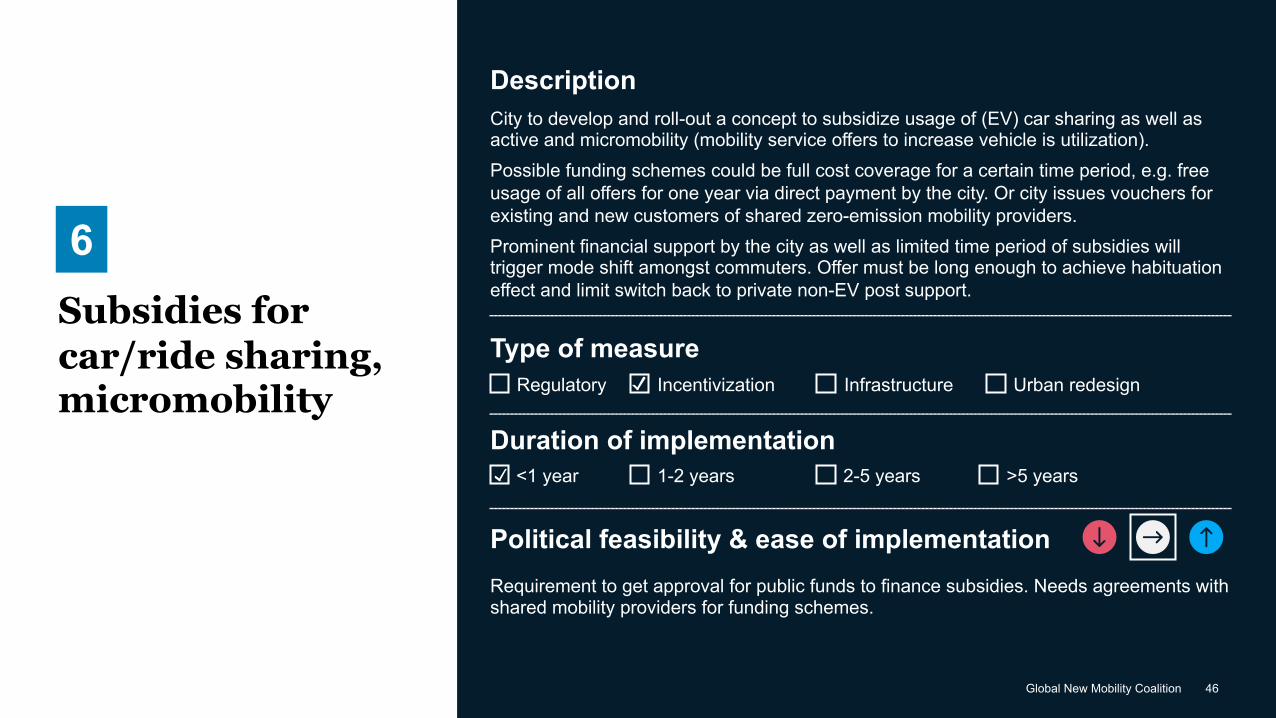
DescriptionCity to develop and roll-out a concept to subsidize usage of (EV) car sharing as well as active and micromobility (mobility service offers to increase vehicle is utilization).Possible funding schemes could be full cost coverage for a certain time period, e.g. free usage of all offers for one year via direct payment by the city. Or city issues vouchers for existing and new customers of shared zero-emission mobility providers.Prominent financial support by the city as well as limited time period of subsidies will trigger mode shift amongst commuters. Offer must be long enough to achieve habituation effect and limit switch back to private non-EV post support.
Duration of implementation<1 year 1-2 years 2-5 years >5 years
Requirement to get approval for public funds to finance subsidies. Needs agreements with shared mobility providers for funding schemes.
Type of measureRegulatory Infrastructure Urban redesignIncentivization
Political feasibility & ease of implementation
47Global New Mobility Coalition
Subsidies for public (zero-emission) transport
7
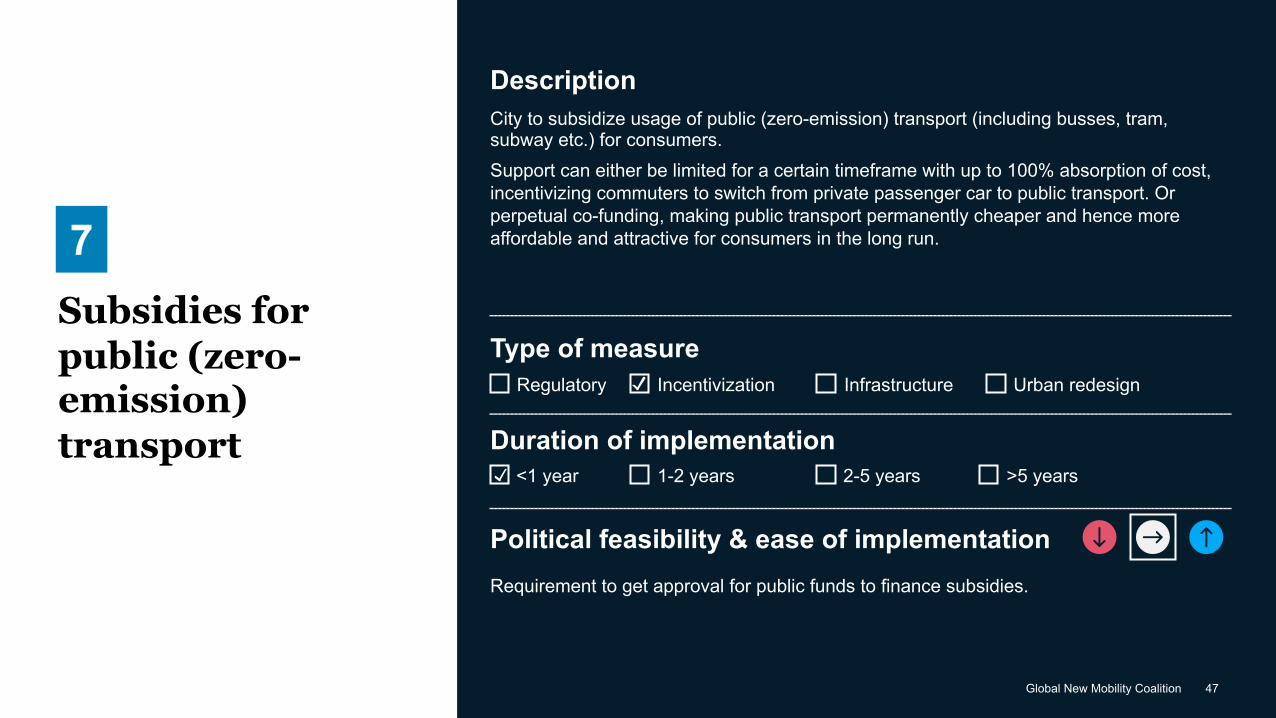
DescriptionCity to subsidize usage of public (zero-emission) transport (including busses, tram, subway etc.) for consumers.Support can either be limited for a certain timeframe with up to 100% absorption of cost, incentivizing commuters to switch from private passenger car to public transport. Or perpetual co-funding, making public transport permanently cheaper and hence more affordable and attractive for consumers in the long run.
Duration of implementation<1 year 1-2 years 2-5 years >5 years
Requirement to get approval for public funds to finance subsidies.
Type of measureRegulatory Infrastructure Urban redesignIncentivization
Political feasibility & ease of implementation

48Global New Mobility Coalition
Reward system to use mobility alternatives
8
DescriptionThe city to develop a tech-enabled reward system together with local retail in order to encourage consumers to switch to more environmentally friendly transport options. A possible solution could be an app tracking and awarding points for the trips done with a zero or low emission transport means. The collected points could then for example be exchanged for free items or vouchers valid in local stores. This approach should be combined with the matching communication campaign to encourage and support commuters to select the most environmentally friendly transport mode1.
Duration of implementation<1 year 1-2 years 2-5 years >5 years
High buy-in from various stakeholders as positive incentive for both consumers as well as local retail. Requires efforts for establishment of collaborations and technical development of connected app.
Type of measureRegulatory Infrastructure Urban redesignIncentivization
Political feasibility & ease of implementation
1. See for example WA State Commute Trip Reduction Programs
49Global New Mobility Coalition
Subsidies for & financing of EV fleets
9
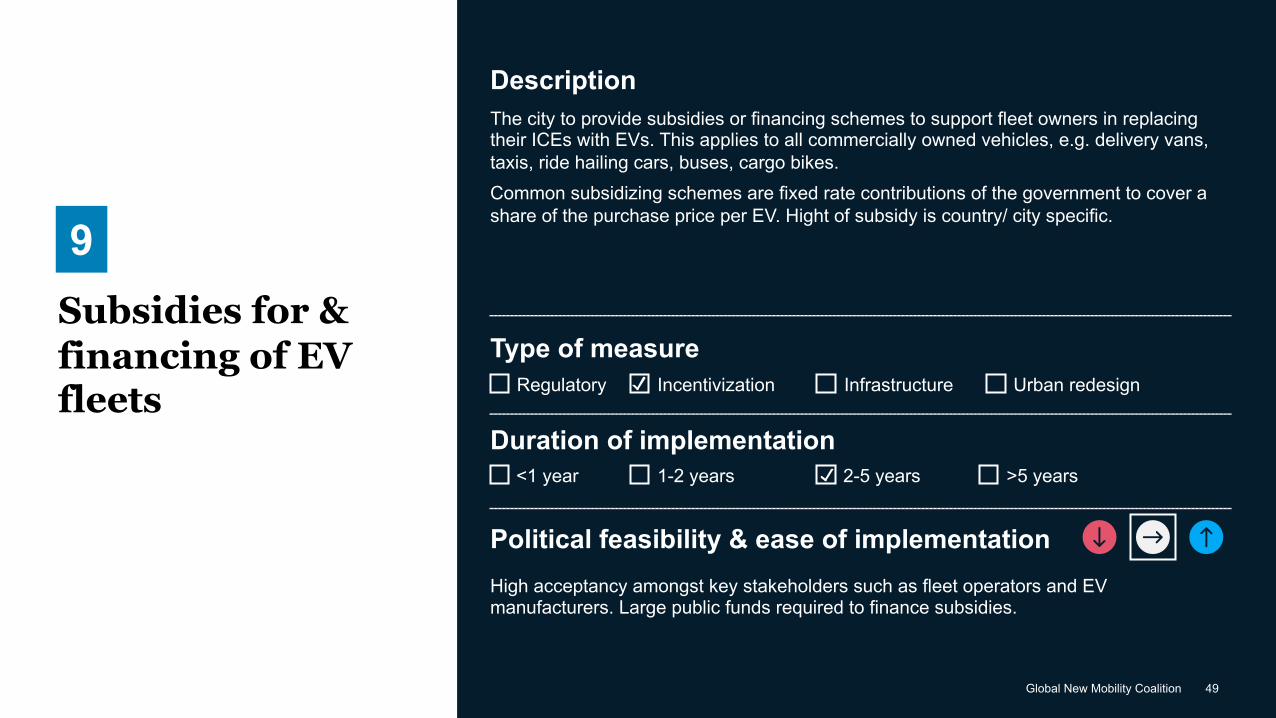
DescriptionThe city to provide subsidies or financing schemes to support fleet owners in replacing their ICEs with EVs. This applies to all commercially owned vehicles, e.g. delivery vans, taxis, ride hailing cars, buses, cargo bikes.Common subsidizing schemes are fixed rate contributions of the government to cover a share of the purchase price per EV. Hight of subsidy is country/ city specific.
Duration of implementation<1 year 1-2 years 2-5 years >5 years
High acceptancy amongst key stakeholders such as fleet operators and EV manufacturers. Large public funds required to finance subsidies.
Type of measureRegulatory Infrastructure Urban redesignIncentivization
Political feasibility & ease of implementation
50Global New Mobility Coalition
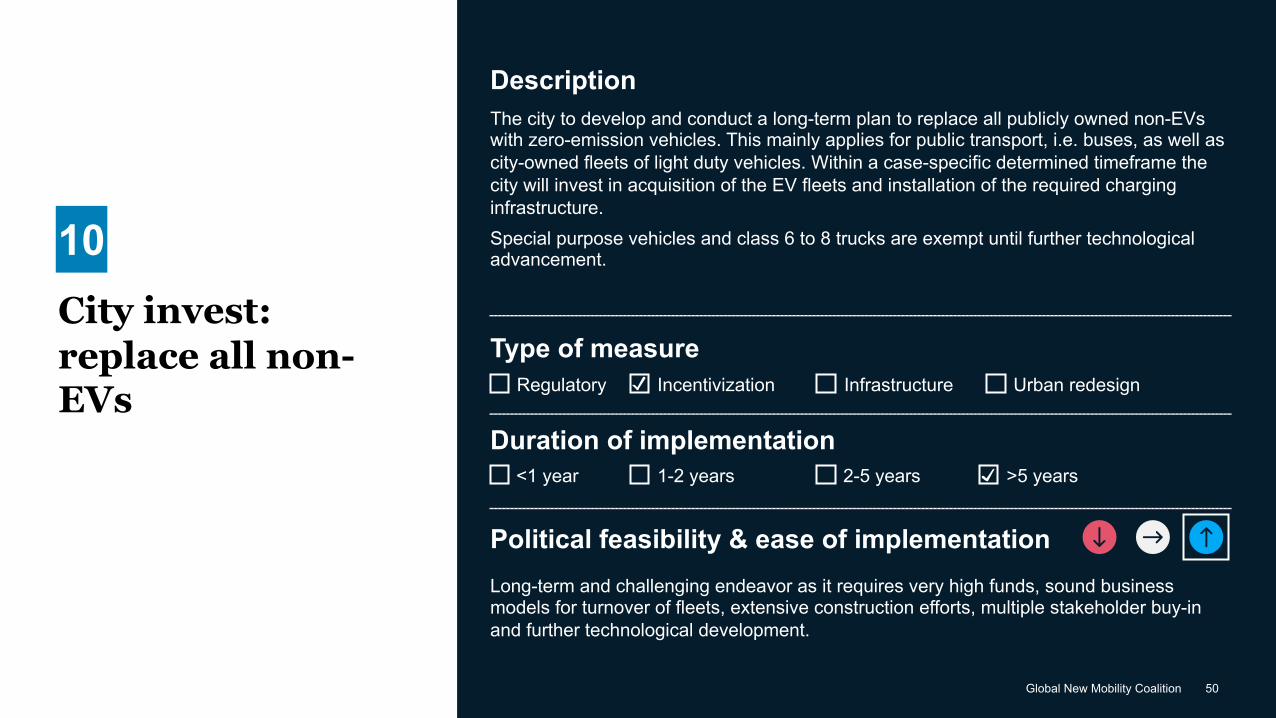
City invest: replace all non-EVs
10
DescriptionThe city to develop and conduct a long-term plan to replace all publicly owned non-EVs with zero-emission vehicles. This mainly applies for public transport, i.e. buses, as well as city-owned fleets of light duty vehicles. Within a case-specific determined timeframe the city will invest in acquisition of the EV fleets and installation of the required charging infrastructure.Special purpose vehicles and class 6 to 8 trucks are exempt until further technological advancement.
Duration of implementation<1 year 1-2 years 2-5 years >5 years
Long-term and challenging endeavor as it requires very high funds, sound business models for turnover of fleets, extensive construction efforts, multiple stakeholder buy-in and further technological development.
Type of measureRegulatory Infrastructure Urban redesignIncentivization
Political feasibility & ease of implementation

51Global New Mobility Coalition
Prominent street signs and road markings to encourage ZEA (voluntary)
11
DescriptionThe city to develop a holistic concept encouraging drivers to support the ZEA voluntarily. Communication via public announcements and most importantly installation of visuals surrounding1 and within the area. Elements can include street signs, road markings, colored pavements, a „green belt“ (trees and plants) around the area etc. Encourage mode shift to alternative transport means (e.g., micro-mobility, EV car sharing and public transport), speed reduction, and bypassing of ZEA with non-EVs.
Duration of implementation<1 year 1-2 years 2-5 years >5 years
High political acceptance since positive enabler. Fast realization of intervention possible, but lagged impact.
Type of measureRegulatory Infrastructure Urban redesignIncentivization
Political feasibility & ease of implementation
1. Compliance with state and federal regulation needs to be ensured
52Global New Mobility Coalition
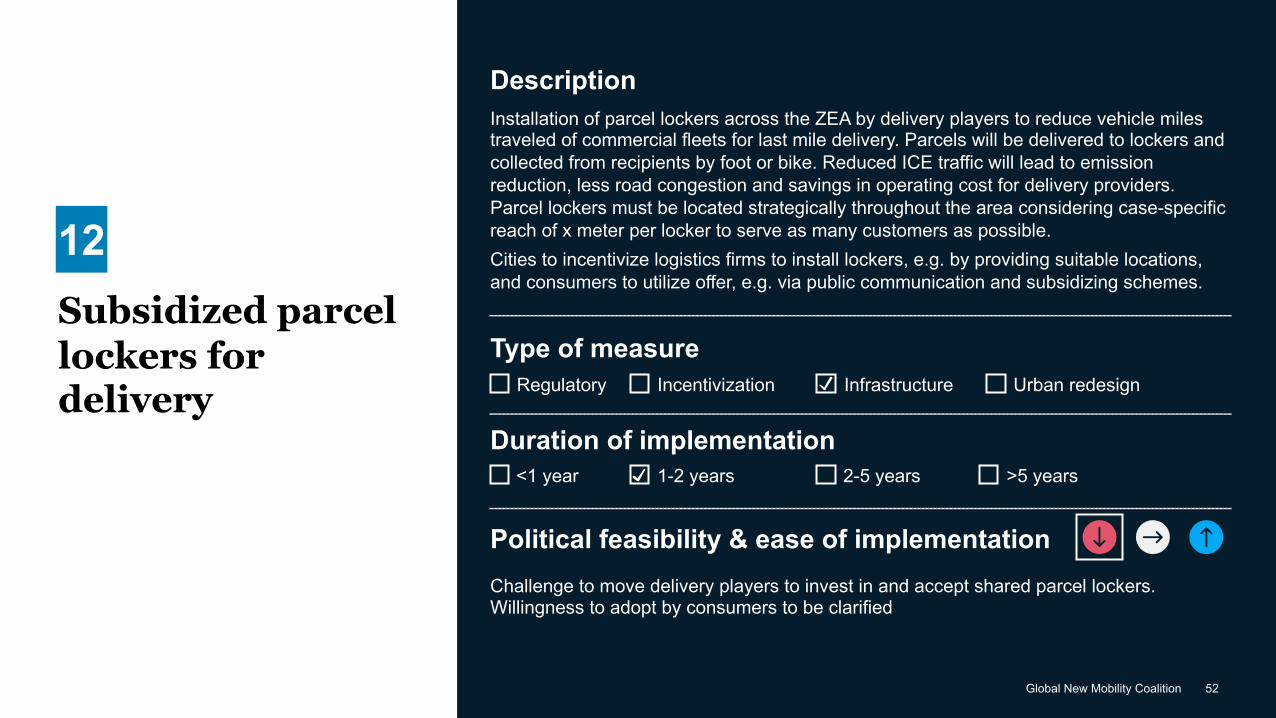
Subsidized parcel lockers for delivery
12
DescriptionInstallation of parcel lockers across the ZEA by delivery players to reduce vehicle miles traveled of commercial fleets for last mile delivery. Parcels will be delivered to lockers and collected from recipients by foot or bike. Reduced ICE traffic will lead to emission reduction, less road congestion and savings in operating cost for delivery providers. Parcel lockers must be located strategically throughout the area considering case-specific reach of x meter per locker to serve as many customers as possible. Cities to incentivize logistics firms to install lockers, e.g. by providing suitable locations, and consumers to utilize offer, e.g. via public communication and subsidizing schemes.
Duration of implementation<1 year 1-2 years 2-5 years >5 years
Challenge to move delivery players to invest in and accept shared parcel lockers. Willingness to adopt by consumers to be clarified
Type of measureRegulatory Infrastructure Urban redesignIncentivization
Political feasibility & ease of implementation
53Global New Mobility Coalition
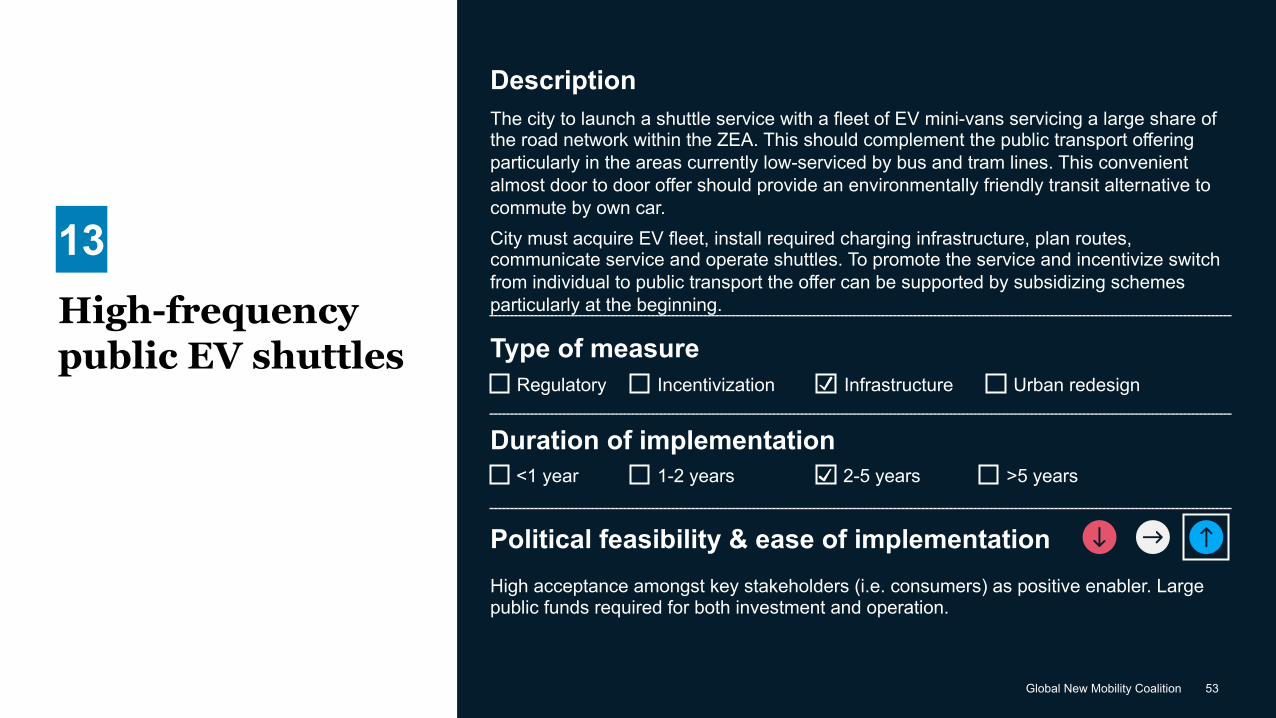
High-frequency public EV shuttles
13
DescriptionThe city to launch a shuttle service with a fleet of EV mini-vans servicing a large share of the road network within the ZEA. This should complement the public transport offering particularly in the areas currently low-serviced by bus and tram lines. This convenient almost door to door offer should provide an environmentally friendly transit alternative to commute by own car. City must acquire EV fleet, install required charging infrastructure, plan routes, communicate service and operate shuttles. To promote the service and incentivize switch from individual to public transport the offer can be supported by subsidizing schemes particularly at the beginning.
Duration of implementation<1 year 1-2 years 2-5 years >5 years
High acceptance amongst key stakeholders (i.e. consumers) as positive enabler. Large public funds required for both investment and operation.
Type of measureRegulatory Infrastructure Urban redesignIncentivization
Political feasibility & ease of implementation
54Global New Mobility Coalition
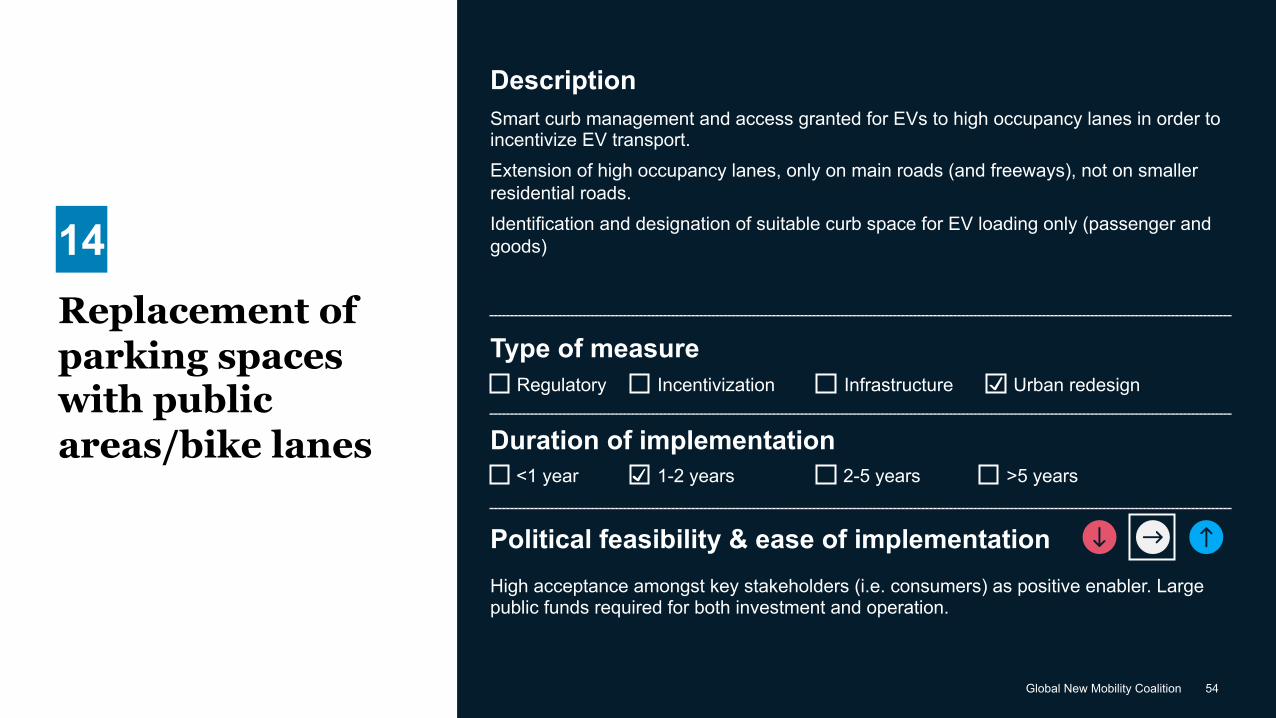
Replacement of parking spaces with public areas/bike lanes
14
DescriptionSmart curb management and access granted for EVs to high occupancy lanes in order to incentivize EV transport.Extension of high occupancy lanes, only on main roads (and freeways), not on smaller residential roads.Identification and designation of suitable curb space for EV loading only (passenger and goods)
Duration of implementation<1 year 1-2 years 2-5 years >5 years
High acceptance amongst key stakeholders (i.e. consumers) as positive enabler. Large public funds required for both investment and operation.
Type of measureRegulatory Infrastructure Urban redesignIncentivization
Political feasibility & ease of implementation
55Global New Mobility Coalition
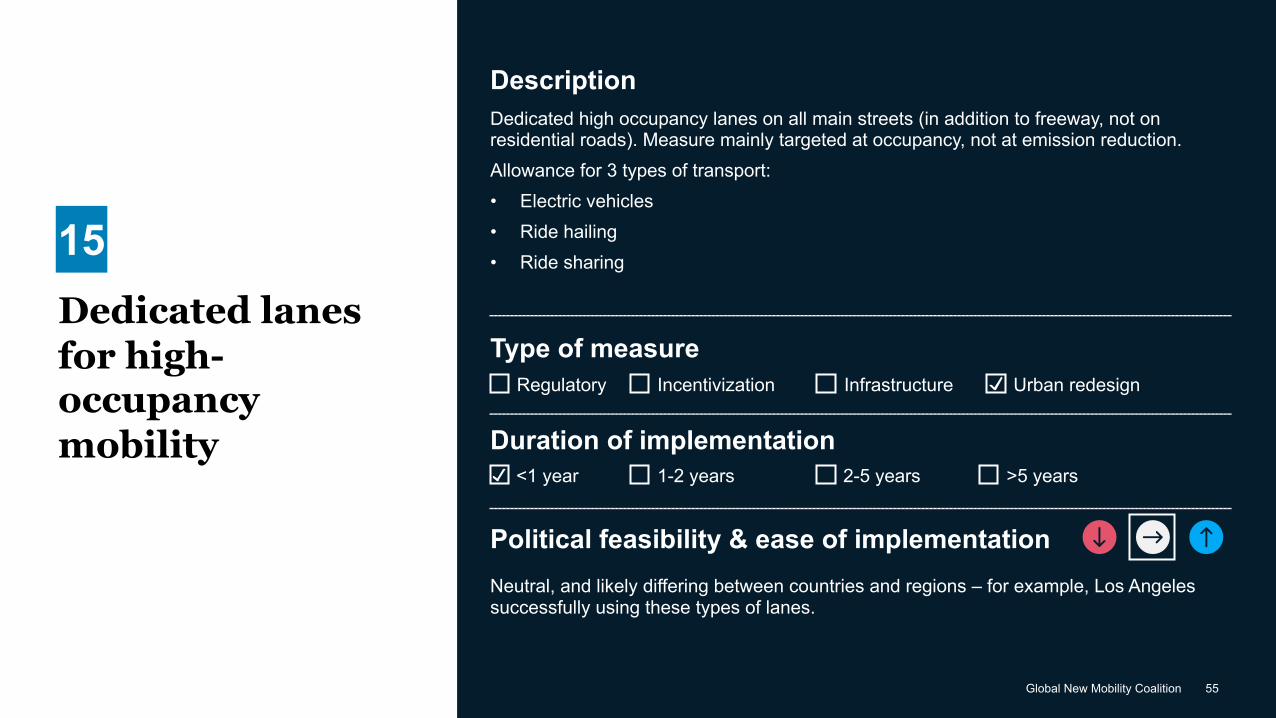
Dedicated lanes for high-occupancy mobility
15
DescriptionDedicated high occupancy lanes on all main streets (in addition to freeway, not on residential roads). Measure mainly targeted at occupancy, not at emission reduction.Allowance for 3 types of transport:• Electric vehicles• Ride hailing• Ride sharing
Duration of implementation<1 year 1-2 years 2-5 years >5 years
Neutral, and likely differing between countries and regions – for example, Los Angeles successfully using these types of lanes.
Type of measureRegulatory Infrastructure Urban redesignIncentivization
Political feasibility & ease of implementation
56Global New Mobility Coalition
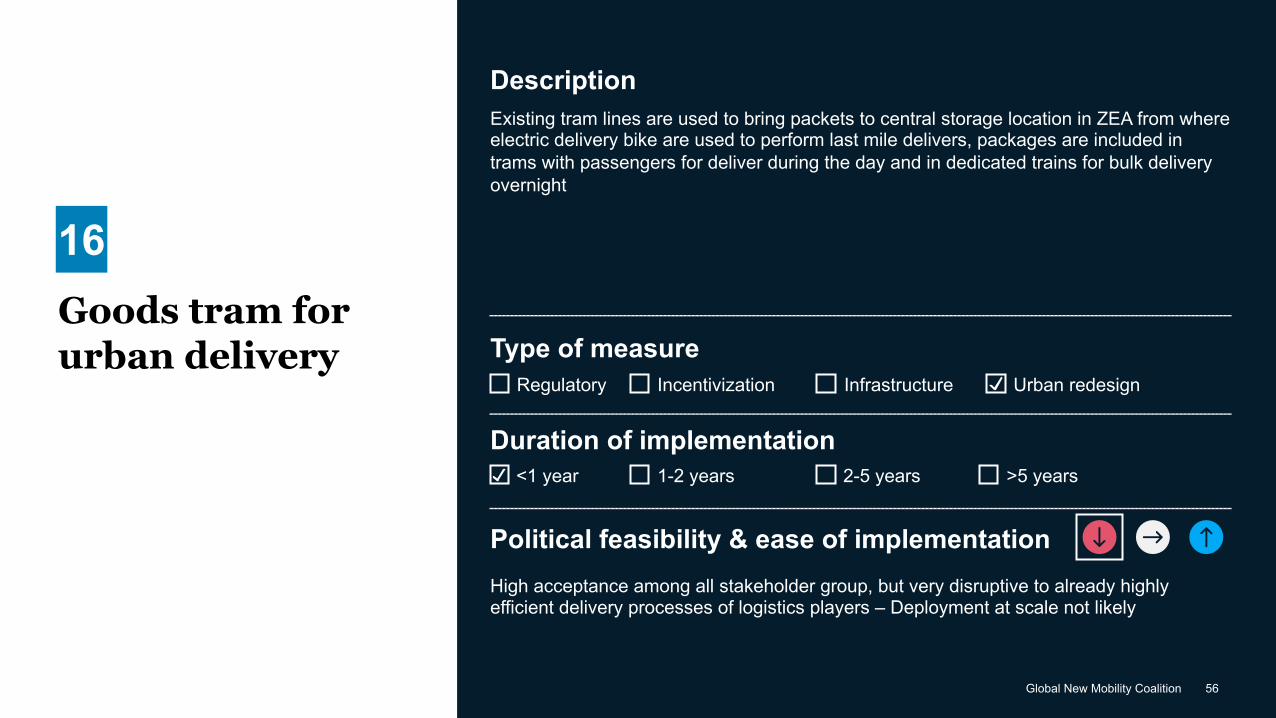
Goods tram for urban delivery
16
DescriptionExisting tram lines are used to bring packets to central storage location in ZEA from where electric delivery bike are used to perform last mile delivers, packages are included in trams with passengers for deliver during the day and in dedicated trains for bulk delivery overnight
Duration of implementation<1 year 1-2 years 2-5 years >5 years
High acceptance among all stakeholder group, but very disruptive to already highly efficient delivery processes of logistics players – Deployment at scale not likely
Type of measureRegulatory Infrastructure Urban redesignIncentivization
Political feasibility & ease of implementation

57Global New Mobility Coalition
#8Quantify and manage externalities
57Global New Mobility Coalition

58Global New Mobility Coalition
Various potential positive and negative "spillover effects" need to be considered
Spillover effects inside the zero-emission area
Spillover effects outside the zero-emission area
Potential gain of new business for local retail due to increased foot traffic vs. potential lost business from reduced commuter traffic
Pressure for automotive OEMs to offer cost competitive EVs but lower transportation cost and increased accessibility for consumers
Initially more complex commutes until efficient multi-modal offering is in place but less congestion once new infrastructure system runs smoothly
New revenue opportunities vs. unclear allocation of costs to different stakeholder groups
Potentially more traffic and hence increased congestion, higher noise pollution and reduced value of private real estate in areas surrounding the zero-emission area
More affordable private and fleet vehicles from reduced EV prices
Increased quality of living from safer streets, health benefits and increased community life
Easier extension of zero-emission area
Illustrative example
...
...

59Global New Mobility Coalition
#9Plan transition and timing for each measure
59Global New Mobility Coalition
60Global New Mobility Coalition
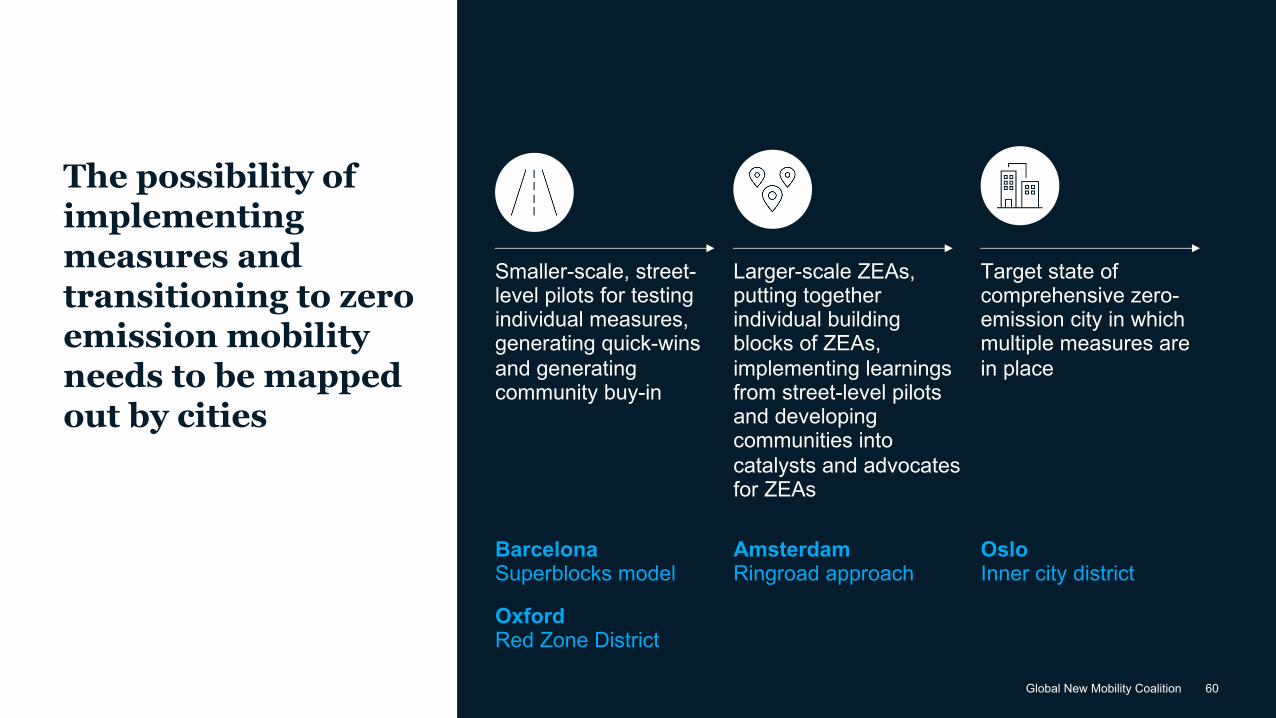
The possibility of implementing measures and transitioning to zero emission mobility needs to be mapped out by cities
Smaller-scale, street-level pilots for testing individual measures, generating quick-wins and generating community buy-in
Larger-scale ZEAs, putting together individual building blocks of ZEAs, implementing learnings from street-level pilots and developing communities into catalysts and advocates for ZEAs
Target state of comprehensive zero-emission city in which multiple measures are in place
BarcelonaSuperblocks model
OxfordRed Zone District
AmsterdamRingroad approach
OsloInner city district

61Global New Mobility Coalition
Zero-emission transition finance for different asset classes and zero-emission areas
Refueling & charging infrastructure 3
Enable financing of public refueling and charging stations to build the backbone for fast adoption of zero-emission vehicles
Zero-emission bus fleets1Accelerate the roll-out of zero-emission bus fleets in cities to decarbonize public transport and achieve cities' CO2 targets
Zero-emission last mile delivery fleets7Fast-track decarbonizing in light of increased online retail and clean city momentum via new last mile concepts and utilizing "pay per driven km" logic
Circular battery and fuel cell value chain6
Establish a clear circular recycling value chain incl. end-of life use in other applications
Zero-emission passenger car fleets 4
Drive guided adoption of urban zero-emission mobility to achieve faster decarbonization of passenger car fleets, espy. from fleet providers
Zero-emission Truck HD fleets 5Enable vehicle financing by taking on large upfront invest, thereby pushing vehicles in the market to establish track record and resolve trust issues
Zero-emission areas & urban redesign
2
Offer funds to allow cities to pilot zero-emission areas

62Global New Mobility Coalition
#10Learn from city case studies
62Global New Mobility Coalition
Global New Mobility Coalition 63
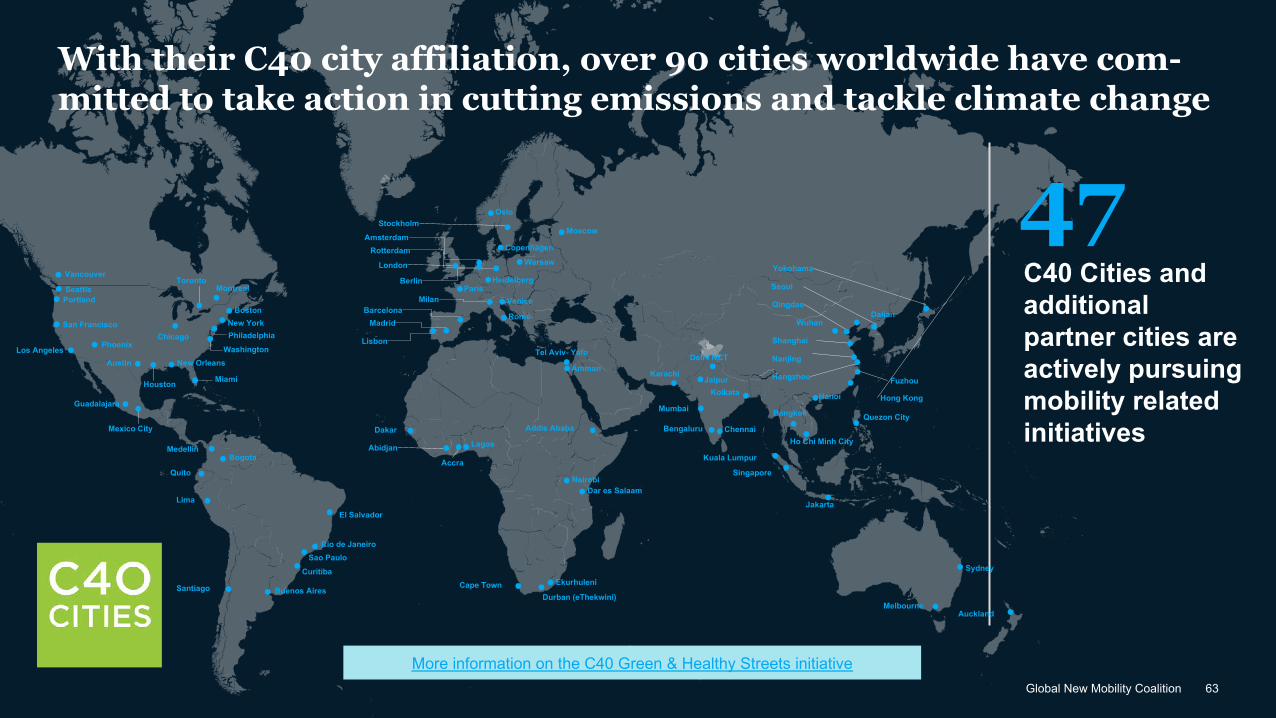
With their C40 city affiliation, over 90 cities worldwide have com-mitted to take action in cutting emissions and tackle climate change
C40 Cities and additional partner cities are actively pursuingmobility relatedinitiatives
47Barcelona
Madrid
Lisbon
Paris
Rome
VeniceMilan
HeidelbergBerlin
London
RotterdamAmsterdam
OsloStockholm
Copenhagen
Moscow
Warsaw
Dakar
Abidjan
Accra
Lagos
Cape TownDurban (eThekwini)
Ekurhuleni
Dar es SalaamNairobi
Addis Ababa
Amman
Tel Aviv- Yafo
KarachiJaipur
Mumbai
Kolkata
Bengaluru Chennai
Kuala Lumpur
Singapore
Jakarta
Ho Chi Minh City
Quezon CityBangkok
Hanoi Hong Kong
FuzhouHangzhou
Nanjing
Shanghai
Qingdao
Seoul
Yokohama
DalianWuhan
Sydney
MelbourneAuckland
Santiago
Lima
Quito
MedellínBogota
El Salvador
Rio de JaneiroSao Paulo
Curitiba
Buenos Aires
BostonNew YorkPhiladelphia
Washington
MontrealToronto
Chicago
Miami
New Orleans
Houston
Austin
Vancouver
SeattlePortland
San Francisco
Phoenix
Guadalajara
Mexico City
Delhi NCT
More information on the C40 Green & Healthy Streets initiative
Los Angeles

64Global New Mobility Coalition
#11 Learn from GNMC members
64Global New Mobility Coalition
65Global New Mobility Coalition
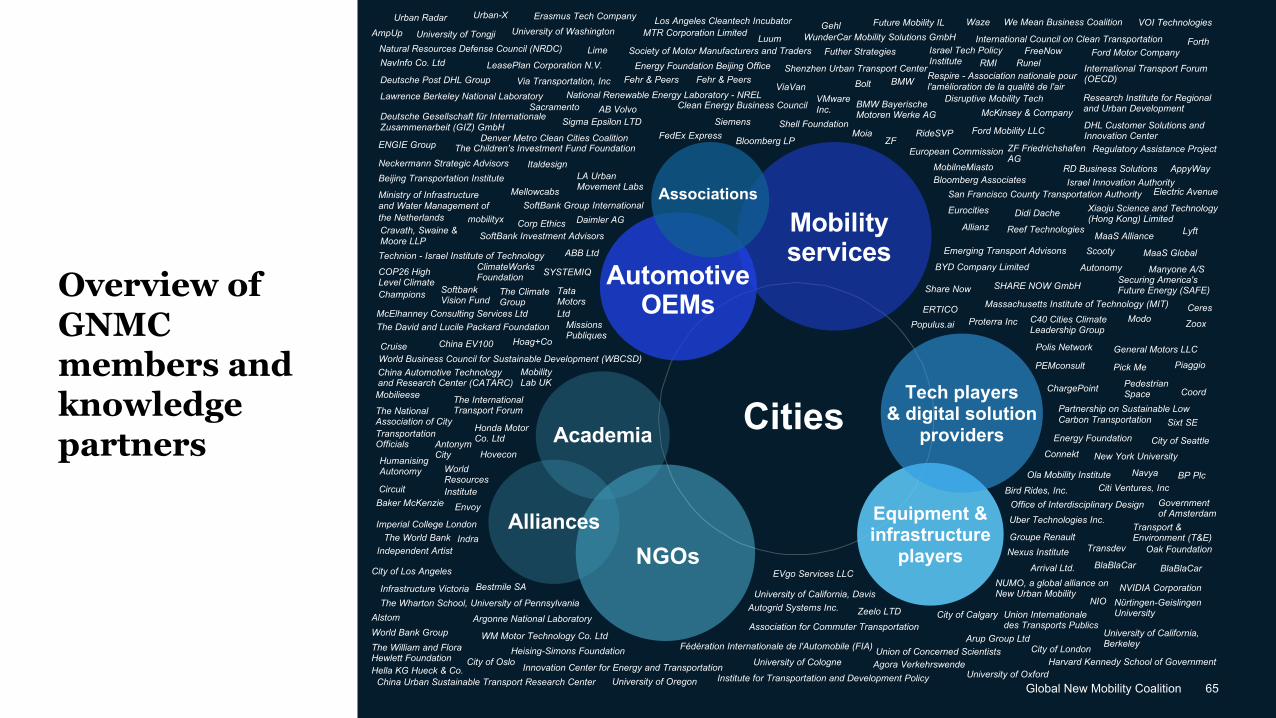
Overview of GNMC members and knowledge partners
Argonne National Laboratory
Denver Metro Clean Cities Coalition
Energy Foundation Beijing Office
COP26 High Level Climate Champions
Cravath, Swaine & Moore LLP
China EV100
Beijing Transportation Institute
Corp Ethics
Baker McKenzie
China Automotive Technology and Research Center (CATARC)
ENGIE Group
Circuit
Alstom
Independent Artist
Deutsche Post DHL Group BMW
Heising-Simons Foundation
Disruptive Mobility Tech
Bloomberg LP
AppyWay
DHL Customer Solutions and Innovation Center
Bloomberg Associates
Didi Dache
BYD Company Limited
ChargePoint
Autonomy
C40 Cities Climate Leadership Group
Connekt
BMW Bayerische Motoren Werke AG
Coord
Bird Rides, Inc. Citi Ventures, Inc
Arrival Ltd.
Association for Commuter Transportation
City of LondonAgora Verkehrswende
NGOs
Cities
Equipment & infrastructure
players
Mobility services
Automotive OEMs
Tech players & digital solution
providersAcademia
Associations
Alliances
Allianz
Bolt
Forth
Bestmile SA
Autogrid Systems Inc.
Ford Motor Company
ABB Ltd
Antonym City
Erasmus Tech Company
Fehr & Peers
AB Volvo
Ford Mobility LLC
AmpUp
BlaBlaCar
City of Seattle
Arup Group Ltd
Ceres
China Urban Sustainable Transport Research Center
City of Calgary
City of Los Angeles
City of Oslo
ClimateWorks Foundation
Clean Energy Business Council
Cruise
Daimler AG
Deutsche Gesellschaft für Internationale Zusammenarbeit (GIZ) GmbH
Electric Avenue
Emerging Transport Advisons
Energy Foundation
Envoy
ERTICO
Eurocities
European Commission
EVgo Services LLC
Fédération Internationale de l'Automobile (FIA)
FedEx Express
Harvard Kennedy School of Government
FreeNowFuther Strategies
Future Mobility ILGehl
General Motors LLC
Government of Amsterdam
Groupe Renault
Nürtingen-Geislingen University
Hella KG Hueck & Co.
Hoag+Co
Honda Motor Co. Ltd
HoveconHumanising Autonomy
Imperial College LondonIndra
Infrastructure Victoria
Innovation Center for Energy and TransportationInstitute for Transportation and Development Policy
International Council on Clean Transportation
International Transport Forum (OECD)
Israel Innovation Authority
Israel Tech Policy Institute
ItaldesignLA Urban Movement Labs
Lawrence Berkeley National Laboratory
LeasePlan Corporation N.V.Lime
Los Angeles Cleantech Incubator
Luum
LyftMaaS Alliance
MaaS Global
Massachusetts Institute of Technology (MIT)
Manyone A/S
McElhanney Consulting Services Ltd
McKinsey & Company
MellowcabsMinistry of Infrastructure and Water Management of the Netherlands
Missions Publiques
Mobilieese
Mobility Lab UK
mobilityx
MobilneMiasto
Modo
Moia
MTR Corporation Limited
National Renewable Energy Laboratory - NREL
Natural Resources Defense Council (NRDC)NavInfo Co. Ltd
Navya
Neckermann Strategic Advisors
New York University
Nexus Institute
NIO
NUMO, a global alliance on New Urban Mobility NVIDIA Corporation
Oak Foundation
BlaBlaCar
Office of Interdisciplinary Design
Ola Mobility Institute
Partnership on Sustainable Low Carbon Transportation
Pedestrian Space
PEMconsult PiaggioPick Me
Polis Network
Populus.ai Proterra Inc
RD Business Solutions
Reef Technologies
Regulatory Assistance Project
Research Institute for Regional and Urban Development
Respire - Association nationale pour l'amélioration de la qualité de l'air
RideSVP
RMI Runel
San Francisco County Transportation Authority
Scooty
Securing America's Future Energy (SAFE)Share Now SHARE NOW GmbH
Shell Foundation
Shenzhen Urban Transport Center
SiemensSigma Epsilon LTD
Sixt SE
Society of Motor Manufacturers and Traders
SoftBank Group International
SoftBank Investment Advisors
Softbank Vision Fund
SYSTEMIQ
Tata Motors Ltd
Technion - Israel Institute of Technology
The Children's Investment Fund Foundation
The Climate Group
The David and Lucile Packard Foundation
The International Transport ForumThe National
Association of City Transportation Officials
The Wharton School, University of Pennsylvania
The World Bank
The William and Flora Hewlett Foundation
Transdev
Transport & Environment (T&E)
Uber Technologies Inc.
Union Internationale des Transports Publics
Union of Concerned Scientists
University of California, Berkeley
University of California, Davis
University of Cologne
University of OregonUniversity of Oxford
University of Tongji University of WashingtonUrban Radar Urban-X
Via Transportation, Inc Fehr & PeersViaVan
VMware Inc.
VOI TechnologiesWaze We Mean Business Coalition
WM Motor Technology Co. LtdWorld Bank Group
World Business Council for Sustainable Development (WBCSD)
World Resources Institute
WunderCar Mobility Solutions GmbH
Xiaoju Science and Technology (Hong Kong) Limited
Zeelo LTD
ZFZF Friedrichshafen AG
Zoox
BP Plc
Sacramento

66Global New Mobility Coalition
#12Ensure community dialogue & buy-in
66Global New Mobility Coalition
67Global New Mobility Coalition
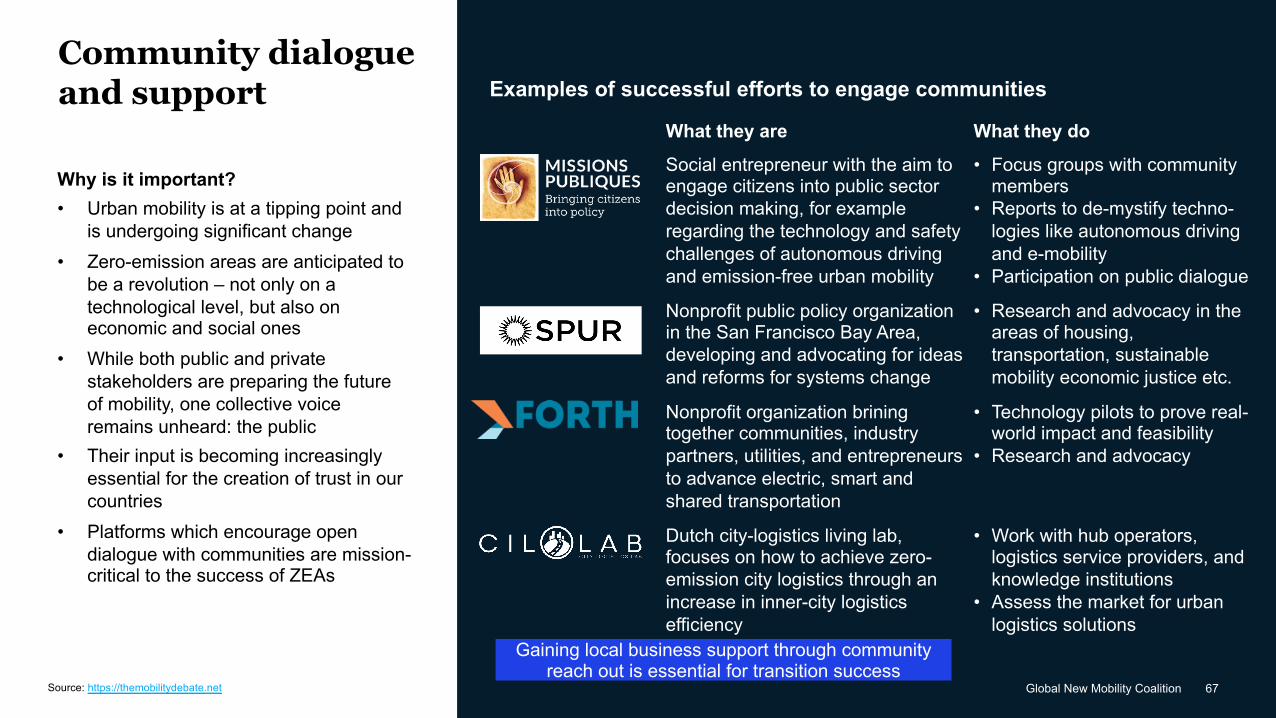
Community dialogue and support
Why is it important?• Urban mobility is at a tipping point and
is undergoing significant change• Zero-emission areas are anticipated to
be a revolution – not only on a technological level, but also on economic and social ones
• While both public and private stakeholders are preparing the future of mobility, one collective voice remains unheard: the public
• Their input is becoming increasingly essential for the creation of trust in our countries
• Platforms which encourage open dialogue with communities are mission-critical to the success of ZEAs
Source: https://themobilitydebate.net
Examples of successful efforts to engage communities
Social entrepreneur with the aim to engage citizens into public sector decision making, for example regarding the technology and safety challenges of autonomous driving and emission-free urban mobility
• Focus groups with community members
• Reports to de-mystify techno-logies like autonomous driving and e-mobility
• Participation on public dialogue
Nonprofit public policy organization in the San Francisco Bay Area, developing and advocating for ideas and reforms for systems change
• Research and advocacy in the areas of housing, transportation, sustainable mobility economic justice etc.
Nonprofit organization brining together communities, industry partners, utilities, and entrepreneurs to advance electric, smart and shared transportation
• Technology pilots to prove real-world impact and feasibility
• Research and advocacy
What they are What they do
Gaining local business support through community reach out is essential for transition success
Dutch city-logistics living lab, focuses on how to achieve zero-emission city logistics through an increase in inner-city logistics efficiency
• Work with hub operators, logistics service providers, and knowledge institutions
• Assess the market for urban logistics solutions

Contact
Maya Ben Dror, World Economic Forum LLC, [email protected] Loane, World Economic Forum LLC, [email protected]
Eric Hannon, McKinsey & Company, Inc., [email protected] Huber, McKinsey & Company, Inc., [email protected]
with knowledge support from McKinsey & Company and in collaboration with the World Economic Forum