Refueling assessment of a zero-emission container corridor ...
13
MARCH 2020 WORKING PAPER 2020-05 Refueling assessment of a zero-emission container corridor between China and the United States: Could hydrogen replace fossil fuels? Authors: Xiaoli Mao, Dan Rutherford, Liudmila Osipova, Bryan Comer Keywords: zero-emission vessels, hydrogen, fuel cells, shipping Introduction and background Container ships emitted 208 million tonnes of carbon dioxide (CO 2 ) in 2015 (Olmer, Comer, Roy, Mao, & Rutherford, 2017), about as much as the entire economy of Vietnam (Global Carbon Atlas, n.d.). The busiest container shipping lane in the world is the transpacific corridor, and in 2015, ships moved 24 million twenty-foot-equivalent unit (TEU) containers, 46% of the world total, across the Pacific Ocean (United Nations Conference on Trade and Development, 2016). Today, fossil fuels power container ships. In the future, if shipping is to decarbonize, zero-emission fuels must take their place. But long, deep-sea routes are particularly challenging to complete with zero-emission fuels, as these often contain less energy per unit volume than fossil fuels. Hydrogen has been used to power cars, buses, trucks, and ferries, but never a large container ship (Hall, Pavlenko, & Lutsey, 2018). 1 Viking has plans for a 1,400-person (passengers plus crew) hydrogen fuel cell cruise ship, and there are small- and medium- size hydrogen-powered container ship concepts, but none are on the water today. 2 That may change as the international shipping industry works to achieve the ambitions of the International Maritime Organization’s (IMO’s) initial greenhouse gas (GHG) strategy. Under the strategy, the IMO aims to cut international shipping’s GHG emissions by at 1 There are hydrogen applications for vessels operated inland and in short sea shipping. As summarized in Hall, Pavlenko, and Lutsey (2018), the Alstewasser was a 100-passenger hydrogen fuel cell ferry that was used in Hamburg, Germany, between 2009 and 2013. The Hydroville is a 16-passenger hydrogen-powered ferry in Belgium that launched in 2017. It burns hydrogen in an internal combustion engine, as Roy Campe explained in ICCT’s zero emission vessel workshop. See https://theicct.org/events/zero-emission-vessel-workshop-SF-2019 for details. 2 ZERO is a hydrogen-powered feeder ship concept introduced by Germanischer Lloyd at a presentation made at the Global Maritime Environmental Congress in 2012: https://www.greencarcongress.com/2012/09/ h2shipping-20120907.html Acknowledgments: This work is generously supported by the Heising Simons Foundation and Aspen Institute. The authors also thank Jennifer Callahan for her critical review, exactEarth for providing Automatic Identification System data, IHS Fairplay for providing ship characteristics data, and Chen Chen for help with the analysis. © 2020 INTERNATIONAL COUNCIL ON CLEAN TRANSPORTATION www.theicct.org [email protected] twitter @theicct
-
Upload
khangminh22 -
Category
Documents
-
view
2 -
download
0
Transcript of Refueling assessment of a zero-emission container corridor ...

MARCH 2020
WORKING PAPER 2020-05
Refueling assessment of a zero-emission container corridor between China and the United States: Could hydrogen replace fossil fuels?Authors: Xiaoli Mao, Dan Rutherford, Liudmila Osipova, Bryan Comer
Keywords: zero-emission vessels, hydrogen, fuel cells, shipping
Introduction and backgroundContainer ships emitted 208 million tonnes of carbon dioxide (CO2) in 2015 (Olmer, Comer, Roy, Mao, & Rutherford, 2017), about as much as the entire economy of Vietnam (Global Carbon Atlas, n.d.). The busiest container shipping lane in the world is the transpacific corridor, and in 2015, ships moved 24 million twenty-foot-equivalent unit (TEU) containers, 46% of the world total, across the Pacific Ocean (United Nations Conference on Trade and Development, 2016). Today, fossil fuels power container ships. In the future, if shipping is to decarbonize, zero-emission fuels must take their place. But long, deep-sea routes are particularly challenging to complete with zero-emission fuels, as these often contain less energy per unit volume than fossil fuels.
Hydrogen has been used to power cars, buses, trucks, and ferries, but never a large container ship (Hall, Pavlenko, & Lutsey, 2018).1 Viking has plans for a 1,400-person (passengers plus crew) hydrogen fuel cell cruise ship, and there are small- and medium-size hydrogen-powered container ship concepts, but none are on the water today.2 That may change as the international shipping industry works to achieve the ambitions of the International Maritime Organization’s (IMO’s) initial greenhouse gas (GHG) strategy. Under the strategy, the IMO aims to cut international shipping’s GHG emissions by at
1 There are hydrogen applications for vessels operated inland and in short sea shipping. As summarized in Hall, Pavlenko, and Lutsey (2018), the Alstewasser was a 100-passenger hydrogen fuel cell ferry that was used in Hamburg, Germany, between 2009 and 2013. The Hydroville is a 16-passenger hydrogen-powered ferry in Belgium that launched in 2017. It burns hydrogen in an internal combustion engine, as Roy Campe explained in ICCT’s zero emission vessel workshop. See https://theicct.org/events/zero-emission-vessel-workshop-SF-2019 for details.
2 ZERO is a hydrogen-powered feeder ship concept introduced by Germanischer Lloyd at a presentation made at the Global Maritime Environmental Congress in 2012: https://www.greencarcongress.com/2012/09/h2shipping-20120907.html
Acknowledgments: This work is generously supported by the Heising Simons Foundation and Aspen Institute. The authors also thank Jennifer Callahan for her critical review, exactEarth for providing Automatic Identification System data, IHS Fairplay for providing ship characteristics data, and Chen Chen for help with the analysis.
© 2020 INTERNATIONAL COUNCIL ON CLEAN TRANSPORTATION
www.theicct.org
twitter @theicct

2 ICCT WORKING PAPER 2020-05 | ZERO-EMISSION CONTAINER CORRIDOR BETWEEN CHINA AND THE UNITED STATES
least 50% by 2050 compared to 2008 levels, and to phase out GHGs as soon as possible. The IMO is set to revise the strategy in 2023, and that could mean even stronger decarbonization targets.
Achieving even the minimum ambition of IMO’s initial strategy will require using new technologies and fuels to power ships (Rutherford & Comer, 2018). In July 2019, the ICCT hosted an international workshop on zero-emission vessel technology to discuss pathways and barriers to zero-emission international shipping.3 Participants identified hydrogen fuel cells as one promising technology. At that workshop, Dr. Joseph Pratt showed how fuel cells powered by liquid hydrogen could be scaled up to power even the largest container ships. The underlying research is presented in Minnehan and Pratt (2017). Comer (2019) applied Minnehan and Pratt’s (2017) methods to determine whether hydrogen could be used for Arctic shipping and concluded that hydrogen is the most promising solution for zero-carbon, long-range Arctic shipping. While current barriers to hydrogen use include limited supply, limited fueling infrastructure, and higher costs relative to fossil fuels, focused research and development and policy interventions could lower these barriers over time.
This paper analyzes the energy demand and refueling needs of a fleet of container ships servicing a shipping corridor between China and the United States in order to examine the feasibility of powering the ships with hydrogen fuel cells.4 As there is currently no hydrogen refueling infrastructure along this route, it also identifies ports where such infrastructure could be developed. We start by assessing the baseline energy demand for container ships operating between the busiest port clusters of the two countries—the Pearl River Delta (PRD) region in China and the San Pedro Bay (SPB) area in the United States. This is hereafter referred to as the PRD–SPB corridor. We model the fuel demand and space requirements of those ships when powered by hydrogen, stored as a cryogenic liquid and used in a fuel cell, instead of heavy fuel oil (HFO) in an internal combustion engine. Then, given the ships’ available space for fuel and propulsion equipment, we calculate what share of legs and voyages could be completed with hydrogen. Subsequently, we evaluate two potential options to improve the attainment rate of ships in this corridor powered by hydrogen. One option is to sacrifice some cargo space to put more hydrogen fuel on board. The other is to allow more frequent refueling en route.
Our main finding is that 99% of the voyages made along the PRD–SPB corridor can be powered by hydrogen instead of fossil fuels, with only minor changes to ships’ fuel capacity or operations. Specifically, this could be achieved by replacing 5% of certain ships’ cargo space with more hydrogen fuel, or by adding one additional port call to refuel hydrogen en route. Importantly, we also find that 43% of all voyages could be completed without adding any fuel capacity or extra port calls.
The rest of this paper is organized as follows. The following section explains the data and methodology used to analyze the refueling needs of container ships traveling the PRD–SPB corridor. Subsequently, we discuss the results, and then the conclusion identifies potential areas for further research.
Data and methodologyA fleet of container ships serviced the PRD–SPB corridor in 2015. Each ship completed one or more voyages along this corridor, and each of these voyages was comprised of one or more legs. As ships sail, they broadcast their position and speed to land-based and satellite receivers. We used this data to isolate and map voyages in the PRD–SPB corridor.
3 ICCT held an international workshop on zero-emission vessels in July 2019. More details can be found at https://theicct.org/events/zero-emission-vessel-workshop-SF-2019
4 Refueling, or bunkering, describes operations to put more fuel into a ship so that it can continue its journey.

3 ICCT WORKING PAPER 2020-05 | ZERO-EMISSION CONTAINER CORRIDOR BETWEEN CHINA AND THE UNITED STATES
Ships call interim ports at the end of each leg until they arrive at their final destination. Once a leg or a voyage is completed, we refer to it as an attained leg or voyage. We define a voyage as one trip between the PRD and SPB ports completed by one specific ship. Each voyage is one way and may include interim port calls before arriving at PRD or SPB. A leg is defined as one continuous trip between two ports; ships do not stop during a leg. Finally, attainment rate is defined as the share of attained legs or voyages using hydrogen with a fuel cell instead of fossil fuel with an internal combustion engine.
Using our Systematic Assessment of Vessel Emissions (SAVE) model, we calculated how much energy ships used to complete their voyages and whether enough liquid hydrogen could be stored on board each ship to meet its energy needs. Most of the options for synthetic fuels for shipping, including methanol, ammonia, and hydrogen, contain less energy per unit volume than HFO (Horvath et al., 2018). That means that switching to those fuels will reduce the range for a given fuel tank volume and conversion efficiency. For this reason, a key measure of the feasibility of zero-emission shipping is whether ships can carry enough fuel to service existing legs and voyages. To assess this, we calculated attainment rates for legs and voyages via the following steps. Each of these steps is then discussed briefly below.
1. Identifying ships that operated along the PRD–SPB corridor in 2015, including the exact legs and voyages completed and ports visited.
2. Estimating the baseline energy demand for those legs and voyages when they use fossil fuels.
3. Modeling the volume of liquid hydrogen fuel needed for those legs and voyages and comparing it to the space that could be available for liquid hydrogen fuel on each ship.
4. Assessing the baseline attainment rates as the percentage of legs and voyages that could be met by hydrogen-powered ships without replacing cargo space with fuel or adding refueling stops en route.
5. Evaluating two options, replacing cargo space with fuel space and more frequent refueling, to determine if attainment rates could be improved.
Voyage identification and baseline energy demandShips broadcast their positions and speeds every few seconds through a device called Automatic Identification System (AIS). We first isolated AIS data that appeared over the North Pacific Ocean in 2015. We then used ICCT’s SAVE model to identify when ships were at berth. The nearest port was defined as the ship’s origin for that leg. When the ship left the port, we tracked it until it came to rest at berth at a new port. That became the destination for the current leg and the origin for the next leg. We linked consecutive legs sequentially until the ship arrived at either the PRD port or SPB port. Any leg sequence that originated or ended at either the PRD or SPB port was classified a voyage along the PRD–SPB corridor.
We used the SAVE model to estimate the amount of energy needed for each leg for each container ship in 2015, and this served as the baseline. The SAVE model uses a bottom-up methodology to estimate hourly energy demand for each individual ship (Olmer et al., 2017). The energy demand for hours spent on each leg is summarized as Erequired for that leg.
Liquid hydrogen fuel volume needed and available fuel volume on board each shipTo meet the energy requirement for each leg, a ship has to consume a greater volume of liquid hydrogen than fossil fuels. This is because hydrogen has a lower volumetric

4 ICCT WORKING PAPER 2020-05 | ZERO-EMISSION CONTAINER CORRIDOR BETWEEN CHINA AND THE UNITED STATES
energy density. The equivalent volume of liquid hydrogen to meet the same energy input requirement is calculated as follows:
Equation 1
VLH2 need_l =
Erequired_l
DLH2 × ηLH2
× fuel margin
Where:
VLH2 need_l =
Liquid hydrogen fuel system volume needed to provide enough energy to complete leg l, in m3
Erequired_l = Energy output required to complete leg l, in kWh;
DLH2 = Volumetric density of a liquid hydrogen fuel system, 1,332 kWh/m3
(Comer, 2019)a
ηLH2 = Efficiency of hydrogen fuel cells to turn liquid hydrogen into energy, which we
assume to be 54% (Comer, 2019)
Fuel margin = Ships usually carry more fuel than needed onboard. We assume a fuel margin of 1.2 for all ships.
[a] Consistent with Minnehan and Pratt (2017), we assume that the density of a liquid hydrogen fuel cell system is 40 kg/m3, even though the density of liquid hydrogen is 71 kg/m3. This is to account for the needed space for insulated tanks and other fuel system components. Multiplying the density of the liquid hydrogen fuel system of 40 kg/m3 by hydrogen’s energy density of 33.3 kWh/kg (Hall et al., 2018), we arrive at 1,332 kWh/m3.
The available space for fuel carriage on board each ship is limited. We estimated the available space for a liquid hydrogen fuel system using Comer’s (2019) method, as follows:
Equation 2
VLH2_capacity_i = 5 × Ve_i – 2 × VFC_i + Vf _i
Where:
VLH2_capacity_i = Available space for liquid hydrogen fuel system on board ship i, in m3
Ve_i = Volume taken up by existing engine on board ship i, in m3, (see Equation 3)
VFC_i =Volume of the fuel cell system needed to provide an equivalent output power as the existing main engine on board ship i, in m3
Vf _i = Volume taken up by the existing fuel tanks on board ship ia, in m3
[a] We have access to a ship’s fuel tank volume and main engine power through the ship’s registry information made commercially available by IHS.
We estimated the volume of existing internal combustion engines using Equation 3 and then estimated the volume needed for a hydrogen fuel cell system in Equation 4. Both are based on statistical relationships between engine size and power established in Minnehan and Pratt (2017):
Equation 3
Ve_i = PME_i – 1906
54.066Where:
PME_i = Main engine power for ship i4, in kW
Equation 4
VFC_i = PME_i – 73.331
55.944
5 ICCT WORKING PAPER 2020-05 | ZERO-EMISSION CONTAINER CORRIDOR BETWEEN CHINA AND THE UNITED STATES
Assessing baseline attainment rates and ways to improve them For each leg completed by each ship, we compared VLH2 _need_l against VLH2 _capacity_i . If VLH2 _capacity_i is greater than VLH2
need_l , the leg is considered attained. If all legs associated with a voyage are attained, the voyage is considered attained.
We also analyzed two options to improve attainment rates. One is to substitute some cargo space in order to carry more liquid hydrogen. Assuming that one TEU has a volume of 38 m3, we modeled scenarios substituting 2% or 5% of cargo space with hydrogen.5 We then reevaluated whether the ship could complete a given leg or voyage.
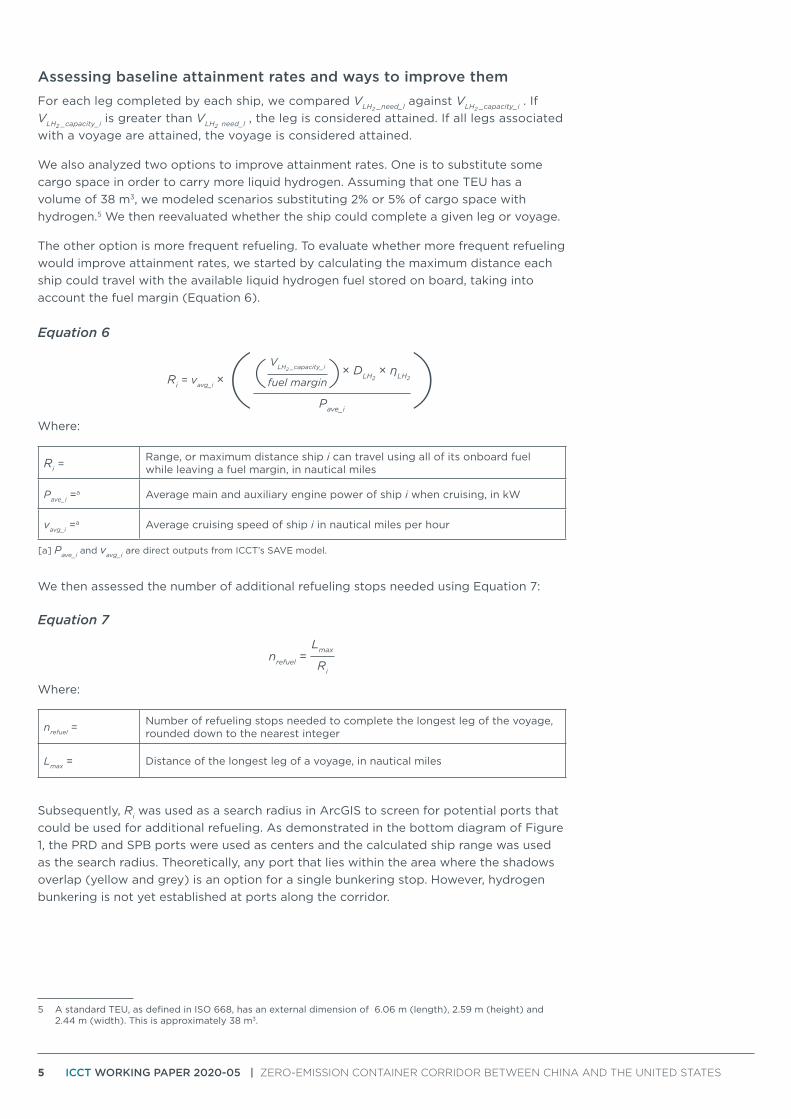
The other option is more frequent refueling. To evaluate whether more frequent refueling would improve attainment rates, we started by calculating the maximum distance each ship could travel with the available liquid hydrogen fuel stored on board, taking into account the fuel margin (Equation 6).
Equation 6
Ri = vavg_i × (Pave_i
× DLH2 × ηLH2( VLH2 _capacity_i
fuel margin) )Where:
Ri = Range, or maximum distance ship i can travel using all of its onboard fuel while leaving a fuel margin, in nautical miles
Pave_i =a Average main and auxiliary engine power of ship i when cruising, in kW
vavg_i =a Average cruising speed of ship i in nautical miles per hour
[a] Pave_i and vavg_i are direct outputs from ICCT’s SAVE model.
We then assessed the number of additional refueling stops needed using Equation 7:
Equation 7
nrefuel = Lmax
Ri
Where:
nrefuel = Number of refueling stops needed to complete the longest leg of the voyage, rounded down to the nearest integer
Lmax = Distance of the longest leg of a voyage, in nautical miles
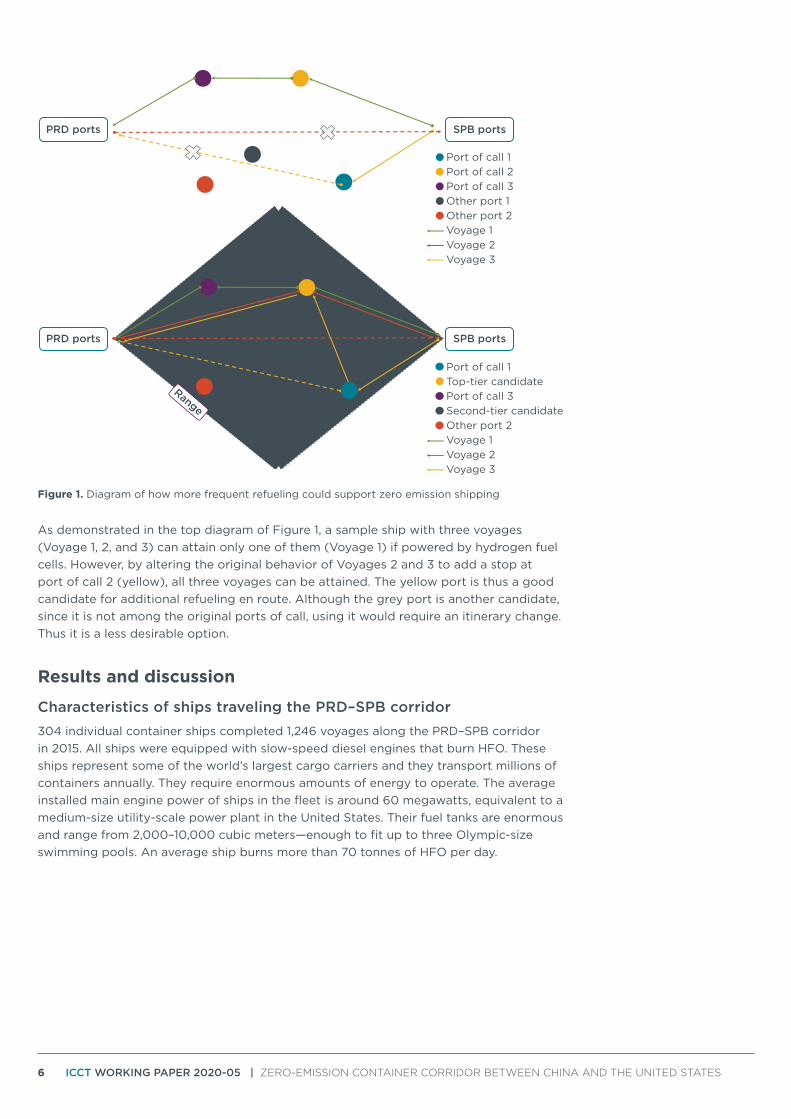
Subsequently, Ri was used as a search radius in ArcGIS to screen for potential ports that could be used for additional refueling. As demonstrated in the bottom diagram of Figure 1, the PRD and SPB ports were used as centers and the calculated ship range was used as the search radius. Theoretically, any port that lies within the area where the shadows overlap (yellow and grey) is an option for a single bunkering stop. However, hydrogen bunkering is not yet established at ports along the corridor.
5 A standard TEU, as defined in ISO 668, has an external dimension of 6.06 m (length), 2.59 m (height) and 2.44 m (width). This is approximately 38 m3.
6 ICCT WORKING PAPER 2020-05 | ZERO-EMISSION CONTAINER CORRIDOR BETWEEN CHINA AND THE UNITED STATES
Range
Port of call 1Top-tier candidatePort of call 3Second-tier candidateOther port 2Voyage 1Voyage 2Voyage 3
PRD ports SPB ports
SPB portsPRD ports
Port of call 1Port of call 2Port of call 3Other port 1Other port 2Voyage 1Voyage 2Voyage 3
Figure 1. Diagram of how more frequent refueling could support zero emission shipping
As demonstrated in the top diagram of Figure 1, a sample ship with three voyages (Voyage 1, 2, and 3) can attain only one of them (Voyage 1) if powered by hydrogen fuel cells. However, by altering the original behavior of Voyages 2 and 3 to add a stop at port of call 2 (yellow), all three voyages can be attained. The yellow port is thus a good candidate for additional refueling en route. Although the grey port is another candidate, since it is not among the original ports of call, using it would require an itinerary change. Thus it is a less desirable option.
Results and discussion
Characteristics of ships traveling the PRD–SPB corridor304 individual container ships completed 1,246 voyages along the PRD–SPB corridor in 2015. All ships were equipped with slow-speed diesel engines that burn HFO. These ships represent some of the world’s largest cargo carriers and they transport millions of containers annually. They require enormous amounts of energy to operate. The average installed main engine power of ships in the fleet is around 60 megawatts, equivalent to a medium-size utility-scale power plant in the United States. Their fuel tanks are enormous and range from 2,000–10,000 cubic meters—enough to fit up to three Olympic-size swimming pools. An average ship burns more than 70 tonnes of HFO per day.

7 ICCT WORKING PAPER 2020-05 | ZERO-EMISSION CONTAINER CORRIDOR BETWEEN CHINA AND THE UNITED STATES
Table 1. Selected characteristics of the container ships servicing PRD–SPB corridor
TEU Mean length (m) Number of shipsMean installed main engine power (kW)
1,000 – 1,999 172 1 13,000
2,000 – 2,999 206 3 21,000
3,000 – 4,999 274 31 39,000
5,000 – 7,999 293 83 57,000
8,000 – 11,999 339 156 64,000
12,000 – 14,500 366 30 72,000
Whole fleet 320 304 60,000
Traffic pattern of the PRD–SPB corridorAmong the 1,246 voyages completed in 2015, 271, or 22%, were nonstop. The majority of nonstop voyages, 90%, were completed by medium- or large-size ships of between 5,000 and 11,999 TEUs. Most voyages had multiple legs. On average, ships called two ports during one voyage, and thus there were three legs to the voyage. A typical nonstop voyage was approximately 6,600 nautical miles (nm), but ships with multiple interim port calls still travelled long-range legs of 6,000 nm–6,600 nm, which means those interim ports were close to either their origin or destination (Table 2).
Table 2. Voyages serviced by container ships along the PRD–SPB corridor
TEU Number of shipsTotal number
of voyagesNumber of
nonstop voyagesMean number of legs per voyage
Mean distance of longest leg, nautical miles
1,000 – 1,999 1 1 0 5 3,100
2,000 – 2,999 3 3 1 2 6,600
3,000 – 4,999 31 41 5 4 6,000
5,000 – 7,999 83 394 103 3 6,400
8,000 – 11,999 156 699 142 3 6,400
12,000 – 14,500 30 108 20 2 6,500
Total 304 1,246 271 3 6,300
In total, the fleet used 75 ports of call. Besides the origin and destination ports, the most visited port in China was the Port of Kaohsiung with 12% of all stops; additionally, the most frequented interim port in the United States was the Port of Oakland with 9% of all stops. The ports of call commonly used outside of China and the United States were ports in Japan, South Korea, and Russia.
Although the 1,246 voyages were different in many ways, we do see some general patterns along the PRD–SPB corridor. We merged all voyages into five spatial clusters, and this is illustrated in Figure 2, where a thicker line identifies a representative route on the PRD–SPB corridor for each cluster.6 All northward routes were in the two largest clusters, clusters 1 and 2, which contain 62% of ships servicing 60% of all voyages. A typical nonstop voyage of the two clusters averaged around 6,500 nm. Due to the Earth’s curvature, the great circle distance on the PRD–SPB route tends to be shorter toward northern latitudes. Still, we do observe some ships taking the southern voyage, which is typically 1,000 nm longer (red cluster). These results are all summarized in Table 3.
6 This is done using QGIS’s spatial cluster analysis tool. More information can be found here: https://docs.qgis.org/2.8/en/docs/training_manual/vector_analysis/network_analysis.html.

8 ICCT WORKING PAPER 2020-05 | ZERO-EMISSION CONTAINER CORRIDOR BETWEEN CHINA AND THE UNITED STATES
Figure 2. Cluster analysis of representative routes in the PRD–SPB corridor
Table 3. Characteristics of the voyages in the PRD–SPB corridor aggregated in the spatial clusters
Cluster Color on the
mapNumber of
shipsTotal number
of voyagesNon-stopvoyages
Length of the representative route,
nautical miles
1 Green 75 287 49 6,500
2 Purple 113 465 111 6,400
3 Yellow 60 298 62 6,500
4 Blue 29 92 19 6,400
5 Red 25 102 30 7,500
Total 304 1,246 271 —
Refueling needs assessmentIf ships traveling along the PRD–SPB corridor were powered by hydrogen fuel cells, there would need to be enough hydrogen on board to support a continuous trip between two ports of call. We found that of the 3,624 legs completed by the 304 ships in the fleet, 2,639 or 79% of them could also be attained if the ship were powered by hydrogen fuel cells. This is without increasing the fuel tank volume or adding more ports of call. However, for voyages, the attainment rate drops significantly, to 43%. This is because most of the attained legs are short and most voyages would contain at least one long-range leg.
Interestingly, medium-size container ships are more capable of servicing this corridor when powered by hydrogen. As detailed in Table 4, smaller container ships of fewer than 3,000 TEUs and larger ones of more than 12,000 TEUs do not have enough space for large enough fuel tanks to complete long-distance legs unless they replace some cargo space with fuel or add an additional port of call.

9 ICCT WORKING PAPER 2020-05 | ZERO-EMISSION CONTAINER CORRIDOR BETWEEN CHINA AND THE UNITED STATES
Table 4. Attainment rate for hydrogen-powered ships by cargo capacity
TEU capacityVolume of available
fuel storage (m3)
Volume of liquid hydrogen fuel needed
for the longest leg (m3)
Attainment rate
Leg Voyage
1,000 – 1,999 2,400 3,200 60% 0%
2,000 – 2,999 3,400-4,700 5,500-8,000 57% 0%
3,000 – 4,999 5,500-10,000 2,600-26,000 85% 39%
5,000 – 7,999 8,700-16,000 6,800-21,000 79% 40%
8,000 – 11,999 9,400-19,000 7,400-29,000 80% 48%
12,000 – 14,500 15,000-18,000 14,000-29,000 66% 25%
Mean 13,000 16,000 79% 43%
Finally, the more stops along a voyage, the easier it is for ships to carry enough hydrogen to complete each leg and the entire voyage. As related in Table 5, below, nonstop voyages have the lowest attainment rates and those with multiple ports of call are easier for hydrogen-fueled ships to service. This is simply due to the fact that the more fragmented the voyage, the shorter the distance a ship has to travel continuously and the more opportunities there are to refuel.
Table 5. Attainment rate broken down by fragmentation of voyages
Voyage type Maximum leg distance (nm) Attainment rate
Nonstop 6,600 28%
Two legs 6,200 32%
Three legs 5,900 43%
More than three legs 5,300 65%
Options to improve attainment ratesThe number of voyages that can be attained by hydrogen-powered ships can be increased above 43% by replacing some cargo space with fuel. As shown in Table 6, replacing 2% of cargo space with fuel, or about 120 containers for a medium-size container ship, the voyage attainment rate doubles to 86%. If 5% of the ships’ cargo space, or about 300 containers, can be substituted for fuel storage, the service fleet can complete almost all voyages.
Table 6. Attainment rates under three scenarios where some cargo space is replaced by fuel
Cargo space replaced by
fuel
Attained Total Attainment rate
Legs Voyages Legs Voyages Legs Voyages
0% 2,639 536 3,353 1,246 79% 43%
2% 3,182 1,075 3,353 1,246 95% 86%
5% 3,348 1,241 3,353 1,246 99% 99%
Alternatively, ships can refuel more often. As detailed in Table 7, we found that of the 304 container ships studied, 69 of them—23%—can attain all of their 2015 voyages without replacing cargo space with fuel and without extra refueling stops. By calling one additional port to refuel, all but three voyages made by three ships could be attained. This is illustrated in Figure 3.

10 ICCT WORKING PAPER 2020-05 | ZERO-EMISSION CONTAINER CORRIDOR BETWEEN CHINA AND THE UNITED STATES
Table 7. Attainment rates with additional port stops for refueling
Additional ports of call
Attained Total % attainedShips with 100% attainment rateLegs Voyages Legs Voyages Legs Voyages
0 2,639 536 3,353 1,246 79% 43% 69
1 3,349 1,243 3,353 1,246 99% 99% 301
2 3,353 1,246 3,353 1,246 100% 100% 304
0% 20% 40% 60% 80% 100%
Attainment rate
0% 20% 40% 60% 80% 100%
Attainment rate
Voyages
Legs
Voyages
Legs
Voyages
Legs
5%2%
0%
Car
go
sp
ace
rep
lace
men
t ra
te
Voyages
Legs
Voyages
Legs
Voyages
Legs
21
0A
dd
itio
nal s
top
s fo
r re
fuel
ing
Figure 3. Attainment rates of trips, by legs and voyages, along the PRD–SPB corridor when replacing fossil fuels with hydrogen. Legs and voyages were defined in the previous section.
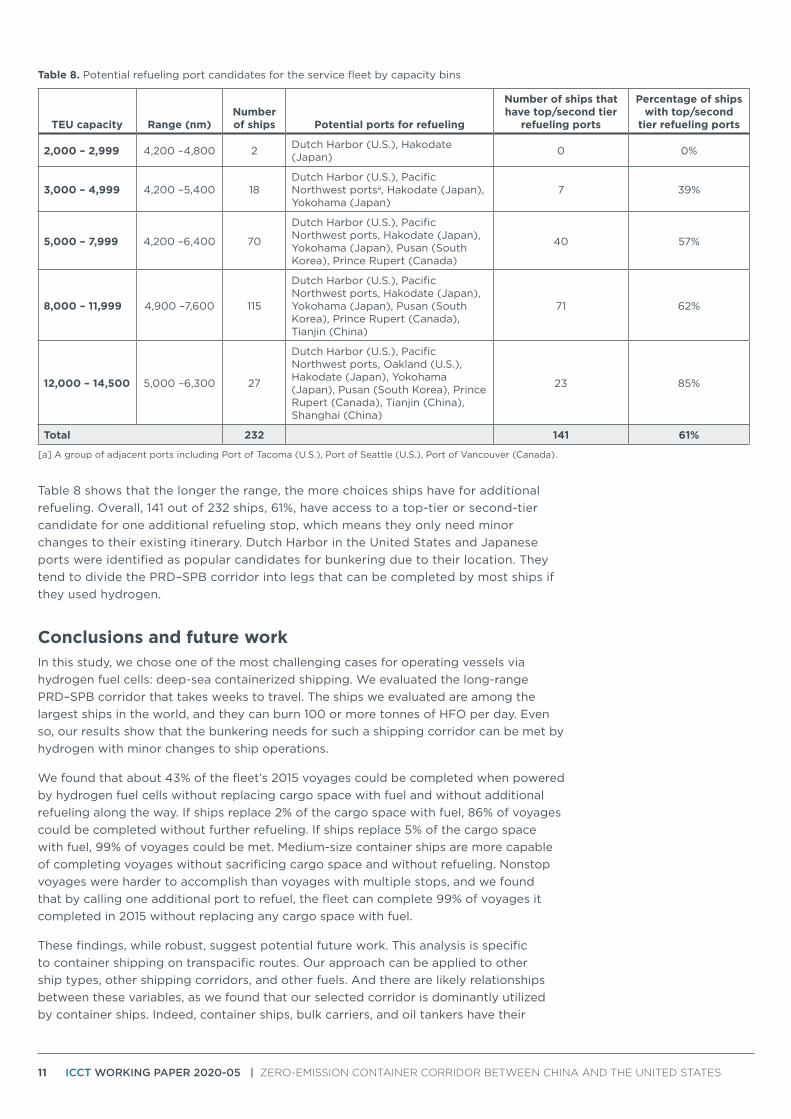
For the 232 container ships that need only one additional refuel to attain all their voyages, we screened for potential ports and broke them down by three tiers. A top-tier candidate is a port that lies within the region where the shadows in Figure 1 overlap and already served this ship during some other voyage in 2015 (e.g., the yellow port in Figure 1). A second-tier candidate is a port that lies within the overlapping region, but did not serve the ship in 2015; nonetheless, it is close to the route the ship operates along (e.g., the grey port in Figure 1).7 A third-tier candidate is any other port that lies within the overlapping region that does not meet the above two criteria.
The higher the tier, the less disruption the additional call should cause to the ship’s original itinerary. The results are presented in Table 8.
7 We qualitatively assessed the ports that are geographically close to the ship’s original voyage.
11 ICCT WORKING PAPER 2020-05 | ZERO-EMISSION CONTAINER CORRIDOR BETWEEN CHINA AND THE UNITED STATES
Table 8. Potential refueling port candidates for the service fleet by capacity bins
TEU capacity Range (nm)Number of ships Potential ports for refueling
Number of ships that have top/second tier
refueling ports
Percentage of ships with top/second
tier refueling ports
2,000 – 2,999 4,200 –4,800 2 Dutch Harbor (U.S.), Hakodate (Japan) 0 0%
3,000 – 4,999 4,200 –5,400 18Dutch Harbor (U.S.), Pacific Northwest portsa, Hakodate (Japan), Yokohama (Japan)
7 39%
5,000 – 7,999 4,200 –6,400 70
Dutch Harbor (U.S.), Pacific Northwest ports, Hakodate (Japan), Yokohama (Japan), Pusan (South Korea), Prince Rupert (Canada)
40 57%
8,000 – 11,999 4,900 –7,600 115
Dutch Harbor (U.S.), Pacific Northwest ports, Hakodate (Japan), Yokohama (Japan), Pusan (South Korea), Prince Rupert (Canada), Tianjin (China)
71 62%
12,000 – 14,500 5,000 –6,300 27
Dutch Harbor (U.S.), Pacific Northwest ports, Oakland (U.S.), Hakodate (Japan), Yokohama (Japan), Pusan (South Korea), Prince Rupert (Canada), Tianjin (China), Shanghai (China)
23 85%
Total 232 141 61%
[a] A group of adjacent ports including Port of Tacoma (U.S.), Port of Seattle (U.S.), Port of Vancouver (Canada).
Table 8 shows that the longer the range, the more choices ships have for additional refueling. Overall, 141 out of 232 ships, 61%, have access to a top-tier or second-tier candidate for one additional refueling stop, which means they only need minor changes to their existing itinerary. Dutch Harbor in the United States and Japanese ports were identified as popular candidates for bunkering due to their location. They tend to divide the PRD–SPB corridor into legs that can be completed by most ships if they used hydrogen.
Conclusions and future workIn this study, we chose one of the most challenging cases for operating vessels via hydrogen fuel cells: deep-sea containerized shipping. We evaluated the long-range PRD–SPB corridor that takes weeks to travel. The ships we evaluated are among the largest ships in the world, and they can burn 100 or more tonnes of HFO per day. Even so, our results show that the bunkering needs for such a shipping corridor can be met by hydrogen with minor changes to ship operations.
We found that about 43% of the fleet’s 2015 voyages could be completed when powered by hydrogen fuel cells without replacing cargo space with fuel and without additional refueling along the way. If ships replace 2% of the cargo space with fuel, 86% of voyages could be completed without further refueling. If ships replace 5% of the cargo space with fuel, 99% of voyages could be met. Medium-size container ships are more capable of completing voyages without sacrificing cargo space and without refueling. Nonstop voyages were harder to accomplish than voyages with multiple stops, and we found that by calling one additional port to refuel, the fleet can complete 99% of voyages it completed in 2015 without replacing any cargo space with fuel.
These findings, while robust, suggest potential future work. This analysis is specific to container shipping on transpacific routes. Our approach can be applied to other ship types, other shipping corridors, and other fuels. And there are likely relationships between these variables, as we found that our selected corridor is dominantly utilized by container ships. Indeed, container ships, bulk carriers, and oil tankers have their

12 ICCT WORKING PAPER 2020-05 | ZERO-EMISSION CONTAINER CORRIDOR BETWEEN CHINA AND THE UNITED STATES
own distinct trading patterns (Kaluza, Kölzsch, Gastner, & Blasius, 2010). Oil tankers, for example, may utilize corridors that are close to major production sites and popular bunkering ports.
Other potential alternative fuels for ships such as ammonia or methanol carry more energy per unit volume than liquid hydrogen, which suggests they could be used more easily than hydrogen. Additionally, a few zero-emission technologies that are considered more challenging for deep-sea applications, notably batteries, could become viable in shorter shipping corridors. Zero-emission technologies and bunkering needs assessed at the shipping corridor level could provide confidence for early investors seeking to leverage future economies of scale.
This work focused narrowly on the refueling needs of zero-carbon shipping. Other factors, including cost-effectiveness, will play a role in whether new fuels can be successfully used in shipping. To boost early investment in zero-emission technology and associated bunkering infrastructure, we also need economic assessments of such corridors. This involves not only the cost of technology implementation for the applicable fleet and the profitability of certain types of commodity trading utilizing a given corridor, but also the cost of developing port infrastructure.
Currently, HFO is produced in fossil fuel abundant regions and transported to major bunkering ports. If more ports need to offer bunkering services to support a zero-emission fleet, a distributed hydrogen production and delivery network would be needed. Life-cycle assessments of alternative marine fuels would also be needed to ensure that they are low carbon throughout their production cycle.

13 ICCT WORKING PAPER 2020-05 | ZERO-EMISSION CONTAINER CORRIDOR BETWEEN CHINA AND THE UNITED STATES
ReferencesComer, B., & Rutherford, D. (2018). The International Maritime Organization’s initial greenhouse gas
strategy. Retrieved from the International Council on Clean Transportation, https://theicct.org/publications/IMO-initial-GHG-strategy.
Comer, B. (2019). Transitioning away from heavy fuel oil in Arctic shipping. Retrieved from the International Council on Clean Transportation, https://theicct.org/publications/transitioning-away-heavy-fuel-oil-arctic-shipping.
Global Carbon Atlas. (n.d.). 2018 CO2 emissions. Retrieved from http://www.globalcarbonatlas.org/en/CO2-emissions.
Hall, D., Pavlenko, N., & Lutsey, N. (2018). Beyond road vehicles: Survey of zero-emission technology options across the transport sector. Retrieved from the International Council on Clean Transportation, https://theicct.org/publications/zero-emission-beyond-road-vehicles.
Horvath, S., Fasihi, M., & Breyer, C. (2018). Techno-economic analysis of a decarbonized shipping sector: Technology suggestions for a fleet in 2030 and 2040. Energy Conversion and Management, 164, 230–241. doi: 10.1016/j.enconman.2018.02.098
Kaluza, P., Kölzsch, A., Gastner, M. T., & Blasius, B. (2010). The complex network of global cargo ship movements. Journal of the Royal Society Interface, 7(48), 1093 –1103. doi: 10.1098/rsif.2009.0495
Minnehan, J. J., & Pratt, J. W. (2017). Practical application limits of fuel cells and batteries for zero emission vessels. Sandia National Laboratories. Retrieved from https://energy.sandia.gov/wp-content/uploads/2017/12/SAND2017-12665.pdf.
Olmer, N., Comer, B., Roy, B., Mao, X., & Rutherford, D. (2017). Greenhouse gas emissions from global shipping, 2013–2015. Retrieved from the International Council on Clean Transportation, https://theicct.org/publications/GHG-emissions-global-shipping-2013-2015.
United Nations Conference on Trade and Development. (2016). Review of maritime transport, 2016. Retrieved from: https://unctad.org/en/PublicationsLibrary/rmt2016_en.pdf.