
Technology to transform a connected nation - McKinsey
144
Digital India Technology to transform a connected nation March 2019
-
Upload
khangminh22 -
Category
Documents
-
view
3 -
download
0
Transcript of Technology to transform a connected nation - McKinsey

Digital India
Digital IndiaTechnology to transform a connected nation
March 2019

McKinsey Global InstituteSince its founding in 1990, the McKinsey Global Institute (MGI) has sought to develop a deeper understanding of the evolving global economy. As the business and economics research arm of McKinsey & Company, MGI aims to provide leaders in the commercial, public, and social sectors with the facts and insights on which to base management and policy decisions.
MGI research combines the disciplines of economics and management, employing the analytical tools of economics with the insights of business leaders. Our “micro-to-macro” methodology examines microeconomic industry trends to better understand the broad macroeconomic forces affecting business strategy and public policy. MGI’s in-depth reports have covered more than 20 countries and 30 industries. Current research focuses on six themes: productivity and growth, natural resources, labour markets, the evolution of global financial markets, the economic impact of technology and innovation, and urbanisation. Recent reports have assessed the digital economy, the impact of AI and automation on employment, income inequality, the productivity puzzle, the economic benefits of tackling gender inequality, a new era of global competition, Chinese innovation, and digital and financial globalisation.
MGI is led by three McKinsey & Company senior partners: Jacques Bughin, Jonathan Woetzel, and James Manyika, who also serves as the chairman of MGI. Michael Chui, Susan Lund, Anu Madgavkar, Jan Mischke, Sree Ramaswamy, and Jaana Remes are MGI partners, and Mekala Krishnan and Jeongmin Seong are MGI senior fellows.
Project teams are led by the MGI partners and a group of senior fellows and include consultants from McKinsey offices around the world. These teams draw on McKinsey’s global network of partners and industry and management experts. The MGI Council, which includes leaders from McKinsey offices around the world and the firm’s sector practices, includes Michael Birshan, Andrés Cadena, Sandrine Devillard, André Dua, Kweilin Ellingrud, Tarek Elmasry, Katy George, Rajat Gupta, Eric Hazan, Acha Leke, Scott Nyquist, Gary Pinkus, Sven Smit, Oliver Tonby, and Eckart Windhagen. In addition, leading economists, including Nobel laureates, advise MGI research.
The partners of McKinsey fund MGI’s research; it is not commissioned by any business, government, or other institution. For further information about MGI and to download reports, please visit www.mckinsey.com/mgi.
McKinsey & Company in IndiaMcKinsey & Company is a management consulting firm that helps leading corporations and organisations make distinctive, lasting, and substantial improvements in their performance. Over the past eight decades, the firm’s primary objective has remained constant: to serve as an organisation’s most trusted external adviser on critical issues facing senior management. With consultants deployed from more than 128 offices in 65 countries, McKinsey advises companies on strategic, operational, organisational, and technological issues. The firm has extensive experience in more than 20 major industry sectors and eight primary functional practice areas as well as in-depth expertise in high-priority areas for today’s business leaders. Across India, McKinsey & Company serves clients in the public and private sectors from offices in Delhi, Mumbai, Chennai, and Bangalore. For more information on McKinsey in India, please see www.mckinsey.com/Global_Locations/Asia/India.
Copyright © McKinsey & Company 2019

Digital India: Technology to transform a connected nation
AuthorsNoshir Kaka, MumbaiAnu Madgavkar, MumbaiAlok Kshirsagar, MumbaiRajat Gupta, MumbaiJames Manyika, San FranciscoKushe Bahl, MumbaiShishir Gupta, Delhi

PrefaceIndia is establishing itself as a major presence in the digital economy. By any number of key metrics, from internet connections to app downloads, both the volume and the growth of its digital economy now exceed those of most other countries. Government and the private sector are moving rapidly to spread high-speed connectivity across the country and provide the hardware and services to put Indian consumers and businesses online. What does this increased connectivity mean in economic terms? And how quickly and effectively will the country be able to harness digital technologies for the prosperity of all Indians?
This report by the McKinsey Global Institute is the latest research in an ongoing series on the impact of digital technologies on economies around the world. We build on our existing work on digital’s potential and challenges in the United States, Europe, and some other economies to probe how digital forces allow firms to connect, automate, and analyse—capabilities that will enable them to reshape their value chains and increase productivity. In line with our “micro-to-macro” approach, we examine in depth four sectors in India—agriculture, healthcare, retail, and logistics—that can benefit from taking digitisation to a new level.
This research is a joint venture between McKinsey & Company’s office in India and the McKinsey Global Institute. It was led by three McKinsey & Company senior partners based in Mumbai—Noshir Kaka, Alok Kshirsagar, and Rajat Gupta—along with Anu Madgavkar, an MGI partner in Mumbai, who directed the project. James Manyika, MGI’s chairman, based in San Francisco, and Kushe Bahl, a McKinsey partner in Mumbai, helped steer the effort. Kanika Gupta and Shishir Gupta headed the research team, which was composed of Rishi Arora, Archit Maheshwari, Chandan Kar, Ipshita Mandal, Preksha Mangal, Ketav Mehta, Ayush Mittal, TJ Radigan, Sailee Rane, Himanshu Satija, Tanya Sharma, Maheep Singh, Shantanu Sinha, and Shivika Syal.
This project greatly benefited from a year-long research collaboration between McKinsey & Company and the Government of India’s Ministry of Electronics and Information Technology (MeitY) that culminated in the government’s report “India’s Trillion Dollar Digital Opportunity,” released in February 2019. We are especially grateful to Ravi Shankar Prasad, Honorable Minister of Law and Justice and Electronics and Information Technology, Government of India, Nandan Nilekani, co-founder and chairman of Infosys and former chairman of the Unique Identification Authority of India, and Ajay Sawhney, union secretary, MeitY, for their guidance and thought partnership.
We received many valuable insights through this research collaboration from Government of India officials including Amitabh Kant, CEO of NITI Aayog; Dr. Rajiv Kumar, vice chairman of NITI Aayog; and Aruna Sundararajan, union telecom secretary, Department of Telecommunication. We are especially indebted to officials of MeitY and representatives of several other ministries and departments, among them Agriculture and Farmers’ Welfare; Commerce and Industry (Government e Marketplace); Finance (DBT Mission); Health and Family Welfare; Higher Education; Labour and Employment; Power; School Education and Literacy; and Skill Development and Entrepreneurship.
We are grateful to business and industry leaders who interacted with us along with their teams to provide input to our research: Bhavish Aggarwal, co-founder and CEO of Ola; Mukesh Ambani, chairman and managing director of Reliance India Limited; Rajan Anandan, CEO of Google India; N. Chandrasekaran, group chairman of Tata Sons; R. Chandrasekhar, former president of NASSCOM; Deepak Garg, founder and CEO of Rivigo; Debjani Ghosh, president of NASSCOM; Roopa Kudva, managing director of Omidyar Network India Advisors; Saurabh Kumar, founder and CEO of Agricx Lab; Anant Maheshwari, president of Microsoft India; Sunita Nadhamuni, director of technology at Dell EMC; Pradeep Parmeswaran, India head of Uber; Siddharth Patodia, a co-founder of iGenetic Diagnostics; Kunal Prasad, co-founder and chief operating officer of CropIn Technology Solutions; Rishad Premji, chairman of NASSCOM; Aditya Puri, managing director of HDFC Bank; Vijay Shekhar Sharma, founder and CEO of Paytm; Dr. Devi Shetty, chairman and executive director of Narayana Health; Vikram Shroff, executive director of UPL; Aditya Singh, managing director of DaVita Care (India); Siddharth

Tata, a co-founder of Purple Chilli; and Naveen Tewari, founder and CEO of InMobi. We also thank representatives of several other business and industry organisations from whom we obtained valuable insights, among them ABB, Amazon India, Apollo Hospitals, Axis Bank, Bharti Enterprises, GE India, Hindustan Petroleum, Hindustan Unilever, ICICI Bank, Indian Oil, Kotak Mahindra Bank, Larsen & Toubro, Mahindra Group, Piramal Enterprises, Siemens, State Bank of India, and Vodafone.
Several experts from nonprofits, think tanks, and other institutions challenged our thinking, and we are grateful to them, especially Dilip Asbe, managing director and CEO of National Payments Corporation of India; Sanjay Jain, a fellow at the Indian Software Products Industry Round Table (iSPIRT) and chief innovation officer of the Centre for Innovation Incubation and Entrepreneurship at the Indian Institute of Management Ahmedabad; Lalitesh Katragadda, technologist and architect of AP FiberNet; Nachiket Mor, India country director of the Bill & Melinda Gates Foundation; Srikanth Nadhamuni, CEO of the eGovernments Foundation; Paresh Parasnis, CEO of the Piramal Foundation; Samir Saran, president of the Observer Research Foundation; and Sharad Sharma, governing council member and co-founder of iSPIRT.
Many McKinsey colleagues, based in India and outside, generously shared their time and provided valuable insights. We are grateful to Chirag Adatia, Salil Aggarwal, Anubhav Bhattacharjee, Sujit Chakrabarty, Bo Chen, Mahima Chugh, Nicolas Denis, David Fiocco, K Ganesh, Raghav Gupta, Eric He, Daniel Hui, Kanika Kalra, Joshua Katz, Suyog Kotecha, Ashok Kumar, Saurabh Kumar, Mehdi Lahrichi, Archana Maganti, Anne Martinez, Neelesh Mundra, Nitika Nathani, James Naylor, Clayton O’Toole, Sudiptha Pal, RS Mallya Perdur, Naveen Prashanth, Ankur Puri, Chandrika Rajagopalan, Florian Schaudel, Sameer Shetty, Kunwar Singh, Shwaitang Singh, Marek Stepniak, Owen Stockdale, Renny Thomas, Jordan VanLare, Sri Velamoor, Khiloni Westphely, and Hanish Yadav.
We are deeply indebted to our academic adviser, Rakesh Mohan, a senior fellow at the Jackson Institute for Global Affairs at Yale University, who provided valuable feedback and guidance throughout the research.
The report was edited and produced by MGI senior editor Mark A. Stein and editorial director Peter Gumbel, production manager Julie Philpot, graphic design team leader Vineet Thakur, senior graphic designers Marisa Carder, Pradeep Singh Rawat, and Patrick White, and graphic artist Margo Shimasaki. Cathy Gui and Rebeca Robboy of MGI’s external communications team helped disseminate and publicise the report, while Lauren Meling, MGI digital editor, aided with digital and social media diffusion.
This report contributes to MGI’s mission to help business and policy leaders understand the forces transforming the global economy, identify strategic locations, and prepare for the next wave of growth. As with all MGI research, this research is independent and has not been commissioned or sponsored in any way by any business, government, or other institution. We welcome your comments at [email protected].
Jacques Bughin Director, McKinsey Global Institute Senior Partner, McKinsey & Company, Brussels
James Manyika Chairman and Director, McKinsey Global Institute Senior Partner, McKinsey & Company, San Francisco
Jonathan Woetzel Director, McKinsey Global Institute Senior Partner, McKinsey & Company, Shanghai
March 2019


Contents
In brief
Executive summary
1. India’s consumer-led digital leap
2. The digital gap among India’s businesses
3. Potential economic impact of digital applications in 2025
4. Building digital ecosystems
4.1 Agriculture
4.2 Healthcare
4.3 Retail
4.4 Logistics
5. Implications for companies, policy makers, and individuals
Technical appendix
Bibliography
vi
1
23
41
53
69
72
82
94
104
113
121
129

In brief
Digital India: Technology to transform a connected nation
India’s digital surge is well under way on the consumer side, even as its businesses show uneven adoption and a gap opens between digital leaders and other firms. This report examines the opportunities for India’s future digital growth and the challenges that will need to be managed as it continues to embrace the digital economy.
— India is one of the largest and fastest-growing markets for digital consumers, with 560 million internet subscribers in 2018, second only to China. Indian mobile data users consume 8.3 gigabits (GB) of data each month on average, compared with 5.5 GB for mobile users in China and somewhere in the range of 8.0 to 8.5 GB in South Korea, an advanced digital economy. Indians have 1.2 billion mobile phone subscriptions and downloaded more than 12 billion apps in 2018. Our analysis of 17 mature and emerging economies finds India is digitising faster than any other country in the study, save Indonesia—and there is plenty of room to grow: just over 40 percent of the populace has an internet subscription.
— The public and private sectors are both propelling digital consumption growth. The government has enrolled more than 1.2 billion Indians in its biometric digital identity programme, Aadhaar, and brought more than 10 million businesses onto a common digital platform through a goods and services tax. Competitive offerings by telecommunications firms have turbocharged internet subscriptions and data consumption, which quadrupled in both 2017 and 2018 and helped bridge a digital divide; India’s lower-income states are growing faster than higher-income ones in internet infrastructure and subscriptions. Based on current trends, we estimate that India will increase the number of internet users by about 40 percent to between 750 million and 800 million and double the number of smartphones to between 650 million and 700 million by 2023.
— Our survey of more than 600 firms shows that digital adoption among businesses has been uneven across all sectors. Digital leaders in the top quartile of adopters are two to three times more likely to use software for customer relationship management, enterprise resource planning, or search engine optimisation than firms in the bottom quartile and are almost 15 times more likely to centralise digital management. Firm size is not always a
differentiator: while large firms are far ahead in digital areas requiring large investments like making sales through their own website, small businesses are leapfrogging ahead of large ones in other areas, including acceptance of digital payments and the use of social media and video conferencing to reach and support customers.
— Digital applications could proliferate across most sectors of India’s economy. By 2025, core digital sectors such as IT and business process management, digital communication services, and electronics manufacturing could double their GDP level to $355 billion to $435 billion. Newly digitising sectors, including agriculture, education, energy, financial services, healthcare, logistics, and retail, as well as government services and labour markets, could each create $10 billion to $150 billion of incremental economic value in 2025 as digital applications in these sectors help raise output, save costs and time, reduce fraud, and improve matching of demand and supply.
— The productivity unlocked by the digital economy could create 60 million to 65 million jobs by 2025, many of them requiring functional digital skills, according to our estimates. Retraining and redeployment will be essential to help some 40 million to 45 million workers whose jobs could be displaced or transformed.
— New digital ecosystems are already visible, reshaping consumer-producer interactions in agriculture, healthcare, retail, logistics, and other sectors. Opportunities span such areas as data-driven lending and insurance payouts in the farm sector to digital solutions that map out the most efficient routes and monitor cargo movements on India’s highways. In healthcare, patients could turn to teleconsultations via digital voice or HD video, and in retail, brick-and-mortar stores would find value from being part of e-commerce platforms.
— All stakeholders will need to respond effectively if India is to achieve its digital potential. Executives will need to anticipate the digital forces that will disrupt their businesses and invest in building capabilities, including partnering with universities and outsourcing or acquiring talent to deliver digital projects. Governments will need to invest in digital infrastructure and public data that organisations can leverage even as they put in place strong privacy and security safeguards. Capturing the gains of the digital economy will require more ease in creating, scaling, and exiting startups as well as policies to facilitate retraining and new-economy jobs for workers. Individuals will need to inform themselves about how the digital economy could affect them as workers and consumers and prepare to capture its opportunities.

The MGI India Firm Digitisation Index shows digitally advanced �rmsare pulling ahead of their peers.
Financialservices
70x 30x50xLogisticsAgriculture Education Retail
$ 435bn
Gro
wth
pot
enti
al
Potential value by 2025
(Index top quartile)(Index bottom quartile)
22%
2%
29%
170x
26.2
5.4
560m
239m
18 8,320mb 6.1%
0.1%2.2
86mb
2014 2018 2014 2018 2014 2018 2014 2018 2014 2018
Digital usage in India is soaring as costs tumble
Unlocking the potential of technologyDigital India
Number of smartphones per 100 people
Total number of internet users
Number of cashlesstransactions per person
Monthly data consumption per unique connection
Monthly data price (per1gb as % of monthly GDP)
Laggards Leaders
13%
46%
3.5x
2.6x
14.5x
Newly digitising sectors will seesigni�cant value emerge.
Core digital sectors have the potential to more than double by 2025.
1
Source: McKinsey Global Institute analysis
1 IT business process management, digital communication services, and electronics manufacturing.
Changing core operations to respond to digital disruption
With centralised digital team Using CRM software
58%
70xJobs and
skills
11.7x
$ 170bn
$ 70bn $ 70bn$ 50bn
$ 30bn
$ 35bnCore digital
sectors
$ 170bnCurrent value
By 2025, digital could transform India's economy, sector by sector(Values show upper limit of an estimated range)

.

Executive summary
With more than half a billion internet subscribers, India is one of the largest and fastest-growing markets for digital consumers, and the rapid growth has been propelled by public and private sector alike. India’s lower-income states are bridging the digital divide, and the country has the potential to be a truly connected nation by 2025. Much more growth is possible. As India’s digital transformation unfolds, it could create significant economic value for consumers, businesses, microenterprises, farmers, government, workers, and other stakeholders.
Digital adoption by India’s businesses has so far been uneven, but new digital business models could proliferate across most sectors. We find that core digital sectors such as IT and business process management (IT-BPM), digital communication services, and electronics manufacturing could double their GDP level to $355 billion to $435 billion by 2025, while newly digitising sectors (including agriculture, education, energy, financial services, healthcare, logistics, and retail) as well as digital applications in government services and labour markets could each create $10 billion to $150 billion of incremental economic value in the same period. Some 60 million to 65 million jobs could be created by the productivity surge by 2025, although redeployment will be essential to help the 40 million to 45 million workers whose jobs will likely be displaced or transformed by digital technologies, based on our estimates.
In India’s new and emerging digital ecosystems of the future—already visible in areas such as precision agriculture, digital logistics management, and digital healthcare consultations—business will have to find a new way to engage with customers. All Indian stakeholders will need to gear up to capture the opportunities and manage the challenges of being a connected nation.
India’s digital leap is well under way, propelled by both public- and private-sector actionsBy many measures, India is on its way to becoming a digitally advanced nation.1 Just over 40 percent of the populace has an internet subscription, but India is already home to one of the world’s largest and most rapidly growing bases of digital consumers. It is digitising activities at a faster pace than many mature and emerging economies.
India’s internet user base has grown rapidly in recent years, propelled by the decreasing cost and increasing availability of smartphones and high-speed connectivity, and is now one of the largest in the world (Exhibit E1). The country had 560 million subscribers in September 2018, second in the world only to China.2 Digital services are growing in parallel. Indians now download more apps—12.3 billion in 2018—than residents of any other country except China.3 The average Indian social media user spends 17 hours on the platforms each week, more than social media users in China and the United States.4 The share of Indian adults with at least one digital financial account has more than doubled since 2011, to 80 percent, thanks in large part to the more than 332 million people who opened mobile phone–based accounts under the government’s Jan-Dhan Yojana mass financial-inclusion programme.5
1 In February 2019, the Indian government released a report highlighting the considerable economic opportunities from digital technologies and a detailed action plan for realizing them. India’s Trillion Dollar Digital Opportunity, Ministry of Electronics and Information Technology, Government of India, February 2019.
2 Indian telecom services performance indicator report, June-September 2018, Telecom Regulatory Authority of India.3 Priori Data, January 2019.4 We Are Social, Digital in 2018: Southern Asia, January 2018.5 Pradhan Mantri Jan-Dhan Yojana, November 20, 2018, pmjdy.gov.in/account; Asli Demirgüç-Kunt et al., The Global
Findex Database 2017: Measuring financial inclusion and the fintech revolution, World Bank, April 2018.
.
1Digital India: Technology to transform a connected nation

Our analysis of 17 mature and emerging economies across 30 dimensions of digital adoption since 2014 finds that India is digitising faster than all but one other country in the study, Indonesia. Our Country Digital Adoption Index covers three elements: digital foundation, or the cost, speed, and reliability of internet connections; digital reach, or the number of mobile devices, app downloads, and data consumption; and digital value, the extent to which consumers engage online by chatting, tweeting, shopping, or streaming. India’s score rose by 90 percent between 2014 and 2017, second only to Indonesia’s improvement, at 99 percent, over the same period (Exhibit E2). In absolute terms, India’s score is low, at 32 out of a maximum 100, comparable to Indonesia’s at 40, but significantly lagging behind the four most-digitised economies of the 17: South Korea, Sweden, Singapore, and the United Kingdom.
The public sector has been one strong catalyst for India’s rapid digitisation. The government’s effort to ramp up Aadhaar, the national biometric digital identity programme, has played a major role (see Box E1, “Aadhaar, the world’s largest digital ID programme, has enabled many services”). The Goods and Services Tax Network, established in 2013, brings all transactions involving about 10.3 million indirect taxpaying businesses onto one digital platform, creating a powerful incentive for businesses to digitise their operations.
At the same time, private-sector innovation has helped bring internet-enabled services to millions of consumers and made online usage more accessible. For example, Reliance Jio’s strategy of bundling virtually free smartphones with subscriptions to its mobile service has spurred innovation and competitive pricing across the sector. Overall, data costs have dropped by more than 95 percent since 2013: the cost of one gigabyte fell from 9.8 percent of per capita monthly GDP in 2013 (roughly $12.45) to 0.37 percent in 2017 (the equivalent of a few cents).6 Average fixed-line download speed quadrupled between 2014 and 2017.7 As a result, monthly mobile data consumption per user is growing at 152 percent annually—more than twice the rates in the United States and China (Exhibit E3).
6 Analysys Mason, January 9, 2019; World Bank, October 27, 2018. 7 Akamai’s state of the internet: Q1 2014 report, Akamai Technologies, May 2014; and Akamai’s state of the internet: Q1 2017
report, Akamai Technologies, March 2017.
95%Decline in data costs since 2013
Exhibit E1India is among the top two countries globally on many key dimensions of digital adoption.
SOURCE: Priori Data, January 2019; Strategy Analytics, 2018; TRAI, September 30, 2018; UIDAI, April 2018; We Are Social, January 2019; McKinsey Global Institute analysis
Exhibit 1
India no. 1 globally 1.2b
people enrolled in the world’s largest unique digital identity program
India no. 2 globally, behind China
12.3bapp downloads in 2018
1.17bwireless phone subscribers
560minternet subscribers
354msmartphone devices
294musers engaged in social media
India is among the top two countries globally on many key dimensions of digital adoption
Source: Priori Data, January 2019; Strategy Analytics, 2018; TRAI, September 30, 2018; UIDAI, April 2018; We Are Social, January 2019; McKinsey Global Institute analysis
Digital IndiaReport exhibits, VImc 0311
ES and report
[mc]I’ve used Theinhardt Light and Theinhardt Medium (*not* the PPT Bold button).
2 Digital India: Technology to transform a connected nation

Exhibit E2India, coming off a low base, is the second-fastest digital adopter among 17 major digital economies.
1 MGI’s Country Digital Adoption Index represents the level of adoption of digital applications by individuals, businesses, and governments across 17 major digital economies. The holistic framework is estimated based on 30 metrics divided between three pillars: digital foundation (eg, spectrum availability, download speed), digital reach (eg, size of mobile and internet user bases, data consumption per user), and digital value (eg, utilisation levels of use cases in digital payments or e-commerce). Principal component analysis was conducted to estimate the relative importance of the three pillars: 0.37 for digital foundation, 0.33 for digital reach and 0.30 for digital value. Within each pillar, each element is assigned equal value, with indicators normalised into a standard scale of 0–100 (0 indicating lowest possible value). A simple average of the normalised values was then used to calculate the index.
SOURCE: Akamai’s state of the internet: Q1 2014 report; Akamai’s state of the internet: Q1 2017 report; Analysys Mason; Euromonitor International consumer finance and retailing overviews, 2017 editions; International Telecommunication Union; UN e-Government Survey; Strategy Analytics; Open Signal; Ovum; We Are Social; Digital Adoption Index, World Bank; McKinsey Global Institute analysis
Exhibit 2
India, coming o a low base, is the second-fastest digital adopter among 17 major digital economies
Source: Akamai’s state of the internet: Q1 2014 report; Akamai’s state of the internet: Q1 2017 report; Analysys Mason; Euromonitor International consumer nance and retailing overviews, 2017 editions; International Telecommunication Union; UN e-Government Survey; Strategy Analytics; Open Signal; Ovum; We Are Social; Digital Adoption Index, World Bank; McKinsey Global Institute analysis
1. MGI’s Country Digital Adoption Index represents the level of adoption of digital applications by individuals, businesses, and governments across 17 major digital economies. The holistic framework is estimated based on 30 metrics divided between three pillars: digital foundation (eg, spectrum availability, download speed), digital reach (eg, size of mobile and internet user bases, data consumption per user), and digital value (eg, utilisation levels of use cases in digital payments or e-commerce). Principal component analysis was conducted to estimate the relative importance of the three pillars: 0.37 for digital foundation, 0.33 for digital reach and 0.30 for digital value. Within each pillar, each element is assigned equal value, with indicators normalised into a standard scale of 0–100 (0 indicating lowest possible value). A simple average of the normalised values was then used to calculate the index.
75
73
67
67
66
66
65
64
64
61
58
57
50
47
40
40
Russia
South Africa
Canada
South Korea
Brazil
United Kingdom
Sweden
Australia
United States
Singapore
Japan
Germany
France
Indonesia
Italy
China
India 32
ES and report
Country Digital Adoption Index1
Score (0-100), 2017Growth in Country Digital Adoption Index % growth, 2014–17
24
United Kingdom
South Africa
Germany
Indonesia
India
27
Russia
China
Canada
Japan
31
90
Italy
France
South Korea
Brazil
30
36
United States
Sweden
44
Australia
Singapore
99
45
44
43
35
35
30
30
25
25
3Digital India: Technology to transform a connected nation
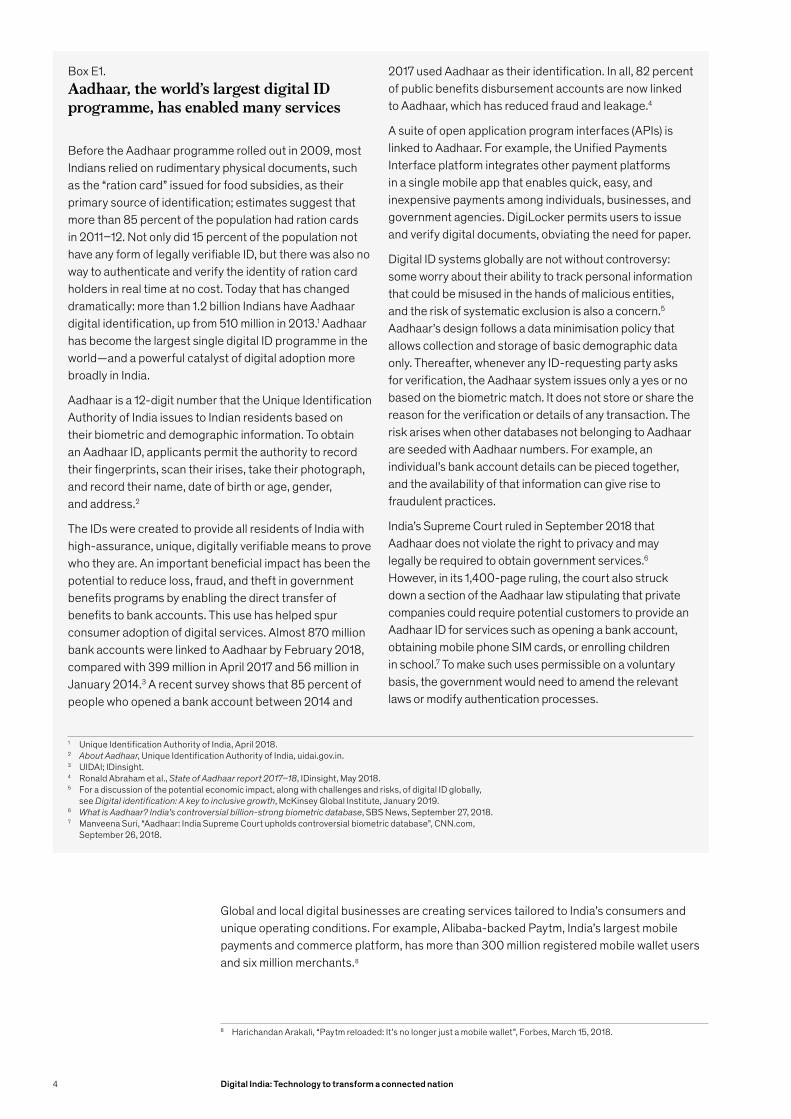
Global and local digital businesses are creating services tailored to India’s consumers and unique operating conditions. For example, Alibaba-backed Paytm, India’s largest mobile payments and commerce platform, has more than 300 million registered mobile wallet users and six million merchants.8
8 Harichandan Arakali, “Paytm reloaded: It’s no longer just a mobile wallet”, Forbes, March 15, 2018.
Box E1.Aadhaar, the world’s largest digital ID programme, has enabled many services
Before the Aadhaar programme rolled out in 2009, most Indians relied on rudimentary physical documents, such as the “ration card” issued for food subsidies, as their primary source of identification; estimates suggest that more than 85 percent of the population had ration cards in 2011–12. Not only did 15 percent of the population not have any form of legally verifiable ID, but there was also no way to authenticate and verify the identity of ration card holders in real time at no cost. Today that has changed dramatically: more than 1.2 billion Indians have Aadhaar digital identification, up from 510 million in 2013.1 Aadhaar has become the largest single digital ID programme in the world—and a powerful catalyst of digital adoption more broadly in India.
Aadhaar is a 12-digit number that the Unique Identification Authority of India issues to Indian residents based on their biometric and demographic information. To obtain an Aadhaar ID, applicants permit the authority to record their fingerprints, scan their irises, take their photograph, and record their name, date of birth or age, gender, and address.2
The IDs were created to provide all residents of India with high-assurance, unique, digitally verifiable means to prove who they are. An important beneficial impact has been the potential to reduce loss, fraud, and theft in government benefits programs by enabling the direct transfer of benefits to bank accounts. This use has helped spur consumer adoption of digital services. Almost 870 million bank accounts were linked to Aadhaar by February 2018, compared with 399 million in April 2017 and 56 million in January 2014.3 A recent survey shows that 85 percent of people who opened a bank account between 2014 and
1 Unique Identification Authority of India, April 2018.2 About Aadhaar, Unique Identification Authority of India, uidai.gov.in.3 UIDAI; IDinsight.4 Ronald Abraham et al., State of Aadhaar report 2017–18, IDinsight, May 2018.5 For a discussion of the potential economic impact, along with challenges and risks, of digital ID globally,
see Digital identification: A key to inclusive growth, McKinsey Global Institute, January 2019.6 What is Aadhaar? India’s controversial billion-strong biometric database, SBS News, September 27, 2018.7 Manveena Suri, “Aadhaar: India Supreme Court upholds controversial biometric database”, CNN.com,
September 26, 2018.
2017 used Aadhaar as their identification. In all, 82 percent of public benefits disbursement accounts are now linked to Aadhaar, which has reduced fraud and leakage.4
A suite of open application program interfaces (APIs) is linked to Aadhaar. For example, the Unified Payments Interface platform integrates other payment platforms in a single mobile app that enables quick, easy, and inexpensive payments among individuals, businesses, and government agencies. DigiLocker permits users to issue and verify digital documents, obviating the need for paper.
Digital ID systems globally are not without controversy: some worry about their ability to track personal information that could be misused in the hands of malicious entities, and the risk of systematic exclusion is also a concern.5 Aadhaar’s design follows a data minimisation policy that allows collection and storage of basic demographic data only. Thereafter, whenever any ID-requesting party asks for verification, the Aadhaar system issues only a yes or no based on the biometric match. It does not store or share the reason for the verification or details of any transaction. The risk arises when other databases not belonging to Aadhaar are seeded with Aadhaar numbers. For example, an individual’s bank account details can be pieced together, and the availability of that information can give rise to fraudulent practices.
India’s Supreme Court ruled in September 2018 that Aadhaar does not violate the right to privacy and may legally be required to obtain government services.6 However, in its 1,400-page ruling, the court also struck down a section of the Aadhaar law stipulating that private companies could require potential customers to provide an Aadhaar ID for services such as opening a bank account, obtaining mobile phone SIM cards, or enrolling children in school.7 To make such uses permissible on a voluntary basis, the government would need to amend the relevant laws or modify authentication processes.
4 Digital India: Technology to transform a connected nation

Exhibit E3India’s data usage quadrupled in one year as prices fell.
1 In data published by the Telecom Regulatory Authority of India for September 2018, consumption per unique subscriber is shown to have increased to 8,320 MB, putting India on pace to more than quadruple its average consumption again from 2017 to 2018.
SOURCE: Analysys Mason, January 9, 2019; UN Database; McKinsey Global Institute analysis
Exhibit 1
2017
50
2010 1211 1513 16140
10
20
30
40
60
India’s data usage quadrupled in one year as prices fell
Source: Analysys Mason, January 9, 2019; UN Database; McKinsey Global Institute analysis
1. In data published by the Telecom Regulatory Authority of India for September 2018, consumption per unique subscriber is shown to have increased to 8,320 MB, putting India on pace to more than quadruple its average consumption again from 2017 to 2018.
!"#$%&#'()*'+
Data pricePer GB of data (% of monthly GDP per capita)
Data consumptionPer connection, per month (MB)
United States Brazil China India1
1,000
4,000
0
3,500
500
1,500
11 13
1,622
12 20172010
397
1614 15
4x
5Digital India: Technology to transform a connected nation

India’s digital divide is narrowing, and all states have much room to growWith both private- and public-sector action promoting digital usage, India’s states have started bridging the digital divide. Lower-income states are showing the fastest growth in internet infrastructure, such as base tower stations and the penetration of internet services to new customers. While low- and moderate-income states as a group accounted for 43 percent of all base tower stations in India in 2013, they accounted for 52 percent of the incremental towers installed between 2013 and 2017.9 Low-income states like Uttar Pradesh, Madhya Pradesh, and Jharkhand were among the five fastest-growing states in internet penetration between 2014 and 2018; Uttar Pradesh alone added more than 36 million internet subscribers in that period. Ordinary Indians in many parts of the country—including small towns and rural areas—can read the news online, order food delivery via a phone app, video chat with a friend (Indians log 50 million video-calling minutes a day on WhatsApp), shop at a virtual retailer, send money to a family member through their phone, or watch a movie streamed to a handheld device.
Even after these advances, India still has plenty of room to grow in digital terms. Just over 40 percent of the populace has an internet subscription.10 Despite the growth of digital financial services, close to 90 percent of all retail transactions, by number, are still in cash.11 Only 5 percent of trade is transacted online, compared with 15 percent in China in 2015.12 Looking ahead, India’s digital consumers are poised for robust growth. By our estimates, India could add as many as 350 million smartphones by 2023.
Indian businesses are digitising rapidly but not evenlyAgainst this backdrop of rapid consumer internet adoption, India’s businesses have a relatively uneven pattern of digitisation. We surveyed more than 600 firms to determine the level of digitisation as well as the underlying traits, activities, and mind-sets that drive digitisation at the firm level. We used each company’s answers to score its level of digitisation on a scale of 0 to 100 and created the MGI India Firm Digitisation Index. Companies in the top quartile, which we characterise as digital leaders, had an average score of 58.2, while those in the bottom quartile, the digital laggards, averaged 33.2. The median score was 46.2.
A higher score indicates a company uses digital more extensively in day-to-day operations (such as implementing customer relationship management systems or accepting digital payments) and in a more organised manner (for example, by having a separate analytics team or centralised digital organisation) than companies with lower scores. Our survey found that, on average, digital leader firms outscored other firms by 70 percent on strategy dimensions (for example, responsiveness to disruption and investment in digital technologies), by 40 percent on organisation dimensions (such as level of executive support and use of key performance indicators), and by 31 percent on capability dimensions (including use of technologies such as CRM and enterprise resource planning solutions, and adoption of digital payments).
Differences in digital adoption within sectors are greater than those across sectors. While some sectors have more digitally sophisticated companies than others, top-quartile companies can be found in all sectors—even those sometimes considered resistant to technology, such as transportation and construction. Conversely, sectors such as information and communications technology (ICT), professional services, and education and healthcare, which have more digitised firms on average, are represented in the bottom quartile of adoption (Exhibit E4).
9 States are categorised based on their per capita GDP relative to the country’s: “very high income” states have per capita GDP more than twice India’s average; “high income”, 1.2 to 2 times; “moderate income”, 0.7 to 1.2 times; and “low income”, less than 0.7 times.
10 Indian telecom services performance indicator report, June-September 2018, Telecom Regulatory Authority of India.11 “Digital payments in India to reach $1 trillion by 2023: Credit Suisse”, Economic Times, February 15, 2018.12 Euromonitor International Retailing Edition 2019.
6 Digital India: Technology to transform a connected nation

Exhibit E4Digitisation levels vary more within sectors than across sectors among large Indian firms.India Firm Digitisation Index1
1 Based on 50-question survey of 220 large companies (5 billion rupees or $70 million annual revenue). The survey seeks to determine level of digitisation as well as the underlying traits, activities, and mindsets that drive it. Firms are scored based on their responses on dimensions related to digital strategy (eg, responsiveness to disruption, investment in digital technologies); digital organisation (eg, level of executive support, use of key performance indicators); and digital capabilities (eg, use of technologies like CRM and ERP, or adoption of digital payments).
2 Leaders are top quartile firms in terms of firm digitisation index, while laggards are in the bottom quartile.3 ICT comprises telecom services providers, media and information technology companies.4 Financial services comprises banks, finance, and insurance companies.5 Real estate and construction comprises construction companies, real estate developers, and real estate brokerage firms.6 Professional services comprises companies in the fields of consulting, architecture, and stock trading, among others.7 Education and health comprises firms in the fields of health services, pharmaceuticals, and education services.8 Manufacturing comprises firms in manufacturing of textiles, food processing, metal and metal products, petroleum and related
products, and others.9 Trade comprises companies trading, both wholesale and retail, commodities (eg, automobiles, sanitary wares).10 Transport comprises firms in logistics and passenger transport.
SOURCE: McKinsey India firm digitisation survey, May 2017; McKinsey Global Institute analysis
Exhibit 12
India Firm Digitisation Index1
Digitisation levels vary more within sectors than across sectors among large Indian rms
Source: McKinsey India rm digitisation survey, May 2017; McKinsey Global Institute analysis
1. Based on 50-question survey of 220 large companies (5 billion rupees or $70 million annual revenue). The survey seeks to determine level of digitisation as well as the underlying traits, activities, and mindsets that drive it. Firms are scored based on their responses on dimensions related to digital strategy (eg, responsiveness to disruption, investment in digital technologies); digital organisation (eg, level of executive support, use of key performance indicators); and digital capabilities (eg, use of technologies like CRM and ERP, or adoption of digital payments).
2. Leaders are top quartile rms in terms of rm digitisation index, while laggards are in the bottom quartile.3. ICT comprises telecom services providers, media and information technology companies.4. Financial services comprises banks, nance, and insurance companies.5. Real estate and construction comprises construction companies, real estate developers, and real estate brokerage rms.6. Professional services comprises companies in the elds of consulting, architecture, and stock trading, among others.7. Education and health comprises rms in the elds of health services, pharmaceuticals, and education services.8. Manufacturing comprises rms in manufacturing of textiles, food processing, metal and metal products, petroleum and related products, and
others.9. Trade comprises companies trading, both wholesale and retail, commodities (eg, automobiles, sanitary wares).10. Transport comprises rms in logistics and passenger transport.
3337
15 1622 21
35
15
71
57
66
74
63
73
54 5360
10
0
70
20
30
40
50
80
Median score in sector
Highest score in sector
Lowest score in sector
!"#$%&#'()*'+
ICT3 Financial services4
Real estate and
construc-tion5
Profes-sional
services6
Education and health7
Manufac-turing8
Trade9 Transport10
Sector median digitisation score
50 48 47 47 46 45 44 43
Leaders% of rms in sector
41 28 40 36 24 21 5 10
Laggards% of rms in sector
26 17 15 20 29 27 45 19
Digital laggards2
<41
Digital leaders2
>52
7Digital India: Technology to transform a connected nation

Digital leaders share common traits that digital laggards can emulateIndia’s digital leaders share common traits in digital strategy, organisation, and capabilities, but they still have room to improve across all three areas, from CEO support for digital initiatives to use of customer relationship management systems and other digital capabilities (Exhibit E5).
— Digital strategy: Leading digital companies in India adopt strategies that make them stand out from their peers in several ways. They centre their strategies on digital, let digital technologies shape how they engage with customers, and invest more heavily in digital than their peers. These firms are 30 percent more likely than bottom-quartile firms to say they fully integrate their digital and overall strategies, and 2.3 times more likely to sell their products through e-commerce platforms. Top-quartile firms are 3.5 times more likely than bottom-quartile firms to say that digital disruptions led them to change their core operations. Digital leaders also make digital investment a priority. Top-quartile firms are 5.5 times more likely than bottom-quartile firms to outspend their peers on digital initiatives and 40 percent more likely to consider digital a top priority for investment.
Exhibit E5India’s digital leaders still have ample room for improvement in many areas.
1 “Leaders” are firms scoring within the top quartile of MGI’s India Firm Digitisation Index.2 Results of a survey conducted across 220 large firms in India with revenue of 5 billion rupees, or $70 million.
SOURCE: McKinsey India firm digitisation survey, May 2017; McKinsey Global Institute analysis
Exhibit 14
India’s digital leaders still have ample room for improvement in many areas
Source: McKinsey India rm digitisation survey, May 2017; McKinsey Global Institute analysis
1. “Leaders” are rms scoring within the top quartile of MGI’s India Firm Digitisation Index.2. Results of a survey conducted across 220 large rms in India with revenue of 5 billion rupees, or $70 million.
% of rms responding
10 6020 30 40 50 70 80 100900
30
17
37 45
46
55
8 29
26 40
23
33
47
23 49
58
41 65
Strategy
Has a digital strategy that is fully integrated with the overall strategy
Has changed core operations in response to disruption
Believes they invest more in digital than peers do
Organisation
Has a centralised, company-wide digital organisation
CEO supports and is directly involved in digital initiatives
Has a distinct, stand-alone analytics team with the appropriate talent
Capabilities
Uses the Uni ed Payments Interface (UPI) for interbank transfers
Has implemented a Customer Relationship Management system
Makes extensive use of digital channels to reach customers
% of leaders not reporting this attribute
% of digital leaders reporting this attribute1
% of non-leader rms reporting this attribute
42
71
60
53
51
35
55
45
54
8 Digital India: Technology to transform a connected nation

— Digital organisation: Many more digital leaders than laggards have a single business unit that manages and coordinates digital initiatives for the entire company. Top-quartile firms are 14.5 times more likely than bottom-quartile firms to centralise digital management, and five times more likely to have a stand-alone, properly staffed analytics team. Top-quartile firms are also 70 percent more likely than bottom-quartile firms to say their CEO is “supportive and directly engaged” in digital initiatives.
— Digital capabilities: Top-quartile firms are 2.6 times more likely than bottom-quartile firms to use customer relationship management software, for example, and 2.5 times more likely to coordinate the management of their core business operations by using an enterprise resource planning system. Digital leaders also optimise their digital marketing. Our survey shows that top-quartile companies are 2.3 times more likely than bottom-quartile firms to use search engine optimisation, and 2.7 times more likely to use social media for marketing.
The gap between digital leaders and other firms is not insurmountable. In some cases, even when the difference is large, companies may be able to begin closing it by digitising in small, relatively simple ways. Social media marketing is a good example. Bottom-quartile firms are 70 percent less likely than top-quartile businesses to use social media to attract and serve new customers, and less than half as likely to use e-commerce or listing platforms. However, these sales channels are cheap and easily accessible, and a business owner with a smartphone and a high-speed internet connection will encounter few barriers to taking advantage of them.
Small businesses are closing the digital gap with larger firms and are ahead of them in accepting digital paymentsLarge companies (defined in our survey as having revenue greater than 5 billion rupees, or about $70 million) have the financial resources and expertise to invest in some advanced technologies, such as artificial intelligence and the Internet of Things, but growing high-speed internet connectivity and shrinking data costs are opening digital opportunities for many small-business owners and sole proprietors.
Indeed, our survey found that small businesses are ahead of large companies in accepting digital payments. Among small firms, 94 percent said they accept payment by debit or credit card, compared with only 79 percent of big firms; for digital wallets, the figures were 78 percent versus 49 percent. Small companies also are more willing to use digital technologies such as video conferencing and chat to support their customers.
Our survey found that 70 percent of small firms have built their own websites to reach clients, compared with 82 percent of large firms, and are just about as likely as those big companies to have optimised their websites for mobile devices. Small firms are less likely than big firms to buy display ads on the web (37 percent versus 66 percent), but they are ahead of big companies in connecting with customers via social media and are more likely to use search engine optimisation. More than 60 percent of the small firms surveyed use LinkedIn to hire talent, and about half say most of their employees need to have basic digital skills. While only 51 percent of smaller firms said they “extensively” sell goods and services via their websites (compared with 73 percent of big businesses), small businesses use e-commerce platforms and other digital sales channels just as much as large firms and are equally likely to receive orders through digital channels such as WhatsApp.
Digital applications have potential to create significant economic value for India but will require new skills and labour redeploymentFirms in India that innovate and digitise rapidly will be better placed to tap into a large connected market of up to 700 million smartphones and about 800 million internet users by 2023. In the context of rapidly improving technology capabilities and declining data costs, technology-enabled business models could become omnipresent across sectors and activities in India over the next decade. That will likely create significant economic value in each of these sectors. At the same time, the nature of work will change and require new skills.
94%Percentage of small businesses that accept debit or credit card payments
700mEstimated number of smartphones in India by 2023
9Digital India: Technology to transform a connected nation

Core digital sectors could more than double in size by 2025, and each of several newly digitising sectors could contribute $10 billion to $150 billion of economic valueWe consider economic impact across three types of sectors. First are core digital sectors, such as IT-BPM; digital communication services, including telecom services; and electronics manufacturing. Second are newly digitising sectors that are not traditionally considered part of India’s digital economy but have the potential to innovate and adopt digital rapidly, such as financial services, agriculture, healthcare, logistics, and retailing. Third are activities related to government services and labour markets, which can be intermediated using digital technologies in new ways.
India’s core digital sectors accounted for about $170 billion—or 7 percent—of GDP in 2017–18.13 This comprises value added from sectors that already provide digital products and services at scale, such as IT-BPM ($115 billion), digital communication services ($45 billion), and electronics manufacturing ($10 billion). We estimate that these sectors could grow significantly faster than GDP, and their value-added contribution could range from $205 billion to $250 billion for IT-BPM, $100 billion to $130 billion for electronics manufacturing, and $50 billion to $55 billion for digital communication services, totalling between $355 billion and $435 billion and accounting for 8 to 10 percent of India’s GDP in 2025.
Alongside these already digitised sectors and activities, India stands to create more value if it succeeds in nurturing new and emerging digital ecosystems in sectors such as agriculture, education, energy, financial services, healthcare, and logistics. The benefits of digital applications to productivity and efficiency in each of these newly digitising sectors are already visible. For example, in logistics, tracking vehicles in real time has enabled shippers to reduce fleet turnaround time by 50 to 70 percent.14 Similarly, digitising supply chains allows companies to reduce their inventory by up to 20 percent. Farmers can cut the cost of growing rice by 15 to 20 percent using data on soil conditions that enables them to minimise the use of fertilisers and other inputs.15
In cross-cutting areas such as government services and the markets for jobs and skills, digital technologies can also create significant value. For example, shifting government transactions, including subsidy transfers and procurement, online can enhance public-sector efficiency and productivity, and creating online marketplaces that bring together workers and employers could considerably improve the performance of India’s fragmented and largely informal job market.
Unlocking this value will require widespread adoption and implementation. The economic value will be proportionate to the extent that digital processes permeate organisations and their marketing and service delivery channels, shop floors, and supply chains. Our estimates of potential economic value for each sector vary depending on adoption rates by 2025; for example, in areas where the readiness of India’s firms and government agencies is low and considerable effort will be required to catalyse broad digitisation, adoption may be as low as 20 percent. Where private-sector readiness is relatively high and government policy is already supportive of large-scale digitisation, adoption could be as high as 80 percent.
13 Estimates based on industry revenue and cost structures and growth trends.14 Who we are, Rivigo, rivigo.com.15 Pinaki Mondal and Manisha Basu, “Adoption of precision agriculture technologies in India and in some developing
countries: Scope, present status and strategies”, Progress in Natural Science: Materials International, June 2009, Volume 19, Issue 6.
10 Digital India: Technology to transform a connected nation

Box E2.Our methodology for sizing economic valueOur research seeks to analyse and quantify the potential economic impact of digital technology and applications in India over the coming years.
The core digital sectors we describe (IT-BPM, digital communication services, and electronics manufacturing) are already considered part of India’s digital economy, and their GDP contribution is measured based on conventional revenue, expense, and value-added metrics.
Economic data are not available for technology-based business models and applications in newly digitising sectors—such as agriculture, education, energy, financial services, manufacturing, healthcare, logistics, and retail—because national income accounts do not yet track them separately. For these areas, we create broad estimates of potential economic value in the future. We use a value-impact approach to understand and estimate the potential effect of digital adoption on productivity based on micro evidence from sectors and firms. We identify discrete use cases and estimate their potential impact by quantifying the productivity gains possible if they were to scale up and achieve moderate to high levels of adoption. Productivity gains are estimated by measures such as greater output using the same resources, cost savings, time savings, and new sources of capital and labour that could become available with the implementation of digital technologies.
We do not estimate potential GDP impact because the accounting and marketisation of productivity gains remain uncertain and hard to predict. For example, it is unclear whether time saved will convert into productive and paying jobs, and whether new digital services will generate consumer surplus accruing to users of technologies or paid products that yield revenue to producers. Nevertheless, we believe these estimates provide a sense of the order of magnitude of the impact that digitisation represents for an economy of the scale and breadth of India’s.
All our estimates are in nominal dollars in 2025 and represent scope for economic value creation in that year. They do not represent market revenue or profit pools for individual players; rather, they are estimates of end-to-end value to the whole system.
Our estimates of economic value in 2025 represent potential; they are not a prediction. The pace of India’s progress will depend on government policies and private-sector action. Realising the economic value estimated would necessitate investment in digital infrastructure and ecosystems, complementary investment in physical infrastructure and productive capacities, and education and training of the workforce.
In all, we estimate that India has the potential to create considerable economic value by 2025: $130 billion to $170 billion in financial services (including digital payments); $50 billion to $65 billion in agriculture; $25 billion to $35 billion in retail and e-commerce (including supply chain); $25 billion to $30 billion in logistics and transportation; and roughly $10 billion in areas such as energy and healthcare (Exhibit E6). Greater digitisation of government services and benefits transfers could yield economic value of $20 billion to $40 billion combined and up to $70 billion from more efficient skill training and job market matching using digital platforms. The economic value is estimated as a range (see Box E2, “Our methodology for sizing economic value”). While these estimates underscore large potential value, realisation of this value is not guaranteed: losing momentum on the government policies that enable the digital economy would mean India could realise less than half of the potential value by 2025.
11Digital India: Technology to transform a connected nation
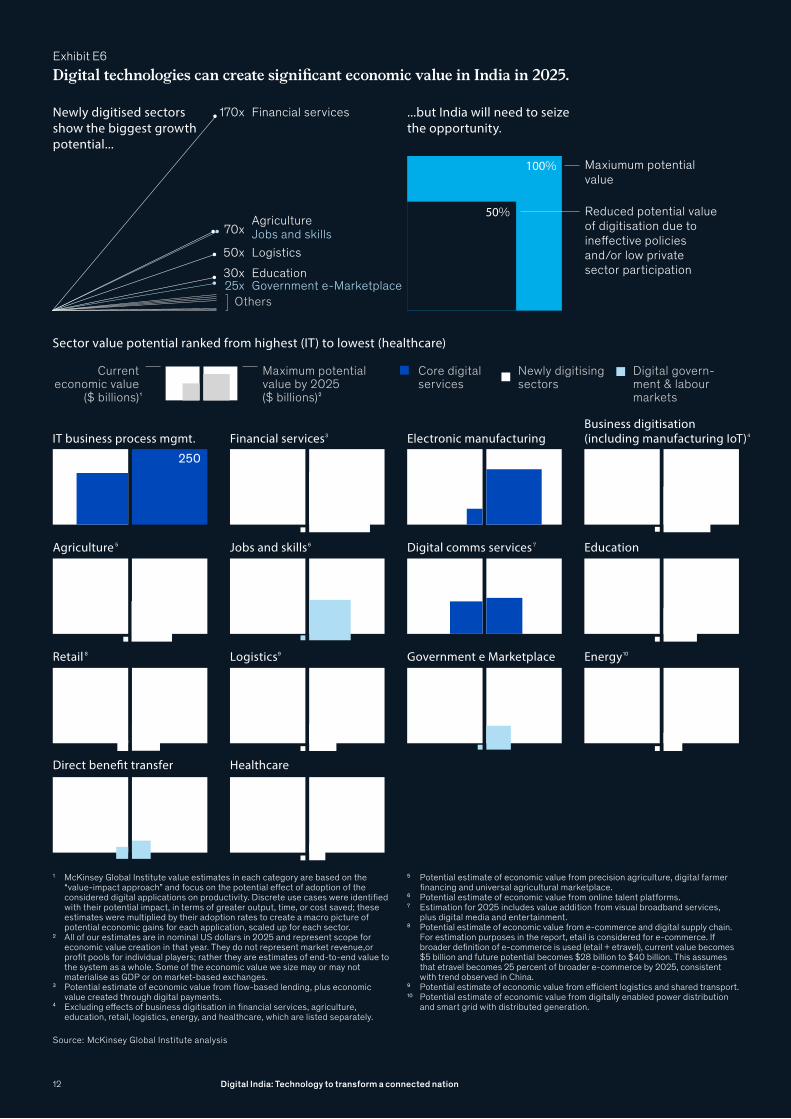
Exhibit E6Digital technologies can create significant economic value in India in 2025.Exhibit E6
Digital technologies can create signi�cant economic value in India in 2025
Source:
McKinsey Global Institute analysis
Others
...but India will need to seize the opportunity.
Newly digitised sectors show the biggest growth potential...
Maxiumum potential value
Reduced potential value of digitisation due to ine�ective policies and/or low private sector participation
IT business process mgmt. Financial services3
Jobs and skills
Logistics
Digital comms services
Government e Marketplace
Education
Energy
Healthcare
Agriculture
Retail
Direct bene�t transfer
Electronic manufacturing
Current economic value
($ billions)
Maximum potential value by 2025($ billions)
Core digital services
Newly digitising sectors
Digital govern-ment & labour markets
100%
Sector value potential ranked from highest (IT) to lowest (healthcare)
1 McKinsey Global Institute value estimates in each category are based on the “value-impact approach” and focus on the potential e�ect of adoption of the considered digital applications on productivity. Discrete use cases were identi�ed with their potential impact, in terms of greater output, time, or cost saved; these estimates were multiplied by their adoption rates to create a macro picture of potential economic gains for each application, scaled up for each sector.All of our estimates are in nominal US dollars in 2025 and represent scope for economic value creation in that year. They do not represent market revenue,or pro�t pools for individual players; rather they are estimates of end-to-end value to the system as a whole. Some of the economic value we size may or may not materialise as GDP or on market-based exchanges.Potential estimate of economic value from �ow-based lending, plus economic value created through digital payments.Excluding e�ects of business digitisation in �nancial services, agriculture, education, retail, logistics, energy, and healthcare, which are listed separately.
Potential estimate of economic value from precision agriculture, digital farmer �nancing and universal agricultural marketplace.Potential estimate of economic value from online talent platforms.Estimation for 2025 includes value addition from visual broadband services, plus digital media and entertainment.Potential estimate of economic value from e-commerce and digital supply chain. For estimation purposes in the report, etail is considered for e-commerce. If broader de�nition of e-commerce is used (etail + etravel), current value becomes $5 billion and future potential becomes $28 billion to $40 billion. This assumes that etravel becomes 25 percent of broader e-commerce by 2025, consistent with trend observed in China. Potential estimate of economic value from e�cient logistics and shared transport.Potential estimate of economic value from digitally enabled power distribution and smart grid with distributed generation.
2
3
4
5
6
7
8
9
10
115 <1 10 <1
<145<1<1
3 <1
<15
<1 <1
5055
35
70
30 25 15
15 10
250 130 90
70
Jobs and skills
Government e-Marketplace25x
Financial services
Logistics
Agriculture
Education
170x
50x
70x
30x
50%
170
2 1
5
8 9 10
76
12 Digital India: Technology to transform a connected nation
4
Business digitisation (including manufacturing IoT)
12 Digital India: Technology to transform a connected nation

Productivity unlocked by digital applications could create up to 65 million jobs for Indians by 2025, but up to 45 million workers will need retraining and redeploymentPrior MGI research on the effects of automation and other technologies on work has found that while some jobs will be displaced, and others created, most occupations will change as machines complement humans in the workplace.16 That in turn will require a new focus on retraining. For India, we estimate that the new digital economy may render obsolete all or parts of 40 million to 45 million existing jobs by 2025, particularly those in highly predictable, nonphysical activities, such as the work of data-entry operators, bank tellers, clerks, and insurance claims- and policy-processing staff. Consequently, many millions who currently hold these jobs will need to be retrained and redeployed.
At the same time, heightened productivity and increased demand generated by digital technology applications may create enough new jobs to offset that substitution and employ more workers if the requisite training and investments are made. We estimate that 60 million to 65 million new jobs could be created through the direct impact of productivity-boosting digital applications.
New skills will be needed for jobs of the futureJobs of the future will be more skill-intensive. The need for functional digital literacy will increase across the board. For example, many more delivery workers will need to use apps to navigate their way around the city, shop floor workers will need to understand and respond to the output of precision control systems, farm advisory agents will need to read intelligent apps on their tablets and discuss implications with farmers, and health workers will need to learn how to extract and upload data into intelligent health management information systems. Routine tasks like data processing will be increasingly automated.
Along with rising demand for skills in emerging digital technologies (such as the Internet of Things, artificial intelligence, and 3-D printing), demand for higher cognitive, social, and emotional skills, such as creativity, unstructured problem solving, teamwork, and communication, will also increase. These are skills that machines, for now, are unable to master. As the technology evolves and develops, individuals will need to constantly learn and relearn marketable skills throughout their lifetime. India will need to create affordable and effective education and training programs at scale, not just for new job market entrants but also for midcareer workers.
Four sectors in which digital forces can have a transformative effectTo capture the potential economic value that we size at a macro level, businesses will need to deliver digital technologies at a micro level: that is, use digital technologies to fundamentally change the way individuals and businesses interact and perform day-to-day activities. We examine the potential shifts in interactions between individuals and institutions (predominantly businesses, although government agencies also play important roles in many value chains). These interactions will shift because of three digital forces: those that allow people to connect or collaborate, transact, and share information; those that enable organisations to automate routine tasks to increase productivity; and those that provide the tools for organisations to analyse data to make insights and improve decision making. The interplay of these three forces will lead to the emergence of new data ecosystems in virtually every business sector or domain, spurring new products, services, and channels, and creating economic value for consumers as well as components of the ecosystem that best adapt their business models.
16 See Jobs lost, jobs gained: Workforce transitions in a time of automation, McKinsey Global Institute, December 2017. For this report, we used similar analysis with different time frames.
Exhibit E6
Digital technologies can create signi�cant economic value in India in 2025
Source:
McKinsey Global Institute analysis
Others
...but India will need to seize the opportunity.
Newly digitised sectors show the biggest growth potential...
Maxiumum potential value
Reduced potential value of digitisation due to ine�ective policies and/or low private sector participation
IT business process mgmt. Financial services3
Jobs and skills
Logistics
Digital comms services
Government e Marketplace
Education
Energy
Healthcare
Agriculture
Retail
Direct bene�t transfer
Electronic manufacturing
Current economic value
($ billions)
Maximum potential value by 2025($ billions)
Core digital services
Newly digitising sectors
Digital govern-ment & labour markets
100%
Sector value potential ranked from highest (IT) to lowest (healthcare)
1 McKinsey Global Institute value estimates in each category are based on the “value-impact approach” and focus on the potential e�ect of adoption of the considered digital applications on productivity. Discrete use cases were identi�ed with their potential impact, in terms of greater output, time, or cost saved; these estimates were multiplied by their adoption rates to create a macro picture of potential economic gains for each application, scaled up for each sector.All of our estimates are in nominal US dollars in 2025 and represent scope for economic value creation in that year. They do not represent market revenue,or pro�t pools for individual players; rather they are estimates of end-to-end value to the system as a whole. Some of the economic value we size may or may not materialise as GDP or on market-based exchanges.Potential estimate of economic value from �ow-based lending, plus economic value created through digital payments.Excluding e�ects of business digitisation in �nancial services, agriculture, education, retail, logistics, energy, and healthcare, which are listed separately.
Potential estimate of economic value from precision agriculture, digital farmer �nancing and universal agricultural marketplace.Potential estimate of economic value from online talent platforms.Estimation for 2025 includes value addition from visual broadband services, plus digital media and entertainment.Potential estimate of economic value from e-commerce and digital supply chain. For estimation purposes in the report, etail is considered for e-commerce. If broader de�nition of e-commerce is used (etail + etravel), current value becomes $5 billion and future potential becomes $28 billion to $40 billion. This assumes that etravel becomes 25 percent of broader e-commerce by 2025, consistent with trend observed in China. Potential estimate of economic value from e�cient logistics and shared transport.Potential estimate of economic value from digitally enabled power distribution and smart grid with distributed generation.
2
3
4
5
6
7
8
9
10
115 <1 10 <1
<145<1<1
3 <1
<15
<1 <1
5055
35
70
30 25 15
15 10
250 130 90
70
Jobs and skills
Government e-Marketplace25x
Financial services
Logistics
Agriculture
Education
170x
50x
70x
30x
50%
170
2 1
5
8 9 10
76
12 Digital India: Technology to transform a connected nation
4
Business digitisation (including manufacturing IoT)
13Digital India: Technology to transform a connected nation

To highlight the kinds of business model changes that companies should envisage and prepare for, we examine how the connect-automate-analyse trio can play out across four sectors: agriculture, healthcare, retail, and logistics.
Digital agriculture: More than 40 percent of India’s labour force works in agriculture, which contributes about 18 percent of the country’s GDP.17 Farms are small, averaging a little more than one hectare, and inefficient, with crop yields ranging from 50 to 90 percent of those in Brazil, China, Russia, and other developing economies.18 Many factors contribute to this. Indian farmers have a dearth of machinery and relatively little data on soil health, weather, and other variables; according to the government’s online farmer advisory portal, about 50 percent of farmers’ queries pertain to weather-related information.19 Because of poor logistics and warehousing, about $15 billion worth of agricultural produce went to waste before reaching consumers in 2013.20
Digital technology can transform India’s agriculture ecosystem in several ways (Exhibit E7). Online bank accounts can provide the income and spending data that farmers need to qualify for cheaper credit from banks. Digital land-registry records could make crop insurance available to more farmers. Precision agriculture—delivering real-time data to farmers’ mobile phones to help them optimise fertiliser, pesticide, and other inputs—can increase yields by 15 percent or more.21 After harvest, farmers could use variants of online marketplaces for agricultural produce to transact with a larger pool of potential buyers. One such platform, the government’s electronic National Agriculture Market, or eNAM, is available in 585 locations in 16 states and shows potential to increase prices realised by farmers by 15 percent.22 Combined, these and other digital technologies can help food production better keep pace with population growth and add $50 billion to $65 billion of economic value in 2025.23
17 Our estimates based on official data sources including Report on fifth annual employment-unemployment survey (2015–16), Ministry of Labour and Employment, Government of India; First advance estimates of national income 2018–19, Ministry of Statistics and Programme Implementation press release, January 7, 2019.
18 India’s technology opportunity: Transforming work, empowering people, McKinsey Global Institute, December 2014.19 Kisan Call Centre dashboard, mKisan, Government of India.20 Wastage of agricultural produce, Ministry of Food Processing Industries press release, August 9, 2016.21 Digital transformation initiative: Unlocking $100 trillion for business and society from digital transformation,
World Economic Forum, January 2017; Rapid introduction and market development for urea deep placement technology for lowland transplanted rice, International Fertilizer Development Centre, 2017.
22 Ramesh Chand, Doubling farmers’ income: Rationale, strategy, prospects and action plan, National Institution for Transforming India policy paper number 1/2017, March 2017; eNAM, Ministry of Agriculture and Farmers Welfare, Government of India, May 2018.
23 Ramesh Chand, Doubling farmers’ income: Rationale, strategy, prospects and action plan, National Institution for Transforming India policy paper number 1/2017, March 2017.
40%The percentage of India’s labour force that works in agriculture
14 Digital India: Technology to transform a connected nation

Typical farming cycle
Financing and risk mitigation
Lenders(such as banks and local money lenders)
Government agricultureprogram databases (soil healthcards, eNAM sales records,mKisan and KCC engagement)
Traditional public datasources (India Meteorological Department, digital landholding records)
Private sector data collection(agricultural inputs sales records, IoT device sensing, farm data from satellite images, customer preferences)
Farm advisory �rms²(use aggregated data to o�er real-time best practices and advice)
Suppliers of consumables(such as seeds and fertiliser)
Suppliers of equipment(such as tractors)
Buyers of farm produce(such as local middlemen)
Insurance companies
Planning and pre-planting
Planting and in-season care
Harvesting Selling
Connect– Digital markets for produce – Real-time monitoring and measuring using the Internet of Things (IoT)– Digitally shared farm equipment
1
1 1 1
2
Automate– Farm management tools– Digitally enabled “smart” farm equipment
Analyse– Farm advisory for precisions agriculture– Digital farmer �nancing and insurance
3
3 3
Digital �nancial platforms
IoT monitoring devices
Sharing platforms
Marketplace internet platform
Digital advisory applications
Data ecosystem
Digital distruptions Enabling platforms and applications
Key stakeholdersData ecosystem
Exhibit E7Farms of the future: making data-driven decisions from seeding to selling.1
1 This schema imagines how the Indian agricultural landscape could look in five to ten years if digital applications were to be widely adopted. This would require an open and interoperable data ecosystem, clear guidelines about data ownership and usage, wide availability of broadband connectivity in rural areas, and digital literacy among farmers.
2 This role in the ecosystem could be taken on by a new player (a startup) or an existing player (such as suppliers of consumables or equipment).
NOTE: Applications in italic type are explored in depth in this report.
SOURCE: McKinsey Global Institute analysis
15Digital India: Technology to transform a connected nation

Digital healthcare: India has too few doctors, not enough hospital beds, and a declining share of state spending on healthcare relative to GDP.24 While life expectancy has risen to 68.3 years from 37 in 1951, the country still ranks 125th globally.25 Indian women are three times as likely to die in childbirth as women in Brazil, Russia, China, and South Africa—and ten times as likely as women in the United States.26 India also trails other big emerging economies in infant mortality, childhood nutrition, and other public health markers. India has the world’s highest incidence of tuberculosis, the most cases of HIV/AIDS outside of Africa, and three-fourths of all malaria cases in South and Southeast Asia. Indians are less likely to survive breast cancer than people in China or the United States, and more likely to succumb to heart attacks at an earlier age.
Digital solutions can help, not just in alleviating the demand-supply mismatch by freeing up 15 percent of the time of scarce healthcare professionals, but also in improving quality and trust (Exhibit E8). Telemedicine lets doctors consult with patients over a digital voice or video link rather than in person; this could enable them to see more patients, thereby easing the doctor shortage in rural areas. In trials and pilots, telemedicine cuts consultation costs by about 30 percent. If telemedicine replaced 30 to 40 percent of in-person outpatient consultations, India could save up to $10 billion and improve care for the poor and those living in remote areas. Consolidating individual patients’ lifelong medical history into an electronic health record (EHR) can help healthcare providers make more accurate diagnoses and lower the risk of medical errors. Once stripped of information that could identify patients, EHRs also could reduce administrative costs and provide data for medical research. Some hospitals in India already practice evidence-based care, using digital platforms to give doctors and nurses access to the best recent research to supplement their clinical expertise. The Manipal Hospitals chain of medical centres uses IBM Watson for Oncology, a cognitive computing platform, to analyse cancer patients’ records and present oncologists with a range of potential diagnoses and personalised treatment options.27
Digital retail: More than 80 percent of all retail outlets in India—most of them sole proprietorships or mom-and-pop shops—operate in the cash-driven informal economy. That compares with 55 percent of retailers in China and 35 percent in Brazil.28 Because a large part of their trade happens in cash, owners of these businesses do not generate the financial records needed to apply for a bank loan. That limits their growth potential and their opportunity to acquire productivity-enhancing digital tools. Large retailers have their own troubles. Their business models, based on manual store operations and high inventory levels, are capital heavy. They tend to give little thought to customers’ in-store experiences or long-term loyalty. In many cases, retailers’ marketing practices are outdated and ineffective, and their prices are static regardless of inventory or demand.
24 Current health expenditure (percent of GDP), World Bank, 2015.25 World health statistics 2018, World Health Organization.26 Healthcare in India: New milestones, new frontiers, Organisation of Pharmaceutical Producers of India, December 2016.27 “Manipal Hospitals announces national launch of IBM Watson for Oncology: Evidence-based cancer care now available
pan-India for Manipal and non-Manipal patients”, IBM press release, July 29, 2016, ibm.com/press.28 “Traditional grocery stores” category in Euromonitor International Retailing Edition 2019; we refer to traditional grocery
stores as mom-and-pop stores.
16 Digital India: Technology to transform a connected nation

Digital solutions could reshape interactions among players in the value chain (Exhibit E9). E-commerce can enable retailers to expand without resorting to the capital-intensive brick-and-mortar model. Some do not even bother with their own website, instead relying on third-party sites like Amazon, which offer large, ready pools of shoppers along with logistics, inventory, and payment services as well as customer data analytics. Likewise, digital payments automatically create financial records to establish the creditworthiness of both the store and its customers, making access to formal finance easier. Digital marketing, through social media or other means, can engage customers and build brand loyalty. We estimate that e-commerce sales in India would grow faster than sales at brick-and-mortar outlets, allowing digital retail to increase its share of trade from 5 percent currently to about 15 percent by 2025.
Telemedicine platform
Digital insurance platform
Insurance
Distributor Pharma companyPatient
Patient-facing digital applications
Care providers
Patient data ecosystem
Back-o�ce functions(scheduling, claims,records, etc)
Physician
Electronic health record (Consultation history, diagnostic results, procedures, prescriptions)
Financial records (Insurance claims, payment history)
Wellness records(Exercise and sleep patterns,allergies, immunisation records)
Connect– Telemedicine– Remote monitoring w/IoT– Online doctor comparison
1 2
2
Automate– Electronic health records– Applications for chronic disease management– Automation of claims, scheduling, etc; rural doctor accountability tools
Analyse– Evidence-based care analytics– Data-driven utilisation management and risk-sharing– Digitised insurance underwriting and claims
3
3
2
2
3
3 1
1 1
Digital distruptions Enabling platforms and applications
Key stakeholdersData ecosystem
Exhibit E8Healthcare in the future: digital technologies enable seamless care centered on patients.1
1 This schema imagines how the Indian healthcare landscape could look in five to ten years if digital applications were widely adopted. This would require an open and interoperable electronic health record ecosystem, clear guidelines about data ownership and privacy, the wide availability of broadband connectivity in rural areas, and rules about who can see records.
NOTE: Applications in italic type are explored in depth in this report.
SOURCE: McKinsey Global Institute analysis
17Digital India: Technology to transform a connected nation

Digital logistics (including transportation): Economists forecast that India will add more than $1 trillion of incremental GDP by 2022, one of only five economies globally to achieve this feat.29 That would challenge the overburdened logistics network, which already suffers from a fragmented trucking industry, inadequate railways infrastructure, and a shortage of warehousing. India spends about 14 percent of GDP on logistics, compared with 12 percent in South America, 9 percent in Europe, and 8 percent in the United States, according to McKinsey estimates. High costs and low performance assume greater importance in light of the government’s “Make in India” programme, which seeks to increase manufacturing’s share of GDP from about 16 percent to 25 percent by 2022.
Digital transformation is likely even in this traditional, physical sector (Exhibit E10). To prevent logistics from getting in the way, the government is creating a transactional e-marketplace,
29 The $1 trillion incremental GDP estimate assumes that India continues growing at its current rate. GDP per capita growth has exceeded 5 percent annually since 1995. See Outperformers: High-growth emerging economies and the companies that propel them, McKinsey Global Institute, September 2018, and Global Outlook, Economist Intelligence Unit, January 2019.
Data ecosystem
Manufacturer Wholesaler Retailer Customer
Independent online B2C retail channels²
Third-party online B2B retail channels
Third-party online B2C retail channels
Financial(digital payments, GSTN data)
Customer data2
(purchase history, occupation, age, gender)
ConnectSmaller retailer– Online selling (and buying)
Larger retailer– Online selling (and buying)– In-store digital applications for
immersive customer experience
1 2
Automate– Digital solutions for store/inventory management
– Digital solutions for store/inventory management
Analyse– Financing– Digital payments
– Digital marketing– Personalised o�ers– Optimal pricing
3
3
2 1
11
Digital distruptions Enabling platforms and applications
Key stakeholdersData ecosystem
Exhibit E9Retail in the future: data-enriched client experiences, online and in stores.1
1 This schema imagines how the Indian retail landscape could look in five to ten years if digital applications were widely adopted. This would require clear rules about permissible e-commerce practices, significant growth in consumer banking and digital payments, wide availability of broadband connectivity in rural areas, continued growth in internet subscribers and smartphone owners, and widespread digital literacy among consumers.
2 This is relevant primarily for large retailers.
NOTE: Applications in italic type are explored in depth in this report.
SOURCE: McKinsey Global Institute analysis
18 Digital India: Technology to transform a connected nation

the National Logistics Platform, to connect shipping agencies, logistics services, inland container depots, container freight stations, banks, and insurance agencies with customs authorities, seaport and airport officials, and railways managers.30 By creating a place where stakeholders can share information and coordinate plans, the platform is intended to speed deliveries, reduce inventory requirements, and smooth order processing.
Private logistics firms also are enlisting digital solutions to streamline operations. These include moving freight booking online, automating customer service, installing tracking devices to monitor truck and cargo movements and increase productivity, leveraging real-time weather and traffic data to map the most efficient routes, and equipping trucks with internet-linked sensors that alert dispatchers when a vehicle needs maintenance. According to McKinsey estimates, digital interventions that result in higher system efficiency and better asset utilisation can reduce logistics costs by 15 to 25 percent.
30 “Department of Commerce developing national logistics portal”, Ministry of Commerce & Industry press release, August 23, 2018, pib.nic.in.
Data ecosystem (decentralised using blockchain)
Logistics platform
Telematics
Demand and supply oflogistics services at agranular level in the country
Vehicle and driver data(obtained by tracking and tracing devices attached to vehicles)
Warehouse and storage data(stock availability, space availability, count of relevant items, etc)
Connect– Platformisation– Decentralised network
technology to create anetwork of connectedstakeholders
1
2
2
Automate– Dashboard user interfaces and data logs– Automated bookings– Predictive maintenance for vehicles
Analyse– Telematics: real-time monitoring and analytics using IoT devices– Inventory and route optimisation– Warehouse space optimisation
3
3
3
3
1
Source (supplier, stockyard, etc)
Freight forwarder Carrier Destination
Digital distruptions Enabling platforms and applications
Key stakeholdersData ecosystem
Traditional staggered �ows Instantaneous digital �ows
Exhibit E10Logistics in the future: digital technologies allow supply-chain consolidation and analysis.1
1 This schema imagines how the Indian logistics landscape could look in five to ten years if digital applications were widely adopted. This would require robust roads, railways, ports, and other infrastructure; standards for logistics data sharing; and rules on ownership and liability.
NOTE: Applications in italic type are explored in depth in this report.
SOURCE: McKinsey Global Institute analysis
Data ecosystem (decentralised using blockchain)
Logistics platform
Telematics
Demand and supply oflogistics services at agranular level in the country
Vehicle and driver data(obtained by tracking and tracing devices attached to vehicles)
Warehouse and storage data(stock availability, space availability, count of relevant items, etc)
Connect– Platformisation– Decentralised network
technology to create anetwork of connectedstakeholders
1
2
2
Automate– Dashboard user interfaces and data logs– Automated bookings– Predictive maintenance for vehicles
Analyse– Telematics: real-time monitoring and analytics using IoT devices– Inventory and route optimisation– Warehouse space optimisation
3
3
3
3
1
Source (supplier, stockyard, etc)
Freight forwarder Carrier Destination
Digital distruptions Enabling platforms and applications
Key stakeholdersData ecosystem
Traditional staggered �ows Instantaneous digital �ows
19Digital India: Technology to transform a connected nation

Implications for business, government, and individualsFor India to reap the full benefits of digitisation—and minimise the pain of transitioning to a digital economy—business leaders, government officials, and individual citizens must play distinct roles and work together.
Business leaders will need to assess how and where digital could disrupt their company and industry and set priorities for how to adapt to the changing environment. Potential disruptions and benefits may be particularly large in India because of its scale, the rapid pace of digitisation, and its relatively low current productivity in many sectors. For firms to seize the benefits of these digital changes, leaders will need to act quickly and decisively to adapt their companies’ existing business models and to digitise internal operations. In this context, four imperatives stand out.
First, companies will need to take smart risks in adapting current business models and adopting new, disruptive ones. Only 46 percent of Indian firms in our survey reported having a coordinated plan to change their long-term operations to react to large-scale disruption.
Second, digital should be front of mind as executives strategise. Customers are becoming more digitally literate and have come to expect the convenience and speed of digital, whether they are shopping online or questioning a billing irregularity, but many companies do not meet their expectations. In our survey, 80 percent of firms cite digital as a “top priority”, but only 41 percent say their digital strategy is fully integrated with the company’s overall strategy.
Third, firms will need to invest in building digital capabilities quickly, especially hiring talent needed to implement and accelerate digital transformation. That is especially challenging in India because many of its most talented workers emigrate and rarely return. Companies could partner with universities to recruit and develop talent, beginning with digital natives who are currently enrolled or have recently finished their studies. Skills and capabilities that need to be developed in this cohort include nonlinear and lateral thinking to go beyond well-defined processes and methodologies, a strong technology-first bias when solving business problems, and an “open source mentality” that helps students stitch together multiple sources of knowledge to solve problems. Companies will also need to build deeper understanding of technology and capabilities at all levels of their organisations, including in the C-suite. Senior executives will need to champion digital and advanced analytics initiatives across their firms.
Finally, firms will need to encourage agile, digital-first organisation. This may require a new attitude that puts digital first, starting with a “test and learn” mind-set that encourages rapid iteration and a high tolerance for failure and redeployment.
India’s government has done much to encourage digital progress, from clarifying regulations to improving infrastructure to launching the Digital India initiative, an ambitious plan to double the size of the country’s digital economy. However, much work remains to be done for India to capture its full digital potential. Government can help by partnering with the private sector to drive digitisation.
Most directly, national and state governments can foster digital growth by continuing to invest in digital infrastructure and the digitisation of government operations. This helps by providing a market for digital solutions, which generates revenue for providers and encourages startups, by expanding access to high-speed internet connectivity, and by giving people more reasons to sign on—whether to receive a cooking-gas subsidy or register the purchase of property.
Government can help further in at least three ways: by creating and administering public data sources that public and private organisations can leverage to improve products and services and even create new ones; by fostering a regulatory environment that supports digital adoption while also protecting citizens’ privacy; and by facilitating the evolution of labour markets in industries disrupted by automation.
20 Digital India: Technology to transform a connected nation

Individual Indians are already reaping the benefits of digitisation as consumers, but they will need to be cognisant that its disruptive powers can affect their lives and work in other fundamental ways, too. As workers in an environment impacted by digital technologies, individuals will need to be aware of how their work may change and what skills they will need to thrive in the future, as well as looking for opportunities to capture the benefits of a new digital-led economy and workplace. Individuals will also need to become stewards of their personal data and sceptical consumers of information.
Preparation can start with awareness of industry innovations and disruptive technologies and with learning how they might affect competing firms and the people who work for them. Preparing for change may involve becoming comfortable with basic digital tools such as mobile phones and the internet, acquiring additional skills in a worker’s current industry, or training for a new line of work.
Workers can also get ahead by building an online presence: as employers increasingly post and fill positions online, it is essential for job hunters to create a personal profile on one or more platform. Thousands of Indians are already using digital technologies to become their own boss; India accounts for 21.5 percent of workers signed up to online outsourcing sites worldwide, second only to the United States. When they are engaged full time, these online outsourcing workers frequently earn as much as or more than Indians in conventional employment.
India’s digital advances over the past few years have gained momentum as both the public and private sectors have propelled the country into the forefront of the world’s consumers of internet and digital applications. Indian business, too, has embraced digital, albeit unevenly, with adoption varying widely among companies and sectors. Navigating the emerging digital landscape is not easy, but it is one of the golden keys to India’s future growth and prosperity. Unlocking the opportunities will be a challenge for the government, for businesses large and small, and for individual Indians across the subcontinent, and some pain will accompany the gains. But if India can continue its digital growth trajectory and accelerate further, the rewards will be palpable to millions of businesses and hundreds of millions of citizens.
21Digital India: Technology to transform a connected nation

22 Digital India: Technology to transform a connected nation

India’s consumer-led digital leap1.India is digitising rapidly. An average mobile data user currently consumes more than 8 GB of data per month, which exceeds the average in more digitally advanced countries such as China and South Korea; India’s average data usage a year ago was just 15 percent of South Korea’s and 50 percent of China’s.31 It has the second-largest number of internet users in the world—more than 550 million—and we estimate that this figure could exceed 800 million by 2023, driven by the increasing availability and decreasing cost of high-speed connectivity and smartphones. The government’s Digital India initiative is bringing broadband internet access to 250,000 gram panchayats, or self-governing village councils, to make it easier for millions more people to connect online.32 Private telecommunications companies are offering attractive packages, providing bundled near-free smartphones and voice plans to anyone who subscribes to their internet services. Such public and private efforts to turbocharge digital adoption have boosted usage: on average, Indians used more than 54 times as much data in 2018 as they did in mid-2016.33
Some of India’s digital potential stems from its previous reticence about adopting technology; it is a big country growing on a small base. E-commerce revenue is soaring, yet only 5 percent of trade is online, compared with 15 percent in China.34 The number of internet subscribers is in the hundreds of millions, but only about 40 percent of the populace.35 And despite the growth of digital wallets and other e-payment options, 90 percent of all retail transactions in India are still made with cash.36 In other words, even as its digital consumer numbers grow, India has plenty of room to continue increasing both the number of internet subscribers and the users of a range of digital services.
India has accelerated the digitisation of its economy and societyIndia has raised its profile among technologically advanced countries, not just in the sheer size of its market and its potential, as highlighted by the number of subscribers to digital services, but also the pace of its digitisation over the last three to four years.
By several measures of digital adoption, India is already among the global leaders (Exhibit 1). Its Aadhaar programme, which can digitally verify the identities of 1.2 billion people, is the world’s largest biometric identification system. India also has the second-largest mobile subscription base, with nearly 1.2 billion subscribers, and the second-largest internet subscription base, with 560 million subscribers.
31 Ministry of Science and ICT, Republic of Korea; Ministry of Industry and Information Technology, People’s Republic of China; and Telecom Regulatory Authority of India, September 2018.
32 For details of the government’s action plan for digital, see India’s Trillion Dollar Digital Opportunity, Ministry of Electronics and Information Technology, Government of India, February 2019.
33 Indian telecom services performance indicators, Telecom Regulatory Authority of India, June 2016 and September 2018.34 China number is for 2015, Euromonitor International Retailing Edition 2019.35 Indian telecom services performance indicators, Telecom Regulatory Authority of India, September 2018.36 “Digital payments in India to reach $1 trillion by 2023: Credit Suisse”, Economic Times, February 15, 2018.
1.2 billionNumber of Indians enrolled in Aadhaar, the world’s largest digital ID programme
23Digital India: Technology to transform a connected nation

On a micro scale, individual Indians are making digital part of their lives. They download more apps—12.3 billion in 2018—than residents of any other country except China.37 About 294 million Indians use social media, and the average Indian social media user spends 17 hours on the platforms each week, more than social media users in either China or the United States.38 On average, Indians consume 8.3 gigabytes (GB) of data every month, compared with about 5.5 GB by the typical Chinese consumer.39
India is one of the world’s fastest-digitising countries but has plenty of room for growthTo gauge India’s relative position, we analysed 30 dimensions of digital adoption in 17 mature and emerging digital economies—including Brazil, China, Indonesia, Russia, South Korea, Sweden, and the United States. The 30 metrics cover three aspects of adoption: digital foundation (such as the cost, speed, and reliability of internet connections); digital reach (the number of mobile devices, app downloads, and data consumption); and digital value (the extent of digital user engagement in texting, tweeting, shopping, and streaming). Across these dimensions, we found that India is digitising faster than all but one other country in the study, Indonesia.
The analysis, summarised in the Country Digital Adoption Index, concluded that India’s digital adoption level rose by 90 percent between 2014 and 2017 (Exhibit 2).40 India’s rate of growth is high across all dimensions of the index, but greatest in the digital foundation section. This was helped by Aadhaar enrolment, which has more than doubled since 2014. Other improvements include the quadrupling of average fixed-line download speed, and the lower price of mobile data.41
37 Priori Data, January 2019.38 Digital in 2018: Global overview, We Are Social, January 2018; Digital in 2018: Southern Asia, Eastern Asia,
Northern America, We Are Social, January 2018.39 Indian telecom services performance indicators, Telecom Regulatory Authority of India, September 2018;
Ministry of Industry and Information Technology, People’s Republic of China.40 In the digital score, “high” represents a rate of growth of above 50 percent over the three-year period,
“medium” is between 25 and 50 percent, and “low” is below 25 percent.41 Akamai’s state of the internet: Q1 2014 report, Akamai Technologies, May 2014; and Akamai’s state of the internet:
Q1 2017 report, Akamai Technologies, March 2017.
Exhibit 1India is among the top two countries globally on many key dimensions of digital adoption.
SOURCE: Priori Data, January 2019; Strategy Analytics, 2018; TRAI, September 30, 2018; UIDAI, April 2018; We Are Social, January 2019; McKinsey Global Institute analysis
Exhibit 1
India no. 1 globally 1.2b
people enrolled in the world’s largest unique digital identity program
India no. 2 globally, behind China
12.3bapp downloads in 2018
1.17bwireless phone subscribers
560minternet subscribers
354msmartphone devices
294musers engaged in social media
India is among the top two countries globally on many key dimensions of digital adoption
Source: Priori Data, January 2019; Strategy Analytics, 2018; TRAI, September 30, 2018; UIDAI, April 2018; We Are Social, January 2019; McKinsey Global Institute analysis
Digital IndiaReport exhibits, VImc 0311
ES and report
[mc]I’ve used Theinhardt Light and Theinhardt Medium (*not* the PPT Bold button).
24 Digital India: Technology to transform a connected nation
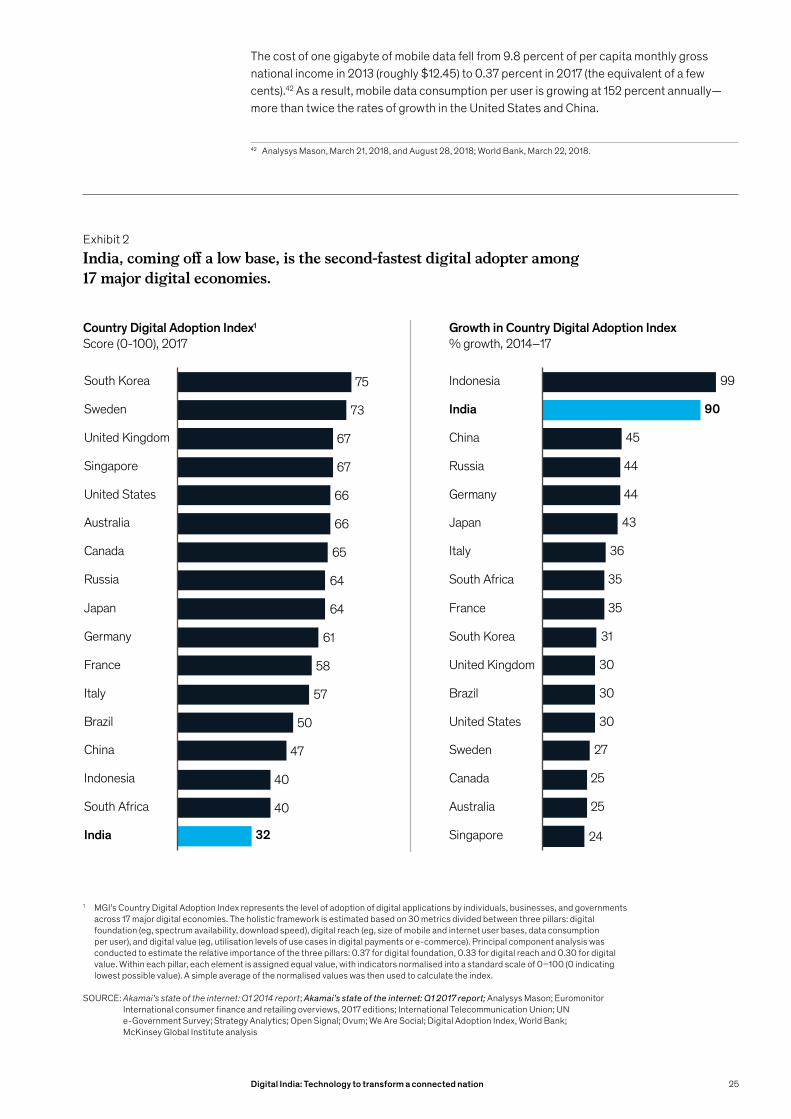
The cost of one gigabyte of mobile data fell from 9.8 percent of per capita monthly gross national income in 2013 (roughly $12.45) to 0.37 percent in 2017 (the equivalent of a few cents).42 As a result, mobile data consumption per user is growing at 152 percent annually—more than twice the rates of growth in the United States and China.
42 Analysys Mason, March 21, 2018, and August 28, 2018; World Bank, March 22, 2018.
Exhibit 2India, coming off a low base, is the second-fastest digital adopter among 17 major digital economies.
1 MGI’s Country Digital Adoption Index represents the level of adoption of digital applications by individuals, businesses, and governments across 17 major digital economies. The holistic framework is estimated based on 30 metrics divided between three pillars: digital foundation (eg, spectrum availability, download speed), digital reach (eg, size of mobile and internet user bases, data consumption per user), and digital value (eg, utilisation levels of use cases in digital payments or e-commerce). Principal component analysis was conducted to estimate the relative importance of the three pillars: 0.37 for digital foundation, 0.33 for digital reach and 0.30 for digital value. Within each pillar, each element is assigned equal value, with indicators normalised into a standard scale of 0–100 (0 indicating lowest possible value). A simple average of the normalised values was then used to calculate the index.
SOURCE: Akamai’s state of the internet: Q1 2014 report; Akamai’s state of the internet: Q1 2017 report; Analysys Mason; Euromonitor International consumer finance and retailing overviews, 2017 editions; International Telecommunication Union; UN e-Government Survey; Strategy Analytics; Open Signal; Ovum; We Are Social; Digital Adoption Index, World Bank; McKinsey Global Institute analysis
Exhibit 2
India, coming o a low base, is the second-fastest digital adopter among 17 major digital economies
Source: Akamai’s state of the internet: Q1 2014 report; Akamai’s state of the internet: Q1 2017 report; Analysys Mason; Euromonitor International consumer nance and retailing overviews, 2017 editions; International Telecommunication Union; UN e-Government Survey; Strategy Analytics; Open Signal; Ovum; We Are Social; Digital Adoption Index, World Bank; McKinsey Global Institute analysis
1. MGI’s Country Digital Adoption Index represents the level of adoption of digital applications by individuals, businesses, and governments across 17 major digital economies. The holistic framework is estimated based on 30 metrics divided between three pillars: digital foundation (eg, spectrum availability, download speed), digital reach (eg, size of mobile and internet user bases, data consumption per user), and digital value (eg, utilisation levels of use cases in digital payments or e-commerce). Principal component analysis was conducted to estimate the relative importance of the three pillars: 0.37 for digital foundation, 0.33 for digital reach and 0.30 for digital value. Within each pillar, each element is assigned equal value, with indicators normalised into a standard scale of 0–100 (0 indicating lowest possible value). A simple average of the normalised values was then used to calculate the index.
75
73
67
67
66
66
65
64
64
61
58
57
50
47
40
40
Russia
South Africa
Canada
South Korea
Brazil
United Kingdom
Sweden
Australia
United States
Singapore
Japan
Germany
France
Indonesia
Italy
China
India 32
ES and report
Country Digital Adoption Index1
Score (0-100), 2017Growth in Country Digital Adoption Index % growth, 2014–17
24
United Kingdom
South Africa
Germany
Indonesia
India
27
Russia
China
Canada
Japan
31
90
Italy
France
South Korea
Brazil
30
36
United States
Sweden
44
Australia
Singapore
99
45
44
43
35
35
30
30
25
25
25Digital India: Technology to transform a connected nation

India’s position in the index also was helped by the fact that more than 210 million Indians joined the global network of internet users between 2013 and 2017, almost doubling the total national penetration rate.43 India added more than 240 million smartphone users over that period, more than quadrupling the smartphone penetration rate, from 5.5 phones per 100 people in 2013 to 22.2 phones in 2017.44 The number of digital payment transactions, including those involving digital wallets, internet banking, and credit or debit card transactions at points of sale, reached 15.3 billion in 2017–18, up from 2.5 billion in 2013–14.45
India’s growth momentum on digital adoption should be viewed in the context of a low base. To maintain its momentum, the country would need to maintain this trajectory and improve on it where possible.
Innovation in the public and private sectors has been essential in driving digital adoptionTwo factors have been primarily responsible for India’s accelerating pace of digital adoption: the government’s dedication to digitising key aspects of the economy, and the private sector’s innovation and investment to promote broader internet access and increased use. In many areas where digital adoption has been quickest, these combined public and private influences are clear to see (Exhibit 3).
Public-sector programmes have laid a solid foundation for private digital innovationThe government accelerated the national digitisation process by building a foundation of digital infrastructure and public platforms—scalable databases and websites—and then introducing digital applications and services. These created real incentives for citizens to go online (see Box 1, “An overview of the Digital India programme”).
Government measures included the rapid ramp-up of Aadhaar, the national biometric digital identity programme, and its subsequent linkage to the payment of welfare benefits. Over 1.2 billion Indians now have Aadhaar digital identities, up from 510 million in 2013; nearly 870 million bank accounts were linked to Aadhaar by February 2018, compared with 399 million in April 2017 and 56 million in January 2014.46
A suite of open application program interfaces (APIs) linked to Aadhaar—such as the Unified Payments Interface and Bharat Interface for Money/Bharat QR code for payments, eKYC for electronic verification of customers’ identities, and DigiLocker for online document storage—makes up a large part of India’s digital foundation and has propelled the country’s digital evolution. The open-source Unified Payments Interface platform, for example, integrates other payment platforms in a single mobile app that enables quick, easy, and inexpensive payments for individuals, businesses, and government agencies.47 DigiLocker permits users to issue and verify digital documents, obviating the need for paper.48
43 Indian telecom services performance indicators, Telecom Regulatory Authority of India, December 2013 and June 2017; calculated as number of subscriptions divided by total population, World Bank, April 19, 2018.
44 Strategy Analytics, May 2017.45 Payment system indicators, Reserve Bank of India, Table 43, March 2015 and September 2017. The above values
have been taken from harmonised sources as of May 2018. They are not the most recent values available.46 Aadhaar, April 18, 2018; Ronald Abraham et al., State of Aadhaar report 2016–17, IDinsight, May 2017;
UIDAI, March 4, 2018.47 “Unified Payments Interface: The product to enable money transfers—both ‘push’ and ‘pull’ through smart phones”,
Ministry of Finance press release, May 6, 2016.48 eSign Online Electronic Signature Service, Controller of Certifying Authorities, cca.gov.in; Aadhar linked digital locker,
Ministry of Communications press release, March 4, 2015.
26 Digital India: Technology to transform a connected nation

Source: Payment system indicators, Reserve Bank of India, Table 43, March 2015 and December 2018; eNAM; GeM; Euromonitor International Retailing Edition 2018; Redseer consulting; NASSCOM; McKinsey Global Institute analysis
27Digital India: Technology to transform a connected nation
Gross merchandise value of e-retail
• India Post• eGovernment
Services India Limited
• RuPay
Pubic sector enablers driving the change
Private sector players disrupting the market
• Motor Vehicles (Amendment) Bill, 2017
• National Career Service
• National Agriculture Market
• Uni�ed Payments Interface
• Government eMarket-place
• Amazon• Flipkart• Ecom Express
• Ola India• Uber
• Naukri.com• LinkedIn
• Walmart• Bigbasket
• Pay TM• State Bank
of India
$ 9bn2015
140m per year2014
8m2010
$ 1bn2016
3.6bn per year2014
$ 5bn2017
$ 0.02bn2017
$ 2.35bn2018
Completed car rides via mobile apps
Job seekers on online talent platforms
Agricultural output transacted through eNAM
Digital payments
Government procurement
through Government
e Marketplace
$ 19bn2018
480m per year2017
31m2015
117.5x2.1x 3.4x 3.9x 5.0x 6.7x
24.3bn per year2018
Exhibit 3
Government procurement leads the growth in public and private sectors over recent years
Digital application use across India is soaring
27Digital India: Technology to transform a connected nation

Separately, the introduction of the Goods and Services Tax Network, which brings all transactions by about 10.3 million indirect taxpaying businesses onto one digital platform, and the digitisation of records at the Ministry of Corporate Affairs are emerging as powerful platforms. Authorised users can make digital tax payments through them, research corporate digital identity and verification, and conduct real-time credit evaluations based on revenue reported through the tax network.49
The government also triggered a growth spike in digital payments through the launch, in 2014, of the Pradhan Mantri Jan-Dhan Yojana, the national financial-inclusion drive, which led millions of people to open Aadhaar-authenticated bank accounts linked to mobile phones. Indians have opened 337 million Jan-Dhan accounts, a threefold jump in four years.50 One of the effects of the government’s move to demonetise high-denomination currency notes in November 2016 was to remove many legal and regulatory barriers to digital payments.
Private-sector competition has helped bring down digital costs, thereby boosting usageOne consequence of the competition and growing private-sector service offerings is that data costs in India have plummeted by more than 95 percent since 2013, providing a major impetus for continued growth in internet access and usage. The average Indian customer in September 2018 used more than 92 times as much data, 8,320 MB, as in 2014, when the monthly average was just 89 MB. In several digitally advanced countries, including the United States and China, data costs dipped below 1 percent of monthly income years ago, triggering comparably large jumps in data consumption. India reached this point in 2017, and as a result data consumption quadrupled from 2016 to 2017 (Exhibit 4).
Consequently, the price of data is no longer a constraint on India’s ability to adopt digital channels for increasingly data-intensive services like remote teleconsultation, e-learning modules, and movie or other entertainment streaming. India’s relatively low level of fixed broadband penetration (1.4 subscriptions per 100 people versus 42.4 in the United Kingdom) makes mobile internet relatively more valuable for consumers who often cannot access the internet in other ways. This should lead to further increases in mobile-driven online activity in the coming years.
49 Role of GST in widening tax base, answer to Lok Sabha unstarred question no. 2405, March 9, 2018.50 Progress report, Pradhan Mantri Jan-Dhan Yojana, January 7, 2019.
28 Digital India: Technology to transform a connected nation

Box 1. An overview of the Digital India programme
The national government introduced Digital India in July 2015, launching projects in each of the following areas to transform how Indians communicate, work, save, and spend:1
— Broadband highway: Provide broadband connectivity in rural areas via optical-fibre cable to gram panchayats; more than 110,000 have been linked so far.2 Improve connectivity in urban areas by adding service providers and solving right-of-way issues. Install broadband and cloud services to government departments up to the panchayat level.
— Universal mobile connectivity: Expand mobile coverage to generate demand for mobile services in rural areas and attract private-sector telecoms and internet service providers. Mobile services already cover 554,530 of the country’s 597,608 villages.3
— Public internet access: Offer public internet access at Common Services Centres and post offices. Currently, service is available at almost 300,000 of the country’s 546,286 CSCs, which are physical facilities for delivering government of India e-services to rural and remote locations where availability of computers and Internet used to be negligible or mostly absent. About 800 CSCs offer Wi-Fi.4
— E-governance: Re-engineer government to improve service and efficiency. Examples include Aadhaar, e-visa, and e-procurement. The central government published 926,070 electronic tenders in 2017–18, up from 476,983 in 2014–15.5
— E-Kranti—electronic delivery of services: Deliver government services digitally to improve efficiency, transparency, and reliability. Progress has been made on 33 of e-Kranti’s 44 “mission mode projects”—high-priority e-governance tasks with clearly defined objectives and measurable outcomes.6
— Information for all: Increase access to government information, starting with the open data platform data.gov.in. Currently, around 255,004 documents, data sets, and other resources are available on the site.7 Another platform, MyGov.in, facilitates citizen engagement with government.
— Electronics manufacturing: Promote electronics manufacturing in India, with the target of net zero imports by 2020. After the duty on imports of mobile components was more than halved, domestic mobile handset manufacturing output increased from 60 million units in 2014–15 to 225 million in 2017–18.8
— IT for jobs: Teach young people the skills needed for IT and IT-enabled jobs. The government has launched several initiatives, but greater scale is required to meet industry needs. Training institutes, higher education institutes, and industry could collaborate on the best approach.
— Early harvest: Implement quick-turnaround projects to illustrate digitisation’s benefits. Examples include a biometric system to track the attendance of 901,713 central government employees, secure government email, a national portal for lost children, and conversion of schoolbooks to e-books.9
1 Digital India, May 1, 2018.2 Aman Sharma, “BharatNet has a new target: Connect every village home”, Economic Times, May 17, 2018; “1.10 lakh
gram panchayats given optical fibre connectivity: government”, Economic Times, February 9, 2018.3 “Over 43,000 villages in India without mobile services: Telecom minister”, Economic Times, August 1, 2018.4 National monthly progress report, Common Services Centres Scheme, April 2018.5 Central Public Procurement Portal, January 2019.6 National e-Governance Division, Digital India, May 3, 2018.7 Mygov.in, January 3, 2019.8 “Mobile phones to get cheaper as government eases import duty”, Hindu BusinessLine, May 6, 2016; MeitY, March 31,
2018.9 Biometric attendance system, May 21, 2018, attendance.gov.in.
29Digital India: Technology to transform a connected nation

Exhibit 4India’s data usage quadrupled in one year as prices fell.
1 In data published by the Telecom Regulatory Authority of India for September 2018, consumption per unique subscriber is shown to have increased to 8,320 MB, putting India on pace to more than quadruple its average consumption again from 2017 to 2018.
SOURCE: Analysys Mason, January 9, 2019; UN Database; McKinsey Global Institute analysis
Exhibit 1
2017
50
2010 1211 1513 16140
10
20
30
40
60
India’s data usage quadrupled in one year as prices fell
Source: Analysys Mason, January 9, 2019; UN Database; McKinsey Global Institute analysis
1. In data published by the Telecom Regulatory Authority of India for September 2018, consumption per unique subscriber is shown to have increased to 8,320 MB, putting India on pace to more than quadruple its average consumption again from 2017 to 2018.
!"#$%&#'()*'+
Data pricePer GB of data (% of monthly GDP per capita)
Data consumptionPer connection, per month (MB)
United States Brazil China India1
1,000
4,000
0
3,500
500
1,500
11 13
1,622
12 20172010
397
1614 15
4x
30 Digital India: Technology to transform a connected nation

Private-sector players have raced to provide services tailored to the Indian marketThe size of India’s market is spurring global technology giants such as Google, Facebook, Microsoft, and Netflix to create services tailored to India’s consumers. Netflix, for example, reportedly plans to spend roughly $300 million on India-focused content for its streaming service.51 Amazon in 2016 introduced Tatkal, a streamlined registration process that aims to enable India’s small- and medium-size enterprises to set up shop on Amazon’s platform in under 60 minutes.52 Google’s Android launched the Android One series of low-cost phones and is working with Reliance Jio on a smartphone that would retail for around $30. Facebook, in partnership with the mobile service provider Airtel, is building 20,000 Express Wi-Fi hotspots.53
Local language content and interfaces will be important catalysts for growth in internet usage in a country where the constitution lists 22 scheduled, or official, languages. Digital applications will need to support local languages to succeed in India. One study found that, in 2016, the number of people using an Indian language on the internet surpassed the number of Indians who use English on the web. Their number rose at a compound annual growth rate of 41 percent between 2011 and 2016, when it reached 234 million users.54 And that trend shows no sign of slowing: nine out of ten new internet subscribers in India do not speak English and will consume vernacular content.55 Facebook in India supports 12 local languages, and WhatsApp supports 11 local languages. However, more needs to be done. For example, less than 1 percent of all websites in India are in local languages, compared with 6.0 percent in Russia and 3.4 percent in Japan.56
Private-sector innovation has propelled growth in India’s e-commerce industry. In 2017, India had 176.8 million e-commerce users and $20 billion in consumer e-commerce sales.57 Amazon, Flipkart, and others have used innovative sales and logistics models to grow fast. Amazon offers more than 160 million products from more than 300,000 sellers in India and delivers to 97 percent of serviceable postal codes, with 75 percent of new customers in nonmetro locations.58 Flipkart has registered more than 100,000 sellers and promises new sellers they can register and have their products online and for sale within 15 minutes. Both online retailers have invested significantly in logistics capabilities, especially in smaller towns.59
51 Vidhi Choudhary, “Netflix, Amazon set aside Rs 2,000 crore each in battle for India market”, Livemint, April 10, 2017.52 “Make way for Amazon Tatkal, a unique service-on-wheels for SMBs from Amazon.in”, Amazon press release, April 27,
2017, services.amazon.in.53 Hiroshi Lockheimer, “The best of Android and Google with Android Oreo (Go edition) and Android One”, The Keyword
Google blog entry, February 22, 2018; “MediaTek, Reliance Jio working on Android Go Oreo smartphones”, Hindu BusinessLine, January 30, 2018; Karan Choudhary, “Facebook eyes more likes from Bharat to expand user base”, Business Standard, October 21, 2016; “Facebook partners with Airtel to roll out Express Wi-Fi to deploy 20,000 hotspots in India”, Financial Express, May 4, 2017.
54 India’s languages—defining India’s internet, KPMG in India and Google, April 2017.55 Pankaj Doval, “90% of new net users non-English”, Times of India, April 26, 2017.56 Usage of content languages for websites, W3Techs, January 16, 2019.57 Simon Kemp, Digital in 2018 in Southern Asia, We Are Social, January 2018.58 “Amazon announces a specialised network of 15 fulfilment centres to enhance AmazonNow delivery experience for
customers”, Amazon press release, February 27, 2018, Amazon.in; “Amazon India crosses 3-lakh sellers mark on its marketplace”, Economic Times, February 18, 2018; Anirban Sen, “Amazon claims orders delivered to 97 percent pin codes in second leg of Great Indian Festival”, Livemint, October 21, 2016.
59 “Flipkart Global opens a world of opportunities to Indian sellers”, Flipkart Global Stories, August 24, 2017; Flipkart, May 17, 2018.
234m Number of people using an Indian language online
31Digital India: Technology to transform a connected nation

Financial technology innovation has grown rapidly. One survey ranked India second in the strength of the fintech movement, with 77 percent of consumers saying they use at least one nontraditional firm for financial services.60 Some are reaching huge scale: Alibaba-backed Paytm, India’s largest mobile payments and commerce platform, has more than 300 million registered mobile wallet users and six million merchants.61 Other players are also growing rapidly. Freecharge, with over 54 million wallet customers, handled 500 million transactions in June 2017.62
Indian businesses also have embraced the cloud. India’s public cloud market was estimated at $2.6 billion in 2018 and forecasted to grow to more than $4 billion by 2020.63 About 90 percent of India’s top chief information officers said their companies are either already actively using cloud technologies or plan to do so within the next year. More than 120,000 firms in India already are customers of a single cloud storage business, Amazon Web Services. India’s universal banks have also driven significant digital innovation across the spectrum of financial services, and their regulator, the Reserve Bank of India, recently outlined possible steps for the adoption of blockchain technologies in the financial sector.64
Increased digital access has begun to bridge the gap between rich and poor states and affect lives in profound waysDigital penetration and GDP per capita are strongly correlated. States in the top third of GDP per capita levels, such as Haryana, Maharashtra, and Tamil Nadu, together with the small, highly urbanised states and union territories of Chandigarh, Delhi, and Goa, have the highest internet penetration, ranging between 28 percent in Uttarakhand to more than 170 percent in Delhi. Similarly, states in the bottom third of GDP per capita, such as Bihar, Jharkhand, Madhya Pradesh, and Uttar Pradesh, are among states with the lowest penetration rates: 22 percent in Bihar, for example, and 22 percent in Jharkhand.65
Nonetheless, given widespread adoption, Indian states are bridging the digital gap. In several areas, including the installation of infrastructure like base transceiver stations and penetration of internet services, the relatively lower-income states are growing the fastest (Exhibit 5). For example, low- and moderate-income states as a group accounted for 43 percent of all base transceiver stations in India in 2013; these states accounted for 52 percent of the incremental towers installed between 2013 and 2017.66 Likewise, these two cohorts of states accounted for 43 percent of all internet subscribers in 2013 and 52 percent in the incremental share added between 2014 and 2018.
A state-level analysis reveals that all states have grown their internet subscriber bases by a minimum of 12 percent annually between 2014 and 2018, while states with relatively lower internet penetration rates to begin with, such as Uttar Pradesh, Madhya Pradesh, and Bihar, have grown their subscriber bases distinctly faster, at 24 to 26 percent over the same period. (Exhibit 6).
60 Capgemini, LinkedIn, and Efma, World fintech report 2017, November 2016.61 Harichandan Arakali, “Paytm reloaded: It’s no longer just a mobile wallet”, Forbes, March 15, 2018.62 Devidutta Tripathy and Sankalp Phartiyal, “Axis Bank agrees to buy payments wallet provider FreeCharge for $60 million”,
Reuters, July 27, 2017; “FreeCharge crosses 500 mn transactions”, Economic Times, June 29, 2017.63 “India’s public cloud market to rise by 53 percent, says Akash Ambani”, Times of India, January 19, 2018.64 “RBI arm to launch model platform for blockchain technology soon”, Hindu BusinessLine, September 1, 2017.65 For GDP per capita figures for states and UTs, see “State-wise gross state domestic product (GSDP) at constant prices”,
Ministry of Statistics and Programme Implementation, Government of India, July 31, 2018, mospi.gov.in.66 States are categorised based on their per capita GDP relative to the country’s: “very high income” states have per capita
GDP more than twice India’s average; “high income”, 1.2 to two times; “moderate income”, 0.7 to 1.2 times; and “low income”, less than 0.7 times.
32 Digital India: Technology to transform a connected nation

Exhibit 5Digital infrastructure and online users have grown in both poorer and richer Indian states.
1 States are classified based on their per capita GDP relative to India’s average. “Low income” states: less than less than 0.7 times India’s per capita GDP; “moderate income” states: between 0.7 and 1.2 times; “high income” states: between 1.2 and 2 times; and “very high income” states: >2 times.
NOTE: Figures may not sum to 100% because of rounding. SOURCE: Lok Sabha and Rajya Sabha unstarred questions; TRAI performance indicators, as of September 30, 2018; India’s Economic
Geography in 2025: States, clusters and cities, 2014; McKinsey Global Institute analysis
Exhibit 6
Digital infrastructure and online users have grown in both poorer and richer Indian states
Source: Lok Sabha and Rajya Sabha unstarred questions; TRAI performance indicators, as of September 30, 2018; India’s Economic Geography in 2025: States, clusters and cities, 2014; McKinsey Global Institute analysis
1. States are classi ed based on their per capita GDP relative to India’s average. “Low income” states: less than less than 0.7 times India's per capita GDP; “moderate income” states: between 0.7 and 1.2 times; “high income” states: between 1.2 and 2 times; and “very high income” states: >2 times.
NOTE: Figures may not sum to 100% because of rounding.
794
Very highincome
292
Lowincome1
2 2014014
Moderateincome
Highincome
1,4852 2018017
41
237
122
Base transceiver station coverageThousand
267
73
125
79
17
560
Internet subscribersMillion
[mc]Income colors recur later in document.
33Digital India: Technology to transform a connected nation

Digital applications are affecting the individual lives of ordinary IndiansWe already see evidence of how digital technologies are changing the way many average Indians save, spend, communicate, earn their livings, and communicate with their families. Millions of Indians, especially in big cities, now routinely interact with the world digitally as part of their normal routines. They can, for example, read the news online, request a ride share on their smartphone, order lunch delivery via a phone app, video chat with a friend (Indians log 50 million video-calling minutes a day on WhatsApp), shop at a virtual retailer, pay a bill from their digital wallet, take a course over the internet, or watch a movie streamed to a tablet before nodding off for the night (Exhibit 7). Consumers can access financial accounts and borrow money easily by using online interfaces rather than having to visit a distant bank branch. Online shoppers enjoy not only much more convenience but also greater choice. Consumers in smaller cities, who do not have retail choices comparable to those of large metro areas, account for more than half of new e-commerce purchases in India.67
67 Rasul Bailay and Shambhavi Anand, “How e-commerce companies like Amazon, Flipkart help stores locate new spending cities”, Economic Times, September 1, 2017.
50m The amount of video-calling minutes that Indians log a day on WhatsApp
Exhibit 6Indian states with low internet adoption rates in 2014 have been catching up since then.
1 Quartiles are based on growth of internet subscribers; first quartile states recorded fastest growth in internet subscribers.2 Due to data constraints, some states are grouped together: Andhra Pradesh includes Telangana; Madhya Pradesh includes Chattisgarh;
Bihar includes Jharkhand; Maharashtra includes Goa; Uttar Pradesh includes Uttarakhand; West Bengal includes Sikkim; Gujarat includes Dadra and Nagar Haveli; Tamil Nadu includes Puducherry; Punjab includes Chandigarh; “North-East” includes Arunachal Pradesh, Manipur, Mizoram, Nagaland, Meghalaya, and Tripura.
SOURCE: TRAI Performance Indicators, as of September 30, 2018; McKinsey Global Institute analysis
Exhibit 7
Indian states with low internet adoption rates in 2014 have been catching up since then
Source: TRAI Performance Indicators, as of September 30, 2018; McKinsey Global Institute analysis
1. Quartiles are based on growth of internet subscribers; rst quartile states recorded fastest growth in internet subscribers.2. Due to data constraints, some states are grouped together: Andhra Pradesh includes Telangana; Madhya Pradesh includes Chattisgarh; Bihar
includes Jharkhand; Maharashtra includes Goa; Uttar Pradesh includes Uttarakhand; West Bengal includes Sikkim; Gujarat includes Dadra and Nagar Haveli; Tamil Nadu includes Puducherry; Punjab includes Chandigarh; “Northeast” includes Arunachal Pradesh, Manipur, Mizoram, Nagaland, Meghalaya, and Tripura.
0 20 26
20
96
30
340
15
9836 3810 12 14 3216 282418 22 30
25
Internet penetration, 2014Internet subscribers per 1,000 people
TamilNadu
WestBengal
Odisha
Haryana
Jammu & Kashmir
Rajasthan
HimachalPradesh
Internet subscriber growth2Compound annual growth rate, 2014–18 (%)
Andhra Pradesh
UttarPradesh
Assam KarnatakaGujarat
Bihar
DelhiMaharashtra
KeralaNorth-East
Madhya Pradesh
Punjab
First quartile1 Second quartile Third quartile Fourth quartile
34 Digital India: Technology to transform a connected nation

Exhibit 7Digital technologies are permeating the lives of ordinary Indians, changing their daily routines at every turn.
SOURCE: McKinsey Global Institute analysis
Digital news
Food delivery
Messaging and video calling
Digital education content
Online ride sharing platforms
Digital payments
Digital content entertainment
Online home services portal
>350 million smartphone devices
“Time to get some updates on key events”
“Feeling hungry now, time to order my favourite salad”
“Need to chat with friends about plan for the weekend”
“Need to help my kids with their homework”
“Running late to o ce, let’s book
a taxi”
“The AC in my room needs to be �xed”
“Need to buy school bags and books for
my kids”
“Picking up groceries, paying with my mobile
wallet”
“Got some leisure time to watch my
favourite show”
Over 420,000 food deliveries per day
500 million rides in 2016
7.30am
8.30am
12.30pm
3.00pm
4.00pm
6.00pm
7.30pm
8.00pm
9.00pm
300,000 sellers on Amazon, 176 million
E-commerce users
>20% retail transactions now
cashless
17 hours per week
35Digital India: Technology to transform a connected nation

Millions of poor and rural Indians have benefited from the spread of mobile phone technology and high-speed digital connectivity. Combined with Aadhaar-enabled targeting of beneficiaries, government welfare payments now flow directly into beneficiaries’ bank accounts. Beneficiaries can access the money through a network of banking correspondents who carry micro-ATMs to dispense cash and accept deposits, without losing part of the payments to theft or extortion by the middlemen who used to distribute cash from the government. Electronic transfers of government benefits to consumers’ bank accounts grew more than 26-fold between fiscal year 2014 and fiscal year 2018, and Aadhaar-based micro-ATM transactions grew tenfold in value from fiscal 2017 to fiscal 2018.68 Similarly, millions of rural homemakers living below the poverty line have received cooking-gas subsidies directly into their bank accounts by proving their identity with Aadhaar.
A recent ruling by India’s highest court has limited the use of Aadhaar-enabled eKYC—electronic know-your-customer anti-money-laundering solutions—to verify identities by private-sector entities including banks, fintech companies, and telecom players. Companies are developing and testing ways to verify ID electronically that comply with the judgement, even as advocates pursue legal amendments to allow Aadhaar-enabled eKYC on a voluntary basis. These solutions will be important for millions of people, including those on the move without permanent addresses—for example, migrant workers could activate a new mobile connection in minutes rather than days using Aadhaar eKYC, and will need new forms of Aadhaar-based solutions to enable this convenience. This will make it easier for them to video chat with their families and inexpensively send money home, while also giving them access to music, news, and video content in their primary language.
The wave of digital transformation has also empowered women in India by helping them find gainful employment, one area where they lag behind women in peer countries. For example, 54,800 women have become village-level entrepreneurs at government-run Common Service Centres, providing digital services to the local population.69 In fiscal 2016, the Babajob portal recorded a sevenfold increase in openings for female cab drivers and an increase of more than 150 percent in women’s applications for driver jobs.70 The business process outsourcing (BPO) industry in India employs approximately 4 million workers, about 30 percent of them women.71 A three-year awareness programme in rural India on opportunities in the BPO industry enhanced women’s enrolment in training programmes and increased school enrolment among girls by three to five percentage points.72
The government is also already using technology to issue health advisories. For example, Kilkari, an application that delivers free weekly audio messages on pregnancy, family planning, nutrition, childbirth, and maternal and child care, already has racked up more than 60 million calls.73 The Ministry of Health and Family Welfare designed a doctor-on-call service, the National Health Helpline, which makes 500 qualified doctors available free to citizens at all hours, every day of the year.74 The government also has introduced the National Health Portal to provide information in six languages using a mobile app and a toll-free number; more than 2.6 million people have used the web portal, and 2.2 million have called the number.75
India’s digital footprint has significant room to growIndia’s digital story is still in its infancy. Significant gains have been made, but more are likely to come, especially in the next five to ten years. For example, while the number of smartphones per 100 people in India more than quadrupled from 2014 to 2018, rising from 5.5 to 26.2, the world leader, Sweden, has 95.8 smartphones per 100 people.76 And while the average mobile download speed in India jumped from 1.3 megabits per second in 2014 to 9.9 Mbps in 2018,
68 Direct Benefit Transfer, April 18, 2018; Ronald Abraham et al., State of Aadhaar report 2017–18, IDinsight, May 2018.69 MeitY, April 2018.70 “More women taking up odd jobs; opt to be cab drivers, guards”, Economic Times, June 5, 2016.71 World Development Report 2016: Digital dividends, World Bank, 2016.72 Ibid.73 Ministry of Health and Family Welfare.74 Ibid.75 Ibid.76 Strategy Analytics, December 2018.
36 Digital India: Technology to transform a connected nation

Exhibit 8
India has room to grow in many digital dimensions
Source: Speedtest Global Index by Ookla, November 2018; Analysys Mason, January 9, 2019; Euromonitor Passport, March 29, 2018; ITU, Measuring the Information Society Report 2014, 2017; Strategy Analytics, January 9, 2019; TRAI Performance Indicators, September 30, 2018; Broadband Statistics, OECD, 2017; McKinsey Global Institute analysis
1. The exception to this is for “Average mobile data consumption per user per month” as Finland, the known global leader in data consumption, was not included in our set of 17 countries analysed for the Country Digital Adoption Index.
Number of smartphonesPer 100 people
Average mobile data consumption per user per monthGigabytes
Average mobile download speedMbps
Mobile broadband subscriptions (3G/4G/5G), including donglesPer 100 people
Fixed broadband subscriptionsPer 100 people
Number of cashless transactions per person Per year
IndiaDec 2014
IndiaSep 2018
Singapore2017
5.434.3
144.44.2x
6.4x
IndiaMar 2014
IndiaNov 2018
CanadaNov 2018
1.39.9
59.66.0x
7.6x
IndiaSep 2018
IndiaDec 2014
FinlandDec 2017
0.09
8.30
15.50
92x
1.9x
IndiaDec 2014
95.8
IndiaDec 2018
Sweden2017
5.526.24.8x
3.7x
Singapore2017
IndiaDec 2014
IndiaFY2018
2.2
18.0
802.744.6x
8.2x
IndiaDec 2013
IndiaSep 2018
1.4
France2016
1.2
42.430x
1.2x
India vs highest-performing country among 17 countries considered1
it is still a fraction of the 59.6 Mbps available in Canada.77 Indians consume much more mobile data than they used to—8.3 GB per month, compared with just 89 MB four years earlier—but the average Finn consumes more than twice as much data, 15.5 GB per month.78 And Indian consumers averaged only 18 digital transactions per year in 2017–18, compared with more than 800 by the average consumer in Singapore in 2017 (Exhibit 8).79
77 Speedtest Global Index, Ookla, November 2018.78 Telecom Regulatory Authority of India, September 2018; OECD, 2017.79 Payment system indicators, Reserve Bank of India, Table 43, December 2018; Global Payments Map, May 2017.
Exhibit 8India has room to grow in many digital dimensions.India vs highest-performing country among 17 countries considered1
1 The exception to this is for “Average mobile data consumption per user per month” as Finland, the known global leader in data consumption, was not included in our set of 17 countries analysed for the Country Digital Adoption Index.
SOURCE: Speedtest Global Index by Ookla, November 2018; Analysys Mason, January 9, 2019; Euromonitor Passport, March 29, 2018; ITU, Measuring the Information Society Report 2014, 2017; Strategy Analytics, January 9, 2019; TRAI Performance Indicators, September 30, 2018; Broadband Statistics, OECD, 2017; McKinsey Global Institute analysis
37Digital India: Technology to transform a connected nation

India is on a fast track to adopt key digital attributes, and the number of smartphones and internet subscriptions could continue to increase rapidly in the next five years. We estimate that India could add as many as 350 million smartphones, more than doubling its absolute level.
Just as data costs have fallen sharply and sparked a sharp increase in usage, smartphone penetration has grown rapidly as average prices have fallen. Average smartphone prices dropped from the level of 25 percent of GDP per capita in 2007 to 8 percent in 2014 and have remained relatively stable since then. Smartphone penetration, in response, has increased from 8 percent to 26 percent between 2014 and 2018, when prices bottomed out.
The experience of more digitally advanced nations and peer developing nations suggests that further growth in smartphone ownership is likely in the coming four to five years. The United States was comparable to India’s current 26 percent penetration rate in 2010 and went on to exceed 50 percent penetration in the four years that followed. Likewise, Brazil and China each passed 20 percent in 2012, going on to achieve 52 percent and 71 percent penetration, respectively, in the following four years. If India replicates this trend, its smartphone penetration rate could jump from 26 percent to more than 50 percent by 2023, adding close to 350 million smartphone devices.
A bottom-up scenario suggests the potential for India’s internet subscriber base to reach 835 million by 2023. For this analysis, we looked at how cohorts of India’s states, classified based on income levels, compare in penetration of base transceiver stations and internet subscribers in 2017–18, and estimate growth based on a few assumptions. For example, we assume the two bottom cohorts will reach the internet penetration rates of the next higher cohort over a five-year period; in the high-income states, we assume the internet penetration rate would plateau at 80 internet subscriptions per 100 people (the rate in advanced economies), and the “very high income” group will maintain its current level of penetration of 162 internet subscriptions per 100 people. Based on these assumptions, India has the potential to add about 275 million internet subscribers by 2023, to reach a total of just over 835 million subscribers. Similar assumptions about each cohort matching the base transceiver station penetration rate of the next higher cohort suggest India could add about 1.5 million stations by 2023 (Exhibit 9).
India set out on its digital journey with the goal of transforming itself over a decade into a digitally empowered society and knowledge-based economy that would improve the lives of all citizens. Three and a half years into the Digital India initiative, the country has laid a solid foundation by extending broadband digital access beyond cities and deeply into rural areas. The digital divide between states is being bridged, and through a range of digital initiatives,
>800mSize of India’s potential internet subscriber base in 2023
38 Digital India: Technology to transform a connected nation

many millions of previously underserved and unserved people have been brought into the banking system, the healthcare system, and the educational system. India has already started reaping the benefits of this digital push—but it is just a start. Much more room for growth is available, including for companies, whose digital adoption has thus far been uneven. We examine the digital record of Indian businesses and the opportunities still to be tapped in the next chapter.
Exhibit 9There is significant scope for progress for India if each state begins to perform at the level of the next highest performer.Scenario in which each state performs as well as the next highest performing group of states
1 States are classified based on their per capita income relative to India’s average. “Low income” states: less than 0.7 times; “moderate income” states: between 0.7 and 1.2 times; “high income” states: between 1.2 and 2 times; and “very high income” states: >2 times. The shares of population for very high income, high income, moderate income, and low income states are 2%, 37%, 24%, and 38%, respectively.
2 Includes Delhi, Chandigarh, and Goa.3 Includes Gujarat, Haryana, Himachal Pradesh, Karnataka, Kerala, Maharashtra, Puducherry, Punjab, Tamil Nadu, Telanagana, and Uttarakhand.4 Includes Andhra Pradesh, Chhattisgarh, Jammu & Kashmir, Odisha, Rajasthan, and West Bengal.5 Includes Arunachal Pradesh, Assam, Bihar, Jharkhand, Madhya Pradesh, Manipur, Meghalaya, Mizoram, Nagaland, Sikkim, Tripura, Uttar Pradesh.
SOURCE: Lok Sabha and Rajya Sabha unstarred questions; TRAI Performance Indicators, as of September 30, 2018; McKinsey Global Institute analysis
Exhibit 9
Scenario in which each state performs as well as the next highest performing group of states1
There is sign cant scope for progress for India if each state begins to perform at the level of the next highest performer
Source: Lok Sabha and Rajya Sabha unstarred questions; TRAI Performance Indicators, as of September 30, 2018; McKinsey Global Institute analysis
1. States are classi ed based on their per capita income relative to India’s average. “Low income” states: less than 0.7 times; “moderate income” states: between 0.7 and 1.2 times; “high income” states: between 1.2 and 2 times; and “very high income” states: >2 times. The shares of population for very high income, high income, moderate income, and low income states are 2%, 37%, 24%, and 38%, respectively.
2. Includes Delhi, Chandigarh, and Goa.3. Includes Gujarat, Haryana, Himachal Pradesh, Karnataka, Kerala, Maharashtra, Puducherry, Punjab, Tamil Nadu, Telanagana, and Uttarakhand.4. Includes Andhra Pradesh, Chhattisgarh, Jammu & Kashmir, Odisha, Rajasthan, and West Bengal.5. Includes Arunachal Pradesh, Assam, Bihar, Jharkhand, Madhya Pradesh, Manipur, Meghalaya, Mizoram, Nagaland, Sikkim, Tripura, Uttar Pradesh.6. Capped at 80% for 2023, the current average for the high-income countries.
Base transceiver station coveragePer 1,000 people
500 10 703020 40 60 80 90 100
0.1
Share of population%
2.3
1.40.6
0.80.9
3.8
Additional potential Very high income2 High income3 Moderate income4 Low income5
Internet subscribersPer 100 people
70300 10 20 6040 50 80 90 100
2814
162
Share of population%
26
546
13
41
Total number of base transceiver stationsThousand
Total number of Internet subscribersMillion
2017
1,485
2023
2,951
+1,466
September2018
560
2023
838
+278
39Digital India: Technology to transform a connected nation

40 Digital India: Technology to transform a connected nation

Box 2. Methodology for our survey of 664 Indian firms
The India Firm Digitisation Survey consisted of 50 questions about digital practices.Two hundred twenty large firms (with revenue of more than 5 billion rupees, or $70 million) and 444 small firms (with revenue of less than 5 billion rupees) provided answers across a range of dimensions (Exhibit 10).
To assess their strategies, we asked about their responsiveness to competition, how well their digital strategies align with their broader business strategies, and the extent of their investment in digital technology.
To gauge organisational support for digital, we probed managers’ views on the subject, reviewed the organisation of each firm’s data structure, and gauged how strictly executives monitored key performance indicators for their digital strategy.
To measure a company’s digital capabilities, we gathered information on IT architecture and automation, and then inquired about digital marketing, sales channels, and payments, and how data drives tactical or strategic decisions. We used each firm’s answers to score its level of digitisation—its digital index—and then created the MGI India Firm Digitisation Index to rank the firms. It should be noted that the index reflects self-reported scores from companies rather than objective criteria.
Against the backdrop of rapid digital adoption by India’s consumers, India’s business community is digitising unevenly. Some knowledge-intensive sectors such as information and communications technology (ICT) and financial services are making rapid progress, while many labour-intensive sectors such as trade and manufacturing are lagging behind. Within each sector, levels of digitisation also vary widely. At least a few firms in every sector have pulled ahead of their peers to attain robust levels of digitisation, while others have room to catch up. In this chapter, we discuss the findings of an in-depth survey of 664 large and small Indian companies we conducted to determine the level of digitisation within the firms as well as the underlying traits, activities, and mind-sets that are driving digitisation at a firm level. We used this survey to compile the MGI India Firm Digitisation Index, which highlights the ways in which some companies, both large and small, are pulling ahead of their competitors—and what the laggards need to do to catch up.
Our survey shows that digital leaders have important traits in commonIn search of common traits and themes among digital leaders, we asked each of the 664 firms in our India Firm Digitisation Survey about their digital strategy, digital organisation, and digital capabilities (see Box 2, “Methodology for our survey of 664 Indian firms”).
The digital gap among India’s businesses2.
41Digital India: Technology to transform a connected nation

The survey-based index highlights a large difference between the most and least digitised respondents. Businesses with the strongest alignment in digital strategy and organisational readiness for digital adoption have scores close to 70. The lowest-ranked company is nearer to 10. Rather than focus on these outliers, we split the 664 companies surveyed into four groups based on their scores; a significant gap remained. Companies in the top quartile, which we characterise as digital leaders, had an average score of 58.2, while those in the bottom quartile, the digital laggards, averaged 33.2 (Exhibit 11). The median score was 46.2.
A higher score indicates the company is using digital in its day-to-day operations more extensively (such as implementing CRM or accepting digital payments) and in a more organised manner (such as having a separate analytics team or a centralised digital organisation) than companies with lower scores. Our survey found that, on average, digital leader firms outscored non-leader firms by 70 percent on strategy dimensions (for example, their responsiveness to disruption and investment in digital technologies); 40 percent on organisation dimensions (including level of executive support and use of key performance indicators); and 31 percent on capability dimensions (such as the use of customer relationship management and enterprise resource planning solutions and the adoption of digital payments).
Exhibit 10MGI’s India Firm Digitisation Index ranks companies on three important digital dimensions.
1 Large firms defined as those with more than 5 billion rupees, or $70 million, in annual revenue; small firms are those with less than 5 billion rupees in annual revenue.
SOURCE: McKinsey India firm digitisation survey, May 2017; McKinsey Global Institute analysis
Exhibit 10
Source: McKinsey India rm digitisation survey, May 2017; McKinsey Global Institute analysis
1. Large rms de ned as those with more than 5 billion rupees, or $70 million, in annual revenue; small rms are those with less than 5 billion rupees in annual revenue.
444Small
rms
220
Largerms
Survey sample set1 Digital dimensions evaluated
Strategy Organisation Capabilities
• Responsiveness to competitor digital actions
• Alignment of digital strategy with business strategy
• Extent of digital investment
• Level of leadership support for digital initiatives
• Centralisation of digital organisational structure
• Empowerment of digital organisations
• Use of digital marketing and sales channels
• Adoption of digital payment methods
• Level of IT architectureand automation
664
MGI’s India Firm Digitisation Index ranks companies on three important digital dimensions
[mc]Icons recur later in document.
42 Digital India: Technology to transform a connected nation

All sectors, even those significantly less digitised than others, have digital leadersSome knowledge-intensive sectors such as ICT and financial services are digitising rapidly, with high median scores and relatively few firms with low scores. At the bottom of the scale are trade and transportation.
Yet our survey and index also show that a business’s sector does not wholly determine its digital fate. While some sectors have more digitally sophisticated companies than others, top-quartile companies can be found in all sectors, even those considered less advanced in technology adoption. For example, the trade sector has relatively low levels of digitisation, with 45 percent of firms ranked in the bottom quartile—and one company ranked as a digital leader. Similarly, India’s transportation sector has a company that meets our criteria for a digital leader despite being in the least digitised sector overall. At the same time, sectors that are more highly digitised on average, including ICT, professional services, and education and health, all have bottom-quartile firms that we classify as digital laggards (Exhibit 12).
Exhibit 11There is significant variation in firm digitisation among India’s large firms.
1 Based on 50-question survey of 220 large companies (more than 5 billion rupees, or $70 million in annual revenue). The survey seeks to determine level of digitisation as well as the underlying traits, activities, and mindsets that drive it. Firms are scored based on their responses on dimensions related to digital strategy (eg, responsiveness to disruption, investment in digital technologies); digital organisation (eg, level of executive support, use of key performance indicators); and digital capabilities (eg, use of technologies like CRM and ERP, or adoption of digital payments).
SOURCE: McKinsey India firm digitisation survey, May 2017; McKinsey Global Institute analysis
Exhibit 11
India Firm Digitlisation Index1
There is sign cant variation in rm digitisation among India’s large rms
Source: McKinsey India rm digitisation survey, May 2017; McKinsey Global Institute analysis
1. Based on 50-question survey of 220 large companies (more than 5 billion rupees, or $70 million in annual revenue). The survey seeks to determine level of digitisation as well as the underlying traits, activities, and mindsets that drive it. Firms are scored based on their responses on dimensions related to digital strategy (eg, responsiveness to disruption, investment in digital technologies); digital organisation (eg, level of executive support, use of key performance indicators); and digital capabilities (eg, use of technologies like CRM and ERP, or adoption of digital payments).
30
0
60
35
5
55
10
20
15
25
40
45
50
65
70
Top quartile
>52
Median score
46.2
Bottom quartile
<41
Digital laggards median
33.2Digital leaders median
58.2
Bottom quartile Top quartile
43Digital India: Technology to transform a connected nation

Digitally advanced firms are found not only in all sectors but also in all sizes, whether measured by revenue or number of employees. An analysis of the publicly traded firms in our sample found no correlation between size metrics and level of digitisation.
Exhibit 12Digitisation levels vary more within sectors than across sectors among large Indian firms.India Firm Digitisation Index1
1 Large Based on 50-question survey of 220 large companies (5 billion rupees or $70 million annual revenue). The survey seeks to determine level of digitisation as well as the underlying traits, activities, and mindsets that drive it. Firms are scored based on their responses on dimensions related to digital strategy (eg, responsiveness to disruption, investment in digital technologies); digital organisation (eg, level of executive support, use of key performance indicators); and digital capabilities (eg, use of technologies like CRM and ERP, or adoption of digital payments).
2 ICT comprises telecom services providers, media and information technology companies.3 Financial services comprises banks, finance, and insurance companies.4 Real estate and construction comprises construction companies, real estate developers, and real estate brokerage firms.5 Professional services comprises companies in the fields of consulting, architecture, and stock trading, among others.6 Education and health comprises firms in the fields of health services, pharmaceuticals, and education services.7 Manufacturing comprises firms in manufacturing of textiles, food processing, metal and metal products, petroleum and related products, and others.8 Trade comprises companies trading, both wholesale and retail, commodities (eg, automobiles, sanitary wares).9 Transport comprises firms in logistics and passenger transport.10 Leaders are top quartile firms in terms of firm digitisation index, while laggards are in the bottom quartile.
SOURCE: McKinsey India firm digitisation survey, May 2017; McKinsey Global Institute analysis
Exhibit 12
India Firm Digitisation Index1
Digitisation levels vary more within sectors than across sectors among large Indian rms
Source: McKinsey India rm digitisation survey, May 2017; McKinsey Global Institute analysis
1. Based on 50-question survey of 220 large companies (5 billion rupees or $70 million annual revenue). The survey seeks to determine level of digitisation as well as the underlying traits, activities, and mindsets that drive it. Firms are scored based on their responses on dimensions related to digital strategy (eg, responsiveness to disruption, investment in digital technologies); digital organisation (eg, level of executive support, use of key performance indicators); and digital capabilities (eg, use of technologies like CRM and ERP, or adoption of digital payments).
2. Leaders are top quartile rms in terms of rm digitisation index, while laggards are in the bottom quartile.3. ICT comprises telecom services providers, media and information technology companies.4. Financial services comprises banks, nance, and insurance companies.5. Real estate and construction comprises construction companies, real estate developers, and real estate brokerage rms.6. Professional services comprises companies in the elds of consulting, architecture, and stock trading, among others.7. Education and health comprises rms in the elds of health services, pharmaceuticals, and education services.8. Manufacturing comprises rms in manufacturing of textiles, food processing, metal and metal products, petroleum and related products, and
others.9. Trade comprises companies trading, both wholesale and retail, commodities (eg, automobiles, sanitary wares).10. Transport comprises rms in logistics and passenger transport.
3337
15 1622 21
35
15
71
57
66
74
63
73
54 5360
10
0
70
20
30
40
50
80
Median score in sector
Highest score in sector
Lowest score in sector
!"#$%&#'()*'+
ICT3 Financial services4
Real estate and
construc-tion5
Profes-sional
services6
Education and health7
Manufac-turing8
Trade9 Transport10
Sector median digitisation score
50 48 47 47 46 45 44 43
Leaders% of rms in sector
41 28 40 36 24 21 5 10
Laggards% of rms in sector
26 17 15 20 29 27 45 19
Digital laggards2
<41
Digital leaders2
>52
44 Digital India: Technology to transform a connected nation

Seven traits of effective digital leadersIf sector and size do not explain digital leaders, what does? Our survey found that digital leaders share at least seven traits across the dimensions measured in our survey, three relating to digital strategy and two each in digital organisation and digital capabilities.
— Digital strategy: Leading companies adopt strategies that cause them to stand out from their peers in several ways. They centre their strategies on digital, let digital technologies shape how they engage with their customers, and invest more heavily in digital than their peers. Top-quartile firms are 30 percent more likely than bottom-quartile firms to say they fully integrate their digital and overall strategies. They are 2.3 times more likely to sell their products through e-commerce platforms.
Digital leaders also are more adaptive to unexpected circumstances. They are much more likely to have proactive strategies to deal with digital disruptions; leaders are about 60 percent more likely than laggard firms to plan for a disruption to their supply chains or products and services, and about 3.5 times more likely to prepare for a disruption to their operations or distribution channels. Top-quartile firms are 3.5 times more likely than bottom-quartile firms to say that digital disruptions led them to change their core operations. Indeed, this is a particularly distinctive trait of digital leaders: 53 percent of firms who report having done this have top-quartile digitisation scores.
As part of their overall strategies, digital leaders also make digital investment a priority. Top-quartile firms are 5.5 times more likely than bottom-quartile firms to outspend their peers on digital initiatives, and 40 percent more likely to consider digital a top priority for investment.
— Digital organisation: Many more digital leaders than laggards have a single business unit that manages and coordinates digital initiatives for the entire company. Top-quartile firms are 14.5 times more likely than bottom-quartile firms to centralise digital management, and five times more likely to have a stand-alone, properly staffed analytics team.
Companies we identify as digital leaders tend to have stronger support from their senior executives. Top-quartile firms are 70 percent more likely than bottom-quartile firms to say their CEO is “supportive and directly engaged” in digital initiatives.
— Digital capabilities: Almost by definition, digital leaders are digital adopters, and they use digital productivity tools far more often than laggards. Top-quartile firms are 2.6 times more likely than bottom-quartile firms to use customer relationship management software, for example, and 2.5 times more likely to coordinate the management of their core business operations by using an enterprise resource planning system.
Digital leaders also optimise their digital marketing. Our survey shows that top-quartile companies are 2.3 times more likely than bottom-quartile firms to use search engine optimisation, and 2.7 times more likely to use social media for marketing (Exhibit 13).
While leaders and laggards are similar in some areas—for example, more than 90 percent of each use internet banking and around 75 percent sell through their own websites—significant differences exist in other areas. Less than 2 percent of laggards make use of Internet of Things–enabled products, compared with 51 percent of leading firms; that is another example of how leading companies are quicker to employ new digital technology, as is the fact that two-thirds of leaders but only one-fourth of laggards have optimised their websites for mobile devices.
The difference between firms on the digital frontier and those far behind is not just about whether firms invest in information technology—most companies do. Rather, the gap reflects the degree to which digital assets are used, how they are used, and the extent to which firms digitise their workplaces. Top-performing firms see going digital as an opportunity to reinvent core processes, create new business models, and put customers at the centre of everything.
45Digital India: Technology to transform a connected nation

Exhibit 13India’s digital leaders and laggards differ on critical aspects of digital strategy, organisation, and capabilities.
1 “Leaders” are firms scoring within the top quartile of MGI’s India Firm Digitisation Index, while laggards are firms scoring in the bottom quartile.2 Results of a survey of 220 large firms in India with revenue of more than 5 billion rupees, or $70 million.
SOURCE: McKinsey India firm digitisation survey, May 2017; McKinsey Global Institute analysis
Exhibit 13
Digital strategy
Seeing digital as a priority for investment
Spending more than peers on digital
Reporting digital strategy fully integrated with overall strategy
Reporting having changed core operations due to digital disruptions
Digital organisation
Have a fully centralised digital organisation
Have a standalone analytics team
Digital capabilities
Have fully implemented CRM systems
Using mobile apps for digital marketing
34
13
2
9
22
24
85
45
46
29
58
62
10
55
69
47
2.6x
1.2x
1.3x
5.5x
14.5x
3.5x
5.2x
2.6x
India’s digital leaders and laggards d er on critical aspects of digital strategy, organisation, and capabilities
Source: McKinsey India rm digitisation survey, May 2017; McKinsey Global Institute analysis
1. Results of a survey of 220 large rms in India with revenue of more than 5 billion rupees, or $70 million. “Leaders” are rms scoring within the top quartile of MGI’s India Firm Digitisation Index, while “Laggards” are rms scoring in the bottom quartile.
% of digital laggards surveyed1,2 % of digital leaders surveyed1,2
46 Digital India: Technology to transform a connected nation

Highly digitised firms also can rewrite the rules of competition by disrupting intermediaries, breaking apart value chains, and exploiting network effects and low marginal costs to gain hyperscale. When digitisation reaches critical mass across industries, it can spark fierce price competition, shifting profits, and competitive churn in commercial ecosystems.80 Digitally enabled innovations can have powerful network effects with “winner-take-most” dynamics, although India may not yet be on the edge of such an economy-altering revolution.
Even digital leaders have room to improveDigital leaders excel in several of the dimensions we used to compile the India Firm Digitisation Index. For example, 95 percent of the leaders are using or in the process of implementing digital distribution channels. More than 85 percent of digital leaders see digital investment as one of their most important priorities. However, on many dimensions, even leaders have a long way to go (Exhibit 14).
For example, only 55 percent of leaders currently believe they are investing more in digital than their peers. Similarly, while top-quartile firms are much more likely than bottom-quartile firms to say their CEO is supportive and directly engaged in digital initiatives, such CEOs are still in the minority in India: only 40 percent of chief executives at digital leaders are directly engaged in digital initiatives. Among bottom-quartile firms, that share drops to 24 percent.
80 Digital America: A tale of the haves and have-mores, McKinsey Global Institute, December 2015.
95% Percentage of digital leaders that use or are implementing digital distribution channels
Exhibit 14India’s digital leaders still have ample room for improvement in many areas.% of firms responding
1 “Leaders” are firms scoring within the top quartile of MGI’s India Firm Digitisation Index.2 Results of a survey conducted across 220 large firms in India with revenue of 5 billion rupees, or $70 million.
SOURCE: McKinsey India firm digitisation survey, May 2017; McKinsey Global Institute analysis
Exhibit 14
India’s digital leaders still have ample room for improvement in many areas
Source: McKinsey India rm digitisation survey, May 2017; McKinsey Global Institute analysis
1. “Leaders” are rms scoring within the top quartile of MGI’s India Firm Digitisation Index.2. Results of a survey conducted across 220 large rms in India with revenue of 5 billion rupees, or $70 million.
% of rms responding
10 6020 30 40 50 70 80 100900
30
17
37 45
46
55
8 29
26 40
23
33
47
23 49
58
41 65
Strategy
Has a digital strategy that is fully integrated with the overall strategy
Has changed core operations in response to disruption
Believes they invest more in digital than peers do
Organisation
Has a centralised, company-wide digital organisation
CEO supports and is directly involved in digital initiatives
Has a distinct, stand-alone analytics team with the appropriate talent
Capabilities
Uses the Uni ed Payments Interface (UPI) for interbank transfers
Has implemented a Customer Relationship Management system
Makes extensive use of digital channels to reach customers
% of leaders not reporting this attribute
% of digital leaders reporting this attribute1
% of non-leader rms reporting this attribute
42
71
60
53
51
35
55
45
54
47Digital India: Technology to transform a connected nation

Only 45 percent of India’s digital leaders indicated that they have aligned their digital strategy and overarching business strategy. Answers to follow up questions revealed that some of the remainder focus on connecting digital to a particular business unit or a single function, such as marketing or IT, rather than the entire company.
Easy wins can help bottom-quartile firms begin to close the gap with digital leadersThe survey also offers a glimpse of paths to improvement for all Indian companies, leaders and laggards alike. While the gap between firms is large, those who are behind may be able to begin to close it by digitising in small, relatively simple ways (Exhibit 15).
Social media marketing is a good example. Bottom-quartile firms are 70 percent less likely than top-quartile businesses to utilise social media to attract and serve new customers, and less than half as likely to use e-commerce or listing platforms. However, these sales channels are cheap and easily accessible, and a business owner with a smartphone and a high-speed internet connection will encounter few barriers to taking advantage of them.
Exhibit 15India’s digital laggards can begin to close the gap with digital leaders by adopting relatively simple digital solutions.% of firms responding
1 “Leaders” are firms scoring within the top quartile of MGI’s India Firm Digitisation Index, while laggards are firms scoring in the bottom quartile.2 Results of a survey conducted across 220 large firms in India with revenue of 5 billion rupees, or $70 million.
SOURCE: McKinsey India firm digitisation survey, May 2017; McKinsey Global Institute analysis
Exhibit 15
% of rms responding
India’s digital laggards can begin to close the gap with digital leaders by adopting relatively simple digital solutions
Source: McKinsey India rm digitisation survey, May 2017; McKinsey Global Institute analysis
1. “Leaders” are rms scoring within the top quartile of MGI’s India Firm Digitisation Index, while laggards are rms scoring in the bottom quartile.2. Results of a survey conducted across 220 large rms in India with revenue of 5 billion rupees, or $70 million.
Leader-laggard gapPercentage points
Make use of technologies for digital marketing
Social media 38
Email 29
Company website 18
Conduct sales through digital channels
E-commerce platforms 37
Listing platforms 32
Text messages 20
Make use of basic digital solutions
Industry-wide software 47
ERP system 44
CRM system 36
Digital laggards1,2Digital leaders1,2
60
93
89
64
56
67
85
73
58
22
71
27
24
47
38
29
22
64
48 Digital India: Technology to transform a connected nation

Digital payments are another example. Among bottom-quartile firms, only 18 percent receive more than one-fourth of their revenue through electronic means; among digital leaders, that proportion is 69 percent, nearly four times as high. In other words, almost three in four of the bottom-quartile companies receive at least 75 percent of their revenue in cash. Easy-to-use, inexpensive digital payment applications could help companies—even those, like food vendors, who by necessity conduct their business face-to-face—close the digital payments gap.
Productivity-enhancing business software presents another opportunity for those lagging behind to catch up with the digital leaders. Indeed, only 58 percent of top-quartile companies already use customer relationship management systems. That compares with 22 percent of bottom-quartile firms, which are also behind on use of enterprise resource planning systems (29 percent) and industry-specific software (38 percent). These findings indicate how much room firms have to catch up.
Small businesses are closing the digital gap with larger firmsInvesting in some advanced technologies, such as artificial intelligence and the Internet of Things, tends to require the financial resources and expertise of large companies. However, growing high-speed internet connectivity and shrinking data costs are opening digital opportunities for many small business owners and sole proprietors in India. More than 86 percent of the small firms surveyed believe digital has created new roles in the company.
As noted earlier, a firm’s size—as measured by revenue—was not predictive of its overall level of digitisation across our sample of 664 businesses. In some technology areas where agility is key to adoption, small firms have even surpassed their larger counterparts (Exhibit 16).
Digital payments are one example. Small businesses are ahead of large companies in accepting digital payments and are paving the way for increased adoption of digital as a replacement for cash payments. In our survey, 94 percent of small firms said they accept payment by debit or credit card, compared with only 79 percent of big firms; for digital wallets, the figures were 78 percent versus 49 percent.
Small companies also are more willing to use digital technologies such as video conferencing and chat to support their customers. Where they are behind large companies, the gap is often not very large. For example, our survey found that 70 percent of small firms have built their own websites to reach clients, compared with 82 percent of large firms, and are just about as likely as those big companies to have optimised their websites for mobile devices. Small firms are less likely than big firms to buy display ads on the web (37 percent versus 66 percent), but they are ahead of big companies in connecting with customers via social media, and more likely to use search engine optimisation to make themselves easier to find.
More than 60 percent of the small firms surveyed use LinkedIn to hire talent, and about half believe that most of their employees today need to have basic digital skills. The absence of those skills may explain why 27 percent of the small firms surveyed still outsource some or all their digital jobs and responsibilities.
While only 51 percent of smaller firms said they “extensively” sell goods and services via their websites (compared with 73 percent of big businesses), small businesses use e-commerce platforms and other digital sales channels just as much as large firms and are equally likely to receive orders through digital means like WhatsApp.
58% Proportion of top-quartile firms that use CRM systems
49Digital India: Technology to transform a connected nation

The uneven digitisation of Indian businesses is both an opportunity and a challenge. As digital strategy, organisation, and capabilities become key points of differentiation, a new generation of leaders is emerging that appears to be pulling ahead of their peers. These leaders in the top quartile of our India Firm Digitisation Index progressed by fully committing to invest capital, acquire expertise, and build every part of their businesses around digital technology. Companies that are behind risk losing out as digital raises productivity and boosts innovation—and revenue. Yet nothing is set in stone. While some companies lead, their peers have myriad ways to catch up, and even the leaders have considerable room to harness the power of the new technologies more fully. As all companies wrestle with the imperatives of the digital age, the potential benefits are coming into view. In the next chapter, we look at how big those benefits could be by sizing the value of digital applications in a number of key sectors.
Exhibit 16Small firms trail big firms in digital marketing and sales but lead in payments in India.% of firms with extensive use
1 Large firm results from a survey conducted across 220 large firms in India with revenue of more than 5 billion rupees, or $70 million.2 Small firm results from a survey conducted across 444 small firms in India with revenue of less than 5 billion rupees, or $70 million.
SOURCE: McKinsey India firm digitisation survey, May 2017; McKinsey Global Institute analysis
Exhibit 16
% of rms with extensive useSmall rms trail big rms in digital marketing and sales but lead in payments in India
Source: McKinsey India rm digitisation survey, May 2017; McKinsey Global Institute analysis
1. Large rm results from a survey conducted across 220 large rms in India with revenue of more than 5 billion rupees, or $70 million.2. Small rm results from a survey conducted across 444 small rms in India with revenue of less than 5 billion rupees, or $70 million.
55
51
39
30
29
57
73
41
45
40
Sellingthrough mobileapplications
Receivingorders viatext messages,WhatsApp, etc.
Selling viaown website
Selling via e-commerceplatforms
Sellingthrough listingplatforms
70
55
50
39
37
82
48
42
46
66
Companywebsite
Searchengineoptimisation
Online addisplays
Social mediapresence
Mobile app
96
94
80
78
50
46
96
79
75
49
52
30
Internetbanking
Mobilebanking
Debit or credit cards
UPI (BHIM)
Mobilewallets
POS
Digital marketing activities Digital channels Payment methods
Small rms signi cantly behind large rmsSmall rms signi cantly ahead of large rms
Small rms1
Large rms2
50 Digital India: Technology to transform a connected nation

51Digital India: Technology to transform a connected nation

52 Digital India: Technology to transform a connected nation

Digital technologies and platforms are poised to fundamentally change the way Indian businesses operate internally and how they interact with their customers, suppliers, and competitors. These technologies make it easier for businesses, people, and machines to communicate instantly and continuously, eliminating intermediaries and enabling easier collaboration, transactions, and sharing of information. Digital can increase productivity by automating many tasks while at the same time collecting and analysing data to identify inefficiencies, detect flaws and errors, and enable products and services to be customised.
Much is at stake in India’s digital transformation. In this chapter, we size the potential economic benefits that could be achieved if the country successfully integrates digital technologies in all sectors by 2025.81
Widespread digital adoption has the potential to create significant value in all sectors of the economy by 2025With digital applications becoming omnipresent in all sectors, we consider how they can create value in three distinct types of sectors and activities. First are the core digital sectors of IT-BPM, electronics manufacturing, and digital communication services. These sectors, already well recognised as part of India’s digital economy, are inherently digital in nature or create products and services that help others digitise. Second are newly digitising sectors such as agriculture, financial services, healthcare, and logistics, which have traditionally not been considered sectors of the digital economy but are increasingly using digital applications to become more productive. Third are government services and markets for jobs and skills, both of which are ripe for digital applications that can boost efficiency.
Core digital sectors already constitute a large and growing portion of India’s economy and could contribute $355 billion to $435 billion of GDP in 2025India’s digital economy in 2017–18 accounted for 8 percent of nominal GDP, or about $200 billion, according to our estimates. Most of this value—$170 billion—comes from core digital sectors that already provide digital products and services at scale, including IT and business process management, or IT-BPM ($115 billion); digital communication services, including telecommunications ($45 billion); and electronics manufacturing, including mobile handsets ($10 billion). The remaining value comes from early scaling of newly digitising sectors and applications like e-commerce and direct benefit transfers. Core digital sectors are expected to grow significantly faster than overall GDP growth, and their GDP contribution could range from about $355 billion to $435 billion by 2025, according to our estimates.
India’s IT-BPM industry recorded $154 billion in revenue and accounted for 3.7 million jobs in 2017.82 As global IT industry spending shifts toward new digital technologies and away from legacy systems, the industry has the potential to generate $285 billion to $350 billion
81 Economic value is estimated as a range, based on the potential output of digital provider sectors (such as IT-BPM and electronics manufacturing) as well as the potential adoption rate of key digital applications in other sectors and the possible value arising, as a result, from higher productivity, resources savings, and tapping new factors of production. See the technical appendix.
82 Make in India, January 7, 2019, makeinindia.com.
Potential economic impact of digital applications in 2025
3.
53Digital India: Technology to transform a connected nation

in revenue, translating into $205 billion to $250 billion of value added in 2025. For this, it will need to look beyond its current business model and build capabilities in advanced digital applications—including automation, cloud, cybersecurity, mobile, AI, 3-D printing, IoT, big data analytics, and social media—that are already transforming its clients globally.83
Digital communication services are another example of a rapidly evolving sector, one with a potential economic value of $50 billion to $55 billion in 2025. It consists of two connected but distinct components: revenue and value added from digital communication services and from creation of digital content. India’s data consumption will continue increasing at a rapid clip, propelled by rising smartphone penetration, increased broadband connectivity in remote areas of the country under the BharatNet2, and increasingly affordable data costs. Greater consumption in turn will drive more content creation. India’s broadcast networks developed their own over-the-top on-demand video streaming platforms—Hotstar, SonyLIV, and VOOT—to meet rising demand among increasingly connected consumers and to compete with new rivals. Global platforms such as Netflix and Amazon Prime Video operate in India, producing or coproducing original content for the Indian market.
Mobile handset manufacturing is a relatively new area of India’s digital economy. Imports of mobile handsets declined by 37 percent from 2015–16 to 2016–17, in response to the government’s Phased Manufacturing Programme, under which import duty is imposed on certain subassemblies in cellular mobile handsets manufacturing. India has started attracting investment in local producers. Some 118 units manufacturing mobile handsets and components have emerged in the past three years, creating employment for about 450,000 persons directly and indirectly.84 Mobile handset production rose from 60 million units valued at $2.9 billion in 2014–15 to 225 million units valued at $20.3 billion in 2017–18.85 A similar approach could spur manufacturing of other digital devices such as medical electronics, LCD/LED televisions, LED lighting products, and set-top boxes, along with automotive electronics. Overall, electronics manufacturing has the potential to contribute $100 billion to $130 billion in value added by 2025.
In newly digitising sectors, moderate to high adoption of a diverse set of digital applications and business activities could occur by 2025Alongside these already digitised sectors and activities are a number of sectors including agriculture, education, energy, financial services, healthcare, and logistics that have not traditionally had technology at their core. If India can nurture digital ecosystems and applications in these areas, it could create considerable value. We sought to estimate the potential economic value of digital technologies in these sectors by identifying transformative digital opportunities, or sets of applications, whose economic value can be quantified. They span a diverse set of sectors, ranging from financial services, education, and healthcare to transport, trade, logistics, manufacturing, and agriculture. (For more on the methodology behind these figures, see Box 3, “Using a value-impact approach to measure the digital economy in India”.)
Some benefits of digital are already visible in these sectors, at times as the result of successful pilot implementation. For example, in logistics, tracking vehicles in real time has enabled truckers to reduce fleet turnaround time by 50 to 70 percent.86 Digitising supply chains allows companies to reduce their inventory by 10 to 20 percent. In agriculture, farmers can cut the cost of growing rice by 15 to 20 percent by harnessing data on soil conditions, which can help them minimise the use of fertilisers and other inputs.87 A digital agricultural marketplace allows more buyers to bid on commodities, pushing up prices for the farmers by as much as 15 percent.
83 Fact sheet of IT & BPM industry, Ministry of Electronics & Information Technology.84 Ministry of Electronics & Information Technology, March 2018.85 Ibid.86 Who we are, Rivigo, rivigo.com.87 Pinaki Mondal and Manisha Basu, “Adoption of precision agriculture technologies in India and in some developing
countries: Scope, present status and strategies”, Progress in Natural Science: Materials International, June 2009, Volume 19, Issue 6.
54 Digital India: Technology to transform a connected nation

Box 3. Using a value-impact approach to measure the digital economy in India
This research seeks to analyse and quantify the potential economic impact of digital technology and applications in India over the coming years. The starting point when setting out to measure the digital economy is to first define the term. The Organisation for Economic Co-operation and Development describes the internet economy as “the full range of our economic, social and cultural activities supported by the internet and related information and communications technologies”, underscoring the concept’s sweeping nature and scope.1
Methodological challenges when measuring the size of the digital economy start with the nature of GDP and its measurement system, which recognises only market-based, priced interactions as economic goods. For instance, booking a hotel room online directly online, rather than going through a travel agent or app that charged for the service, would imply loss of GDP, unless the time saved was deployed in market-based activities.2 Many digital products, such as email, web search, and apps, are offered free or at very low marginal cost to the consumer, while prices of others, such as smartphones, tablets, and connectivity, are falling. This implies more surplus for consumers of these goods but potentially less GDP accounted for by their producers. It is not clear how large this effect is—one research study has concluded that the slowdown in US productivity growth (as measured by GDP) over the last decade cannot be explained by the shift in value from measured revenue to unmeasured consumer surplus.3
Given these challenges, researchers have used various approaches to estimate the size of the digital economy. The direct-impact approach measures GDP value added using the expenditure method, assessing private consumption expenditure, public expenditure, private investment, and trade balance, which are closely related to digital products and services. Estimates vary, but studies show that the size of the digital economy is 1 to 7 percent of GDP in the countries considered.4 The dynamic-impact approach looks at the statistical relationship between a country’s digital profile and economic development. In a recent study, the Institute for Competitiveness ran a state-level regression of GDP per capita on capital, labour, and internet penetration and found that a 10 percent increase in internet penetration results in a 3.9 percent increase in GDP per capita.5
1 Measuring the internet economy: A contribution to the research agenda, OECD Digital Economy Paper number 226, OECD, 2013.2 Nadim Ahmad and Paul Schreyer, Are GDP and productivity measures up to the challenges of the digital economy? OECD, 2016.3 Chad Syverson, “Challenges to mismeasurement explanations for the US productivity slowdown”, The Journal of Economic Perspectives,
American Economic Association, spring 2017, Volume 31, Number 2.4 Measuring the internet economy: A contribution to the research agenda, OECD Digital Economy Paper number 226, OECD, 2013.5 Amit Kapoor, Chirag Yadav, and Neera Vohra, Impact of Reliance’s entry: A socio-economic analysis of Jio-fication and India’s GDP story,
Institute for Competitiveness, March 2018.
We use a value-impact approach to understand and estimate the potential effect of digital adoption on productivity based on microevidence from sectors and firms. We identify discrete use cases and estimate their potential impact in terms of the productivity gains possible if they were to scale up and achieve moderate to high levels of adoption. Productivity gains are estimated through drivers such as greater output using the same resources, cost savings, time savings, or new sources of capital and labour that could become available with the use of digital technologies.
The core digital sectors we describe (IT-BPM, digital communication services, and electronics manufacturing) are already considered part of India’s digital economy, and their GDP contribution is measured based on conventional revenue, expense, and value-added metrics. For the newly digitising sectors (such as agriculture, education, energy, financial services, manufacturing, healthcare, logistics, and retail), as well as government services and markets for jobs and skills, no economic data exist today for technology-based business models and applications, which are nascent or emerging, and not separately tracked in national income accounts. For these areas, we focus on creating broad estimates of potential economic value in the future. We do estimate potential GDP impact because the accounting and marketisation of productivity gains remain uncertain and hard to predict.
All of our estimates are in nominal dollars in 2025 and represent the potential for economic value creation in that year. They do not represent market revenue or profit pools for individual players; rather, they are estimates of end-to-end value to the system as a whole. Some of the economic value we size may or may not materialise as GDP or market-based exchanges. For example, it is unclear whether time saved will actually convert into productive and paying jobs, and whether new digital services will generate consumer surplus accruing to users of technologies or paid products that yield revenue to producers. Nevertheless, we believe these estimates provide a sense of the order of magnitude of the impact that digitisation represents for an economy of the scale and breadth of India’s.
Finally, our estimates of economic value in 2025 represent India’s potential, not a prediction. The pace of progress will depend critically on government policies and private-sector action. Conducive government policies and programs could spur entrepreneurs to innovate and help India’s economy and society to fully incorporate new digital technologies. For further details, see the technical appendix.
55Digital India: Technology to transform a connected nation

Unlocking the potential value of digital in these sectors, as suggested by various pilots, will require widespread adoption. The economic value will be proportionate to the extent to which these digital processes permeate organisations. We segment the opportunities on the basis of their likely adoption rate, which is a function of two dimensions: the degree of public-sector support and readiness of enabling regulations and policies (since a number of them, like healthcare, require policy amendments), and the degree of private-sector readiness and interest, which is based on examples of scaled digital applications that have been implemented and by investment made in the private sector (Exhibit 17).
Based on this assessment, we classify India’s digital opportunities into three groups according to potential adoption range by 2025.
First are digital applications in areas where implementation is scaling up rapidly in the private or public sector, or where there is significant unfulfilled demand due to policy barriers government is already addressing. Examples of the former include e-commerce and the government’s e-marketplace for online procurement. Examples of the latter include flow-based lending on the back of Goods and Services Tax Network data and other sources of digitised business data, from government sources, utilities like credit scoring agencies, or proprietary data aggregators. Such applications have the potential for the highest adoption rates by 2025. We estimate this potential adoption to be between 60 and 80 percent of the addressable market.
Exhibit 17Public- and private-sector readiness drive digital adoption in India.Potential adoption rates of addressable activities in 20151
Selected prioritised use cases shown
1 Adoption refers to percent of relevant addressable using a technology by 2025; adoption range of 20 to 80 percent over 2018–25 comes from adoption curve developed in A future that works: Automation, employment, and productivity, McKinsey Global Institute, 2017.
2 Purchases outside of the government online purchase system.3 Including e-commerce.
SOURCE: India’s Trillion Dollar Digital Opportunity, Ministry of Electronics and Information Technology, Government of India, February 2019; McKinsey Global Institute analysis
Exhibit 17
Public- and private-sector readiness drive digital adoption in India
Source: McKinsey Global Institute analysis
1. Adoption refers to percent of relevant addressable using a technology by 2025; adoption range of 20 to 80 percent over 2018–25 comes from adoption curve developed in A future that works: Automation, employment, and productivity, McKinsey Global Institute, 2017.
2. Purchases outside of the government online purchase system.3. Including e-commerce.
Public sectorsupport
High
LowLow High
Private sector readiness
Potential adoption rates of addressable activities in 20251
Selected prioritised use cases shown
• Universal agricultural marketplace• Precision agriculture• Digital farmer nancing and insurance payout(s)• Customisable student learning platforms
• Telemedicine consultations• Applications for chronic disease management• Online buying or selling and digital supply chain• Flow-based lending and advanced credit
underwriting• Digitally enabled power generation• Government e Marketplace2
• Digital marketing3
• Digital payments
• Smart grids with distributed generation• Online talent platforms• Electronic health record
• Business digitisation and IoT-based analytics• Evidence-based care using analytics• E cient transportation and logistics platform
60–80%
40–60%
40–60%
20–40%
56 Digital India: Technology to transform a connected nation

Second are digital applications that are attracting strong private-sector interest and for which the government is taking facilitating steps, or where the government is addressing barriers to accelerate private-sector moves. Examples of the first type include business digitisation within firms and digital logistics platforms, while examples of the latter include farmers trading produce through online agricultural marketplaces. Although these areas will require policy measures (such as the creation of a market facilitator to spur online agriculture trading), they could be driven by private-sector innovation for the most part, with the government playing a facilitating role. These applications would have the potential for moderate adoption rates, 40 to 60 percent of the addressable market, by 2025.
Third are digital applications in areas that require concerted government action, for example to implement digital platforms or through significant policy reform. One example of this would be government mandates to use electronic health records in the healthcare system. Another would be creation of an online database that can track the employment journey of every worker in the country, enabling large pools of individuals and institutions to collaborate in matching labour market demand and supply. These applications have potential for levels of adoption by 2025 that we assume could be between 20 and 40 percent of the addressable market.
Newly digitising sectors could realise significant value from digital technologies, as could government services and labour market innovationsDigital applications spreading into new opportunity areas, such as education, healthcare, and agriculture, that have low levels of digitisation at present, at the adoption rates mentioned above, have the potential to create significant economic value by 2025. Newly digitising sectors, as well as digital applications in government services and jobs and skills markets, could each create $10 billion to $150 billion of incremental economic value in 2025 (Exhibit 18).
We assessed economic value potential across nine sectors, ordered by their potential scale of value creation. They are financial services and digital payments; agriculture; education; retail and e-commerce; logistics, supply chains, and efficient transportation; energy; healthcare; e-government services; and jobs and skills markets. In the next chapter, we dive deeper into four sectors—agriculture, healthcare, retail, and logistics—to assess specifically how interactions between individuals and institutional entities within these sectors could be reshaped as new data ecosystems emerge in them.
57Digital India: Technology to transform a connected nation

Exhibit 18Digital technologies can create significant economic value in India in 2025.Exhibit E6
Digital technologies can create signi�cant economic value in India in 2025
Source:
McKinsey Global Institute analysis
Others
...but India will need to seize the opportunity.
Newly digitised sectors show the biggest growth potential...
Maxiumum potential value
Reduced potential value of digitisation due to ine�ective policies and/or low private sector participation
IT business process mgmt. Financial services3
Jobs and skills
Logistics
Digital comms services
Government e Marketplace
Education
Energy
Healthcare
Agriculture
Retail
Direct bene�t transfer
Electronic manufacturing
Current economic value
($ billions)
Maximum potential value by 2025($ billions)
Core digital services
Newly digitising sectors
Digital govern-ment & labour markets
100%
Sector value potential ranked from highest (IT) to lowest (healthcare)
1 McKinsey Global Institute value estimates in each category are based on the “value-impact approach” and focus on the potential e�ect of adoption of the considered digital applications on productivity. Discrete use cases were identi�ed with their potential impact, in terms of greater output, time, or cost saved; these estimates were multiplied by their adoption rates to create a macro picture of potential economic gains for each application, scaled up for each sector.All of our estimates are in nominal US dollars in 2025 and represent scope for economic value creation in that year. They do not represent market revenue,or pro�t pools for individual players; rather they are estimates of end-to-end value to the system as a whole. Some of the economic value we size may or may not materialise as GDP or on market-based exchanges.Potential estimate of economic value from �ow-based lending, plus economic value created through digital payments.Excluding e�ects of business digitisation in �nancial services, agriculture, education, retail, logistics, energy, and healthcare, which are listed separately.
Potential estimate of economic value from precision agriculture, digital farmer �nancing and universal agricultural marketplace.Potential estimate of economic value from online talent platforms.Estimation for 2025 includes value addition from visual broadband services, plus digital media and entertainment.Potential estimate of economic value from e-commerce and digital supply chain. For estimation purposes in the report, etail is considered for e-commerce. If broader de�nition of e-commerce is used (etail + etravel), current value becomes $5 billion and future potential becomes $28 billion to $40 billion. This assumes that etravel becomes 25 percent of broader e-commerce by 2025, consistent with trend observed in China. Potential estimate of economic value from e�cient logistics and shared transport.Potential estimate of economic value from digitally enabled power distribution and smart grid with distributed generation.
2
3
4
5
6
7
8
9
10
115 <1 10 <1
<145<1<1
3 <1
<15
<1 <1
5055
35
70
30 25 15
15 10
250 130 90
70
Jobs and skills
Government e-Marketplace25x
Financial services
Logistics
Agriculture
Education
170x
50x
70x
30x
50%
170
2 1
5
8 9 10
76
12 Digital India: Technology to transform a connected nation
4
Business digitisation (including manufacturing IoT)
58 Digital India: Technology to transform a connected nation

Financial services and digital payments: We size the potential economic value from digital initiatives such retail e-payments, flow-based lending, and advanced credit underwriting to micro-, small-, and medium-size enterprises at $130 billion to $170 billion in 2025.
Fintech innovation is growing exponentially in India. Firms made early gains in digital payments as the number of transactions in India—payments made with digital wallets, mobile apps, and net banking—grew tenfold in four years, to 2.03 billion a month in 2017–2018 from 202 million a month in 2013–14.88 In addition, the United Payments Interface system processed another 3.71 billion digital interbank transactions worth more than $68 billion during 2018.89 A large majority of Indians—77.9 percent, behind only China—say they use at least one nontraditional financial services firm.90 Some of these digital-first banks are reaching significant scale: Paytm, which is backed by the Chinese e-commerce and technology conglomerate Alibaba, has become India’s largest mobile payment and commerce platform, with more than 300 million mobile wallet users and six million merchants.91 Based on these trends and cross-country benchmarks, we estimate that 55 percent to 60 percent of the value of all India’s retail transactions will be noncash payments by 2025, making savings of 0.7 to 0.9 percent of GDP possible through better cash management, time saved, and lower interest forgone.
Exponential growth in digital payments and associated data create new opportunities in the way credit is assessed and delivered. India’s businesses, large and small, are poised to generate a substantial amount of data, such as historical records of revenue, costs of doing business, and market growth. This data on money flows can be used for advanced credit underwriting and could enable banks to engage in so-called flow-based lending to businesses that until now have been too small to efficiently assess their credit risk. The efficiency gained from digital payments as well as the value unlocked by flow-based lending could help India realise economic value between $130 billion to $170 billion in 2025, assuming 60 to 80 percent of the unmet credit needs of micro-, small-, and medium-size enterprises is fulfilled through such products.
Agriculture: Digital initiatives in farmer financing and insurance, precision agriculture, and online agricultural trading may help India’s farm sector realise $50 billion to $65 billion of additional value in 2025. We discuss agriculture in more depth in the next chapter. Farmers, like many small businesses, can benefit by finding cheaper credit in a data-driven environment. As a class, they rely on noninstitutional sources of capital, such as village moneylenders, for more than 30 percent of their credit; interest on noninstitutional borrowing is ten percentage points higher on average than bank rates.92 Digital applications that use online payment history, receipts and credit records, invoices from input companies, digitised land records that establish titling of collateral, and imaging solutions that establish crop status can all help improve access and reduce the cost of crop finance and insurance.
Better access to capital would make it easier for farmers to acquire and use equipment and services that raise productivity, such as networked satellites and terrestrial sensors and probes, which capture and analyse real-time data on weather, soil conditions, animal health, and other variables. Farmers could use the information to determine how much fertiliser, pesticide, and other inputs are needed to maximise yields. Pilot programs employing this precision agriculture have been found to increase productivity by 10 to 15 percent or more.93
88 Payment system indicators, Reserve Bank of India, Table 43, March 2015 and December 2018.89 Unified Payments Interface product statistics, National Payments Corporation of India, December 31, 2018.90 World fintech report 2017, Capgemini, LinkedIn, and Efma, November 2016.91 Harichandan Arakali, “Paytm reloaded: It’s no longer just a mobile wallet”, Forbes, March 15, 2018.92 Household Indebtedness in India, National Sample Survey Office, 70th round, 2012–13.93 “Fertilizer deep placement”, IFDC Report, International Fertilizer Development Centre, June 2013, Volume 38, Number 2;
“Precision farming: A pathway to attract youth in agriculture”, Popular Kheti, July–September 2014, Volume 2, Issue 3.
Exhibit E6
Digital technologies can create signi�cant economic value in India in 2025
Source:
McKinsey Global Institute analysis
Others
...but India will need to seize the opportunity.
Newly digitised sectors show the biggest growth potential...
Maxiumum potential value
Reduced potential value of digitisation due to ine�ective policies and/or low private sector participation
IT business process mgmt. Financial services3
Jobs and skills
Logistics
Digital comms services
Government e Marketplace
Education
Energy
Healthcare
Agriculture
Retail
Direct bene�t transfer
Electronic manufacturing
Current economic value
($ billions)
Maximum potential value by 2025($ billions)
Core digital services
Newly digitising sectors
Digital govern-ment & labour markets
100%
Sector value potential ranked from highest (IT) to lowest (healthcare)
1 McKinsey Global Institute value estimates in each category are based on the “value-impact approach” and focus on the potential e�ect of adoption of the considered digital applications on productivity. Discrete use cases were identi�ed with their potential impact, in terms of greater output, time, or cost saved; these estimates were multiplied by their adoption rates to create a macro picture of potential economic gains for each application, scaled up for each sector.All of our estimates are in nominal US dollars in 2025 and represent scope for economic value creation in that year. They do not represent market revenue,or pro�t pools for individual players; rather they are estimates of end-to-end value to the system as a whole. Some of the economic value we size may or may not materialise as GDP or on market-based exchanges.Potential estimate of economic value from �ow-based lending, plus economic value created through digital payments.Excluding e�ects of business digitisation in �nancial services, agriculture, education, retail, logistics, energy, and healthcare, which are listed separately.
Potential estimate of economic value from precision agriculture, digital farmer �nancing and universal agricultural marketplace.Potential estimate of economic value from online talent platforms.Estimation for 2025 includes value addition from visual broadband services, plus digital media and entertainment.Potential estimate of economic value from e-commerce and digital supply chain. For estimation purposes in the report, etail is considered for e-commerce. If broader de�nition of e-commerce is used (etail + etravel), current value becomes $5 billion and future potential becomes $28 billion to $40 billion. This assumes that etravel becomes 25 percent of broader e-commerce by 2025, consistent with trend observed in China. Potential estimate of economic value from e�cient logistics and shared transport.Potential estimate of economic value from digitally enabled power distribution and smart grid with distributed generation.
2
3
4
5
6
7
8
9
10
115 <1 10 <1
<145<1<1
3 <1
<15
<1 <1
5055
35
70
30 25 15
15 10
250 130 90
70
Jobs and skills
Government e-Marketplace25x
Financial services
Logistics
Agriculture
Education
170x
50x
70x
30x
50%
170
2 1
5
8 9 10
76
12 Digital India: Technology to transform a connected nation
4
Business digitisation (including manufacturing IoT)
59Digital India: Technology to transform a connected nation

Farmers (and consumers) can also benefit by gaining digital access to markets, offering better prices for produce. Inadequate transportation and poor communication currently compel many farmers to sell their crops at the nearest wholesale market, or mandi, with no choice but to accept the prices at that location. Digital technology gives them access to buyers across the country, often eliciting higher prices. Online trading increased farmers’ revenue by 13 percent in a pilot project run by the Karnataka state government and the National Commodity and Derivatives Exchange spot market.94
Digitisation also could address the issue of food lost to spoilage while being stored or transported. More than $15 billion worth of agricultural goods were lost in this way in 2013.95 E-negotiable warehousing receipts may eventually let farmers sell to buyers in other parts of India without having to transport their produce or livestock. Installing internet-connected sensors in warehouses can warn of conditions that result in spoilage.
Education: Using digital tools and technologies to teach and train 40 to 60 percent of India’s nearly 70 million new labour force entrants could add $20 billion to $50 billion of economic value in 2025, according to our estimates.
Over the years, India has invested heavily to improve access to education, and this has resulted in increased enrolment. Elementary education has become nearly universal, with a gross enrolment ratio of 96.9 percent in 2015–16.96 Trends also show significant improvement at the secondary and higher secondary levels: from 2010–11 to 2015–16, the gross enrolment ratio for secondary schools increased from 65 percent to 80.1 percent, and from 39.3 percent to 56.2 percent for higher secondary. The next step is to enrol the more than six million children who do not go to school and to monitor and address the high rates of absenteeism among those who are enrolled.
Digital content and channels provide a powerful opportunity to bridge remaining gaps in access and improve learning outcomes. Interactive and gamified digital content that is tailored for individual students can improve retention and learning outcomes by making instruction more effective. Each additional year of schooling is estimated to result in about 8 percent higher wages.97
Retail and e-commerce: India’s retail sector is poised for extensive digitisation, with e-commerce at the forefront. We describe this transformation in more detail in the following chapter. By our estimates, e-commerce has the potential to create economic value of $25 billion to $35 billion in 2025 in India’s retail sector, with the share of e-commerce gross merchandise value rising from 5 percent of trade output (wholesale and retail) to about 15 percent by 2025, in line with countries such as China in 2015.
94 Ramesh Chand, Doubling farmers’ income: Rationale, strategy, prospects and action plan, NITI Aayog policy paper number 1/2017, March 2017.
95 “Wastage of agricultural produce”, Ministry of Food Processing Industries press release, August 9, 2016.96 School education in India: Flash statistics, National University of Educational Planning and Administration, Universal
District Information System, September 30, 2015.97 Claudio E. Montenegro and Harry Anthony Patrinos, Comparable estimates of returns to schooling around the world,
policy research working paper WPS7020, World Bank Group, September 2014.
$35 billion E-commerce and digital supply chain have the potential to create this economic value in 2025, in India’s retail sector
60 Digital India: Technology to transform a connected nation

Propelled by the explosive growth of smartphone ownership, the number of online shoppers in India more than quadrupled in four years, from 40 million in 2013 to 176.8 million in 2017, when online sales revenue surpassed $20 billion.98 A McKinsey survey of consumer sentiment in 2019 indicates that 79 percent of urban Indians already buy household supplies online, making it the second most heavily used buying channel. In a global sample of 15 countries, India is the most likely to increase the frequency of using the internet to buy household supplies, either somewhat or significantly.
Access to the internet is a precondition for the rise of e-commerce. About 60 to 65 percent of Indians are likely to have internet access by 2025, we estimate. Data from other countries, such as China, indicate that when half or more of a nation’s populace has internet access, e-commerce accounts for at least 15 percent of overall trade. More than half of India’s e-commerce growth is coming from medium-size and smaller urban areas, often referred to as Tier 2 and Tier 3 cities. Consumers in these cities do not have retail shops comparable to those of large metro areas, so online stores expand their choice and increase convenience.
E-commerce platforms will impact India’s retail sector throughout the value chain, and not just the consumer end. Large manufacturers, small- and medium-size vendors, wholesale and retail trade channels, and e-commerce companies constitute the supply chain. Customers expect faster delivery and better service, while businesses need to lower the cost of carrying inventory and reliably delivering to more locations. A digital supply chain can address these issues.
Leading consumer goods and e-commerce companies in India are already digitising their supply chains—and reaping the benefits. Amazon runs its own end-to-end digital platform with warehouses and fulfilment centres across India and offers its digital supply chain service to more than 300,000 sellers on its platform, many of them small- and medium-size enterprises.99 The economic value in reduced inventory costs associated with digitisation is reflected in the logistics and supply chain opportunity.
Logistics and efficient transportation: Digital technologies can raise efficiencies in India’s sprawling logistics and transportation systems, as we describe in more detail in the next chapter. We estimate that digitised applications in logistics, supply chains, and passenger transportation can unlock value ranging from $25 billion to $30 billion in 2025.
India currently spends 13 to 14 percent of its GDP on logistics, compared to 9 percent for the United States and 8 percent for Europe, according to McKinsey estimates. Multiple factors explain high costs in India, including inadequate infrastructure and repetitive and cumbersome procedures. In 2018, India ranked 44th out of 160 countries on the World Bank’s Logistics Performance Index, with a score of 3.18 out of 5.100 Poor performance on timeliness (shipments reaching their destinations by their scheduled or expected delivery times) and inefficient clearance processes, including customs, dragged down India’s overall score.
98 Digital in 2018: Southern Asia, We Are Social, January 2018.99 “Amazon India crosses 3-lakh sellers mark on its marketplace”, Economic Times, February 18, 2018; “Amazon.in doubles
its specialised network for large appliances and furniture—adds 6 new fulfilment centres”, Amazon.in press release, March 19, 2018.
100 Country Score Card: India 2018, Logistics Performance Index, World Bank.
61Digital India: Technology to transform a connected nation

The government of India is putting together an integrated logistics portal that links shippers, carriers, and customers to facilitate trade and collaboration. The platform is envisioned to be a single-window clearance system that will allow shippers to find the optimal means of transporting goods and the right warehousing and packaging facility (including cold chain) while also helping them to initiate and complete the associated documentation process.
Efficient logistics coupled with digitised supply chains (discussed earlier in the section on the retail sector) can drive significant savings in inventory costs. The economic value sized for this sector includes the potential impact of 60 to 80 percent of the output of India’s industrial sector being connected through digitally enabled supply chains by 2025, with consequent reductions in inventory and improved ability to match customer needs with stock at retail outlets. Online platforms for passenger transportation (for example, hired rides for taxis) also form part of the opportunity.
Energy: India is the fourth-largest consumer of electricity and the third-largest producer of electricity in the world. The efficiencies promised by digital technology in India’s power sector could realise $10 billion to $15 billion of savings by 2025, according to our estimates.
Installing digital meters for all households while also digitising and automating the power grid could both improve the reliability of service and bring down aggregate technical and commercial losses, a combination of energy lost to equipment malfunction and theft as well as revenue lost to inefficient billing and collection.
Linking digital meters to the internet to enable bidirectional communication between consumers and the utility—technology known as advanced metering infrastructure—could provide utilities with data they can use to improve the speed and accuracy of billing, detect grid problems quicker, advise customers on saving energy, and uncover electricity theft. Advanced metering infrastructure also is essential to creating a “smart grid” that would, among other things, allow for the bidirectional flow of power required for distributed electricity generation by rooftop solar panels, wind turbines, and other means. The government has initiated a National Smart Grid Mission to optimise and automate the grid for efficient power delivery.
Healthcare: Digital technology has the potential to deliver value in many areas of the healthcare system, as we describe in the following chapter. We estimate that it may save $4 billion to $5 billion in 2025.
Telemedicine models have the technical capability to handle up to half of in-person outpatient consultations. We believe a program of accelerated implementation may enable India to tap 60 to 80 percent of this potential by 2025. Telemedicine initiatives globally have shown that virtual doctor visits cost about 30 percent less than in-person visits.101
To tap this potential, India will need to enact legislation to, among other things, establish the validity of telemedicine and online prescriptions, and determine the legal jurisdiction for medical negligence cases if a doctor and patient are in different states. The Ministry of Health and Family Welfare has released a draft Digital Information Security in Healthcare Act to enforce privacy and security measures for electronic health data, and to regulate storage and exchange of electronic health records.
101 Jeffrey Stensland et al., “The relative cost of outpatient telemedicine services”, Telemedicine Journal, 2004, Volume 5, Number 3.
62 Digital India: Technology to transform a connected nation

Beyond its economic value, telemedicine could benefit patients in remote and rural areas by reducing their reliance on unqualified local medical practitioners and saving time and money spent travelling to a nearby city or town to see a medical expert. India has too few doctors: just 0.8 physician for every 1,000 persons, which is below the World Health Organization’s recommendation of 1.0 per 1,000.102 Adding to the problem in rural areas, cities have only 32 percent of India’s people but 60 percent of its hospitals.103 Data also could help public officials make better-informed decisions about annual budgets and infrastructure expansion, among other matters.
E-government services: Government is the biggest economic entity in the digital ecosystem, and its efficiency and productivity significantly influence systemic efficiency. Digital applications have direct impact on two government interactions: subsidy transfer and government purchases. Accelerated implementation and expansion of current government initiatives in both of these areas combined could yield savings of $20 billion to $40 billion in 2025, we estimate.
From the launch of the Direct Benefit Transfer programme in January 2013 through December 2018, the government transferred a total of $82.6 billion in benefits from 434 schemes to 3.4 billion beneficiaries cumulatively.104 The government could move additional large payments—including subsidies for food grains, skills training, midday meals for schoolchildren, and the construction of toilets under the Swachh Bharat programme—to DBT over the next few years.
Procurement by general government, department enterprises, and non-departmental enterprises constitutes about 13 percent of GDP, which amounts to about $300 billion annually.105 Efficiencies unlocked in the government procurement process could therefore yield significant benefits. In 2016, the government set up the Government e Marketplace (GeM) to significantly cut the cost of frequently used goods and services, reduce the time taken in procurement without weakening risk management, and promote the transition to digital payments. GeM is an open API that includes e-commerce functionalities such as demand aggregation, dynamic pricing, e-bidding, order placement, price comparisons, reverse auction, and search, as well as continuous vendor assessments, digital contract signatures, digitally verified buyer authentication, easy return policies, and facilities for digital documents.
Jobs and skills markets: Nationwide, online marketplaces that bring together potential workers and employers or work providers could improve India’s fragmented and largely informal job markets. Scaling up the digital marketplaces could yield $65 billion to $70 billion of economic value in 2025, by our estimates.
Much of India’s economy relies on informal networks for employers to fill vacancies and workers to find employment. Job market systems have not kept pace with increased worker mobility or with disruptions to organisational and business models. Digital technologies offer alternatives because they can be deployed to quickly and accurately match job seekers with openings based on their skills, experience, and interests. The first step is to aggregate information about trained candidates and available jobs by sector and geography across the country, including remote and rural areas. A few private online job marketplaces, such as Naukri.com and Babajob, currently collect information on the job seekers and employers who use their platforms, but this does not present a complete picture of the labour market.
102 Global health workforce statistics, World Health Organization, 2016.103 Report on healthcare access initiatives, KPMG in India and Organisation of Pharmaceutical Producers of India,
August 2016.104 Direct Benefit Transfer, January 8, 2019, Government of India, dbtbharat.gov.in.105 Our estimates based on official data sources including National account statistics 2016–17, Central Statistics
Organization, Ministry of Statistics and Programme Implementation, Government of India.
63Digital India: Technology to transform a connected nation

More comprehensive platforms of labour market information could be created. They would measure and match demand and supply for skills and by geography. Based on benchmarks from global experience, we estimate that large online talent marketplaces could help 20 million to 28 million people secure work that they otherwise would not have found. About 6 million to 8 million could find jobs that are better matched to their skills. Online talent marketplaces could significantly improve job seekers’ and employers’ productivity by reducing job search time by 7 to 22 percent. Employers also could benefit by lowering attrition rates and having better information to target employees with required skills.
Accelerating momentum on government policies and programs is essential to enable widespread digital adoption and value creationOur quantification of economic value in 2025 represents India’s potential, not a prediction of what it will actually achieve. The pace of progress that India makes on its digital journey in coming years will depend critically on government policies and private-sector action. In the following section, we summarise some recent encouraging trends, but we underscore that losing momentum in either area would mean India could realise half or less of the potential value by 2025.
Government policies and programs could spur entrepreneurs to innovate and help India’s economy and society to fully incorporate new digital technologies. Personal data is an area where government policy is vital, both to enable innovation by digital providers and to protect the rights of digital consumers. Data is poised to become as important to the 21st century as oil was to the 20th century, and India has become data-rich, thanks to its large population and active digital consumers. Policy makers have a critical role to play in laying out rules for usage of data so that it neither stifles innovation nor compromises the privacy and confidentiality of personal data. The government is already establishing ownership, privacy, and confidentiality standards for personal data usage.
Public data has an important role to play as well. To enable a robust data ecosystem, the government could ensure that all of its ministries’ and agencies’ digital initiatives conform to Ministry of Electronics and Information Technology (MeitY) guidelines for open application program interfaces. This will ensure that innovators can access and use public data to create products.
Some domains require explicit government action—such as investment in or implementation of digital capabilities—to gain traction. One example is the government’s Bharatnet Phase 2 program to improve connectivity by installing broadband optic-fibre cable to all 250,000 villages with gram panchayats, or village councils, by March 2019.106 The plan is for every gram panchayat to have about five Wi-Fi access points, including an average of three for public institutions such as educational centres, health centres, post offices, and police stations. To boost investment in last-mile connectivity, the government will offer viability gap funding to private-sector participants.
106 Press Information Bureau, Ministry of Communications, Government of India, October 2018.
28mNumber of Indians who could get work using online talent marketplaces
64 Digital India: Technology to transform a connected nation

Digital technology can create millions of jobs and new types of work; workers will need retraining and redeploymentThe changes brought by digital adoption will disrupt India’s labour force alongside the industries affected. While technology will supplant workers in some areas, it will augment them in other areas, enabling them to be more productive. Many jobs will change as machines complement humans in the workplace. To prepare for these changes, workers will need to be retrained.
Prior MGI research on automation’s impact on work gave rise to scenarios surrounding workforce transitions.107 Our analysis for India suggests that the growth in demand for labour, barring extreme scenarios, could more than offset the number of jobs lost to digital technology and work automation. However, some work will be automated or rendered obsolete. We estimate that all or parts of 40 million to 45 million existing jobs could be affected by 2025. These include data-entry operators, bank tellers, clerks, and insurance claims- and policy-processing staff. Many millions of people who currently hold these positions will need to be retrained and redeployed—an operation that India’s IT industry association, the National Association of Software and Services Companies (NASSCOM), has described as “an urgent and massive imperative”.108
At the same time, the heightened productivity and increased demand generated by digital technology applications may create enough new jobs to offset that substitution and employ more workers if the requisite training and investments occur. We estimate that as many as 60 million to 65 million new jobs could be created from the direct impact of productivity-boosting digital applications. These jobs could be created in industries as diverse as construction and manufacturing, agriculture, trade and hotels, IT-BPM, finance, media and telecom, and transport and logistics (Exhibit 19). This could mean more jobs for architects, carpenters, electricians, construction labourers, retail salespeople, food preparers and handlers, delivery executives, health workers, teachers and trainers, web developers, and non-technology support staff.
Agriculture is a case in point. Services enabled by digital technologies—from site-specific fertiliser and irrigation advice to speedy crop insurance payouts based on drone images and IoT sensor data—could make agriculture more productive and release many agricultural workers for higher-paying jobs in new digital value chains in the farm sector or elsewhere.
The challenge for India will be to create affordable and effective retraining programs at scale. This could require coordinated actions by policy makers, business leaders, and educators as well as individuals. Industry leaders and educators, with government facilitation and support, may need to consider developing a new national technology curriculum to teach the skills that will be required by emerging digital technologies such as the Internet of Things, artificial intelligence, and 3-D printing.
107 Jobs lost, jobs gained: Workforce transitions in a time of automation, McKinsey Global Institute, December 2017.108 “Skilling for digital relevance”, NASSCOM, July 20, 2017, nasscom.in; see also Skill shift: Automation and the future
of the workforce, McKinsey Global Institute, May 2018.
65mPotential number of jobs created by higher productivity from digital technology applications
65Digital India: Technology to transform a connected nation

Exhibit 19Value created by the digital economy could support 60 million to 65 million jobs in India by 2025, but will require significant worker retraining and redeployment.
1 Potential for jobs sized based on the productivity gains possible through the adoption of various digital applications. Digital applications either directly result in new job creation or result in labour redeployment (shifting of workers from current jobs to new kinds of jobs); IT-BPM, digital communication services, electronics manufacturing, precision agriculture and online talent marketplaces are assumed to create new employment, while other applications are assumed to have a labour re-deployment effect with workers shifting from current to new job opportunities.
2 Calculated on a per-sector basis, based on dividing estimates of GDP per worker in 2025 by potential economic value which can be created in each sector.
SOURCE: India’s Trillion Dollar Digital Opportunity, Ministry of Electronics and Information Technology, Government of India, February 2019. McKinsey Global Institute analysis
Some companies in North America and Europe are dealing with comparable challenges by establishing partnerships with universities and other educational institutions to train or retrain their employees, helping them to develop useful new skills and smooth their transitions from one job to another. This enables companies to engage in large-scale retraining without having to hire the staff and shoulder the overhead required to manage it internally. Such partnerships may become more common as companies adopt automation at scale.109
Realising the full value of digitisation is contingent on the economy’s ability to retrain affected workers and redeploy them in more productive jobs. Following are three examples of these digitally enabled occupations:
— High-tech workers trained in the digital technologies of the future. In the past few years, employment growth has represented about two-thirds of revenue growth in India’s IT-BPM sector, with productivity (as measured by revenue per worker) accounting for the rest. Based on a range of scenarios for productivity growth, McKinsey estimates that the industry could employ five million to six million workers by 2025. Since most future revenue (40 percent) is likely to be from digital technologies, this implies strong demand for IT workers trained in areas such as big data analytics, artificial intelligence, and blockchain.110
109 Jobs lost, jobs gained: Workforce transitions in a time of automation, McKinsey Global Institute, December 2017.110 Perspective 2025: Shaping the digital revolution, National Association of Software and Services Companies, 2015.
Exhibit 19
Value created by the digital economy could support 60 million to 65 million jobs in India by 2025, but will require sig cant worker retraining and redeployment
Source: McKinsey Global Institute analysis
1. Potential for jobs sized based on the productivity gains possible through the adoption of various digital applications. Digital applications either directly result in new job creation or result in labour redeployment (shifting of workers from current jobs to new kinds of jobs); IT-BPM, digital communication services, electronics manufacturing, precision agriculture and online talent marketplaces are assumed to create new employment, while other applications are assumed to have a labour re-deployment e ect with workers shifting from current to new job opportunities.
2. Calculated on a per-sector basis, based on dividing estimates of GDP per worker in 2025 by potential economic value which can be created in each sector.
Examples of new digitally enabled jobs
Transport and logistics
• Big data experts for optimisation platforms• Ride-sharing platform drivers
IT and professional services
• Cloud computing• Social media• Cyber security• Network engineering• IoT and AI experts• Media content creation
Trade and hotels
• Delivery agents in e-commerce companies• Workers in hotels linked to shared accommodation platforms
Agriculture • Digitally enabled eld agents for farm input companies• Digital advisory service providers for agriculturists
Manufac-turing and construction
• R&D technicians• Electronics assembly workers for new device ecosystems • Shop oor workers (re)trained in Industry 4.0 to use factory
analytics and automation tools
60 million–65 million
40 million–45 million
Number of workers whose job pro le may change and who would need to be retrained and redeployed in new and emerging technologies2
Number of jobs createdby digital technologies1
66 Digital India: Technology to transform a connected nation

— Work enabled by new digital marketplaces. Digital marketplaces, or online platforms that enable the sale of goods and services, are changing labour market dynamics by creating new value chains of workers linked to organised, digitally enabled businesses. E-commerce in India generates close to $20 billion in merchandise value annually and employs between 150,000 and 200,000 people, mostly in goods delivery and logistics.111 In line with expected internet penetration for India by 2025, McKinsey has estimated that e-commerce is likely to become four to six times its current size and could create 500,000 jobs, based on today’s job intensity. Similarly, cab aggregators such as Uber and Ola book three million to five million rides daily, providing work for 600,000 to 700,000 drivers. With the biggest 30 cities accounting for more than 90 percent of their business, there is ample room to expand. In China, the biggest cab operator, DiDi, books around 25 million rides per day and says it provides flexible job opportunities for 21 million drivers.112
— Digitally enabled on-demand work for independent freelance workers. Digital technologies and the platforms they enable make work divisible and help workers access opportunities remotely. A growing army of freelancers worldwide wants autonomous, project-based work, typically in the work-from-home model. This is a particularly attractive opportunity for women professionals who may drop out of the regular workforce for a time due to family obligations. Currently, around 15 million freelancers are registered in India, and platforms such as Flexing It are providing them with employment opportunities.113
Measuring the value that digital technologies can create across sectors is at best an approximate science, based on a wide range of variables. Nonetheless, the range of potential value that we find across India’s economy from a full-on embrace of digital is significant. While this value cannot be added up and translated into GDP, the boost to growth that digital potentially offers is substantial, and millions of jobs are at stake. Managing the transitions will be challenging, especially in the labour market. One imperative for policy makers and business leaders will be to retrain workers on an unprecedented scale. But the accompanying opportunities may allow India to make a step change in its economy, improving productivity, offering innovative solutions, and enabling millions of ordinary Indians to find more fulfilling and higher-paying work.
111 India’s labour market: A new approach to gainful employment, McKinsey Global Institute, July 2017.112 Li Jianhua, Sharing Economy for SDGs, Development Dimensions of the Sharing Economy:
Learnings from China, UNCTAD, Geneva, Switzerland, April 16, 2018.113 Anand J and Shalina Pillai, “New-age techies turn freelancers for big pay”, Times of India, October 24, 2017.
$20 billionThe amount e-commerce in India generates in merchandise annually; it employs between 150,000 and 200,000 people
67Digital India: Technology to transform a connected nation

68 Digital India: Technology to transform a connected nation

Digital technologies are most powerful, and can create the most value, when the forces they unleash integrate services across digital sector boundaries into new digital ecosystems. Online shopping, mobile banking, ride sharing, and other digitally enabled services are all examples of these new ecosystems, and they have raised consumers’ expectations of speed and convenience. In this chapter, we offer a more detailed look at how technology forces connect businesses with customers and one another, automate interactions, and analyse the data created. The resulting digital ecosystems could transform four sectors of India’s economy: agriculture, healthcare, retail, and logistics.
Connect-automate-analyse: three tenets of digital integration that may spur the rise of new ecosystemsDigital technologies can fundamentally change how individuals and businesses perform day-to-day activities in three ways: by allowing people to connect to collaborate, transact, and share information; by enabling organisations to automate routine tasks to boost productivity; and by providing organisational leaders with the tools they need to analyse data to formulate insights and improve decision making.
— Digital connectivity is the ability of individuals to communicate and collaborate quickly and easily within big organisations and around the world. Corporate solutions like Slack and Skype allow collaboration in widely distributed workforces, enabling businesses to save time and money on travel. Connectivity also removes the need for intermediaries in many transactional relationships, which not only improves efficiency but has given rise to the shared economy, leading to significantly better utilisation of assets and skills.
— Automation improves productivity by using digitally enabled machines to perform tasks once done only by people, such as packing boxes and assembling automobiles. The advent of faster computers, advanced sensors, and sophisticated algorithms is allowing automation to expand into more complex tasks, such as driving cars. Previous MGI research estimated that automation could raise productivity growth globally by 0.8 to 1.4 percent annually.114
— Digital analytics is the process of using computers to sort, compare, and contrast large amounts of data to find patterns, relationships, and insights that previously were too expensive or time-consuming to produce. This information can markedly refine decision making and improve customer service. Data-driven decision making has given rise to new business models, such as instant claims processing by the online insurer Lemonade.
114 A future that works: Automation, employment, and productivity, McKinsey Global Institute, January 2017.
Building digital ecosystems4.
69Digital India: Technology to transform a connected nation

India’s growing number of connected consumers increasingly expect to have multiple needs met simultaneously and seamlessly. This has opened an opportunity for businesses to capture value by integrating services across traditional sector boundaries in new digital ecosystems. Companies best positioned to seize digital’s lucrative ecosystem opportunities are those that aggregate consumer needs and serve them in an integrated fashion. Amazon is an example: born an online bookseller, it has expanded aggressively into many corners of e-commerce as well as cloud computing, logistics, consumer electronics, entertainment, and even groceries. Amazon seeks to become a “one-stop shop” for needs related to shopping, entertainment, and finance. Customers can, for example, use Amazon Pay to watch TV shows on Prime Video or listen to music on Prime Music. All of these services are available via a single login account, maximising consumer convenience.
Tencent is another example of an ecosystem player: from its roots as an instant-messaging service, it has regularly added other businesses of interest to its customers, including finance, gaming, movies, and social media. Rakuten began as an online mall and added financial services (credit cards, mortgages, and securities brokerage), created one of Japan’s largest online travel portals, and signed up 800 million users to its instant-messaging app, Viber.
What these digital conglomerates have in common is a knack for integrating services across traditional sector boundaries to satisfy consumers who increasingly expect seamless service. Speed and convenience are becoming more and more important to consumers, adding an important dimension on which service providers must compete. Successful companies are responding by dismantling legacy parallel value chains and collapsing them into new single chains to meet each key customer need (Exhibit 20).
New ecosystems are likely to emerge in sectors that are ripe for digital transformation. Agriculture is India’s largest source of jobs but is unproductive: crop yields lag behind global benchmarks, and a significant share of each year’s harvest is lost to spoilage. Healthcare suffers from too few doctors and hospital beds, and those it has are misallocated, with most resources in cities while most Indians live in rural areas. Retailers often operate in the cash-only informal economy, depriving the government of tax revenue and raising the cost of credit for store owners. Logistical services are expensive, heavily reliant on paperwork, and depend on increasingly congested national highways.
70 Digital India: Technology to transform a connected nation

Advancing technologies
Changing customer expectations
Intermediaries
Customer
Producers /manufacturers
Intermediaries
Integrating and packaging �rm
Customer
Digital technologies are allowing �rms to serve several needs simultaneously in an integrated, digital way
Traditionally, customer needs have been served by dozens of parallel value chains
Producers /manufacturers
Exhibit 20Technology can help companies satisfy changing customer expectations in an integrated fashion via new “digital ecosystems”.
SOURCE: McKinsey Global Institute analysis
71Digital India: Technology to transform a connected nation

72 Digital India: Technology to transform a connected nation

Agriculture is a critical component of India’s economy, contributing 18 percent of the country’s GDP and employing 45 percent of its workforce.115 However, agriculture is markedly inefficient in India—the average farm takes up a little more than one hectare and produces yields of rice, maize, and other major crops that are one-half to one-fifth those of its counterparts in Brazil, China, Russia, and other developing economies.116
Multiple factors contribute to this poor performance, including subscale farm sizes, low investment in capital such as traditional farm equipment, and suboptimal farm practices brought on by low availability of information. Some Indian farmers have relatively little insight into farm and environmental variables like weather, sunlight, and rainfall. Once Indian farmers harvest their relatively small crops, inadequate storage and inefficient transport leads to approximately 40 percent of the produce spoiling before reaching consumers.
Improving agricultural productivity would help boost overall economic growth and raise incomes in rural areas; India’s 263 million farm workers earn an average of just $3.12 a day.117 Consequently, increasing farm incomes is a priority for national and state governments across India. However, underdeveloped financial ecosystems and subscale farms make achieving this goal a particular challenge.
One sign of the underdeveloped financial ecosystem is that 36 percent of India’s farmers take out loans from informal sources.118 They pay interest rates that are about 10 percentage points higher than bank rates, and they are often trapped in cycles of debt.119 The lack of a financial ecosystem means farmers can have difficulties securing crop insurance. Less than 24 percent of the gross cropped area in India was under insurance in 2017–18, compared with 89 percent in the United States and 69 percent in China.120 While government schemes exist to make crop insurance more affordable, 67 percent of farmers are unaware of these programs, according to a survey by the Comptroller and Auditor General of India.121 This leaves farmers extremely vulnerable to disasters like landslides or unforeseen rainfall patterns.
Subscale farms pose other challenges. India’s average farm size is about 1.1 hectares, compared to 180 hectares in the United States, and 45 percent of farmers are small or marginalised.122 Meanwhile, crop prices realised by farmers remain unsustainably low, partially because of the large markups commanded by middlemen in the supply chain. This combination of factors has resulted in perpetually low farm profitability, with many farmers struggling to make ends meet. In a recent survey, 76 percent of farmer respondents indicated that they would prefer to give up farming if they could find another employment option.123
115 Our estimates based on official data sources including National Accounts Statistics, 2017, and Report on fifth annual employment-unemployment survey, 2015–16, Ministry of Labor and Employment, Government of India.
116 OECD.117 State of Indian agriculture 2015–16, Ministry of Agriculture & Farmers Welfare.118 Anjani Kumar et al., Institutional versus noninstitutional credit to agricultural households in India: Evidence on impact
from a national farmers’ survey, International Food Policy Research Institute discussion paper 01614, March 2017.119 Ibid.120 Nibu Pullamvilavil, “India needs to make crop insurance work for its farmers”, The Wire, April 22, 2018.121 “What crop insurance? India’s farmers have no clue about the covers Centre doles out for them”, Economic Times,
July 24, 2017.122 “Average farm landholding size shrinks to 1.1 ha”, Hindu Business Line, August 17, 2018; Farms and land in farms:
2017 summary, US National Agricultural Statistics Service, Department of Agriculture, February 2018; Agricultural statistics at a glance: 2016, Directorate of Economics and Statistics, Ministry of Agriculture and Farmers Welfare, March 2, 2017.
123 State of Indian farmers: A report, Centre for the Study of Developing Societies, March 2018.
4.1 Agriculture
73Digital India: Technology to transform a connected nation

Typical farming cycle
Financing and risk mitigation
Lenders(such as banks and local money lenders)
Government agricultureprogram databases (soil healthcards, eNAM sales records,mKisan and KCC engagement)
Traditional public datasources (India Meteorological Department, digital landholding records)
Private sector data collection(agricultural inputs sales records, IoT device sensing, farm data from satellite images, customer preferences)
Farm advisory �rms²(use aggregated data to o�er real-time best practices and advice)
Suppliers of consumables(such as seeds and fertiliser)
Suppliers of equipment(such as tractors)
Buyers of farm produce(such as local middlemen)
Insurance companies
Planning and pre-planting
Planting and in-season care
Harvesting Selling
Connect– Digital markets for produce – Real-time monitoring and measuring using the Internet of Things (IoT)– Digitally shared farm equipment
1
1 1 1
2
Automate– Farm management tools– Digitally enabled “smart” farm equipment
Analyse– Farm advisory for precisions agriculture– Digital farmer �nancing and insurance
3
3 3
Digital �nancial platforms
IoT monitoring devices
Sharing platforms
Marketplace internet platform
Digital advisory applications
Data ecosystem
Digital distruptions Enabling platforms and applications
Key stakeholdersData ecosystem
Exhibit 21Farms of the future: making data-driven decisions from seeding to selling.1
1 This schema imagines how the Indian agricultural landscape could look in five to ten years if digital applications were to be widely adopted. This would require an open and interoperable data ecosystem, clear guidelines about data ownership and usage, wide availability of broadband connectivity in rural areas, and digital literacy among farmers.
2 This role in the ecosystem could be taken on by a new player (a startup) or an existing player (such as suppliers of consumables or equipment).
NOTE: Applications in italic type are explored in depth in this report.SOURCE: McKinsey Global Institute analysis
74 Digital India: Technology to transform a connected nation

Digital technology can raise farm productivity and create new opportunity for farmersDigital technologies can play a key role in transforming agriculture across the value chain by connecting farmers to markets and shared equipment, automating farm management processes, and analysing data to drive actionable insights for farmers (Exhibit 21).
Important use cases include digital farmer financing and insurance, farm advisory for precision agriculture, and online marketplaces for produce facilitated by digital technologies. Each use case independently has strong potential to increase farm incomes, but their combined impact could enable a step change in incomes. Each use case will need to be specifically tailored to the Indian context in order to be effective. Purveyors of digital solutions must contend with the problem of serving millions of small farms that individually have low levels of disposable income. The creation of an ecosystem enabling the aggregation of data from across disparate sources will be of paramount importance for enabling products to help farmers. Public data sources like digital land records could be combined with other agricultural data sources, public and private, to provide the information backbone necessary to support a variety of agriculture solutions.
Digital technologies will enable financial services firms to offer lending and insurance products to farmers who are underserved todayA lack of documentary evidence of financial history often prevents farmers from accessing banks to serve their financial needs. Digital bank accounts can begin to bridge this gap by creating verifiable transaction records, including electronic receipt of agricultural subsidies. This enables banks to more accurately assess credit risks when farmers seek financing to buy seed, fertiliser, and pesticide for the coming season or to invest in the digital technologies needed for precision agriculture. Access to bank credit could produce considerable savings on interest payments and enable farmers to affordably borrow enough to acquire more advanced technology.
Even with data-driven digital credit-risk models, lenders still face considerable uncertainty in serving small and marginal farmers. Lenders will require creative and flexible solutions to protect themselves as they meet farmers’ individual needs, and digital solutions can help. The government-sponsored Kisan Credit Card program allows farmers access to a flexible credit facility with repayments that can be rescheduled in the event of demonstrated unforeseen circumstances. Additional solutions to decrease risk could include ring-fenced disbursal accounts available only for certain purchases as well as loan repayments that are triggered automatically when a borrower sells his or her crop.
Meanwhile, easily accessible digital information about land ownership, weather, and other variables could improve and extend crop insurance underwriting. The same data, augmented with imagery from satellites, drones, or an individual’s mobile phone, could speed the claims process and accelerate payouts if crops fail (Exhibit 22).
The Climate Corporation, a US-based subsidiary of Monsanto established in 2006, pioneered using weather data to offer insurance products. Payment is based on the occurrence of fixed insured events (for example, a drought) that relieves farmers of the need to file claims at all and avoids the costly exercise of assessing actual crop damage. The Climate Corporation sold its weather-based insurance scheme to insurer AmTrust Financial Services in 2015.124
124 “The Climate Corporation sells crop insurance business to Amtrust Financial Services Inc.”, Climate Fieldview, climate.com.
75Digital India: Technology to transform a connected nation
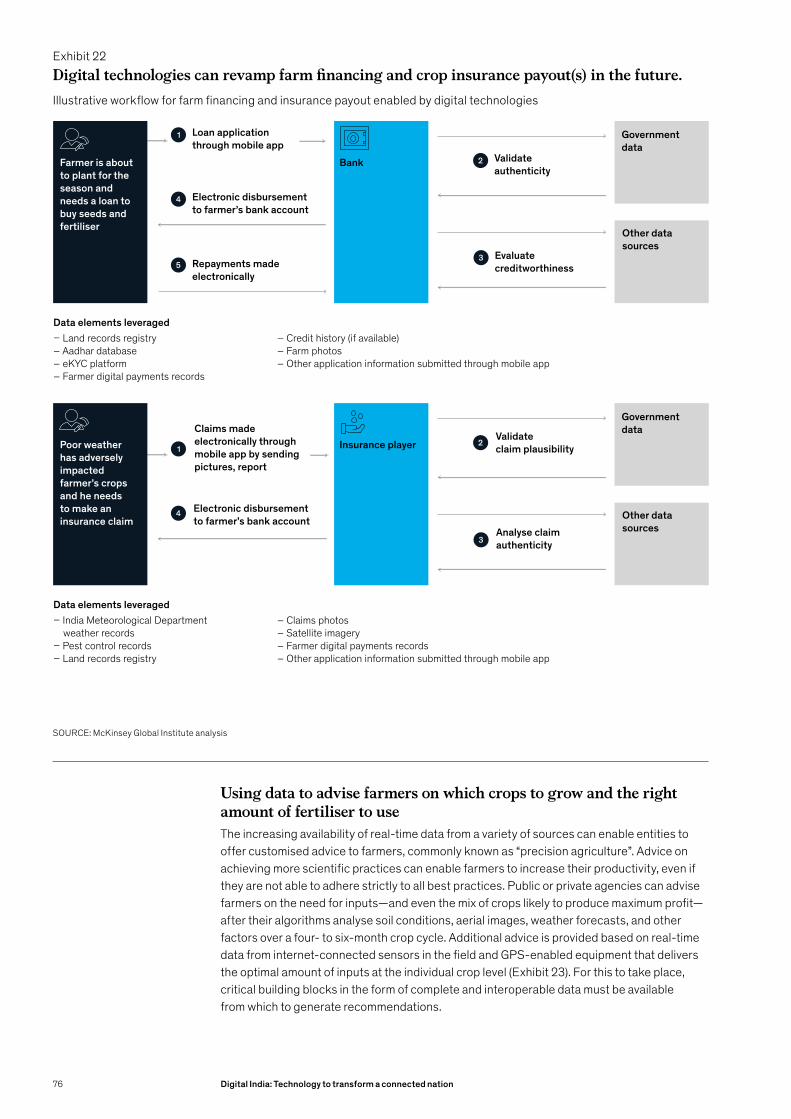
Using data to advise farmers on which crops to grow and the right amount of fertiliser to useThe increasing availability of real-time data from a variety of sources can enable entities to offer customised advice to farmers, commonly known as “precision agriculture”. Advice on achieving more scientific practices can enable farmers to increase their productivity, even if they are not able to adhere strictly to all best practices. Public or private agencies can advise farmers on the need for inputs—and even the mix of crops likely to produce maximum profit—after their algorithms analyse soil conditions, aerial images, weather forecasts, and other factors over a four- to six-month crop cycle. Additional advice is provided based on real-time data from internet-connected sensors in the field and GPS-enabled equipment that delivers the optimal amount of inputs at the individual crop level (Exhibit 23). For this to take place, critical building blocks in the form of complete and interoperable data must be available from which to generate recommendations.
Bank
– Land records registry– Aadhar database– eKYC platform– Farmer digital payments records
– Credit history (if available)– Farm photos– Other application information submitted through mobile app
Farmer is about to plant for theseason and needs a loan to buy seeds and fertiliser
Loan applicationthrough mobile app
Electronic disbursementto farmer’s bank account
Validateauthenticity
Governmentdata
Other datasources
EvaluatecreditworthinessRepayments made
electronically
Data elements leveraged
1
2
3
4
5
Insurance player
– India Meteorological Department weather records– Pest control records– Land records registry
– Claims photos– Satellite imagery– Farmer digital payments records– Other application information submitted through mobile app
Poor weather has adverselyimpacted farmer’s crops and he needs to make an insurance claim
Claims madeelectronically throughmobile app by sendingpictures, report
Electronic disbursementto farmer’s bank account
Validateclaim plausibility
Governmentdata
Other datasourcesAnalyse claim
authenticity
Data elements leveraged
12
3
4
Exhibit 22Digital technologies can revamp farm financing and crop insurance payout(s) in the future.Illustrative workflow for farm financing and insurance payout enabled by digital technologies
SOURCE: McKinsey Global Institute analysis
76 Digital India: Technology to transform a connected nation

What types of questions will advisory services be able to answer for the farmer?– Which crops work best with my soil pro le?– When should I plant and harvest for optimal results?
Collection of data Analysing data to produce insights for the farmer Additional applications
Soil Health Cards
eNAM sales
KCCengagement
IMD weather reports
Digital land records
Ag input sales records
Satelliteimagery
Farm-supplied data
Insurance payout(s)To enable directpayout(s) based onlive ground datawithout the need for claims
Yield forecastingReal-time yieldforecasting based oncrop progress
Acreage estimationAcreage estimates by type of crop for the government and others
Crop protectionPredictiveassessment of croprisks with advice onmitigation
Input demandforecastingAccurately forecastconsumer demandfor chemicals andfertilisers by region
‘Smart’ farm equipment
Farmer
“This much fertiliser best suits your soil and crop”
Agricultural extension worker
IoT sensors
Analytics and farm advisory �rm
Personalised alerts
“Heavy rainfall expected tomorrow”Data
aggregator
Government data sources(traditional and new programs)
Private sector data collection
Dashboard application
“Be ready to harvest crop next week”
– What should I expect in terms of pests?– What is the best nutrition management plan for my crops?
State and union government agencies across India collect vast amount of agricultural data each year by way of about 800 national, state, and research institutions. This rich data infrastructure includes information such as seed availability from Seednet India Portal, weather patterns from meteorological departments, and daily mandi prices on Agmarknet. Additionally, the Ministry of Agriculture and Farmers Welfare has distributed more than 158 million Soil Health Cards to farmers, capturing farm-level soil fertility data from each farm.125
While a vast amount of data exists, it is difficult to analyse in its current form due to a lack of interoperability among various sources tracked by different agencies. In order for proliferation of digital applications like precision advisory services to flourish, data will have to be captured and made available using common languages and schemas to ensure that they can be linked and analysed across sources. As the volume of data continues to grow, public-private partnerships will be needed to process the aggregated information meaningfully.
125 Soil Health Card, January 8, 2019.
Exhibit 23Digital technologies can enable farmers to engage in precision agriculture.Illustrative precision agriculture workflow enabled by digital technologies
SOURCE: McKinsey Global Institute analysis
77Digital India: Technology to transform a connected nation

Globally, large agriculture-input providers such as Monsanto and Mosaic are using data to provide actionable insights for farmers. Monsanto has launched a farm-management platform with the aim of providing advice for planting and crop nutrition using farm-level weather and soil testing data. Monsanto has invested heavily in proprietary algorithms to accomplish this. Mosaic has gone another route, starting CropNutrition.com as a digital hub for information on soil fertility and crop nutrition. Nutrient management algorithms provide advice for farmers without the use of any farm-level data, providing a simpler but lower-investment tool for farmers.
In India, attempts to bring precision agriculture advisory to farmers are less developed but emerging quickly. The mKRISHI app, a technology platform developed by Tata Consultancy Services, has more than one million users registered on its platform. It offers customised real-time information to help them plan activities.126 Disease management using real-time image processing and integrated data from a network of wirelessly connected stations reading parameters like temperature and humidity allow mKRISHI to deliver actionable insights to farmers. This has led to improvements of as much as 40 percent in yields for participating farmers year-over-year along with significant cost decreases.
Viable digital sales platforms can mean more leverage and higher prices for farmersDigital technologies can continue to increase farm incomes after harvest by helping farmers improve the price they are paid for their produce. Most of India’s 138 million farms sell their crops at local mandis, or wholesale markets, where buyers usually are scarce and sellers have little bargaining power, resulting in poor income realisation. A viable nationwide online trading platform could address this problem by providing farmers and traders with timely information about prices and supply as well as an alternate venue in which to transact crop sales.
When accompanied by enabling digital infrastructure, such a digital venue would give farmers access to a larger pool of potential buyers. The government already has made its Electronic National Agriculture Market (eNAM) available in 585 markets in 16 states; it also enables buying and selling commodities on its mKisan portal, which delivers technical advice to farmers.127 An estimated $5 billion in goods traded on the eNAM platform in 2017, representing about 2 percent of crop sales. However, several challenges restrict its widespread adoption. The main problem is trust: how can buyers be sure they will receive the right product on time? Integration of e-warehousing and a logistics interface to assure timely produce delivery can help, as can digital verification of transactions and identities or of institutional facilitators who stand to act as guarantors between small buyers and sellers. Firms working in this ecosystem will also need to consult closely with state governments to manage the regulatory and legal environment, because agricultural sales are heavily and disparately regulated in different states.
ITC’s e-Choupal system attempts to solve these problems by offering farmers a separate transaction platform that’s currently available in more than 40,000 villages. Farmers can visit a kiosk in their village to check prices at several local mandis, helping them make better decisions on when and where to sell their produce. The Choupal Saagar portion of the program allows ITC to purchase produce directly from farmers, eliminating the need for intermediaries and thus offering better prices and timely payments to the farmer.
126 Enabling digital farming with PRIDE, Tata Consultancy Services, tcs.com.127 eNAM, Ministry of Agriculture and Farmers Welfare, Government of India, May 2018.
$5bEstimated amount of goods traded on eNAM platform in 2017
78 Digital India: Technology to transform a connected nation

To succeed, digital markets for perishable produce must also be able to verify the quality of the goods being sold. Digital technology can offer solutions here, too. For example, Agricx Lab’s digital potato-grading system certifies potatoes using photographs and a proprietary algorithm that considers parameters such as firmness and minor and major flaws.
Low productivity on Indian farms offers opportunitiesThe potential gains from digital agriculture applications could be considerable. For example, moving 40 to 60 percent of agriculture product sales to a universal marketplace by 2025 is forecasted to increase prices paid to farmers by 15 percent.128 Widespread implementation of advisory for precision agriculture, such as digitally enabled advice on crop choice, fertiliser use, weather patterns, and other variables, could increase yields by 15 to 20 percent, or $20 billion to $25 billion per year by 2025.129 Combined, these and other digital technologies could help food production better keep pace with the country’s population growth, add $50 billion to $70 billion of economic value in 2025—and fundamentally change Indian agriculture.130
Individual farmers stand to gain from digital technologies at every turn in their crop cycle. Receiving digitally enabled credit and insurance, instead of a loan from the local middleman, can lead to other benefits. A digitally enabled farmer may use advisory services to plant the most efficient crops for his soil type, avoid a pest infestation thanks to an app-based notification, and harvest crops at the opportune time. The farmer is then free to sell the produce using an online platform to command a fair market price instead of selling produce back to a local middleman to settle his debts, allowing him to pay off his formal loan with money to spare (Exhibit 24).
While national and state governments drew up the plan for doubling farmers’ income and then laid the regulatory and programmatic foundation, private companies now have an opportunity to collaborate with the public sector to pilot offerings using available data. For example, a Bangalore software firm, CropIn, offers a farm-management solution over the internet, but rather than try to approach tens of thousands of individual farmers, the firm works through the Karnataka state government and local farmer producer organisations, which are collectives with hundreds of members.131
Even companies without a product to sell may find opportunities as Indian agriculture goes digital. For instance, the Ministry of Agriculture and Farmers Welfare plans to demonstrate the benefits of Soil Health Card advisories in roughly 600,000 villages; it intends to partner with the private sector to complete the job in a reasonable time.
128 Ramesh Chand, Doubling farmers’ income: Rationale, strategy, prospects and action plan, National Institution for Transforming India policy paper number 1/2017, March 2017.
129 Rapid introduction and market development for urea deep placement technology for lowland transplanted rice, International Fertilizer Development Centre, 2017; Pinaki Mondal and Manisha Basu, “Adoption of precision agriculture technologies in India and in some developing countries: Scope, present status, and strategies”, Progress in Natural Science: Materials International, June 2009, Volume 19, Issue 6.
130 Ramesh Chand, Doubling farmers’ income: Rationale, strategy, prospects and action plan, National Institution for Transforming India policy paper number 1/2017, March 2017.
131 Farmer producer organisations: Frequently asked questions, National Bank for Agriculture and Rural Development, 2015.
79Digital India: Technology to transform a connected nation

Traditional journey Digitally enabled journey
Pre-cultivation
During cultivation
Post-cultivation
Rohit is a rural farmer living in UttarPradesh, and he plans to cultivate his two-hectare plot of land as he does
every year
Rohit has no credit history andcannot apply for formal credit, so he borrows from local middleman at mandi
Rohit decides to plant rice, since this is what he grew last year and he has experience growing it
Rohit cannot a�ord a tractor, so he uses old equipment to plough and plant �eld
Rohit goes to local market to buychemical nutrients, but due toshortage can’t get the exact ones he wants
Pests are especially bad thisseason—an infestation ruins a patch of Rohit’s crops before he can contain it
Rohit harvests and stores his crops
Rohit returns to mandi, selling crop outputs to local middleman at quoted price; much of proceeds go to repay loan
Rohit uses a mobile application toapply for a loan, which leverages his digital payments history tounderwrite terms
Rohit leverages mobile app for farm advisory to select the mostpromising crop to plant, aided bydata from his Soil Health Card
Uses a mobile app to rent a tractorfor a week to plough and plant his �eld
Rohit orders chemical nutrientsonline using ring-fenced loanaccount
Advisory program warns Rohit about imminent threat of pests, and he is able to prepare and avoid any crop damage
Noti�cations from advisory program prompt Rohit to harvest at optimal time based on measured crop maturity and price forecasts
Ultimately, he decides to sell his crop on an e-marketplace platform, which will take care of shipping logistics
Rohit uses website to checkprevailing crop prices in local mandis
Exhibit 24Digital technologies allow us to reimagine the seasonal farmer journey.
SOURCE: McKinsey Global Institute analysis
80 Digital India: Technology to transform a connected nation

Capturing value from digital applications in agriculture will require concerted effort from all stakeholdersCompanies, governments, and farmers can adopt digitally focused strategies to maximise value.
Agriculture input and equipment providers will need to work to figure out where they belong in this new ecosystem while simultaneously digitising their own internal operations. Data and information collection will allow these firms to better understand customers and offer an opportunity to optimise operations and personalise services for farmers. Additionally, precision agriculture insights, especially concerning risks, weather, and yield estimates, create an opportunity for input providers to predict demand geographically and plan their supply networks accordingly.
Financial services firms have an opportunity to serve millions of farmers with loans and insurance products enabled by digital. More personal and financial data are available today than before, and the collection, processing, and use of this data to evaluate risks and trigger payouts will be a main success factor for lenders. To mitigate the inherent riskiness of serving farmers, lenders can work to design systems that use digital technologies to reduce their own risk by, for example, disbursing loan amounts only through verified digital payments for specific items.
The national, state, and local governments can invest in leading the charge for digital adoption. Initiatives such as the Soil Health Card and Kisan Call Centre will generate large amounts of useful data. Using this data to the greatest possible extent will require an open and collaborative attitude, including support for public-private partnerships to analyse and disseminate the data. Additionally, governments can increase stability by supporting and retraining any farm workers who are displaced by digitisation in the sector.
Finally, it will ultimately be up to all farmers to capture the benefits of digital for themselves. Better information and advice could boost productivity: farmers who become “smart” consumers of this information and rely on its authenticity will improve their yields. Realising these benefits will require engaging digitally with other stakeholders, so individual digital literacy will be vital to each farmer’s success.
81Digital India: Technology to transform a connected nation

82 Digital India: Technology to transform a connected nation

India’s healthcare system is expansive but faces many difficult challenges, particularly in poor states and rural areas. The country is home to many medical professionals: more than one million doctors (about as many as in the United States) and almost two million nurses and midwives.132 However, it has too few of them relative to the size of its population: 2.2 for every 1,000 persons, compared with 2.8 in China.133 It also has an urban-rural divide: 60 percent of Indian hospitals are in cities, where only 32 percent of the country’s population resides.134
Some of these issues may reflect a relative decline in spending. India spent the equivalent of 4.2 percent of its GDP on healthcare in 2000, but only 3.9 percent in 2015, the latest year for which the World Health Organization has full data. Over the same period, China’s healthcare spending rose from 4.5 percent of its GDP to 5.3 percent.135 The difference is starker in dollar terms: India spends $63 per capita on healthcare each year, compared with $426 in China.136
The government is taking the lead. While individuals and insurers account for 70 percent of India’s health spending (about one-third of the populace has private insurance), the government exerts significant influence over the system through state-funded insurance programmes. Rashtriya Swasthya Suraksha Yojana, for example, pays routine medical expenses for 40 million households below the poverty line, and government schemes spend 1.2 percent of GDP on healthcare. This gives elected officials leverage to encourage further adoption of medical technologies to improve services and lower costs (see Box 4, “Government schemes enable wider adoption of digital tools to improve care”).
132 National health profile of India, 2018, Central Bureau of Health Intelligence; Aaron Young et al., “A census of actively licensed physicians in the United States, 2016”, Journal of Medical Regulation, June 2017, Volume 103, Number 2.
133 Global health workforce statistics, World Health Organization, 2016.134 Report on healthcare access initiatives, Organisation of Pharmaceutical Producers of India, August 2016.135 Global health expenditure database, World Health Organization, 2015.136 World health statistics 2018, World Health Organization.
Box 4. Government schemes enable wider adoption of digital tools to improve care
A significant number of Indian households—estimated at 15 to 20 percent—face unaffordable medical bills each year because of serious illness or accidents.1 To address this issue, the government recently introduced the National Health Protection Mission (Ayushman Bharat) to subsume current government health schemes and provide up to $7,500 annually to cover the cost of medical specialists and hospital stays for about 100 million vulnerable families.2
To make the scheme work, the government acknowledged that it needs a digital platform as an essential technology backbone. In addition to enabling the quick enrolment of insurers and patients, the platform also could host
1 “World Bank support to the health sector in India”, World Bank, April 6, 2010; Anamika Pandey et al., “Trends in catastrophic health expenditure in India: 1993 to 2014”, Bulletin of the World Health Organization, January 1, 2018, Volume 96, Number 1.
2 “Ayushman Bharat for a new India 2022 announced”, Ministry of Finance press release, February 1, 2018, pib.gov.in.
electronic health records for each patient. These EHRs can improve the quality of care and provide anonymised data to conduct research and help insurance providers determine accurate premiums. Such a platform also could decrease operating costs throughout the system by, for example, reducing the need for administrative staff and enabling insurers to speedily settle claims by verifying information online.
As with all EHR data, any information sharing would need to follow the guidelines of the national digital health authority and be approved by the patient. Draft versions of the Digital Information Security in Healthcare Act aim to establish these guidelines for generation, collection, storage, transmission, and ownership of patient health data, and would establish a central regulator called the National Electronic Health Authority to enforce these standards.
4.2 Healthcare
83Digital India: Technology to transform a connected nation
Critical gaps in India’s healthcare system diminish patient outcomesOn a nominal basis, India has made dramatic gains in the health and wellness of its citizens. For example, Indians born in 1951 could expect to live, on average, for 37 years; by 2018, the average life span was 69 years.137 Yet the country ranks 125th among all nations in life expectancy.138 Indian women today are three times as likely to die in childbirth as women in Brazil, Russia, China, and South Africa—and more than ten times as likely to die giving birth as women in the United States. India also trails other big emerging economies in infant mortality, childhood nutrition, and other public health markers. Infectious diseases are widespread, including the world’s highest incidence of tuberculosis, the most cases of HIV/AIDS outside of Africa, and three-fourths of all malaria cases in South and Southeast Asia. Indians are less likely to survive breast cancer than people in China or the United States, and more likely to succumb to heart attacks at an early age.
Reasons that Indian morbidity and mortality statistics lag so far behind those of otherwise comparable countries fall into three broad categories: access, quality, and patient experience.
— Access. The shortage of doctors and nurses is particularly acute in rural areas, where many people find that the doctor nearest to them may be several kilometres away, a distance they often must travel on foot, while ill. To rise to the global benchmark for the ratio of medical practitioners to patients, India would need to add 6.5 million healthcare professionals, a 30 percent increase. Cost also inhibits patient access to care. Only 34 percent of Indians had health insurance in 2017. High premiums put insurance out of reach for many people. With more than 60 percent of healthcare expenditure coming out of pocket, many Indians have to make tough trade-offs between healthcare and other necessities.139
— Quality. Even when patients are able to see doctors, outcomes are highly variable. The provider market in India is extremely fragmented, and outcomes often are not measured. Poor channels of communication can thwart the sharing of best practices among doctors or prevent medical professionals from contacting patients to make sure they are following recommended courses of treatment. A scarcity of specialists also lowers quality of care where expertise is not widely available: by one estimate, the country has fewer than one-fifth the number of cardiologists, paediatricians, and clinical psychologists it requires.140
— Patient experience. Many patients, particularly in rural areas, are dissatisfied with the service at their local healthcare provider and reluctant to return. For example, a recent accountability study in Rajasthan, a rural state on the frontier with Pakistan in northwest India, found that ten out of 33 districts scored zero out of a possible five in patient satisfaction.141 Indians also have access to little information about the quality or qualifications of doctors in their area, and they cannot be sure a physician will be available even with an appointment: a nationally representative all-India survey found doctor absenteeism exceeds 30 percent in some state-owned rural Primary Health Centres.142
137 Demographic and health status indicators 1951–2011, ENVIS Centre on Population and Environment; World Health Statistics 2016, WHO.
138 The World Factbook, Central Intelligence Agency, 2017.139 “Out of pocket spend makes up 62 percent of health care costs”, The Hindu, December 2017.140 “Healthcare crisis: Short of 5 lakh doctors, India has just 1 for 1,674 people”, Hindustan Times, 2016;
“There are less than 4000 psychiatrists in India: Is medical education to blame?”, News Minute, 2018; “India has a shortage of specialist doctors”, Deccan Herald, 2017.
141 Rajasthan Health Department; Times of India, 2018.142 Karthik Muralidharan et al., Is there a doctor in the house? Medical worker absence in India,
Department of Economics working paper, Harvard University, April 12, 2011.
69Average life span in years in 2018, up from 37 years in 1951
84 Digital India: Technology to transform a connected nation

Digital technologies may help address some of India’s healthcare shortcomingsMany issues holding back India’s healthcare sector could be resolved by digital technologies that are already available or under development. Some of the innovations have the potential to fundamentally change the nature of healthcare delivery by better connecting people with services, automating routine tasks, and analysing patient data to improve care decisions (Exhibit 25).
Four technologies offer particularly compelling value propositions, addressing India’s distinct challenges: telemedicine, electronic health records, chronic disease management, and evidence-based care analytics.
Exhibit 25Healthcare in the future: digital technologies enable seamless care centered on patients.1
1 This schema imagines how the Indian healthcare landscape could look in five to ten years if digital applications were widely adopted. This would require an open and interoperable electronic health record ecosystem, clear guidelines about data ownership and privacy, the wide availability of broadband connectivity in rural areas, and rules about who can see records.
NOTE: Applications in italic type are explored in depth in this report.SOURCE: McKinsey Global Institute analysis
Telemedicine platform
Digital insurance platform
Insurance
Distributor Pharma companyPatient
Patient-facing digital applications
Care providers
Patient data ecosystem
Back-o�ce functions(scheduling, claims,records, etc)
Physician
Electronic health record (Consultation history, diagnostic results, procedures, prescriptions)
Financial records (Insurance claims, payment history)
Wellness records(Exercise and sleep patterns,allergies, immunisation records)
Connect– Telemedicine– Remote monitoring w/IoT– Online doctor comparison
1 2
2
Automate– Electronic health records– Applications for chronic disease management– Automation of claims, scheduling, etc; rural doctor accountability tools
Analyse– Evidence-based care analytics– Data-driven utilisation management and risk-sharing– Digitised insurance underwriting and claims
3
3
2
2
3
3 1
1 1
Digital distruptions Enabling platforms and applications
Key stakeholdersData ecosystem
85Digital India: Technology to transform a connected nation

Telemedicine consultations can be a cost-effective way to deliver medical care, especially in rural areasTelemedicine technology includes any digital communication between patients, doctors, specialists, and clinical staff, whether via an HQ video link at a local Common Services Centre or a discussion on a mobile phone. These remote consultations can be between patients and nurses, midwives, or other clinical staff; directly between a patient and a doctor; or between a doctor and a specialist.
Technology alone is not a replacement for care by doctors; while some ailments can be fully treated remotely, telemedicine practices still need physical facilities where trained personnel can perform procedures, take diagnostic images, and draw fluids for tests (Exhibit 26). However, these virtual visits offer a cost-effective way to deliver medical care, particularly in rural areas with relatively few hospitals and little or no physical access to specialists.
Telemedicine trials have demonstrated that remote consultations cost about 30 percent less than equivalent in-person visits. We estimate that telemedicine could replace half of in-person outpatient consultations in India, and an accelerated implementation plan could enable the country to tap 60 to 80 percent of this potential by 2025. At this scale, the technology could save India $4 billion to $5 billion while also enabling people in rural areas to reduce their dependency on unqualified medical practitioners and save time and money spent in travelling to nearby cities to obtain expert advice.
The growth of smartphone ownership and spread of broadband internet connectivity are creating a large untapped market for telemedicine consultations. The government has pitched in by drafting supportive legislation, such as the Digital Information Security in Healthcare Act. DISHA is intended to ensure the confidentiality and reliability of digital health data by regulating how they are collected, stored, transmitted, and used.
Patient schedulesconsultation withmobile app or overphone
Patient visits centre and is checked in byhealth extension worker
On-site medic records vital signs and symptoms in an electronic healthrecord (EHR)
Health extensionworker leads patient to teleconsultationcentre with screenand microphone
Doctor joins calland o�ers advicebased on patient’ssymptoms and EHR
Patient followscourse of treatment,tracking progressand adherence inmobile application
Clinic follows upthrough application and schedules nextappointment
Prescription medication is dispersed directly from clinic
Patient receives the prescribed course oftreatment on paper and via mobile app
Exhibit 26Remote consultations can redefine patients’ primary healthcare experience.Illustrative patient experience in a rural remote medicine clinic with health-extension worker
SOURCE: McKinsey Global Institute analysis
86 Digital India: Technology to transform a connected nation

Several competitors have already entered the market, with different methods for reaching patients. Practo has gained significant scale with a direct-to-patient application-based solution, gaining an edge by offering a package of services that combines remote medical consultations with insurance claims filing, electronic health records, and linkages with traditional networks of doctors and hospitals.143 Meanwhile, Apollo Health, a large incumbent provider, has begun to set up “teleclinic centres” in rural locations. Video chat technologies available in clinics allow patients to speak directly to doctors, while health extension workers at the clinics are able to perform tasks like checking blood pressure, which must be done physically. Apollo’s teleclinics have achieved significant scale, offering 10 million specialty teleconsultations to date.144
Good Doctor by Ping An, a health insurer in China, has started building an entire healthcare ecosystem in an integrated online and offline model. It offers telemedicine consultations and offline consultations through its own branded clinics, as well as a suite of services ranging from storing medical records to selling medicine, medical devices, and fitness equipment in a virtual health mall to being a gateway to secondary and tertiary care. Over 1,000 doctors work in-house with several thousand external doctors to provide consultations to over 200 million users, who also can use a mobile app to book in-person appointments, manage their prescriptions at more than 10,000 partner-pharmacy outlets, access information about various health topics, and monitor their individualised health plan.145
Electronic health records and digital patient profiles can improve diagnoses and provide safer careDigitising health records and patient profiles can improve patient care and reduce time spent on back-office tasks. The Indian government set standards in 2016 for the effective use and interoperability of electronic health records, which gather patients’ entire medical history—including test results, diagnostic images, surgical procedures, and prescription drugs taken—in one file.
This overview is meant to provide accurate, up-to-date, and complete information about patients regardless of whether they are being treated by their regular doctor, a specialist they have never seen before, or an emergency room surgeon. Proponents say that EHRs can help providers make more effective diagnoses, reduce the risk of medical errors, and provide safer care (Exhibit 27).146
India’s medical professionals outside of a few urban pockets have not yet embraced EHRs, however.147 To persuade doctors and hospitals to use electronic health records, India could follow the example of Estonia and ensure that the system is easy to learn and easy to use, and pair implementation with adequate training and incentives for adoption. In Estonia, these steps helped boost EHR uptake to 95 percent of doctors.
EHR systems should be designed with an eye on adhering to government standards and being flexible enough to effectively clean and analyse data for insights. Aggregated EHR data are extremely valuable—large EHR providers such as Cerner in the United States sell proprietary insights into anonymised data stored on their systems, which generates revenue and help keeps operations sustainable. However, any gains need to be balanced against concerns about patient privacy and confidentiality. Questions such as who owns a patient’s data, who can change it, and what they can do with the data are causing controversy across developed and developing economies alike.
143 Your home for health, Practo, practo.com.144 Teleclinics, Apollo Tele Health Services, apollotelehealth.com.145 About us, Ping An Healthcare and Technology Company, pahtg.com.146 Office of the National Coordinator for Health Information Technology, healthit.gov.147 Sunil Kumar Srivastava, “Adoption of electronic health records: A roadmap for India”, Healthcare Informatics Research,
October 2016, Volume 22, Number 4.
50%Share of in-person outpatient consultations that telemedicine could replace by 2025
87Digital India: Technology to transform a connected nation

Exhibit 27Electronic health records collect data from many sources for easy access.
SOURCE: McKinsey Global Institute analysis
Collection of data Storage ofinformation
Retrieval ofinformation
Use of information
Consultation history
Prescription history
Surgeries andprocedures
Scans
Pathology test results
Immunisation records
Allergies
Vital statistics from regular health check-ups
Visit history
Minor ailment diagnoses
Prescription data
Doctors enterdiagnoses andprescriptions in the o�ce or on the go
Lab reports aredigitalised and added to EHR
Capture information inaccordance with interoperabilitystandards in easy-to-use ways
Sources Example data elements
Store records in a common cloud- based platform in accordance with data privacy guidelines
Release informationonly with patients’consent after checking uniqueidenti�er
Doctors can retrieve EHR for outpatient visits
Doctors can seepatient history in case of emergencies
Individuals can seeown health recordsand get remindersfor follow up, etc.
Hospitals
Diagnostic labs
Pharmacies
Primary Health Centres / Clinics
Hospital admissions
88 Digital India: Technology to transform a connected nation
Application-based chronic disease management can help Indians with diabetes, hypertension, and other ailments adhere to their treatment plansA study conducted in a rural part of Maharashtra, a state in central India, concluded that less than half of patients with diabetes and hypertension adhered to their treatment plans, whether they involved diet, exercise, or medication. Many more patients are simply unclear about how to manage their chronic diseases.148
Affordable smartphones and increased internet connectivity across India provide an opportunity for medical professionals to engage directly with their patients, use digital chronic disease management apps to monitor and measure how well they are following their courses of treatment, and nudge them as needed to take their medicine, exercise, or put down the salt shaker.
Applications are not a replacement for doctors but can serve as a powerful complement to doctor-directed courses of treatment. What is not yet clear is whether patients, care providers, or insurers will pay for the apps. And will doctors be able to persuade patients to use apps consistently enough for them to change the patients’ behaviour? Chronic disease management applications have many stakeholders and natural owners, including care providers, pharmaceutical companies, and insurance companies; effective management will require these groups to collaborate.
One of the more successful chronic disease management apps is mySugr, which endocrinologists use to help people with diabetes manage their disease. People use the app to record their blood sugar levels, diet, exercise, and insulin use. More than 1.3 million people use mySugr, which the pharmaceutical giant Roche acquired in 2017.
A newer app, Sensely, helps doctors stay in touch with patients by having them talk to a nurse avatar on their smartphone; the app combines that “check-in” with data it gathers via Bluetooth from medical devices, wearable monitors, and other hardware, and relays the information to the doctor to help shape the course of treatment. Additionally, Sensely helps patients manage their own health. Standard content modules include symptom triage algorithms, which form the basis for a “personal health assistant”, as well as “self-care” modules for health information and wellness resources to help patients manage their chronic diseases.
Evidence-based care enabled by data and analytics can improve diagnosesMillions of Indians receive substandard healthcare each year, partly because of a shortage of medical specialists such as cardiologists, and partly because of the lack of suitable diagnostic tools in clinics and rural health centres. Evidence-based care seeks to address these issues by enabling doctors and nurses to supplement their clinical expertise with the best recent research. Expanded internet connectivity, faster computers, and more data make this possible.
Medical professionals can employ evidence-based care tools in several ways. At the most basic level, for example, they could search the medical literature for recommendations on how to most effectively treat common ailments. More sophisticated services use advanced analytics and AI-powered software to diagnose patients by analysing images, blood samples, or other inputs. Others evaluate patient data, which may include genome sequencing, to suggest an optimal, personalised course of treatment.
148 Kiranmayi Venkata Kakumani and Prasad Waingankar, “Assessment of compliance to treatment of diabetes and hypertension amongst previously diagnosed patients from rural community of Raigad district of Maharashtra”, The Journal of the Association of Physicians of India, December 2016, Volume 64.
89Digital India: Technology to transform a connected nation

In India, Manipal Hospitals has enlisted a cognitive computing platform, IBM Watson for Oncology, to analyse patients’ medical records and present oncologists with a range of potential diagnoses and personalised treatment options.149 In China, Infer Vision has partnered with hundreds of hospitals to rapidly iterate on AI diagnostic offerings for chest conditions. More than 60 percent of Infer Vision’s team has a technical background, and the firm’s partnership with more than 100 radiologists has allowed it to launch three major diagnostics products since being founded in 2015.
In addition to improving care for patients, evidence-based medicine can reduce cost by steering doctors away from unnecessary, ineffective, or inappropriate laboratory tests and other tasks. One report estimated this alone could save $250 billion a year in the United States.150
However, the necessary investment in digital technologies can be steep. Initial investments may be best focused on applications that produce high returns on investment. Full adoption across India would require tools to be accessible to a wide range of medical professionals across different geographies, so ease of use and compatibility with local languages would be important considerations.
Digital disruptions will reshape the healthcare sector, making it more patient-centricDigital technologies could disrupt how the healthcare industry is organised. Industry boundaries will begin to blur as established companies take on new roles in partnership with novel startups—or in opposition to them. Unlike the current model, where providers of each service—insurance, primary care, pharmaceuticals, and hospitals—deal separately with consumers, the new paradigm will encourage the integrated, seamless delivery of personalised health solutions.
Another result of digital technologies will be to enable care focusing on patients throughout their cycle of treatment, starting with pre-diagnosis. Such digitally driven changes can save time, accelerate diagnosis and treatment, and make it simpler to manage chronic diseases at every step (Exhibit 28). While these technologies are able to provide some discrete value on their own, their use in conjunction has the potential to reshape how patients experience the healthcare system.
149 “Manipal Hospitals announces national launch of IBM Watson for Oncology: Evidence-based cancer care now available pan-India for Manipal and non-Manipal patients”, IBM press release, July 29, 2016, ibm.com/press.
150 Institute of Medicine, Best Care at Lower Cost: The Path to Continuously Learning Health Care in America, Washington, DC: The National Academies Press, 2013.
“ Evidence-based medicine can reduce cost by steering doctors away from unnecessary, ineffective, or inappropriate laboratory tests and other tasks.”
90 Digital India: Technology to transform a connected nation

Traditional journey Digitally enabled journey
Diagnosis
Ongoing treatment
Deepika notices she haspersistent headaches, fatigue,
and trouble concentrating
Deepika avoids seeking help forweeks, eventually walking5 kilometres to nearest clinic,but doctor is absent
A week later, her symptoms worsen,so she walks 5 kilometres back todoctor
A series of tests are performed, withresults to come later; meanwhile,doctor tells Deepika to get more rest
Two weeks later, doctor callsDeepika at her home to giveresults—she has Type 2 diabetes
Deepika resolves to eat better andexercise more, creates handwrittendiet plan
Deepika rides bus 2 hours to visitnearest diabetes specialist forcheck-up; told she will have to comeback for quarterly check-ups
Doctor prescribes Deepika insulininjections, but they are on backorder at local pharmacy
A month later Deepika �nallyreceives her insulin supplies, but isunsure exactly when to use them
Deepika tracks her meals andexercises sporadically and withoutconsistency, and sometimes missesher quarterly check-ups, putting herat severe risk of complications
She uses her smartphone toschedule an appointment at localclinic as soon as she starts to noticesymptoms
Deepika treks to clinic at her allottedtime and is seen by doctor who hasalready read her medical history,which is available electronically
Doctor uses advanced diagnosticdevice to instantly analyse Deepika’sblood sugar and returns results forType 2 diabetes
Doctor uses clinic telemedicineplatform to get a specialist’s secondopinion, then informs Deepika shehas Type 2 diabetes
Deepika downloads diabetesmanagement app to track diet,exercise, and appointments, anduses wearable device to track vitalsand blood sugar
She uses doctor-to-patienttelemedicine platform to meet withdiabetes specialist who prescribesinsulin injections
Deepika is reminded to track hermeals and exercise consistently,and her easy-to-attend telemedicineappointments help her steer clear ofcomplications due to her disease
Deepika orders insulin injections through pharmacy mobile app and they are delivered to her door within one week
Exhibit 28Digital technologies allow us to reimagine the care journey for diabetes.
SOURCE: McKinsey Global Institute analysis
91Digital India: Technology to transform a connected nation

Digitisation requires new management strategies to capture valueSmart strategies can help companies, institutions, and individuals capture value.
Healthcare providers, for example, can accelerate the adoption of digital technology in order to release doctors from low-value-added tasks and enable them to spend more time caring for patients. Some medical professionals and patients may be sceptical of new technologies such as EHRs; providers could try to win them over by starting with simpler applications that deliver big improvements and by keeping them informed about changes to come and the benefits they may bring.
Providers also will need to prepare for the emergence of digitally enabled home healthcare, sometimes referred to as “bedless” hospitals. This involves using digital connectivity, virtual monitoring, and remote treatment technology to bring hospital services into patients’ homes.
Insurers and others who pay for healthcare stand to benefit from technological advances that improve utilisation management—that is, enable them to better assess in advance whether a course of treatment is appropriate and to authorise or deny it. Payors can leverage newly available health data to improve their underwriting, speed claim payments, upgrade patient care, and lower costs.
The national and state governments can better manage healthcare costs and accelerate the diffusion of promising new technologies by being early adopters of applications in health centres. They also can contribute by adopting policies to make it easier to collect and use data while respecting individual privacy rights.
Pharmaceutical companies and medical products manufacturers could use digital technology to boost R&D productivity in several ways, by optimising drug design and enhancing repeatability and speed in drug trials. In the manufacturing process, digitisation can reduce the number of ingredients or process steps.151 Digital technologies also offer drug makers an opportunity to interact directly with patients, building brand loyalty and influencing patient adherence to drug prescriptions.
Patients are likely to find that new digitally based products and services can offer them more information about their health and more control over their care. Companies already market chronic disease management devices to help patients with noncommunicable diseases by, for example, warning them of impending heart attacks, monitoring their vital signs, or simply reminding them to take medication. Similar applications and wearable technologies enable healthy people to monitor their wellness and provide feedback to improve their fitness.
Digital platforms already allow patients to conduct online doctor comparisons based on the physician’s training and experience or feedback from other patients as well as which health insurance programs the doctor accepts.
151 Olivier Leclerc and Jeff Smith, “How new biomolecular platforms and digital technologies are changing R&D”, July 2018, McKinsey.com.
92 Digital India: Technology to transform a connected nation

93Digital India: Technology to transform a connected nation

94 Digital India: Technology to transform a connected nation

Trade, both wholesale and retail, is a large part of India’s economy and is getting larger. The sector accounts for 10 percent of India’s GDP and 8 percent of employment.152 Despite its size, much of India’s retail sector is dominated by small mom-and-pop stores. More than 80 percent of all retail outlets in India—mostly sole proprietorships or family-run shops—are part of the cash-driven informal economy, which the Indian government defines as “engaged in the production of goods or services with the primary objective of generating employment and incomes to the persons concerned”.153 That compares with 55 percent of retailers in China and 35 percent in Brazil. Mom-and-pop stores are not a rural phenomenon. Of India’s 231 million micro-, small-, and medium-size trading enterprises, 53 percent are in urban areas; of the 390 million people employed by these businesses, 59 percent are in towns and cities.154
Digital technology in the form of e-commerce is changing the sector. The pace of growth has picked up pace in recent years, coinciding with the rise of online commerce. Between 2006 and 2011, trade grew by an average of 7.7 percent while GDP expanded by 7.2 percent, representing elasticity of 1.07. Industry growth rose to 8.9 percent from 2012 to 2017, while GDP growth slowed to 6.5 percent, representing an elasticity of 1.4. This second, faster phase of growth in trade coincided with a steep rise in Indian e-commerce, from about $2 billion in 2012 to $20 billion by 2017, suggesting online sales are not just cannibalising traditional businesses.155
This is just the beginning: our estimates suggest that e-commerce growth will outpace sales at brick-and-mortar locations for many years, and the digital share of overall trade in India will increase from 5 percent currently to about 15 percent by 2025. Digital technologies are rising rapidly as they address the core pain points, or problems, of the retail industry.
Multiple pain points exist for both small and large retailersSmall retailers and those in the informal economy often must cope with limited access to credit because they conduct their business in cash and do not create the kind of verifiable financial records necessary to prove their creditworthiness. This can limit their ability to borrow money to expand or to raise working capital for repaying maturing debts, weathering business slumps and emergencies, or even financing day-to-day operations such as replenishing inventory or paying bills. When they are able to borrow, they often rely on informal moneylenders who charge high interest rates—as much as ten percentage points more than rates at traditional banks.
They also have constrained growth potential not only because of their limited access to affordable credit but also because they usually attract customers from only a limited area, and their revenue growth depends on local affluence and demand. The in-store productivity of small and informal retailers tends to be low because they order supplies, track inventory, keep books, and perform other duties manually, often using paper forms and ledgers.
Meanwhile, large brick-and-mortar retailers in India face different challenges. For example, their capital-heavy business models rely on large physical locations that require staffing, and on high inventory levels. One-way transactions give them little to no data that would help them to improve in-store experiences or build customer loyalty, and they tend to rely on traditional—and often ineffective—marketing practices, which are not targeted.
152 Retail industry in India, India Brand Equity Foundation, October 2018.153 Store-based retailing data is from Euromonitor International Retailing Edition 2019; traditional grocery retailers are
assumed to represent unorganised entities, or mom-and-pop stores; Informal sector and conditions of employment in India, National Sample Survey Office 66th round, 2009–10.
154 Annual report 2017–18, Ministry of Micro, Small and Medium Enterprises.155 National accounts statistics: Back series 2004–05 to 2011–12, 2017–18, Ministry of Statistics and Programme
Implementation, Government of India; Euromonitor International Retailing Edition 2019.
4.3 Retail
95Digital India: Technology to transform a connected nation

Few of India’s big retailers alter prices in response to supply and demand, nor do they try to persuade customers to purchase additional goods and services (cross-selling) or to consider buying a larger quantity or a higher-quality version of what they have chosen (up-selling).
Digital apps can significantly alleviate retailers’ pain pointsAided by the increasing availability of high-speed digital connectivity, the growing number of smartphones, and the adoption of accommodative government policies, digital technologies can seamlessly connect sellers and buyers. Retailers, both small and large, stand to gain significantly from the adoption of digital technologies. Some of the more prominent digital applications are briefly described below:
— Online buying and selling: E-commerce via online marketplace or through a company’s own website offers a direct connection with consumers, supplementing physical shops.
— Store and inventory management: Readily available software for laptops or tablets can help retailers keep their accounts, pay suppliers, manage inventory, and bill customers, all while generating data that can provide insights into how to improve productivity.
— Digital marketing: Commercial platforms can place targeted advertising, generate leads, analyse the effectiveness of campaigns, and make data-backed recommendations about discounting and other management decisions.
— In-store digital applications: Retailers are bringing digital technology into their brick-and-mortar stores in several ways. Some use augmented-reality solutions to let shoppers see how a garment or makeup would look on them without requiring them to physically put it on. Others have created virtual stores—two-dimensional displays of groceries or other products, each with a QR code—where customers make a purchase by scanning the code; the physical products are then delivered to their homes.
— Financing: As noted earlier, digital applications such as e-commerce and point-of-sale credit- and debit-card terminals automatically create revenue and cost data that lenders can rely on to more accurately assess potential borrowers’ creditworthiness. This can make it easier for retailers to access credit for working capital or expansion.
— Digital payments: United Payments Interface, the interbank money-transfer service, and digital wallets such as Paytm are card-free options to make or receive digital payments. Using them in lieu of cash also creates data on revenue and expenditure and can help retailers expand their customer bases and reduce the cost of handling cash.
These digital innovations are likely to restructure India’s retail industry and produce significant industry churn. Few retailers will be able to avoid the effects of digitisation, and businesses of all sizes will need to learn how to use technology to connect with their customers, automate internal processes, and analyse data collected from customer profiles, online orders, and digital payments (Exhibit 29). Well-managed, forward-thinking retailers—even mom-and- pop shops—who master these skills will be much more likely to build customer loyalty, identify ways to become more efficient, and thrive.
Data is a constant in the connect-automate-analyse process. Each step offers opportunities to both gather and apply data. For example, connecting with customers digitally, whether by alerting them to new products and new promotions or by taking orders, can produce insights. Retailers can glean a lot about individual or collective interests, tastes, and even income of their customers by knowing which digital communications they bothered to read and which they acted on. Their purchasing histories offer even richer insights.
Data provide insights into which items sell quickest or provide the biggest profit margin, information that is useful for strategic planning and inventory management. In the next section, we explore three specific digital applications that pertain to online buying and selling, financing, and digital marketing.
96 Digital India: Technology to transform a connected nation

Online selling will disrupt all types of retail marketsOnline buying and selling is the most prominent and profound digital application, and it affects small and large retailers as well as end consumers in equal measure. According to the McKinsey 2019 Global Consumer Sentiment Survey, which surveyed 17,700 people in 15 countries including India, online buying is already the second most heavily used buying channel for consuming-class urban Indians. The omnipresent mom-and-pop stores, by contrast, ranked a distant fourth, and just over half of consuming-class urban Indians reported shopping there. Fresh food markets are used by about 30 percent of the same group (Exhibit 30).
30%Share of consuming-class Indians who buy at fresh food markets
Data ecosystem
Manufacturer Wholesaler Retailer Customer
Independent online B2C retail channels²
Third-party online B2B retail channels
Third-party online B2C retail channels
Financial(digital payments, GSTN data)
Customer data2
(purchase history, occupation, age, gender)
ConnectSmaller retailer– Online selling (and buying)
Larger retailer– Online selling (and buying)– In-store digital applications for
immersive customer experience
1 2
Automate– Digital solutions for store/inventory management
– Digital solutions for store/inventory management
Analyse– Financing– Digital payments
– Digital marketing– Personalised o�ers– Optimal pricing
3
3
2 1
11
Digital distruptions Enabling platforms and applications
Key stakeholdersData ecosystem
Exhibit 29Retail in the future: data-enriched client experiences, online and in stores.1
1 This schema imagines how the Indian retail landscape could look in five to ten years if digital applications were widely adopted. This would require clear rules about permissible e-commerce practices, significant growth in consumer banking and digital payments, wide availability of broadband connectivity in rural areas, continued growth in internet subscribers and smartphone owners, and widespread digital literacy among consumers.
2 This is relevant primarily for large retailers.
NOTE: Applications in italic type are explored in depth in this report.SOURCE: McKinsey Global Institute analysis
97Digital India: Technology to transform a connected nation

Online household spending grew by 45 percent in the 12 months ending in September 2018, making digital the fastest-growing sales channel for urban India. Specialty grocers were the next-fastest-growing channel with a 27 percent net increase, followed by hypermarkets with a 19 percent increase. Of people who bought online, more than 60 percent said it helped them save time. The second-most-popular reasons for online shopping, greater product range available online and convenience to order anytime, were each cited by just 38 percent of respondents. More than 80 percent of people who shopped more online said it was a positive experience, indicating the sustainability and growth potential of the channel, and more than two-thirds said they plan to increase their online grocery shopping (Exhibit 31).
There is no one-size-fits-all strategy for retailers seeking to tap into the rapid growth of e-commerce. Approaches vary depending on each retailer’s size, scale, location, and product line.
— Small retailers often see online platforms as a means to scale up their businesses, gain insight about demand, and conveniently find customers beyond their immediate area. Small retailers that deal in niche products or have low sales volumes may find it useful to list their products on online marketplaces, but they aren’t likely to use more sophisticated e-commerce service offerings like fulfilment services. Meanwhile, those that sell mass-produced goods may opt for a fuller suite of fulfilment services, including warehousing and shipping.
45%Growth in online household spending in the year to September 2018
Exhibit 30Online grocery shopping has become common among a sample of primarily urban Indians.Distribution of channels used by households for buying household supplies1
%, households2
1 Percent of households answering the question “Where do you currently shop for goods for your household (eg, groceries, household supplies)?”
2 McKinsey Global Sentiment Survey for India consists of responses from 1,000 individuals between the ages of 18 and 74. More than 80 percent of respondents live in urban areas, and more than 75 percent of respondents earn more than 30,000 rupees per month.
SOURCE: McKinsey 2019 Global Sentiment Survey; McKinsey Global Institute analysis
Exhibit 30
Distribution of channels used by households for buying household supplies1
%, households2
Online grocery shopping has become common among a sample of primarily urban Indians
Source: McKinsey 2019 Global Sentiment Survey; McKinsey Global Institute analysis
1. Percent of households answering the question “Where do you currently shop for goods for your household (eg, groceries, household supplies)?”2. McKinsey Global Sentiment Survey for India consists of responses from 1,000 individuals between the ages of 18 and 74. More than 80 percent
of respondents live in urban areas, and more than 75 percent of respondents earn more than 30,000 rupees per month.
83
60
54
50
29
24
21
20
8
Chain grocery stores/supermarkets
Fresh food markets/wet markets
Online (net)
Monobrand beauty stores
Hypermarkets
Mom-and-pop stores/local bakeries
Drugstores/health and beauty specialty stores
Specialty grocers
Cash and carry
Petrol stores/forecourt stores
79
98 Digital India: Technology to transform a connected nation

— Large retailers use third-party platforms to serve customers without having to invest in building and running their own high-volume transactional websites. Some do not have physical stores and do not want to start opening them. Others have substantial numbers of brick-and-mortar stores. Some large retailers, such as Croma, an electronics chain, use e-commerce platforms to supplement their own websites as well as their physical stores. Platforms offer retailers large, ready pools of potential buyers and data about their shopping and browsing. They also make available logistics, inventory, and payment services.
Online commerce platforms would be the most beneficial under fair, competitive conditions, but unfair pricing practices or online monopolies could inhibit their potential. At the same time, overly stringent regulations restricting e-commerce can stifle growth and innovation. Striking a balance between these extremes is important to the success of the nascent industry in India.
Exhibit 31The majority of Indians plan to further increase their use of the internet for grocery shopping in the next year.Respondents saying they will more frequently use the internet to buy groceries in the future1 % of population2
1 Percentage of people answering “increase somewhat” or “increase significantly” to the question “How do you expect your frequency of using the internet to buy groceries and household supplies to change in the next 12 months?”
2 McKinsey Global Sentiment Survey consists of responses from 17,700 individuals globally between the ages of 18 and 74, 1,000 of whom were from India. Among Indians surveyed, more than 80 percent of respondents live in urban areas, and more than 75 percent of respondents earn more than 30,000 rupees per month.
SOURCE: McKinsey 2019 Global Sentiment Survey; McKinsey Global Institute analysis
Exhibit 31
Respondents saying they will more frequently use the internet to buy groceries in the future1
% of population2
The majority of Indians plan to further increase their use of the internet for grocery shopping in the next year
Source: McKinsey 2019 Global Sentiment Survey; McKinsey Global Institute analysis
1. Percentage of people answering “increase somewhat” or “increase sign cantly” to the question “How do you expect your frequency of using the internet to buy groceries and household supplies to change in the next 12 months?”
2. McKinsey Global Sentiment Survey consists of responses from 17,700 individuals globally between the ages of 18 and 74, 1,000 of whom were from India. Among Indians surveyed, more than 80 percent of respondents live in urban areas, and more than 75 percent of respondents earn more than 30,000 rupees per month.
37
24
21
21
21
18
14
17
16
15
13
11
11
17
8
5
7
8
7
6
5
2
2
2
2
2
2
2636 62India
45
United States
United Arab Emirates
Nigeria
China
Mexico
35
Saudi Arabia
6
28
21
18
Global
19
Brazil
South Africa
Japan
14
Spain
Russia
Germany
France
Plan to increase signi cantlyPlan to increase somewhat
52
29
17
28
19
28
27
24
13
13
United Kingdom
99Digital India: Technology to transform a connected nation

Data analytics enable targeted digital marketing and personalised shopper incentivesConsumers increasingly want more than products or services from retailers; they want to feel a personal connection with store brands. More than half of those responding to an online survey of 1,000 consumers said they buy more from retailers who suggest products or show online ads based on their previous browsing or buying behaviour. A plurality (48 percent) said they buy more after receiving personalised emails alerting them to products or customised offers based on their shopping history.156
To meet those expectations, retailers need digital technology capable of tracking each customer’s buying and browsing histories, cross-referencing those data to the retailer’s inventory, suggesting discounts or other offers likely to persuade shoppers to buy, and then recommending which communications channels and marketing approaches are most likely to elicit a response.
While only 33 percent of people who responded to the online survey said personalised ads in their social media feeds motivate them to buy more from a retailer, other approaches using social media marketing can be more engaging. Facebook Live video is one example, as are games, live curated content, and contests.
Consumers also respond well when they think they are getting a good deal. Indian retailers have noticed this. The hypermarket chain Big Bazaar drew 10 million viewers to a Facebook Live Shopping Carnival and texted one million coupons to consumers who wanted to buy one of the hourly specials offered on the 24-hour webcast; shoppers used 62 percent of the coupons, which required them to visit a physical store.157
Digital payments and flow-based lending can remove a hurdle to business growthUntil now, financial institutions have restricted access to credit to individuals and micro-, small-, and medium-size enterprises because they frequently lack a financial history. Online payments will help by generating a substantial amount of data, such as historical records of revenue, the costs of doing business, and market growth. The rapid rise in digital payments in India—they jumped by about 75 percent between November 2016 and January 2018 to reach more than 1.5 billion transactions—suggests they already are generating substantial amounts of data.
More digital transactions could make it easier for small businesses to borrow from banks and other traditional establishments rather than local moneylenders. Digital transactions provide a record of businesses’ revenue and expenses, which enables banks to offer loans based on projected future cash flows (which is why it is often called flow-based lending) rather than based on the liquidation value of a borrowers’ assets (Exhibit 32).
Digital payments and flow-based lending have the potential to substantially boost the amount of credit available to micro-, small-, and medium-size enterprises, removing an impediment that has long prevented them from growing.
156 Lauren Freedman, Consistent personalization everywhere consumers shop: 7th annual consumer personalization survey, MyBuys.com, 2015.
157 “Big Bazaar announces first 24 Hours Facebook Live Shopping Carnival”, Big Bazaar press release, January 23, 2018, futuregroup.in; “How Big Bazaar recorded highest sale ever on Republic Day sale with Facebook Live”, Social Samosa, February 6, 2018, socialsamosa.com.
1.5 billionVolume of digital payments in India in 2018, a 75% increase from 2016
100 Digital India: Technology to transform a connected nation

The State Bank of India switched its SME lending program from balance-sheet lending to cash-flow-based lending in 2016 and has automated the process of conducting due diligence for loans to SMEs.158 Lending to SMEs has increased by almost 50 percent since the policy was adopted, rising from $27.4 billion at the end of fiscal year 2015 to $38.5 billion in 2018. The increase in the number of borrowers was more modest, going from fewer than 900,000 to just over one million.159
Digital transformation may affect all key stakeholders in the ecosystemThe coming digital transformation of the retail sector in India has implications for more than retailers themselves. Today’s intermediaries, the wholesalers, also should be anticipating that digital will affect their business and investigating how they could respond. Consumers, too, would be wise to look ahead to what these changes might mean for them.
Digital technologies will make it easier for efficient mom-and-pop stores to scale up by enabling them to serve demand beyond their immediate service areas, giving them access to institutional credit for expansion, and integrating informal retailers into the formal economy.
158 Namrata Acharya, “SBI moves from balance sheet-based to cash flow-based lending”, Business Standard, September 17, 2016; Shritama Bose, “How SBI Project Vivek has given SMEs a leg-up in drive to clear loans”, Financial Express, September 23, 2017.
159 SBI annual report 2017–18: Building momentum for a transforming India, State Bank of India, 2018; SBI annual report 2014–15: Bankers to digital India, State Bank of India, 2015.
Exhibit 32Flow-based lending can simplify the process of making and servicing loans.Illustrative flow-based lending process enabled by digital technologies
SOURCE: McKinsey Global Institute analysis
Digital application for loanWeb or Mobile or Banker
Disbursal of creditBanker review
Digital veri�cation
Loan paymentDigital veri�cation
of identify
Eligible amount,quote, etc, through a push noti�cation
Extensive documentationand physical visit to bank
~30 days to process in banks
~15 days for loandisbursal by banks
Asset-backed, mortgageneeds to be paid
~10 mins to apply for loan on website or mobile
~90 seconds to process the loan
~3 days for loan disbursal Automatic and �exiblerepayment options
Loan application Credit risk assessment Loan disbursal Risk management
Indiastack
GSTN
Invoices
Credit history
Sales ledgers
Bank stmts.
SME SME
Automaticrepayment from POS swipes or escrow accounts
Flow-basedlendingplatform
Traditionallending
Flow-basedlending
Open API consent layer to access data
AntifraudmanagementteamAlgorithm for
credit riskassessment
101Digital India: Technology to transform a connected nation

More dynamic small retailers will likely take advantage of this opportunity to scale up and become more productive.
Big retailers will find that digital applications can help them improve their margins and scale up faster by reducing the role of capital. The data generated by digital transactions may both build customer loyalty via personalised offers and allow retailers to engage in more and better price discrimination to optimise revenue from each buyer.
Customers are clear winners in the digital revolution, gaining customised services, additional convenience, and much more variety in the goods on offer. However, as retailers’ analytical capabilities become more advanced, customer targeting and segmentation will proliferate. Companies will be that much better at delivering “the right product, price, and message to the right customer at the right time”, as a marketing saying goes.
Reimagining the life of a small retailer in the digitised futureIt is not difficult to imagine how digital technology could dramatically affect India’s small retailers and their earning potential (Exhibit 33). Many small shop owners today rely on repeat customers, referrals, and passers-by to come to their businesses and peruse their inventory. Social media, e-commerce platforms, and other digital pathways can expose shop owners to a much larger audience, and digital ordering and payments make it relatively easy to convert more browsers to customers.
The resulting revenue growth, documented in digital-payment records that the shop owner can share with potential lenders, makes it easier to borrow money for expansion—increasing production in the original shop and perhaps opening additional locations or creating a website catering to people in other states or abroad.
In this way, small business owners can become medium-size business owners and job creators. The same process can help today’s medium-size business manager mature into tomorrow’s corporate leader, and so on.
102 Digital India: Technology to transform a connected nation

Traditional journey Digitally enabled journey
Sandeep has a small 40 square-footstore selling bakery productson the periphery of Indore city
Sandeep’s cakes are well-knownlocally, and he usually sells topeople in the neighbourhood whomhe knows well
Operations are manual—whileSandeep manages his ledgers, hiswife helps him maintain inventory
He is supplied by the local distributorof a consumer-goods company,whose sales sta� visits him every2 weeks
Almost all of Sandeep’s sales are in cash
Sandeep wants to cater to theresidents of the couple of newlyconstructed high rise apartments,but lacks a mechanism to do so
Delivery e�orts for bakery products are limited to repeat customers who call Sandeep directly
Sandeep and his wife see theirbakery as a declining occupation;they encourage their children tostudy hard so they will not follow intheir footsteps
Sandeep joins an e-retailer making abig drive to bring small eateries ontoits platform
Sandeep list his products on theplatform, which allows morecustomers in a broader area to seethem
Sandeep’s sales increase by morethan 50 percent within 3 months ofjoining the platform
He is approached by banks for microcredit based on his transactionsrecord on the platform
Sandeep uses the credit to increasestock levels; more than 30% of hissales now come from the onlineplatform
Sandeep hires two more people tohelp him increase production tomeet greater demand for hisproducts
Sandeep’s income increases, andhe begins thinking of buying a smallcar for the family
Exhibit 33Digital technologies can transform the income-earning potential of a small retailer.
SOURCE: McKinsey Global Institute analysis
103Digital India: Technology to transform a connected nation

104 Digital India: Technology to transform a connected nation

As India’s economy continues its growth momentum, the flow of goods will become critical, both within the country and beyond. One of the weak links is high logistics cost, at 13 to 14 percent of GDP, compared to 8 percent in the United States, 9 percent in Europe, and 12 percent in South America.
Multiple factors contribute to this high cost. McKinsey’s logistics practice has estimated that only 60 to 70 percent of logistics spending is attributable to direct costs associated with the country’s fragmented trucking industry, inadequate railways infrastructure, and lack of warehousing. More than 75 percent of operators own five or fewer trucks, leading to challenges in containerisation of freight.160 This is a particular issue in India, where 60 percent of all freight moves on roads, compared with 30 to 45 percent in developed countries.161 Furthermore, national highways represent just 2 percent of the country’s road network but carry an estimated 40 percent of traffic; McKinsey’s logistics practice has estimated that 50 percent of all freight in India moves on just seven key national corridors.162
The remaining 30 to 40 percent of India’s logistics spending is for indirect components including theft, damages, and inventory carrying costs.163 Cumbersome and redundant procedures and processes are one of the key contributors to high indirect costs. According to the World Bank’s 2018 Logistics Performance Index, India ranks 35th in speed and predictability of the clearance process, while China is 27th and Singapore is fifth.164 The Ministry of Finance estimates that a 10 percent decrease in indirect logistics cost could increase exports 5 to 8 percent.165
The Indian logistics industry is at the cusp of disruptionHaving a robust, reliable, and efficient logistics sector is critical to increasing productivity and making Indian goods competitive in global markets. In January 2018, the government set out to create a national logistics platform, an integrated portal that, if implemented robustly, will serve as a transactional e-marketplace to connect logistics buyers and service providers with all government agencies, such as customs, as well as port community systems, sea and airport terminals, shipping lines, and railways. A national logistics platform could help manufacturers reduce turnaround time in warehouse activities and better administer the end-to-end movement of goods in supply chains, while retailers and sellers could benefit from faster deliveries, lower inventory requirements, and smoother order processing.
Significant activity is either planned or already taking place in the logistics sector, by both the government and the private sector. For example, the government has agreed to invest $114 billion in the Sagarmala project to modernise port connectivity, $76 billion in the Bharatmala road- and highway-construction programme, and another $121 billion to modernise Indian railways. At the same time, multiple private-sector players have also launched initiatives to improve efficiency and functioning. For example, Rivigo, a trucking startup, has adopted a suite of technologies—internet-linked sensors to improve maintenance of its fleet and enable dynamic routing and driver relay models—that the company says have reduced transit times for clients by 50 to 70 percent.166
160 India Transport Report: Moving India to 2032, Volume 1, National Transport Development Policy Committee, 2014.161 Sector report, Logistics—India 2017, IMAP India.162 McKinsey logistics practice analysis; Statistical Year Book India 2014 and Statistical Year Book India 2018,
Ministry of Statistics and Programme Implementation, Government of India.163 McKinsey logistics practice analysis.164 World Bank Logistics Performance Index, lpi.worldbank.org.165 “Industry and Infrastructure”, in Economic Survey 2017–18, Ministry of Finance, Government of India, January 2018.166 “Anywhere to anywhere in India in 3 days”, Rivigo, rivigo.com.
4.4 Logistics
105Digital India: Technology to transform a connected nation

Digital applications are critical to cut logistics cost significantlyAccording to estimates by McKinsey’s logistics practice, digital interventions that result in higher system efficiency and better asset utilisation can reduce logistics costs by as much as 25 percent. Promising digital technologies exist for all aspects of the logistics value chain, from manufacturer or retailer to freight carrier and finally to the buyer (Exhibit 34).
Among the most promising digital interventions are platformisation, telematics, and digital record-keeping via applications like blockchain, as we discuss below. Beyond these three, advanced analytics and other digital technologies can bring significant efficiencies to logistics. For example, real-time data can be used for route optimisation, informing about traffic conditions, the status of the fleet, shipments pending delivery, and other variables, to develop the most efficient approach to loading trucks and routing them to their destinations. Analytics can also be used for back-office tasks, enabling efficiencies such as algorithmic pricing and automated booking. Robots can undertake repetitive, low-skill tasks such as picking, cleaning, sorting, and handling, while equipping workers with augmented-
Data ecosystem (decentralised using blockchain)
Logistics platform
Telematics
Demand and supply oflogistics services at agranular level in the country
Vehicle and driver data(obtained by tracking and tracing devices attached to vehicles)
Warehouse and storage data(stock availability, space availability, count of relevant items, etc)
Connect– Platformisation– Decentralised network
technology to create anetwork of connectedstakeholders
1
2
2
Automate– Dashboard user interfaces and data logs– Automated bookings– Predictive maintenance for vehicles
Analyse– Telematics: real-time monitoring and analytics using IoT devices– Inventory and route optimisation– Warehouse space optimisation
3
3
3
3
1
Source (supplier, stockyard, etc)
Freight forwarder Carrier Destination
Digital distruptions Enabling platforms and applications
Key stakeholdersData ecosystem
Traditional staggered �ows Instantaneous digital �ows
Exhibit 34Logistics in the future: digital technologies allow supply-chain consolidation and analysis.1
1 This schema imagines how the Indian logistics landscape could look in five to ten years if digital applications were widely adopted. This would require robust roads, railways, ports, and other infrastructure; standards for logistics data sharing; and rules on ownership and liability.
NOTE: Applications in italic type are explored in depth in this report.
SOURCE: McKinsey Global Institute analysis
Data ecosystem (decentralised using blockchain)
Logistics platform
Telematics
Demand and supply oflogistics services at agranular level in the country
Vehicle and driver data(obtained by tracking and tracing devices attached to vehicles)
Warehouse and storage data(stock availability, space availability, count of relevant items, etc)
Connect– Platformisation– Decentralised network
technology to create anetwork of connectedstakeholders
1
2
2
Automate– Dashboard user interfaces and data logs– Automated bookings– Predictive maintenance for vehicles
Analyse– Telematics: real-time monitoring and analytics using IoT devices– Inventory and route optimisation– Warehouse space optimisation
3
3
3
3
1
Source (supplier, stockyard, etc)
Freight forwarder Carrier Destination
Digital distruptions Enabling platforms and applications
Key stakeholdersData ecosystem
Traditional staggered �ows Instantaneous digital �ows
106 Digital India: Technology to transform a connected nation

reality glasses could increase their efficiency at sorting, kitting, and picking items. Finally, networked Internet of Things sensors can be used to gather live performance data on equipment while it is in service and use predictive analytics to repair or replace components as warranted.
“Platformisation” may bring efficiency and transparency to India’s fragmented logistics ecosystemPlatformisation is the process of moving all transactions for a truck or fleet owner online. Much of the attention in this area has focused on digital freight aggregation, but industry players are starting to explore other services, such as insurance, financing, and fleet management. A lack of transparency into demand and supply makes it difficult for many truckers to find return loads, so they rely on brokers, increasing their waiting time at outbound locations and leading to reduced efficiency and higher costs. Several companies are testing models to create a more transparent platform-based demand and supply matching system along with other value-added services.
Turvo, a Silicon Valley–based startup with an office in Hyderabad, offers a cloud-based service to help logistics firms optimise their rates using artificial intelligence. Another use is digitally enhanced freight aggregation. Startups such as BlackBuck and 4TiGO, which are based in Bangalore, operate online platforms that enable shippers to find independent truckers to deliver goods at a mutually acceptable price. BlackBuck says it has signed up more than 250,000 trucks and 10,000 shippers, including Hindustan Unilever.167 Uber entered the long-haul business in 2017 with its Uber Freight division. Uber Freight connects shippers with truck drivers in much the same way that the Uber app connects drivers and riders; like its taxi-aggregating cousin, the freight service adjusts prices to match supply and demand.
Telematics solutions can help in end-to-end fleet management, even for fleets of oneTelematics involves the use of digital communications and informatics to monitor vehicles and cargo in real time, maximise fleet utilisation, and improve driver performance and discipline.
Indian freight operations are inefficient by international standards; Indian trucks travel an average of 300 kilometres per day, compared with 800 kilometres in China, McKinsey’s logistics practice estimates. One reason for this inefficiency is the Indian industry’s highly fragmented nature: more than 80 percent of trucks operate independently rather than as part of a fleet.168 Telematics can help even individual truck owners improve fuel efficiency, increase visibility with shippers, and enhance vehicle utilisation (Exhibit 35). Shippers are increasingly interested in vehicle utilisation and visibility. The solution set ranges from simple GPS tracking to complete interface with vehicle computers, as needed.
Telematics solutions can help reduce fuel consumption by 10 to 20 percent and lower maintenance costs by 20 to 30 percent by providing managers with data they can use to identify drivers who idle too long, accelerate too quickly, or drive too fast. Managers can use the same data to optimise the routes drivers take, reduce the number of miles they drive, and make sure trucks are serviced on schedule. Some systems used face-monitoring algorithms and in-cabin cameras to detect driver fatigue or unauthorised drivers, aiding theft prevention and insurance proceedings.
167 BlackBuck (Zinka Logistics Solutions Pvt. Ltd.) page on LinkedIn.168 India Transport Report: Moving India to 2032, Volume 1, National Transport Development Policy Committee, 2014.
107Digital India: Technology to transform a connected nation

Decentralised record-keeping networks can create trust and transparency by removing intermediariesCurrent paperwork processes in the logistics industry are highly manual, tedious, and inefficient. This can increase costs and slow deliveries. Digital technologies like blockchain can help. It can be used as a rating system in which every transaction completed by a trucker or shipper can be rated or verified. Since its authentication can be used by other players, trust in the system increases and multiple verification steps are removed. This creates a reputation-based economy and reduces intermediaries.
A sending company can put together a smart contract to automatically pay the vendor when a shipment reaches its destination. The addition of blockchain can make smart contracts smarter by eliminating administrative steps. Initial vetting would be required for all shippers, carriers, and brokers. Different authentication sources would need to be used to ensure that all parties establish trust from the beginning (Exhibit 36). A private network for shippers, carriers, brokers, and others must be set up. Government or industry-wide bodies would be in the best position to create a consortium to establish a common framework for the development of rules-based logistics networks, possibly using blockchain. Multinational players and governments have made initial progress. The Port of Antwerp in Belgium, for example, recently began using blockchain technology to help it securely automate its administrative processes.169
169 “Antwerp blockchain pilot pioneers with secure and efficient document workflow”, Antwerp Port Authority press release, June 18, 2018.
Exhibit 35Telematics data can help to improve end-to-end fleet management.
SOURCE: McKinsey Global Institute analysis
Fuel cost savings
Maintenance cost savings
Telematics-enabled truck
Camera Temperature sensor
Telematicsbox
Load sensor Fuel sensor
Application server Fleet manager’s control centreTransmission of
computerisedinformation …
… leading toimprovement in�eet operations
10% 20%
30%10%20%
10%
108 Digital India: Technology to transform a connected nation

While blockchain technologies offer promise, significant uncertainties are also associated with them. McKinsey’s work with financial services leaders over the past two years suggests that companies that were quick to invest in blockchain have begun to have doubts; only relatively few use cases made technological, commercial, and strategic sense or could be delivered at scale. According to one study, some financial services companies—among the attempted early adopters—felt the technology was too immature, not ready for enterprise-level application, or unnecessary because other options worked as well and cost less.170
As stated above, India’s logistics sector is inefficient, costing 14 percent of GDP compared with 8 to 9 percent for peers and advanced nations. India can go a long way toward improving efficiency by first adopting the more established applications discussed above, including setting up a national logistics platform and leveraging the power of telematics.
170 Matt Higginson, Marie-Claude Nadeau, and Kausik Rajgopal, Blockchain’s Occam problem, January 2019, McKinsey.com.
Exhibit 36Decentralised record-keeping networks with data from the Internet of Things can make supply chains more transparent.
SOURCE: McKinsey Global Institute analysis
Direct communication ofstatus and transactionalinformation via Internetof Things–enabled goods
Supplier holds a copy of the ledger and hasfull visibility of the status of the shipped goods
The network computers share the collected data and make it visible to all network participants
Recipient holds a copy of the ledger and has full visibility of the status of the shipped goods
Decentralisedrecord-keeping network
Supplier Port Warehouse
109Digital India: Technology to transform a connected nation

What stakeholders can do to accelerate the digitisation of India’s logistics sectorFor India to realise gains and for logistics companies to benefit from them will take time and patience.
Shippers that use logistics services to deliver finished goods to consumers or parts to commercial customers can benefit by becoming smart consumers of data. Being better able to use the additional information, insights, and choices digital processes make available could help shippers adopt leaner practices, reduce supply chain downtime, and improve the quality of supply chain services overall (Exhibit 37).
Digital literacy will be essential to engage digitally with other stakeholders. This is essential to fully realising the benefits of these new technologies. Shippers will need to know how to adopt new applications and make sense of the data all stakeholders will share with them throughout the transportation process.
Government can play an important role in digitising logistics and supply chains in India by establishing a clear value proposition for the process and encouraging truck fleet owners to invest in digital solutions. Equally important would be the creation of a common platform and establishment of industry bodies to write rules governing the platform and standardising data on it. The government is already at work on this, having initiated work to build a National Logistics Platform to bring efficiency and transparency to the sector. The government could consider expanding and improving training programs to equip workers in the logistics sector with skills needed for each wave of new digital technology. At the same time, it can encourage innovation by continuing to invest in and actively use digital technologies. It recently mandated the installation of GPS devices on public buses to allow them to be tracked remotely, but it could do more by creating a market for frontier technologies such as artificial intelligence.171 For example, AI could help the state-owned Indian Railways optimise its coach loads and train routing.
The four sector examples highlighted in this chapter are just an illustration of the types of efficiencies and value that digital technology adoption and the creation of digital ecosystems could bring about in India. These technologies already exist, and companies are starting to harness them. Embracing digital is not just a company role, however: both government and individuals also have important roles to play, as we discuss in the final chapter.
171 Intelligent Transportation Systems (ITS): Requirements for public transport vehicle operation, Automotive Research Association of India, 2017.
110 Digital India: Technology to transform a connected nation

Traditional journey Digitally enabled journey
Mukesh has a steel factory in Delhiand supplies steel to fabricators and
manufacturers throughout the country
Mukesh typically hires shippingcompanies in the same industrialarea to transport the bulk of hisproducts
The truckers give him a handwrittenreceipt with details on the size of theconsignment, destination, amountpaid, etc., but no proper document
Mukesh has to constantly follow up with truckers to get updates on the status of the consignment, and hasto rely on what they say
Mukesh has to spend a signi�cantproportion of his time on logisticswhich could be more productivelyspent elsewhere
Occasionally, part of hisconsignment is damaged or stolen; Mukesh has to bear the loss on his books
Mukesh’s perception by customersoften su�ers as a result of delayedorders
The time Mukesh loses in managinglogistics prevents him frominnovating or expanding hisbusiness
Mukesh logs on to an integratedlogistics platform, which matchesdemand with supply, to bookcapacity for his upcomingconsignments
He compares quotes from di�erentproviders (including multimodal),and in minutes he can evaluatetheir reputation and the servicesthey o�er
Mukesh now gets better prices andservice because the platform hasled more e�cient and transparentplayers to expand
He tracks his consignment andmonitors its condition in real timethrough a dashboard linked to �eet-management software
Mukesh gives his buyer a codethat allows him to access detailedinformation on nature ofconsignment goods, value, etc.
Transparency is increased asMukesh and his buyer can checkreal time status and location ofgoods by logging onto a sharedplatform
Mukesh saves hours each day andhas happier customers since hestarted leveraging the integratedplatform
Exhibit 37Digital technologies can increase efficiency in logistics systems by adding transparency.
SOURCE: McKinsey Global Institute analysis
111Digital India: Technology to transform a connected nation

112 Digital India: Technology to transform a connected nation

For India to reap the full benefits of digitisation—and minimise the pain of transitioning to a digital economy—business leaders, government officials, and individual citizens will have to play distinct roles. Equally important, they will need to work together.
Business leaders must assess what digital means to their company and their industry, set priorities for how their firms will adapt, and talk with suppliers and customers about what the changes mean to them. Government officials need to execute on the Digital India initiative, including investing in digital infrastructure, digitising government operations, creating public data sources, rationalising regulations, and managing the retraining of workers displaced by digital applications. Individuals should prepare for the changing nature of many jobs, possibly including their own; they also need to be careful stewards of their personal data and savvy consumers in rapidly evolving markets.
Businesses will need to think fast and act faster if they are to succeed in India’s digital futureExecutives would be wise to anticipate that digital forces are going to disrupt every aspect of business. As a result, value will shift, and winners and losers will emerge. Winners will be those firms that react quickly and embrace change.
The potential disruptions and benefits may be particularly large in India because of its scale, rapid digitisation, and relatively low current productivity in many sectors. Seizing the benefits of the changes to come will depend to a large extent on how quickly and decisively executives adapt their companies’ existing business models and how thoroughly they digitise their firms’ internal operations.
As executives map out their plans for navigating the coming transformation, they should keep in mind four imperatives: take smart risks in adapting current business models and adopting new, disruptive ones; strategise with digital in front of mind; invest in building the necessary digital capabilities quickly; and require their companies to be agile, digital-first organisations.
Take risks to adapt existing business models and adopt new, disruptive onesReacting quickly to changing dynamics is vital to surviving in disrupted industries, but only 46 percent of Indian firms surveyed reported having a coordinated plan to change their long-term strategy to react to large disruptions.
Disruption by its nature breeds uncertainty, but that is no reason to be timid. Companies in disrupted industries should respond boldly, whether exploring a different business model or investigating new ways to reach existing customers and attract new ones. Digital should be front of mind as executives strategise, and digital should be central to any stratagems they devise.
Customers are becoming more digitally literate and have come to expect the convenience and speed of digital, whether they are shopping online or questioning a billing irregularity, but many companies appear not to fully appreciate that idea. In our survey, 80 percent of firms
Implications for companies, policy makers, and individuals
5.
113Digital India: Technology to transform a connected nation

cite digital as a “top priority”, but only 41 percent say their digital strategy is fully integrated with the company’s overall strategy.
Digital laggards, by their nature, may not lead technological disruption in their industries, but their opportunities to digitise their day-to-day operations are significant: only 39 percent of large firms in our survey say they use a customer relationship management system (software that helps automate the sales process), and only 50 percent have an enterprise resource planning system (software that helps to manage production). A very small share, 14 percent, of companies in our survey said they have incorporated digital fully throughout their organisations; centralised digital organisations are the most effective at driving digital themes.
Invest in building necessary digital capabilities quicklyCompanies that lag behind competitors will need to invest in building the necessary digital capabilities quickly, starting by hiring the right talent. That is challenging in India, which ranks 81st overall on INSEAD’s 2018 Global Talent Competitiveness Index largely because many of its most talented workers emigrate and rarely return.172 Companies could try to address this problem by partnering with universities to recruit and develop talent, beginning with “digital natives” who are currently in universities or have recently finished their studies. Skills and capabilities of the future that need to be developed in this cohort include nonlinear and lateral thinking to go beyond well-defined processes and methodologies, a strong technology-first bias to solving business problems, and an “open source mentality” that helps students stitch together multiple sources of knowledge to solve problems.
Beyond their recruiting, digital leader companies need to build deeper technology understanding and capabilities at all levels of their organisations. That starts at the top: C-suite executives will need to become increasingly aware of digital’s potential applications and personally champion digital and advanced analytics initiatives across their organisations. Business unit heads will need to develop digital and analytics road maps and manage a portfolio of projects. A cadre of business-digital “translators” will need to learn how to execute digital projects by assembling and managing multifunctional teams, while digital specialists (in-house or outsourced talent) will be needed to deliver these projects.
These capabilities will need to be developed by training existing employees and acquiring or partnering with other organisations that have the necessary talent. Companies seeking to digitise should consider all of these options and choose the most effective option for each context.
Encourage an agile, digital-first organisationDigital organisations also tend to empower individuals and discourage hierarchy. ING Group, a Dutch financial services firm, transformed its organisation by flattening its structure into 350 “squads” in just 13 “tribes” while doing away with incentives and compensation structures tied to the size of projects or teams.
In addition to new tools and a new team, companies seeking to digitise their operations often need a new attitude as well—one that encourages agility and puts digital first. That starts with a “test and learn” mind-set that encourages rapid iteration and has a high tolerance for failure and redeployment. Google, for example, ran more than 150,000 experiments in 2016; in any given year, most experiments fail, but the long tail of those that succeed are extremely valuable.173
For a fully digital vision to take hold, company leadership must lead the charge. Once they commit to digitising the company, leaders should consider all options but quickly prioritise their investment opportunities. Starting with projects that produce quick returns on investment can generate organisational alignment and support for further digitisation.
172 Lanvin, B. and Evans, P. ed. (2018), Global Talent Competitiveness Index 2018, INSEAD, Adecco and Tata Communications.173 ”How search works”, Google.com
114 Digital India: Technology to transform a connected nation

Government has many roles to play in digitising India, starting with digitising itselfIndia’s government has done much to encourage digital progress, from clarifying regulations to improving infrastructure to launching the Digital India initiative, with a goal of doubling the size of the country’s digital economy. However, much work remains to be done for India to capture its full digital potential. Government can help by partnering with the private sector to drive digitisation.
Most directly, national and state governments can foster digital growth in India by continuing to invest in digital infrastructure and the digitisation of government operations. This helps in several ways. First, by providing a market for digital solutions, which generates revenue for providers and encourages startups. Second, by expanding access to high-speed internet connectivity. Third, by giving people more reasons to sign on—for example, to receive a cooking-gas subsidy or register the purchase of property.
Government can help further by creating and administering public data sources that public and private organisations can leverage to improve products and services and even create new ones, by fostering a regulatory environment that supports digital adoption while also protecting citizens’ privacy, and by facilitating the evolution of labour markets in industries disrupted by automation.
Invest more in digital infrastructure and the digitisation of government operationsWorking with private companies, the government has brought broadband internet connectivity to approximately 110,000 gram panchayats and said it plans to extend the fibre-optic service to 150,000 more by March 2019.174 These remaining gram panchayats are the hardest to reach and will pose a particular challenge to Bharat Broadband Network, the state-owned company overseeing the project.
In addition to building out infrastructure, India has prioritised the adoption of digital technology across agencies for communication and processes. The government adopted a National e-Governance Plan in 2016 with the goal of digitising government services and making them available via the internet or cell phone app.
Create and administer public data sources for use by public and private organisations with adequate data privacy frameworksThe government in 2012 inaugurated the Open Government Data Platform India, popularly referred to by its URL, data.gov.in, as a one-stop shop for data sets, documents, services, tools, and applications published by government ministries, departments, and organisations. The site says it contains more than 250,000 resources from 143 government departments. It offers data on everything from the percentage of schools with electricity to the amount of foreign direct investment in agriculture to the length of national highways in each state. Yet India overall has a mixed record of making its data accessible. By one standard, the implementation metric in the World Wide Web Foundation’s Open Data Barometer, India ranks 20th among 30 countries surveyed in data availability. The barometer tracks G20 members as well as countries that have signed the International Open Data Charter, a set of principles and best practices regarding the release of governmental data.175 India has not signed the charter.176
174 “1.10 lakh gram panchayats given optical fibre connectivity: government”, Economic Times, February 9, 2018.175 Open data barometer: Leaders edition, World Wide Web Foundation, September 2018.176 Open Data Charter, opendatacharter.net.
115Digital India: Technology to transform a connected nation

Individual government bodies continue to offer data on their own websites. The Farmers’ Portal, run by the Ministry of Agriculture and Farmers Welfare, has information ranging from the number of fertiliser dealers in the state of Andhra Pradesh to the symptoms of babesiosis in buffaloes. The ministry also sends text messages with weather updates and farming tips and runs mobile apps for everything from calculating crop insurance premiums for a particular farm to looking up real-time crop prices within 50 kilometres.
The government is gathering detailed data on retail sales and other transactions through its Goods and Services Tax Network, a digital system that registers retail sales and calculates value-added taxes owed by shopkeepers and service providers. The network has recorded five billion invoices since the tax took effect in July 2017, but for now the data are unavailable to the public.
Concerns about data protection and privacy are legitimate and must be addressed. The Indian Supreme Court in 2017 ruled that privacy is a fundamental right of every citizen.177 Laws and policies on data privacy will continue to evolve in India, as in the rest of the world (see Box 5, “India’s new right to privacy compels lawmakers to enact a data-protection bill”). Recognising the importance of data protection issues, India’s government constituted an expert committee, whose report and draft Personal Data Protection Bill are open to public consultation. Government also needs to take the lead on cybersecurity. It can make sure that the Computer Emergency Response Team India (CERT-IN) has adequate resources to combat cyberattacks, which rose at a compound annual growth rate of 6 percent from 2014 to 2016, when they exceeded 50,000.178
177 Amit Anand Choudhary and Dhananjay Mahapatra, “Indian Supreme Court recently endorsed privacy as a fundamental right of every citizen”, Times of India, August 25, 2017.
178 Computer Emergency Response Team India (CERT-IN), February 2018; dailyhostnews.com.
Box 5. India’s new right to privacy compels lawmakers to enact a data-protection bill
Digital applications run on data, which has become the new oil in the digital age. Since data is information that often pertains to individuals or groups of individuals, it might impinge on privacy and must be protected. In 2017, India’s Supreme Court endorsed privacy as a fundamental right and ruled that the privacy of personal data and facts is an essential facet of the right to privacy. This has made it obligatory for India’s policy makers to enact clear regulations for data privacy, establishing who owns data, who can use it and under what conditions, and avenues for recourse in case of violation, among other issues.
Countries around the world have developed comprehensive regulatory frameworks to protect individuals’ rights with respect to processing of their information. In India, the government set up a committee of experts under the chairmanship of Justice B. N. Srikrishna in July 2017 to examine various issues related to data protection in India, recommend methods to address them, and suggest a draft data protection bill. The draft bill seeks to protect the autonomy of individuals with respect to their personal data, specify norms of data processing by entities using personal data, and set up a regulatory body to oversee data processing activities. The bill is due for discussion in the Indian Parliament.
116 Digital India: Technology to transform a connected nation

One way for India to improve access to its data would be to think about how someone new to the portal would try to find and use it, and to make the data available in these intuitive ways—subject to adequate data privacy and protection standards. Common rules and standards applicable to all of the approximately 8,000 data sets published on the portal could also help would-be data users. Where universal data standards are needed but don’t exist for nongovernment data, the Ministry for Electronics and Information Technology could propose standards of its own, for example with electronic health records. The central government also could improve access to government data by working with state and local governments to make more of their data are available publicly, and to make sure their data aligns with formats and standards already in use.
Foster a regulatory environment that is supportive of digital technology adoptionIndia has taken steps to remove regulatory and bureaucratic impediments that were slowing digital, but more work is needed. Removing lingering doubt about the use of digital technologies can foster adoption and innovation. As well as removing legal obstacles, government could provide financial incentives to venture capitalists, private equity firms, and other companies willing to invest in technologies that enhance the public good.
The environment for startups in India continues to be challenging. While venture capital and private equity investments are growing—PE investments topped $33 billion for the first time in 2018—India still receives far less than its share of investment at about 2.6 percent of global PE volume (compared to 3.25 percent of global GDP and 17.7 percent of global population).179 In some areas ripe for technological disruption, regulatory uncertainty is hampering progress. Government programs seeking to enable a vibrant startup ecosystem, such as Startup India, are promising, but more will need to be done.
Facilitate the healthy evolution of labour markets disrupted by digital technologiesAutomation may compel tens of millions of Indian workers to seek new jobs and new skills. This amounts to a considerable challenge for the government. It should anticipate the complex transitions ahead and prepare to address them, perhaps by identifying workers in at-risk industries and setting up programs to retrain them before they lose all or part of their jobs to automation.
Retraining programs will need to be well designed and closely monitored to confirm that workers achieve their goals. MGI research into the education-to-employment skill-training approach of the 1990s found that programs investigated adequately trained fewer than one-third of their participants on average.180
Whichever approach India adopts, it would benefit from including incentives for workers to engage in lifelong learning—that is, to continually learn new skills as new technologies appear.
Government also can encourage the development of platforms that are capable of efficiently matching job openings with available workers and that make it easier for women to enter or reenter the labour force. It also could consider incentives or some form of assistance to help workers move to where jobs are.
Finally, government could embrace the gig economy as a temporary or permanent solution to automation-related job loss. The gig economy encompasses drivers for car services such as Uber and Ola, delivery people for meal-delivery services such as Swiggy and Zomato, and digital marketers, website designers, and other freelance workers available through platforms such as Freelancer.
179 Venture Intelligence; Quartz.com, 2017; The rise and rise of private markets, McKinsey & Company, February 2018, McKinsey.com; World Bank, 2017
180 Education to employment: Designing a system that works, McKinsey Center for Government, January 2013.
117Digital India: Technology to transform a connected nation

Individuals need to gear up for digitisation, with its potential gains and painsMore Indians than ever are connected to the internet: 560 million, according to the Telecom Regulatory Authority of India. And many more are likely to come online, because India’s internet penetration rate is still relatively low: 20 percent in rural areas, and 65 percent in cities at the end of 2017, the latest year for which the Internet and Mobile Association of India has published data.
At the same time, new digital technologies are slowly permeating places where people work, shop, relax, and interact with government. They have already delivered benefits in some of these spheres, such as e-commerce, price comparison tools, and ride sharing, among other services. Digital may soon offer additional benefits, including improved access to healthcare and credit. Such a rapid transition would have many implications, both for individuals and broader Indian society. Digital literacy—the ability to use computers, smartphones, or other digital technologies to locate, create, and communicate information—may decide who shares in the consumer surplus generated by new technologies.
While we expect digitisation will benefit most Indians as consumers, each individual should be cognisant of the fact that digital is disruptive. As workers in an environment impacted by digital technologies, individuals should understand how their work will change and look for opportunities to capture the benefits of a new digital-led economy and workplace. As consumers of digital services, individuals can pay close attention to how they use and produce data, and they can be active proprietors of their personal information.
Anticipate workplace disruption and prepare for changeDigital transformations of the workplace make it imperative for people to better understand what is coming so they can position themselves to capture the maximum benefits. Preparation can start with individuals anticipating how digital could disrupt their workplace and change the nature of their job—or render it obsolete. This process can begin by being aware of industry innovations and disruptive technologies and learning how they might affect competing firms and the people who work for them. Preparing for change involves becoming comfortable with basic digital tools such as mobile phones and the internet, acquiring additional skills in the worker’s current industry, or training for a new line of work.
Workers can also get ahead by building an online presence: as employers increasingly post and fill jobs online, it is essential for job hunters to create personal profiles on one or more platform, such as Obasanjo’s, Babajob, NanoJobs, and TimesJobs. Thousands of Indians are using digital technologies to become their own boss. Many of them use WorknHire and other portals to find freelance work in such fields as data entry and graphic design. This is an option for a significant number of people—India accounts for 21.5 percent of workers signed up for online outsourcing sites, second only to the United States. When they are engaged full time, these online outsourcing workers frequently earn as much as or more than Indians in conventional employment.181
Meanwhile, India also has produced a digital-job subculture of freelance software engineers who create apps for smartphones. Apple CEO Tim Cook says software developers based in India have produced almost 100,000 apps for his company’s App Store.182 India’s total app output is probably much higher, because only about one-fifth of the country’s 50,000 mobile software developers make apps for Apple’s iOS operating system. Most Indian developers are focused on Android, the operating system used by Google and other handset makers.183
181 Siou Chew Kuek et al., The global opportunity in online outsourcing, World Bank and Dalberg Global Development Advisors, June 2015.
182 Stephen Nellis, “Apple CEO touts India impact in push for deeper market access”, Reuters, June 27, 2017, reuters.com.183 Alberto Furlan, “Top app developers India (2017)”, Business of Apps website, November 28, 2018, businessofapps.com.
118 Digital India: Technology to transform a connected nation

Social media platforms effectively serve as virtual shopping malls for small businesses of all kinds. Facebook, the industry leader in India, has estimated that about 50 million small- and medium-size enterprises from around the world are present on its platform; that is twice as many as in 2013.184 Many of these businesses use social media to advertise or build relationships with customers, but others, including Indian firms such as Delhi Shopping Bazaar, Indian Handicrafts & Gifts Shopping, and Shoppers’ Darbar, are operating virtual retail shops on Facebook business pages.
Be a prudent steward of personal data and a sceptical consumer of informationUsing the internet to regularly engage with people in other countries and follow world events can help individuals gain insight into the global datasphere and how personal data can be used and misused. Engaging in this way also demonstrates the need to be sceptical and think critically in a world of abundant information that is not always correct.
Being active on the internet also can teach individuals the high value placed on even small pieces of personal information, such as their browsing history at an online store, and it can illustrate the importance of reading consent forms, monitoring data collection, and identifying online scammers.
The abundance of malware, fraudsters, and other dangers on the internet reinforces the need to balance engagement with security. Capturing the maximum benefits of the new data-driven world requires striking a balance between avoiding the digital world altogether and giving out your information without discretion. Both behaviours pose risks, but for different reasons.
India’s digital transformation is under way and accelerating. The growth prospects that this brings to the economy are potentially very substantial. To realise that potential will require an embrace of digital and fleetness of foot among companies, especially those lagging behind their peers. Even digital leaders have room to grow. India’s government is trying to open a clear development path with its Digital India initiative, which, among many other things, is actively promoting the spread of digital infrastructure and the harnessing of data and working to make broadband connectivity available in the poorest states and most remote gram panchayats. Individual Indians have already signalled their embrace of all things digital, as shown by the rapid growth in data consumption over the past few years. Digital India is already a reality, but an unfinished one. New efforts, new investment, and new imaginative feats will be needed for the country to move to the next level of digital adoption and secure a dynamic, technology-driven, and prosperous future.
184 Digital globalization: The new era of global flows, McKinsey Global Institute, March 2016.
100,000The amount of apps produced by software developers based in India for the App Store, says Apple CEO Tim Cook
119Digital India: Technology to transform a connected nation

120 Digital India: Technology to transform a connected nation

Technical appendix1. MGI’s country digital adoption indexDigitisation is the use of digital applications by individuals, businesses, and governments. To measure India’s adoption in an international context, we created MGI’s Country Digital Adoption Index.185 This composite index provides a synthesised view of the level and pace of digitisation by country.186
The index is based on the following three conceptual pillars:
— Digital foundation: This includes, for example, spectrum availability, internet download speed, internet affordability, and e-government platforms and services offered.
— Digital reach: This includes metrics such as the size of the mobile and internet user bases, availability of local-content websites, and data consumption per user.
— Digital value: This includes the utilisation levels of use cases across e-government services, digital media, e-commerce, and digital payments.
The Country Digital Adoption Index assesses 17 countries using 30 metrics related to these three pillars of the digital economy. Each country is assessed on each metric on a scale of 0 to 100, where 100 represents the highest theoretical value assigned to the best-performing country on each of the 30 metrics. Exhibit A1 lists the metrics. We rely on data from globally harmonised data sets for all metric values, even if more recent country-specific data are available.
The 17 countries in our data set are Australia, Brazil, Canada, China, France, Germany, India, Indonesia, Italy, Japan, Russia, Singapore, South Africa, South Korea, Sweden, the United Kingdom, and the United States. The countries were selected based on the scale of their economies, their representation across the spectrum of digital adoption, and the extent of harmonised data available for each country to enable meaningful comparisons. We did not include countries like Nigeria and Bangladesh, for example, because insufficient data were available for these countries across the 30 metrics that went into the index.
Principal component analysis was done on variables at a theme level, to estimate the importance of the three pillars in explaining the extent of digitisation; the three pillars represented comparable weights—0.37 for digital foundation, 0.33 for digital reach, and 0.30 for digital value. Within each pillar, each variable was accorded equal weight. Variables were normalised by dividing the indicator value by the respective mean plus three times the standard deviation. Normalised values were then aggregated to build the index.
185 The Country Digital Adoption Index should not be confused with a separate and unrelated MGI index measuring digitisation for industries, the MGI Industry Digitization Index. This has been used in previous reports, including Digital America: A tale of the haves and have-mores, December 2015. That index calculates the extent of digitisation through the lens of digital assets, digital usage, and digital labour.
186 Existing indexes of digital adoption, such as the World Economic Forum’s Networked Readiness Index, the ITU’s ICT Development Index, and the United Nations’ E-Government Development Index, capture important aspects of digital adoption but did not provide the end-to-end view of digitisation we sought for this study.
1.MGI’s Country Digital Adoption Index
This appendix describes the methodology for four major new analyses in this report:
2.MGI’s India Firm Digitisation Index
3.Economic value of technology adoption
4.Labour market impact of technology
121Digital India: Technology to transform a connected nation

1 Based on harmonised data set as of May 2018.2 A World Bank ranking of the quality of governments’ online services.3 Government indicator of the World Bank’s Digital Adoption Index.4 A supplement to the UN E-Government Survey that gauges how well governments use digital technology to increase political participation by their citizens.5 Based on survey of internet users aged 16–64 years.
SOURCE: Ovum; Open Signal; Akamai’s state of the internet: Q1 2014 report; Akamai’s state of the internet: Q1 2017 report; International Telecommunication Union; Analysys Mason; UN e-Government Survey; Digital Adoption Index, World Bank; Strategy Analytics; We Are Social; Euromonitor International Consumer Finance and Retailing 2017 Editions; McKinsey & Company; India’s Trillion Dollar Digital Opportunity, Ministry of Electronics and Information Technology, Government of India, February 2019. McKinsey Global Institute analysis
Exhibit 1
India’s position relative to 16 other countries in metrics used to calculate MGI’s Digital Adoption Index
Source: Ovum; Open Signal; Akamai’s state of the internet: Q1 2014 report; Akamai’s state of the internet: Q1 2017 report; International Telecommunication Union; Analysys Mason; UN e-Government Survey; Digital Adoption Index, World Bank; Strategy Analytics; We Are Social; Euromonitor International Consumer Finance and Retailing 2017 Editions; McKinsey & Company; McKinsey Global Institute analysis
1. Based on harmonised data set as of May 2018.2. A World Bank ranking of the quality of governments’ online services.3. Government indicator of the World Bank's Digital Adoption Index.
4. A supplement to the UN E-Government Survey that gauges how well governments use digital technology to increase political participation by their citizens.
5. Based on survey on internet users aged 16–64 years.
Metric1
Normalised value for latest available data point1
Scale of 0–100
Absolute value for latest available data point1
Best-performing country India
Dig
ital f
ound
atio
n
Allocated spectrum below 1 GHz per person per sqkm, 2014 and 2017 58.3 MHz 0.3
Allocated spectrum above 1 GHz per person per sqkm, 2014 and 2017 221.3 MHz 0.9
4G availability, 2015 and 2017 100% 86.3%
Average mobile download speed, 2014 and 2017 26.0 Mbps 4.9
International internet bandwidth per internet user, 2013 and 2016 960 Kbps 16
Average �xed-line download speed, 2014 and 2017 28.6 Mbps 6.5
Number of public Wi-Fi hotspots per 100,000 people, 2014 and 2016 614.4 21.5
Average price per GB of mobile data, 2013 and 2017 0.07% of GNI per capita 0.37%
Average �xed broadband subscription charge, 2014 and 2017 0.1% of GNI per capita 0.45%
Government Online Service Index, 2013–14 to 2016 and 20172 100% 74%
Digital identity program assessment,20163 100% 100%
Dig
ital r
each
Number of smartphones per 100 people,2013 and 2017 95.8 22.2
Number of basic phones per 100 people,2013 and 2017 49.9 34.8
Mobile phone subscriptions per 100 people,2013 and 2016 161.7 87.0
Mobile internet subscriptions (2G, 3G, 4G, or 5G) per 100 people, 2013 and 2017 178.6 80.9
Mobile broadband subscriptions (3G, 4G, or 5G) per 100 people, 2013 and 2017 144.4 38.7
Average mobile data consumption per user per month, 2013 and 2017 8.6 GB 1.0
Fixed broadband subscriptions per 100 people, 2014 and 2016 42.4 1.4
Average �xed-line data consumption per user per month, 2014 and 2017 153.6 GB 18.3
Number of app downloads (Android and iOS), 2014 and 2017 81.7 per smartphone 45.7
Dig
ital v
alue
E-Participation Index, 2014 and 20174 100% 76%
% of users using WhatsApp, Wechat, or other popular instant-messaging app, 2014 and 2017 73% 28%
% of users engaged in social media, 2014 and 2017 85% 19%
Average time spent on social media sites per user per week, 2014 and 2017 25.6 hours 17.0
% of users engaged in online purchases/ e-commerce, 2014 and 20175 78% 26%
E-commerce as a % of total retail, 2015 and 2017 20 5
% of users searching for product information online before purchase, 2014 and 20175 84% 30%
Average data usage for music per user per month, 2013 and 2016 1.3 GB 27.5 MB
Average data usage for video (TV, movie, clips) per user per month, 2013 and 2016 59.2 GB 335.4 MB
Number of cashless consumer transactions per person, 2013 and 2016 802.7 7.6
India Other countries
Exhibit A1India’s position relative to 16 other countries in metrics used to calculate MGI’s Digital Adoption Index.
122 Digital India: Technology to transform a connected nation

2. MGI’s India firm digitisation indexTo understand trends in firm-level digitisation in a granular way, we conducted a 50-question survey on digital practices to a sample of 220 large firms in India (those with revenue of more than 5 billion rupees, or $70 million) and 444 small firms (those with revenue of less than 5 billion rupees). An independent external agency conducted the survey. Respondents were the CTOs, CIOs, or technology heads of the business entities. The survey was sampled to capture firm-level digitisation for all the major industry and service sectors of the economy, including construction, manufacturing, education, healthcare, finance, trade, and transport.
The survey seeks to determine the actual level of digitisation as well as the underlying traits, activities, and mind-sets that drive digitisation at the firm level. We used each firm’s answers to score its level of digitisation and create the India Firm Digitisation Index. It should be noted that the index reflects self-reported scores from companies rather than objective criteria. The survey is organised around the following three conceptual pillars:
— Digital strategy: To assess firms’ strategies, we asked about their responsiveness to competition, how well their digital strategies align with their broader business strategies, and the amount they have invested in digital technology.
— Digital organisation: To gauge organisational support for digital technologies, we not only asked for managers’ views on the subject, we also reviewed the organisation of each firm’s data structure and how strictly the companies monitored key performance indicators for their digital strategy.
— Digital capabilities: To measure a company’s digital capabilities, we gathered information on IT architecture and automation, then inquired about digital marketing, sales channels, and payments, and how data drives tactical or strategic decisions.
The India Firm Digitisation Index assigns equal weight to all three pillars and then assigns equal weight to all relevant questions within each pillar. Respondents were asked to characterise various dimensions of digitisation on a scale of 0 to 4 or 0 to 5, with the scale varying by question. A score of 0 indicated no progress on digitisation, while a score of 4 or 5 (on their respective scales) indicated complete digitisation. Each relevant question was then converted into a standardised scale of 0 to 100 for aggregation. Standardisation is done in such a way that above the median level, every subsequent higher level of digitisation receives a higher weight. This accommodates the fact that it becomes increasingly difficult for firms to digitise at levels higher than the median level of digitisation.
123Digital India: Technology to transform a connected nation
3. Economic value of technology adoptionThis research uses a value-impact approach to calculate the economic value of technology adoption. It focuses on the potential effect of digital adoption on aggregate productivity based on microevidence from sectors and firms. Discrete use cases are identified and their potential impact, in greater output, time, or cost saved, is estimated to come up with a macro picture of potential economic gains. Scenarios were created within which the economic value is likely to fall in 2025.
We sized two archetypes of sectors. The first archetype consists of core digital economy sectors: IT-BPM, digital communication services, and electronics manufacturing.These sectors are formally defined in the system of accounts and tracked regularly in national accounts. For the purposes of our report, we create scenarios forecasting growth by 2025 based on estimates of revenue growth, and estimate their value added.
The second archetype consists of two subtypes: newly digitising sectors—including agriculture, education, energy, financial services, healthcare, logistics, and retail—and government services and labour markets, comprising cross-cutting activities. While the former is more business-led and the latter more government- and individual-driven, the common factor is that the digitisation of both of these subtypes is relatively nascent, with some exceptions, such as government e-services. Digitisation levels are typically not systematically tracked in terms of scale, and the efficiency gains realised through digitisation result in greater output, time savings, or cost savings, parameters that are not captured in national accounts data.
Core digital sectorsThe three core digital sectors are undergoing transitions, and the past may not be a guide for the future. In addition to analysing past growth trends, we conducted extensive stakeholder consultations to develop a perspective on potential growth and develop scenarios. We describe here the approach we used to develop these scenarios.
IT-BPM ($205 billion to $250 billion potential value added in 2025). The revenue and value-added scenarios for IT-BPM were constructed with two fundamental trends in mind: scenarios related to global technology spending and India’s ability to capture a part of that. Global ICT spending grew by 2 percent per year between 2015 and 2017, as opposed to 3.4 percent per year forecast in the NASSCOM-McKinsey 2015 Perspective. As a result, we developed two scenarios, one assuming that technology spending could continue to grow at a moderate rate of 2.5 percent annually to 2025, and the other assuming that it could accelerate pace and grow at a 3.4 percent rate. The second component of our scenario is alternative perspectives on how fast India’s IT industry captures share of global spending. In the moderate scenario, India’s share rises from 5.6 percent in 2017 to 8.3 percent in 2025; in the optimistic scenario, its share in 2025 is 9.7 percent of global ICT spending. Depending on which of these scenarios plays out, India’s IT-BPM sector could grow 7.6 to 10.8 percent per year between 2017 and 2025.
124 Digital India: Technology to transform a connected nation

Electronics manufacturing ($100 billion to $130 billion potential value added in 2025). The demand for electronics in India in 2017–18 stood at $106.1 billion, of which domestic electronics manufacturing fulfilled $59.6 billion (accounting for about 4 percent of all manufacturing sector output). The past few years have been encouraging for the sector, especially in the growth of India’s mobile handset manufacturing, where production jumped from 60 million handsets valued at $2.9 billion in 2014–15 to 225 million units valued at $20.3 billion in 2017–18. We gauged the future demand for electronics in India by analysing per capita spending on electronics as a function of GDP per capita (PPP). Based on the cross-country trend in more than 20 countries, India’s per capita spending on electronic goods is expected to rise by 20 percent to 2025, should it follow the global curve. We also incorporated a moderate rise in manufacturing share of GDP for India, from a low of around 15 percent currently to between 18 and 20 percent. If India is able to take advantage of its increased spending on electronics manufacturing, along with the overall focus on increasing manufacturing share of GDP, electronics manufacturing could rise from its current 4 percent of manufacturing sector GDP to about 8 to 10 percent by 2025, in line with countries such as Germany and Japan.
Digital communication services ($50 billion to $55 billion potential value added in 2025). India’s digital consumption is rising exponentially as data prices fall. Smartphone penetration is also rising rapidly, and the total number of handsets in use is forecasted to exceed 800 million by 2025. Smartphone owners in India currently consume 8.3 GB of data each month on average, well above the 5.5 GB for the average Chinese mobile user and comparable to South Koreans’ consumption, which is in the range of 8.0 to 8.5 GB a month. Between 2015 and 2025, we anticipate overall data consumption may rise by more than 60 times, which is equivalent to data consumption doubling every 18 months. Our estimates incorporate reasonable data-price assumptions to account for the sector’s long-term financial sustainability.
Other sectorsFor newly digitising sectors, and government services and jobs and skills markets, we considered a set of use cases in each sector. For each use case, we estimated a range of future adoption rates based on criteria described below, and we estimated value creation potential based on microlevel examples of on-the-ground implementation of the use case. The product of the adoption rate and the micro-level value creation potential yields the aggregate economic value potential from the use cases within each sector.
For potential adoption rates, we categorised all digital applications into three segments, bounded by the slow- and fast-paced adoption curves estimated by MGI after analysing the adoption trends of more than 50 technologies globally. The three ranges of adoption rates for 2025 were 20 to 40 percent, 40 to 60 percent, and 60 to 80 percent. Adoption rates are assigned to each digital application depending upon the assessment of business readiness, which depends on elements including the inherent digital maturity of the sector, the presence of reasonably scaled use cases of digital applications, and public-sector relevance and support, which reflects government’s action and intent in regulations and policies.
For microlevel value creation potential, we conducted a detailed effort to understand pilots and case studies where the use case was actually implemented, to obtain a range of possible effects from each digital application. Since use cases show significant variation in the impact of digital adoption, we used benchmarks that were moderate, as opposed to those with the highest impact.
125Digital India: Technology to transform a connected nation

4. Labour market impact of technologyEstimating how digitisation may affect the labour market is difficult because there are many interdependencies, including how the value created through digital adoption is appropriated by different stakeholders, how they choose to consume (and save), and finally which skills are required to produce the goods and services demanded.
Our estimate of the impact of digital adoption on jobs is not an attempt to predict where jobs will be lost, where they will be created, and the specific skills required. Rather, it is an attempt to estimate how many jobs will be impacted, in which sectors, and whether digital will necessarily lead to joblessness. The idea is to link value creation with impact on labour markets through the need to reskill and redeploy labour.
1. Estimating overall employment potential of 60 million to 65 million jobs in 2025All sized digital applications—in core digital sectors, newly digitising sectors, and government services and labour markets—create economic value in our model. Each of these therefore unlocks productivity that can create the deployment of labour in productive work. We mapped each application to the relevant sector of India’s economy. For example, digital applications pertaining to agriculture were mapped to the agriculture sector, the ones pertaining to IT-BPM to the IT and communication sector, and so on. For each sized application, we divided the total economic value creation we estimated for 2025 by the average projected sector productivity in 2025, to estimate how many jobs could be created in 2025 as a result of the value creation.
To estimate average sector productivity in 2025, we used an overall GDP estimate for India of $4.4 trillion in 2025, assuming a 9 percent increase in nominal GDP between 2017 and 2025. This is consistent with 7 percent annual growth in constant prices, a 5 percent inflation rate, and a 3 percent currency depreciation of the rupee to the dollar. This overall GDP was split into sectors such as agriculture, manufacturing, trade, transport, and so on using reasonable assumptions. For instance, we assumed agriculture would account for 12 percent of India’s economy in 2025, and manufacturing and trade (including hotels and restaurants) for 17 percent each. Assuming constant participation rates, India’s labour force is expected to grow from about 480 million in 2017 to 545 million by 2025. We assume the pattern of distribution of the labour force across sectors based on the historical sectoral growth of employment between 2011 and 2015, along with some moderation in growth to ensure that the sectoral share of employment remains reasonable.
2. Estimating the potential impact of redeploying and reskilling 40 million to 45 million workers in 2025We note that some digital applications—for example, the core digital economy sectors (IT-BPM, digital communication services, and electronics manufacturing), online talent marketplaces, and precision agriculture—give rise to higher output through new investment, better know-how, or better and faster matching of labour demand and supply. The higher output implies net new employment.
Other digital applications have the effect of freeing up workers and redeploying them to other types of work. Two types of digital applications have this effect: applications relating to overall business digitisation or automation, and applications like digital payments that create economic value through efficiency gains such as cost and time savings. In both categories, we estimate the overall number of workers who would need reskilling and redeployment by 2025 is between 40 million and 45 million.
126 Digital India: Technology to transform a connected nation

For business digitisation and automation, we assumed a midpoint automation adoption scenario, based on modelled estimates for India from MGI’s past research. Under this scenario, we estimate that about 5 percent of current work would be displaced by 2025 as a result of digitisation. Most of the work in a few types of jobs would be displaced, but for most occupations, only a fraction of the current work performed would be digitised by 2025. Assuming the share of jobs displaced is equivalent to the share of full-time-equivalent workers displaced, we conclude that about 20 million workers would require reskilling to be absorbed in new types of work as a result of business digitisation.
For other digital applications that have a similar efficiency effects, we calculated the labour redeployment potential by dividing the economic value potential of each application by the average labour productivity of the closest sector. For example, for the economic value potential estimated from digital payments, we used the financial sector’s average labour productivity to estimate the number of workers potentially displaced who would need reskilling and redeployment. Across all applications, another 20 million to 25 million workers would be redeployed in 2025.
127Digital India: Technology to transform a connected nation

128 Digital India: Technology to transform a connected nation

BibliographyAAbraham, Ronald, et al., State of Aadhaar report 2016–17, IDinsight, May 2017.
Abraham, Ronald, et al., State of Aadhaar report 2017–18, IDinsight, May 2018.
Ahmad, Nadim, and Paul Schreyer, “Are GDP and productivity measures up to the challenges of the digital economy?”, International Productivity Monitor, spring 2016, Number 30.
Akamai Technologies, Akamai’s state of the internet: Q1 2014 report, May 2014.
Akamai Technologies, Akamai’s state of the internet: Q1 2017 report, March 2017.
Automotive Research Association of India, Intelligent transportation systems (ITS): Requirements for public transport vehicle operation, 2017.
CCapgemini, LinkedIn, and Efma, World fintech report 2017, November 2016.
Central Intelligence Agency, The World Factbook, 2017.
Centre for the Study of Developing Societies, State of Indian farmers: A report, March 2018.
Chand, Ramesh, Doubling farmers’ income: Rationale, strategy, prospects and action plan, National Institution for Transforming India policy paper number 1/2017, March 2017.
Common Services Centres Scheme, National monthly progress report, April 2018.
DDemirgüç-Kunt, Asli, et al., The Global Findex Database 2017: Measuring financial inclusion and the fintech revolution, World Bank, April 2018.
EEconomist Intelligence Unit, Global Outlook, January 2019.
ENVIS Centre on Population and Environment, Demographic and health status indicators 1951–2011.
FFreedman, Lauren, Consistent personalization everywhere consumers shop: 7th annual consumer personalization survey, MyBuys.com, 2015.
Furlan, Alberto, Top app developers India (2017), Business of Apps, November 28, 2018, businessofapps.com.
HHannak, Aniko, et al., “Measuring price discrimination and steering on e-commerce web sites”, Proceedings of the 2014 Conference on Internet Measurement Conference, Association for Computing Machinery, 2014.
IIndia Brand Equity Foundation, Retail industry in India, October 2018.
International Fertilizer Development Centre, “Fertilizer deep placement”, IFDC Report, June 2013, Volume 38 Number 2.
International Fertilizer Development Centre, Rapid introduction and market development for urea deep placement technology for lowland transplanted rice, 2017.
Internet and Mobile Association of India and Kantar IMRB, Internet in India 2017, February 2018, cited in Surabhi Agarwal, “Internet users in India expected to reach 500 million by June: IAMAI”, Economic Times, February 20, 2018.
JJianhua, Li, Sharing economy for SDGs, Development Dimensions of the Sharing Economy: Learnings from China, UNCTAD, Geneva, Switzerland, April 16, 2018.
129Digital India: Technology to transform a connected nation

K Kapoor, Amit, Chirag Yadav, and Neera Vohra, Impact of Reliance’s entry: A socio-economic analysis of Jio-fication and India’s GDP story, Institute for Competitiveness, March 2018.
Kemp, Simon, Digital in 2018 in Southern Asia, We Are Social, January 2018.
KPMG and Organisation of Pharmaceutical Producers of India, Report on healthcare access initiatives, August 2016.
KPMG in India and Google, India’s languages—defining India’s internet, April 2017.
Kuek, Siou Chew, et al., The global opportunity in online outsourcing, World Bank and Dalberg Global Development Advisors, June 2015.
Kumar, Anjani, et al., Institutional versus noninstitutional credit to agricultural households in India: Evidence on impact from a national farmers’ survey, International Food Policy Research Institute discussion paper number 01614, March 2017, indiaenvironmentportal.org.in.
LLanvin, Bruno, and Paul Evans, eds., The Global talent competitiveness index: Diversity for competitiveness, INSEAD, the Adecco Group, and Tata Communications, December 2017.
Leclerc, Olivier, and Jeff Smith, “How new biomolecular platforms and digital technologies are changing R&D”, July 2018, McKinsey.com.
MMcKinsey & Company, The rise and rise of private markets, February 2018.
McKinsey Center for Government, Education to employment: Designing a system that works, January 2013.
McKinsey Global Institute, Digital America: A tale of the haves and have-mores, December 2015.
McKinsey Global Institute, Digital globalization: The new era of global flows, March 2016.
McKinsey Global Institute, A future that works: Automation, employment, and productivity, January 2017.
McKinsey Global Institute, India’s labour market: A new approach to gainful employment, July 2017.
McKinsey Global Institute, India’s technology opportunity: Transforming work, empowering people, December 2014.
McKinsey Global Institute, Jobs lost, jobs gained: Workforce transitions in a time of automation, December 2017.
McKinsey Global Institute, Skill shift: Automation and the future of the workforce, May 2018.
Ministry of Agriculture and Farmers Welfare, Government of India, Agricultural statistics at a glance 2016, March 2, 2017, eands.dacnet.nic.in.
Ministry of Agriculture and Farmers Welfare, Government of India, State of Indian agriculture 2015–16.
Ministry of Electronics and Information Technology, Government of India, Fact sheet of IT & BPM industry.
Ministry of Electronics and Information Technology, Government of India, India’s Trillion Dollar Digital Opportunity, February 2019.
Ministry of Finance, Government of India, “Industry and infrastructure”, in Economic Survey 2017–18, January 2018.
Ministry of Labour and Employment, Government of India, Report on Fifth Annual Employment-Unemployment Survey (2015–16), September 2016.
Ministry of Micro, Small & Medium Enterprises, Government of India, Annual report 2017–18.
Ministry of Statistics and Programme Implementation, Government of India, Accounts statistics (2016–17).
Ministry of Statistics and Programme Implementation, Government of India, National accounts statistics: Back series 2004–05 to 2011–12, 2017–18, November 28, 2018.
Ministry of Statistics and Programme Implementation, Government of India, Statistical year book India 2014.
Ministry of Statistics and Programme Implementation, Government of India, Statistical year book India 2016.
Ministry of Statistics and Programme Implementation, Government of India, Statistical year book India 2018.
Ministry of Statistics and Programme Implementation, National Sample Survey Office, Government of India, Household indebtedness in India, 70th round, 2012–13.
Mondal, Pinaki, and Manisha Basu, “Adoption of precision agriculture technologies in India and in some developing countries: Scope, present status and strategies”, Progress in Natural Science: Materials International, June 2009, Volume 19, Issue 6.
Monika et al., “Precision farming: A pathway to attract youth in agriculture”, Popular Kheti, July–September 2014, Volume 2, Issue 3.
Montenegro, Claudio E., and Harry Anthony Patrinos, Comparable estimates of returns to schooling around the world, policy research working paper WPS7020, World Bank Group, September 2014.
130 Digital India: Technology to transform a connected nation

Muralidharan, Karthik, et al., Is there a doctor in the house? Medical worker absence in India, Department of Economics working paper, Harvard University, April 12, 2011.
NNASSCOM, “Skilling for digital relevance”, July 20, 2017, nasscom.in.
National Bank for Agriculture and Rural Development, Farmer producer organisations: Frequently asked questions, 2015.
National University of Educational Planning and Administration, School education in India 2015–16: Flash statistics, Universal District Information System, October 2016.
OOffice of the Registrar General & Census Commissioner, Government of India, Census 2011.
Organisation for Economic Co-operation and Development, Measuring the internet economy: A contribution to the research agenda, OECD Digital Economy Paper number 226, July 12, 2013.
Organisation of Pharmaceutical Producers of India, Healthcare in India: New milestones, new frontiers, December 2016.
PPandey, Anamika, et al., “Trends in catastrophic health expenditure in India: 1993 to 2014”, Bulletin of the World Health Organization, January 1, 2018, Volume 96, Number 1.
Perspective 2025: Shaping the digital revolution, National Association of Software and Services Companies, 2015.
Pullamvilavil, Nibu, India needs to make crop insurance work for its farmers, The Wire, April 22, 2018, thewire.in/agriculture/india-needs-to-make-crop-insurance-work- for-its-farmers
PwC and Startupbootcamp, Fintech trends report: India 2017, 2017.
SSmith, Mark, et al., eds., Best care at lower cost: The path to continuously learning health care in America, Institute of Medicine of the National Academies, Washington, DC: The National Academies Press, 2013.
Sood, Jyotika, India’s deepening farm crisis: 76% farmers want to give up farming, shows study, DownToEarth, March 12, 2018, downtoearth.org.in/news/indias- deepening-farm-crisis-76-farmers-want-to-give-up-farming-shows-study-43728.
State Bank of India, SBI annual report 2014–15: Bankers
to digital India, 2015.
State Bank of India, SBI annual report 2017–18:
Building momentum for a transforming India, 2018.
Stensland, Jeffrey, et al., “The relative cost of outpatient telemedicine services”, Telemedicine Journal, September 1999, Volume 5, Number 3.
Syverson, Chad, “Challenges to mismeasurement explanations for the US productivity slowdown”, The Journal of Economic Perspectives, American Economic Association, spring 2017, Volume 31, Number 2.
TTelecom Regulatory Authority of India, Indian telecom services performance indicator report, April-September 2018.
The Keyword, “The best of Android and Google with Android Oreo (Go edition) and Android One”, Google blog entry by Hiroshi Lockheimer, February 22, 2018, blog.google.com.
WWe Are Social, Digital in 2018: Global overview, January 2018.
We Are Social, Digital in 2018: Southern Asia, January 2018.
We Are Social, Digital in 2018: Southern Asia, Eastern Asia, Northern America, January 2018.
Wilson, Christo, “Buyer beware, online shopping prices vary user to user”, The Conversation, November 3, 2014, theconversation.com/buyer-beware-online-shopping-prices-vary-user-to-user-33439
World Bank, Logistics Performance Index, Country Score Card: India 2018.
World Bank, World Bank support to the health sector in India, April 6, 2010.
World Bank, World Development Report 2016: Digital dividends, 2016.
World Economic Forum, Digital transformation initiative: Unlocking $100 trillion for business and society from digital transformation, January 2017.
World Health Organization, Global health workforce statistics, 2016.
World Health Organization, World health statistics 2018.
World Wide Web Foundation, Open data barometer: Leaders edition, September 2018.
YYoung, Aaron, et al., “A census of actively licensed physicians in the United States, 2016”, Journal of Medical Regulation, June 2017, Volume 103, Number 2.
131Digital India: Technology to transform a connected nation


Related MGI and McKinsey research
Outperformers: High-growth emerging economies and the companies that propel them (September 2018) Some emerging economies have grown much faster and more consistently than others. Underlying these success stories is a pro-growth policy agenda and the standout role of large companies.
Digital China: Powering the economy to global competitiveness (December 2017)China is already a global leader in the digital economy. It is a major investor in and one of the leading adopters of digital technologies in the consumer sector. Chinese consumers are enthusiastic about e-commerce and mobile payments. But more is to come.
Digital America: A tale of the haves and have-mores (December 2015)While the most advanced sectors, companies, and individuals continually push the boundaries of technology use, the US economy overall is realizing only 18 percent of what we calculate to be its full digital potential.
www.mckinsey.com/mgiE-book versions of selected MGI reports are available at MGI’s website, Amazon’s Kindle bookstore, and Apple’s iBooks Store.Download and listen to MGI podcasts on iTunes or atwww.mckinsey.com/mgi/publications/multimedia/Cover image: Getty Images
India’s labour market: A new emphasis on gainful employment (June 2017)India’s labour markets are experiencing structural change, but attention tends to focus narrowly on creating jobs for its workforce of 460 million. We see the need to emphasize improved quality of work and the income derived from it.
The new dynamics of financial globalization (August 2017) Since the global financial crisis began, cross-border capital flows have fallen by 65 percent in absolute terms. But financial globalization is still very much alive—and could prove to be more stable and inclusive in the future.
Jobs lost, jobs gained: Workforce transitions in a time of automation (December 2017) Automation and AI technologies will create new prosperity and millions of jobs, but as many as 375 million people will need to shift occupational categories and upgrade skills during the transition.
SEPTEMBER 2018
OUTPERFORMERS: HIGH-GROWTH EMERGING ECONOMIES AND THE COMPANIES THAT PROPEL THEM
Jonathan Woetzel
Anu Madgavkar
Shishir Gupta
DISCUSSION PAPERJUNE 2017
INDIA’S LABOUR MARKET A NEW EMPHASIS ON GAINFUL EMPLOYMENT
DECEMBER 2017
DIGITAL CHINA: POWERING THE ECONOMY TO GLOBAL COMPETITIVENESS AUGUST 2017
THE NEW DYNAMICS OF FINANCIAL GLOBALIZATION
HIGHLIGHTS
The MGI Industry Digitization Index
The productivity opportunity
Reinventing organizations
675931
DECEMBER 2015
DIGITAL AMERICA: A TALE OF THE HAVES AND HAVE-MORES
DECEMBER 2017
JOBS LOST, JOBS GAINED: WORKFORCE TRANSITIONS IN A TIME OF AUTOMATION

McKinsey Global InstituteMarch 2019Copyright © McKinsey & CompanyDesigned by OPX
www.mckinsey.com/mgi
@McKinsey_MGI @McKinseyGlobalInstitute
Digital India