energy to transform lives
324
ENERGY TO TRANSFORM LIVES INTEGRATED ANNUAL REPORT 2018 ENERGY TO TRANSFORM LIVES
-
Upload
khangminh22 -
Category
Documents
-
view
4 -
download
0
Transcript of energy to transform lives

ENERGY TO TRANSFORM LIVES
INTEGRATED ANNUAL REPORT2018
ENERGY TO TRANSFORM LIVES

Energy is powerful. Not only does it spark one’s desire for innovation and growth, it also spurs one’s passion for excellence and success. Having proudly kept the nation progressing for the past seven decades, we shall continue to do so for the next seven decades and beyond.
Happy 70th Anniversary

I N S I D E T H I S R E P O R T
2 Our Domestic Businesses
3 Our International Footprint
4 Our Vision, Our Mission and About Us
5 Notice of the 29th Annual General Meeting
8 Statement Accompanying Notice of the 29th Annual General Meeting
9 Administrative Notes of the 29th Annual General Meeting
About TNB
12 Our Reporting Journey
13 Key Highlights
14 Key Financial Highlights
15 Six-Year/Period Group Financial Summary
16 Six-Year/Period Group Growth Summary
FROM OUR LEADERS
17 Chairman’s Letter to Shareholders
21 2018 Year in Review• Group Business Model• Our Strategy
- Future Generation Sources- Grid of the Future- Winning the Customer- Future Proof Regulations
• Our Capitals- Financial Capital- Manufactured Capital- Natural Capital- Intellectual Capital- Human Capital- Social and Relationship Capital
44 Our Scorecard
45 Financial Calendar
46 Investor Relations
49 Net Book Value of Land & Buildings
Our Business
52 Corporate Information
53 Organisational Structure
54 Group Corporate Structure
56 Direct Value Added to Malaysia
57 Awards & Recognition
Business Context
62 Simplified Group Statement of Financial Position
64 Core Revenue Financial Year Ended 31 December 2018
Performance Review
Sustainability Statement
66 About This Statement
67 Managing Sustainability
68 Sustainability Governance
68 Supporting The United Nations Sustainable Development Goals (UN SDGs)
70 Engaging Stakeholders
71 What Matters to Us
72 Spirit of Sustainability • Our Governing Principles
74 Delivering With Purpose • The Future of Energy • Customer Centricity
81 Environmental Stewardship • Minimising Environmental Impact • Climate Change
84 Embracing Relationship • Unlocking People Value • Generative Safety Culture • Brightening Surrounding Communities • Transforming Lives Through Education
The Strength of Our Governance
98 Chairman’s Introduction
100 A Committed Board
111 An Effective Leadership
118 Leadership & Effectiveness • Nomination and Remuneration Committee Report
132 Accountability • Audit Committee Report • Risk Committee Report • Internal Audit Function
141 Relations with Shareholders
144 Statement of Risk Management and Internal Control
148 Directors’ Report
153 Consolidated Statement of Profit or Loss
154 Consolidated Statement of Comprehensive Income
155 Consolidated Statement of Financial Position
157 Consolidated Statement of Changes in Equity
160 Consolidated Statement of Cash Flows
163 Notes to the Financial Statements
308 Statement by Directors
308 Statutory Declaration
309 Independent Auditors’ Report
Financial Statements
316 Statistics of Shareholdings
Proxy Form
Additional Information

p.2
About TNB
Our Business
Business Context
Performance Review
Sustainability Statement
Governance
Financial Statements
Additional Information
OUR DOMESTICBUSINESSES
As the key component of our electricity production, the Generation Division is entrusted to operate and maintain TNB’s portfolio of power generating assets, comprising of thermal generation facilities and major hydro-generation schemes in Peninsular Malaysia. In addition, the Division also supports the operations and maintenance of six (6) Independent Power Producers (IPPs).
GENERATION
The Grid Division links the power produced by our Company and IPPs throughout Peninsular Malaysia with the Distribution Division’s network. Electricity is also transmitted directly to large industrial customers via the National Grid.
GRID
18,338 MWMaximum Demand on 15 August 2018
23,082 KMLength of Domestic Transmission Network
443Domestic Transmission Substations
0.35 MINUTESwhich has been consistently below the 2-minute mark since FY2009
SYSTEM MINUTES
ZERO LOAD LOSSfor the 500kV system since FY2008
SYSTEM RESILIENCE
99.79%
SYSTEM AVAILABILITY
AVAILABILITY
Equivalent Availability Factor (EAF)
88.93%
For wholly-owned power plants in Peninsular Malaysia
RELIABILITY
Equivalent Unplanned Outage Factor (EUOF)
3.84%
For wholly-owned power plants in Peninsular Malaysia
CAPACITY
10,917.53 MWFor wholly-owned power plants in Peninsular Malaysia
Total Domestic Generating Capacity
118,814.46 GWhUnits Sold in 2018 (Sales in Peninsular Malaysia, Sabah and Labuan)
The Retail Division strives to win our customers by building long-term and meaningful relationship through continuous ongoing customer centric approaches.
RETAIL
9.65 millionCustomers in Peninsular Malaysia, Sabah and Labuan
AVAILABILITY
The Distribution Network Division is responsible for the asset lifecycle of the Nation’s distribution electricity supply system to the end-users, ensuring an uninterruptible supply of power to businesses and homes.
DISTRIBUTION
NETWORK
48.22 min/cust/yr2017: 50.24 min/cust/yr
SAIDI
660,038 KMCircuit Kilometres of wholly-owned distribution network in Peninsular Malaysia
LENGTH OF DOMESTIC DISTRIBUTION NETWORK

Integrated Annual Report 2018
Tenaga Nasional Berhad
p.3
About TNB
Our Business
Business Context
Performance Review
Sustainability Statement
Governance
Financial Statements
Additional Information
OUR INTERNATIONAL FOOTPRINT
- 50% equity ownership in a UK Solar Portfolio via Vortex Solar Investments S.à.r.l with 365MWp total installed capacity
- 80% equity ownership in a UK Wind Portfolio via Tenaga Wind Ventures UK Ltd with 26.1MW total installed capacity
UNITED KINGDOM
- 6% equity ownership in the
Shuaibah Independent Water
& Power Project (IWPP) with
900MW installed capacity
of conventional plant and
1,030,000m3/day water
desalination assets
- REMACO O&M Services for
Shuaibah IWPP
SAUDI ARABIA
- 30% equity ownership in GMR Energy Ltd with 2,299MW installed capacity of coal, gas and solar assets
- 50% equity ownership in JV company between REMACO and GMR Energy Ltd for plant O&M services
INDIA
- Liberty Power Ltd 235MW
- REMACO O&M Services - Balloki Power Plant
PAKISTAN
- Development of the Sumatra - Peninsular Malaysia High Voltage Direct Current Interconnection
INDONESIA
- 30% equity ownership in GAMA Enerji A.Ș. with 1,102MW installed capacity of gas, wind, hydro and 274,000m3/day water conveyance assets in Jordan
TURKEY
- REMACO O&M for the 225MW Sabiya Power Generation & Water Distillation Plant
- REMACO O&M for the Shuaiba North Co-Gen 780MW Power; 204,000 m3/day water
- REMACO O&M for the 210MW Doha West Power Generation & Water Distillation Plant
- Maintenance Service Agreement (MSA) for Instrumentation and Control for the Doha West Plant and Shuwaikh Plant
- MSA for Mechanical Works for the Doha West Plant and Shuaiba Plant
KUWAIT

p.4
About TNB
Our Business
Business Context
Performance Review
Sustainability Statement
Governance
Financial Statements
Additional Information
ABOUT USAs the largest utility in Malaysia, Tenaga Nasional Berhad not only provides electricity to the country’s homes, businesses and industries, but is also a key contributor to Nation-building.
We are present throughout the entire electricity production and supply value chain.
We have also embraced the sustainability agenda by entering into the Renewable
Energy space and at the same time undertaking other green and social initiatives
to ensure we deliver value to all our stakeholders. These efforts are underpinned
by our goal of ensuring the longevity of our business and the long-term well-being
of our community.
In all of our endeavours, we are driven by our firm belief that we have a
responsibility to improve the lives of the people of Malaysia. We therefore look
forward to continuing to ensure a better and brighter tomorrow for us all.
We have served our industrial, commercial and residential customers in Malaysia for over 69 years.
WHO WE SERVE
Our industrial customers engage in the manufacture of goods and services.
Although they make up the smallest segment of our customers, they also account
for the majority of our electricity sales.
INDUSTRIAL
Our residential customers represent the majority of Malaysia’s 32.6 million
population. As our largest market, they drive us to deliver excellence in our
products and services.
RESIDENTIAL
Our commercial customers are our second-largest source of electricity sales,
carrying out the business and commercial activities which drive our economy.
COMMERCIAL
We are committed to excellence in our products and services
OUR MISSION
To be among the leading corporations in energy and related businesses globally
OUR VISION

Integrated Annual Report 2018
Tenaga Nasional Berhad
p.5
About TNB
Our Business
Business Context
Performance Review
Sustainability Statement
Governance
Financial Statements
Additional Information
NOTICE IS HEREBY GIVEN THAT the Twenty-Ninth Annual General Meeting (29th AGM) of Tenaga Nasional Berhad (“TNB” or “the Company”) will be held on Tuesday, 14 May 2019 at 10.00 a.m. at mySpace1@Ballroom, Level 3, The Malaysia International Trade & Exhibition Centre (MITEC), Kompleks MITEC, No. 8, Jalan Dutamas 2, 50480 Kuala Lumpur, Malaysia to transact the following businesses:
NOTICE OF THE 29TH ANNUAL GENERAL MEETING
Tuesday, 14 May 2019 at 10.00 a.m.
mySpace1@Ballroom, Level 3, The Malaysia International Trade &
Exhibition Centre (MITEC), Kompleks MITEC, No. 8, Jalan Dutamas 2,
50480 Kuala Lumpur, Malaysia
AGENDA
AS ORDINARY BUSINESS:
1. To receive the Audited Financial Statements for the Financial Year ended 31 December 2018 together with the Reports of the Directors and Auditors thereon.
(Please refer to Note (a) of the Explanatory Notes on Ordinary Businesses)
2. To re-elect the following Directors who retire by rotation in accordance with Clause 64(1) of the Company’s Constitution and being eligible offer themselves for re-election:
(i) Tan Sri Leo Moggie Ordinary Resolution 1 (ii) Juniwati Rahmat Hussin Ordinary Resolution 2
3. To re-elect the following Directors who were appointed to the Board and retire in accordance with Clause 63(2) of the Company’s Constitution and being eligible offer themselves for re-election:
(i) Gopala Krishnan K.Sundaram Ordinary Resolution 3 (ii) Ong Ai Lin Ordinary Resolution 4(iii) Datuk Ahmad Badri bin Mohd Zahir Ordinary Resolution 5(iv) Dato’ Roslina binti Zainal Ordinary Resolution 6(v) Amir Hamzah bin Azizan Ordinary Resolution 7
4. To approve the payment of Non-Executive Directors’ fees of RM2,057,419.35 for the Financial Year ended 31 December 2018.
Ordinary Resolution 8
5. To approve the payment of the following Non-Executive Directors’ fees from 1 January 2019 until the next Annual General Meeting (AGM) of the Company:
(i) Director’s fee of RM30,000.00 per month for the Non-Executive Chairman;
(ii) Director’s fee of RM20,000.00 per month for each Non-Executive Directors.
Ordinary Resolution 9
6. To approve the payment of benefits to the Non-Executive Directors (excluding Non-Executive Directors’ fees) amounting to RM2,258,100.00 from the 29th AGM until the next AGM of the Company.
Ordinary Resolution 10
7. To re-appoint Messrs PricewaterhouseCoopers PLT, having consented to act, as Auditors of the Company, to hold office until the conclusion of the next AGM and to authorise the Directors to fix their remuneration. Ordinary Resolution 11
8. To transact any other business of which due notice shall have been given in accordance with the Companies Act 2016 (Act).

p.6
About TNB
Our Business
Business Context
Performance Review
Sustainability Statement
Governance
Financial Statements
Additional Information
FURTHER NOTICE IS HEREBY GIVEN THAT for the purpose of determining a member who shall be entitled to attend this 29th AGM, the Company shall be requesting Bursa Malaysia Depository Sdn. Bhd. (Bursa Depository) in accordance with Clause 45(2) of the Company’s Constitution and Section 34(1) of the Securities Industry (Central Depositories) Act 1991 (SICDA) to issue a General Meeting Record of Depositors (ROD) as at 7 May 2019. Only a depositor whose name appears on the ROD as at 7 May 2019 shall be entitled to attend the said Meeting or appoint proxy/proxies to attend and/or vote on his/her behalf.
BY ORDER OF THE BOARD
NORAZNI BINTI MOHD ISA(LS 0009635) Company Secretary
Kuala Lumpur12 April 2019
EXPLANATORY NOTES ON ORDINARY BUSINESSES:
(a) Agenda No. 1 is meant for discussion only as the provision of Section 340(1)(a) of the Act does not require shareholders’ approval for the Audited Financial Statements. As such, it is not put forward for voting.
(b) Ordinary Resolutions 1-7 – Proposed Re-election of Directors in accordance with Clauses 64(1) and 63(2) of the Company’s Constitution
Clause 64(1) of the Company’s Constitution provides among others, that one-third (1/3) of the Directors at the time being of whom have been longest in office shall retire by rotation at the AGM of the Company and shall be eligible for re-election.
Clause 63(2) of the Company’s Constitution provides among others, that the Directors shall have power at any time and from time to time to appoint any other person to be a Director of the Company either to fill a casual vacancy or as an addition to the existing Directors. Any Director so appointed shall hold office only until the next following AGM of the Company and shall then be eligible for re-election.
Board Nomination and Remuneration Committee (BNRC) and the Board have conducted an assessment on the independence of all Independent Directors including Juniwati Rahmat Hussin, Gopala Krishnan K.Sundaram and Ong Ai Lin and
are satisfied that they have complied with the independence criteria as required by the Main Market Listing Requirements of Bursa Malaysia Securities Berhad (MMLR) and continue to bring independent and objective judgment to the Board deliberations.
BNRC and the Board have also considered the Board Evaluation including the Self and Peer Assessment results of Juniwati Rahmat Hussin, Gopala Krishnan K.Sundaram and Ong Ai Lin and agreed that they have met the Board’s expectation in terms of experience, expertise, integrity, competency, commitment and individual contribution by continuously performing their duties diligently as Directors of the Company.
Tan Sri Leo Moggie, Datuk Ahmad Badri bin Mohd Zahir and Amir Hamzah bin Azizan, being Appointed Directors by the Minister of Finance (Incorporated), the Special Shareholder of TNB, are also standing for re-election.
TNB Board on 15 March 2019, had approved for the appointment of Dato’ Roslina binti Zainal as the Non-Independent Non-Executive Director. Being the former TNB Vice President, Regulatory Economics and Planning, her inclusion to the Board shall further strengthen the Board composition and give valuable insight on the future regulatory landscape of the electricity industry.
Subsequently, the Board on 26 March 2019 has approved, with the concurrence of TNB Special Shareholder for the appointment of Amir Hamzah bin Azizan as TNB President/Chief Executive Officer/Executive Director for a period of three (3) years with effect from 2 April 2019. Pursuant to Clause 63(2) of the Company’s Constitution, Amir Hamzah bin Azizan also standing for re-election.
BNRC and the Board hereby recommend for the re-election of each Director who is retiring at the 29th AGM.
(c) Ordinary Resolutions 8-10 – Non-Executive Directors’ Remuneration
Section 230(1) of the Act stipulates among others that the fees and any benefits payable to the Directors of a listed company and its subsidiaries shall be approved at a general meeting. As agreed by the Board, the shareholders’ approval shall be sought at the 29th AGM on the Non-Executive Directors’ remuneration through three (3) separate resolutions as follows:
(i) Ordinary Resolution 8 on the payment of Non-Executive Directors’ fees in respect of the Financial Year ended 31 December 2018;
(ii) Ordinary Resolution 9 on the payment of Non-Executive Directors’ fees for the Non-Executive Chairman and each Non-Executive Director from 1 January 2019 until the next AGM of the Company;
(iii) Ordinary Resolution 10 on the payment of benefits (excluding Non-Executive Directors’ fees) to the Non-Executive Directors from the 29th AGM until the next AGM of the Company.
TNB Board on 11 April 2018, had approved on the engagement of Willis Towers Watson (WTW) to conduct a holistic and independent review of the Non-Executive Directors’ Remuneration with the view to determine its market competitiveness and alignment with the latest regulations/corporate governance guidelines in Malaysia. TNB Non-Executive Directors remuneration was last reviewed in 2013.
Whilst there is no proposed revision to the existing Directors’ fees, the proposed Ordinary Resolution 8-9 for the Financial Year ended 31 December 2018 and payment of the fees from 1 January 2019 until the conclusion of the next AGM are tabled herewith in line with the provision of the Act and best practices of corporate governance by ensuring full disclosure.
Notice of the 29th Annual General Meeting

Integrated Annual Report 2018
Tenaga Nasional Berhad
p.7
About TNB
Our Business
Business Context
Performance Review
Sustainability Statement
Governance
Financial Statements
Additional Information
Due to the limited listed company data in utilities industry in Malaysia, multiple data sources which extend beyond the local market and industry were considered by WTW. In its review, overall, TNB is market competitive, for most of the compensation elements and WTW recommended that the existing remuneration policy remains and it is to be reviewed in one (1) to two (2) years to ensure the market competitiveness.
The existing remuneration policy of Non-Executive Directors is as follows:
Description TNB Board TNB Subsidiaries
Chairman Non-ExecutiveDirectors
Chairman Non-ExecutiveDirectors
Monthly fixed fees RM30,000 per month
RM20,000 per month
Category I – RM7,000Category II – RM5,000
Category I – RM5,000Category II – RM3,000
*Meeting Allowances (per meeting):
(i) Board RM2,500 RM2,000 RM1,500 RM1,000
(ii) Board Committees RM2,000 RM1,500 RM1,000 RM800
Benefits Medical, Business Peripherals, Electricity Bills, Travelling & Telecommunication and other claimable benefits
* subject to not more than three (3) payments in a month.
In determining the estimated total amount of benefits payable, the Board has considered various factors including the number of scheduled and special meetings for the Board and Board Committees.
Payment of Non-Executive Directors’ benefits will be made by the Company and its subsidiaries on a monthly basis and/or as and when incurred, provided that the proposed Ordinary Resolution 10 be passed at the 29th AGM. The Board is of the view that it is fair and justifiable for the payment of benefits to the Non-Executive Directors be made as and when incurred, after the Non-Executive Directors have discharged their responsibilities and rendered their services to the Company.
Details of the Directors’ Remuneration for the Financial Year ended 31 December 2018 are enumerated on page 131 of the Corporate Governance Overview Statement of this Integrated Annual Report.
(d) Ordinary Resolution 11 – Re-appointment of Auditors
Based on the External Auditors Assessment Result for the Financial Year under review, Board Audit Committee and the Board are satisfied with the quality of service, adequacy of resources provided, communication, independence, objectivity and professionalism demonstrated by the External Auditors in carrying out their functions.
Being satisfied with the External Auditors’ performance, the Board recommends their re-appointment for shareholders’ approval at the forthcoming AGM.
Additional Information on Ordinary Resolutions 1 to 7
Additional Information on the particulars of the retiring Directors, as required under Appendix 8A of the MMLR is detailed out in the Statement Accompanying Notice of 29th AGM of this Integrated Annual Report.
Notice of the 29th Annual General Meeting
NOTES:
1. A member of a Company shall be entitled to appoint another person as his/her proxy to exercise all or any of his/her rights to attend, participate, speak and vote at a meeting of members of the Company, in accordance with Section 334(1) of the Act.
2. Where a member is an authorised nominee as defined in accordance with the provisions of the SICDA, it may appoint up to two (2) proxies in respect of each Securities Account it holds with ordinary shares in the Company standing to the credit of the said Securities Account.
3. A member entitled to attend and vote at the Meeting is entitled to appoint not more than two (2) proxies to attend and vote on his/her behalf. Where a member appoints two (2) proxies, the appointments shall be invalid unless the proportion of the shareholdings to be represented by each proxy is specified.
4. The instrument appointing a proxy/Proxy Form shall be in writing under the hand of the appointer or of his attorney duly appointed under a power of attorney. Where the instrument appointing a proxy/Proxy Form is executed by a corporation, it shall be executed either under its common seal or under the hand of any officer or attorney duly appointed under a power of attorney.
5. A corporation which is a member may by resolution of its Directors or other governing body authorise such person as it thinks fit to act as its representative at the Meeting in accordance with Clause 51 of the Company’s Constitution.
6. Duly completed Proxy Form must be deposited to the Boardroom Share Registrars Sdn. Bhd., Level 6, Symphony House, Pusat Dagangan Dana 1, Jalan PJU 1A/46, 47301 Petaling Jaya, Selangor Darul Ehsan, Malaysia not less than twenty-four (24) hours before the time appointed for the taking of the poll or no later than 13 May 2019 at 12.00 p.m.
7. Pursuant to Paragraph 8.29A of the MMLR, voting at the 29th AGM of the Company will be conducted by poll. Poll Administrator and Independent Scrutineers will be appointed respectively to conduct the polling/e-voting process and to verify the results of the poll.
Registration of Members/Proxies
Registration of members/proxies attending the Meeting will start from 7.00 a.m. on the day of the Meeting and shall remain open until such time as may be determined by the Chairman of the Meeting. At the closure thereof, no person will be allowed to register for the Meeting nor enter the Meeting venue. Members/proxies are required to produce identification documents for registration.

p.8
About TNB
Our Business
Business Context
Performance Review
Sustainability Statement
Governance
Financial Statements
Additional Information
The Directors who are retiring by rotation in accordance with Clause 64(1) of the Company’s Constitution and seeking re-election:
(i) Tan Sri Leo Moggie
(ii) Juniwati Rahmat Hussin
The Directors who were appointed to the Board and are retiring in accordance with Clause 63(2) of the Company’s Constitution and seeking re-election:
(i) Gopala Krishnan K.Sundaram
(ii) Ong Ai Lin
(iii) Datuk Ahmad Badri bin Mohd Zahir
(iv) Dato’ Roslina binti Zainal
(v) Amir Hamzah bin Azizan
The profiles of the above Directors are set out in A Committed Board on pages 100 to 109 of this Integrated Annual Report.
Save for Dato’ Roslina binti Zainal who holds 18,400 ordinary shares in the Company, none of the above Directors has any interest in the securities of the Company or its Subsidiaries.
(Pursuant to Paragraph 8.27(2) of the Main Market Listing Requirements of Bursa Malaysia Securities Berhad)
STATEMENT ACCOMPANYING NOTICE OF THE 29TH ANNUAL GENERAL MEETING

Integrated Annual Report 2018
Tenaga Nasional Berhad
p.9
About TNB
Our Business
Business Context
Performance Review
Sustainability Statement
Governance
Financial Statements
Additional Information
ADMINISTRATIVENOTES OF THE 29TH ANNUAL GENERAL MEETING
Tuesday, 14 May 2019 at 10.00 a.m.
mySpace1@Ballroom, Level 3, The Malaysia International Trade & Exhibition Centre
(MITEC), Kompleks MITEC, No. 8, Jalan Dutamas 2, 50480 Kuala Lumpur, Malaysia
GPS: 3.1791° N, 101.6679° E
PARKING AREA
Kindly park your vehicle at the designated parking area through the North or South entry in
MITEC. The parking bays are subject to parking fees imposed by the Parking Management.
Please validate your parking ticket at the Ticket Counter situated at the foyer Level 2.
REGISTRATION
Registration will start at 7.00 a.m. and registration counters shall remain open until such time
as may be determined by the Chairman of the Meeting. There will be signages to direct you
to the registration area. Please produce your original Identity Card (NRIC)/Passport during the
registration.
NO PERSON WILL BE ALLOWED TO REGISTER ON BEHALF OF THE REGISTERED SHAREHOLDER/PROXY.
Upon verification and registration, you will be given a Wristband. No person will be allowed to
enter the Meeting Hall without the Wristband.
The registration counters will only handle verification of shareholdings and registration process.
You may proceed to the Help Desk for any other clarification or enquiry.
HELP DESK
Please proceed to the Help Desk located within the
registration area if you need any assistance.
SOUVENIR ELIGIBILITY
Souvenir is to be given to shareholders and proxies who
attended the 29th Annual General Meeting (AGM), holding
501 unit of shares and above only (while stock last).
Where a shareholder splits the shares by appointing
more than one (1) proxy, ONLY one (1) proxy is entitled
to one (1) souvenir.
Where a proxy represents multiple shareholders, the
proxy shall be entitled to ONLY one (1) souvenir.
VOTING PROCEDURE
The voting at the 29th AGM will be conducted via
e-polling. Boardroom Share Registrars Sdn. Bhd. has
been appointed as Poll Administrator to conduct the
polling process. An Independent Scrutineer will verify
the result of the poll.
Please follow the instructions given during the AGM for
the e-polling process.
REFRESHMENTS
Light refreshments will be served for the shareholders/
proxies attending the AGM. Please proceed to the
Refreshment Hall as indicated by the signages.

p.10
About TNB
Our Business
Business Context
Performance Review
Sustainability Statement
Governance
Financial Statements
Additional Information
NO SMOKING POLICY
MITEC is a non-smoking building.
FIRST AID
Please refer to any of our staff/First Aiders should any
assistance be required.
PERSONAL BELONGINGS
Please look after your personal belongings. TNB will not
be held responsible/liable for any missing items.
ENQUIRY
Any general queries in relation to the AGM, please
contact the Share Registrar during office hours from
8.30 a.m. to 5.30 p.m. (Monday to Friday).
Telephone : +603-7849 0777
Facsimile : +603-7841 8151/8152
From Jalan K
uching
From
Pub
lika
From
Ban
gsar
Jalan
Tuan
ku A
bdul Hali
m
Jalan Kuching
Jalan Dutamas 2
Jalan Dutamas 1
Jalan DutamasMasjid Wilayah
Persekutuan
Lembaga Hasil Dalam
Negeri Jalan Duta
Kompleks Mahkamah
Kuala Lumpur
Jalan Sultan Haji Ahmad Shah
MATRADE
Ministry of
International
Trade & Industry
(MITI)
Malaysia International Trade
& Exhibition Centre (MITEC)
Per
siar
an D
utam
as
By Car
The following major roads, expressways and highways will conveniently direct shareholders/proxies to MITEC:
DUKE (Duta - Ulu-Kelang Expressway)NKVE (New Klang Valley Expressway)SPRINT HighwayJalan Kuching
By Taxi
Catch a Taxi/Grab from anywhere in Kuala Lumpur or Petaling Jaya and request for a drop-off at North or South Entrance.
Taxis or Airport Limo are also available from Kuala Lumpur International Airport (KLIA) to MITEC and the drive to MITEC takes about an hour journey.
By Bus
T821 - MRT Semantan - Kompleks Mahkamah Jalan Duta (Only on weekdays) until 8.00 p.m.
852 - Titiwangsa Bus Hub - MATRADE(Everyday) until 11.30 p.m.
851 - Pasar Seni Bus Hub - Kompleks Mahkamah Jalan Duta(Only on weekdays) until 11.30 p.m.
By Train
MRT SemantanLRT/Monorail Titiwangsa
HOW TO GET TO MITEC
Administrative Notes

Integrated Annual Report 2018
Tenaga Nasional Berhad
p.11
About TNB
Our Business
Business Context
Performance Review
Sustainability Statement
Governance
Financial Statements
Additional Information
12 Our Reporting Journey
13 Key Highlights
14 Key Financial Highlights
15 Six-Year/Period Group Financial Summary
16 Six-Year/Period Group Growth Summary
FROM OUR LEADERS
17 Chairman’s Letter to Shareholders
21 2018 Year in Review
• Group Business Model
• Our Strategy
- Future Generation Sources
- Grid of the Future
- Winning the Customer
- Future Proof Regulations
• Our Capitals
- Financial Capital
- Manufactured Capital
- Natural Capital
- Intellectual Capital
- Human Capital
- Social and Relationship Capital
44 Our Scorecard
45 Financial Calendar
46 Investor Relations
49 Net Book Value of Land & Buildings
OUR BUSINESS

p.12
About TNB
Our Business
Business Context
Performance Review
Sustainability Statement
Governance
Financial Statements
Additional Information
Our reporting landscape this year continues with the Integrated Annual Report (IAR) format. The Integrated Reporting <IR> Framework, which we adopt, informs the integrated thinking of TNB and how we create value, by conveying relevant aspects of our value-creation process to our stakeholders. The globally-recognised <IR> standard is in line with our aspiration to become a world-class utility.
This IAR encapsulates TNB’s Economic, Environmental, Social and Governance
measures, including programmes, policies and developments for the financial year ended
31 December 2018 (FY2018), as we strive to provide accurate and up-to-date disclosures
on our business.
The report aims to provide concise and relevant information on the performance of our
domestic and international operations within the context of our external environment, how
we are governed, our future prospects, as well as our long-term strategy to become a Top
10 Global Utility (by market capitalisation) by 2025.
Our IAR is to be read in conjunction with our Sustainability Report, which provides related
details on our sustainability journey and efforts that form an integral part in meeting our
global aspirations.
In addition to the <IR> standard, the contents and development of this IAR and our
accompanying Sustainability Report, continues to be guided by Bursa Malaysia’s Main
Market Listing Requirements and Sustainability Reporting Guide (2018); the Malaysian
Code on Corporate Governance (2017); and the GRI Sustainability Reporting Standards
(GRI Standards: Core Option). It also highlights the alignment of our sustainability
performance and material matters with targeted United Nations Sustainable Development
Goals (UN SDGs) – under the global 2030 Agenda for Sustainable Development.
The impacts and contributions of TNB’s business to the six (6) capitals of value creation,
as described in the <IR> Framework, are presented in this IAR in an integrated manner.
THIS IAR INCORPORATES THE FOLLOWING
NAVIGATION ICONS TO IDENTIFY OUR
REPORTING OF EACH OF THE SIX (6) VALUE
CREATION CAPITALS:
OUR REPORTING JOURNEY
FINANCIAL CAPITAL
• Prudent capital allocation balancing growth and stakeholder expectation
• Ensure responsible debt structure in line with our business profile
MANUFACTURED CAPITAL
• Sustainable asset management in line with best available practices
• Developing new capacity and services in line with corporate strategic plan
NATURAL CAPITAL
• Protect our environment and biodiversity
• Combat climate change through reduction of greenhouse gas (GHG) emissions
SOCIAL AND RELATIONSHIP CAPITAL
• Build strong relationship
with stakeholders through
meaningful engagement
INTELLECTUAL CAPITAL
• Continued support for technological advancement through research and development
• Explore new efficiency drivers, products, services and business models
HUMAN CAPITAL
• Efficient management of human capital resources
• Foster stable, safe and high quality employment
• Development of our talent at all levels

Integrated Annual Report 2018
Tenaga Nasional Berhad
p.13
About TNB
Our Business
Business Context
Performance Review
Sustainability Statement
Governance
Financial Statements
Additional Information
KEY HIGHLIGHTS
2.6%
3.2%
* Based on adjusted net profit
26.5%RM3,723.7MILLION
RM11,819.3MILLION
USD95.9/MT
CAPITAL EXPENDITURE AVERAGE COAL PRICE
UNIT DEMAND GROWTH
EARNINGS BEFORE INTEREST, TAXES,
DEPRECIATION & AMORTISATION
(EBITDA) MARGIN
NET PROFIT ATTRIBUTABLE
TO OWNERS OF THE
COMPANY
RETURN ON ASSETS*

p.14
About TNB
Our Business
Business Context
Performance Review
Sustainability Statement
Governance
Financial Statements
Additional Information
GROUP COMPANY
FINANCIAL YEAR/PERIOD* ENDED 31 DECEMBER2018 2017*
(Restated)2018 2017*
(Restated)
PROFITABILITY (RM Mil l ion)
Revenue 50,392.5 15,692.2 47,063.3 14,718.2
Operating profit 6,875.6 3,014.0 6,070.8 2,668.2
Profit before taxation and zakat 5,046.6 2,843.5 4,314.1 2,625.4
Net profit attributable to owners of the Company 3,723.7 2,622.3 3,218.6 2,452.3
KEY BALANCE SHEET DATA (RM Mil l ion)
Property, plant and equipment 111,445.5 104,807.6 83,921.1 81,792.6
Total assets 153,695.0 144,250.0 125,141.5 118,048.8
Total borrowings 47,832.4 41,443.7 21,637.0 15,348.1
Total liabilities 94,643.1 86,261.0 73,411.4 66,306.0
Share capital 11,446.1 11,199.6 11,446.1 11,199.6
Shareholders’ equity 59,051.9 57,989.0 51,730.1 51,742.8
SHARE INFORMATION
Per share (sen)
Basic earnings 65.6 46.3
Diluted earnings 65.4 46.2
Dividend (sen):
- Interim 30.27 -
- Final 23.00 21.4
Net assets per share attributable to owners of the Company 1,017.0 1,007.2
FINANCIAL RATIOS
Return on assets (%) 3.2 5.3
EBITDA margin (%) 26.5 32.3
Debt-equity (net of cash) ratio 0.50 0.4
KEY FINANCIALHIGHLIGHTS

Integrated Annual Report 2018
Tenaga Nasional Berhad
p.15
About TNB
Our Business
Business Context
Performance Review
Sustainability Statement
Governance
Financial Statements
Additional Information
GROUP
31.08.2014 31.08.2015 31.08.2016 31.08.2017 31.12.2017*(Restated)
31.12.2018
OPERATING RESULTS (RM Mil l ion) (1)
Revenue 42,792.4 43,286.8 44,531.5 47,416.9 15,692.2 50,392.5
Operating profit 7,181.0 8,627.6 9,072.0 9,364.0 3,014.0 6,875.6
Profit before taxation and zakat 7,114.7 7,133.7 8,066.8 8,281.8 2,843.5 5,046.6
Net profit attributable to owners of the Company 6,467.0 6,118.4 7,367.6 6,904.0 2,622.3 3,723.7
KEY BALANCE SHEET DATA (RM Mill ion) (2)
Property, plant and equipment 83,045.1 90,300.3 96,512.7 103,083.7 104,807.6 111,445.5
Total assets 110,665.4 117,135.0 132,902.2 142,012.4 144,250.0 153,695.0
Total borrowings 25,456.0 24,698.9 34,306.7 38,846.5 41,443.7 47,832.4
Total liabilities 67,206.2 69,668.1 80,302.5 84,427.6 86,261.0 94,643.1
Share capital 5,643.6 5,643.6 11,025.8 11,124.9 11,199.6 11,446.1
Shareholders’ equity 43,222.0 47,208.0 52,599.7 57,584.8 57,989.0 59,051.9
SHARE INFORMATION
Per share (sen)
Basic earnings 114.6 108.4 130.6 122.0 46.3 65.6
Diluted earnings 114.6 108.4 130.2 121.5 46.2 65.4
Gross dividend 29.0 29.0 32.0 61.0 21.4 53.3
Net assets 765.9 836.5 928.3 1,009.2 1,007.2 1,017.0
Share price as at reporting date (RM) 12.4 11.2 14.7 14.3 15.3 13.6
FINANCIAL RATIOS
Return on assets (%) 6.2 6.6 6.4 5.4 5.3 3.2
Return on shareholders’ equity (%) 15.8 16.3 16.1 13.3 13.2 8.3
Gearing (%) 36.9 34.2 39.5 40.3 41.6 44.8
EBITDA margin (%) 28.2 32.2 33.2 32.6 32.3 26.5
Effective weighted average cost of funds (%) 4.9 4.8 5.1 4.7 5.0 5.0
Interest coverage (%) 13.8 14.7 14.2 10.6 9.5 7.9
Currency mix (RM:Foreign) 77:23 78:22 83:17 77:23 79:21 74:26
Debt-equity (net of cash) ratio(3) 0.3 0.3 0.3 0.4 0.4 0.5
* Financial Period Ended 31 December 2017(1) Amounts for financial period ended 31 December 2017 have been restated for the Amendments to MFRS15 which was adopted in FY2018(2) Balances as at 31 December 2017 have been restated for the Amendments to MFRS15 which was adopted in FY2018(3) Cash includes financial assets at fair value through profit or loss (FVTPL)
SIX-YEAR/PERIOD* GROUP FINANCIAL SUMMARY

p.16
About TNB
Our Business
Business Context
Performance Review
Sustainability Statement
Governance
Financial Statements
Additional Information
SIX-YEAR/PERIOD* GROUPGROWTH SUMMARYREVENUE (RM MILLION)
TOTAL ASSETS(RM MILLION)
GEARING (%)
NET PROFIT ATTRIBUTABLE TO OWNERS OF THE COMPANY (RM MILLION)
TOTAL BORROWINGS (RM MILLION)
INTEREST COVERAGE (%)
SHAREHOLDERS’ EQUITY (RM MILLION)
RETURN ON ASSETS(%)
BASIC EPS (SEN)
42,792
2014
44,532
2016
43,287
2015
47,417
2017
15,692
2017*(Restated)
50,393
2018
2,622
2017*(Restated)
3,724
2018
6,467
2014
7,368
2016
6,118
2015
6,904
2017
57,989
2017*(Restated)
59,052
2018
43,222
2014
52,600
2016
47,208
2015
57,585
2017
144,250 153,695110,665 132,902117,135 142,012
2017*(Restated) 20182014 20162015 2017
41,444 47,83225,456 34,30724,699 38,847
2017*(Restated) 20182014 20162015 2017
5.3 3.26.2 6.46.6 5.4
2017*(Restated) 20182014 20162015 2017
41.6
2017*(Restated)
44.8
2018
36.9
2014
39.5
2016
34.2
2015
40.3
2017
9.5
2017*(Restated)
7.9
2018
13.8
2014
14.2
2016
14.7
2015
10.6
2017
46.3
2017*(Restated)
65.6
2018
114.6
2014
130.6
2016
108.4
2015
122.0
2017
* Financial Period Ended 31 December 2017

Integrated Annual Report 2018
Tenaga Nasional Berhad
p.17
About TNB
Our Business
Business Context
Performance Review
Sustainability Statement
Governance
Financial Statements
Additional Information
CHAIRMAN’S LETTER TO SHAREHOLDERS
“Our diversified footprint and agility in providing innovative and creative offerings will undoubtedly provide us the added advantage in capturing opportunities in the geographies and areas that we serve.”
It is my pleasure, on behalf of the Board of Directors
of Tenaga Nasional Berhad (TNB), to present you our
Integrated Annual Report (IAR) for the Financial Year ended
31 December 2018 (FY2018). Through the strategic efforts
initiated under our Reimagining TNB (2017-2025) blueprint,
we continue to register revenue growth and healthy profits
throughout the financial year, fostered by a conducive
regulatory environment. We are also pleased to report
that TNB’s Sustainability Commitments continues to reap
positive outcomes to ensure sustainable progression and
development.
STEADY EARNINGS EXPANSION UNDERSCORED BY SOLID
OPERATING PERFORMANCE
Driven by higher electricity demand which peaked in August 2018 to
18,338MW registering a rise of 3.1% from FY2017, our Group revenue grew
6.3% from FY2017 (September 2016 – August 2017) to RM50.39 billion. Net
profit for FY2018 was lower at RM3.75 billion compared to RM6.91 billion
in FY2017, mainly due to regulatory adjustment as a result of regulatory
changes in the Second Regulatory Period (RP2) (2018-2020), impairment,
and forex translation.
Underpinning our higher revenue in FY2018, electricity demand continued
its positive momentum in FY2018, with annual electricity sales recorded
at 1.4 percentage points higher than initially projected under RP2 of the
Incentive Based Regulation (IBR) framework.
DEAR SHAREHOLDERS,
53.3 senPER ORDINARY SHARE
1.4%POINT HIGHER
TOTAL DIVIDENDANNUAL ELECTRICITY SALES*
TAN SRI LEO MOGGIECHAIRMAN
* Comparison with RP2 forecast

p.18
About TNB
Our Business
Business Context
Performance Review
Sustainability Statement
Governance
Financial Statements
Additional Information
Chairman’s Letter To Shareholders
The Group remains committed to create long-term value
for our shareholders by consistently delivering optimum
dividends for each financial year. For the current
financial year, the Board had approved a single-tier
interim dividend of 30.3 sen per ordinary share
amounting to a dividend payout of RM1.72 billion
(paid in October 2018); and a final single-tier dividend
of 23.0 sen per ordinary share amounting to a dividend
payout of RM1.31 billion.
With this, TNB’s total dividend in FY2018 amounts
to 53.3 sen per Ordinary Share at a total value of
RM3.03 billion. The dividend payout is equivalent
to 55.8% of the Adjusted Group Profit After Tax and
Minority Interests (PATAMI) (excluding Extraordinary and
Non-Recurring Items) for FY2018, which is in line with
TNB’s revised dividend policy of between 30% and
60% of Group PATAMI.
NEW REGULATORY PERIOD FOR THE MALAYSIA
ELECTRICITY SUPPLY INDUSTRY
To ensure the continued stability and orderly
development of the local electricity supply industry, we
have been engaging the Government and the Energy
Commission (EC) since 2016 to prepare the necessary
framework and recommendations to enable a smooth
transition into RP2.
Following a series of negotiation sessions in 2017,
the Government, through the EC, had approved the
average base tariff for RP2 to be set at 39.45 sen per
kWh. Included in the new base tariff is also the capital
investment approval of RM18.8 billion to upgrade
our regulated assets by embedding automation and
technology into the grid.
This upgrade will enable us to support the Nation’s aspiration for increased utilisation of
sustainable energy by ensuring that our grid will be able to facilitate the bi-directional flow of
energy resulting from the injection of distributed renewable generation anywhere along it.
Notably, the sustainable ecosystem afforded by the IBR framework and the Imbalance Cost
Pass-Through (ICPT) mechanism implemented in the last four (4) years have resulted in Malaysia
having one of the most reliable energy networks in the region – on par with other advanced
countries.
As a proactive and forward-looking organisation, preparatory works are already underway to gear
ourselves for the Third Regulatory Period (RP3) (2021-2023). Upon receiving the endorsement
of the Management team and approval of the Board, we expect our IBR RP3 proposal to be
submitted to the EC by December 2019.
NET PROFIT(RM million)
6,000.0
4,500.0
3,000.0
1,500.0
7,500.0
FPE 2017*(Restated)
2,608.5 3,745.0
2018
6,912.1
20170
DIVIDEND(Sen per ordinary share)
60
45
30
15
0
75
FPE 2017*
21.4 53.3
2018
61.0
2017
Malaysia, through TNB, has one of the most reliable energy networks in the region.
REVENUE(RM million)
30,000.0
20,000.0
10,000.0
60,000.0
0
50,000.0
40,000.0
50,392.5
2018
47,416.9
2017
15,692.2
FPE 2017*(Restated)
* Financial Period Ended 31 December 2017

Integrated Annual Report 2018
Tenaga Nasional Berhad
p.19
About TNB
Our Business
Business Context
Performance Review
Sustainability Statement
Governance
Financial Statements
Additional Information
Chairman’s Letter To Shareholders
EMBRACING LIBERALISATION OF MALAYSIA
ELECTRICITY SUPPLY INDUSTRY
With the wave of technology disruptions arriving
at our shores, we firmly believe that it is important
for the Malaysia Electricity Supply Industry (MESI)
to be prepared for the oncoming fundamental
shifts impacting the global electricity industry. The
Government’s timely reform efforts through the
MESI 2.0 is a key step to prepare the industry, ahead of
global trends. We foresee a rising need to future-proof
Malaysia’s industry structure and regulations, and to
empower consumers to make smarter choices in a
more democratised and decentralised setting.
Having anticipated these market-wide reforms,
we launched our Strategic Plan under Reimagining
TNB. We are proud of the solid foundations we
have put in place today, which has transformed our
internal processes and structure, rendering TNB more
technologically advanced, and cost-optimised than we
were four (4) years ago.
We are excited with the growth prospects ahead that
would see us delivering even better services, and
catalyse new market growth by unlocking the value of
network assets, which will lead to improving sustainable
value for all our stakeholders. We see this as part of our
unwavering commitment and contribution to realise the
Nation’s ambitions.
IMPROVING SOCIAL AND ENVIRONMENTAL
SUSTAINABILITY
In moving towards our Reimagining TNB aspiration
to be among the Top 10 Global Utility Companies by
market capitalisation in 2025, we are cognisant of our
role as a responsible corporate citizen in enhancing
social equity, helping the needy, conserving the
environment, and improving the livelihoods of the local
communities in which we operate, especially through
better education.
Throughout the years, TNB has been a strong proponent
in bettering lives through offering scholarships and
financial assistance to the needy and those from the
lower-income group. Beneficiaries from our TNB ‘Back
to School’ programme include deserving B40 primary
school students (from families with median household
income not exceeding RM3,000 per month), who
received assistance in terms of basic school supplies,
such as school uniforms and stationery.
We are cognisant of our role as a responsible
corporate citizen in enhancing social equity.
Additionally, the ‘Dermasiswa My Brighter Future
(MyBF) Programme’, which was launched in August
2018, has seen a total of 945 B40 students pursuing
their tertiary education in Science, Technology,
Engineering and Mathematics (STEM) in local
universities, financed by TNB through Yayasan Tenaga
Nasional (YTN). The Dermasiswa sponsorship provided
for the B40 tertiary students includes allowances
for board and lodging, tuition fees, and living
expenses throughout the duration of their studies.
The Dermasiswa programme is in addition to YTN’s
ongoing scholarships and convertible loans, for which
TNB provided for 1,974 students in FY2018.
We also continued to work with
Yayasan AMIR and the Ministry of
Education for our ‘Trust Schools
Programme’, where we helped
provide eight (8) rural schools
located in the vicinity of our power
stations by guiding and coaching
500 teachers and school personnel
in adopting effective teaching
skills and pedagogy which now is
benefiting 6,715 students who are
studying in these schools.
Understanding the financial
constraints and emotional strife
faced by lower-income families
whose family members undergo
prolonged medical treatment
in a hospital, we decided to
play our part in giving back to
society by partnering with the
National Welfare Foundation
(Yayasan Kebajikan Negara) to
provide safe and comfortable
accommodation for those in need.
‘DERMASISWA MY BRIGHTER FUTURE (MYBF) PROGRAMME’
Total of 945B40 students pursuing their tertiary education in the STEM in local universities
Through programmes such as My Brighter Future (MyBF), TNB continues to be a strong proponent in bettering lives by offering scholarships and financial assistance to the needy and those from the lower-income group.

p.20
About TNB
Our Business
Business Context
Performance Review
Sustainability Statement
Governance
Financial Statements
Additional Information
Chairman’s Letter To Shareholders
Under the ‘Better, Brighter Shelter Programme’, TNB
endeavours to uplift the conditions and facilities of
‘transit homes’ at the National Heart Institute in Kuala
Lumpur, and the Serdang Hospital in Selangor, to cater
for underprivileged folks who need to be at the side of
their unwell family members during critical times.
Meanwhile, TNB’s environmental commitments
continued to flourish during FY2018 with our Fireflies
Conservation Project at the coastal village of Kampung
Kuantan in Kuala Selangor, which is home to one of
the largest firefly colonies in Southeast Asia. Through
dedicated conservation efforts, the firefly colony
today thrives as does the local community who make
a living from eco-tourism. Given the success of this
programme, TNB through TNB Research Sdn. Bhd.
has decided to replicate the conservation project in
three (3) other locations, namely, Kampung Yak Yah
in Kemaman, Terengganu; Kampung Sungai Timun
in Rembau, Negeri Sembilan; and Kampung Dew in
Taiping, Perak.
BETTER, BRIGHTER PROSPECTS
The oncoming disruption to the energy supply value
chain, underpinned by new technology breakthroughs,
changing regulatory environment and evolving
customer expectations, present a whole new business
landscape for TNB in the coming years.
In commemorating our 70th anniversary of being a
nation-builder, we remain confident that our highly
skilled workforce, coupled with the measures executed
under our Reimagining TNB strategy will position us
favourably in capturing new opportunities arising from
the industry’s journey towards a more sustainable
future.
Moving ahead, the transformation of the global energy
supply industry will continue to accelerate as the forces
of decarbonisation, decentralisation, deregulation
and digitalisation of the industry further shape how
electricity is generated, distributed and consumed. We,
at TNB, strive to be a reliable partner and an anchor
to our stakeholders and the nation in meeting the
challenges ahead.
TAN SRI LEO MOGGIEChairman
ACKNOWLEDGEMENTS
On behalf of the Board and TNB, I would like to
thank the Government for the continued support
of the IBR framework and ICPT mechanism which
have been instrumental in enabling the Company
to operate efficiently and provide reasonable tariffs
to our customers. We look forward to continuing our
collaboration with the EC and relevant agencies in
achieving the MESI reform objectives to ensure long-
term energy security and a more equitable industry for
all stakeholders.
I would also like to record a special tribute to Datuk
Seri Ir. Azman bin Mohd. Under his leadership, TNB
has received numerous accolades, including the
World Branding Award in 2018, bestowed by the
prestigious London-based World Branding Forum.
During his tenure, TNB was ranked 22nd among global
utility players by Brand Finance, a renowned brand
valuation agency. TNB’s achievements throughout the
years reflect Datuk Seri’s outstanding capabilities as
President/Chief Executive Officer (President/CEO).
At the same time, I would like to welcome our new
President/CEO, Amir Hamzah bin Azizan. He comes
with 28 years of industry and international experience,
as well as extensive knowledge of the oil and gas
industry and marine logistics sector. I share the Board’s
view that our new incumbent will take the Company
to greater heights and to a better and brighter future
based on the foundation laid by his predecessors.
Upon launching of the ‘Better, Brighter Shelter Programme’, Deputy Prime Minister Dato’ Seri Dr. Wan Azizah Wan Ismail visited the shelters at Serdang Hospital in Selangor.
To our valued 35,000 employees,
I would like to record my gratitude
for your loyalty and utmost
dedication in giving your best for
the Company, as well as to my
fellow Board members for your
commitment and guidance. A
word of appreciation goes to our
suppliers, vendors and contractors
for your cooperation that enabled
smooth operations within TNB.
And last, but not least, to all our
shareholders and customers, for
your continued support and trust
in us.
TNB would not have accomplished
all the feats that we have set out
to do without all your contributions.

Integrated Annual Report 2018
Tenaga Nasional Berhad
p.21
About TNB
Our Business
Business Context
Performance Review
Sustainability Statement
Governance
Financial Statements
Additional Information
The year in review saw us making great strides in our transformation, as we moved closer to
achieving the objectives and priorities set under Reimagining TNB (2017-2025). In our bid to realise
the long-term growth aspirations encapsulated under each of the four (4) strategic pillars of Future
Generation Sources, Grid of the Future, Winning the Customer and Future Proof Regulations, we
make a conscious effort to safeguard the values and interests of our stakeholders, while building
sustainability into our business, and acting with the highest ethical standards.
2018 YEAR IN REVIEW
p.22
About TNB
Our Business
Business Context
Performance Review
Sustainability Statement
Governance
Financial Statements
Additional Information
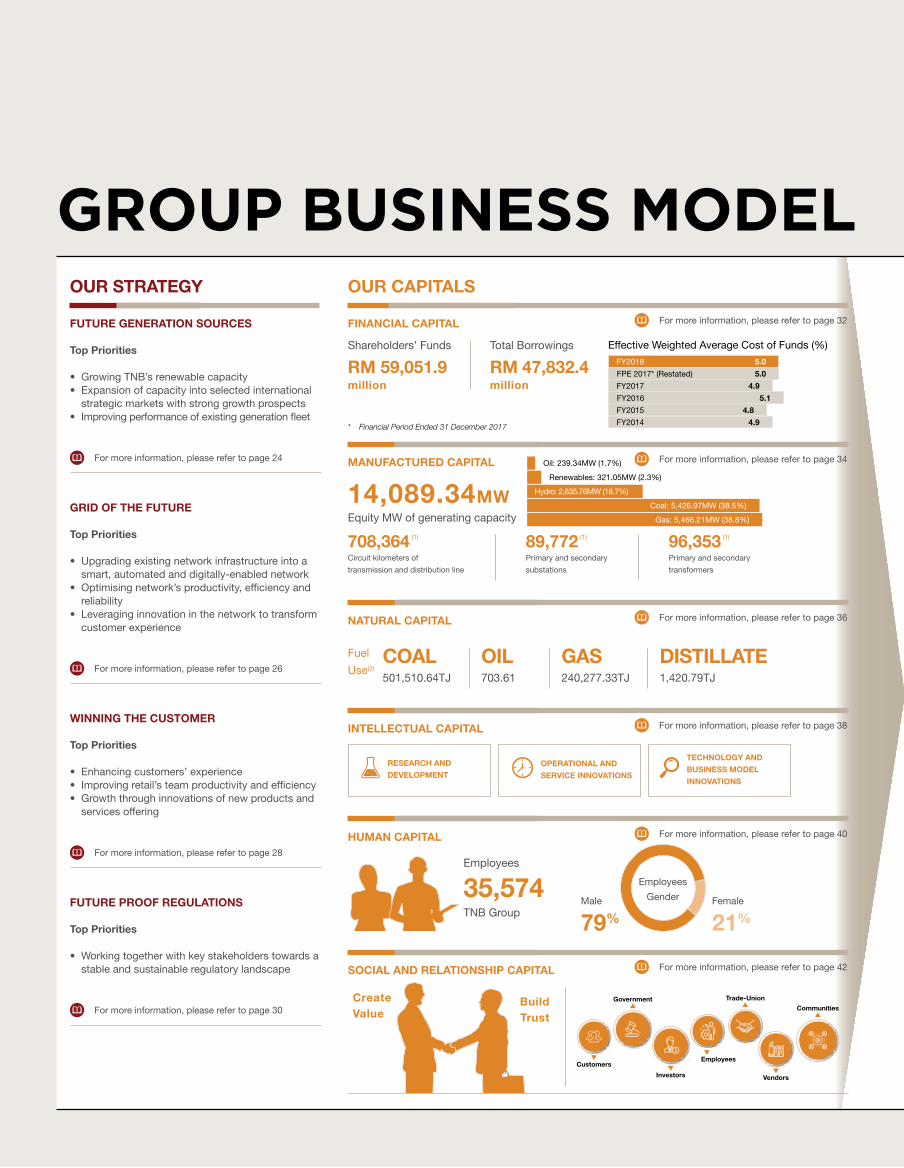
GROUP BUSINESS MODELOUR STRATEGY
WINNING THE CUSTOMER
Top Priorities
• Enhancing customers’ experience• Improving retail’s team productivity and efficiency• Growth through innovations of new products and
services offering
For more information, please refer to page 28
GRID OF THE FUTURE
Top Priorities
• Upgrading existing network infrastructure into a smart, automated and digitally-enabled network
• Optimising network’s productivity, efficiency and reliability
• Leveraging innovation in the network to transform customer experience
For more information, please refer to page 26
FUTURE GENERATION SOURCES
Top Priorities
• Growing TNB’s renewable capacity• Expansion of capacity into selected international
strategic markets with strong growth prospects• Improving performance of existing generation fleet
For more information, please refer to page 24
For more information, please refer to page 30
FUTURE PROOF REGULATIONS
Top Priorities
• Working together with key stakeholders towards a stable and sustainable regulatory landscape
OUR CAPITALS
HUMAN CAPITAL
Employees
TNB Group
35,574Male
79%Female
21%
Employees
Gender
INTELLECTUAL CAPITAL
RESEARCH AND
DEVELOPMENTOPERATIONAL AND
SERVICE INNOVATIONS
TECHNOLOGY AND
BUSINESS MODEL
INNOVATIONS
FINANCIAL CAPITAL
Shareholders’ Funds
RM 59,051.9million
Total Borrowings
RM 47,832.4million
Effective Weighted Average Cost of Funds (%)
4.8FY2015
4.9FY2014
5.1FY2016
4.9FY2017
5.0FPE 2017* (Restated)
5.0FY2018
NATURAL CAPITAL
Fuel
Use(2)OIL703.61
DISTILLATE1,420.79TJ
COAL501,510.64TJ
GAS240,277.33TJ
SOCIAL AND RELATIONSHIP CAPITAL
Create Value
Build Trust
MANUFACTURED CAPITAL
14,089.34MW Equity MW of generating capacity
Circuit kilometers of
transmission and distribution line
708,364Primary and secondary
substations
89,772Primary and secondary
transformers
96,353
Oil: 239.34MW (1.7%)
Renewables: 321.05MW (2.3%)
Hydro: 2,635.76MW (18.7%)
Gas: 5,466.21MW (38.8%)
Coal: 5,426.97MW (38.5%)
For more information, please refer to page 32
For more information, please refer to page 34
For more information, please refer to page 36
For more information, please refer to page 38
For more information, please refer to page 40
For more information, please refer to page 42
Government
Customers
Investors
Employees
Trade-Union
Vendors
Communities
* Financial Period Ended 31 December 2017
(1) (1) (1)

Integrated Annual Report 2018
Tenaga Nasional Berhad
p.23
About TNB
Our Business
Business Context
Performance Review
Sustainability Statement
Governance
Financial Statements
Additional Information
INPUT FROM SIX CAPITALS
Input from the six (6) capitals ensure we maintain a sustainable business. We recognise that an organisation depends on all forms of capitals, not just financial capital to contribute to the success of our business models. Our ability to enhance the stocks or values of these capitals are essential to the growth of our business.
Notes:(1) For TNB operations in Peninsular
Malaysia and Sabah only.(2) From power plants which TNB has
controlling stake for period FY2018.(3) From domestic power plants which TNB
has invested and have power purchasing agreement for domestic customers.
(4) Unit sold by wholly-owned TNB international power plants only.
(5) Including 9.04 million customers in Peninsular Malaysia and 0.61 million customers in Sabah.
(6) For TNB operations in Peninsular Malaysia only.
6,87
5.6
3,01
4.0
9,3
64.0
9,0
72.0
8,6
27.6
7,18
1.0
FY20
14
FY20
15
FY20
16
FY20
17
FPE
201
7*(R
esta
ted
)
FY20
18
RM 6,875.6 million
OPERATING PROFIT
THE VALUES CREATED AND ITS IMPACT
Greenhouse Gas Emissions Intensity
0.54tCO2e/MWh
Emissions Intensity(6)
Mitigation due to TNB’s use of (1) Non-Carbon generation, (2) Energy efficiency across value chain, (3) Clean coal technology, (4) Tree replanting
5,030,079.7tCO2e
Emissions Mitigated(6)
21.24% of TNB’s equity generating capacity
2,968.1MW
Non-Carbon Energy
ENVIRONMENT
9.65million
Customer Accounts(5):
SAIDI:
CSI:
SYSTEM MINUTES:
CUSTOMERS
Peninsular Malaysia
48.22Sabah
267.87
Peninsular Malaysia
8.1Sabah
7.7
Peninsular Malaysia
0.35Sabah
42.97
118,814.46GWh
Total Energy Units Sold(3):
1,101.74
5,345.24
113,469.22
Peninsular Malaysia(3)Sabah(3)International(4)
Total Energy Sold by Region
Suppliers and Contractors Employees
RM 3,685.8 million
Staff Expenses
ECONOMIC
Capital Providers
Government and Regulators
RM 1,301.6 million
Taxes
Fuel and Other Operating Costs
RM 28,534.9 million
Other Operating cost
RM 11,634.0 million
Fuel cost
RM 1,688.5 million
Lenders Financial cost
RM 2,931.9 million
Shareholders Total dividends
COMMUNITY
13,040Number of Rural Primary Students Assisted
2,919Number of Graduate Students Assisted
26AdoptedSchools
Group Business Model
RM 3,723.7 million
NET PROFIT ATTRIBUTABLE TO OWNERS OF THE COMPANY
3,72
3.7
2,62
2.3
6,9
04.0
7,36
7.6
6,11
8.4
6,46
7.0
FY20
14
FY20
15
FY20
16
FY20
17
FY20
18
FPE
201
7*(R
esta
ted
)
* Financial Period Ended 31 December 2017

p.24
About TNB
Our Business
Business Context
Performance Review
Sustainability Statement
Governance
Financial Statements
Additional Information
FUTURE GENERATION SOURCES
OBJECTIVES
Future Generation Sources are focused on delivering value towards our Reimagining TNB aspirations by shaping TNB’s generation capability and portfolio growth in clean energy, with the ultimate aim to position TNB as a renewables leader in the ASEAN region. We progress our renewable energy (RE) aspirations by continuously pushing the innovation envelope, engaging in strategic collaborations with established players in the RE sector, and applying emerging technologies to enable the efficient generation, distribution and storage of clean energy.
At the same time, we strive to ensure that our conventional generation assets continue to perform at the highest efficiency level to provide sustainable, reliable, and affordable energy to our customers. We are looking to expand our domestic generation capacity to fuel the Nation’s economic trajectory, whilst continuously building our international generation capacity in selected strategic markets.
Number of power plants
Total installed capacity (MW)
Equity capacity
Electricity sold (GWh)
Capacity under construction (MW)
Wholly-owned
Coal 2 4,080.0 4,080.0 29,363.4
Gas 9 4,486.4 4,486.4 25,537.6
Non-carbon 38 2,607.5 2,607.9 4,965.4 30.0
Others
Majority-owned
Coal 1(1) 1,486.0 891.6 9,878.1 2,000.0
Gas 2(1) 872.4 547.2 505.73 1,440.0
Non-carbon 57 102.7 84.4 440.6
Others 23 223.3 185.3 328.4
Minority-owned
Coal 2 1,650.0 455.4 9,967.4
Gas 3 1,476.0 432.6 3,595.9
Non-carbon 33 639.9 264.5 1,003.1 180.0
Others 1 900.0 54.0 7,449.4
(1) Our majority-owned plant, KEV, operates both coal-fired turbines and gas-fired turbines and appears as both coal and gas plant in this table
Our “Future Generation Sources” strategic driver leads TNB’s generation capacity growth
strategy, as we actively diversify into energy sources that are able to meet the needs of the
future in a sustainable, reliable, and affordable manner.
Our Strategy
Improving our sustainability through our foray into the wind energy market.

Integrated Annual Report 2018
Tenaga Nasional Berhad
p.25
About TNB
Our Business
Business Context
Performance Review
Sustainability Statement
Governance
Financial Statements
Additional Information
Our Strategy
IMPROVING OUR SUSTAINABILITY
During the year, our total installed RE capacity increased by 70.88MW to a total of 332MW, through:
• The acquisition of an 80% equity interest in two (2) RE companies registered in the United Kingdom, namely, GVO Wind Ltd and Bluemerang Capital Ltd, provided us a generation equity of 20.88MW. This marked TNB’s maiden foray into the onshore wind energy market; and
• The successful commissioning of our domestic 50MW Large Scale Solar (LSS) TNB Sepang project with 230,000 solar photovoltaic (PV) panels.
Recognising that developing the right talent is crucial to realising our long-term sustainability goals, we endeavoured to groom future leaders through our Generation Leadership Development Programme. The six-month programme, which commenced in April 2018, saw 47 qualified Generation Division executives elevate their expertise.
To build resilient communities around our areas of business, we have invested significantly to improve emergency preparedness and dam maintenance at three (3) hydroelectric schemes. Our efforts were focused on:
• Enhancing the area’s emergency response plan through regular drills involving local authorities, state agencies and local residents;
• Upgrading the monitoring system at our dam; • Reviewing and upgrading garbage management along the dam’s upper
catchment area and continuous removal of dam sediments;• Improving the notification processes and communication infrastructure
to all stakeholders; and • Conducting regular Integrated Community Based Disaster Management
(ICBDM) awareness sessions on the threat of potential floods to local authorities and residents.
OUTLOOK
In the coming year, we strive to raise our operating efficiency through concerted efforts ranging from expanding our Generation Division’s Business Turnaround Programme to broadening our corporate reorganisation exercise with an aim to create a highly-skilled, knowledgeable and effective workforce to meet the challenges ahead. On new electricity resources to meet rising demand, we look forward to increase our thermal-based capacity with our 70%-owned 2 x 1,000MW ultra-supercritical Jimah East Power Plant that is expected to be commissioned in FY2019 (Unit 1: June 2019 and Unit 2: December 2019). Following that, we shall ensure the timely delivery of our 51%-owned 1,440MW combined-cycle gas turbine Southern Power Generation (SPG) Pasir Gudang Plant in 2020.
DEVELOPMENTS IN FY2018
In January 2018, we established TNB Renewables Energy Sdn. Bhd. (TRe) to spearhead and accelerate our RE business growth in Malaysia. Under TRe, we intensified efforts in progressing our three-pronged RE strategy by capturing growth opportunities in utility-scale RE assets, small-scale RE assets, and expanding our retail self-generation platform.
To ensure sustainable value creation, we continued to demonstrate excellence in managing our generation assets through our holistic asset optimisation methodology, which aims to sustainably monetise value from each of our assets throughout its entire lifecycle.
In streamlining our generation operations to be leaner and more cost-effective, our Generation Division’s Business Turnaround Programme’s pilot project at our TNB Janamanjung plant continues to deliver positive traction.
Following the encouraging results at TNB Janamanjung plant, the programme was extended to our TNB Prai plant, Connaught Bridge plant and Port Dickson plant, where our turnaround team has completed Phase 1 while work for Phase 2 is currently in progress.
We also reviewed our international RE strategy, resulting in a decision to focus on growing our assets in five (5) selected locations, namely, Turkey, India, the United Kingdom, Australia and the ASEAN region. To step up our international presence, we are currently exploring collaboration opportunities with several experienced partners with established footprint in these key markets. Concurrently, we have developed an international operating model that is expected to enhance our ability to push business growth and ensure effective management of our assets.
For more information on GSPARX is available on page 29 in the Winning the Customer Section.
For more information on our Generation Performance, please refer to ‘Manufactured Capital’ on pages 34 to 35 in Our Capitals section.
GSPARX, a fully-owned subsidiary of TRe, was formed to grow our retail self-generation business.
Competency mismatch to drive strategy Inability to mitigate regulatory constraintsUnable to keep pace with changing
customers’ expectations
STRATEGIC RISKS

p.26
About TNB
Our Business
Business Context
Performance Review
Sustainability Statement
Governance
Financial Statements
Additional Information
GRID OF THE FUTURE
OBJECTIVES
The grid network functions as the backbone of TNB’s electricity supply chain, transporting bulk electricity from power generators to the distribution network to brighten homes, offices and commercial spaces, while supplying directly to industries for manufacturing. With the rising electricity demand, ‘Keeping the Lights On’ – remains our most critical task, to ensure secure and reliable electricity supply to fuel the Nation’s growth.
We endeavour to future-proof our energy transmission system by advancing our grid architecture to be one of the smartest, most efficient, automated and digitalised power networks. As the Nation’s power utility provider, we aspire to transform our customers’ experience through innovative offerings that create trust, pride, confidence and loyalty.
To-date, the first phase of our ‘Grid of the Future’ strategy (2016-2020) is firmly in place and involves the piloting and rollout of the elements that we believe will form the foundation of the modern grid, namely, the Advanced Metering Infrastructure (AMI), Distribution Automation (DA), Geospatial Information System (GIS), Volt-Var Optimisation, and Mobility Solutions for workforce management.
“Grid of the Future” strategic driver progresses our power transmission system to be
among the most technologically advanced and reliable in the world, and to meet future
challenges and growing demand in an increasingly liberalised generation market.
Our Strategy
Grid Statistics
TRANSMISSION LINES
Wholly-owned
23,082.3 KM
Majority-owned
2,888.5 KM
PEAK DEMAND
Wholly-owned
18,338.0 MWh
Majority-owned
955.1 MWh
TRANSMISSION SUBSTATIONS
Wholly-owned
443 substations
Majority-owned
45 substations
DISTRIBUTION LINES
Wholly-owned
660,038.0 KM
Majority-owned
22,355.0 KM
DISTRIBUTION SUBSTATIONS
Wholly-owned
81,327 substations
Majority-owned
7,957 substations
ELECTRICITY DISTRIBUTED
Wholly-owned
113,469.2 GWh
Majority-owned
5,345.2 GWh
ELECTRICITY TRANSMITTED
Wholly-owned
114,707.9 GWh
Majority-owned
1,724.8 GWh
TNB continues to scale new heights with grid network improvement to meet rising demand and customer’s future expectations.

Integrated Annual Report 2018
Tenaga Nasional Berhad
p.27
About TNB
Our Business
Business Context
Performance Review
Sustainability Statement
Governance
Financial Statements
Additional Information
Our Strategy
Inability to mitigate regulatory constraints Incapacity to leverage on technologyInability to adapt to changing market
environment
STRATEGIC RISKS
DEVELOPMENTS IN FY2018
In supporting our ‘Grid of the Future’ strategy, we have successfully completed the separation of the Distribution Division into
1. Distribution Network Division – to focus on improving operational efficiency and digitisation of the distribution grid; and 2. Retail Division – to focus on enhancing customer loyalty, developing new products and services and growing the retail energy business.
We established ‘Grid of the Future’ (GoTF) Steering Committee and GoTF Maturity Model to enable centralised decision-making with clear accountability hierarchy and benchmarking against world-class performing systems.
iii. Improved grid fault diagnosis and sharpened location precision to enable quicker grid restoration by the Grid System Operator and our maintenance team; and
iv. Continued certification of ISO 27001:2013 through the successful implementation of three (3) cyber drills via cyber-attack simulations, as well as organising awareness and training programmes to increase our support team’s proficiency and understanding on the importance of data protection.
In sustaining the excellent performance of our transmission network, we have continued the expansion and strengthening of our 500kV Grid Superhighway which will enable secure and efficient power transfer from other locations to the Central Area region, which accounts for 45% of Peninsular Malaysia’s electricity demand.
In addition to transmission grid upgrading works, we also ensured the continued modernisation
and digitalisation of our distribution grid through the following initiatives:
• Completed the implementation of 190,000 smart meters in Melaka. For 2019, the installation programme will expand beyond Melaka with a focus on homes and businesses in the Klang Valley;
• Successfully fitted the 113 MVAr of capacitor banks throughout our distribution network, in line with plans to optimise Volt-Var to improve the quality of electricity supply to our customers;
• Converted 3,672 distribution substations into Supervisory Control and Data Acquisition-enabled (SCADA-rised) substations, bringing the total number of distribution substations equipped with DA technology to more than 12,000 substations nationwide. Under the current GoTF strategy, TNB plans to upgrade all distribution substations located in major cities by 2025; and
• Successful deployment of mobility solutions for TNB meter management throughout Peninsular Malaysia.
We also completed the enhancement of the current ‘Transmission Grid Strategic Plan’ that was carried out to align with our ‘Grid of the Future’ aspiration set under Reimagining TNB. Concurrent with this strategic plan, the ‘Transmission Grid Digitalisation Transformation’ programme was also initiated this year, anchoring on three (3) core pillars, namely, Asset Management, Workforce Management and Grid Operations, to achieve operational excellence. Among the initiatives implemented this year under this digitalisation exercise include:
i. Utilised an online monitoring and analysis system for gas-insulated transformers and switchgears to improve maintenance effectiveness and accuracy;
ii. Scaled our drone fleet to carry out aerial patrolling of transmission towers and rentices across the distribution network and to uplift the efficacy of land planning and surveillance exercises carried out by our operation and maintenance teams;
DELIVERING BEST-IN-CLASS GRID PERFORMANCE
Through the world-class management of our transmission network and operational excellence, Malaysia’s power supply system is performing on par with developed nations, with SAIDI not exceeding 51 minutes per customer per year since 2015, accomplishing 12 consecutive years of zero major disturbance, and nine (9) consecutive years of zero load loss tripping for the 500kV Grid Superhighway.
For more information on our grid performance, please refer to ‘Manufactured Capital’ on pages 34 to 35 in Our Capitals section.
OUTLOOK
As we move towards a fully digitalised and automated grid and distribution network in the near future, nurturing a continuous talent pipeline will be a priority to realise the goals and ambitions we have set. In the coming year, we look to establish our Grid Academy to focus on developing subject matter experts with the requisite financial, technical and leadership capabilities to become future leaders of the Grid Division.
In terms of infrastructure, we will continue to strengthen the functionality, reliability and performance of our 500kV Grid Superhighway around the Central Area to ensure continued power supply with minimal transmission loss, as well as equipping 3,000 additional distribution substations with DA technology. We will also strive to complete our Asset Investment Plan for the grid and distribution network proposal to be submitted to the Government and regulator, ahead of the upcoming Third Regulatory Period (2021-2023).

p.28
About TNB
Our Business
Business Context
Performance Review
Sustainability Statement
Governance
Financial Statements
Additional Information
7,000,000
8,000,000
5,000,000
3,000,000
1,000,000
6,000,000
4,000,000
2,000,000
Customers Peninsular Malaysia Sabah
Others
WINNING THE CUSTOMER
OBJECTIVES
To maintain the trust of our nine (9) million customers nationwide, our Retail Division will create exceptional customer experience in delivering quality customer service and best and innovative solutions based on customer needs and values.
We are continuously engaging the customers via various methods encompassing click, call and come over channels as part of our efforts to reach out to all walks of customers through personal engagements and meet-ups with associations, consumer groups and all related stakeholders. Furthermore, we are also available for the customers through our Kedai Tenaga outlets, CareLine, myTNB web and mobile application.
Our “Winning the Customer” strategic driver guides wins in the kWh and beyond
energy businesses by building a retailer with customer centricity anchored by quality
service, innovative solutions, enhanced stakeholder communications and cost leadership
throughout the customer journey to meet ever-evolving needs and values.
FY
2015
FY
2016
FY
2017
FY
2018
Mining
28 30 30 45
FY
2015
FY
2016
FY
2017
FY
2018
Free units
2,40
3
3,05
1
2,50
2
4,81
7
FY
2015
FY
2016
FY
2017
FY
2018
Commercial
1,44
9,10
4
1,44
2,98
0
1,42
7,42
2
1,55
3,60
7
84,4
09
88,8
11
92,9
06
96,1
67
FY
2015
FY
2016
FY
2017
FY
2018
Domest ic
6,84
3,72
5
6,91
0,08
1
6,95
5,59
5
7,37
8,42
5
452,
469
471,
943
488,
270
505,
239
FY
2015
FY
2016
FY
2017
FY
2018
Industr ia l
28,0
54
2,82
7
27,2
10
1,99
1
27,5
75
1,55
3
29,7
49
1,58
9
FY
2015
FY
2016
FY
2017
FY
2018
Street l ight
64,6
95
5,50
4
66,9
25
5,82
4
67,7
30
6,04
2
72,5
54
6,12
9
Our Strategy
0
The ability to meet and exceed customer experience is going to be crucial in the future.

Integrated Annual Report 2018
Tenaga Nasional Berhad
p.29
About TNB
Our Business
Business Context
Performance Review
Sustainability Statement
Governance
Financial Statements
Additional Information
Our Strategy
CSI (5 Years)
4
2
10
8
6
Peninsular Malaysia
8.1
FY2018
8.1
FY2017
8.1
FY2016
8.0
FY2015
7.6
FY2014
4
2
10
8
6
Sabah
7.7
FY2018
7.3
FY2017
7.3
FY2016
7.0
FY2015
NA
FY2014
0 0
Competency mismatch to drive strategyUnable to keep pace with changing customers’
expectationsInability to adapt to changing market
environment
STRATEGIC RISKS
ACHIEVEMENTS IN FY2018
Our customer base grew 2.79% year-on-year in FY2018. With rising demand, the total domestic annual electricity sales grew to 118,814GWh.
The successful separation of our Distribution Network and Retail Divisions provides clear focus for our Retail Division to further strengthen our presence and branding in the energy retail market.
We accomplished a CSI score of 8.1 for the third consecutive year in FY2018, comparing favourably with the level of customer satisfaction towards energy utilities in the United States which stood at 75.2 (on a 100-point scale) in 2018, according to data released by the American Customer Satisfaction Index.
We continue developing products and services that will enable our customers to better manage their power consumption, such as:
• Home Energy Report: We continued to provide our customers with a detailed report of their home energy consumption that includes comparison with other similar homes. The programme has been successful in promoting more efficient energy utilisation, with energy savings of 47,792 MWh achieved (October 2017 - September 2018).
• Making Electricity Visible (MaEVI): We provide interested customers with the option to use MaEVI, our internally developed app based smart home energy management system.
• Energy Management Solutions: We continued to promote the solution to our business customers to help reduce their electricity cost by avoiding surcharges through multiple solutions.
• myTNB mobile app: Downloaded by 540,000 TNB account holders. The app allows our customers to enjoy a seamless experience to interact with us.• TNB Payment Kiosks: We further improved our payment facilities by adding both number of kiosks and number of functions offered.• Full-Fledge Contact Centre: Raising the bar on customer engagement, we upgraded our call centre to become a full-fledge contact centre, known as TNB
CareLine (dial or SMS 15454) which has recently been awarded with 5 Global Business Services Asia Award during the year.
During the year, our Retail Division also carried out a total of 40 engagement sessions on energy conservation with 14,500 stakeholders including government agencies, non-governmental organisations, social and community leaders, universities and school students, as well as TNB staff.
• We partnered with the Malaysian Green Technology Corporation (MGTC) with a target to install up to 10,000 charging stations nationwide; and
• We also adopted the Green Energy Programme (GEP) to drive RE utilisation and energy efficiency for the Senai-Desaru Expressway, together with the Malaysian Industry-Government Group for High Technology and concessionaire Senai-Desaru Expressway Bhd.
OUTLOOK
• In 2019, Retail Division will drive TNB’s aspiration to become the Retailer of Choice;
• We will focus on Winning kWh, Winning Energy, Winning Utilities and Full Suite of Services. The focus into differentiated areas will allow our Retail team to provide greater customer empowerment and choice whilst sustaining and growing in a dynamic and disrupted industry;
• Continue to provide high quality service experience and best innovative solutions to customers with ever changing needs and values;
• Maximise business value by becoming cost leader anchoring on cost-to-serve, cost-to-acquire, cost-to-retain, and cost-to-exit;
• Through a holistic approach on stakeholders engagement and communication, we aim to better communicate with our customers and other stakeholders as well as to continuously promote customer centricity;
• Reskill and develop new retailer key capabilities such as customer experience, marketing, sales, commercial and customer communications through Retail Academy; and
• In anticipation of the increasing shift towards digitalisation, Retail will leverage new agile technologies in delivering digital customer care to adapt towards changing customer expectations.
EXPANDING RE ADOPTION
In 2018, we formed a new subsidiary to drive RE self-generation among Malaysian residents and businesses:
• We established GSPARX Sdn. Bhd. – a wholly-owned subsidiary to provide self-generation/consumption solutions for the customers. Through the new Net Energy Metering (NEM) Scheme and Supply Agreement for Renewable Energy (SARE), GSPARX adds value by providing investment for its Zero Capex solutions for commercial and industrial customers. GSPARX also provides quality solar PV system for residential customers, through cash and loan (leasing) options . To date, some 1.3MWp worth of RE contracts have been confirmed under GSPARX. GSPARX aspires to work with local reputable installers, enabling green prosumers and contributing towards Malaysia’s RE target.

p.30
About TNB
Our Business
Business Context
Performance Review
Sustainability Statement
Governance
Financial Statements
Additional Information
FUTURE PROOF REGULATIONS
OBJECTIVES
Future Proof Regulations strives to enhance the sustainability and competitiveness of the power industry amid an increasingly decentralised, digitalised and decarbonised economy. To this end, we are committed to continuously improve the current Incentive Based Regulation (IBR) Framework for our regulated business in Malaysia based on transparent and efficient tariff design principles.
We also strive to safeguard TNB’s regulatory play in our overseas businesses. We believe in adopting a partnership approach with industry players and regulators to work towards sustaining the industry’s growth and sustainability through effective legislations and market-based policies.
“Future Proof Regulations” strategic driver navigates TNB’s efforts in ensuring the
sustainability of the future market as we move towards a transparent, liberalised and
democratised energy supply market.
DEVELOPMENTS IN FY2018
During the 22nd Conference of the Electric Power Supply Industry (CEPSI) 2018, the Malaysian Government announced the launch of the Government’s reform initiative for the power industry, by reactivating a Government agency, Malaysia Programme Office for Power Electricity Reform (MyPower) under the Ministry of Energy, Science, Technology, Environment and Climate Change (MESTECC).
The Government announced in July 2018 the cancellation of four (4) Independent Power Producer (IPP) projects awarded earlier due to non-compliance of the conditions stipulated. These cancellations are not expected to impact Malaysia’s electricity supply security.
Our Strategy
Inability to mitigate regulatory constraints
Ineffective engagement with stakeholders
Inability to adapt to changing market environment
STRATEGIC RISKS
CEPSI provided the opportunity to showcase our commitment and preparedness for the future to the world.

Integrated Annual Report 2018
Tenaga Nasional Berhad
p.31
About TNB
Our Business
Business Context
Performance Review
Sustainability Statement
Governance
Financial Statements
Additional Information
MALAYSIA FUEL MIX TREND CHART (RM/GJ)
20
5
25
10
30
15
35
40
0
Jan16
Sep16
May16
Jan17
Mar16
Nov16
Jul16
Mar17
May17
Jul17
Sep17
Nov17
Jan18
Mar18
May18
Jul18
Sep18
Nov18
LNG
COAL
PIPED GAS
In line with RP2, Energy Commission (EC) published a revised framework on electricity tariff determination for the Peninsular Malaysia which introduced the implementation of the Annual Regulatory Adjustments, where TNB is required to return to the industry any excess revenue collected. Given this recent regulatory development, it is foreseen that profit in the next two financial years (2nd and 3rd years of RP2) will be lower as compared to 2017 level.
The Government of Malaysia has decided to continue with the implementation of the Imbalance Cost Pass-Through (ICPT) mechanism in the July 2018 and January 2019 cycles. This allowed the pass-through of higher generation costs owing to increased average global fuel prices. The average costs of coal during the two cycles were USD91.66 per MT as of June 2018 and USD97.84 per MT as of December 2018, in comparison with the base cost of USD75 per MT.
2018 also saw concerted efforts by the Malaysian Government to provide a conducive environment to grow renewable energy (RE) through MESTECC’s announcement to push RE generation capacity in Malaysia’s energy mix to 20% by 2025 – equivalent to about 4GW of new RE injection.
In line with the Government’s RE aspirations, MESTECC has announced the following policies:
I. Effective 1 January 2019, the new Net Energy Metering (NEM) scheme will be improved from the net billing concept to the pure net energy metering scheme.
II. The Supply Agreement for Renewable Energy (SARE), which is key in enabling the ‘solar leasing concept’, was introduced to support the growth of retail solar power self-generation in Malaysia.
FY2018 marked the first year under the Second Regulatory Period (RP2), with an annual allowable return of 7.3%, forecast cost of USD75 per metric tonne (MT) for coal, RM24.2/mmBTU - RM27.2/mmBTU for domestic piped gas and RM35/mmBTU for Liquefied Natural Gas (LNG), along with RM18.8 billion for grid investments.
Our Strategy
CEPSI 2018
Attended by more than 2,000 industry delegates and above 4,500 visitors from all over the world, the 22nd installment of CEPSI 2018 was a resounding success.
As the appointed chair (2017-2018) and on behalf of the Association of the Electricity Supply Industry of East Asia and the Western Pacific (AESIEAP), it was our honour to host the conference and concurrent exhibition, themed “Reimagining Utility of the Future”, which took place at the Kuala Lumpur Convention Centre from 17th to 22nd September 2018.
We would like to take this opportunity to thank the Prime Minister of Malaysia, Tun Dr. Mahathir Mohamad, for delivering the special address, and the Minister of MESTECC, Yeo Bee Yin, for her inspiring keynote address. A special thanks also goes to all our partners and sponsors for their generous support, industry captains for their participation, as well as the relevant Government agencies and our employees for making CEPSI 2018 a memorable event.
We are proud to be given the opportunity to gather world-leading figures from more than 30 countries to hold in-depth discussions on industry-defining issues and challenges and to share the latest technological innovations, strategies, and success stories.
OUTLOOK
• Malaysia’s Clean Air Regulations, gazetted in June 2014 is expected to come into force in 2019. All power plants are expected to comply with the revised emission standards set under this new regulation.
• MESTECC will be undertaking a series of open tenders in 2019 to install an estimate 500MW of new RE capacity under the third cycle of the Large Scale Solar scheme.
• TNB’s PAKA GF4 unit (257MW) is expected to retire with its PPA expiring on 31st December 2019.
• TNB is expected to submit its initial IBR RP3 proposal to EC by December 2019 in preparation of the commencement of negotiations in early 2020.

2018 HighlightsFINANCIALCAPITAL
FINANCIAL HIGHLIGHTS
Group revenue for Financial Year 2018, was recorded at RM50.39 billion. This represented a revenue increase of 6.3% compared to financial year ended 31 August 2017 (FY2017), on the back of 2.6% demand growth. Among the main contributors for the growth in the Industrial sector are the Electric and Electronic and paper-based product manufacturing sectors. Meanwhile, the growth in the Commercial sector are contributed by the business and accommodation services sectors.
Group EBITDA for FY2018 was RM13.37 billion with a margin of 26.5%, compared to RM15.47 billion with a margin of 32.6% in FY2017. The decrease was mainly due to higher operational expenses and one-off adjustments.
Group Profit After Tax, or PAT of RM3.75 billion was impacted by Other Regulatory Adjustment which was returned to the industry, forex translation losses and adverse movement in share of losses in associates.
FY2018 saw TNB’s renewable energy portfolio in United Kingdom (through Tenaga Wind Ventures and Vortex Solar), recording favourable performance.
CAPITAL ALLOCATION
TNB has a capital planning and allocation process that is essential in translating TNB’s aspirations into viable achievements.
Through strategic capital allocation framework, the Company’s top management can effectively and efficiently allocate scarce financial resources and make all-important decisions between attaining growth, preserving success and creating sustainable values by balancing the business capital requirements with the stakeholders’ aspirations and expectations.
This capital allocation framework has enabled TNB to:
• Move away from a rigid line by line budget-driven process towards an agile and strategy driven planning process;
• Simplify and reduce time-consuming processes in the preparation of TNB’s annual business plan and budgeting;
• Remain vigilant by continuously streamlining capital spending at lower risk;
• Explore new business segments such as development and investment in renewable energy assets (solar and wind); and
• Increase geographic diversification by exploring opportunities outside Malaysia apart from our existing footprint in the Middle East and Pakistan. TNB has invested in emerging and developing markets such as India and Turkey. Aside from that, TNB has also entered into a developed market in the United Kingdom since 2017.
EBITDA Margin (%)
20
10
40
30
FY2014
28.2
FY2016
33.2
FY2015
32.2
FY2017
32.6
FPE 2017*(Restated)
32.3
FY2018
26.5
0
Debt Maturity Profi le (RM Mil l ion)
2,000
1,000
4,000
3,000
2019 20212020 2022 2023
3,844.6 1,026.4 995.91,670.43,149.1
0
MYR USD JPY GPB PKR
5.3%RM2.53 billion
0.1%RM0.06
billion
1.3%RM0.61 billion
19.3%RM9.21 billion
74.0%RM35.42
billionDebt currency mix
RM47.83 bi l l ion
* Financial Period Ended 31 December 2017
p.32
About TNB
Our Business
Business Context
Performance Review
Sustainability Statement
Governance
Financial Statements
Additional Information
Our Capitals

BORROWINGS
Supported by strong credit rating of AAA rating by RAM, A by Moodys and BBB+ by S&P, TNB has the flexibility to tap funding sources from the capital market, banks and other financial institutions from both domestic and international fronts.
TNB had established a RM5.0 billion Islamic Medium Term Note Sukuk Programme and a USD2.5 billion Multi-Currency Medium Term Note Sukuk Programme to meet its funding requirements. The purposes of both programmes are to fund capex, general corporate purposes and investments. The limits of both Programmes can be increased if there is a requirement in the future.
In addition, various short term banking trade lines had been established with most of the locally domiciled banks in Malaysia, which could form another source of short term funding plan to support TNB’s working capital requirements.
TNB is governed by its Treasury Policy in managing forex and interest rates exposures with the objective to protect TNB group’s profit from material adverse movements due to rates fluctuations. TNB has been managing its short-term forex exposures through hedging a minimum of 50% of known foreign currency exposure up to a 12-month period through forward exchange contracts and natural hedges.
DIVIDEND
In 2017, TNB’s Board of Directors had approved a Revised Dividend Policy where dividends are to be paid out based on 30% to 60% of the TNB Group Consolidated Net Profit Attributable To Shareholders After Minority Interest (PATAMI). The revised TNB’s dividend policy has increased transparency of the dividend pay out to stakeholder.
In compliance to the Companies Act 2016, the management assessed the company’s solvency before making a distribution to the shareholders and its ability to pay its debts as and when debts become due within twelve months immediately after the distribution is made.
Despite the challenges faced in FY2018, TNB has taken a view that the one-off adjustments should not affect the dividend payout. Hence, the adjustments were normalised in order to compute the Adjusted PATAMI.
For FY2018, the Board of Directors had approved a 55.8% dividend payout ratio from the Group Adjusted PATAMI of RM5.42 billion, amounting to RM3.03 billion. This translates to a total of 53.3 sen per share for FY2018, of which 23.0 sen per share will be distributed as the final single-tier dividend.
Total Dividend (RM sen)
2018 Highlights
Dividend distr ibution (%)Interim Final Dividend payout of Group PATAMI
Dividend yield
40
20
80
60
FY2014 FY2016FY2015 FY2017 FPE2017*
FY2018
30
15
60
45
0
17.0
44.0
21.4
10.0
19.0
10.0
19.0
30.3
23.022.0
10.0
FY2017
4.3
50.0
FPE2017*
1.4
44.0
FY2018
3.9
55.8(1)
2.2
FY2016
24.5
FY2015
2.6
26.8
FY2014
2.3
25.3
(1) Dividend Payout of Adjusted Group PATAMI* Financial Period Ended 31 December 2017
0
Integrated Annual Report 2018
Tenaga Nasional Berhad
p.33
About TNB
Our Business
Business Context
Performance Review
Sustainability Statement
Governance
Financial Statements
Additional Information
Our Capitals

p.34
About TNB
Our Business
Business Context
Performance Review
Sustainability Statement
Governance
Financial Statements
Additional Information
MANUFACTURED CAPITAL
Assets Key Activities In 2018 Outlook
Power Generation Assets
TNB generation assets consist of:
• 5 coal fired plants• 14 gas fired plants• 24 distillate fired plants• 128 non-carbon plants
of various technologies (hydro, solar, and wind)
• ISO 55001 certification has successfully been renewed for TNB’s wholly-owned domestic plants
• Performance of TNB’s peninsular plants continue to improve with a 4% increase in overall average plant availability
• Successful completion of acquisition of 20.88MW wind capacity• Successful COD of TNB’s pioneer Large Scale Solar plant in Sepang,
Selangor• Completion of initial phase of generation transformation programme• Upgrading of TNB’s current domestic power plants in meeting emission
levels set out in the Clean Air Regulation 2014
• Commencement of Large Scale Solar plant construction in Bukit Selambau
• Expansion of current generation leadership development programme to create new batch of architect level leaders
• Continued construction of Jimah East Power (2,000MW) which is currently at 98.1% project progress and is expected to meet its target COD in June 2019
• Continued construction of SPG (1,440MW) which is currently at 73.7% project progress and is expected to meet its target COD in July 2020
Power Network Assets
TNB network assets consist of:
• 25,971 circuit km of Transmission network
• 488 Transmission substations
• 682,393.0 circuit km of Distribution network
• 89,284 Distribution substations
• Maintained domestic networks at world-class performance with transmission system minutes of 0.35, and distribution SAIDI of 48.22
• Successfully completed RM6.372 billion worth of network enhancement in 2018 as allocated under the current regulatory period. Amongst the assets constructed are:
- 19,506.0 km of networks, and construction of 1,877 new substations to better serve domestic customers- Installation of 160,000 smart meters in line with Government target of having 1.5 million smart meters by 2020- SCADA-risation of 3,672 distribution substation in line with initiatives of building the Grid of the Future
• Implementation of Asset Performance Management System ensuring holistic management of assets through its life cycle
• Review of the current Grid Strategic Plan that will cater to the enhancement to TNB’s transmission grid over the next 10 years
• Successful deployment of TNB’s geospatial information system to three (3) regions, Kuala Lumpur, Kuala Selangor and Putrajaya that will enhance network planning activities
• Continued deployment of smart meters in large city centres in Peninsular Malaysia
• Establishment of a Grid Academy that will look to improve Grid leadership and management capabilities
• Implementation of Grid Digitalisation transformation programme that was approved in 2018, along four (4) focus areas:
- Digital Empowered Workforce,- Intelligent Asset Management,- Intelligent Grid Operation, and- Grid Insight & Innovations.
Non-Power Assets
Amongst non-power assets managed by TNB are:
• TNB manages over 5.8 million square feet of office and operational work spaces
• TNB manages over 16,000 km of fibre optic network
• TNB manages over 4,100 vehicles
• Establishment of REVD, entity within TNB specific to manage and optimises savings from TNB’s real estate assets
• Laid over 700 km of fibre optic cable as part of TNB’s power network extension
• Conducted high speed broadband pilot using TNB’s fibre optic cable in line with Government’s National Fiberisation and Connectivity Plan (NFCP) in Jasin, Melaka involving 1,100 homes
• Commencement of TNB HQ campus development works
• Continued development of TNB HQ campus
• Enhancement of TNB’s integrated facilities management and real estate project management control to unlock value and optimise savings
• Complete NFCP pilot trial
Our Capitals

Integrated Annual Report 2018
Tenaga Nasional Berhad
p.35
About TNB
Our Business
Business Context
Performance Review
Sustainability Statement
Governance
Financial Statements
Additional Information
2018 Highlights
FY2018
FY2018
FY2017
FY2017
FY2016
FY2016
FY2016 FY2016FY2017 FY2017FY2018 FY2018
120%
12.0
6.0 120.060 600
100%
10.0
5.0 100.050 500
80%
8.0
4.0 80.040 400
60%
6.0
3.0 60.030 300
40%
4.0
2.0 40.020 200
20%
2.0
1.0 20.010 100
89.988.588.1
73.379.778.7 80.7
91.587.3
1.5
43.0
11.0
25.30.2 0.4
48.2
50.2
49.7
Equivalent Availability Factor (EAF)
Equivalent Unplanned Outage Factor (EUOF)
System Minutes & System Average Interruption Duration Index (SAIDI)
Peninsular Malaysia Sabah (SESB)
SabahPeninsular Malaysia(1) International(2)
SabahPeninsular Malaysia(1) International(2)
(1) Performance of TNB’s wholly-owned power plants in Peninsular Malaysia(2) Performance of TNB’s wholly-owned power plants internationally
(1) Performance of TNB’s wholly-owned power plants in Peninsular Malaysia(2) Performance of TNB’s wholly-owned power plants internationally
System Minutes SAIDI
Our Capitals
267.9
262.7
351.0
0
3.22.7
4.4
2.9
4.94.8
10.29.6
10.4
0.0 00.0 0
0%

About TNB
Our Business
Business Context
Performance Review
Sustainability Statement
Governance
Financial Statements
Additional Information
p.36
NATURALCAPITAL
Approach Key Activities In 2018 Outlook
Protecting our natural heritage
TNB takes responsibility in protecting and preserving the flora and fauna associated with our activities
• Monitoring of IUCN red list occupants within our power plant operating area• Conducted 18 biodiversity programmes within our Hulu Terengganu
hydroelectric station area• Conducted 11 biodiversity programmes within our Sungai Perak hydroelectric
station• Partnership with National Hydraulic Research Institute of Malaysia
(NAHRIM) to enhance water management at Sungai Perak and Cameron Highlands
• Protection programme for Kelah fish resources and Rafflesia plants within the Royal Belum State Park
• Continued adoption of ISO 14001 standards in the operations of our domestic plants
• Continued protection, restoration, and recovery of natural capital surrounding our area of activities
Combatting climate change
TNB is committed towards a low carbon economy by embracing and supporting renewable energy generation and reduction of both GHG and non-GHG emissions
• 1% reduction in GHG emission per MWh produced in 2017 compared with previous year
• Continued upgrading of TNB conventional power plants to be in line with the Clean Air Regulations 2014 that is expected to be enforced in July 2019
• Increased of emission-free capacity by 1.69%, with the acquisition of GVO Wind Ltd and Bluemerang Capital Ltd
• Timely completion of our first Large Scale Solar• Continued retrofitting of TNB offices to improve building energy efficiency
and management• Continued implementation of our Home Energy Report programme that has
resulted in a carbon emission avoidance of 33,168 tonnes CO2 emissions• Continued development of internal online GHG emission management
system that is expected to go live in 2019
• Increase emission-free capacity both domestically and internationally
• Completion of online GHG emission management system
• Completion of plant upgrading in line with Clean Air Regulations 2014
Sustainable business practices
TNB is committed to continuously improve our operational performance, energy efficiency, stakeholder engagement and management of natural resources
• Continuous improvement of our operational efficiencies• Establishment of a TNB Green Energy Development Fund (TGEDF) with
clear terms of reference and implementation mechanism. The TGEDF is established to create and explore opportunities aimed at minimising the environmental impact of our business. As of December 2018, TGEDF has approved RM13 million to fund the exploration of six (6) such opportunities
• Continuous engagement with relevant stakeholders to mitigate concerns and impact of any environmental incident associated with our activities
• Preparation of Sustainability Report 2017
• Continuous communication of environmental performance, development and methodology
Our Capitals

About TNB
Our Business
Business Context
Performance Review
Sustainability Statement
Governance
Financial Statements
Additional InformationIntegrated Annual Report 2018
Tenaga Nasional Berhad
p.37
2018 Highlights
Our Capitals
CO2 Emission Intensity GHG Emissions Intensity (tCO2e/MWh)Total TNB GHG Emissions (mtCO2e) Net Power Generation (TWh)
FY2014 FY2016
Financial Year
FY2015 FY2017
0.0
10.5 0.1
20.5 0.2
30.5 0.3
40.5 0.4
50.5 0.5
60.5 0.6
70.5 0.7
22.7
0.56
39.3
0.55 0.54
23.9
29.1 33.5
GH
G E
mis
sio
ns
(mtC
O2e
) an
dN
et P
ow
er G
ener
atio
n (
TW
h)
GH
G E
missio
ns p
er Po
wer G
eneratio
n(E
missio
n In
tensity) (tC
O2 e/M
Wh
)
43.8
60.9
0.54
0.0
51.8
in part due to our renewable generation sources
5,030,079.7 tCO2e mitigated

About TNB
Our Business
Business Context
Performance Review
Sustainability Statement
Governance
Financial Statements
Additional Information
p.38
INTELLECTUALCAPITAL
Management Approach Key Activities In 2018 Outlook
Research and development
Continued support of technological advancement through research and development
• Investment of more than RM117 million in R&D for 2018, focusing on renewable energy and environment, conventional generation, and grid networks
• Launched collaboration between TNB Research (wholly-owned subsidiary of TNB) and Institute of Technology Petronas which look to explore joint research and development in the energy sector
• Collaboration between TNB Research and Malaysian Global Innovation & Creativity (MaGIC) with the aim of building a healthy micro-ecosystem for the electricity supply industry
• Continued investment in research and development as one of the key enablers in addressing the challenges facing the industry
Operational and service innovations
Explore and develop innovations that will optimise TNB’s operations, enhance asset management, and reduce operation and maintenance costs
Development of new products and services for both regulated and non-regulated business
• Successfully completed eight (8) strategic Proof of Concept (POC) innovations on the application of emerging technologies such as blockchain, augmented reality and robotics which have potential of delivering RM3.8 million cost savings per annum
• Introduction of new retail products/services to promote energy efficiency • Implementation of centralised billing has led to timely end-to-end billing
management
• Exploring retail energy marketplace model with the aim of delighting our end customer
• Develop initial sustainable products/services for TNB Smart City solution
• Collaborate with local university (Universiti Tenaga Nasional) to establish a Smart Campus
Technology and business model innovations
Invest in incubating applications of new technology and disruptive business model, from both internal and external sources
• Establishment of Business Innovation Incubator (BII) entity with the purpose to incubate innovation and launch start-up prototypes with a focus on commercialisation at scale
• Establishment of internal committee to evaluate and endorse high-impact innovation proposals
• Endorsement of four (4) high-impact innovation proposals for incubation by BII
• Establishment of a simplified internal innovation framework that is aimed at increasing crowdsourcing of ideas and shortening steps from ideation to actualisation
• Appointment of a venture capital partner for innovation investment in the energy sector
• Increasing the number of high impact proposal under incubation
Our Capitals

About TNB
Our Business
Business Context
Performance Review
Sustainability Statement
Governance
Financial Statements
Additional InformationIntegrated Annual Report 2018
Tenaga Nasional Berhad
p.39
R&D investment over the last 5 years (mi l l ion) Breakdown of R&D investment by research areas
40
20
100
120
80
60
117.4
FY2018
117.4
FY2017
105.7
FY2016
72.9
FY2015
59.6
FY2014
2018 Highlights
Listing of sample R&D projects
Research Areas Key Projects
Renewable energy and
environment
• Project on developing a technically, economically and environmentally feasible floating solar photovoltaic
system for domestic implementation
• Development of suitable carbon material use to improve the capturing of GHG emission in coal power
plants
• Design, development and commercialise improved impulse hydro turbine capable of higher turbine
efficiency
• Develop active management of distribution network with distributed renewables as a Distributed
Generation model
Conventional thermal generation • Development of conventional thermal boiler profile to further optimise performance and efficiency
• Optimisation of coal management systems to improve coal condition and transportation
• Development of improved dynamic cooling model for gas turbine power plants
• Development of model aimed at optimising power generation costs, energy conversion efficiency and
GHG emission
Grid network • Feasibility study on portable earthing for deployment of mobile substations
• Economic study on optimisation network performance vs asset life cycle cost for medium voltage
equipment
• Development of IEC 61850 Specification and Guidelines for the Implementation of Substation Protection,
Automation and Control Systems for local implementation
• Pilot implementation of internally developed demand response mechanism for local deployment
Grid network52%
Conventional thermal generation32%
Renewable energy & environment
16%
R&D investment by
research areas
Our Capitals
0

About TNB
Our Business
Business Context
Performance Review
Sustainability Statement
Governance
Financial Statements
Additional Information
p.40
HUMANCAPITAL
Management Approach Key Activities In 2018 Outlook
Human resource management
Development of a more strategic and data-driven HR function through creation of new Data Analytics functions within HR’s Centre of Expertise
Deployment of HR Business Partners for each business line to facilitate strategic partnership between HR and the business
Centralisation of HR shared services within TNB Global Business Solutions entity to unlock efficiency and productivity gains
• Review of critical HR processes to facilitate the operationalisation of HR shared services by TNB Global Business Solutions
• Successful migration of HR shared services functions from Group HR to TNB Global Business Solutions
• Full implementation of People-Matters Better Brighter online talent management to cater for HR services from hire to retire
• Successful migration of TNB medical benefits management from external provider to internal team
• Establishment of HR Analytics team
• Developing HR mid-term and long term strategy (2020-2025) to ensure alignment to the new operating model
• Embark on a HR culture transformation throughout TNB
• Promote a Data Driven HR through analytics capability development programmes
• Establishing the necessary data governance framework and ICT tools as analytics enablers
Safe and healthy work environment
Ensure the safety of individuals at TNB facilities and areas of activities
Develop a health and safety generative culture that is aimed to achieve zero accident
Foster a culture of global preventive health activities amongst employees
• Introduction of Tenaga Safety Culture which emphasises practicing safety as a way of life
• Strengthening the enforcement of TNB’s Life Saving Rules introduced in 2017
• Development of an internal HSE platform that will allow for centralisation of HSE monitoring and tracking
• Successful accreditation of eight (8) cafeterias within Company premise as “Healthy Cafeterias” by Minister of Health to ensure provision of nutritious food based on the Malaysian Dietary Guidelines and Recommended Nutrient Intake
• Continued promotion of corporate weekly wellness hour and annual staff wellness check-up
• Enhancement of our internal HSE platform to enable more functions and services to be provide
• Continuous efforts to improve the safety awareness and practices amongst employees and contractors working within our premises
• Development of internal ergonomics guidelines
Talent management and development
Maintain core competencies and building new capabilities in the areas of new technology and innovations
Building leadership capabilities at every level anchored on the TNB leadership values of ‘Future, Engage, and Deliver’
• Recruitment of the right talents with the right values locally and globally
• Development of talents through numerous technical and functional training programmes attended by more than 70% of our employee in 2018
• TNB leadership talents had undergone 2,486 training hours in 2018 focused on enhancing their leadership capabilities
• Progress 1,300 employees through our Upward Mobility programme in which we provide employees with the opportunity to upgrade their qualification from a high school leaver to a degree or equivalent industrial certification holder
• Continued support for the development of Malaysian graduates through participation in SL1M internship programme. TNB enrolled 880 graduates into our SL1M development programme in FY2018
• Expansion of our Leadership Drive programme to include junior manager level
• Enhancement of our corporate MBA programme and expansion of our leadership development programme
• Enhancement of leadership development programme to help our leaders embrace global disruptions
Our Capitals

About TNB
Our Business
Business Context
Performance Review
Sustainability Statement
Governance
Financial Statements
Additional InformationIntegrated Annual Report 2018
Tenaga Nasional Berhad
p.41
2018 Highlights
Annual Lost Time Injury Frequency (LTIF)
1
2
3
1.1 1.4 2.1
FY2016 FY2018FY2017
LTIF by business activities
GENERATION: 1.6
TRANSMISSION: 3.1
DISTRIBUTION: 1.1
RETAIL: 6.9
OTHERS: 1.2
HR Breakdown by Generation* HR Breakdown by Gender
12,000
6,000
24,000
18,000
12 1
Senior Management
22,5874,131
Non-Executives
5,2063,235
Executives
331 71
Management
10,000
5,000
20,000
15,000
799 101
Gen Z
2,978444
Baby Boomers
6,8252,029
Gen X
17,5344,864
Millennials
Men Women Men Women
Our Capitals
Training Hours Breakdown by Function Upward Mobil i ty Programmes’ Graduates
Senior Management
92.3%Average training hours per
employee: 15.4 hours
Executives
77.6%Average training hours per
employee: 24.7 hours
Management
81.5%Average training hours per
employee: 15.3 hours
Non-Executives
68.3%Average training hours per
employee: 17.2 hours
EMPLOYEE TRAININGTechnician career development programme
1,173
Clerical career development programme
97
Technician degree programme
20Clerical degree
programme
13
Steam engineer programme
30
0 0
0
* Baby Boomers (> 55 years old), Gen X (40-55 years old), Millennials (24-39 years old) and Gen Z (<24 years old)

p.42
About TNB
Our Business
Business Context
Performance Review
Sustainability Statement
Governance
Financial Statements
Additional Information
SOCIAL AND RELATIONSHIPCAPITAL
BUILDING TRUST AND CREATING VALUE
Forming strong societal connections based on shared values of trust, credibility, and reliability are core to TNB’s continuous efforts in building social capital with our various stakeholders, who are at the heart of our value-creation process.
We continuously communicate, engage, and initiate outreach to our network of stakeholders – from communities residing near our power plants and our customers to the authorities and non-governmental organisations (NGOs) – to enable opportunities to collaborate, develop co-ownership, and generate shared experiences within which good faith and trust are further strengthened.
Developing strong relationship premised on shared values, concerns, and interests of all our stakeholders are central to who we are, what we do, and how we make our decisions.
TRANSFORMING THE COMMUNITY
As a caring business that has been powering the Nation’s progress for the past seven (7) decades, it is our purpose to support the sustainable development of the communities within which we operate. TNB’s community-building and community investment efforts encompass the following areas:
• Education;• Environmental protection and biodiversity conservation; and• Sustainable economic growth and social development.
In times of rapid societal changes and unsettling disruptions caused by technological advances, shifts in economic hierarchy, and climate change, the accelerated widening of social gaps calls for strategic interventions from both the public and private sectors – to mitigate the effects of income inequality and ensure greater social mobility, while enhancing social integration.
This is what TNB has always been focusing on playing our role to help the less privileged, so they in turn can help themselves. In doing so, we aspire to create
better, brighter lives that contribute to the betterment of our society. To this end, we have set up initiatives to support youth advancement that will enable them to be more upwardly mobile, regardless of background, race, religion, or gender.
Good education can transform lives. We believe our social aspirations can be achieved by enabling more disadvantaged youths to gain access to quality education.
TNB’s efforts in ensuring equitable access to quality education, especially among youths and young children from vulnerable and lower-income in line with the global sustainable development agenda, particularly, Goal Four: Quality Education, under the 2030 Agenda for Sustainable Development by the United Nations.
Through the various education support programmes, scholarships, financial assistance, and school adoption initiatives carried out by TNB, we hope that by 2030, we would have played a part in helping to ensure equal access to affordable technical, vocational and tertiary education for all young Malaysians – including persons with disabilities, indigenous people, and the underprivileged.
STAKEHOLDER GROUPS
More information on our Stakeholder Engagement efforts and how we respond to stakeholder concerns can be found in our Sustainability Statement within this Integrated Annual Report, and our upcoming Sustainability Report 2018.
CUSTOMERSOur customers comprise domestic, commercial, and industrial customers, including the Government, Small & Medium-Sized Enterprises (SMEs) and large corporations.
GOVERNMENTThe Malaysian Federal and State Governments, parliamentarians, municipal and district councils, and regulators.
INVESTORSInstitutional and retail investors, analysts, business partners, and potential investors with interest.
EMPLOYEESOur 35,574 employees throughout TNB Group(Full-time employees excluding contractors.)
COMMUNITIESLocal communities in
or near areas where we operate including
those affected by our operations.
VENDORS4,665 contractors and suppliers.
TRADE-UNIONSThree (3) registered unions and two (2) workers’ associations that cover all categories of staff.
Our Capitals

Integrated Annual Report 2018
Tenaga Nasional Berhad
p.43
About TNB
Our Business
Business Context
Performance Review
Sustainability Statement
Governance
Financial Statements
Additional Information
• Back-to-School Programmei. Through this programme, TNB helped B40 families prepare their children for the new schooling year by providing primary school students with the
necessary school supplies such as uniforms, stationery sets and school bags.ii. More than 13,000 primary students across 50 locations nationwide benefited from this programme in FY2018.
• Dermasiswa My Brighter Future (MyBF) Programmei. A landmark programme launched in 2018 targeting B40 students that have secured placement in Science, Technology, Engineering,
and Mathematics (STEM) or Technical and Vocational Education and Training (TVET) courses in Malaysian public universities.ii. Sponsorship provided includes tuition fees, board and lodging, and contributions to support the students’ family to ensure that they
need not have to seek employment while studying to help supplement their parents’ income.iii. A total of 945 students were beneficiaries of the Dermasiswa MyBF Programme in 2018.
• Trust School Programmei. This programme, conducted jointly with Yayasan AMIR and the Ministry of Education is aimed at developing the quality leadership and management in
participating schools. ii. Each adopted school’s teaching personnel are also exposed to new methods and techniques to make teaching and learning more engaging. It is the
intent of this programme that by helping to improve the school’s leadership, management, and teaching capabilities, the efforts will translate into a better learning experience for the students, and ultimately leading to better schooling experiences.
iii. Currently TNB has committed to adopt eight (8) Trust Schools with a total teacher and student population of over 500 and 6,715, respectively.
• Pintar School Programmei. Through this programme in collaboration with PINTAR Foundation TNB helps selected school organised motivational and leadership programmes for
students and teachers, and education support programmes such as tuition classes, and examination clinics for the students.ii. TNB committed to adopt a new batch of 18 schools nationwide in FY2017 for the next three (3) years, bringing the total adopted schools to 58
nationwide.
• Yayasan Tenaga Nasional (TNB Foundation) Scholarships and Financial Assistance Programmei. We have an annual commitment of RM50 million to develop the future leaders of our nation by enabling bright young Malaysians to pursue their tertiary
education in local and foreign universities. ii. We are proud to be able to provide 1,974 students with scholarships and financial assistance needed to pursue their aspirations in 2018.
Education Programmes
For more information about our environmental and biodiversity, as well as community investment and social development programmes, please refer to our Sustainability Statement on pages 66 to 96 or our upcoming Sustainability Report 2018.
“This year, I received another offer from the same university and this time, it came with a TNB
scholarship. The happiness I felt was just overwhelming.”
Heena Niesha Bella Ravindran
“I was at a loss when I received an offer to further my studies as I knew my parents, who did not
work, could not afford it. This changed when I was offered the scholarship, which really came at an opportune time.”
Ken Ak Abam
“When I first received the letter, I was a little shocked and unsure of what to think as I had
not applied for it. After speaking to YTN, my feelings turned to gratitude as this meant I could now focus on my studies…”
Leong Kah Yau
“My parents were surprised and thankful for this unexpected blessing. I will strive to do the
best in my studies and I will not be asking for money from my family in kampung.”
Nur Aleefah Shuhadah Azhar
WIDENING OUR SOCIAL CIRCLE
The advent of information technology and development of sophisticated smart wireless devices has given rise to opportunities to use social media as a vehicle for better recognising the values, reaching out, and engaging a wider spectrum of stakeholders. Effective social media strategy employed during the year saw TNB’s social media platforms gaining further traction with sizable organic growth in the number of followers to:
Notable achievements for our festive campaigns in FY2018 include being conferred top honours in the ‘Long-Form Storytelling’ and ‘YouTube Ad of the Year’ categories, of the ‘YouTube Top Ads in Malaysia 2018 Awards’.
+30,340 followers +3,310 followers+6,660 followers
Our Capitals

p.44
About TNB
Our Business
Business Context
Performance Review
Sustainability Statement
Governance
Financial Statements
Additional Information
OUR SCORECARD
31.8.2014 31.8.2015 31.8.2016 31.8.2017 31.12.2017 31.8.2018
Return on asset 6.2% 6.6% 6.4% 5.4% 5.3%(6) 3.2%
Generation market share(1) 47.0% 48.0% 52.3% 52.3% 50.6% 49.9%
Customer satisfaction index(1) 7.6 8.0 8.1 8.1 N/A(5) 8.1
Corporate reputation index(3) 74% 76% 82% 81% N/A(5) 88%
Cost per unit(1) 36.30
sen/kWh
35.10
sen/kWh
34.20
sen/kWh
36.60
sen/kWh
37.30
sen/kWh
39.20
sen/kWh
Equivalent availability factor(2) 85.51% 88.76% 88.08% 88.51% 84.96% 89.92%
Equivalent unplanned outage factor(2) 7.09% 3.85% 4.44% 2.69% 4.46% 3.24%
Transmission system minutes(1) 0.13
minute
0.77
minute
1.47
minute
0.23
minute
0.05
minute
0.35
minute
System average interruption duration index(1)
(SAIDI) minutes/customer/year 55.00 49.66 49.71 50.24 18.05 48.22
Transmission losses(1) 1.63% 1.47% 1.28% 1.29% 1.30% 1.43%
Distribution losses(1) 6.52% 6.21% 6.11% 6.21% 6.13% 6.62%
Employee engagement score(4) 85% 85% 89% 89% N/A(5) 86%
(1) For Peninsular Malaysia only.
(2) Including TNB’s wholly-owned generating capacity in Peninsular Malaysia.
(3) TNB did not conduct any Corporate Reputation Index prior to FY2014.
(4) TNB conducts its employee engagement survey biennially. The scores for both FY2016 and FY2017 are based on survey conducted in FY2016.
(5) The respective surveys was not conducted during this 4-month Annual Report period.
(6) Financial Period Ended 31 December 2017 (Restated)
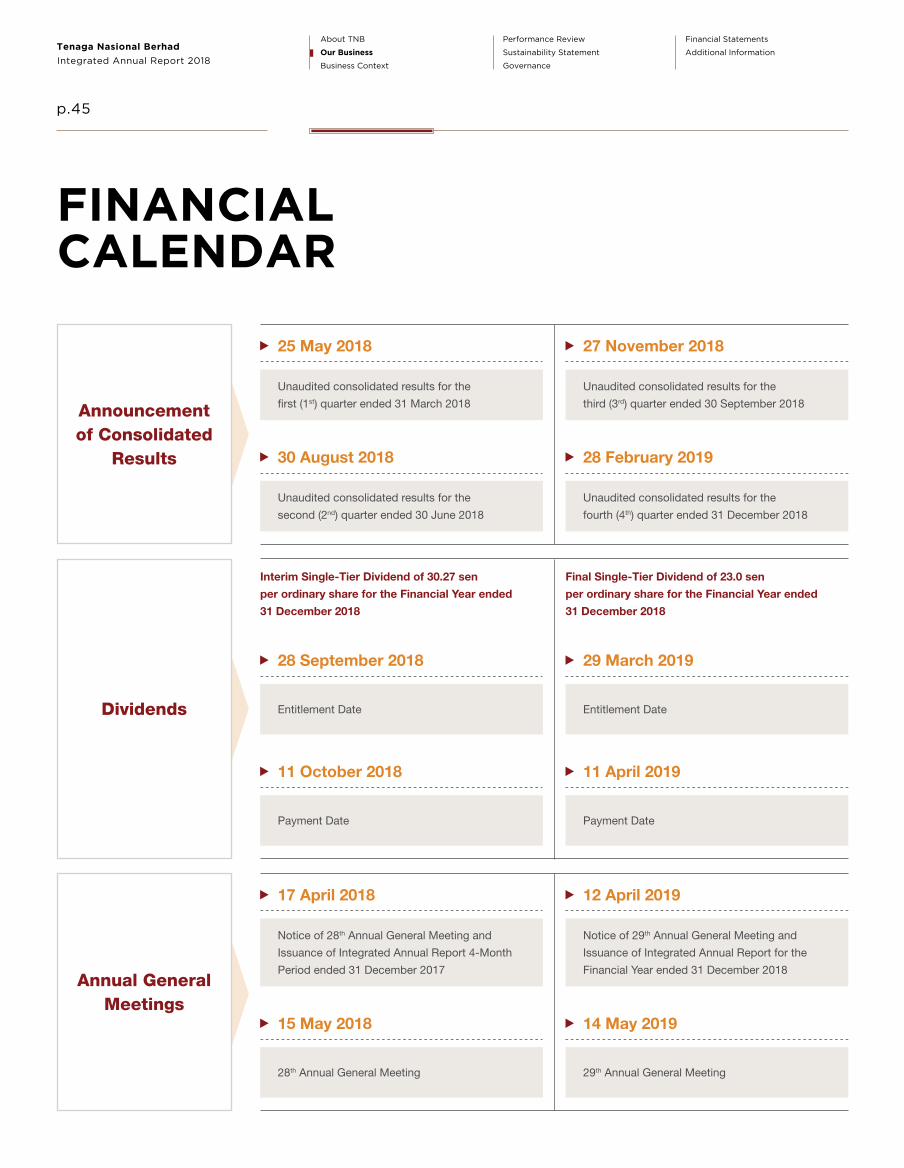
Integrated Annual Report 2018
Tenaga Nasional Berhad
p.45
About TNB
Our Business
Business Context
Performance Review
Sustainability Statement
Governance
Financial Statements
Additional Information
FINANCIAL CALENDAR
Announcement of Consolidated
Results
25 May 2018
Unaudited consolidated results for the
first (1st) quarter ended 31 March 2018
27 November 2018
Unaudited consolidated results for the
third (3rd) quarter ended 30 September 2018
30 August 2018
Unaudited consolidated results for the
second (2nd) quarter ended 30 June 2018
28 February 2019
Unaudited consolidated results for the
fourth (4th) quarter ended 31 December 2018
Annual General Meetings
17 April 2018
Notice of 28th Annual General Meeting and
Issuance of Integrated Annual Report 4-Month
Period ended 31 December 2017
12 April 2019
Notice of 29th Annual General Meeting and
Issuance of Integrated Annual Report for the
Financial Year ended 31 December 2018
15 May 2018
28th Annual General Meeting
14 May 2019
29th Annual General Meeting
Dividends
28 September 2018
Entitlement Date
29 March 2019
Entitlement Date
11 October 2018
Payment Date
11 April 2019
Payment Date
Interim Single-Tier Dividend of 30.27 sen
per ordinary share for the Financial Year ended
31 December 2018
Final Single-Tier Dividend of 23.0 sen
per ordinary share for the Financial Year ended
31 December 2018

p.46
About TNB
Our Business
Business Context
Performance Review
Sustainability Statement
Governance
Financial Statements
Additional Information
INVESTOR RELATIONS
Proactive engagement with the investment community
Transparency in disclosing material information
Our Investor Relations (IR) team strives to provide our stakeholders with timely updates on TNB’s business strategy, growth
direction and latest developments.
In FY2018, various engagement and communication activities were carried out to develop a positive relationship with our existing and potential investors.
These activities include our quarterly and full-year financial results announcements, Investor Relation programme, as well as one-on-one and group
meeting engagement sessions with investors and analysts.
To ensure that we receive appropriate feedback and sustain our excellence service to the investment community, we conduct our IR Annual Survey
regularly to gauge the team’s performance, as well as investors’ satisfaction level towards our performance.
We are committed to deliver timely, accurate and transparent disclosures on material corporate updates to our shareholders and
the investment community. We also benchmark our processes and internal controls against global best practices in key areas,
including upholding high ethical values in handling information disclosure.
This is vital in shaping investors’ positive perception on the Group’s accountability, transparency and efficiency. In doing so, we aim to develop a close
rapport with our investment community to enable a better understanding of our business, strategy and performance.
As part of continuous improvement, we consistently strive to enhance the delivery of our material disclosures to ensure the stakeholders are well informed
on the latest developments in financial performance, local and international business performance, relevant environmental, social and governance (ESG)
practices and other related matters.
We maintain strong links with our 26 sell-side research analysts and four (4) credit rating agencies to ensure information outflow to the market is accurate
and consistent with the Group’s views and performance.
461(FY2017: 454)
NUMBER OF ENGAGEMENTS HELD
81.6%(FY2017: 81.7%)
IR ANNUAL SURVEY SCORE
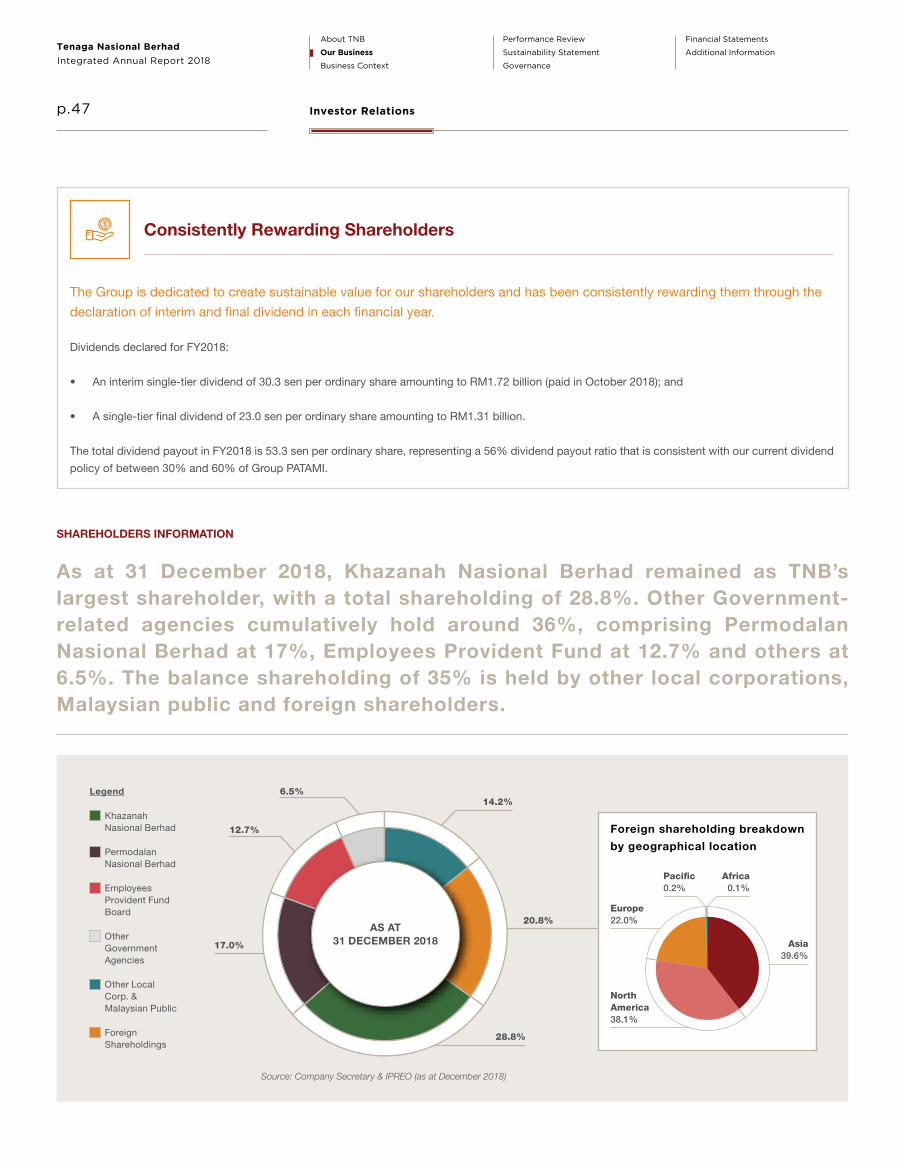
Integrated Annual Report 2018
Tenaga Nasional Berhad
p.47
About TNB
Our Business
Business Context
Performance Review
Sustainability Statement
Governance
Financial Statements
Additional Information
Consistently Rewarding Shareholders
The Group is dedicated to create sustainable value for our shareholders and has been consistently rewarding them through the
declaration of interim and final dividend in each financial year.
Dividends declared for FY2018:
• An interim single-tier dividend of 30.3 sen per ordinary share amounting to RM1.72 billion (paid in October 2018); and
• A single-tier final dividend of 23.0 sen per ordinary share amounting to RM1.31 billion.
The total dividend payout in FY2018 is 53.3 sen per ordinary share, representing a 56% dividend payout ratio that is consistent with our current dividend
policy of between 30% and 60% of Group PATAMI.
Investor Relations
As at 31 December 2018, Khazanah Nasional Berhad remained as TNB’s largest shareholder, with a total shareholding of 28.8%. Other Government-related agencies cumulatively hold around 36%, comprising Permodalan Nasional Berhad at 17%, Employees Provident Fund at 12.7% and others at 6.5%. The balance shareholding of 35% is held by other local corporations, Malaysian public and foreign shareholders.
SHAREHOLDERS INFORMATION
Foreign shareholding breakdown
by geographical location
Khazanah Nasional Berhad
Legend
Permodalan Nasional Berhad
Employees Provident Fund Board
Other Government Agencies
Other Local Corp. & Malaysian Public
Foreign Shareholdings
28.8%
20.8%
17.0%
14.2%6.5%
12.7%
AS AT 31 DECEMBER 2018
Europe22.0%
North America38.1%
Africa0.1%
Pacific0.2%
Source: Company Secretary & IPREO (as at December 2018)
Asia39.6%

p.48
About TNB
Our Business
Business Context
Performance Review
Sustainability Statement
Governance
Financial Statements
Additional Information
CALENDAR OF IR EVENTS IN FY2018
Investor Relations
TNB SHARE PRICE, FBM KLCI INDEX AND VOLUME TRADED IN FY2018
16.50
KLCI Index
16.001900.00
15.50
1850.00
15.00
1800.00
14.50
1750.00
140.0
1700.0013.50
13.00
12.50
1950.00
1650.00
1600.00
Volume Traded (mn)
60.0
40.0
20.0
0.0
Jan18 May18 Sep18Mar18 Jul18 Nov18Feb18 Jun18 Oct18Apr18 Aug18 Dec18
Highest: RM16.24, 30/3/18
Lowest: RM12.70, 18/12/18
Analyst Briefing PE Ended Dec’17
28 Feb’ 18
Analyst Briefing 3Q FY’18
27 Nov’ 18
Analyst Briefing 2Q FY’18
30 Aug’ 18
Analyst Briefing 1Q FY’18
25 May’ 18
Analyst Briefing 1Q PE Ended Dec’17
26 Jan’ 18
CIMB 10th Malaysia
Corporate Day (Kuala Lumpur)
4 JANUARY 2018
Daiwa Capital Market
(Japan)
8 - 9 MARCH 2018
Credit Suisse Investment Conference(Hong Kong)
20 - 21 MARCH 2018
Maybank Invest Asia
(London)
21 - 22 JUNE 2018
Macquarie NDR
(New York, Boston & San Francisco)
16 - 18 JULY 2018
Sultan Mahmud
Hydro Power Plant Site Visit
(Kenyir, Terengganu)
7 AUGUST 2018
Share Price (RM)

Integrated Annual Report 2018
Tenaga Nasional Berhad
p.49
About TNB
Our Business
Business Context
Performance Review
Sustainability Statement
Governance
Financial Statements
Additional Information
Pro
per
ty L
ist
Gro
up
LAN
DB
UIL
DIN
GS
Leas
eho
ldFr
eeho
ldTo
tal
No
.
Bui
lt-U
p
Are
a
(sq
M)
Tota
l
NB
V
(RM
’000
)
No
.
of
Lots
Are
a
(sq
M)
NB
V
(RM
’000
)
No
.
of
Lots
Are
a
(sq
M)
NB
V
(RM
’000
)
No
.
of
Lots
Are
a
(sq
M)
NB
V
(RM
’000
)
(1)
(2)
(3)
(4)
(5)
(6)
(1+
4)(2
+5)
(3+
6)(1
0)(1
1)(1
2)
LOC
AT
ION
Per
lis 5
0 1
56,9
76
1,8
33
439
8
8,18
3 1
1,63
1 4
89
245
,159
1
3,46
4 7
4 1
1,36
9 2
1,26
0
Ked
ah 2
98
1,0
56,6
63
13,
745
692
9
38,4
62
55,
188
990
1
,995
,125
6
8,93
3 3
75
139
,930
2
18,2
15
Pul
au P
inan
g 1
95
719
,709
6
3,21
2 6
76
985
,302
7
9,67
0 8
71
1,7
05,0
11
142
,882
3
46
135
,470
8
59,2
89
Per
ak 7
95
6,1
64,6
65
334
,582
6
67
4,4
32,9
22
311
,365
1
,462
1
0,59
7,58
7 6
45,9
47
951
6
91,7
89
2,7
58,9
40
Sel
ang
or
985
1
1,81
9,66
9 5
01,8
95
1,4
58
2,6
01,8
98
550
,954
2
,443
1
4,42
1,56
7 1
,052
,849
1
,670
7
40,6
44
2,2
68,9
22
W. P
erse
kutu
an 3
84
297
,326
6
7,71
6 5
65
630
,249
1
91,9
34
949
9
27,5
75
259
,650
5
80
274
,895
7
19,2
71
Put
raja
ya/C
yber
jaya
8
588
,797
1
3,78
7 1
5 1
,554
1
,693
2
3 5
90,3
51
15,
480
62
8,5
81
39,
538
N. S
emb
ilan
284
2
,066
,500
7
9,65
6 5
51
1,1
54,8
14
76,
788
835
3
,221
,314
1
56,4
44
261
4
59,9
68
507
,761
Mel
aka
360
6
40,6
41
23,
478
460
2
51,6
96
160
,530
8
20
892
,337
1
84,0
08
90
161
,746
1
87,2
41
Joho
r 9
61
3,4
44,0
31
419
,804
1
,153
1
,005
,893
2
07,3
54
2,1
14
4,4
49,9
24
627
,158
5
45
260
,203
8
09,9
00
Pah
ang
380
1
,319
,143
5
0,57
2 5
40
919
,194
8
3,81
0 9
20
2,2
38,3
37
134
,382
5
08
278
,694
3
,663
,827
Tere
ngg
anu
367
2
,583
,865
3
9,10
0 2
11
11,
023,
207
89,
698
578
1
3,60
7,07
2 1
28,7
98
284
4
91,0
18
1,7
94,3
92
Kel
anta
n 3
60
1,2
88,0
93
8,5
32
354
2
,296
,831
2
5,36
2 7
14
3,5
84,9
24
33,
894
361
6
64,9
09
824
,883
Sab
ah 3
16
6,2
61,6
21
76,
641
60
4,5
01,7
54
35,
488
376
1
0,76
3,37
5 1
12,1
29
2,5
87
651
,954
4
28,4
14
Pak
ista
n 1
3
8,14
1 1
03
1
790
,344
1
,532
2
8
28,4
85
1,6
35
1
12,
713
233
Tota
l 5
,744
3
8,44
5,84
0 1
,694
,656
7
,842
3
1,62
2,30
3 1
,882
,997
13
,586
7
0,06
8,14
3 3
,577
,653
8
,695
4
,983
,883
1
5,10
2,08
6
The
land
and
bui
ldin
gs
com
pris
e p
ow
er s
tatio
ns, m
ini h
ydro
s, je
ttie
s, d
ams,
sub
stat
ions
, res
iden
tial h
ous
es, a
par
tmen
ts, h
olid
ay b
ung
alo
ws,
offi
ce b
uild
ing
s, w
areh
ous
es, s
tore
s
and
wo
rksh
op
s.
NE
T B
OO
K V
AL
UE
OF
LA
ND
AN
D B
UIL
DIN
GS
AS
AT
31
DE
CE
MB
ER
20
18

While our roots are firmly consolidated on accomplishments within Malaysia, we have also made inroads into the international arena and our growth has already gained footholds in overseas markets which include Pakistan, India, Turkey, Saudi Arabia and the United Kingdom.
We will continue to grow, move economies and drive the energy industry by transcending borders, shaping a better brighter future for us and the generations to come.

About TNB
Our Business
Business Context
Performance Review
Sustainability Statement
Governance
Financial Statements
Additional InformationIntegrated Annual Report 2018
Tenaga Nasional Berhad
p.51
52 Corporate Information
53 Organisational Structure
54 Group Corporate Structure
56 Direct Value Added to Malaysia
57 Awards & Recognition
BUSINESS CONTEXT
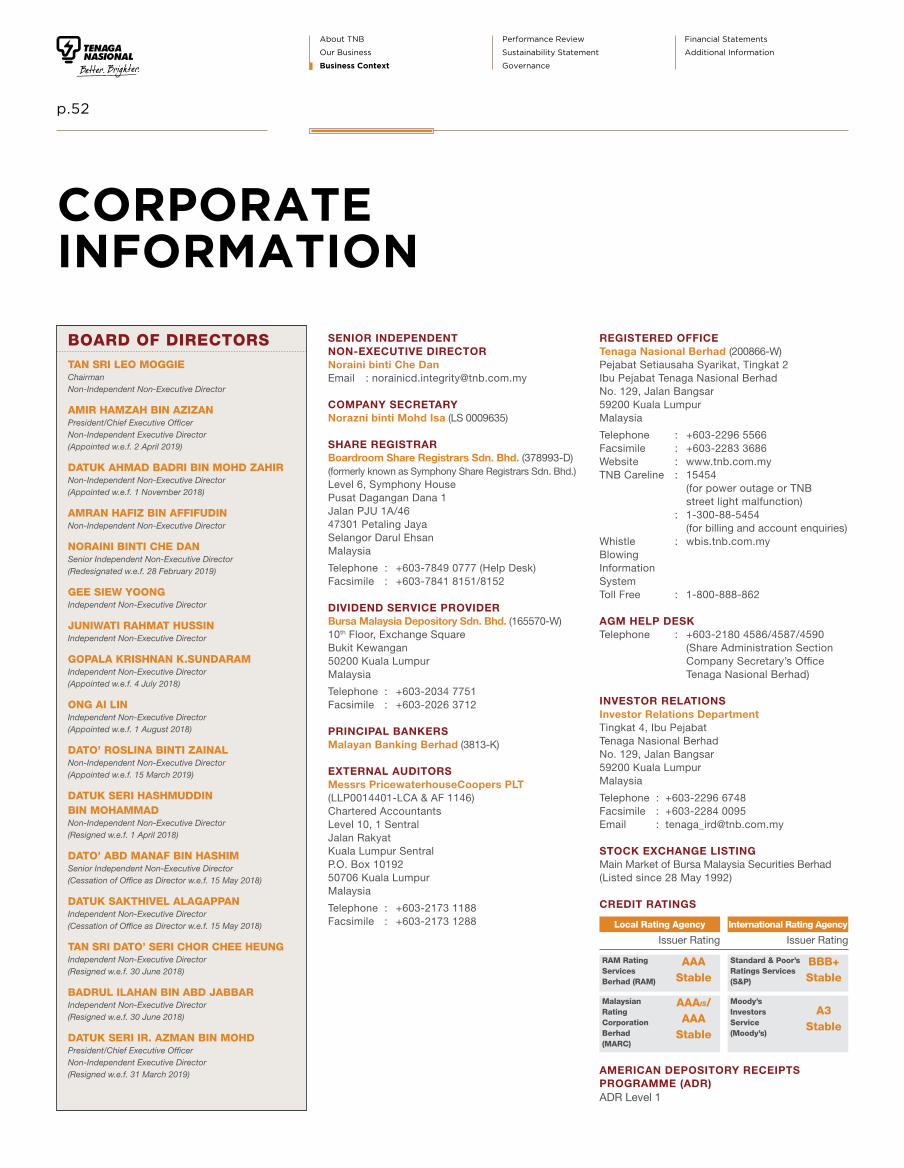
p.52
About TNB
Our Business
Business Context
Performance Review
Sustainability Statement
Governance
Financial Statements
Additional Information
CORPORATE INFORMATION
TAN SRI LEO MOGGIEChairmanNon-Independent Non-Executive Director
AMIR HAMZAH BIN AZIZANPresident/Chief Executive OfficerNon-Independent Executive Director(Appointed w.e.f. 2 April 2019)
DATUK AHMAD BADRI BIN MOHD ZAHIRNon-Independent Non-Executive Director(Appointed w.e.f. 1 November 2018)
AMRAN HAFIZ BIN AFFIFUDINNon-Independent Non-Executive Director
NORAINI BINTI CHE DANSenior Independent Non-Executive Director(Redesignated w.e.f. 28 February 2019)
GEE SIEW YOONGIndependent Non-Executive Director
JUNIWATI RAHMAT HUSSINIndependent Non-Executive Director
GOPALA KRISHNAN K.SUNDARAMIndependent Non-Executive Director(Appointed w.e.f. 4 July 2018)
ONG AI LINIndependent Non-Executive Director(Appointed w.e.f. 1 August 2018)
DATO’ ROSLINA BINTI ZAINALNon-Independent Non-Executive Director(Appointed w.e.f. 15 March 2019)
DATUK SERI HASHMUDDIN BIN MOHAMMAD Non-Independent Non-Executive Director(Resigned w.e.f. 1 April 2018)
DATO’ ABD MANAF BIN HASHIM Senior Independent Non-Executive Director(Cessation of Office as Director w.e.f. 15 May 2018)
DATUK SAKTHIVEL ALAGAPPANIndependent Non-Executive Director(Cessation of Office as Director w.e.f. 15 May 2018)
TAN SRI DATO’ SERI CHOR CHEE HEUNGIndependent Non-Executive Director(Resigned w.e.f. 30 June 2018)
BADRUL ILAHAN BIN ABD JABBARIndependent Non-Executive Director(Resigned w.e.f. 30 June 2018)
DATUK SERI IR. AZMAN BIN MOHDPresident/Chief Executive OfficerNon-Independent Executive Director(Resigned w.e.f. 31 March 2019)
SENIOR INDEPENDENTNON-EXECUTIVE DIRECTORNoraini binti Che DanEmail : [email protected]
COMPANY SECRETARYNorazni binti Mohd Isa (LS 0009635)
SHARE REGISTRARBoardroom Share Registrars Sdn. Bhd. (378993-D)(formerly known as Symphony Share Registrars Sdn. Bhd.)Level 6, Symphony HousePusat Dagangan Dana 1Jalan PJU 1A/4647301 Petaling JayaSelangor Darul Ehsan Malaysia
Telephone : +603-7849 0777 (Help Desk)Facsimile : +603-7841 8151/8152
DIVIDEND SERVICE PROVIDERBursa Malaysia Depository Sdn. Bhd. (165570-W)10th Floor, Exchange SquareBukit Kewangan50200 Kuala LumpurMalaysia
Telephone : +603-2034 7751Facsimile : +603-2026 3712
PRINCIPAL BANKERSMalayan Banking Berhad (3813-K)
EXTERNAL AUDITORSMessrs PricewaterhouseCoopers PLT (LLP0014401-LCA & AF 1146)Chartered AccountantsLevel 10, 1 Sentral Jalan Rakyat Kuala Lumpur SentralP.O. Box 1019250706 Kuala LumpurMalaysia
Telephone : +603-2173 1188Facsimile : +603-2173 1288
REGISTERED OFFICE Tenaga Nasional Berhad (200866-W)Pejabat Setiausaha Syarikat, Tingkat 2Ibu Pejabat Tenaga Nasional BerhadNo. 129, Jalan Bangsar 59200 Kuala LumpurMalaysia
Telephone : +603-2296 5566Facsimile : +603-2283 3686Website : www.tnb.com.myTNB Careline : 15454 (for power outage or TNB street light malfunction) : 1-300-88-5454 (for billing and account enquiries)Whistle : wbis.tnb.com.myBlowing Information SystemToll Free : 1-800-888-862
AGM HELP DESKTelephone : +603-2180 4586/4587/4590 (Share Administration Section Company Secretary’s Office Tenaga Nasional Berhad)
INVESTOR RELATIONSInvestor Relations DepartmentTingkat 4, Ibu Pejabat Tenaga Nasional BerhadNo. 129, Jalan Bangsar59200 Kuala LumpurMalaysia
Telephone : +603-2296 6748Facsimile : +603-2284 0095Email : [email protected]
STOCK EXCHANGE LISTINGMain Market of Bursa Malaysia Securities Berhad (Listed since 28 May 1992)
CREDIT RATINGS
AMERICAN DEPOSITORY RECEIPTS PROGRAMME (ADR)ADR Level 1
Local Rating Agency International Rating Agency
Issuer Rating Issuer Rating
RAM Rating Services Berhad (RAM)
Standard & Poor’sRatings Services (S&P)
Malaysian Rating Corporation Berhad (MARC)
Moody’s Investors Service (Moody’s)
AAAStable
BBB+Stable
AAAIS/AAA
Stable
A3Stable
BOARD OF DIRECTORS

About TNB
Our Business
Business Context
Performance Review
Sustainability Statement
Governance
Financial Statements
Additional InformationIntegrated Annual Report 2018
Tenaga Nasional Berhad
p.53
HEAD(Legal Services)
HEAD(Career Enhancement Management)
HEAD(Health, Safety & Environment)
HEAD(Single Buyer)
HEAD(Real Estate Ventures)
HEAD(Fleet Management)
HEAD(Security Services)
CHIEF INTEGRITY DEVELOPMENT OFFICER
CHIEF TALENT OFFICER
CHIEF INTERNATIONAL OFFICER
ORGANISATIONAL STRUCTURE
COMPANY SECRETARY
COREBUSINESS
BOARDCOMMITTEES
NON-CORE BUSINESS
CHIEFRISK
OFFICER
CHIEFINTERNALAUDITOR
PRESIDENT/CHIEF EXECUTIVE
OFFICERChief Generation Officer(Generation Division)
Chief Grid Officer(Grid Division)
Chief Distribution Network Officer(Distribution Network Division)
Chief Retail Officer(Retail Division)
BOARD OF DIRECTORS
Chief Financial Officer(Group Finance Division)
Chief Strategy & Regulatory Officer(Strategy & Regulatory Division)
Chief Ventures Officer(Energy Ventures Division)
Chief People Officer(Group Human Resource Division)
Chief Corporate Officer(Group Corporate Communications Division)
Chief Procurement Officer(Procurement & Supply Chain Division)
Chief Information Officer(Information & Communication Technology Division)

p.54
About TNB
Our Business
Business Context
Performance Review
Sustainability Statement
Governance
Financial Statements
Additional Information
GROUPCORPORATESTRUCTURE
100% MALAYSIA TRANSFORMER MANUFACTURING SDN. BHD.
100% TNB INTEGRATED LEARNING SOLUTION SDN. BHD.
100% TNB PASIR GUDANG ENERGY SDN. BHD.
100% TNB JANAMANJUNG SDN. BHD.
100% TNB FUEL SERVICES SDN. BHD.
100% TNB CONNAUGHT BRIDGE SDN. BHD.
100% TNB-IT SDN. BHD.
100% TNB GLOBAL VENTURES CAPITAL BERHAD
100% ALLO TECHNOLOGY SDN. BHD.(Formerly known as Setia Haruman Technology Sdn. Bhd.)
100% TNB SEPANG SOLAR SDN. BHD.
100% TNB TOPAZ ENERGY SDN. BHD.
100% TNBX SDN. BHD.
100% TNB GLOBAL CAPTIVE (L) LTD
100% TNB POWER DAHARKI LTD.
100% TNB LIBERTY POWER LIMITED
100% TNB MANJUNG FIVE SDN. BHD.
100% TNB WESTERN ENERGY BERHAD
100% TNB PRAI SDN. BHD.
100% TNB NORTHERN ENERGY BERHAD
100% TNB ENGINEERING CORPORATION SDN. BHD.
100% TNEC CONSTRUCTION SDN. BHD. (Dormant)
100% BANGSAR ENERGY SYSTEMS SDN. BHD.
49% ABRAJ COOLING LLC
77% AIRPORT COOLING ENERGY SUPPLY SDN. BHD.
70% SELESA ENERGY SYSTEMS SDN. BHD. (Dormant)
100% TNEC OPERATIONS AND MAINTENANCE SDN. BHD.
51% TOMEST ENERGY MANAGEMENT SDN. BHD. (In Members’ Voluntary Winding Up)
100% TNB RESEARCH SDN. BHD.
100% TNB INTERNATIONAL SDN. BHD.
100% INTEGRAX BERHAD
100% UNIVERSITI TENAGA NASIONAL SDN. BHD.
100% TNB ENERGY SERVICES SDN. BHD.
100% TNB LABS SDN. BHD. (Formerly known as TNBR QATS Sdn. Bhd.)
100% TENAGA E MOBILITY SOLUTIONS SDN. BHD.
100% TENAGA INVESTMENTS UK LTD
100% SEGMEN KEMBARA SDN. BHD. (Dormant)
100% UNITEN R&D SDN. BHD.
YAYASAN CANSELOR UNIVERSITI TENAGA NASIONAL
100% LBT TWO SDN. BHD. (Dormant)
100% TREK KEMBARA SDN. BHD. (Dormant)
100% TNB RENEWABLES SDN. BHD.
100% TNB BUKIT SELAMBAU SOLAR SDN. BHD.
100% GSPARX SDN. BHD.
100% PELABUHAN LUMUT SDN. BHD.
40% GUNUNG TENAGA SDN. BHD.
50% VORTEX SOLAR INVESTMENTS S.A.R.L.
40% FTJ BIO POWER SDN. BHD.
49% SIME DARBY TNBES RENEWABLE ENERGY SDN. BHD.
20% JANA LANDFILL SDN. BHD.
100% TENAGA WIND VENTURES UK LTD
100% VORTEX SOLAR UK LIMITED
70% MAEVI SDN. BHD.
49% METROSPHERE HYDRO TERSAT SDN. BHD.
100% LEKIR BULK TERMINAL SDN. BHD.
50% LESS 1 SHARE LUMUT MARITIME TERMINAL SDN. BHD.
80% GVO WIND LIMITED*
80% BLUEMERANG CAPITAL LIMITED*
100% LMT CAPITAL SDN. BHD. (Dormant)
* % of holdings are based on equity structure. The economic interest is 100%. List of subsidiaries for GVO Wind Limited and Bluemerang Capital Limited are detailed out on pages 203 to 205 of this Integrated Annual Report.

About TNB
Our Business
Business Context
Performance Review
Sustainability Statement
Governance
Financial Statements
Additional InformationIntegrated Annual Report 2018
Tenaga Nasional Berhad
p.55 Group Corporate Structure
100% TNB VENTURES SDN. BHD.
100% POWER AND ENERGY INTERNATIONAL (MAURITIUS) LTD.
100% ARUNA SERVICIOS INTEGRALES S.L.U.
100% TNB REPAIR AND MAINTENANCE SDN. BHD.
83% SABAH ELECTRICITY SDN. BHD.
70% JIMAH EAST POWER SDN. BHD.
60% KAPAR ENERGY VENTURES SDN. BHD.
60% TENAGA SWITCHGEAR SDN. BHD.
51% SOUTHERN POWER GENERATION SDN. BHD.
76% TENAGA CABLE INDUSTRIES SDN. BHD.
100% INDEPENDENT POWER INTERNATIONAL LTD.
100% GLOBAL POWER ENERJÎ SANAYÎ VE TÎCARET ANONÎM ȘÎRKETÎ
100% TNB REMACO PAKISTAN (PRIVATE) LIMITED
100% TENAGA WHR 1 SDN. BHD.
60% TSG ORMAZABAL SDN. BHD.
100% ELOPURA POWER SDN. BHD.
100% TRICHY POWER LIMITED (Dormant)
34% TENAGA MIDDLE EAST ELECTRIC CONTRACTING L.L.C
100% TRICHY ENERGY LIMITED (Dormant)
95% PT. TENAGA NUSA BAKTI (Dormant)
100% TNB OPERATIONS & MAINTENANCE INTERNATIONAL LTD.
30% GMR ENERGY LIMITED
100% OASIS PARADE SDN. BHD.
20% MALAYSIAN SHOAIBA CONSORTIUM SDN. BHD.
30% GAMA ENERJI ANONÎM ȘÎRKETÎ
50% SAUDI-MALAYSIA WATER & ELECTRICITY CO. LTD.
30% SAUDI MALAYSIA OPERATION AND MAINTENANCE SERVICES CO. LTD.
10% ALIMTIAZ OPERATION & MAINTENANCE COMPANY LIMITED
ASSOCIATES
49% FIBRECOMM NETWORK (M) SDN. BHD.
20% GB3 SDN. BHD.
20% TEKNOLOGI TENAGA PERLIS CONSORTIUM SDN. BHD.
20% JIMAH ENERGY VENTURES HOLDINGS SDN. BHD.
100% JIMAH ENERGY VENTURES SDN. BHD.
JOINT VENTURE
50% SEATRAC SDN. BHD. (Dormant)
SIMPLE INVESTMENTS
20%PERUSAHAAN OTOMOBIL ELEKTRIK (MALAYSIA) SDN. BHD.
(In Winding Up)
10% LABUAN REINSURANCE (L) LTD.
8.91% FEDERAL POWER SDN. BHD.
TRUST FOUNDATIONS
YAYASAN TENAGA NASIONAL
RETIREMENT BENEFIT TRUST FUND
DORMANT COMPANIES
100% ORION MISSION SDN. BHD.
100% LAHAD DATU HOLDINGS SDN. BHD.
50% EASTERN SABAH POWER CONSORTIUM SDN. BHD.
100% LAHAD DATU ENERGY SDN. BHD.
100% TNB CAPITAL (L) LTD.
100% TNB HIDRO SDN. BHD.
100% TNB GENERATION SDN. BHD.
100% TNB COAL INTERNATIONAL LIMITED
100% TNB PROPERTIES SDN. BHD.
MANJUNG ISLAND ENERGY BERHAD (Subsidiary as defined by MFRS 10, 11 and 12)
70% SEPANG POWER SDN. BHD.
100% TNB RISK MANAGEMENT SDN. BHD.
100% TNB ENGINEERS SDN. BHD.
100% TNB TRANSMISSION NETWORK SDN. BHD.
100% TNB DISTRIBUTION SDN. BHD.
100% TNP CONSTRUCTION SDN. BHD.
40% KM METRO-TNB PROPERTIES SDN. BHD.
The information is as at 21 March 2019.
LEGEND:
Subsidiaries Associates Joint Ventures Simple Investments Trust Foundations

p.56
About TNB
Our Business
Business Context
Performance Review
Sustainability Statement
Governance
Financial Statements
Additional Information
DIRECT VALUEADDED TO MALAYSIA
31.12.2018 31.12.2017(Restated)
31.08.2017
VALUE ADDED (RM Million)
Revenue 50,392.5 15,692.2 47,416.9
Operating expenses excluding staff costs, depreciation and amortisation (33,677.6) (9,689.0) (29,218.1)
Net loss on impairment of financial instruments (487.3) (163.4) -
Other operating income 825.1 512.6 1,021.3
Finance income 423.8 94.9 237.6
Finance cost (1,688.5) (531.4) (1,456.0)
Fair value of financial instruments 36.7 (7.2) -
Foreign exchange gain/(loss) (418.3) 310.2 7.9
Share of results of associates and joint ventures (182.7) (37.0) 128.3
Value added available for distribution 15,223.7 6,181.9 18,137.9
DISTRIBUTION (RM Million)
To employees:
Employment cost 3,685.8 1,288.5 3,751.1
To the Government:
Taxation and zakat 1,301.6 235.0 1,369.7
To shareholders:
Dividends 2,931.9 2,493.0 2,205.5
Non-controlling interest 21.3 (13.8) 8.1
To reinvest to the Group:
Depreciation and amortisation 6,491.3 2,049.9 6,105.0
Retained profit 791.8 129.3 4,698.5
Total distributed 15,223.7 6,181.9 18,137.9
To Employees: Employment Cost
Legend
To the Government: Taxation and Zakat
To Shareholders: Dividends and Non-Controlling Interest
To Reinvest to the Group: Depreciation, Amortisation and Retained Profit
8.6%
19.4%
47.8% 24.2%
Distribution ofValue Added
35.3%
20.8%
3.8%
40.1%Financial Period Ended 31.12.2017 (Resta
ted)
31.12.2018

About TNB
Our Business
Business Context
Performance Review
Sustainability Statement
Governance
Financial Statements
Additional InformationIntegrated Annual Report 2018
Tenaga Nasional Berhad
p.57
AWARDS & RECOGNITION
In keeping with the vision of Reimagining
TNB, our Company’s business performance
par excellence is reflected by the
prestigious accolades we garnered locally,
regionally, and internationally during the
financial year.

p.58
About TNB
Our Business
Business Context
Performance Review
Sustainability Statement
Governance
Financial Statements
Additional Information
Awards & Recognition
The 10th Annual Global CSR Summit & Awards 2018
Special Recognition Award for 5 Consecutive Years of CSR Excellence
2018 Australasian Reporting Award
Gold Award for Excellence in Content Reporting
13th Employer Branding Awards
Malaysia Best Employer Brand Awards 2018
The Golden Globe Tigers 2018
Best in Managing Health at Work
The Golden Globe Tigers 2018
Green Future Leadership - TNB Energy Services Sdn. Bhd.

About TNB
Our Business
Business Context
Performance Review
Sustainability Statement
Governance
Financial Statements
Additional InformationIntegrated Annual Report 2018
Tenaga Nasional Berhad
p.59 Awards & Recognition
Employers’ Federation of Pakistan
Best Practices Award on OSH 2017 – Power & Utility Sector - TNB Repair & Maintenance
Asset Asian Awards 2018
Best Corporate Sukuk – 2 Billion Ringgit Wakala Sukuk
Islamic Issuer of the Year - Corporate
YouTube Malaysia Ad Awards 2018
Ad of the Year
Top Ad in Long-Form Storytelling
The Asiamoney Awards 2018
Overall Most Outstanding Company in Malaysia
Most Outstanding Company in Malaysia – Utilities Sector

p.60
About TNB
Our Business
Business Context
Performance Review
Sustainability Statement
Governance
Financial Statements
Additional Information
Global Business Services Asia Awards 2018
Best Practices Business Process Transformation
HRDF Conference & Exhibition 2018
Innovation & Creativity Award - TNB Janamanjung Sdn. Bhd.
Awards & Recognition
Human Resources Minister Award 2018
Large Service Sector - TNB Janamanjung Sdn. Bhd.
World Branding Awards 2018 - 2019
Brand of the Year - Energy - Power
Share Guide Association Malaysia (SGAM) ICT Awards 2018
TNB Android Billing Project

About TNB
Our Business
Business Context
Performance Review
Sustainability Statement
Governance
Financial Statements
Additional InformationIntegrated Annual Report 2018
Tenaga Nasional Berhad
p.61
62 Simplified Group Statement of Financial Position
64 Core Revenue Financial Year Ended 31 December 2018
PERFORMANCE REVIEW
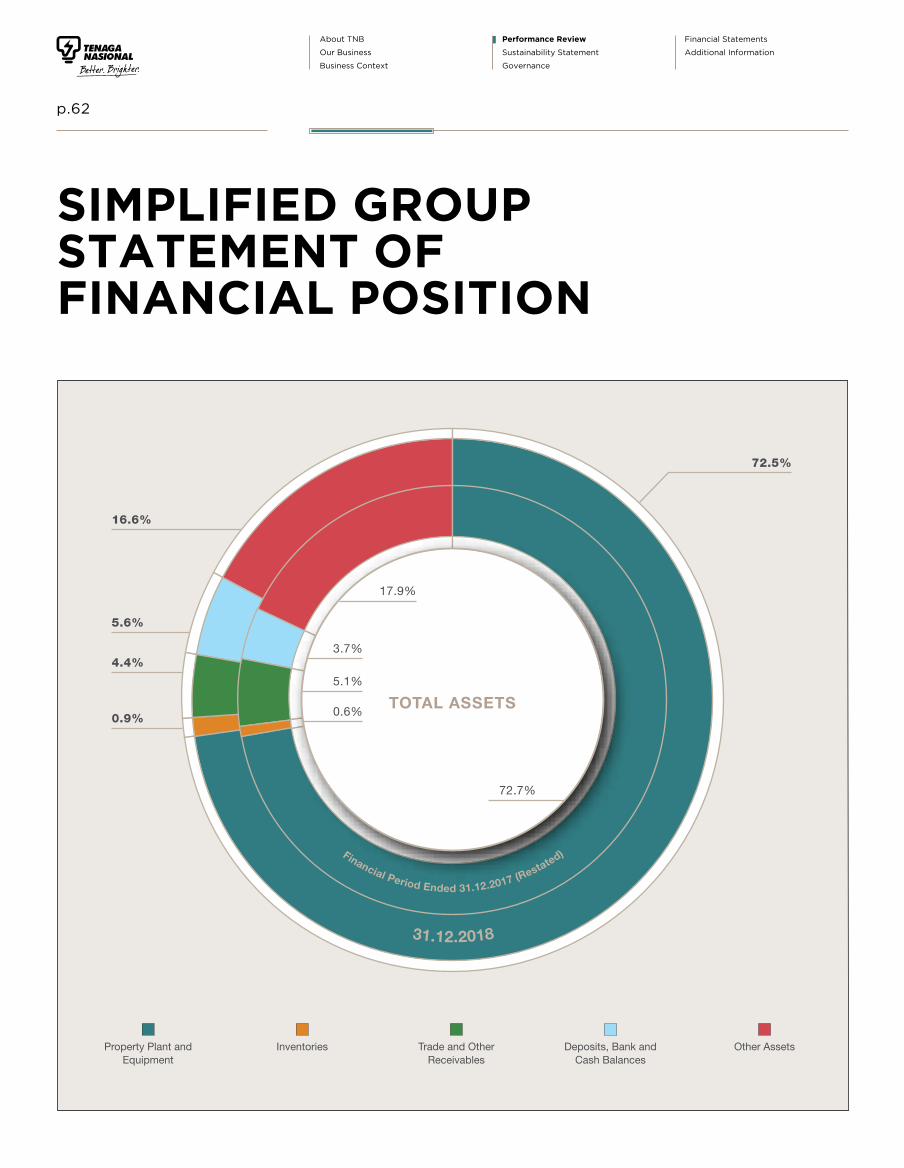
About TNB
Our Business
Business Context
Performance Review
Sustainability Statement
Governance
Financial Statements
Additional Information
p.62
SIMPLIFIED GROUPSTATEMENT OFFINANCIAL POSITION
Property Plant and Equipment
Inventories Trade and Other Receivables
Deposits, Bank and Cash Balances
Other Assets
72.5%
0.9%
4.4%
5.6%
16.6%
TOTAL ASSETS
3.7%
17.9%
72.7%
5.1%
0.6%
Financial Period Ended 31.12.2017 (Restated)
31.12.2018

About TNB
Our Business
Business Context
Performance Review
Sustainability Statement
Governance
Financial Statements
Additional InformationIntegrated Annual Report 2018
Tenaga Nasional Berhad
p.63
Trade and Other
Payables
EmployeeBenefits
TotalBorrowings
ContractLiabilities
Non-Controlling
Interest
CurrentTaxation
DeferredTaxation
ShareCapital
ConsumerDeposits
Other Current and Non Current
Liabilities
Retained Profits and Reserves
Simplified Group Statement of Financial Position
6.4%
30.2%
0.1%
31.1%
3.7%
7.7%
5.2%
2.1%
5.2%
7.5%
0.8%
TOTAL LIABILITIES& EQUITIES
Financial Period Ended 31.12.2017 (Restated)
31.12.2018
0.6%
7.8%
6.3%
31.8%
0.1%8.2%
5.3%
1.9%
5.7%
28.7%3.6%

About TNB
Our Business
Business Context
Performance Review
Sustainability Statement
Governance
Financial Statements
Additional Information
p.64
CORE REVENUE FINANCIALYEAR ENDED 31 DECEMBER 2018
SALES OF ELECTRICITY NUMBER OF CUSTOMERS
(Group/RM Million) (Group/GWh) (by Classification)
FPE 2017*Restated
* Financial Period Ended 31.12.2017 (Restated)^ Others include EGAT, LPL Operating Lease, Accrued Revenue, Goods & Services, Deferred Income, Imbalance Cost Pass-Through, Other Regulatory Adjustment & Tariff Support Subsidy
2018
Peninsular Malaysia
45,028.6
14,760.6
LPL
422.3
153.5
Others^
3,031.0
182.1
SESB
1,831.0
596.0
TNBI (UK WIND)
79.6
-
37.3% 39.6%0.3%
17.1%
41.2% 34.7%
18.9% 22.8%
81.7%
2.6% 2.9% 0.9%
Industrial DomesticCommercial Others
89.4%
3.6%
0.8%
6.0%
0.2%
119,984.04 GWhRM47,363.20
COREREVENUE
94.1%
1.0%
3.8%
1.1%
RM Million
Financial Period Ended 31.12.2017 (Rest
ated
)
31.12.2018
9,648,321

About TNB
Our Business
Business Context
Performance Review
Sustainability Statement
Governance
Financial Statements
Additional InformationIntegrated Annual Report 2018
Tenaga Nasional Berhad
Sustainability Statementp.65
66 About This Statement
67 Managing Sustainability
68 Sustainability Governance
68 Supporting The United Nations Sustainable Development Goals (UN SDGs)
70 Engaging Stakeholders
71 What Matters to Us
72 Spirit of Responsibility
• Our Governing Principles
74 Delivering With Purpose
• The Future of Energy
• Customer Centricity
81 Environmental Stewardship
• Minimising Environmental Impact
• Climate Change
84 Embracing Relationship
• Unlocking People Value
• Generative Safety Culture
• Brightening Surrounding Communities
• Transforming Lives Through Education
SUSTAINABILITY STATEMENT

About TNB
Our Business
Business Context
Performance Review
Sustainability Statement
Governance
Financial Statements
Additional Information
p.66
Governance Economic Environmental SocialMarks our commitment, driven
by our Board to reinforce ethical
business practices and forward-
looking culture under the theme
‘Spirit of Responsibility’.
Defines our continued aspiration
to provide reliable and efficient
energy in the local and
international Energy Supply
Industry (ESI) for a better and
brighter future under the theme
‘Delivering with Purpose’.
Defines our commitment to
minimise our environmental
impact wherever we operate
under the theme ‘Environmental
Stewardship’.
Revolves around how we
develop long-term and
meaningful relationships with
our customers, employees
and communities to enhance
their trusts under the theme
‘Embracing Relationships’.
SUSTAINABILITY STATEMENT
At TNB, we prioritise business operations that cater to the needs and
interests of our various stakeholders and also the environment we live
in. We aim to provide clear, transparent and comprehensive information
on all our efforts that highlight our commitment to sustainability, while
identifying areas for improvement.
ABOUT THIS STATEMENT
We continue to share our sustainability performance and initiatives in relation
to our journey of creating value for our stakeholders. We also disclose targets
for certain material matters, which are aligned to our corporate strategy and
also the United Nations Sustainable Development Goals (UN SDGs).
Statement Framework, Scope & Boundary
The statement is prepared in accordance to Bursa Malaysia Securities
Berhad's (Bursa Malaysia) Main Market Listing Requirements for Sustainability
Statement. This statement is guided also by the Global Reporting Initiative
(GRI) Standards. Various qualitative and quantitative data have been provided
in this statement for the material matters pertaining to TNB’s economic,
environmental and social performance.
The scope of this statement is mainly centered on TNB Company’s operations
in Peninsular Malaysia, with selected highlights on our subsidiaries. This
statement excludes any kind of outsourced, joint venture or suppliers’
activities unless otherwise stated.
Statement Period
The statement period covers our Financial Year 2018 (FY2018), which is from
1 January to 31 December. Where data for FY2018 is not available, the most
recent data is provided.

About TNB
Our Business
Business Context
Performance Review
Sustainability Statement
Governance
Financial Statements
Additional InformationIntegrated Annual Report 2018
Tenaga Nasional Berhad
Sustainability Statementp.67
MANAGING SUSTAINABILITY
Our strategic plan for 2017-2025, Reimagining TNB, was developed to
help transform the organisation to be amongst the leading corporations in
energy and related business globally. In tandem with this, our economic,
environmental and social commitments are fully aligned with our Reimagining
TNB strategy.
It is important to note that sustainability is a continuous and progressive
journey. With this in mind, in 2018, we are aligning our aspirations and
sustainability commitments to the United Nations Sustainable Development
The diagram below shows the linkages and alignment between Reimagining TNB and our sustainability commitments.
Goals (SDGs). In this regard, the TNB Sustainability Strategy includes our
impactful contributions to four (4) SDGs namely; Goal 7 (Affordable and
Clean Energy), Goal 8 (Decent Work and Economic Growth), Goal 13 (Climate
Action), and Goal 17 (Partnerships for the Goals) as illustrated in the diagram
below.
This section will provide an overview of our governance structure, stakeholder
engagement process, identification and management of material areas,
commitment to the SDGs and our sustainability initiatives.
TNB Sustainability Strategy
Future Generation Sources
Future Proof Regulations
Grid of the Future
Winning the Customer
SU
STA
INA
BIL
ITY
PIL
LA
RS
RE
IMA
GIN
ING
TN
B
• Support transition to a
low-carbon economy
• Minimise
environmental impactEnvironmental
• Empower our people
• Inculcate generative
safety culture
• Brighten the lives of
our communitiesSocial
• Provide reliable and
efficient energy for
customers
• Supply energy locally
and internationally
Economic
• Reinforce ethical and safe
business cultureGovernance
To be amongst the leading
corporations in energy and related business globally
DECENT WORK AND ECONOMIC GROWTH
08AFFORDABLE AND CLEAN ENERGY07 PARTNERSHIPS
FOR THE GOALS17CLIMATE ACTION13

About TNB
Our Business
Business Context
Performance Review
Sustainability Statement
Governance
Financial Statements
Additional Information
p.68 Sustainability Statement
We are taking progressive steps toward ensuring sustainability
principles are embedded into our decision-making process and also
throughout our operations
SUSTAINABILITY GOVERNANCE
Sustainability is embedded in our company policies and is inextricably linked with our business strategy and decisions. It influences our investments, operational efficiency programmes, stakeholder engagements and climate risk mitigation efforts, among others.
TNB Board of Directors is cognisant of the importance of ensuring sustainability is integrated in the strategic direction of the organisation, decision-making processes and operational performance.
TNB’s sustainability initiatives fall under the purview of the respective committees – including Sustainability Development Committee (SDC), chaired by the President/Chief Executive Officer (CEO).
The SDC’s role is to review, evaluate and advise on Sustainability and Green Energy related initiatives prior to further review from other relevant committees including the Board. Decisions to escalate issues to higher approving authorities are subject to our Procurement & Supply Chain Policy and Procedures, and Limits of Authority (LOA) guidelines.
Sustainability initiatives and their implementation are cascaded down to divisions and subsidiaries for incorporation into their respective business and operational areas. Periodically, they will report on sustainability performance.
SUPPORTING THE UNITED NATIONS SUSTAINABLE DEVELOPMENT GOALS (UN SDGs)
In 2015, as part of the United Nations (UN) 2030 Agenda for Sustainable Development, 17 Sustainable Development Goals (SDGs) were adopted by 193
countries of the UN General Assembly.
As a signatory to the UN SDGs, Malaysia is committed to aligning the Nation’s sustainability commitments towards the UN SDGs through partnership and
collaboration. At TNB, we continuously contribute towards Malaysia’s sustainability commitments and goals.
At TNB, we currently focus our contributions on four (4) UN SDGs, namely SDG 7, 8, 13 and 17. Our approach to the selection of these four (4) SDGs was based
on what is most material to us as an organisation, and the areas that are most relevant to our business and operations.
TNB’s contributions to the UN SDGs were not limited to the four (4) SDGs mentioned as various initiatives taken also address the other SDGs indirectly. These
are further showcased in the following section (What Matters to Us, page 71). Looking ahead, we will further enhance formulation and development of relevant
strategies, action plans and targets with regards to SDGs.

About TNB
Our Business
Business Context
Performance Review
Sustainability Statement
Governance
Financial Statements
Additional InformationIntegrated Annual Report 2018
Tenaga Nasional Berhad
Sustainability Statementp.69
DECENT WORK AND ECONOMIC GROWTH08
AFFORDABLE AND CLEAN ENERGY07
PARTNERSHIPS FOR THE GOALS17
CLIMATE ACTION13
Ensure access to affordable, reliable, sustainable and
modern energy for all
Achieving this goal will contribute to economic, environmental,
social development and well-being. We are focused on this
goal by prioritising energy efficiency, clean energy technology
and related infrastructure.
Promote sustained, inclusive and sustainable economic
growth, full and productive employment and decent
work for all
We have always placed great importance in creating employment
opportunities that value and respect human rights. This goes
well beyond legal compliance or upholding our reputation, as
we also strongly believe that this is the backbone of positive
business performances across our value chain.
Take urgent action to combat climate change
and its impacts
We support Malaysia’s commitment to the Paris Climate
Change Agreement signed at COP 21, recognising the
increasing importance of mitigating and adapting to climate
change. In this regard, we seek to reduce our Greenhouse
Gas (GHG) emission intensity and the environmental impacts
resulting from our operations.
Strengthen the means of implementation and revitalise the
global partnership for sustainable development
We will continue to form partnerships with all stakeholders
including government agencies, industry experts, businesses
and NGOs, both within and outside the energy sector. This is
to meet future electricity demands in a sustainable manner, as
well as to give back to the community.
TNB’S CONTRIBUTIONS TO UN SDGs
CLIMATE ACTION13
RESPONSIBLE CONSUMPTION AND PRODUCTION
12
LIFE ON LAND15
SUSTAINABLE CITIES AND COMMUNITIES
11
GOOD HEALTH AND WELL-BEING03 QUALITY
EDUCATION04
CLEAN WATER AND SANITATION06GENDER
EQUALITY05
INDUSTRY, INNOVATION AND INFRASTRUCTURE
09
NO POVERTY01 ZERO
HUNGER02
LIFE BELOW WATER14
PEACE, JUSTICE AND STRONG INSTITUTIONS
16
AFFORDABLE AND CLEAN ENERGY07 DECENT WORK AND
ECONOMIC GROWTH08
PARTNERSHIPS FOR THE GOALS17
REDUCED INEQUALITIES10

About TNB
Our Business
Business Context
Performance Review
Sustainability Statement
Governance
Financial Statements
Additional Information
p.70 Sustainability Statement
Our customers comprise of domestic, commercial and industrial customers including Government, Small & Medium-Sized Enterprises (SMEs) and large corporations
Local communities in or near areas where we operate including those affected by our operations
4,665 contractors and suppliers
Institutional and retail investors, analysts and potential investors with interest
The Malaysian Federal and State Governments, parliamentarians, municipal councils and regulators
Customer/human rights groups, environmental groups and chambers of commerce
Three (3) registered unions and two (2) workers associations that cover all categories of staff
Our 35,574 employees throughout TNB Group
Only full time employees excluding contractors
• Customer service outlets• Call centre• myTNB application & online portals• Customer surveys• Social networks• Roadshows• Campaigns
• Outreach programmes• Corporate Social Responsibility (CSR)
programmes• Town halls• Dialogue sessions• Sporting events
• Direct contact• Training and workshops• TNB Vendors Day• Outreach programmes
• Financial results announcements• Investor relation conferences and roadshows• One-to-one engagements• Site visits
• Meetings and briefings• Site visits• Round table sessions• Direct contact• Outreach programmes
• Direct contact • Outreach programmes• Seminars and knowledge sharing sessions
• Joint meetings and engagement sessions• Negotiation• Collective Agreements• Direct contact
• Direct contact • Townhalls, turun padang & other outreach
programmes• Online portal (intranet), newsletters, emails• Employee surveys • CSR events
CUSTOMERS
COMMUNITIES
VENDORS
INVESTORS
GOVERNMENT
NON-GOVERNMENTALORGANISATIONS (NGOS)
TRADE-UNIONS
EMPLOYEES
Who are our stakeholders?
How do we engage our stakeholders?
ENGAGING STAKEHOLDERS
Stakeholder engagement process is an important component in sustainability. The purpose of this engagement is for fostering better relationships and also for understanding their respective needs and concerns to continuously improve ourselves. At TNB, we engage with various stakeholders on a regular basis, and when required.
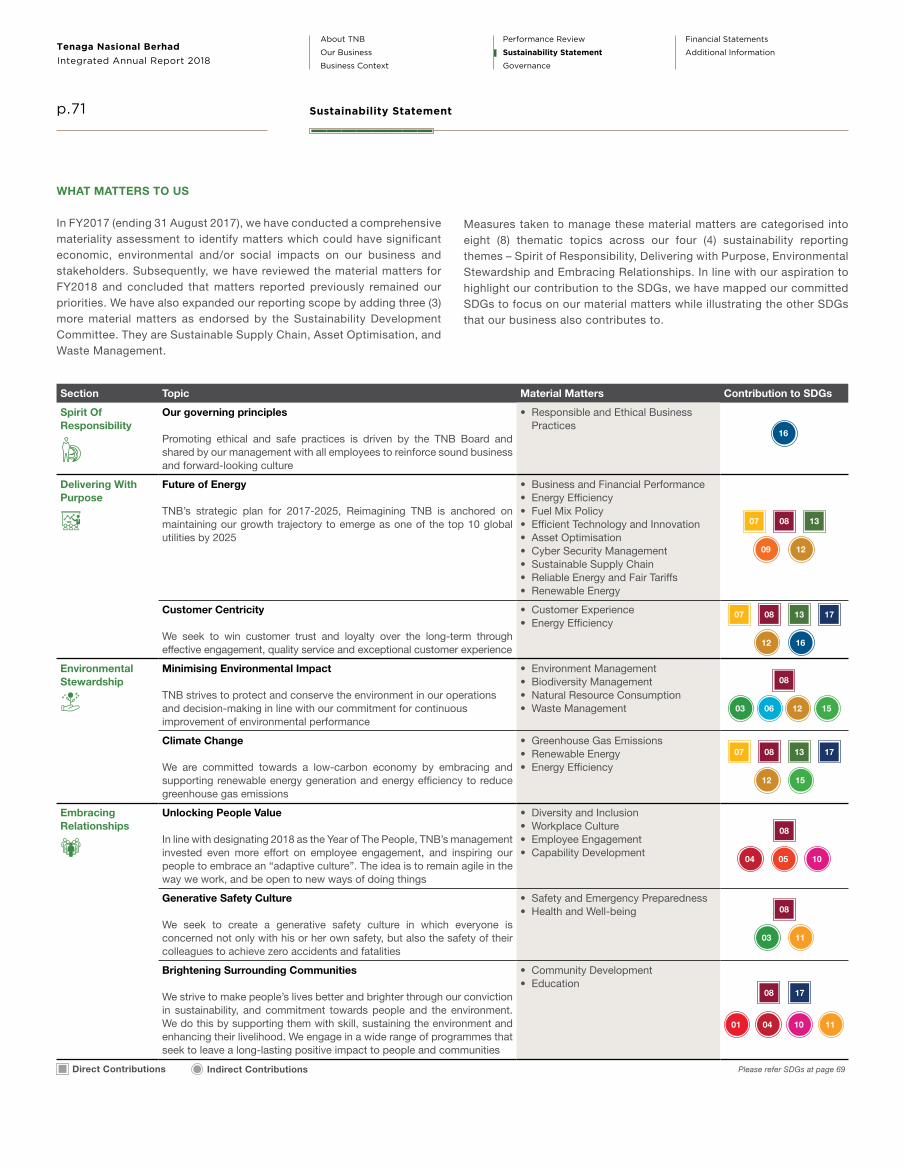
About TNB
Our Business
Business Context
Performance Review
Sustainability Statement
Governance
Financial Statements
Additional InformationIntegrated Annual Report 2018
Tenaga Nasional Berhad
Sustainability Statementp.71
Direct Contributions Indirect Contributions Please refer SDGs at page 69
Section Topic Material Matters Contribution to SDGs
Spirit Of Responsibility
Our governing principles
Promoting ethical and safe practices is driven by the TNB Board and shared by our management with all employees to reinforce sound business and forward-looking culture
• Responsible and Ethical Business Practices
Delivering With Purpose
Future of Energy
TNB’s strategic plan for 2017-2025, Reimagining TNB is anchored on maintaining our growth trajectory to emerge as one of the top 10 global utilities by 2025
• Business and Financial Performance• Energy Efficiency• Fuel Mix Policy• Efficient Technology and Innovation• Asset Optimisation• Cyber Security Management• Sustainable Supply Chain• Reliable Energy and Fair Tariffs• Renewable Energy
Customer Centricity
We seek to win customer trust and loyalty over the long-term through effective engagement, quality service and exceptional customer experience
• Customer Experience• Energy Efficiency
Environmental Stewardship
Minimising Environmental Impact
TNB strives to protect and conserve the environment in our operations and decision-making in line with our commitment for continuous improvement of environmental performance
• Environment Management• Biodiversity Management• Natural Resource Consumption• Waste Management
Climate Change
We are committed towards a low-carbon economy by embracing and supporting renewable energy generation and energy efficiency to reduce greenhouse gas emissions
• Greenhouse Gas Emissions• Renewable Energy• Energy Efficiency
Embracing Relationships
Unlocking People Value
In line with designating 2018 as the Year of The People, TNB’s management invested even more effort on employee engagement, and inspiring our people to embrace an “adaptive culture”. The idea is to remain agile in the way we work, and be open to new ways of doing things
• Diversity and Inclusion• Workplace Culture• Employee Engagement• Capability Development
Generative Safety Culture
We seek to create a generative safety culture in which everyone is concerned not only with his or her own safety, but also the safety of their colleagues to achieve zero accidents and fatalities
• Safety and Emergency Preparedness• Health and Well-being
Brightening Surrounding Communities
We strive to make people’s lives better and brighter through our conviction in sustainability, and commitment towards people and the environment. We do this by supporting them with skill, sustaining the environment and enhancing their livelihood. We engage in a wide range of programmes that seek to leave a long-lasting positive impact to people and communities
• Community Development• Education
130807
09 12
16
12 16
130807 17
150603 12
08
0504 10
08
130807 17
12 15
08
03 11
11100401
08 17
WHAT MATTERS TO US
In FY2017 (ending 31 August 2017), we have conducted a comprehensive materiality assessment to identify matters which could have significant economic, environmental and/or social impacts on our business and stakeholders. Subsequently, we have reviewed the material matters for FY2018 and concluded that matters reported previously remained our priorities. We have also expanded our reporting scope by adding three (3) more material matters as endorsed by the Sustainability Development Committee. They are Sustainable Supply Chain, Asset Optimisation, and Waste Management.
Measures taken to manage these material matters are categorised into eight (8) thematic topics across our four (4) sustainability reporting themes – Spirit of Responsibility, Delivering with Purpose, Environmental Stewardship and Embracing Relationships. In line with our aspiration to highlight our contribution to the SDGs, we have mapped our committed SDGs to focus on our material matters while illustrating the other SDGs that our business also contributes to.

About TNB
Our Business
Business Context
Performance Review
Sustainability Statement
Governance
Financial Statements
Additional Information
p.72 Sustainability Statement
OUR GOVERNING PRINCIPLES
Integrity is at the forefront of everything we
do. It is one of our Shared Values and is driven
by our Board and top management. We aspire
every employee upholds the highest standards
of ethics in all our dealings.
We comply with all relevant regulations to
ensure integrity and good governance. These
include the Companies Act 2016, Bursa
Malaysia Securities Berhad’s Main Market
Listing Requirements and the Securities
Commission’s Malaysian Code on Corporate
Governance 2017 (MCCG). Going beyond
regulatory requirements, we strive to create a
culture of ethics in which integrity is paramount
to everyone.
Promoting ethical and safe practices is driven by the TNB Board and shared
by our management with all our employees to reinforce sound business and a
forward-looking culture
CORPORATE GOVERNANCE AT TNB
We have in place a robust Corporate Governance
Model which defines the boundaries within
which our employees and external parties are
expected to work, and a common approach
to how we conduct our business across the
organisation. To read more, please refer to The
Strength of Our Governance section, which can
be found on pages 98 to 143 of our Integrated
Annual Report (IAR).
RISK MANAGEMENT
AND INTERNAL CONTROL
At TNB, we believe in the importance of
integrating risk management into our processes
and decision-making to enable the achievement
Obtained ISO 37001:2016
Anti Bribery Management
System certification
Signing of Integrity Pledge by
all employees
LaunchedTNB Corporate Integrity Management System (TCIMS)
Handbook
• Responsible and Ethical
Business Practices
KEY HIGHLIGHTS
MATERIAL MATTERS
Spirit of ResponsibilityOur Governing Principles
TNB is committed in championing good governance and ethical practices throughout the Company.
of our business objectives. The design and
implementation of the TNB Risk Management
Framework is based on the principles and
guidelines expressed in ISO 31000:2009 Risk
Management – Principles and Guidelines.
This is supported by our internal control
framework to manage risks within tolerable
levels. Group policies, codes and procedures
are regularly reviewed and approved by
Management and the Board. The effectiveness
of implementation is consistently assessed and
monitored for continual improvement.
For more information please refer to the
Statement of Risk Management and Internal
Control in pages 144 to 146 of our IAR.

About TNB
Our Business
Business Context
Performance Review
Sustainability Statement
Governance
Financial Statements
Additional InformationIntegrated Annual Report 2018
Tenaga Nasional Berhad
Sustainability Statementp.73
HEIGHTENING AWARENESS
In 2017, TNB was one of the first corporations in Malaysia to embark on the ISO 37001:2016 Anti-Bribery Management System certification. Towards achieving
the certification, we launched TNB Corporate Integrity Management System (TCIMS) to drive an integrity-based culture and a high level of compliance with
local and international anti-bribery standards. On 15 November 2018, we obtained the certification from Standard and Industrial Research Institute of Malaysia
(SIRIM), and TCIMS is expected to be completed by late January 2019.
Further reinforcing a culture of integrity, the TCIMS handbook was launched on 19 December 2018 in conjunction with TNB Integrity Day. The handbook covers
TCIMS policies on anti-bribery, gifts, hospitality & related benefits, conflicts of interest, whistleblowing, and Integrity Pact & Committee Integrity Pledges Policy.
A key highlight for this year was the signing of Integrity Pledge by all employees annually for the purpose of awareness and accountability of their respective
assignments or works.
Our employees receive continuous training and awareness sessions to reinforce and instil a culture of integrity. In FY2018, 1,728 of our employees attended
Integrity Engagement Programmes that were conducted nationwide. Our goal is for all companies within the Group to adopt the ISO 37001 standard. Towards
this end, we will continue with various activities and programmes to inculcate integrity as part of our corporate DNA.
Deputy Minister of Energy, Science, Technology, Environment and Climate Change, YB Isnaraissah Munirah Majilis launched TNB Corporate Integrity Management System (TCIMS) handbook in conjunction with TNB Integrity Day.

About TNB
Our Business
Business Context
Performance Review
Sustainability Statement
Governance
Financial Statements
Additional Information
p.74 Sustainability Statement
73.2MW TNB Total Renewable Energy Generation Capacity** Local
EAF has increased to 89.92%above our target of 89.87%
50MW LSS in Sepang, Selangor started operating
• Business & Financial Performance
• Energy Efficiency
• Fuel Mix Policy
• Efficient Technology & Innovation
• Asset Optimisation
• Reliable Energy & Fair Tariffs
• Sustainable Supply Chain
• Renewable Energy
KEY HIGHLIGHTS
MATERIAL MATTERS
DELIVERING SUSTAINABLE VALUE
For FY2018, we have seen continued stable and sustainable growth whilst creating stakeholder
value. To read more on Our Business performance, kindly refer to pages 12 to 49.
Energy Industry Landscape We Operate
Our diversified generation fuel mix for Peninsular Malaysia is based on the optimal generation
capacity development plan established by the Planning & Implementation Committee for Electricity
Supply and Tariff (JPPPET) helmed by Ministry of Energy, Science, Technology, Environment and
Climate Change (MESTECC). This plan takes into consideration the economic, environmental and
energy security factors. Based on this plan, in the medium term, gas and coal will continue to be
the main fuel for power generation while renewables such as solar energy will grow in importance
in line with global trends.
Delivering With PurposeThe Future of Energy
TNB gained a foothold in the country’s first Large Scale Solar (LSS) through a 50MW project in Sepang, Selangor.
AFFORDABLE AND CLEAN ENERGY07 DECENT WORK
AND ECONOMIC GROWTH
08 CLIMATE ACTION13
TNB’s strategic plan for 2017-2025, Reimagining TNB is anchored on maintaining our
growth trajectory to emerge as one of the world’s top 10 global utility by 2025
Direct Contribution
Fuel Mix (PeninsularMalaysia)
Others0.05%
Solar0.03% Hydro
3.89%
Coal55.86%
NaturalGas40.17%

About TNB
Our Business
Business Context
Performance Review
Sustainability Statement
Governance
Financial Statements
Additional InformationIntegrated Annual Report 2018
Tenaga Nasional Berhad
Sustainability Statementp.75
PROVIDING EXCELLENT OPERATIONAL
PERFORMANCE
Together, our Business Continuity Management (BCM)
Framework, innovation and asset optimisation plans,
enable us to improve on our operational performance.
In tandem with the expansion of our generation
operations, our domestic wholly-owned generation
plants continued to demonstrate high reliability with
an increased Equivalent Availability Factor (EAF) of
89.92%, which is above our target. We also recorded
a 99.79% Transmission System Availability, as well as
0.35 Transmission System Minutes in FY2018. We will
continue to improve our operational performance as
our commitment to our stakeholders.
Today, TNB has attained service reliability standards
on par with leading power and utilities players. This is
reflected in two (2) key supply parameters, namely our
System Average Interruption Duration Index (SAIDI) and
System Average Interruption Frequency Index (SAIFI).
Key Updates for FY18:
• First 50MW LSS farm in Sepang,
Selangor, began operations on
23 November 2018
• Commencement for development of
30MW LSS in Bukit Selambau, Kedah
with expected completion late 2020
• Acquisition of 80% equity in GVO
Wind Ltd and Bluemerang Capital Ltd
through our subsidiary, Tenaga Wind
Ventures UK Ltd. with a total capacity
of 26.1MW
Renewable Energy (RE) Updates
TNB RE Capacity (Local & International) for FY2018
TNB’s SAIDI has improved from 50.24 in FY2017 to 48.22 due to the reduction of breakdowns
and forced outages in 2018 whereas the SAIFI is recorded at 0.86 in 2018.
To read more on our performance and initiatives, please refer to our 2018 Year in Review where
we share our efforts towards improving our performance on pages 21 to 43.
System Average InterruptionDuration Index (SAIDI)*Minutes/Customer/Year
FY2016 FY2017 FY2018 FY2016 FY2017 FY2018
System Average Interruption Frequency Index (SAIFI)*Frequency/Customer/Year
49.71
0.87 0.84 0.86
50.24 48.22
Renewable and Green Energy
MESTECC has set a target to grow renewables’ proportion of the total
generation capacity mix from 2% currently to 20% by 2025.
TNB seeks to be part of this growth, and has been making significant
investments into various renewable sources of energy in the country. While we
see conventional assets as being relatively more economical in the short term,
we recognise the need to invest in renewables to help address climate change
issues as well as to prepare for gradual depletion of carbon-based fuels.
TNB’s target is to grow our renewable capacity to 1,700MW - domestically
and internationally by 2025. In January 2018, we established TNB Renewables
Sdn. Bhd. (TRe) to spearhead and accelerate our renewables business
growth in Malaysia. This year also saw our 50MW LSS in Sepang, Selangor
began its operations.
Local InternationalBiomass10MW
Biogas3.2MW
Mini hydro10MW
Hydro131.3MW
Wind143.6MW
Solar50MW Solar
50MW
* For Peninsular Malaysia

About TNB
Our Business
Business Context
Performance Review
Sustainability Statement
Governance
Financial Statements
Additional Information
p.76 Sustainability Statement
• Preventive Maintenance (PM) and Condition-Based Maintenance (CBM) – ensures high
reliability of electricity supply to the customers
• SAIDI 50 Initiatives – early detection for defects, asset replacement and introduction of new
technologies
• Business Turnaround Programme – aimed to unlock asset potential and enhance performance of
TNB’s generation power plants
• Intelligent Predictive and Diagnostic Monitoring (IPDM) System – system that enables plant
operators to detect anomalies from operating parameters of major assets
• Asset Mid-life Overhaul – introduced to prolong asset life, optimise resources and asset-reliability,
reduce equipment failures, decrease maintenance requirement and reduce loss of services
• Drones - used to enhance land planning functions with drones and improve Geospatial Information
System (GIS) data. 34 drones were purchased, while 34 personnel were certified as drone pilots by
the Civil Aviation Authority of Malaysia (previously DCA)
• Online Monitoring System for Gas Analysis – used in transformer bushing and gas insulated
switchgears
• “Automatic Fault Analysis and Fault Location Identification System” Project - to assist system
operator and maintenance team for decision making during restoration processes - pilot project is
in progress
Asset management and optimisation initiatives for FY2018
Innovation initiatives for FY2018
Efficient & Advanced Technology
Innovation lies at the forefront of transforming the energy supply industry, contributing to greater efficiencies. We also invest in advanced technology and
upgrade our infrastructure.
Asset Optimisation through Integrated Management
Our Asset Management Plan represents an integrated enterprise solution that enables TNB to achieve optimal asset performance at a sustainable cost. Using
this integrated plan, our key business units have attained ISO 55001 Asset Management certification. We have also implemented our Asset Performance
Management System (APMS) that would enable us to establish a holistic view of asset management through its life cycle.
Infrastructure investment: Grid Superhighway
As electricity demand continues to increase in Peninsular Malaysia, we are safeguarding our ability to meet customers’ needs by building a 500kV
Grid Superhighway. Construction of the RM2 billion Grid Superhighway began in 2015 and is expected to be completed by 2020. The 500kV Grid
Superhighway, dubbed as the Backbone, will enable adequate and safe power transfer from other regions into Central Area. At present, Central
Area accounts for about 45% of Peninsular Malaysia’s electricity demand.

About TNB
Our Business
Business Context
Performance Review
Sustainability Statement
Governance
Financial Statements
Additional InformationIntegrated Annual Report 2018
Tenaga Nasional Berhad
Sustainability Statementp.77
Cyber security management – Securing our Assets through Proactive Security
We have strengthened our cyber resilience and readiness to respond to any potential attack, using our existing Cyber Security Operating Model (CSOM). Cyber security governance committees across the different lines of business also keep a firm eye on initiatives, mitigation actions, incidence response and policies to keep strengthening our barriers against ever-evolving cyber threats.
As a measure of our cyber resilience, TNB is ISO 27001:2013 Information Security Management System (ISMS) certified – and audits for the National Load Despatch Centre and critical infrastucture are conducted regularly. The year also saw us organise cyber drills and cyber-attack simulations as well as security awareness and training programmes.
FY2016 FY2017 FPE 31.12.2017 FY2018
PROCUREMENT PRACTICES
Total spent on procurement (RM billion) 8.1 7.18 2.45 7.2
Total number of suppliers 4,685 4,514 3,206 4,665
LOCAL SUPPLIERS SUPPORTED
Total number of local suppliers 4,550 3,281 3,132 4,514
Total spent on local procurement (RM billion) 7.44 6.64 2.28 6.80
Percentage of local suppliers (%) 97 73 98 97
Notes: • All data provided excludes fuel and energy procurement • FPE 31.12.2017 denotes 1 September to 31 December 2017
GRID OF THE FUTURE – INNOVATION & SMART GRID
Under Reimagining TNB’s Grid of the Future, we aim to introduce Smart Grid to customers - through modernising and digitalising our grid to cater for
emerging demands and services. TNB is currently improving its grid infrastructure and has embarked on several innovative projects that will improve
reliability, service quality and operational efficiency.
Advanced Metering Infrastructure (AMI)
enhance meter reading by introducing remote
automated readings and detailed load profile
information which enable better load management,
profiling and future tariff options
Installed 160,000 smart meters in Melaka. The installation programme will
continue in Melaka and also be expanded to Klang Valley in 2019
For more information, please see page 78 under Customer Centricity
Mobility Solutions
provide a platform for increased work efficiency
amongst field staff
Successfully rolled out Mobility Solution applications for smart meter
installation (AMI project) - 3MS and I-nett, a tool to automate the load
forecast and disaggregation process during Distribution Network Annual
Planning cycle programme
Volt-VAr Optimisation
improves electricity supply quality by optimising the
network power factor which in the long run will optimise
the investment of new feeders and substations
Planted up 113 MVAr capacitor bank
Geospatial Information System (GIS)
provides accurate location information to manage,
operate and analyse TNB’s network assets
GIS function successfully rolled out to various stations in Putrajaya,
Cyberjaya and Kuala Selangor stations as per GIS Roadmap for 2018
Distribution Automation
provides real-time management of network operations
For this year, 3,672 substations were converted into Supervisory Control and
Data Acquisition (SCADA) enabled substations
2
1
3
4
5
Projects
SUSTAINABLE SUPPLY CHAIN
We recognise the need to manage our supply chain sustainably given the volume and value of our annual purchases. As far as possible, we support local suppliers in order to stimulate the local economy. We treat all our suppliers fairly and with integrity, as we seek to establish strong working relationships based on mutual respect. Towards this end, we are guided by TNB’s Procurement & Supply Chain Policy and Procedures which include a Procurement Code of Conduct. Procurement at TNB is governed by our Board Tender Committee (BTC) and management tender committees.
Various initiatives have been done to enhance our technological ability to implement best procurement practices such as implementation of P&SC e-Approval (PSAS), Electronic Processes, LAPASAR (internal online purchasing channel) and Robotic Process Automation (RPA).
Cyber drills
FY20162 FY20173 FY20183

About TNB
Our Business
Business Context
Performance Review
Sustainability Statement
Governance
Financial Statements
Additional Information
p.78 Sustainability Statement
In line with Reimagining TNB, we strive to win our
customers by building long-term and meaningful
relationship through our ongoing customer-
centric approaches. To date, we serve a total of
9,029,385 customers in the domestic (residential),
commercial and industrial segments.
As part of efforts to enhance our customer
experience, on 1 August 2018 we separated
our Distribution Network and Retail Divisions.
Our customer-centric Retail Division has been
entrusted with further entrenching our presence
in the retail space through the levers of quality
customer service, innovative solutions together
with customer and stakeholder communications.
We are continuously engaging the customers via
various methods encompassing click, call and
come over channels as part of our efforts to reach
out to all walks of customers, through outreach
programmes, personal engagements and meet-
ups with associations, consumer groups and all
related stakeholders.
TNB customers in Peninsular Malaysia FY2018
7,362,967 Domestic
1,552,709 Commercial
29,687 Industrial
84,022* Others
9,029,385 TOTAL CUSTOMERS
Note: * Others consist of mining, street lighting, agriculture, RE generators and free units
Deployment of Smart Meters -Our Advanced Metering Infrastructure
TNB is currently improving its grid infrastructure
in transition towards Smart Grid, where Advanced
Metering Infrastructure (AMI) is being installed
rapidly. This will provide customers with more
detailed and near real-time information on their
energy consumption as well as promote energy
efficiency practices and related services.
Top quartile of CSI at 81%
160,000 customers experienced smart meters
47,792MWh energy saving from Home Energy Report Phase 2
• Customer Experience
• Energy Efficiency
KEY HIGHLIGHTS
MATERIAL MATTERS
We have installed 160,000 smart meters in Melaka
as of December 2018, with a further 180,000
smart meters to be installed. Moving forward, we
will roll out smart meter in urban areas of Klang
Valley.
SOLUTIONS BEYOND kWh
We are continuously working on winning the
customers through delivery of personalised
solutions, targeted to enrich their lifestyles and
improve their experience in better, brighter ways.
Energy Efficiency - Empowering Smarter Choices for Our Customers
In 2018, 40 Energy Efficiency sessions were
conducted by Retail Division targeting
Government agencies, NGOs, community
leaders, universities, schools, as well as TNB
staff. We are not only equipping our customers
with the knowledge to be energy efficient, but aim
to empowering them to manage energy efficiently
through customer offerings and solutions.
Delivering With PurposeCustomer Centricity
TNB is continuously engaging and winning the customers through delivery of high quality services standards.
AFFORDABLE AND CLEAN ENERGY07 DECENT WORK
AND ECONOMIC GROWTH
08 PARTNERSHIPS FOR THE GOALS17CLIMATE
ACTION13
We seek to win customer trust and loyalty over the long term through effective
engagement, quality service and exceptional customer experience
Direct Contribution

About TNB
Our Business
Business Context
Performance Review
Sustainability Statement
Governance
Financial Statements
Additional InformationIntegrated Annual Report 2018
Tenaga Nasional Berhad
Sustainability Statementp.79
Encouraging Local RE Energy Market
We collaborate with the Sustainable Energy Development Authority (SEDA) to manage the Feed-in Tariff (FiT) programme, under which owners of solar
photovoltaic (PV) systems with Feed-in Approvals are able to supply electricity to the grid for a fixed price. To date, 9,354 FiT projects have been
commissioned with an installed capacity of 527.63 MW.
A new Net Energy Metering (NEM) Scheme and Supply Agreement for Renewable Energy (SARE) were announced in November 2018 to grow the solar
industry by opening the market and subsequently spur local players to become regional solutions providers. Through GSPARX Sdn. Bhd., TNB is able to
support the country to meet its new RE target of 20% by 2025 by assisting in the implementation of NEM and SARE. GSPARX Sdn. Bhd. provides a platform
through which TNB can implement beyond-the-meter transactions for SARE such as solar leasing, Power Purchase Agreement (PPA) or a hybrid of both,
as alternatives to direct purchases by customers. For more information on GSPARX Sdn. Bhd., please visit www.gsparx.com.
UNLOCKING VALUE IN LOCAL SOLAR ENERGY MARKET
GSPARX Sdn. Bhd., a fully-owned subsidiary of TNB Renewables Sdn. Bhd.
(TRe), was incorporated in 2018 to grow self generation/ self consumption
business. Its target is to co-invest 500MW of solar energy by 2020 with
TNB’s customers by offering attractive packages with flexible payment
modes to make solar energy more affordable and accessible.
Benefits
Zero upfront
cost
Minimum of 10% savings of electricity
rate
End-to end hassle-free
services
Personalised energy solution
Electricity cost
reduction
Efficient electricity
management
Minister of Energy, Science, Technology, Environment and Climate Change, YB Yeo Bee Yin
visited TNB’s Booth during the ‘International Greentech & Eco Products (IGEM 2018)’.
Home Energy Report (HER)
Using analytics, HER provides customers personalised energy usage reports. Customers can also access the HER online for tips on how to save energy in their home.
During the implementation period of October 2017 to September 2018, HER Phase II programme saved a total of 47,792MWh of electricity. This is more than triple the total energy savings achieved during the Phase I Pilot. The total of carbon emission avoidance is estimated at more than 33,168 tonnes CO2 emissions.
HER Features
Making Electricity Visible (MaEVI)
This Home Energy Management System (HEMS) helps domestic customers monitor their electricity consumption, automate their home appliances and improve their home security, through downloadable app. TNB Energy Services (TNBES) has formed MaEVI Sdn. Bhd. as a subsidiary to manage the business. To learn more, please refer to https://maevi.my/.
Energy Usage
Details
Home Energy
Analysis
Saving Tips Bill Comparison Neighbourhood
Comparison
Energy Performance Contracts (EPCs)
EPCs are formed between energy services companies and facility owners with the primary purpose of improving energy efficiency through investment in energy efficient equipment.
This year, TNBES has entered into an EPC with Universiti Putra Malaysia (UPM) under which it will replace existing fluorescent light fixtures with energy-saving LED tubes. This will help UPM to reduce its electricity consumption by about 890,000kWh a year, saving about RM453,000.
ENERGY EFFICIENCY SOLUTIONS FOR CUSTOMERS
1 2 3 4 5
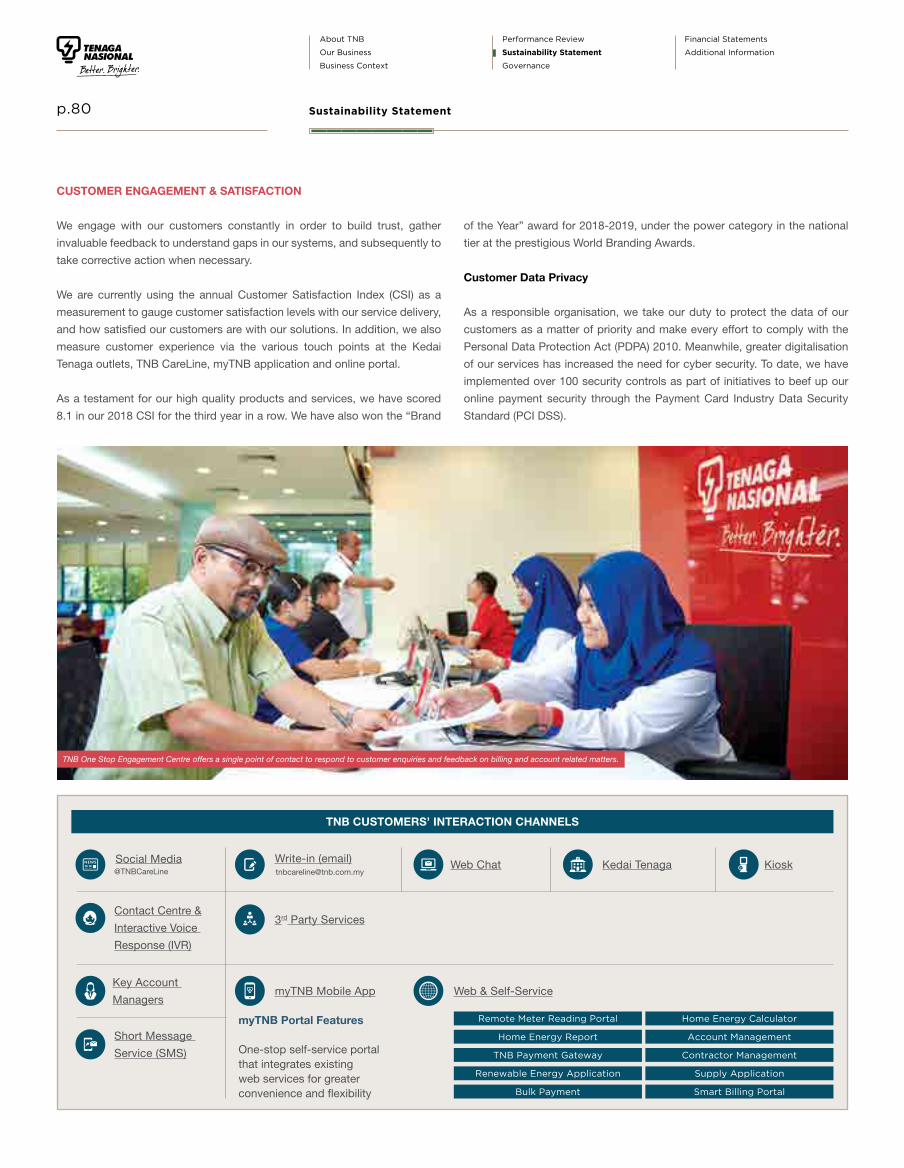
About TNB
Our Business
Business Context
Performance Review
Sustainability Statement
Governance
Financial Statements
Additional Information
p.80 Sustainability Statement
CUSTOMER ENGAGEMENT & SATISFACTION
We engage with our customers constantly in order to build trust, gather
invaluable feedback to understand gaps in our systems, and subsequently to
take corrective action when necessary.
We are currently using the annual Customer Satisfaction Index (CSI) as a
measurement to gauge customer satisfaction levels with our service delivery,
and how satisfied our customers are with our solutions. In addition, we also
measure customer experience via the various touch points at the Kedai
Tenaga outlets, TNB CareLine, myTNB application and online portal.
As a testament for our high quality products and services, we have scored
8.1 in our 2018 CSI for the third year in a row. We have also won the “Brand
TNB CUSTOMERS’ INTERACTION CHANNELS
Home Energy Calculator
Account Management
Contractor Management
Supply Application
Smart Billing Portal
Remote Meter Reading Portal
Renewable Energy Application
Bulk Payment
Home Energy Report
TNB Payment Gateway
Kedai Tenaga
Contact Centre &
Interactive Voice
Response (IVR)
3rd Party Services
Kiosk
myTNB Mobile App Web & Self-Service
myTNB Portal Features
One-stop self-service portal that integrates existing web services for greater convenience and flexibility
Social Media@TNBCareLine
Key Account
Managers
Web Chat
Short Message
Service (SMS)
Write-in (email)[email protected]
of the Year” award for 2018-2019, under the power category in the national
tier at the prestigious World Branding Awards.
Customer Data Privacy
As a responsible organisation, we take our duty to protect the data of our
customers as a matter of priority and make every effort to comply with the
Personal Data Protection Act (PDPA) 2010. Meanwhile, greater digitalisation
of our services has increased the need for cyber security. To date, we have
implemented over 100 security controls as part of initiatives to beef up our
online payment security through the Payment Card Industry Data Security
Standard (PCI DSS).
TNB One Stop Engagement Centre offers a single point of contact to respond to customer enquiries and feedback on billing and account related matters.

About TNB
Our Business
Business Context
Performance Review
Sustainability Statement
Governance
Financial Statements
Additional InformationIntegrated Annual Report 2018
Tenaga Nasional Berhad
Sustainability Statementp.81
OUR ENVIRONMENTAL POLICIES AND GOVERNANCE
Our Environmental Policy complemented by our Green objectives underlines our environmental commitment through sustainable practice. All our power plants and the Grid Maintenance Department have been ISO 14001:2015 Environmental Management Systems (EMS) certified.
We adopt best environmental practices and have embarked on a journey to implement the Guided Self-Regulation (GSR) programme encompassing all our activities and subsidiaries.
GSR was launched by the Department of Environment (DOE) on 16 October 2017 to transform regulation enforcement under the Environmental Quality Act 1974 and enhance environmental awareness and management. It is accompanied by a set of environmental mainstreaming tools for organisations to achieve self-regulation.
WATER AND WASTE MANAGEMENT
Our power plants track water consumption on a monthly basis under a plant optimisation and waste minimisation programme in compliance with ISO 14001. Any deviation from the norm is investigated and accompanied by corrective actions to stop unnecessary water loss.
We also monitor the consumption of materials such as fuel and the discharge of effluents and compare these against baseline data on regular basis.
Optimisation programmes are implemented to identify and manage any discrepancies in consumption. Industrial waste produced at TNB is handled according to the relevant regulations. Best practices have been incorporated into our Health, Safety and Environment (HSE) Department’s Guidelines on Scheduled Waste Management.
BIODIVERSITY MANAGEMENT
We take responsibility in protecting and preserving the flora and fauna in our operating areas.
Our initiatives are based on local contexts and in some cases, on the International Union for Conservation of Nature (IUCN)’s Red List. The Red List guides us in monitoring and protecting the biodiversity at two (2) of our sites - the Hulu Terengganu Hydroelectric Station and Pergau Hydroelectric Station.
At Hulu Terengganu Hydroelectric Station, a total of 18 biodiversity programmes were carried out in FY2018, 9 for fish and 9 for terrestrial, with a total budgeted amount of RM3.15 million and RM2.52 million respectively. Ikan Kelah (Tor tambra) has been identified as protected species in this site, with a total count of 473 fishes as of FY2016. We also carried out various initiatives at other sites to protect this species of fish.
For the Sungai Perak Hydroelectric Station, specifically at the Temenggor Dam, a total of 11 biodiversity programmes were carried out in FY2018, 8 for fish and 3 for terrestrial, with a total budgeted amount of RM1.13 million and RM2.40 million in FY2018 respectively. There are other study initiatives other than the Kelah Sanctuary, at other sites such as the Rafflesia at X-Ray trail and the Saltlick at Sungai Papan. TNB partners with National Hydraulic Research Institute of Malaysia (NAHRIM) to study the enhancement of water management at Sungai Perak and Cameron Highlands. We also launched the “Pengurusan Lestari Sumber Asli Taman Negeri Royal Belum” programme to improve fish resource management and Rafflesia protection in Royal Belum State Park (RBSP).
Site Key Findings
Hulu Terengganu Hydroelectric station
Species Group Number of Species
Fish 24 1 4
Terrestrial 1 9 19 44 209
Sungai Perak Hydroelectric station
Species Group Number of Species
Fish 22 2 1
Terrestrial 5 4 5 30
IUCN Red List
Critically Endangered (CR)
Data Deficient
Near Threatened (NT)Endangered (EN)
Not EvaluatedLeast Concern (LC)
Vulnerable (VU)
Signed Memorandum of Understanding (MoU) with the Department of Environment (DOE) to embrace the Guided Self-Regulation (GSR)
Received certificate of appreciation from the DOE for the environmental sustainability efforts at National Environment Day
A total of RM7.4 million budgeted for fish biodiversity programmes to date
• Environment Management
• Water Management
• Waste Management
• Biodiversity Management
KEY HIGHLIGHTS
MATERIAL MATTERS
Environmental StewardshipMinimising Environmental Impact
TNB carried out various initiatives to protect a number of identified endangered species of fish and terrestrial at their hydro stations.
TNB strives to protect and conserve the environment in our operations and decision-making
as our commitment to continuous improvement of environmental performance
DECENT WORK AND ECONOMIC GROWTH
08
Direct Contribution

About TNB
Our Business
Business Context
Performance Review
Sustainability Statement
Governance
Financial Statements
Additional Information
p.82 Sustainability Statement
Environmental StewardshipClimate Change
AFFORDABLE AND CLEAN ENERGY07 PARTNERSHIPS
FOR THE GOALS17CLIMATE ACTION13
Direct Contribution
Under the Paris Agreement, Malaysia has
committed to reduce its greenhouse gas (GHG)
emissions intensity of GDP by 45% by 2030
relative to the emissions intensity of GDP in 2005.
This consist of 35% on an unconditional basis
and a further 10% upon receipt of climate finance,
technology transfer and capacity building from
developed countries. As the largest electricity
supplier in Malaysia, TNB recognises that we
have a significant role to play in assisting the
government to achieve this goal by aligning our
business activities and decisions with a carbon
mitigation agenda.
Additionally, we are cognisant of growing
stakeholder expectations and the latest
recommendation by Bursa Malaysia’s Listing
Requirements on climate-related financial
disclosures, based on the Task Force on Climate-
related Financial Disclosure (TCFD). Looking ahead,
we will ensure our alignment to the aforementioned
expectations and recommendations, and will
provide further disclosure on our position and
approach in the future.
Guided by our Environmental Policy and Green
Policy, we are also adopting more sustainable
practices along our entire value chain to reduce
our carbon footprint. This is accomplished through
greater focus on renewable generation sources,
clean power assets, and more efficient, digitalised
operations.
Carbon Mitigation Initiatives
Our GHG emissions has increased to 33.50 million
tCO2e in FY2017 due to widening scope covering
TNB Pasir Gudang Energy (TNB PGE) and Kapar
Energy Venture (KEV). TNB’s GHG emissions
intensity was in the range of 0.55 tCO2e/MWh in
FY2016 to 0.54 tCO2e/MWh in FY2017 which
depends on GHG emissions per unit of electricity
generation output of each particular year. To better
monitor and report on our GHG emissions data, we
have developed an internal online GHG Emissions
Management System (GEMS), which will be rolled
out in 2019.
Reduction in GHG emissions intensity to 0.54 tCO2e/MWh*
Total GHG emissions mitigation 5,030,079 tCO2e
Our 50MW Large Scale Solar, cut emissions by approximately 64,000 tCO2e/year
* Emissions intensity in FY2017. FY2018 figures is still in progress and will be disclosed in the next financial year
KEY HIGHLIGHTS
• Greenhouse Gas Emissions
• Renewable Energy
• Energy Efficiency
MATERIAL MATTERS
We are committed towards a low-carbon economy by embracing and supporting renewable
energy generation and energy efficiency
We have been mitigating substantial emissions
through an expansion of our low-carbon generation
portfolio which includes large hydro, renewables
(solar, mini hydro, biogas and biomass) and cleaner
power assets. For instance, in November 2018,
the highly anticipated Large Scale Solar (LSS)
plant in Sepang, Selangor – Malaysia’s first LSS –
was commissioned. The 50MWac will reduce our
emissions by approximately 64,000 tCO2e/year
and boost development in the surrounding areas.
Hydro projects are our major emissions
mitigation contributor, with a total of 3,597,007
tCO2e emissions mitigation in 2017. The latest
coal generation plants using ultra-supercritical
technology consume less fuel per MWh electricity
produced in comparison to conventional coal
power plant further contributing to lower carbon
emissions.
The 250MW Hulu Terengganu hydroelectric station has further boosted TNB’s hydro installed capacity.

About TNB
Our Business
Business Context
Performance Review
Sustainability Statement
Governance
Financial Statements
Additional InformationIntegrated Annual Report 2018
Tenaga Nasional Berhad
Sustainability Statementp.83
TNB’s GHG Emissions (tCO2e) Unit FY2016 FY2017*
Scope 1** tCO2e 28,492,111.00 33,108,297.42
Scope 2**
(Electricity Consumption)
tCO2e 569,079.00 395,506.80
Total GHG Emissions Mitigation*** tCO2e 2,359,770.65 5,030,079.70
GHG Emissions Intensity tCO2e/MWh 0.55 0.54
Note: Figures for FY2018 are in progress.
* Extended scope to include TNB Energy Ventures, TNB Non-Cores (Corporates) and TNB Generation subsidiaries which are TNB Pasir Gudang Energy (TNB PGE) and Kapar Energy Ventures (KEV).
** Scope 1 refers to direct emissions from owned or controlled sources, while Scope 2 emissions are indirect emissions from the generation of purchased energy.
*** Generation source/technology used include Hydro, RE and efficient technology power plant.
ENERGY CONSUMPTION AND EFFICIENCY
Through the years, we have been retrofitting
facilities across our office buildings. This
initiative is very much aligned and in support of
the Government emphasis on energy efficiency
in buildings. The total energy consumption for
TNB buildings in Peninsular Malaysia for FY2018
is 322,025,722kWh.
In 2018, under Phase 2 of our Energy Efficiency
Rewards Programme, we undertook five (5)
Energy Efficiency Retrofitting projects across
seven (7) TNB buildings nationwide:
• Centralised Energy Efficiency Monitoring
System (CEEMOS)
• Energy Efficient Lighting (LED)
• Power Factor Improvement
• Chiller Optimiser
• Variable Speed Drive (VSD) for centralised AC
system motors
INTERNAL AWARENESS
In 2018, a series of knowledge sharing sessions
on Carbon Footprint and Mitigation Assessment
to TNB Divisions were conducted in raising
the awareness in greenhouse gas emissions
reporting and management.
Our Wisma TNB Jalan Timur won the Energy Management for Buildings and Industries Award under the Large Building Category.

About TNB
Our Business
Business Context
Performance Review
Sustainability Statement
Governance
Financial Statements
Additional Information
p.84 Sustainability Statement
EMPLOYER OF CHOICE
As we believe our people are our
most important asset, we seek to
attract and retain the best talents.
This, in turn, rests on being an
“Employer of Choice”.
HR previously launched, the “HR
Guiding Principles - Focused on
People with Care; Clarify of Actions
with Knowledge; Simplicity of
Processes with Trust.” To implement
and embed this throughout the
organisation, we introduced the HR
Leap 6 Project. Through HR Leap 6,
we will continue driving towards a
high-performing culture, in line with
Reimagining TNB.
677,960 training hours forTNB Company
• Diversity and Inclusion
• Workplace Culture
• Employee Engagement
• Capability Development
KEY HIGHLIGHTS
MATERIAL MATTERS
In line with designating 2018 as the Year of The People, TNB’s management invested even more
effort on employee engagement, and inspiring our people to embrace an “adaptive culture”. The
idea is to remain agile in the way we work and be open to new ways of doing things
by World HRD Congress
Malaysia Best Employer Brand Award 2018
Through Leap 6 initiatives, we have been able to enhance HR policies and processes throughout our system for a
better employee experience.
Business Driven
Adaptive Mindset
Learning Organisation
Agile Workforce
Total Motivation
Legacy
HR policies and process categorized into 6 Pillars
HUMAN RESOURCES LEAP 6
HR Leap 6 project is a strategy to support TNB towards its Reimagining TNB aspirations. HR Policies and Processes
are established and reviewed in light of the Leap 6 Pillars. The objective is to transform our HR culture into an
adaptive and high-performing culture. Each of the 6 pillars have an identified North Star to guide its implementation:
Embracing RelationshipUnlocking People Value
Investment up to RM142 million on training and development
We focused in maximising the potential of human capital across the organisation in order to inspire TNB to greater heights.
TALENT ATTRACTION
We believe in recruiting bright and young talent and develop them within the organisation. This is reflected in the age
profile of our recruits where 98.9% of our new hires were millennials (total: 1,788).
DECENT WORK AND ECONOMIC GROWTH08
Plan
Recruit
Develop
Retain
Grow
Exit
Direct Contribution

About TNB
Our Business
Business Context
Performance Review
Sustainability Statement
Governance
Financial Statements
Additional InformationIntegrated Annual Report 2018
Tenaga Nasional Berhad
Sustainability Statementp.85
Our key initiatives for FY2018 were:
• Participated in five (5) career fairs in the
United Kingdom (UK) and Malaysia which also
included participation from our subsidiaries
• Organised career talks and formed a strategic
partnership with iCube, a UK student society
• Formed strategic partnerships with a number of
local academic institutions and organisations
to regularly engage with students to spark an
interest in the energy industry specifically TNB
• Hosted “Tea with Tenaga” sessions at UNITEN
with undergraduates from 10 universities
• In support of the Government’s SL1M initiative
to train graduates who have yet to gain
employment, we brought in a total of 880
trainees (up until 31 August 2018)
• Set up a dedicated onboarding team, enabling
each recruit to have a single contact person
pre-onboarding and on Day 1
CAREER DEVELOPMENT AND TRAINING
As part of becoming an agile workforce, we have
created a High-Impact Learning Culture in which
we offer our people many opportunities for
growth. We view learning and development as
intrinsic in the context of day-to-day work.
training hours for TNB Company
677,960A total of
utilised for general training
3,120 hours
Investment up to
RM142 millionon training and development
TNB employees are provided extensive on-the-job development opportunities including stretch
assignments and is complemented by coaching and mentoring. One of the main focuses in FY2018
is to develop cognitive skills on Business Strategy, Financial Acumen and Customer Centricity.
Career Enhancement Management
TNB’s Career Enhancement Management (CEM) facilitate towards ensuring all employees have roles
based on their skill sets and competencies. Affected employees are upskilled for present and future
role requirements. Moving forward, CEM aligns its activities towards realising Reimagining TNB.
Renewable Energy Communityand forecasting workforce requirements forRenewable Energy initiatives
Facilitating assignment of manpower for Establishing
Sabah Electricity Sdn. Bhd. (SESB) Task Force SAIDI 150
assignments in CEM platform
43 project CEM Engagement Score
90.29%
Division Academies
To accelerate technical capability development
at TNB, we collaborated with ILSAS to set
up separate academies for Generation, Grid,
Distribution and Procurement Divisions. The
objective is to produce Subject Matter Experts
(SMEs) in each division who will coach others
and provide on-the job technical upskilling to
enhance performance.
Generation Division was the first academy being
set up and had produced 215 SMEs. The SMEs
play a major role in the Division Transformation
Programme which has accumulated savings of
RM1.82 billion since FY2014. Other key initiatives
for the year include:
• Generation Leadership Development (GLD)
Programme to develop the talents to become
the future Functional and Business Leaders for
TNB
• SMEs Development Programme to develop
executives and supervisors with specialised
skill sets
Leadership Development
Nurturing leaders at all levels not only motivates
our employees, it also strengthens our succession
planning, enabling us to develop a strong
pipeline of leaders. This has been integrated into
employees’ Competency Assessment alongside
Technical Competencies.
Our Leadership Development Centre (LDC)
designs new experiential leadership and
development programmes to coach and mentor
employees at all levels. So far, 2,496 training
hours have been recorded in FY2018.
In August 2018, 30 employees selected for the
MBA programme in 2017 graduated from our
third cohort of UNITEN/Melbourne Business
School (MBS) programme.
We also have introduced new programmes
such as New Leadership Initiative: Global
Leaders Programme where specialised training
programmes were organised in different
countries and operations to ensure succession
of qualified employees with both core and
functional competencies.

About TNB
Our Business
Business Context
Performance Review
Sustainability Statement
Governance
Financial Statements
Additional Information
p.86 Sustainability Statement
ENGAGING AND LISTENING TO OUR PEOPLE
We engage employees in two-way communication in order to harness their
views for the benefit of the Company.
DIVERSITY AND INCLUSION
We recognise the value that
diversity brings to the workplace,
in broadening our intellectual
perspective and enriching the
basis on which important decisions
are made. We provide a convenient
work space where people of
diverse backgrounds feel safe and
motivated to work.
* FPE 31.12.2017 denotes 1 September to 31 December 2017
FY20
16
FY20
17
*FP
E
31.1
2.20
17
FY20
18
FY20
16
FY20
17
*FP
E
31.1
2.20
17
FY20
18
FY20
16
FY20
17
*FP
E
31.1
2.20
17
FY20
18
FY20
16
FY20
17
*FP
E
31.1
2.20
17
FY20
18Breakdown
By Gender (%)
BreakdownBy Age Generation (%)
Women In Senior Management (%)
Employees WithDisabilities (No.)
Male FemaleMale Female
20
80 79.7 79.5 80
2020.3 20.521.5 19 18.4 16.2
29.3 32 34.2
44
4
6
36 33
4448
• Intranet
• Bulletins
• Tenagawan Daily newsletter
• Social Media
• TV TNB/Info TV
• Livewire
• Townhall
• Outreach and learning sessions
• Morning talk
Online/virtual Physical Engagements
Channels of communication
4,229East
6,051North
5,195South
12,890Central
6Sabah
Peninsular Malaysia
East Malaysia
Total number of employees for TNB Company
Total number of employees
for TNB Group
35,574
28,371
UPDATE ON OUR LEADERSHIP DRIVE
Leadership Drive (LD) blends experiential with classroom lessons
and mission-based work assignments. Launched in FY2016
targeting high potential executives, we have trained three (3)
batches of employees. The third batch was specifically for senior
managers. Future programmes will be extended to managers and
executives.
Season No. of Talents
LD One 32
LD Two 11
LD Three 70
49.2 49 48.9 49.6
13.514.7
15.8 16.7
North
Central
South
EastSabah
Note: All data provided excludes TNB subsidiaries
Millennials (<35 years old)
Generation X(35 - 50 years old)
Baby Boomers(>50 years old)
32.7

About TNB
Our Business
Business Context
Performance Review
Sustainability Statement
Governance
Financial Statements
Additional InformationIntegrated Annual Report 2018
Tenaga Nasional Berhad
Sustainability Statementp.87
5 Integrated Community-Based Disaster Management (ICBDM) exercises conducted
• Safety and Emergency Preparedness
• Health and Well-being
MATERIAL MATTERS
Tenaga Safety Culture launched to inculcate four (4) core values• Assess• Comply
• Intervene• Actively Caring
Golden Globe Tigers Award 2018 - Best in Managing
Health at Work
Won
by World HRD Congress
Lost Time Injury Frequency (LTIF)
(Per Million Man-Hours)
Notes: • All data provided excludes TNB subsidiaries • FPE 31.12.2017 denotes 1 September to
31 December 2017
Number of Lost Time
Injuries
Number of Lost Days
Lost Days Severity Rate
(per million man hours)
153 13,531 185.16
WHAT SAFETY MEANS TO US
Our people are exposed to various risks in their
line of work, thus, we never compromise on
safety and ensure everyone “Get Home Safe”.
We are guided by TNB’s Safety and Health Policy
to produce a comprehensive safety governance
framework. Safety and Health Committees
have been set up in all departments and all
committee members meet on a quarterly basis
to discuss safety performance and address any
shortcomings.
As part of continuous efforts to improve our
safety procedures, we introduced a new HSE
management manual, namely the Health, Safety
and Environment Management System (HSEMS).
The manual is expected to be fully implemented
by end of 2020. Supplementing our aspiration for a
safe work culture, we also have TNB’s Life-Saving
Rules (LSR), which comprises nine (9) rules focused
on saving lives and preventing serious injuries.
strive towards enforcing greater awareness and
inculcate a stronger safety culture to improve our
overall safety performance.
All our power plants and grid have been Occupational
Health and Safety Assessment Series certified
(OHSAS 18001:2007) while our Distribution Network
Division has embarked on implementing this
standard and expects to be certified by end 2019.
Safety Performance
In FY2018, we have recorded a Lost Time Injury
Frequency (LTIF) of 2.08 with higher accidents
reported throughout the Company. Unfortunately,
we have recorded 2 employee fatalities and 4
fatalities involving contractors. Our statistics
show that 48% of Lost Time Injury (LTI) cases are
motor vehicle accidents.
To increase awareness and as part of mitigation
efforts, we have conducted motorcycle safe
riding programme for all meter readers in
collaboration with Malaysian Institute of Road
Safety Research (MIROS) as well as audit for safe
riding implementation. Moving forward, we will FY20
16
FY20
17
FPE
31
.12.
2017
FY20
18
1.06
2.08
1.44 1.54
KEY HIGHLIGHTS
We seek to create a Generative Safety Culture in which everyone is concerned not only of his or
her own safety, but also the safety of their colleagues to achieve zero accidents and fatalities
Embracing RelationshipGenerative Safety Culture
Health and Safety will always be on top of our agenda and this shall be based on respective each other and guided by rules.
DECENT WORK AND ECONOMIC GROWTH08
Direct Contribution

About TNB
Our Business
Business Context
Performance Review
Sustainability Statement
Governance
Financial Statements
Additional Information
p.88 Sustainability Statement
Emergency Preparedness
Our group-wide business continuity is safeguarded by the TNB Business
Continuity Management (BCM) Framework, which enables prompt and
coordinated response and recovery in the event of a crisis. At the corporate
level, the effectiveness of the framework was tested through communication
and full-scaled drills in response to electricity supply disruption scenarios.
This framework is the focal point of reference for business units in
formulating and implementing its BCM strategy and practices tailored to
its business objectives and critical functions. For example, power plants
are responsible to design, implement and regularly test their emergency
response and recovery plans. In addition, our Integrated Community Based
Disaster Management exercises are conducted for communities close to
our hydroelectric power plants and in FY2018, these were conducted in
Cameron Highlands, Hulu Terengganu and Kuala Kangsar districts.
SUPPORTING EMPLOYEE HEALTH & WELLNESS
We promote a healthy lifestyle among employees and their families through
our Total Wellness Programme. To date, the Total Wellness Programme has
been conducted at 135 stations nationwide, where face-to-face awareness
and education sessions are held with employees. We have also compiled
the health data of 16,634 employees based on screening results.
Some of our highlights for FY2018 include:
• TNB’s 71 Kelab Kilat around Malaysia organised various
health-promoting activities
• Signatory to the Ministry of Health’s Healthy Community, Mighty
Country (KOSPEN) programme which focuses on weight management,
health screening and maintaining a positive mental outlook
• Organised TNB Family Wellness Day involving 9,657 TNB staff
• Eight (8) TNB cafeterias have been certified “healthy” by the Ministry
of Health
• A total of 61 TNB gyms were established across TNB offices
More initiatives are in the pipeline under the Total Wellness Programme as
we look to expand the reach of the programme and nurture healthy and
health-conscious workforce.
TNB encourages wellness in our workplace by adopting various approaches to monitor employees’ health and promote regular physical activities.

About TNB
Our Business
Business Context
Performance Review
Sustainability Statement
Governance
Financial Statements
Additional InformationIntegrated Annual Report 2018
Tenaga Nasional Berhad
Sustainability Statementp.89
Allocated RM10 million under My Brighter Future programme
110,335 streetlights replaced with LED lights nationwide
• Community Development
• Education
MATERIAL MATTERS
We strive to make people’s lives better and brighter through our conviction in sustainability,
and commitment towards people and the environment. We do this by supporting them with
skill, sustaining the environment and enhancing their livelihood. We engage in a wide range of
programmes that seek to leave a long-lasting positive impact to people and communities
Total contributions/sponsorships of approximately RM14.2 million
KEY HIGHLIGHTS
GIVING BACK TO THE COMMUNITY
We seek to create better, brighter lives by providing a positive impact on
the communities through our initiatives and investments in community
programmes that support Nation-building.
Aside from self-initiated programmes, we also form partnerships with the
government, charitable bodies and NGOs. In FY2018, our total contributions
and sponsorships were approximately RM14.2 million.
Our focus are based on our beliefs as follows:
• Economic & Social - We believe that capability, social, and community
development support livability and enhancing livelihood by uplifting the
economic and social quality of life.
• Environment - We believe that the future of our planet and next generation
depends on our responsible behavior today.
• Education - We believe education can transform lives of not just one
individual but families and generation.TNB continues to uplift the lives of the communities in the areas of education, human capital development and community enrichment.
Embracing RelationshipBrightening Surrounding Communities
We seek to create better brighter lives by providing a positive impact on the communities in which we operate.
DECENT WORK AND ECONOMIC GROWTH
08 PARTNERSHIPS FOR THE GOALS17
Direct Contribution

About TNB
Our Business
Business Context
Performance Review
Sustainability Statement
Governance
Financial Statements
Additional Information
p.90 Sustainability Statement
Rewiring Programme LED Streetlight Replacement Programme
• 83 homes were refurbished at a cost of RM192,987.18• TNB targets to rewire 1,000 underprivileged homes across
Peninsular Malaysia
• Total of 110,335 units of LED lights have been installed nationwide to replace ordinary High Pressure Sodium Vapour (HPSV) lamps
Economic and Social Transformation Programmes
Rural Electrification Programme (Bekalan Elektrik Luar Bandar (BELB))
Village Street Lighting Project (Lampu Jalan Kampung (LJK))
• Phase 8 completed with 91,782 lights installed (81,249 in Peninsular Malaysia and 10,533 in Sabah)
• Phase 9 progress is currently at 90.53%, where 25,131 out of 27,760 units installed to-date- Covers Peninsular Malaysia and Sabah (including Labuan) with
a total cost of RM30.76 million
• BELB Kampung Orang Asli Sungai Siput Perak Phase 1 – Pos Yum, Kuala Mu and Kampung Jong was completed (tested and commissioned on 24 December 2018)
• Under BELB 2017-2018, TNB was contracted to supply electicity for 30 Kampung Orang Asli across 6 states in Peninsular Malaysi- to date, we have completed 41% of the installation
• The purpose of the Rural Electrification programme is to support the bigger agenda to increase well-being and the social economy of the communities in the rural areas

About TNB
Our Business
Business Context
Performance Review
Sustainability Statement
Governance
Financial Statements
Additional InformationIntegrated Annual Report 2018
Tenaga Nasional Berhad
Sustainability Statementp.91
Home For Needy Programme
• Programme benefited 150 families, from a total contribution of RM7.5 million
• Projek Baiti Jannati – 122 families benefited from a total contribution of RM6.1 million
• Program Mesra Rakyat – 28 families benefited from a total contribution of RM1.4 million
Better Brighter Shelter (BBS) Programme
• Total sponsored in FY2018 is RM2.2 million • As of 2018, 19,857 people benefited from the Better Brighter
Dormitory for the Institut Jantung Negara (IJN) • To date, 2,000 people benefited from the Better Brighter Anjung
Kasih at Hospital Serdang, Yayasan Kebajikan Negara (YKN)• It is expected that this programme will be expanded to the state of
Melaka by 2019
Fireflies Conservation Project
• Total of RM1.9 million was disbursed in FY2018 in terms of Research & Development (R&D)
• Three (3) more villages were added in addition to Kampung Kuantan (Selangor): Kampung Yak Yah, Kemaman (Terengganu), Kampung Sungai Timun, Rembau (Negeri Sembilan) and Kampung Dew, Taiping (Perak)
Tree For A Tree Programme
• Invested a total of RM1.56 million to plant a total of 17,608 trees since the programme’s inception
Environmental Sustenance Programmes

About TNB
Our Business
Business Context
Performance Review
Sustainability Statement
Governance
Financial Statements
Additional Information
p.92 Sustainability Statement
TRANSFORMING LIVES THROUGH EDUCATION
Our educational efforts are undertaken by our foundation, Yayasan Tenaga Nasional (YTN) as well as our EduHub, which groups together Universiti Tenaga
Nasional (UNITEN); Leadership Development Centre (LDC) and our in-house capacity building centre, TNB Integrated Learning Solutions (ILSAS).
Yayasan Tenaga Nasional (YTN)
YTN was founded in 1993 to provide financial aid to various communities and organisations. Today, its focus is primarily on education, and specifically its
scholarship programmes.
The foundation’s objectives are:
• To establish, maintain and administer scholarship funds and to award scholarships for pre-university, undergraduate or postgraduate studies at any
institution
• To foster, develop and improve different types of education as approved under the Educational Law of Malaysia
• To grant donations to local and national institutions or organisations approved by the Director General of Inland Revenue
• To assist, aid and provide relief to the poor and needy
To date, more than 11,000 students have been able to pursue tertiary education, either locally or abroad. YTN runs motivational and thought-leadership programmes
for its scholars and other Malaysian youth. For further information on YTN’s initiative, visit https://ytn.tnb.com.my/.
3,145graduates produced for FY2018
93.69%Employability rate within 6 months
TOP 7 in Malaysiain Times Higher Education
(THE) World University
Rankings 2019
Entry into
Malaysia Book of Records
for the
Most Number of Paper
Bags
made from Recyclable
Newspapers
UNITEN Highlights
YTN updates in FY2018
UNITEN – the Energy University
UNITEN plays a significant role in offering local and international students quality engineering, IT and business management programmes at the foundation,
diploma, undergraduate and postgraduate levels. The university has also been at the forefront of energy research since it was established in 1997, leveraging
TNB’s extensive industry experience in power generation, grid and distribution network.
Number of YTN scholarship awardedTotal spend on YTN scholars
RM35 million 816 students

About TNB
Our Business
Business Context
Performance Review
Sustainability Statement
Governance
Financial Statements
Additional InformationIntegrated Annual Report 2018
Tenaga Nasional Berhad
Sustainability Statementp.93
300 volunteers from UNITEN took part in Project Newspaper "There's No Planet B". Together with visitors, they made 21,505 paper bags from used newspapers, earning an entry into the Malaysia Book of Records for the Most Number of Paper Bags made from Recyclable Newspapers.
UNITEN Smart UniverCity, implemented in 2018 is a collaboration between UNITEN and TNB to enable UNITEN to become a living lab for smart city solutions. There are five (5) aspects of Smart UniverCity, namely: Smart Lifestyle, Smart Infrastructure, Smart Energy, Smart Mobility and Smart Education.
UNITEN Research Hub was officially launched in 2018 which comprises six (6) research entities namely the Institute of Power Engineering (IPE), the Institute of Sustainable Energy (ISE), the Institute of Energy Policy & Research (IEPRe), the Institute of Informatics & Computing in Energy (IICE), the Institute of Energy Infrastructure (IEI) and the Innovation & Research Management Centre (iRMC). The establishment of this hub defines the determination of UNITEN in producing cutting-edge research that will best serve the society. The hub also highlights opportunities, research and programmes that corresponds to the long-term need of the university’s stakeholders.
Reducing Plastic Pollution through “Project Newspaper”
Smart UniverCity Research Hub
UNITEN Initiatives
TNB Integrated Learning Solution (ILSAS)
ILSAS has provided technical training and specialised services to TNB and the energy supply industry for over 30 years. The range of programmes and services offered supports its transformation into a leading energy learning centre. Looking ahead, ILSAS has developed a business plan for 2019 – 2030 to be a Global Leader Learning Solution Provider.
Notable recognitions and achievements in FY2018
Approved City and Guilds (UK) Centre
Institute of Leadership Management
(ILM) (UK) Centre
Department of Occupational Safety and Health
(DOSH) Examination Centre
Awarded the Top 20 Training Providers under the
Human Resources Development Fund (HRDF),
almost every month
with
304 staff
147 trainers
50,571 individuals
Surpassed
RM136 million
revenue in FY2018
trained*
* Number of individuals trained is recorded in accumulative man-days
For further information on our sustainability performance and initiatives, please refer to our upcoming Sustainability Report.

About TNB
Our Business
Business Context
Performance Review
Sustainability Statement
Governance
Financial Statements
Additional Information
p.94 Sustainability Statement
Trust Schools Programme
• Public-private partnership between Malaysia’s Ministry of Education and Khazanah Nasional’s Yayasan AMIR
• Total contribution of RM6.4 million to our eight (8) adopted schools
• TNB has committed to providing RM800,000 per year to each of the eight (8) schools over a period of five (5) years
My Brighter Future (MyBF) Programme
• TNB allocated RM10 million for 1,000 students from low-income families for this scholarship programme through YTN
• The scholarship is offered for studies in the fields of Science, Technology, Engineering and Mathematics (STEM)
Back-To-School Programme
• Benefited 13,040 underprivileged primary school students from 50 locations nationwide
• All students received various school supplies amounting to RM1.94 million
Educational Development Programmes

About TNB
Our Business
Business Context
Performance Review
Sustainability Statement
Governance
Financial Statements
Additional InformationIntegrated Annual Report 2018
Tenaga Nasional Berhad
Sustainability Statementp.95
National Hockey Development and Thunderbolts Programme
• Four (4) schools adopted since programme inception: - Sekolah Sukan Bukit Jalil, Federal Territory of Kuala Lumpur - Sekolah Sukan Tunku Mahkota Ismail, Johor - Sekolah Menengah Kebangsaan Seberang, Temerloh, Pahang - Sekolah Menengah Kebangsaan Anderson, Ipoh, Perak• The total contribution of RM6 million in FY2018 included sponsorship
to Malaysia Hockey Confederation in supporting national hockey tournament
Pintar School Adoption Programme
• Total contribution of RM1 million in FY2018 • 18 schools adopted for the next three (3) years from
FY2017 onwards• 58 schools adopted nationwide to-date
B40 Programme
• Joint collaboration with Yayasan Raja Zarith Sofiah, Johor to help students from B40 families (RM3,000 or less per month)
• 54 students from three (3) schools within the vicinity of TNB’s Headquarters in Kuala Lumpur are to receive RM1,500 per year for a period of three (3) years (2018-2020) and sponsored to attend any value-added programme organised by TNB such as motivational camps, outreach programmes and others

www.tnb.com.my

About TNB
Our Business
Business Context
Performance Review
Sustainability Statement
The Strength of Our Governance
Financial Statements
Additional InformationIntegrated Annual Report 2018
Tenaga Nasional Berhad
p.97
98 Chairman’s Introduction
100 A Committed Board
111 An Effective Leadership
118 Leadership & Effectiveness
- Nomination and Remuneration Committee Report
132 Accountability
- Audit Committee Report
- Risk Committee Report
- Internal Audit Function
141 Relations with Shareholders
144 Statement of Risk Management and Internal Control
THESTRENGTH OF OUR GOVERNANCE
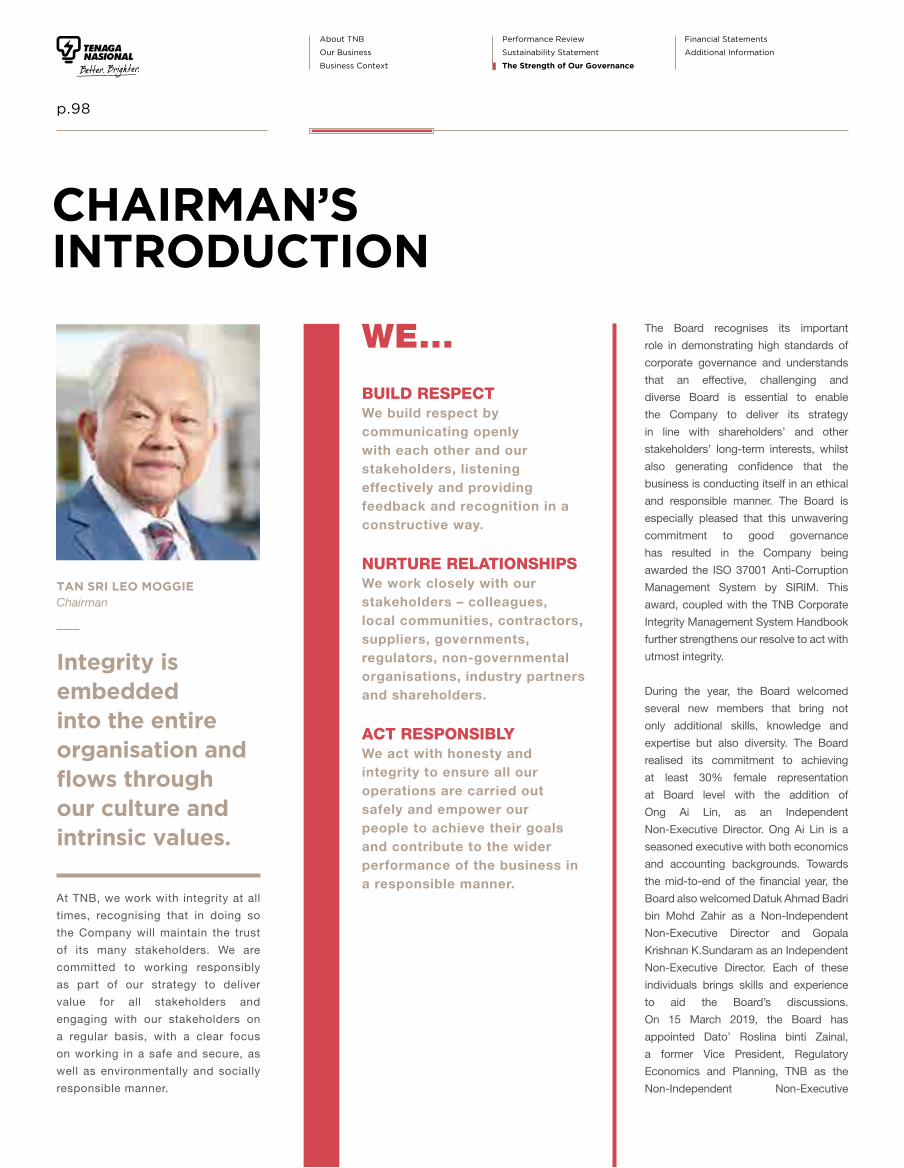
About TNB
Our Business
Business Context
Performance Review
Sustainability Statement
The Strength of Our Governance
Financial Statements
Additional Information
p.98
TAN SRI LEO MOGGIEChairman
Integrity is embedded into the entire organisation and flows through our culture and intrinsic values.
CHAIRMAN’SINTRODUCTION
At TNB, we work with integrity at all
times, recognising that in doing so
the Company will maintain the trust
of its many stakeholders. We are
committed to working responsibly
as part of our strategy to deliver
value for all stakeholders and
engaging with our stakeholders on
a regular basis, with a clear focus
on working in a safe and secure, as
well as environmentally and socially
responsible manner.
The Board recognises its important
role in demonstrating high standards of
corporate governance and understands
that an effective, challenging and
diverse Board is essential to enable
the Company to deliver its strategy
in line with shareholders’ and other
stakeholders’ long-term interests, whilst
also generating confidence that the
business is conducting itself in an ethical
and responsible manner. The Board is
especially pleased that this unwavering
commitment to good governance
has resulted in the Company being
awarded the ISO 37001 Anti-Corruption
Management System by SIRIM. This
award, coupled with the TNB Corporate
Integrity Management System Handbook
further strengthens our resolve to act with
utmost integrity.
During the year, the Board welcomed
several new members that bring not
only additional skills, knowledge and
expertise but also diversity. The Board
realised its commitment to achieving
at least 30% female representation
at Board level with the addition of
Ong Ai Lin, as an Independent
Non-Executive Director. Ong Ai Lin is a
seasoned executive with both economics
and accounting backgrounds. Towards
the mid-to-end of the financial year, the
Board also welcomed Datuk Ahmad Badri
bin Mohd Zahir as a Non-Independent
Non-Executive Director and Gopala
Krishnan K.Sundaram as an Independent
Non-Executive Director. Each of these
individuals brings skills and experience
to aid the Board’s discussions.
On 15 March 2019, the Board has
appointed Dato’ Roslina binti Zainal,
a former Vice President, Regulatory
Economics and Planning, TNB as the
Non-Independent Non-Executive
WE...
BUILD RESPECTWe build respect by communicating openly with each other and our stakeholders, listening effectively and providing feedback and recognition in a constructive way.
NURTURE RELATIONSHIPSWe work closely with our stakeholders – colleagues, local communities, contractors, suppliers, governments, regulators, non-governmental organisations, industry partners and shareholders.
ACT RESPONSIBLYWe act with honesty and integrity to ensure all our operations are carried out safely and empower our people to achieve their goals and contribute to the wider performance of the business in a responsible manner.

About TNB
Our Business
Business Context
Performance Review
Sustainability Statement
The Strength of Our Governance
Financial Statements
Additional InformationIntegrated Annual Report 2018
Tenaga Nasional Berhad
p.99 Chairman’s Introduction
Director. Her inclusion shall further
strengthen the Board and give valuable
insight on the future regulatory landscape
of the electricity industry. Further
details of the appointment of the new
Non-Executive Directors are provided
on pages 107 to 109. The Board also
thanked the departing members for their
insightful contributions and for laying the
foundations of strengthened governance
within the Group.
The Board spends considerable
time focusing on how the strategy is
being implemented and monitoring
progress. We also focus on the
longer-term future and the implications
that a changing marketplace might have
for the business. We do this in several
ways, including actively seeking out
internal and external perspectives on how
the marketplace might develop, the risks
and opportunities which exist and how
these are being addressed.
The Board has continued to devote
time to strengthening risk management
systems across the Group and this has
generated thoughtful discussion on risk
appetite and risk mitigation in both the
Board Risk Committee and around the
boardroom table. The approach taken by
the Group to risk management, and how
it tracks and mitigates the principal risks
it faces, is intended to enable the Group
to respond swiftly to changing market
conditions or external events as they
arise.
TAN SRI LEO MOGGIEChairman
The following pages provide an explanation of our work throughout the year, and detail our continued commitment to deliver transparent and sustainable value to all our stakeholders.
BOARD BALANCE AND COMPOSITION
DIRECTOR’S CORE AREA OF EXPERTISE
5 11
IndependentNon-ExecutiveDirectors
Non-IndependentExecutiveDirector
Non-IndependentNon-ExecutiveChairman3 Non-Independent
Non-ExecutiveDirectors
The difference of tenure served
by our Board ensures we
optimise transparency and
accountability.
The diversity of expertise among our Board ensures we achieve a balanced perspective
in decision-making.
> 5 Years
< 1 Year
1 - 5 Years
Finance & Accounting Legal Engineering Others
100%80%60%40%20%
LENGTH OF TENURE
1
5
50%
10% 10%
30%
4

About TNB
Our Business
Business Context
Performance Review
Sustainability Statement
The Strength of Our Governance
Financial Statements
Additional Information
p.100
Age: 77 Gender: MALE Nationality: MALAYSIAN
Year(s) of Directorship:
15 years
Date of Last
Re-Appointment:
18 December 2017
Board Meeting Attendance
in the Financial Year:
20/21
TAN SRI LEO MOGGIE Chairman, Non-Independent Non-Executive Director*
*Appointed Director of TNB
Qualification(s):
• Master of Arts in History, University of Otago,
New Zealand
• Master of Business Administration, Pennsylvania
State University, United States of America
• Minister of Energy, Communications and Multimedia (1998 - 2004)• Minister of Works (1989 - 1995)• Minister of Energy, Telecommunications and Posts (1978 - 1989 and 1995 - 1998)• Minister of Local Government, State Government of Sarawak (1977 - 1978)• Minister of Welfare Services, State Government of Sarawak (1976 - 1977)• Member of Council Negri Sarawak (Sarawak Legislative Assembly) (1974 - 1978)• Member of Parliament (1974 - 2004) • Civil Servant in the Sarawak State Civil Service (1966 - 1974)
Skills, Experience and Expertise:
A Committed Board
Date Appointed to the Board: 12 APRIL 2004
Membership of Board Committee(s):F
Present Directorship(s):
Listed Entity
• Nil
Other Public Company
• Chubb Insurance Malaysia Berhad
* Appointed Director pursuant to Clause 20(2) of TNB's Constitution.
A COMMITTED BOARD A Board Audit Committee
F Board Finance And Investment Committee
Chairman of Respective Committee

About TNB
Our Business
Business Context
Performance Review
Sustainability Statement
The Strength of Our Governance
Financial Statements
Additional InformationIntegrated Annual Report 2018
Tenaga Nasional Berhad
p.101
Age: 51 Gender: MALE Nationality: MALAYSIAN
Year(s) of Directorship:
Less than one (1) year
Board Meeting Attendance
in the Financial Year:
NA
AMIR HAMZAH BIN AZIZANPresident/Chief Executive Officer, Non-Independent Executive Director*
*Appointed Director of TNB
• Group Chief Executive Officer, Themed Attractions Resorts & Hotels Sdn. Bhd. (2017 - April 2019)
• Managing Director, Icon Offshore Berhad (2016 - 2017) • Vice President (Lubricants Business), Petroliam Nasional Berhad
(2013 - 2016) • Group Managing Director/Chief Executive Officer,
Petronas Lubricants International Sdn. Bhd. (2012 - 2016) • Vice President (Downstream Marketing),
Petroliam Nasional Berhad (2011 - 2013) • Managing Director & Chief Executive Officer,
Petronas Dagangan Berhad (2010 - 2011) • President & Chief Executive Officer, MISC Berhad (2009 - 2010)
• President & Chief Executive Officer, AET Tankers Holding Sdn. Bhd. (2005 - 2008)
• Regional Business Director, MISC Berhad (2004 - 2005) • General Manager, Corporate Planning, MISC Berhad (2000 - 2004) • Senior Treasury Advisor, Shell International Ltd. (1997 - 2000) • Manager, Planning & Support, Sarawak Shell Bhd. (1996 - 1997) • Performance Improvement Advisor, Sarawak Shell Bhd. (1996) • Head of Financial Services, Sarawak Shell Bhd. (1995 - 1996) • Corporate Finance Advisor, Shell Malaysia Ltd. (1993 - 1995) • Marketing Credit Accountant, Shell Singapore Petroleum Company (Pte) Ltd.
(1992 - 1993)
Skills, Experience and Expertise:
A Committed Board
Date Appointed to the Board: 2 APRIL 2019
Qualification(s):
• Bachelor of Science Degree in Management
(Majored in Finance and Economics), Syracuse
University, New York, United States of America
• Stanford Executive Programme, Stanford
University, Stanford, United States of America
Membership of Board Committee(s):
Attends Board Committees’ Meetings (By Invitation)
Present Directorship(s):
Listed Entity
• UEM Edgenta Berhad
Other Public Company
• Nil
A COMMITTED BOARD T Board Tender Committee
NR Board Nomination And Remuneration Committee
R Board Risk Committee
I Board Integrity Committee
L Board Long Term Incentive Plan Committee

About TNB
Our Business
Business Context
Performance Review
Sustainability Statement
The Strength of Our Governance
Financial Statements
Additional Information
p.102 A Committed Board
Age: 59 Gender: MALE Nationality: MALAYSIAN
DATUK AHMAD BADRI BIN MOHD ZAHIR Non-Independent Non-Executive Director*
*Appointed Director of TNB
• Secretary General of Treasury, Ministry of Finance (12 September 2018 - Present)• Deputy Secretary General (Management), Ministry of Finance (1 April 2018 - 11 September 2018)• Director of National Budget Office, National Budget Office, Ministry of Finance (2 February 2016 - 31 March 2018) • Under Secretary, Strategic Investment Division, Ministry of Finance (13 January 2014 - 1 February 2016) • Deputy Secretary, Loan Management, Financial Market & Actuary Division, Ministry of Finance (29 July 2010 - January 2014) • Senior Principal Assistant Secretary, Market Loan, Bilateral & Multilateral Section, Finance Division, Ministry of Finance (April 2007 - 28 July 2010)• Principal Assistant Secretary, Market Loan Unit, Finance Division, Ministry of Finance (July 2000 - March 2007)• Director’s Advisor, Asian Development Bank, Manila, Philippines (July 1997 - June 2000)• Assistant Secretary, Bilateral Unit, Finance Division, Ministry of Finance (October 1995 - June 1997)• Assistant Secretary, Multilateral Unit, Finance Division, Ministry of Finance (August 1989 - June 1994)• Senior Valuation Executive, C.H. William, Talhar & Wong Sdn. Bhd. (Chartered Surveyors) (1986 - June 1988)
Skills, Experience and Expertise:
Date Appointed to the Board: 1 NOVEMBER 2018
Year(s) of Directorship:
Less than one (1) year
Board Meeting Attendance
in the Financial Year:
2/4 (since appointment date)
Qualification(s):
• Master in Business Administration, University of
Hull, United Kingdom
• Degree in Land and Property Management, MARA
Institute of Technology (now MARA University of
Technology), Malaysia
• Diploma in Public Administration, National Institute
of Public Administration (INTAN), Malaysia
• Diploma in Land and Property Management, MARA
Institute of Technology (now MARA University of
Technology), Malaysia
Membership of Board Committee(s):T NR L
Present Directorship(s):
Listed Entity
• Nil
Other Public Companies
• Permodalan Nasional Berhad
• DanaInfra Nasional Berhad
* Appointed Director pursuant to Clause 20(2) of TNB's Constitution.
A COMMITTED BOARD A Board Audit Committee
F Board Finance And Investment Committee
Chairman of Respective Committee

About TNB
Our Business
Business Context
Performance Review
Sustainability Statement
The Strength of Our Governance
Financial Statements
Additional InformationIntegrated Annual Report 2018
Tenaga Nasional Berhad
p.103
Age: 44 Gender: MALE Nationality: MALAYSIAN
AMRAN HAFIZ BIN AFFIFUDINNon-Independent Non-Executive Director*
*Appointed Director of TNB
• Executive Director, Investments, Khazanah Nasional Berhad (20 April 2018 - Present)• Director, Investments, Khazanah Nasional Berhad (2013 - 2018)• Senior Vice President, Investments (Property/Healthcare), Khazanah Nasional Berhad (2011 - 2013)• Investment Manager, Ethos Capital Sdn. Bhd. (2009 - 2011)• Principal Consultant/Advisor, Nusa Capital Sdn. Bhd. (2006 - 2009)• Director, Juwana Group of Companies (2005 - 2006)• Senior Vice President, Namirah Ventures Pte Ltd (2000 - 2005)• Analyst, Equities Investment, Petroleum Nasional Berhad (1998 - 2000)• Corporate Finance Executive, Group Finance Division, Petroleum Nasional Berhad (1997 - 1998)
Skills, Experience and Expertise:
A Committed Board
Date Appointed to the Board: 22 JUNE 2017
Year(s) of Directorship:
One (1) year
Date of Last
Re-Election:
18 December 2017
Board Meeting Attendance
in the Financial Year:
20/21
Qualification(s):
• Bachelor of Science in Commerce (Majoring in
Accounting and Finance), the McIntire School of
Commerce, University of Virginia, Charlottesville,
United States of America
• Attended executive/professional courses at
Harvard Business School and London Business
School
Membership of Board Committee(s):F NR L I
Present Directorship(s):
Listed Entity
• Nil
Other Public Companies
• Biotropics Malaysia Berhad
• Blue Archipelago Berhad
• Malaysian Agrifood Corporation Berhad
• Iskandar Investment Berhad
A COMMITTED BOARD T Board Tender Committee
NR Board Nomination And Remuneration Committee
R Board Risk Committee
I Board Integrity Committee
L Board Long Term Incentive Plan Committee

About TNB
Our Business
Business Context
Performance Review
Sustainability Statement
The Strength of Our Governance
Financial Statements
Additional Information
p.104 A Committed Board
Age: 62 Gender: FEMALE Nationality: MALAYSIAN
NORAINI BINTI CHE DANSenior Independent Non-Executive Director
• Has over 30 years of experience in audit and finance• Served Pernas International Holdings Berhad for 15 years in various capacities including as Group General Manager Finance and Chief Financial Officer• Head of Finance and Vice President of Finance, MISC Berhad for a total of 10 years• Former Director, Labuan Reinsurance (L) Ltd.• Senior Auditor in the firm of Hanafiah Raslan & Mohamad
Skills, Experience and Expertise:
Date Appointed to the Board: 2 JANUARY 2016
Year(s) of Directorship:
Three (3) years
Date of Last
Re-Election:
15 May 2018
Board Meeting Attendance
in the Financial Year:
19/21
Qualification(s):
• Member of Malaysian Institute of Accountants
• Member of Malaysian Institute of Certified Public
Accountants
• Bachelor of Arts (Economics) (Hons.), University of
Manchester, United Kingdom
Membership of Board Committee(s):A F NR R L
Present Directorship(s):
Listed Entities
• S P Setia Berhad
• BIMB Holdings Berhad
Other Public Company
• Bank Islam Malaysia Berhad
A COMMITTED BOARD A Board Audit Committee
F Board Finance And Investment Committee
Chairman of Respective Committee

About TNB
Our Business
Business Context
Performance Review
Sustainability Statement
The Strength of Our Governance
Financial Statements
Additional InformationIntegrated Annual Report 2018
Tenaga Nasional Berhad
p.105
Age: 69 Gender: FEMALE Nationality: MALAYSIAN
GEE SIEW YOONGIndependent Non-Executive Director
A Committed Board
• Independent Non-Executive Director of various Public Listed Companies since 2001• Has more than 40 years of experience in financial and auditing line within multiple industries• Professional strengths are in Restructuring, Reorganisation, Change Management and Corporate Governance• Worked with PriceWaterhouse in Kuala Lumpur, Malaysia and London, United Kingdom. The last position held was Senior Audit Manager and Continuing
Education Manager, PriceWaterhouse (1969 - 1981)• Group Financial Controller, Selangor Pewter Group (1981 - 1985) - Seconded to the United States of America as Director and Chief Executive Officer of Senaca
Crystal Inc., a company in the Selangor Pewter Group, which was undergoing reorganisation under Chapter XI of the U.S. Bankruptcy Code (1983 - 1984)• Personal Assistant to Executive Chairman of Lipkland Group (1985 - 1987)• Was appointed by Bank Negara Malaysia as Executive Director and Chief Executive of Supreme Finance (M) Berhad, a financial institution undergoing rescue
and reorganisation under the supervision of Bank Negara Malaysia (1987 - 1991)• Group Divisional Chief, Management Development Services, Land & General Berhad (1993 - 1997)• Executive Assistant to the Chief Executive, Multi-Purpose Capital Holdings Berhad (1997 - 1999). During this period, had also served as Director of
Multi-Purpose Bank Berhad and Multi-Purpose Insurans Berhad and Executive Director of Multi-Purpose Trustee Berhad
Skills, Experience and Expertise:
Date Appointed to the Board: 2 JANUARY 2016
Year(s) of Directorship:
Three (3) years
Date of Last
Re-Election:
15 May 2018
Board Meeting Attendance
in the Financial Year:
21/21
Qualification(s):
• Member of Malaysian Institute of Accountants
• Member of Malaysian Institute of Certified Public
Accountants
• International Banking Summer School, Cambridge,
Massachusetts, United States of America
Membership of Board Committee(s):R T
Present Directorship(s):
Listed Entities
• Telekom Malaysia Berhad
• Sapura Energy Berhad
Other Public Company
• Nil
A COMMITTED BOARD T Board Tender Committee
NR Board Nomination And Remuneration Committee
R Board Risk Committee
I Board Integrity Committee
L Board Long Term Incentive Plan Committee

About TNB
Our Business
Business Context
Performance Review
Sustainability Statement
The Strength of Our Governance
Financial Statements
Additional Information
p.106 A Committed Board
Age: 60 Gender: FEMALE Nationality: MALAYSIAN
JUNIWATI RAHMAT HUSSINIndependent Non-Executive Director
Skills, Experience and Expertise:
Date Appointed to the Board: 1 JUNE 2017
Year(s) of Directorship:
One (1) year
Date of Last
Re-Election:
18 December 2017
Board Meeting Attendance
in the Financial Year:
18/21
Qualification(s):
• Bachelor of Science (Hons.) in Chemistry,
University of Kent, Canterbury, United Kingdom
• Certificate in International Management, GE
• Attended the INSEAD Senior Management
Development Programme and Advanced
Management Programme
• Attended the HENLEY Business School Advanced
Management Programme, United Kingdom
Membership of Board Committee(s):NR L T R I
Present Directorship(s):
Listed Entity
• UEM Edgenta Berhad
Other Public Company
• Nil
• 2013 - 2016:- Vice President & Venture Director, Pengerang Integrated Complex - Chief Executive Officer, PETRONAS Refinery and Petrochemical Corporation
Sdn. Bhd.• Vice President, Human Resource Management Division, PETRONAS (2010 - 2012)• Vice President, Education Division, PETRONAS (2009 - 2010)• Chief Executive Officer, Malaysian Philharmonic Orchestra & Dewan Filharmonik
PETRONAS (2005 - 2009)• General Manager (Marketing & Trading-Chemicals), MITCO Sdn. Bhd. (2003 - 2005)• Senior Manager (Marketing & Trading-Chemicals), MITCO Sdn. Bhd. (2001 - 2003)• Manager, Human Resource Management, PETRONAS (1991 - 2001)
• 1994 - 1997:- Manager, Petrochemicals Business Planning Unit, Petrochemical Division,
PETRONAS- Manager, Business Evaluation Department, Corporate Planning Division,
PETRONAS• Executive (Analyst), Refining & Marketing Planning Unit, PETRONAS (1991 - 1994)• Executive (Refinery), PETRONAS Penapisan (Melaka) Sdn. Bhd. (1991)• Production Planner (Refinery), PETRONAS Penapisan (Terengganu) Sdn. Bhd.
(1988 - 1990)• Chemist, Process Engineering & Technical, PETRONAS Penapisan (Terengganu)
Sdn. Bhd. (1982 - 1987)• Chemist, Laboratory Services, PETRONAS (1981 - 1982)
A COMMITTED BOARD A Board Audit Committee
F Board Finance And Investment Committee
Chairman of Respective Committee

About TNB
Our Business
Business Context
Performance Review
Sustainability Statement
The Strength of Our Governance
Financial Statements
Additional InformationIntegrated Annual Report 2018
Tenaga Nasional Berhad
p.107
Age: 64 Gender: MALE Nationality: MALAYSIAN
GOPALA KRISHNAN K.SUNDARAMIndependent Non-Executive Director
A Committed Board
• Consultant, Asian Development Bank (August 2018 - September 2019)• Partners, Abdullah Chan & Co., Advocates & Solicitors (2012 - Present)• Leading adviser on the Financial Services Act 2013 and Islamic Financial Services Act 2013• Former Independent International Consultant, World Bank (August 2017 - 30 June 2018)• Former Director, Kuwait Finance House (Malaysia) Berhad (2012 - June 2016) • Held various positions in Bank Negara Malaysia (Central Bank of Malaysia) (1978 - 2012)
- Project Advisor (2011 - 2012)- Assistant Governor (2006 - 2011)- Assistant Manager/Deputy Director/Director, Legal Department (1990 - 2006)- Senior Executive/Assistant Manager, Secretary’s Department (1985 - 1990)- Senior Executive Banking Department (1982 - 1985)
Skills, Experience and Expertise:
Date Appointed to the Board: 4 JULY 2018
Year(s) of Directorship:
Less than one (1) year
Board Meeting Attendance
in the Financial Year:
9/9 (since appointment date)
Qualification(s):
• Bachelor in Law LL. B. (Hons.), University of
Malaya, Malaysia
• Advocate and Solicitor of the High Court of Malaya
Membership of Board Committee(s):I A R
Present Directorship(s):
Listed Entity
• Nil
Other Public Company
• Nil
A COMMITTED BOARD T Board Tender Committee
NR Board Nomination And Remuneration Committee
R Board Risk Committee
I Board Integrity Committee
L Board Long Term Incentive Plan Committee

About TNB
Our Business
Business Context
Performance Review
Sustainability Statement
The Strength of Our Governance
Financial Statements
Additional Information
p.108 A Committed Board
Age: 63 Gender: FEMALE Nationality: MALAYSIAN
ONG AI LINIndependent Non-Executive Director
• Held various positions in PricewaterhouseCoopers Malaysia- Partner/Senior Executive Director (1993 - June 2016)- Senior Manager (1991 - 1992)
• Kassim Chan & Co. (DH&S Malaysia) and DH&S Singapore (1986 - 1991)• Deloitte Haskins & Sells (DH&S), London, United Kingdom (1978 - 1986)
Skills, Experience and Expertise:
Date Appointed to the Board: 1 AUGUST 2018
Year(s) of Directorship:
Less than one (1) year
Board Meeting Attendance
in the Financial Year:
6/7 (since appointment date)
Qualification(s):
• Bachelor of Arts (Hons.) in Economics, University
of Leeds, United Kingdom
• Associate of the Institute of Chartered Accountants
in England and Wales (ICAEW)
• Certified Information System Auditor
• Certified Business Continuity Professional
• Member of Malaysian Institute of Accountants (MIA)
• Member of MIA Digital Economy Task Force
• Member of SIRIM ISO Technical Committee on
Information Security
• Past President of Information Systems Audit &
Control Association (ISACA), Malaysia
Membership of Board Committee(s):A R I
Present Directorship(s):
Listed Entity
• RHB Bank Berhad
Other Public Companies
• RHB Islamic Bank Berhad
• FIDE Forum
A COMMITTED BOARD A Board Audit Committee
F Board Finance And Investment Committee
Chairman of Respective Committee
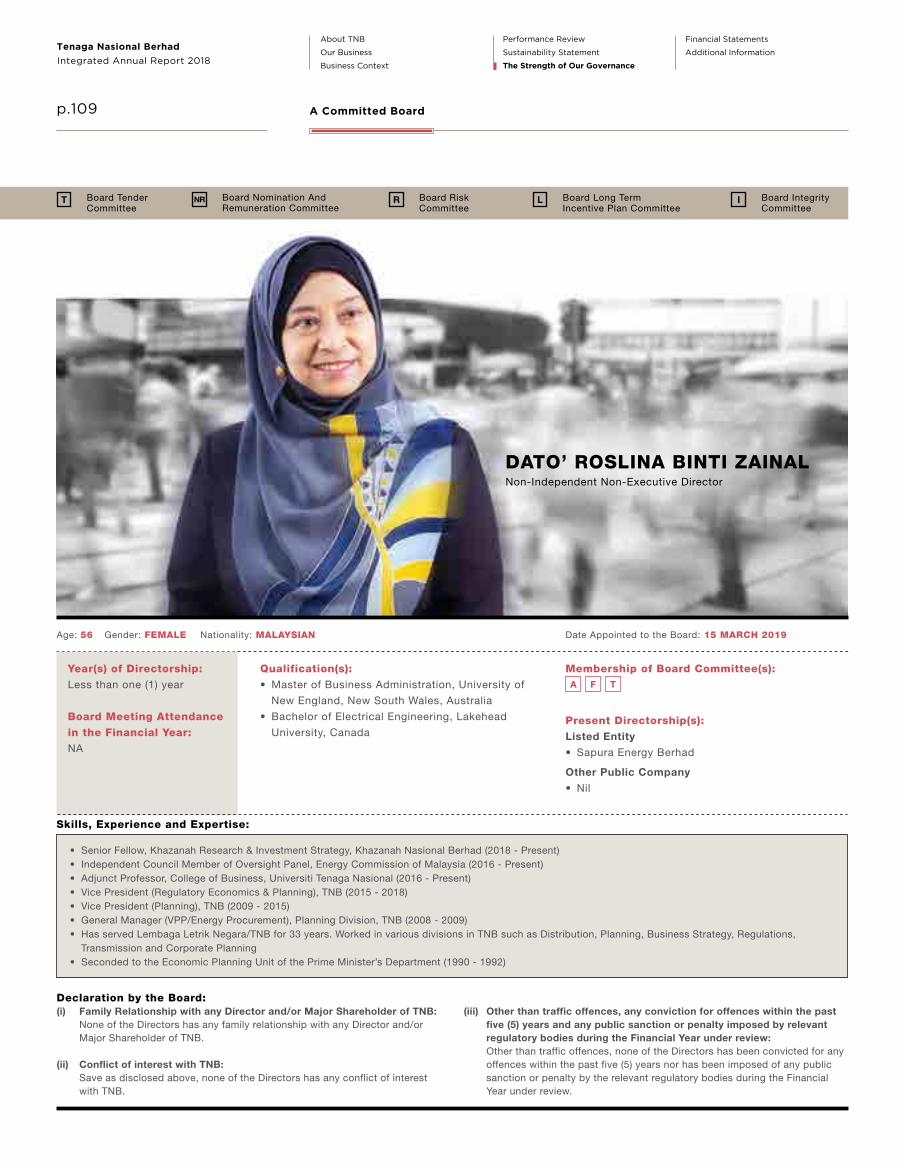
About TNB
Our Business
Business Context
Performance Review
Sustainability Statement
The Strength of Our Governance
Financial Statements
Additional InformationIntegrated Annual Report 2018
Tenaga Nasional Berhad
p.109
Age: 56 Gender: FEMALE Nationality: MALAYSIAN
DATO’ ROSLINA BINTI ZAINALNon-Independent Non-Executive Director
A Committed Board
• Senior Fellow, Khazanah Research & Investment Strategy, Khazanah Nasional Berhad (2018 - Present)• Independent Council Member of Oversight Panel, Energy Commission of Malaysia (2016 - Present)• Adjunct Professor, College of Business, Universiti Tenaga Nasional (2016 - Present)• Vice President (Regulatory Economics & Planning), TNB (2015 - 2018)• Vice President (Planning), TNB (2009 - 2015)• General Manager (VPP/Energy Procurement), Planning Division, TNB (2008 - 2009)• Has served Lembaga Letrik Negara/TNB for 33 years. Worked in various divisions in TNB such as Distribution, Planning, Business Strategy, Regulations,
Transmission and Corporate Planning• Seconded to the Economic Planning Unit of the Prime Minister’s Department (1990 - 1992)
Skills, Experience and Expertise:
Date Appointed to the Board: 15 MARCH 2019
Year(s) of Directorship:
Less than one (1) year
Board Meeting Attendance
in the Financial Year:
NA
Qualification(s):
• Master of Business Administration, University of
New England, New South Wales, Australia
• Bachelor of Electrical Engineering, Lakehead
University, Canada
Membership of Board Committee(s):A F T
Present Directorship(s):
Listed Entity
• Sapura Energy Berhad
Other Public Company
• Nil
Declaration by the Board:(i) Family Relationship with any Director and/or Major Shareholder of TNB: None of the Directors has any family relationship with any Director and/or
Major Shareholder of TNB.
(ii) Conflict of interest with TNB: Save as disclosed above, none of the Directors has any conflict of interest
with TNB.
(iii) Other than traffic offences, any conviction for offences within the past five (5) years and any public sanction or penalty imposed by relevant regulatory bodies during the Financial Year under review:
Other than traffic offences, none of the Directors has been convicted for any offences within the past five (5) years nor has been imposed of any public sanction or penalty by the relevant regulatory bodies during the Financial Year under review.
A COMMITTED BOARD T Board Tender Committee
NR Board Nomination And Remuneration Committee
R Board Risk Committee
I Board Integrity Committee
L Board Long Term Incentive Plan Committee

About TNB
Our Business
Business Context
Performance Review
Sustainability Statement
The Strength of Our Governance
Financial Statements
Additional Information
p.110 Company Secretary
Age: 55 Gender: FEMALE Nationality: MALAYSIAN
NORAZNI BINTI MOHD ISACompany Secretary
• Had more than 28 years of vast experience within TNB where she had served in various positions specifically in legal services, tender, contract management and regulatory management
• Deputy Company Secretary and Joint Company Secretary, TNB (2011 - 2012)• Head of Tender Management Unit, Procurement Division, TNB (2006 - 2011)• Manager of Licensing and Compliance Unit, Corporate Communications Department, TNB (2003 - 2006)• Manager of Contract Management, Procurement Division, TNB (2002 - 2003) • Legal Executive in Legal Services Department, Company Secretary’s Office, TNB (1990 - 2001)
Skills, Experience and Expertise:
Additional Information:(i) Family Relationship with Director and/or Major Shareholder of TNB: Nil(ii) Conflict of interest with TNB: Nil
(iii) Other than traffic offences, any conviction for offences within the past five (5) years and any public sanction or penalty imposed by the relevant regulatory bodies during the Financial Year under review: Nil
Date of Appointment: 31 MAY 2012
Qualification(s):
• Master of Laws, University of Malaya, Malaysia
• Advanced Diploma in Law, MARA Institute of Technology
(now MARA University of Technology), Malaysia
• Diploma in Law, MARA Institute of Technology
(now MARA University of Technology), Malaysia
Present Directorship(s):
Listed Entity
• Nil
Other Public Company
• TNB Western Energy Berhad
COMPANY SECRETARY

About TNB
Our Business
Business Context
Performance Review
Sustainability Statement
The Strength of Our Governance
Financial Statements
Additional InformationIntegrated Annual Report 2018
Tenaga Nasional Berhad
p.111 An Effective Leadership
Date Appointed to the Management Team:
14 February 2014
Qualification(s):
• Bachelor of Commerce (Accounting) , University of Wollongong, Australia
• Certified Public Accountant of Malaysian Institute of Certified Public
Accountants
• Certified Public Accountant of Australian Society of Certified Practising
Accountants
• Member of Malaysian Institute of Accountants
Directorships in Public Companies and Public Listed Companies:
• Integrax Berhad
Management Committee(s):GECC GEMC ESC GMTC ComPEC ICTGC HSE
Date Appointed to the Management Team:
2 April 2019
Qualification(s):
• Bachelor of Science Degree in Management (Majored in Finance and
Economics), Syracuse University, New York,
United States of America
• Stanford Executive Programme, Stanford University, Stanford,
United States of America
Directorships in Public Companies and Public Listed Companies:
• UEM Edgenta Berhad
Management Committee(s):GECC GEMC
AN EFFECTIVE LEADERSHIP
AMIR HAMZAH BIN AZIZANPresident/Chief Executive Officer
NAZMI BIN OTHMANChief Financial Officer
Age: 54 Gender: MALE Nationality: MALAYSIANAge: 51 Gender: MALE Nationality: MALAYSIAN
• Nazmi began his career at Island & Peninsular Berhad as Finance
Manager and joined MRCB as the Financial Controller of Port Dickson
Power Sdn. Bhd. an Independent Power Producer. He joined TNB
Generation Sdn. Bhd. in 1998.
• In 2004, he became Head (Financial Reporting and Budget) and
continued in this role before being promoted to General Manager
(Operation) in 2006.
• He was made Senior General Manager (Group Finance/Group
Accountant) in 2008 and became the Chief Investment Management
Officer in 2014.
• Nazmi was appointed as Chief Financial Officer, Group Finance with
effect from 1 August 2018.
• Marketing Credit Accountant, Shell Singapore Petroleum Company (Pte) Ltd. (1992 - 1993)
• Corporate Finance Advisor, Shell Malaysia Ltd. (1993 - 1995) • Head of Financial Services, Sarawak Shell Bhd. (1995 - 1996) • Performance Improvement Advisor, Sarawak Shell Bhd. (1996) • Manager, Planning & Support, Sarawak Shell Bhd. (1996 - 1997) • Senior Treasury Advisor, Shell International Ltd. (1997 - 2000) • General Manager, Corporate Planning, MISC Berhad (2000 - 2004) • Regional Business Director, MISC Berhad (2004 - 2005) • President & Chief Executive Officer, AET Tankers Holding Sdn. Bhd.
(2005 - 2008)• President & Chief Executive Officer, MISC Berhad (2009 - 2010) • Managing Director & Chief Executive Officer, Petronas Dagangan Berhad
(2010 - 2011) • Vice President (Downstream Marketing), Petroliam Nasional Berhad
(2011 - 2013) • Group Managing Director/Chief Executive Officer, Petronas Lubricants
International. Sdn. Bhd. (2012 - 2016) • Vice President (Lubricants Business), Petroliam Nasional Berhad (2013 - 2016) • Managing Director, Icon Offshore Berhad (2016 - 2017) • Group Chief Executive Officer, Themed Attractions Resorts & Hotels Sdn. Bhd.
(2017 - April 2019)
Working Experience:
Working Experience:

About TNB
Our Business
Business Context
Performance Review
Sustainability Statement
The Strength of Our Governance
Financial Statements
Additional Information
p.112 An Effective Leadership
Date Appointed to the Management Team:
1 July 2012
Qualification(s):
• Fellow of Association of Chartered Certified Accountants,
United Kingdom
• Member of Malaysian Institute of Accountants
Directorships in Public Companies and Public Listed Companies:
• Integrax Berhad
• TNB Global Ventures Capital Berhad
Management Committee(s):GECC GEMC ESC SDC GMTC ComPEC ICTGC
Date Appointed to the Management Team:
1 December 2018
Qualification(s):
• Master of Business Administration, Universiti Tenaga Nasional, Malaysia
• Bachelor of Science (Electrical Engineering), Syracuse University,
New York, United States of America
Directorships in Public Companies and Public Listed Companies:
• Integrax Berhad
Management Committee(s):GECC GEMC ESC SDC GMTC ComPEC ICTGC HSE
AN EFFECTIVE LEADERSHIP
Age: 55 Gender: MALE Nationality: MALAYSIANAge: 49 Gender: MALE Nationality: MALAYSIAN
• Ir. Roslan started his career with the Lembaga Letrik Negara in 1985 at
the Perai Power Station in Penang. From then, his career progressed to
various roles and responsibilities within the power stations owned
by TNB.
• After serving as General Manager for the TNB Connaught Bridge
Power Station and the TNB Tuanku Jaafar Power Station, he was
appointed as Senior General Manager (Asset Operation), Generation
Division (2014 - 2018).
• Ir. Roslan was appointed as Chief Generation Officer with effect from
1 December 2018.
• Datuk Fazlur Rahman served for four (4) years in public accounting
practices with three (3) years in PricewaterhouseCoopers Malaysia,
Kuala Lumpur, as a Tax Consultant.
• He later served in Shell Malaysia for a decade in various capacities
within the corporate and financial management functions of the
company starting from 1995.
• He joined Telekom Malaysia Berhad in 2005 and served in several
senior roles with the last position as Vice President – Business
Development. He became the Chief Financial Officer of Naza Group
in 2010.
• He was appointed TNB’s Chief Financial Officer/Vice President, Group
Finance in July 2012, where he served for six (6) years.
• Datuk Fazlur was appointed as Chief Strategy & Regulatory Officer with
effect from 1 August 2018.
Working Experience:Working Experience:
DATUK FAZLUR RAHMAN BIN ZAINUDDINChief Strategy & Regulatory Officer
Ir. ROSLAN BIN ABD RAHMANChief Generation Officer

About TNB
Our Business
Business Context
Performance Review
Sustainability Statement
The Strength of Our Governance
Financial Statements
Additional InformationIntegrated Annual Report 2018
Tenaga Nasional Berhad
p.113 An Effective Leadership
Date Appointed to the Management Team:
1 February 2019
Qualification(s):
• Master of Business Administration, Ohio University,
United States of America
• Bachelor of Engineering and Applied Science (Electrical Engineering),
Sussex University, United Kingdom
• Diploma in Electrical Engineering, Brighton Technical College, United Kingdom
Directorships in Public Companies and Public Listed Companies:
• Nil
Management Committee(s):GECC GEMC ESC SDC GMTC ICTGC HSE
AN EFFECTIVE LEADERSHIP
Age: 58 Gender: MALE Nationality: MALAYSIAN
• Datuk Ir. Husaini began his career with TNB as an Assistant Engineer
(Transmission Line) in the Asset Maintenance Department in Kluang,
Johor, in 1984.
• He spent 32 years serving in maintenance roles for TNB’s transmission
overhead lines and cables, transmission substation equipment,
transmission substation secondary equipment, and high-voltage direct
current power lines.
• He was appointed as Senior General Manager (Asset Maintenance),
Transmission Division, from 2015 to 2016. He was later promoted
to Senior General Manager (Asset Development), Grid Division, in
February 2016.
• Datuk Ir. Husaini was appointed as Chief Grid Officer, Grid Division with
effect from 1 February 2019.
Working Experience:
Date Appointed to the Management Team:
1 January 2012
Qualification(s):
• Master of Business Administration – joint MBA programme between
Universiti Tenaga Nasional, Malaysia and Bond University, Australia
• Bachelor of Science (Electrical Engineering), Syracuse University,
New York, United States of America
Directorships in Public Companies and Public Listed Companies:
• Nil
Management Committee(s):GECC GEMC ESC SDC GMTC ICTGC HSE
Age: 55 Gender: MALE Nationality: MALAYSIAN
• Datuk Ir. Baharin built his career in TNB serving in various engineering
and managerial positions within the company, including Business
Development, Network Maintenance, Network Planning, Construction
Services, Metering Service, and Engineering Services.
• He was seconded to the Ministry of Energy, Green Technology and
Water (KeTTHA), for two (2) and a half years, where he served as the
Deputy Director for the Electrical Inspectorate Department in Sabah.
He then became the Director for the Electrical Inspectorate Department
in Pahang.
• He was the Managing Director of Sabah Electricity Sdn. Bhd.
from 2007 to 2011, and was promoted to Senior General Manager
(Customer Service & Metering) of TNB in December 2011.
• Datuk Ir. Baharin was made Vice President, Distribution, in January
2012 until July 2018, and was re-designated as Chief Distribution
Network Officer with effect from 1 August 2018.
Working Experience:
DATUK Ir. HUSAINI BIN HUSINChief Grid Officer
DATUK Ir. BAHARIN BIN DINChief Distribution Network Officer
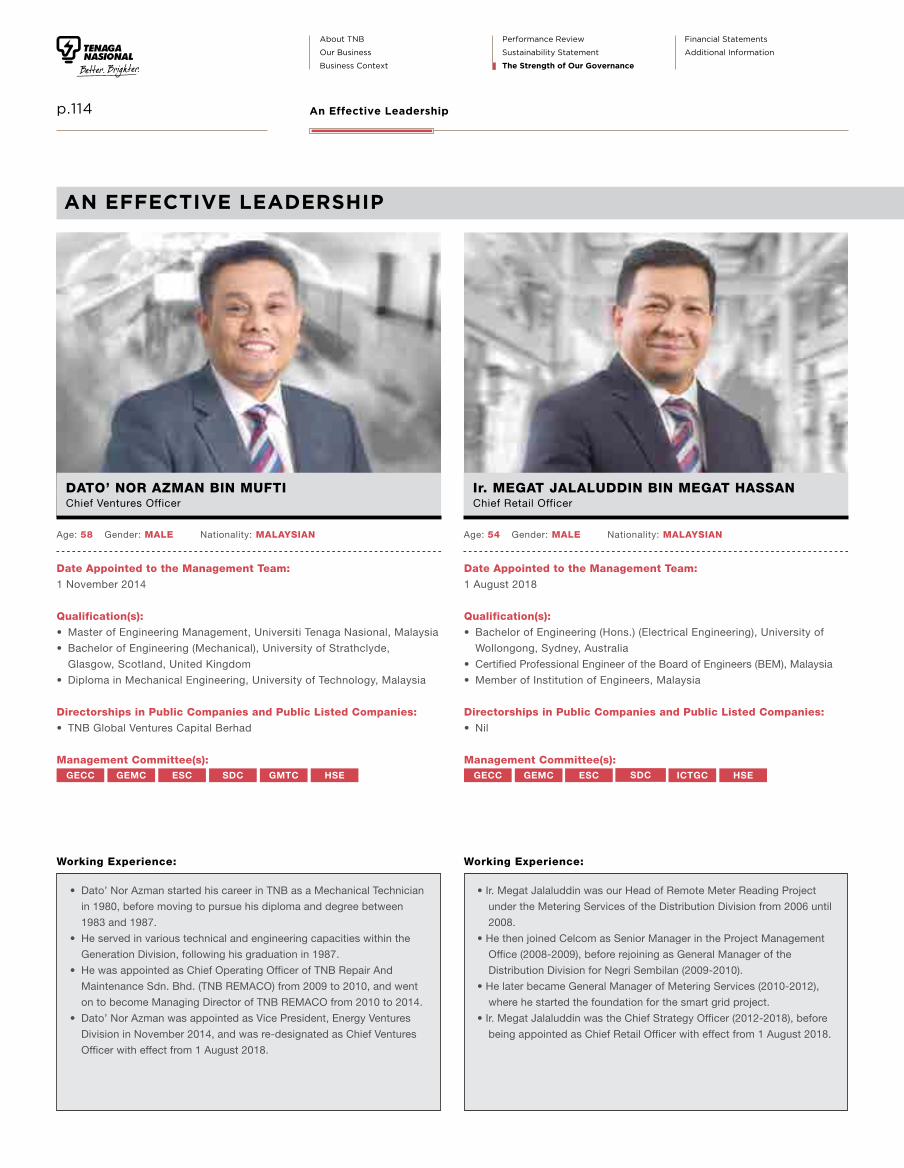
About TNB
Our Business
Business Context
Performance Review
Sustainability Statement
The Strength of Our Governance
Financial Statements
Additional Information
p.114 An Effective Leadership
Date Appointed to the Management Team:
1 November 2014
Qualification(s):
• Master of Engineering Management, Universiti Tenaga Nasional, Malaysia
• Bachelor of Engineering (Mechanical), University of Strathclyde,
Glasgow, Scotland, United Kingdom
• Diploma in Mechanical Engineering, University of Technology, Malaysia
Directorships in Public Companies and Public Listed Companies:
• TNB Global Ventures Capital Berhad
Management Committee(s):GECC GEMC ESC SDC GMTC HSE
Date Appointed to the Management Team:
1 August 2018
Qualification(s):
• Bachelor of Engineering (Hons.) (Electrical Engineering), University of
Wollongong, Sydney, Australia
• Certified Professional Engineer of the Board of Engineers (BEM), Malaysia
• Member of Institution of Engineers, Malaysia
Directorships in Public Companies and Public Listed Companies:
• Nil
Management Committee(s):GECC GEMC ESC SDC ICTGC HSE
AN EFFECTIVE LEADERSHIP
Age: 54 Gender: MALE Nationality: MALAYSIANAge: 58 Gender: MALE Nationality: MALAYSIAN
• Ir. Megat Jalaluddin was our Head of Remote Meter Reading Project
under the Metering Services of the Distribution Division from 2006 until
2008.
• He then joined Celcom as Senior Manager in the Project Management
Office (2008-2009), before rejoining as General Manager of the
Distribution Division for Negri Sembilan (2009-2010).
• He later became General Manager of Metering Services (2010-2012),
where he started the foundation for the smart grid project.
• Ir. Megat Jalaluddin was the Chief Strategy Officer (2012-2018), before
being appointed as Chief Retail Officer with effect from 1 August 2018.
• Dato’ Nor Azman started his career in TNB as a Mechanical Technician
in 1980, before moving to pursue his diploma and degree between
1983 and 1987.
• He served in various technical and engineering capacities within the
Generation Division, following his graduation in 1987.
• He was appointed as Chief Operating Officer of TNB Repair And
Maintenance Sdn. Bhd. (TNB REMACO) from 2009 to 2010, and went
on to become Managing Director of TNB REMACO from 2010 to 2014.
• Dato’ Nor Azman was appointed as Vice President, Energy Ventures
Division in November 2014, and was re-designated as Chief Ventures
Officer with effect from 1 August 2018.
Working Experience:Working Experience:
DATO’ NOR AZMAN BIN MUFTIChief Ventures Officer
Ir. MEGAT JALALUDDIN BIN MEGAT HASSANChief Retail Officer

About TNB
Our Business
Business Context
Performance Review
Sustainability Statement
The Strength of Our Governance
Financial Statements
Additional InformationIntegrated Annual Report 2018
Tenaga Nasional Berhad
p.115 An Effective Leadership
Date Appointed to the Management Team:
24 December 2008
Qualification(s):
• Bachelor of Engineering (Hons.) (Electrical Engineering),
University of Liverpool, United Kingdom
Directorships in Public Companies and Public Listed Companies:
• Nil
Management Committee(s):GEMC HSE
AN EFFECTIVE LEADERSHIP
Age: 56 Gender: MALE Nationality: MALAYSIAN
• Dato’ Muhammad Razif has served TNB for 34 years in various roles
within the Group and its subsidiaries. Among the positions he has held
include Transmission Protection Engineer, Power Plant Engineer and
Business Development Manager at TNB Workshop Services Sdn. Bhd.
Operations Manager at Perusahaan Otomobil Elektrik Malaysia; and
Head of Training at TNB Transmission Network Sdn. Bhd.
• He was made as Head of Training & Development, Group Human
Resource Division, in 2002, and later became Head of Human
Resource Planning and Staffing in 2006.
• Dato’ Muhammad Razif was promoted to Vice President, Human
Resource in December 2008, and was re-designated as Chief People
Officer, Group Human Resource Division with effect from1 August 2018.
Working Experience:
Date Appointed to the Management Team:
3 September 2012
Qualification(s):
• Bachelor of Science (Honours) (Electrical Engineering),
University of Southampton, United Kingdom
Directorships in Public Companies and Public Listed Companies:
• Nil
Management Committee(s):GECC GEMC SDC GMTC HSE
Age: 61 Gender: MALE Nationality: MALAYSIAN
• Datuk Wira Roslan joined TNB in 1980 and held various positions
within the Consumer, Planning, Construction, Operations, and
Maintenance functions at the district level in Peninsular Malaysia.
• He also held several senior positions in the areas of Quality,
Commercial, Customer Service, Marketing and Operations before
being promoted to Chief Corporate Officer with effect from
3 September 2012.
• Datuk Wira Roslan currently oversees all internal and external Group's
Corporate Communication matters. He is also the Country Coordinator
for the Heads of ASEAN Power Utilities/Authorities (HAPUA).
Working Experience:
DATO’ MUHAMMAD RAZIF BIN ABDUL RAHMANChief People Officer
DATUK WIRA ROSLAN BIN AB RAHMANChief Corporate Officer
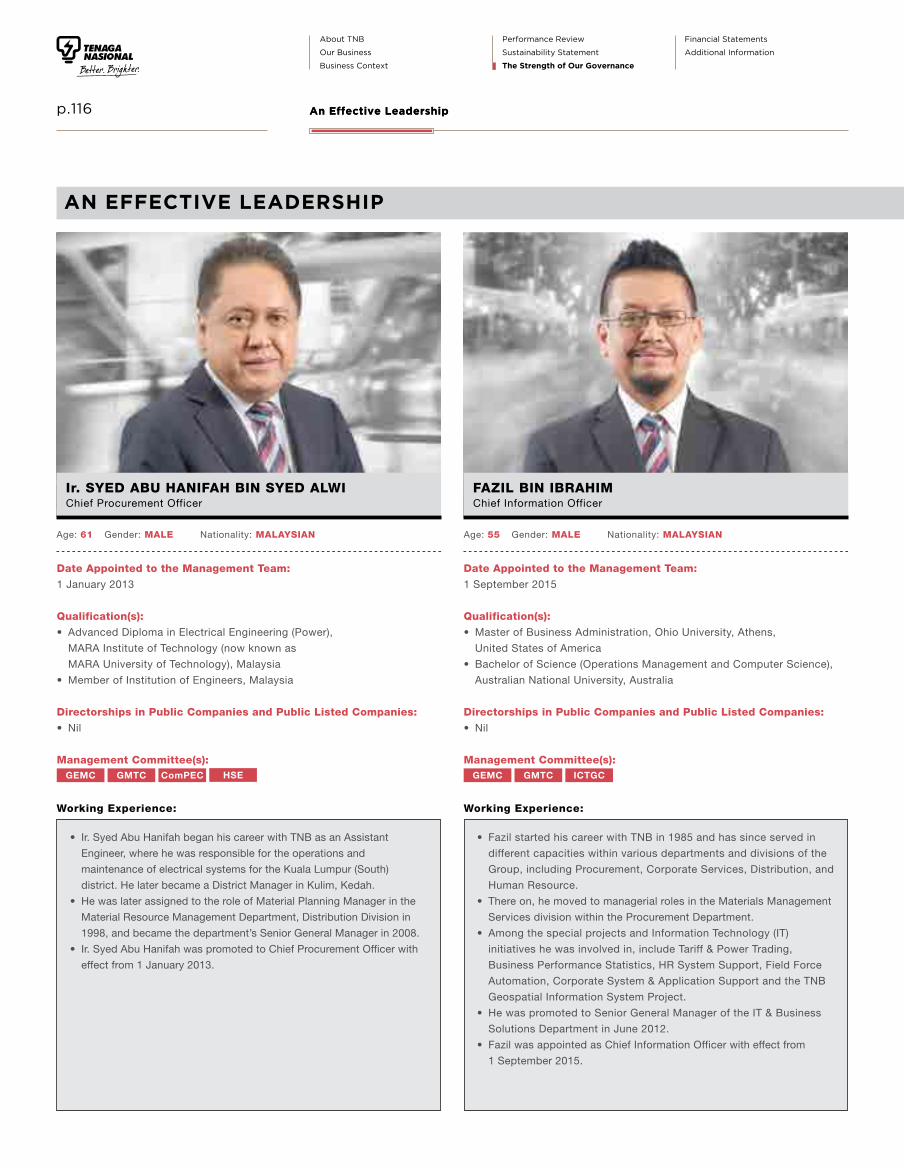
About TNB
Our Business
Business Context
Performance Review
Sustainability Statement
The Strength of Our Governance
Financial Statements
Additional Information
p.116 An Effective LeadershipAn Effective Leadership
AN EFFECTIVE LEADERSHIP
Date Appointed to the Management Team:
1 January 2013
Qualification(s):
• Advanced Diploma in Electrical Engineering (Power),
MARA Institute of Technology (now known as
MARA University of Technology), Malaysia
• Member of Institution of Engineers, Malaysia
Directorships in Public Companies and Public Listed Companies:
• Nil
Management Committee(s):GEMC GMTC ComPEC HSE
Age: 61 Gender: MALE Nationality: MALAYSIAN
• Ir. Syed Abu Hanifah began his career with TNB as an Assistant
Engineer, where he was responsible for the operations and
maintenance of electrical systems for the Kuala Lumpur (South)
district. He later became a District Manager in Kulim, Kedah.
• He was later assigned to the role of Material Planning Manager in the
Material Resource Management Department, Distribution Division in
1998, and became the department’s Senior General Manager in 2008.
• Ir. Syed Abu Hanifah was promoted to Chief Procurement Officer with
effect from 1 January 2013.
Working Experience:
Date Appointed to the Management Team:
1 September 2015
Qualification(s):
• Master of Business Administration, Ohio University, Athens,
United States of America
• Bachelor of Science (Operations Management and Computer Science),
Australian National University, Australia
Directorships in Public Companies and Public Listed Companies:
• Nil
Management Committee(s):GEMC GMTC ICTGC
Age: 55 Gender: MALE Nationality: MALAYSIAN
• Fazil started his career with TNB in 1985 and has since served in
different capacities within various departments and divisions of the
Group, including Procurement, Corporate Services, Distribution, and
Human Resource.
• There on, he moved to managerial roles in the Materials Management
Services division within the Procurement Department.
• Among the special projects and Information Technology (IT)
initiatives he was involved in, include Tariff & Power Trading,
Business Performance Statistics, HR System Support, Field Force
Automation, Corporate System & Application Support and the TNB
Geospatial Information System Project.
• He was promoted to Senior General Manager of the IT & Business
Solutions Department in June 2012.
• Fazil was appointed as Chief Information Officer with effect from
1 September 2015.
Working Experience:
Ir. SYED ABU HANIFAH BIN SYED ALWIChief Procurement Officer
FAZIL BIN IBRAHIMChief Information Officer

About TNB
Our Business
Business Context
Performance Review
Sustainability Statement
The Strength of Our Governance
Financial Statements
Additional InformationIntegrated Annual Report 2018
Tenaga Nasional Berhad
p.117 An Effective LeadershipAn Effective Leadership
Her profile is set out in Company Secretary on page 110.
Management Committee(s):GEMC
AN EFFECTIVE LEADERSHIP
Age: 55 Gender: FEMALE Nationality: MALAYSIAN
MEMBERSHIP KEY
GROUP EXECUTIVE COUNCIL COMMITTEE
ENERGY SUPPLY COMMITTEE
HEALTH, SAFETY AND ENVIRONMENT STEERING COMMITTEE
COMMODITY PROCUREMENT EXECUTIVE COMMITTEE
GROUP EXECUTIVE MANAGEMENT COMMITTEE
SUSTAINABILITY DEVELOPMENT COMMITTEE
GROUP MANAGEMENT TENDER COMMITTEE
INFORMATION AND COMMUNICATIONTECHNOLOGY (ICT) GOVERNANCE COUNCIL
GECC
HSE
GMTC
ComPEC
SDC
GEMC
ICTGC
ESC
Additional Information on Our Management Team:(i) None of the members of our Management Team has any family
relationship with any Director and/or Major Shareholder of TNB.
(ii) None of the members of our Management Team has any conflict of interest with TNB.
(iii) None of the members of our Management Team has been convicted of any offences (save for minor traffic offences) within the past five (5) years, nor has been imposed any public sanction or penalty by the relevant regulatory bodies during the Financial Year under review.
NORAZNI BINTI MOHD ISACompany Secretary

About TNB
Our Business
Business Context
Performance Review
Sustainability Statement
The Strength of Our Governance
Financial Statements
Additional Information
p.118
TNB GOVERNANCE MODEL
The Company’s governance model is based on the principles of the Malaysian Code on Corporate Governance 2017 (MCCG).
The Board is collectively responsible to shareholders and stakeholders, for the long term success of the Company. It fulfils
this responsibility by providing leadership, setting the strategic goals for the Company and overseeing the execution of the
strategy by Management. It ensures the Company has adequate resources to deliver its strategy and reviews the operating
and financial performance of the Group. The Board ensures that the execution of the strategy and value creation are achieved
within a framework of prudent and effective controls.
The Company’s Constitution and the regulatory environment set the external framework for how the Company operates. The
Board is assisted in fulfilling its responsibilities by delegating some of these to each of its Board Committees, which describes how
the Committees discharge these responsibilities in this report. Both the Board and each Committees has a pre-set rolling annual
schedule of topics and items for discussion. The agendas for Board meetings are set by the Chairman, assisted by the Group
Company Secretary. The same process is adopted for each of the Board Committees.
LEADERSHIP &EFFECTIVENESS
GOVERNANCE MODEL
SHAREHOLDERS
BOARD RESERVED AUTHORITIES
DELEGATED AUTHORITY TO MANAGEMENTAUDIT AND FINANCIAL
GOVERNANCE
Internal Audit
External Audit
Financial Controls
RISK MANAGEMENT
STRATEGY
SUSTAINABILITY
TNB BOARD
R
Board Risk Committee (BRC)
I
Board IntegrityCommittee (BIC)
L
Board Long Term Incentive Plan Committee (BLTIP)
A
Board Audit Committee
(BAC)
F
Board Finance And Investment Committee
(FIC)
T
Board Tender Committee
(BTC)
NR
Board Nomination And Remuneration Committee
(BNRC)
PRESIDENT/CHIEF EXECUTIVE OFFICER
Group Executive Management CommitteeGroup Executive Council Committee
GECC GEMC
Energy Supply Committee Sustainability Development Committee
ESC SDC
Health, Safety and EnvironmentSteering Committee
Group Management Tender Committee
HSE GMTC
Commodity ProcurementExecutive Committee
Information and Communication Technology (ICT) Governance Council
ComPEC ICTGC
This statement is to be read together
with the Corporate Governance
Report 2018 of the Company
(CG Report) which is available on
our website: www.tnb.com.my.
The CG Report elaborates on the
Company’s application of each
Principle of the MCCG 2017 for the
Financial Year under review.
Our website contains the Board
Charter inclusive of the Terms of
Reference (TOR) of Committees and
copies of policies mentioned in the
Corporate Governance Overview
Statement. The website is updated
periodically to ensure that it reflects
TNB’s current corporate governance
information.
BOARD ROLES AND
RESPONSIBILITIES
The roles of the Chairman and
President/Chief Executive Officer
(President/CEO) are separated and
held by different individuals. Whilst
the Chairman provides leadership
of the Board, the day-to-day
management of the Company is
delegated to the President/CEO
and his Top Management Team.
The Top Management Team assists
the President/CEO in operational
and strategic decision-making and
collectively reviews areas such as
strategy implementation, operational
and financial performance, budget
and risk matters across the Group as
a whole.

About TNB
Our Business
Business Context
Performance Review
Sustainability Statement
The Strength of Our Governance
Financial Statements
Additional InformationIntegrated Annual Report 2018
Tenaga Nasional Berhad
p.119 Leadership & Effectiveness
CHAIRMAN ROLES
SENIOR INDEPENDENT NON-EXECUTIVE DIRECTOR (SID) ROLES
PRESIDENT/CEO ROLES
NON-EXECUTIVE DIRECTOR (NED) ROLES
CHIEF FINANCIAL OFFICER (CFO) ROLES
COMPANY SECRETARY ROLES
• Leadership, operation and governance of the Board;• Setting the agenda for Board meetings ensuring that they operate effectively
and provide appropriate opportunity for challenge and debate to support sound decision-making;
• Ensuring constructive relations exist between the Executive and Non-Executive Directors;
• Overseeing the performance evaluation of the Board, its Committees, Self and Peer;• Meeting with shareholders, analysts and other representatives of institutional
investors; • Meeting with managers and employees at various locations throughout the Group;• Leading Board meetings and discussions;• Ensuring appropriate steps are taken to provide effective communication with
stakeholders and that their views are communicated to the Board as a whole; and• Leading the Board in establishing and monitoring good corporate governance
practices.
• Providing a sounding board for the Chairman; • An intermediary for other Directors when necessary and specifically serves as the
principal conduit between the Independent Non-Executive Directors and Chairman on sensitive issues;
• Promote high standards of corporate governance and ensure that the Company’s obligations to shareholders are understood and complied with;
• Ensure the composition of the Board with regards to the number of Independent Directors is in adherence to relevant requirements and regulations;
• Being available for confidential discussions with other Non-Executive Directors who may have concerns which they believe have not been properly considered by the Board as a whole;
• Being available to shareholders if they have any concerns which are unable to be resolved through the normal channels of Chairman, President/CEO or Chief Financial Officer, or if contact through these channels are deemed inappropriate; and
• If necessary, the Senior Independent Non-Executive Director can be emailed at [email protected].
• Delivering strategy as agreed by the Board;• Leading the Management Committees which oversee the operational and financial
performance including issues faced by the Group;• Leading and supporting each of TNB’s businesses and the functions of Human
Resource, Strategy and Development and Corporate Affairs; • Representing TNB externally to stakeholders, shareholders, customers, suppliers,
regulatory and Government authorities and the community;• Creating and implementing the Company’s vision and mission;• Ensuring that the Company has appropriate systems to enable it to conduct its
activities both lawfully and ethically; and• Ensuring the Directors are properly informed and that sufficient information is
provided to the Board to enable the Directors to form appropriate judgements.
• Scrutinising, measuring and reviewing the performance of Management;
• Constructively challenging and assisting in the development of strategy;
• Reviewing the Group financial information, ensuring systems of internal control and risk management are appropriate and effective;
• Reviewing the succession plans for the Board/Top Management;
• Serving on various Committees of the Board; and
• Overseeing the development and implementation of the Company’s stakeholders communication policy.
• Providing strategic financial leadership of the Company and day-to-day management of the finance function;
• Leading the finance management teams; and• Representing TNB externally to stakeholders,
shareholders, customers, suppliers, regulatory and Government authorities and the community.
• Managing all Board and Board Committee meetings logistic, attending and recording minutes of all Board and Committee meetings and facilitating Board communications;
• Advising the Board on its roles and responsibilities;
• Facilitating the orientation of new Directors and assisting in Directors’ training and development;
• Advising the Board on corporate disclosures and compliance with Companies Act 2016 and securities regulations and Main Market Listing Requirements of Bursa Malaysia Securities Berhad (MMLR);
• Managing processes pertaining to the general meetings;
• Monitoring corporate governance developments and assisting the Board in applying governance practices to meet the Board’s needs and stakeholders’ expectations;
• Serving as a focal point for stakeholders’ communication and engagement on corporate governance issues; and
• The Board Members have unlimited access to the professional advice and services of the Company Secretary.

About TNB
Our Business
Business Context
Performance Review
Sustainability Statement
The Strength of Our Governance
Financial Statements
Additional Information
p.120 Leadership & Effectiveness
BOARD COMMITTEESThe Board has established its principal Committees to exercise oversight in specific areas. Our Board Committees structure during the Financial Year is set out below. It includes the Committees’ Roles and Responsibilities, Membership, Attendance and Composition.
Prior to each Board meeting, the Board shall receive reports from the Chairman of each Board Committee on their deliberations and recommendations of each meeting. This ensures that each Director is informed of the decisions made including views/comments raised. The Chairman of each Board Committee shall then table to the Board its report and present its recommendations for the Board’s approval accordingly at each Board meeting. This permits the Board to raise any comments/views (if any) on all deliberations.
BOARD AND BOARD COMMITTEES MEETING CALENDAR
BOD
BOD BOD
BOD
BOD
BOD
JANUARY 2018 MARCH 2018 MAY 2018FEBRUARY 2018 APRIL 2018 JUNE 2018
9
25
2911
6 2516 11 28
28
269
25
2911
2911 11 11
6 2516 11 28
28
26
11 16 18 29 308 9 17 413 18 514 15 281613 22 26
27 27 BOD77
14
Total Attendance
Board of Directors
BOARD NOMINATION AND REMUNERATION COMMITTEE (BNRC)
Juniwati Rahmat Hussin10
Attendance ^5/5 (100%)
Tan Sri Dato’ Seri Chor Chee Heung7
Attendance *8/8 (100%)
To identify and recommend new nominees to the Board, Board Committees and Board of TNB Group.
To consider the Executive Director and Top Management’s succession planning.
To assist the Board in reviewing the Board’s required mix of skills, experience and other qualities, including core competencies which Non-Executive Directors should bring to the Board.
To implement the process formulated by the Board to assess the effectiveness of the Board, Board Committees, Self and Peer.
To determine and recommend to the Board the remuneration packages of Non-Executive Directors/Executive Directors/Top Management.
The BNRC’s TOR is available on the Company’s website at www.tnb.com.my.
NRBOARD AUDITCOMMITTEE (BAC)
Noraini binti Che DanAttendance 18/18 (100%)
Gee Siew YoongAttendance 17/18 (94%)
Gopala Krishnan K.Sundaram2
Attendance ^8/8 (100%)
Ong Ai Lin3
Attendance ^7/7 (100%)
Dato’ Abd Manaf bin Hashim5
Attendance *6/7 (86%)
Datuk Sakthivel Alagappan6
Attendance *7/7 (100%)
Tan Sri Dato’ Seri Chor Chee Heung7
Attendance *10/10 (100%)
Badrul Ilahan bin Abd Jabbar8
Attendance *10/10 (100%)
Amran Hafiz bin AffifudinAttendance 13/13 (100%)
Noraini binti Che DanAttendance 12/13 (92%)
Datuk Sakthivel Alagappan6
Attendance *4/4 (100%)
Tan Sri Dato’ Seri Chor Chee Heung7
Attendance *6/6 (100%)
Amran Hafiz bin AffifudinAttendance 12/12 (100%)
Juniwati Rahmat HussinAttendance 10/12 (83%)
Gee Siew Yoong9
Attendance ^8/8 (100%)
Dato’ Abd Manaf bin Hashim5
Attendance *4/4 (100%)
Datuk Ahmad Badri bin Mohd Zahir1
(No meeting held since his appointment)
Amran Hafiz bin AffifudinAttendance 10/10 (100%)
Noraini binti Che Dan11
Attendance ^2/2 (100%)
Dato’ Abd Manaf bin Hashim5
Attendance *5/5 (100%)
BOARD FINANCE AND INVESTMENT COMMITTEE (FIC)
Tan Sri Leo Moggie Attendance 13/13 (100%)
BOARD TENDER COMMITTEE (BTC)
Datuk Ahmad Badri bin Mohd Zahir1
Attendance ^2/2 (100%)
Datuk Seri Hashmuddin bin Mohammad4
Attendance *3/3 (100%)
To oversee the integrity of the financial statements in compliance with legal and regulatory requirements and applicable accounting standards.
To assess the effectiveness of the Group’s internal control framework as well as internal and external audit functions.
The BAC’s TOR is available on the Company’s website at www.tnb.com.my.
Review, monitor and make recommendations to the Board for approval of the annual and supplementary budgets, capital budgets and investments of TNB.
Review and evaluate, as may be appropriate, information relating to the Company's investable assets, its investment policies, strategies, objectives and activities.
Monitor and review investments in subsidiaries and associated companies, and to evaluate and consider and make appropriate recommendations on proposals for any new investments/divestments proposed by the Management.
To provide input on the valuation of the proposed investment/divestments taking into account compliance with the Investment Policy, risk management analysis, findings of the due diligence and written report from external advisers, as applicable.
To establish the framework of TNB’s Procurement & Supply Chain Policy and Procedures.
To advise the Board regarding the details and implementation of TNB’s Procurement & Supply Chain Policy and Procedures framework.
To assist the Board in regulating the compliance of Top Management and Executive Director with TNB’s Procurement & Supply Chain Policy and Procedures.
To ensure TNB complies with the applicable laws, regulations, rules and guidelines to achieve best business practices in its procurement of equipments, materials, works and services.
A F T
Tan Sri Leo Moggie
Datuk Seri Ir.Azman bin Mohd
Datuk Ahmad Badri bin Mohd Zahir1
Amran Hafizbin Affifudin
Norainibinti Che Dan
Gee Siew Yoong
BAC Meeting Hours 44.69 FIC Meeting Hours 25.26 BTC Meeting Hours 30.02 BNRC Meeting Hours 9.17
Chairman
Members
Key Roles and Responsibilities
JuniwatiRahmat Hussin
20/21 95% 20/21 95%20/21 95% 21/21 100%19/21 90% 18/21 86%^2/4 50%
BOD
BODBOD
BOD
BOD

About TNB
Our Business
Business Context
Performance Review
Sustainability Statement
The Strength of Our Governance
Financial Statements
Additional InformationIntegrated Annual Report 2018
Tenaga Nasional Berhad
p.121 Leadership & Effectiveness
All deliberations and recommendations must be minuted and approved by each Board Committee and confirmed by the Chairman of each Board Committee at their respective Board Committee meetings.
Each Board Committee is entitled to seek information from any employee of the Company and to obtain professional advice as the Board Committee deems appropriate in its discretion.
For this Financial Year under review based on the Board annual evaluation on its Committees, the Board unanimously resolves that each Board Committee and its members has discharged its roles and responsibilities effectively as guided by its respective TOR.
Ad-hoc committees are also convened to consider matters of special importance or to exercise the delegated authority of the Board.
NOTES 1 Appointed as Director, Chairman of BTC and Member of BNRC & BLTIP
w.e.f. 1 November 20182 Appointed as Director w.e.f. 4 July 2018, Chairman of BIC and Member of
BAC & BRC w.e.f. 1 August 20183 Appointed as Director w.e.f. 1 August 2018 and Member of BAC, BRC & BIC
w.e.f. 15 August 20184 Resigned as Director, ceased as Chairman of BTC and Member of BRC
w.e.f. 1 April 20185 Cessation of office as Director, Chairman of BRC and Member of BAC, BTC, BNRC
& BLTIP w.e.f. 15 May 20186 Cessation of office as Director and Member of BAC, FIC & BIC w.e.f. 15 May 2018
BOD
BOD BOD
JULY 2018 SEPTEMBER 2018 NOVEMBER 2018AUGUST 2018 OCTOBER 2018 DECEMBER 2018
17 7 176 16 23 2 5 7 178 1619
30
31 31
BOD BOD BOD
BODBOD
14 30 2118 4 1012
27 11
14 30 212118 4 1012
27 11BOD2727
Noraini binti Che DanAttendance 12/12 (100%)
Juniwati Rahmat HussinAttendance 11/12 (92%)
Gopala Krishnan K.Sundaram2
Attendance ^5/5 (100%)
Ong Ai Lin3 Attendance ^4/4 (100%)
Datuk Seri Hashmuddin bin Mohammad4
Attendance *4/5 (80%)
Badrul Ilahan bin Abd Jabbar8 Attendance *7/7 (100%)
Juniwati Rahmat Hussin Attendance 3/3 (100%)
Ong Ai Lin3 Attendance 3/3 (100%)
Datuk Sakthivel Alagappan6
(No meeting held during his tenure/service)
Badrul Ilahan bin Abd Jabbar8 (No meeting held during his tenure/service)
Datuk Ahmad Badri bin Mohd Zahir1 Attendance ^0/1 (0%)
Amran Hafiz bin AffifudinAttendance 2/2 (100%)
Noraini binti Che Dan11
Attendance ^1/1 (100%)
Dato’ Abd Manaf bin Hashim5 Attendance *1/1 (100%)
To oversee the establishment and implementation of the risk management framework that is embedded into the culture, processes and structures of the Company and is responsive to changes in the business environment.
To approve the Risk Management Policies on behalf of the Board.
To ensure the principles and requirements of managing risk are consistently communicated and adopted throughout the Company.
BOARD RISK COMMITTEE (BRC)
Gee Siew Yoong9
Attendance 12/12 (100%)
Dato’ Abd Manaf bin Hashim5
Attendance *6/6 (100%)
R BOARD LONG TERM INCENTIVE PLAN COMMITTEE (BLTIP)
Juniwati Rahmat Hussin10
Attendance ^1/1 (100%)
Tan Sri Dato’ Seri Chor Chee Heung7
Attendance *1/1 (100%)
To oversee the administration of TNB LTIP and the shares granted (LTIP Shares) subject to the By-Laws.
To approve and determine the manner in which the LTIP Shares are granted and subsequently vested to the selected employees in accordance with the By-Laws, including inter alia, the determination of eligibility, grant level, terms of acceptance of offers, terms of vesting of shares, performance conditions and any other terms and conditions imposed at the discretion of the BLTIP.
L BOARD INTEGRITY COMMITTEE (BIC)
Gopala Krishnan K.Sundaram2 Attendance 3/3 (100%)
Tan Sri Dato’ Seri Chor Chee Heung7 (No meeting held during his tenure/service)
To manage disciplinary issues and actions with regard to employees’ misconduct, except for the hearing of appeal of executives of grade M15 and above or equivalent grade with regard to disciplinary cases, for which the power lies with the Board.
To review the disciplinary procedures, whenever applicable, subject to the Board’s approval.
I
TOTAL HOURS OF THE BOARD MEETINGS
41.98
OVERALL PERCENTAGE OF THE BOARD MEETINGSATTENDED BY DIRECTORS
90%
203.54
TOTAL HOURS OF THE BOARD & BOARD COMMITTEES’ MEETINGS
All Directors have complied with the minimum attendance as stipulated in the MMLR, of which being present not less than 50% of the Board meetings held during the Financial Year.
Gopala KrishnanK.Sundaram2
Ong Ai Lin3 Tan Sri Dato’ Seri Chor Chee Heung7
Badrul Ilahan bin Abd Jabbar8
Dato’ Abd Manaf bin Hashim5
Datuk Sakthivel Alagappan6
Datuk Seri Hashmuddin bin Mohammad4
*5/6 83%*7/8 88%*11/12 92% *8/8 100%*12/12 100%^9/9 100% ^6/7 86%
2424 24 24
7 Resigned as Director, ceased as Chairman of BNRC, BLTIP & BIC and Member of BAC & FIC w.e.f. 30 June 2018
8 Resigned as Director and ceased as Member of BAC, BRC & BIC w.e.f. 30 June 2018
9 Appointed as Chairman of BRC and Member of BTC w.e.f. 16 May 201810 Appointed as Chairman of BNRC & BLTIP w.e.f. 1 August 201811 Appointed as Member of BNRC & BLTIP w.e.f. 1 August 2018* Reflects the number of meetings during the time the Director held office/was
Chairman/Member of Committee ^ Reflects the number of meetings since his/her respective appointment on the Board/
relevant Board Committee
BRC Meeting Hours 42.92 BLTIP Meeting Hours 1.83 BIC Meeting Hours 7.67

About TNB
Our Business
Business Context
Performance Review
Sustainability Statement
The Strength of Our Governance
Financial Statements
Additional Information
p.122
MATERIAL MATTERS RESERVED FOR THE BOARD
BOARD ACTIVITIESTNB is built on strong foundations and operates with a clear strategic framework comprising a balance range of businesses in core markets and a commitment to efficient operations and disciplined investment. Some of the matters considered by the Board in relation to these strategic priorities are set out below:
The Board plays a pivotal role in reviewing the Company’s strategic direction and approving corporate strategic initiatives developed by the Management. The Board deliberates annually on the Company’s strategic and business plan as proposed by the Management, including the annual capital and revenue budget for the ensuing year as well as the Key Performance Indicators (KPIs). This will ensure that the KPIs correspond with the Company’s annual strategic and business plan. The Board reviews and deliberates on the Management’s views/assumptions in ensuring the best decisions are reached after considering all relevant aspects.
A separate and informal session between the Board and Top Management, known as the Board Breakout Session (BBO), is held to discuss in-depth and exchange views on the Company’s strategic issues/challenges. The BBO is coordinated by the Company Secretary’s Office as and when the need arises and is a platform for the Board and Management to deliberate and exchange views as well as opinions in formulating strategic plans and to chart the direction of the Group, including the reporting of its progress.
During the Financial Year under review, two (2) BBOs were held on 10 October 2018 and 11 December 2018, specifically to discuss on the TNB International Investment Strategy Refinement and Regulatory Landscape & Challenges under Malaysia Electricity Supply Industry.
During the BBOs, the Management shared with the Board of the Regulatory Landscape, its Current Challenges and Cost of Service & Tariff Design Study as well as Strategies in Refining TNB’s International Investment.
In return, the Management gained constructive inputs/guidance from the Board on way forward of these investments and regulatory landscapes & challenges of utility industry in Malaysia. More information on the Strategic Direction is available in the 2018 Year in Review on pages 21 to 43 of this Integrated Annual Report.
Half-year reviews of the business plan and the budget were conducted whereby comparison of approved targets against the Company’s actual performance was made.
Based on the evaluation for Financial Year under review, the Board collectively concurs that it has reviewed the Company’s strategic and financial plan as well as monitored its implementation, including the setting of suitable KPIs in achieving the Company’s objectives.
The BRC assists the Board in overseeing the establishment, implementation and effectiveness of the risk management system. The BRC on behalf of the Board, also approves risk management policies/practices, reviews periodic reports on risk management and makes relevant recommendations to the Board for its approval.
The Risk Management Department (RMD), led by the Chief Risk Officer, is responsible for the effective implementation of the TNB Risk Management Framework for informed decision-making. Additionally, RMD manages the insurance programmes for the Company and its subsidiaries. RMD had implemented various initiatives in Financial Year 2018 in alignment with the BRC’s objective, which is to ensure that the Company has in place a sound and robust enterprise risk management framework and such framework has been effectively implemented to enhance the Company’s ability to achieve its strategic objectives.
There has been strong and consistent mandate from the BRC and TNB Top Management in driving effective risk management across the Company and its subsidiaries. In Financial Year 2018, BRC communicated its mandate through the TNB Top Management Risk Forum 2018 held on 23 January 2018. About 100 Senior including Top Management personnel from business units and subsidiaries dialogued with the BRC members regarding risks and opportunities in the coming year.
Additionally, there were 12 BRC sittings in Financial Year 2018 to deliberate risk management matters and mitigations across the organisation. Business units had numerous opportunities to provide assurances to BRC of its risk management efforts, assisting the Board in its decision-making, especially in the management of strategic risks that may prevent TNB from achieving its Reimagining TNB outcomes.
BRC were provided with timely alerts on the health of the organisation in achieving its strategic objectives through the quarterly Risk Dashboard reports. RMD collated and highlighted the status of 28 Key Risk Indicators (KRI) identified by the business units. Indicators at triggering and breaking points were deliberated for accelerated mitigating actions to manage the potential impacts. Moreover, RMD facilitated the review of the KRIs to ensure they remain relevant to the present business and strategic objectives as well as adaptive to the changing industry and global scenarios.
Based on the evaluation for the Financial Year under review, the Board collectively agrees that it has discharged its roles in identifying principal risks and in ensuring that the Group has put in place an adequate risk management framework to effectively monitor and manage the risks of its operational businesses.
Formulating, reviewing and approving the Company’s strategic business plan
Identifying and managing principal risks affecting the Company
MATTERS CONSIDERED BY THE BOARD
LINK TO STRATEGY
• Future Proof Regulations
LINK TO STRATEGY
• Grid of the Future• Future Proof Regulations
• Future Generation Sources• Winning the Customer
Leadership & Effectiveness

About TNB
Our Business
Business Context
Performance Review
Sustainability Statement
The Strength of Our Governance
Financial Statements
Additional InformationIntegrated Annual Report 2018
Tenaga Nasional Berhad
p.123
The Board is responsible for ensuring that a sound reporting framework of internal controls and regulatory compliance is in place throughout the Company. Based on the evaluation for the Financial Year under review, the Board collectively concurs that it has discharged its roles through the BRC/BAC whereby regular meetings were held in reviewing the effectiveness of the Company’s internal control system. Details of the Company’s internal control system and its effectiveness are provided in the Statement of Risk Management and Internal Control in this Integrated Annual Report.
The President/CEO is responsible for managing the day-to-day operations of the Company and implementing the Group strategies and policies as agreed by the Board. In doing so he is well supported by the respective Management Committees. The performance of the Management is measured through the Company’s and Group’s quarterly financial reports. The Board, on a continuous basis, is well informed of the progress of the Company’s strategic initiatives and critical operational issues as well as of the Group’s performance based on approved KPIs.
The Board, through the BNRC is entrusted to review potential candidates for Top Management positions and establish their remuneration. The Group’s nomination, selection and succession policies are formulated by the BNRC.
During the Financial Year under review, there were three (3) new additions to the Board, duly appointed by the BNRC/Board.
Gopala Krishnan K.Sundaram and Ong Ai Lin were appointed as Independent Non-Executive Directors with effect from 4 July 2018 and 1 August 2018 respectively, while Datuk Ahmad Badri bin Mohd Zahir, a Non-Independent Non-Executive Director was appointed on 1 November 2018, as Appointed Director of the Minister of Finance (Incorporated) (MoF Inc.), the Special Shareholder of TNB.
Their mix of skills, experience, expertise and qualification are analysed prior to their respective appointments.
The selection of candidates and appointment of Independent Non-Executive Directors by the BNRC/Board are made with the assistance of independent consultant.
During the year, Datuk Fazlur Rahman bin Zainuddin has assume the position of Chief Strategy & Regulatory Officer whilst Nazmi bin Othman has been appointed as CFO as part of job rotation. This is in line with the Company’s succession planning program.
The Board is satisfied that the BNRC has efficiently discharged its duties pertaining to the nomination, remuneration and succession management functions as set out in its TOR.
The BNRC annually evaluates the performance of the President/CEO and the Top Management, whose remunerations are directly linked to their respective KPIs. The President/CEO’s remuneration package is reviewed by the BNRC to reflect the contributions made towards the Group’s achievements for the year. The BNRC’s views and recommendations on this are submitted to the Board for its decision/approval. Based on the evaluation for the Financial Year under review, the Board collectively concurs that succession planning for the President/CEO and Top Management as well as for the Company’s future leaders has been appropriately developed.
MATERIAL MATTERS RESERVED FOR THE BOARD
Reviewing the adequacy and integrity of the Company’s
internal control system
Overseeing and evaluating the conduct and performance of the
Company’s businesses Succession Planning
LINK TO STRATEGY
• Future Proof Regulations
LINK TO STRATEGY
• Grid of the Future• Future Generation Sources• Winning the Customer
LINK TO STRATEGY
• Winning the Customer
Leadership & Effectiveness

About TNB
Our Business
Business Context
Performance Review
Sustainability Statement
The Strength of Our Governance
Financial Statements
Additional Information
p.124
BOARD MEETINGS The Board schedules meetings on a monthly basis. Additional meetings are held to discuss specific issues that require deliberation in between the scheduled meetings. The Board held 21 Board meetings during the Financial Year under review.
The calendar for Board and Board Committee meetings is scheduled well in advance, which include the BBO, Pre-Board meetings and Annual General Meeting (AGM), with dates for the year circulated to the Board in the month of October of the preceding year to give the Directors ample time to plan their attendance. A Pre-Board meeting is held prior to any Board meetings for the Management to provide the Chairman with insights into the papers that will be deliberated.
The agenda of Board meetings is drawn up after consultation between the Chairman, President/CEO and Company Secretary at the Pre-Board meeting. Copies of the agenda and Board papers are circulated to Board Members electronically and in hard copies at least five (5) working days prior to the meetings. This permits prior review by the Directors and if necessary, the provision of further information for deliberation at the meeting to ensure informed decision-making. Any Director may request matters to be included in the agenda.
Top Management and external advisors may be invited to attend Board meetings to advise the Board when matters under their purview are being considered, or as otherwise requested by the Board to enable informed decision-making. Should a Director be unable to attend a meeting, his/her views are sought in advance and put to the meeting to facilitate a comprehensive discussion. Thereupon, each Director makes himself/herself available to fellow Directors and may contribute to all major decisions before the Board.
A comprehensive Board paper comprising the objectives, background, issues, implications, risks, appropriate analysis/statistics, recommendations and other relevant information is prepared to enable the Board to make informed and effective decisions.
The Board and Board Committee meetings are also held at various business operating units or sites of major/new projects to allow the Board to better assess progress made and note any other important issue raised. As at to date, the Board/respective Board Committees visited the following business operations/on-going projects:
BOARD
Date Venue
23 April 2018 TNB Sepang Solar Sdn. Bhd. Large Scale Solar Project at Lot 32888, Mukim Tanjung Dua Belas, Daerah Kuala Langat, Selangor
19 November 2018 Track 4A 1440MW Combined Cycle Power Plant in Pasir Gudang, Johor BAC
Date Venue
7 September 2018 (i) PMU Kimanis, Daerah Papar, Sabah
(ii) Kimanis Power Sdn. Bhd. (Independent Power Producer), Kota Kinabalu, Sabah
Decisions of the Board and Board Committees are made unanimously or by consensus. These decisions and conclusions are recorded in the Board minutes. In the case of a tied vote, the Chairman has a second or casting vote. The Board’s decisions may also be obtained via circulation depending on the urgency and availability of the Directors as well as the nature of the proposal/subject matter.
Minutes of the meetings are circulated earlier to all Directors for their perusal prior to the meetings. The Directors may request for clarification or raise comments on the minutes prior to their confirmation. After the Directors’ confirmation, the Chairman of the meeting signs the minutes as a correct record of the proceedings. The Directors are also informed of announcements made to Bursa Malaysia Securities Berhad for their notification.
SUPPLY OF INFORMATION AND ACCESS TO ADVICE The Board receives accurate, timely and clear information five (5) working days prior to meetings to enable it to effectively discharge its duties and responsibilities. Thus, it has separate and independent access to information to assist it with its deliberations, including the opportunity to request supplementary or explanatory information from Management. The Management provides information to the Board on an on-going basis to allow the Board to effectively discharge its responsibilities.
The Board recognises the importance of independent judgement and constructive debate on all issues under consideration. Where necessary, the Board collectively and individually has the right to obtain external independent legal, accounting or other professional advice at the Company’s expense to assist with its decision-making process.
Leadership & Effectiveness

About TNB
Our Business
Business Context
Performance Review
Sustainability Statement
The Strength of Our Governance
Financial Statements
Additional InformationIntegrated Annual Report 2018
Tenaga Nasional Berhad
p.125
BOARD NOMINATIONAND REMUNERATIONCOMMITTEE
ROLE OF COMMITTEE
The Committee has a dual role. Firstly, the Committee ensures there is a formal and appropriate procedure for the appointment of new Directors to the Board. The Committee is responsible for leading this process and making recommendations to the Board. Secondly, the Committee determines and makes recommendations to the Board on the Company’s framework and policy for the remuneration of the Non-Executive Directors, the Executive Director and Top Management.
SUMMARY OF ACTIVITIES FOR THE FINANCIAL YEAR UNDER REVIEW
Juniwati Rahmat Hussin, an Independent Non-Executive Director was appointed as the Chairman of BNRC with effect from 1 August 2018. She is well supported by three (3) Members, of which half of the BNRC members are Independent Non-Executive Directors.
During the Financial Year under review, the BNRC held 10 meetings on matters including the following:
• Appointment of new Board Members;• Re-election and re-appointment of Independent Non-Executive Directors;• Review of the status of independence of the Independent Non-Executive Directors;• Findings of Annual Assessment of the Board, its Committees, Self and Peer;• Review of composition of the Board Committees;• Review of composition of the Boards of TNB Group of Companies;• Review and assess the performance and make recommendation to the Board with regards to
Directors who seek re-election and re-appointment at the AGM;• Assess and recommend to the Board the renewal of service contracts of Top Management;• Appointment of Senior Independent Non-Executive Director;• Oversee the appointment, succession planning and performance evaluation of President/CEO
and Top Management; and• Review of TNB Non-Executive Directors remuneration by an independent expert.
The BNRC annually reviews the size, composition and diversity of the Board as well as the mix of existing and desired competencies of Members, and reports its conclusions to the Board.
Through its annual assessment and recommendations made by the BNRC, the Board believes that the current size and composition of the Board is conducive to appropriate decision-making and incorporates a diversity of perspectives and skills in order to represent the best interests of the Company as a whole.
In view of the need to ensure proper processes are in place to manage succession issues at the Board level, an appropriate process for the selection, nomination and appointment of suitable candidates to the Board has been put in place.
The BNRC is entrusted with the responsibility of assessing and considering the capabilities, commitment and qualities of candidates to be appointed as Board Members as well as Committees’ Members, taking into account the required mix of skills, background, experience/expertise/knowledge relevant to Company’s business, existing commitment and potential conflict of interest prior to recommending to the Board.
Following each appointment, a letter of appointment will be issued and the Company Secretary shall undertake the necessary as authorised by the Board, so as to ensure the appointment is in accordance with the statutory requirements and as prescribed by the MMLR. All necessary information will be obtained from the newly appointed Director for the Company’s records and for meeting the statutory requirements and other applicable rules and regulations.
NOMINATION AND REMUNERATION COMMITTEE REPORTNR
KEY RESPONSIBILITIES
• To identify and recommend new nominees to the Board, Board Committees and Boards of TNB Group.
• To consider the Executive Director and Top Management’s succession planning.
• To assist the Board in reviewing the Board’s required mix of skills, experience and other qualities, including core competencies which Non-Executive Directors should bring to the Board.
• To implement the process formulated by the Board to assess the effectiveness of the Board, the Board Committees, Self and Peer.
• To determine and recommend to the Board the remuneration packages of Non-Executive Directors/Executive Directors/Top Management.
• The BNRC’s duties and responsibilities are set out in its TOR which is also available on the Company’s website at www.tnb.com.my.
Leadership & Effectiveness
CHAIRMAN
Juniwati Rahmat HussinIndependent Non-Executive Director(Appointed as Chairman w.e.f. 1 August 2018)
Tan Sri Dato’ Seri Chor Chee HeungIndependent Non-Executive Director(Ceased as Chairman w.e.f. 30 June 2018)
MEMBERS
Amran Hafiz bin AffifudinNon-Independent Non-Executive Director
Noraini binti Che DanSenior Independent Non-Executive Director
(Appointed w.e.f. 1 August 2018)
Datuk Ahmad Badri bin Mohd Zahir Non-Independent Non-Executive Director
(Appointed w.e.f. 1 November 2018)
Dato' Abd Manaf bin Hashim Senior Independent Non-Executive Director
(Ceased as Member w.e.f. 15 May 2018)

About TNB
Our Business
Business Context
Performance Review
Sustainability Statement
The Strength of Our Governance
Financial Statements
Additional Information
p.126
BOARD DIVERSITY
The Board in this regard is to make appointments based on merit with the over-riding objective of ensuring that the Board maintains the correct balance of skills, experience, length of service and knowledge of the Group to successfully deliver the Group’s strategy. In addition, the Board believes that the appointments of the existing Directors were guided by their skills, experience, competency and wealth of knowledge while taking into consideration gender diversity.
The Board strongly supports the Government’s target of having 30% women’s participation on boards of public companies in Malaysia. To date, five (5) women sit on the Board, namely Noraini binti Che Dan, Gee Siew Yoong, Juniwati Rahmat Hussin, Ong Ai Lin and Dato’ Roslina binti Zainal representing 50% of the Board, an increase compared to the previous Financial Period.
The gender mix of the Board and throughout the Company is illustrated by the diagram below:
SUCCESSION PLANNING
The Board assisted by the BNRC is responsible for developing plans to identify the necessary and desirable competencies and skills of Directors and succession plans to ensure there is an appropriate dynamic of skills, experience, expertise and diversity on the Board. The BNRC/Board also oversee the appointment as well as the succession planning of the Top Management.
COMPOSITION OF THE BOARD
TNB Board currently consists of 10 members; one (1) Executive Director and nine (9) Non-Executive Directors, of whom five (5) are Independent Directors. The Independent Directors make up half of the Board, as recommended by the MCCG 2017, while their number exceeds the minimum as prescribed by the MMLR. These Directors are considered by the Board to be independent of Management and free of any business or other relationship or circumstance that could materially interfere with the exercise of objective, unfettered or independent judgement.
The Board may appoint a new Director either to fill a casual vacancy or to add to the existing Directors. The Minister of Finance Incorporated (MoF Inc.), being the Special Shareholder of TNB also possesses the right to appoint up to six (6) Directors. The Company’s Constitution provides that the Company must have at least two (2) Directors but not more than 12 Directors.
The Directors believe that the Board presently has an appropriate balance of skills, experience, knowledge and independence to deliver the Group’s strategy, to enable the Non-Executive Directors to effectively challenge the views of the Management and to satisfy the requirements of good governance.
RE-ELECTION OF DIRECTORS
Tan Sri Leo Moggie and Juniwati Rahmat Hussin, being Directors who are retiring by rotation in accordance with Clause 64(1) of the Company’s Constitution and being eligible, have offered themselves for re-election.
New additions to the Board shall include, Gopala Krishnan K.Sundaram and Ong Ai Lin, both were appointed, with effect from 4 July 2018 and 1 August 2018, respectively. Whilst, Datuk Ahmad Badri bin Mohd Zahir was appointed to the Board with effect from 1 November 2018. On 15 March 2019, Dato’ Roslina binti Zainal was subsequently appointed to the Board. Recently, the Board with the concurrence of the Special Shareholder of TNB has approved the appointment of Amir Hamzah bin Azizan as the new President/CEO of TNB for a period of three (3) years with effect from 2 April 2019. At the forthcoming AGM, they are retiring in accordance with Clause 63(2) of the Company’s Constitution, and being eligible, have offered themselves for re-election.
Tan Sri Leo Moggie, Datuk Ahmad Badri bin Mohd Zahir and Amir Hamzah bin Azizan are the Appointed Directors by MoF Inc., the Special Shareholder of TNB.
The Board recognises Directors’ performance are used as basis in recommending to the shareholders for their re-election. This, in turn, is determined through their annual evaluation and independence assessment, which are assessed by the BNRC before any recommendation is made to the Board for the deliberation and its approval.
Based on the annual independence assessment of all Independent Directors inclusive of Gopala Krishnan K.Sundaram and Ong Ai Lin, the BNRC/Board are satisfied that these Independent Directors have complied with the independence criteria as set out by the MMLR and continue to bring independent and objective judgement to the Board. Through the Board annual evaluation including Self and Peer Assessment, having considered their professionalism, vast experience, material relationship, competency, commitment and individual contribution in performing their respective duties, the BNRC/Board are satisfied that all Directors who are seeking for re-election at AGM 2019 have met the Board’s expectation by continuously discharging their duties diligently as Directors of the Company.
With that the BNRC/Board collectively resolved to recommend the re-election of each Director who is standing for re-election at AGM 2019.
MALE50%
DIVERSITY OF THE BOARD
FEMALE50%
MALE80%
DIVERSITY IN THE COMPANY
FEMALE20%
NOMINATION AND REMUNERATION COMMITTEE REPORTNR
Leadership & Effectiveness

About TNB
Our Business
Business Context
Performance Review
Sustainability Statement
The Strength of Our Governance
Financial Statements
Additional InformationIntegrated Annual Report 2018
Tenaga Nasional Berhad
p.127
INDEPENDENCE ASSESSMENT OF INDEPENDENT DIRECTORS
It is vital for the Board to assess the independence of its Independent Directors. This is done annually with reference to the key criteria developed by the BNRC in a framework adopted by TNB. The criteria include independence from the Management and the absence of any business relationship which could materially interfere with, or could reasonably be perceived to materially interfere with, the Independent Director’s judgement. The Directors are also assessed on their ability to provide strong, valuable contributions to the Board’s deliberations, without interference to and acting in the best interest of TNB.
The Board has considered the independence of each Independent Non-Executive Director in office for Financial Year under review and has concluded that each Independent Non-Executive Director has met the independence criteria as set out in the MMLR. The Board is generally satisfied that each Independent Non-Executive Director remains independent in character and judgement and is free from relationships or circumstances which are likely to affect or could appear to affect the Director’s judgement.
In reaching this conclusion, the Board has considered all relevant facts and circumstances of these relationships, which include whether the Independent Director:
(a) is a major shareholder of the Company or an officer of, or otherwise associated directly with, a major shareholder of the Company;
(b) is employed, or has previously been employed within the last two (2) years in an executive capacity by the Company;
(c) has been engaged as an adviser by the Company or is presently a partner, director (except an Independent Director) or major shareholder, as the case may be, of a firm or corporation which provides professional advisory services to the Company; or
(d) has engaged in any transaction with the Company or is presently a partner, director or major shareholder, as the case may be, of a firm or corporation which has engaged in any transaction with the Company.
The Board also concurs that the continuous contributions of the Directors are beneficial to the Board and the Company as a whole.
The BNRC shall assess the independence of Independent Non-Executive Directors annually. The independence status of Independent Non-Executive Directors standing for re-election is disclosed in the Notice of the 29th AGM.
The Board adopts the policy that limits the tenure of its Independent Non-Executive Directors to nine (9) years, pursuant to Step Up 4.3 of MCCG 2017.
Currently, none of the Independent Non-Executive Directors has served the Board for more than nine (9) years.
BOARD DEVELOPMENT
The Board is conscious of the need to keep themselves properly briefed and informed about current issues. The Board on a continuous basis attends internal and external training programmes, in ensuring they remain updated with the development of the Company’s business and industry that may affect their roles and responsibilities. Topics covered at sessions attended by the Directors during the Financial Year were economics, regulatory developments, risk management, finance, investment, governance and sustainability.
The Company Secretary assists the Board Continuing Development by facilitating the orientation of new Directors and co-ordinating internal training programmes, as well as arranging for external training programmes.
INDUCTION
Newly-appointed Directors receive appropriate induction and training on the Company’s business, corporate governance and reporting procedures, on which they are continuously updated. In addition, the Directors are advised on policies and procedures of the Board and Board Committees’ meetings and their rights and responsibilities.
In addition, the Directors receive a comprehensive information pack containing the Board Charter, the Non-Executive Directors’ Handbook, the Company’s Constitution, relevant Acts affecting the Company, the latest Annual Report, TNB’s Procurement & Supply Chain Policy and Procedures, Procurement Code of Conduct and Code of Ethics in order to facilitate the discharge of their duties.
New Board Members are provided with the opportunity to experience the Company’s operations first-hand and to meet and discuss all aspects of this with the Top Management. The Company Secretary facilitates the induction programme by providing the new Board Members with access to information on areas such as operations, finance, treasury and risk management, as required.
There were a number of induction sessions arranged by the Company Secretary’s Office between the Directors with the respective Top Management during the Financial Year under review to better assist them in understanding the Company’s core businesses and its whole operation. The details are as follows:
DATE INDUCTION PROGRAMME DIRECTOR(S) IN ATTENDANCE
26 February 2018 ICT Division Overview Briefing 1. Amran Hafiz bin Affifudin2. Juniwati Rahmat Hussin
1 March 2018 TNB Repair And Maintenance Sdn. Bhd. (REMACO), TNB Energy Services Sdn. Bhd. (TNBES) dan TNB Engineering Corporation Sdn. Bhd. (TNEC)Overview Briefing
1. Amran Hafiz bin Affifudin2. Juniwati Rahmat Hussin
23 July 2018 Group Finance Division Overview Briefing 1. Gopala Krishnan K.Sundaram2. Ong Ai Lin
23 July 2018 Strategic Management & Performance Department Overview Briefing
1. Gopala Krishnan K.Sundaram2. Ong Ai Lin
Leadership & Effectiveness
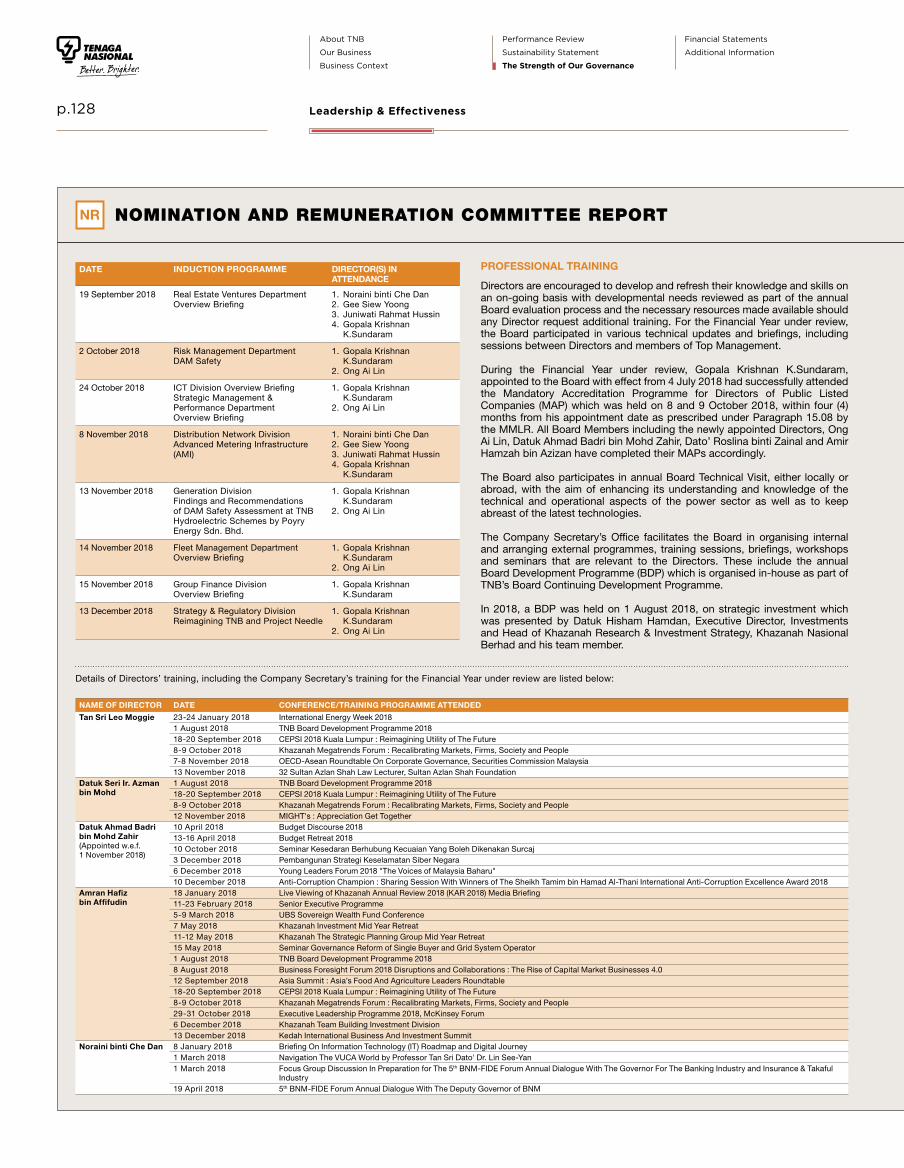
About TNB
Our Business
Business Context
Performance Review
Sustainability Statement
The Strength of Our Governance
Financial Statements
Additional Information
p.128 Leadership & Effectiveness
NOMINATION AND REMUNERATION COMMITTEE REPORTNR
PROFESSIONAL TRAINING
Directors are encouraged to develop and refresh their knowledge and skills on an on-going basis with developmental needs reviewed as part of the annual Board evaluation process and the necessary resources made available should any Director request additional training. For the Financial Year under review, the Board participated in various technical updates and briefings, including sessions between Directors and members of Top Management.
During the Financial Year under review, Gopala Krishnan K.Sundaram, appointed to the Board with effect from 4 July 2018 had successfully attended the Mandatory Accreditation Programme for Directors of Public Listed Companies (MAP) which was held on 8 and 9 October 2018, within four (4) months from his appointment date as prescribed under Paragraph 15.08 by the MMLR. All Board Members including the newly appointed Directors, Ong Ai Lin, Datuk Ahmad Badri bin Mohd Zahir, Dato’ Roslina binti Zainal and Amir Hamzah bin Azizan have completed their MAPs accordingly.
The Board also participates in annual Board Technical Visit, either locally or abroad, with the aim of enhancing its understanding and knowledge of the technical and operational aspects of the power sector as well as to keep abreast of the latest technologies.
The Company Secretary’s Office facilitates the Board in organising internal and arranging external programmes, training sessions, briefings, workshops and seminars that are relevant to the Directors. These include the annual Board Development Programme (BDP) which is organised in-house as part of TNB’s Board Continuing Development Programme.
In 2018, a BDP was held on 1 August 2018, on strategic investment which was presented by Datuk Hisham Hamdan, Executive Director, Investments and Head of Khazanah Research & Investment Strategy, Khazanah Nasional Berhad and his team member.
DATE INDUCTION PROGRAMME DIRECTOR(S) INATTENDANCE
19 September 2018 Real Estate Ventures DepartmentOverview Briefing
1. Noraini binti Che Dan2. Gee Siew Yoong3. Juniwati Rahmat Hussin4. Gopala Krishnan
K.Sundaram
2 October 2018 Risk Management DepartmentDAM Safety
1. Gopala Krishnan K.Sundaram
2. Ong Ai Lin
24 October 2018 ICT Division Overview BriefingStrategic Management & Performance DepartmentOverview Briefing
1. Gopala Krishnan K.Sundaram
2. Ong Ai Lin
8 November 2018 Distribution Network DivisionAdvanced Metering Infrastructure (AMI)
1. Noraini binti Che Dan2. Gee Siew Yoong3. Juniwati Rahmat Hussin4. Gopala Krishnan
K.Sundaram
13 November 2018 Generation DivisionFindings and Recommendations of DAM Safety Assessment at TNB Hydroelectric Schemes by Poyry Energy Sdn. Bhd.
1. Gopala Krishnan K.Sundaram
2. Ong Ai Lin
14 November 2018 Fleet Management DepartmentOverview Briefing
1. Gopala Krishnan K.Sundaram
2. Ong Ai Lin
15 November 2018 Group Finance DivisionOverview Briefing
1. Gopala Krishnan K.Sundaram
13 December 2018 Strategy & Regulatory DivisionReimagining TNB and Project Needle
1. Gopala Krishnan K.Sundaram
2. Ong Ai Lin
Details of Directors’ training, including the Company Secretary’s training for the Financial Year under review are listed below:
NAME OF DIRECTOR DATE CONFERENCE/TRAINING PROGRAMME ATTENDED
Tan Sri Leo Moggie 23-24 January 2018 International Energy Week 20181 August 2018 TNB Board Development Programme 201818-20 September 2018 CEPSI 2018 Kuala Lumpur : Reimagining Utility of The Future8-9 October 2018 Khazanah Megatrends Forum : Recalibrating Markets, Firms, Society and People7-8 November 2018 OECD-Asean Roundtable On Corporate Governance, Securities Commission Malaysia13 November 2018 32 Sultan Azlan Shah Law Lecturer, Sultan Azlan Shah Foundation
Datuk Seri Ir. Azman bin Mohd
1 August 2018 TNB Board Development Programme 201818-20 September 2018 CEPSI 2018 Kuala Lumpur : Reimagining Utility of The Future8-9 October 2018 Khazanah Megatrends Forum : Recalibrating Markets, Firms, Society and People12 November 2018 MIGHT's : Appreciation Get Together
Datuk Ahmad Badri bin Mohd Zahir(Appointed w.e.f. 1 November 2018)
10 April 2018 Budget Discourse 201813-16 April 2018 Budget Retreat 201810 October 2018 Seminar Kesedaran Berhubung Kecuaian Yang Boleh Dikenakan Surcaj3 December 2018 Pembangunan Strategi Keselamatan Siber Negara6 December 2018 Young Leaders Forum 2018 "The Voices of Malaysia Baharu"10 December 2018 Anti-Corruption Champion : Sharing Session With Winners of The Sheikh Tamim bin Hamad Al-Thani International Anti-Corruption Excellence Award 2018
Amran Hafizbin Affifudin
18 January 2018 Live Viewing of Khazanah Annual Review 2018 (KAR 2018) Media Briefing11-23 February 2018 Senior Executive Programme5-9 March 2018 UBS Sovereign Wealth Fund Conference7 May 2018 Khazanah Investment Mid Year Retreat11-12 May 2018 Khazanah The Strategic Planning Group Mid Year Retreat15 May 2018 Seminar Governance Reform of Single Buyer and Grid System Operator1 August 2018 TNB Board Development Programme 20188 August 2018 Business Foresight Forum 2018 Disruptions and Collaborations : The Rise of Capital Market Businesses 4.012 September 2018 Asia Summit : Asia’s Food And Agriculture Leaders Roundtable18-20 September 2018 CEPSI 2018 Kuala Lumpur : Reimagining Utility of The Future8-9 October 2018 Khazanah Megatrends Forum : Recalibrating Markets, Firms, Society and People29-31 October 2018 Executive Leadership Programme 2018, McKinsey Forum6 December 2018 Khazanah Team Building Investment Division13 December 2018 Kedah International Business And Investment Summit
Noraini binti Che Dan 8 January 2018 Briefing On Information Technology (IT) Roadmap and Digital Journey1 March 2018 Navigation The VUCA World by Professor Tan Sri Dato' Dr. Lin See-Yan1 March 2018 Focus Group Discussion In Preparation for The 5th BNM-FIDE Forum Annual Dialogue With The Governor For The Banking Industry and Insurance & Takaful
Industry19 April 2018 5th BNM-FIDE Forum Annual Dialogue With The Deputy Governor of BNM

About TNB
Our Business
Business Context
Performance Review
Sustainability Statement
The Strength of Our Governance
Financial Statements
Additional InformationIntegrated Annual Report 2018
Tenaga Nasional Berhad
p.129 Leadership & Effectiveness
NAME DATE COURSE
Norazni binti Mohd Isa 18 July 2018 Corporate Liability Provision 2018
26-27 July 2018 General Counsel & Company Secretary Asia : Breaking Boundaries in the Age of Disruptive Change
19 September 2018 Directors’ Remuneration for GLICs, GLCs & Government Agencies 2018
20 September 2018 Companies Act 2016: Dealing With Common Issues
18 December 2018 Anti-Money Laundering, Anti-Terrorism Financing and Proceeds of Unlawful Activities Act 2001 (AMLA)
BOARD EVALUATION
The Board recognises an objective and well-managed board evaluation process can lead to substantial improvement in board effectiveness, bringing significant benefits to the Company. This is achieved through annual performance evaluations, induction programmes for new Board members and on-going Board development activities.
In 2018, the Board with the assistance of BNRC, had undertaken a formal and extensive Board Evaluation Assessment (BEA) of its own performance, its Committees and Individual Directors, for the Financial Year ended 31 December 2018.
These evaluations were conducted through the BEA questionnaires and the results were subsequently collected and analysed.
The BEA questionnaires towards an Effective Board cover the following parameters:
Responsibility and Conduct:
• Business Strategy governance and implementation
• Risk management and integrity• Implementation of strategies and policies
Process and Administration:
• Board and Committee Charters • Agenda and frequency of meetings• Sufficient information availability and on a
timely basis
Composition:
• Diversity • Competencies of the Members• Board and Committee compositions
NAME OF DIRECTOR DATE CONFERENCE/TRAINING PROGRAMME ATTENDED
Noraini binti Che Dan 1 August 2018 TNB Board Development Programme 20188 August 2018 Business Foresight Forum 2018 Disruptions and Collaborations : The Rise of Capital Market Businesses 4.03-4 September 2018 Credit Risk Management Banking Sector18-20 September 2018 CEPSI 2018 Kuala Lumpur : Reimagining Utility of The Future21 September 2018 Information Security Awareness and IT Security Talk27 September 2018 Board Development Programme Sale And Services Tax8 October 2018 Khazanah Forum On Balance Recalibrating Market, Firms, Society and People
Gee Siew Yoong 10 January 2018 Briefing on Malaysian Code of Corporate Governance 201725 January 2018 Developing Leaders, Transforming Organisations, Impacting Your Future5 February 2018 Technical Visit To a Self Propelled Heavy Lift Pipelaying Vassels - Sapura 35005 February 2018 Global Gas Market Developments Supply - Demand and Implementations to Pricing Dynamics5 February 2018 Middle East : Opportunity Space for Offshore Oil & Gas Industry5 March 2018 Malaysian Financial Reporting Standards (MFRS 15 & 9)1 August 2018 TNB Board Development Programme 201818-20 September 2018 CEPSI 2018 Kuala Lumpur : Reimagining Utility of The Future8 October 2018 Khazanah Megatrends Forum : Recalibrating Markets, Firms, Society and People14 December 2018 Malaysian Financial Reporting Standards (MFRS 15)
Juniwati Rahmat Hussin
24-25 January 2018 Blockchain Conference - Decentralising and Distributing for Data Validation and Management18 July 2018 Malaysia Association of Risk and Insurance Management (MARIM) Conference 20181 August 2018 TNB Board Development Programme 201818-20 September 2018 CEPSI 2018 Kuala Lumpur : Reimagining Utility of The Future8-9 October 2018 Khazanah Megatrends Forum : Recalibrating Markets, Firms, Society and People16 October 2018 UEM Edgenta Forum : Expressway Operation Safety Passport18-19 October 2018 Asean Board of Directors : Future Proof Your Boardroom “Evolving Into a Proactive and Tech Savvy Board Director Ready to Steer The Company Through A
Storm of Opportunities”22 October 2018 ICLIF : Emerging of Risks, The Future - Board and Return On Compliance
Gopala Krishnan K.Sundaram (Appointed w.e.f. 4 July 2018)
1 August 2018 TNB Board Development Programme 20188 August 2018 Business Foresight Forum 2018 Disruptions and Calloborations : The Rise of Capital Market Businesses 4.018-20 September 2018 CEPSI 2018 Kuala Lumpur : Reimagining Utility of The Future8 October 2018 Khazanah Megatrends Forum : Recalibrating Markets, Firms, Society and People8-9 October 2018 Mandatory Accreditation Programme18-19 October 2018 Asean Board of Directors : Future Proof Your Boardroom “Evolving Into a Proactive and Tech Savvy Board Director Ready to Steer The Company Through A
Storm of Opportunities”30 October 2018 The Annual Report of Tomorrow : Guide to Forward Looking Information15 November 2018 Majlis Sirim Industri 2018
Ong Ai Lin (Appointed w.e.f. 1 August 2018)
5-8 February 2018 Financial Institutions Directors Education - Part 110 April 2018 Artificial Intelligence (AI) and The Auditors6 June 2018 Win The Innovation Race By Prof. Roy Chua 13 July 2018 RHB Bank Sustainability Awareness Session16-19 September 2018 Financial Institutions Directors Education - Part 29 October 2018 Malaysia- A New Dawn Investors’ Conferences9-10 October 2018 Malaysian Institution Accountant Conference30 October 2018 DNA of A Board Leader - De Marshall Goldsmith
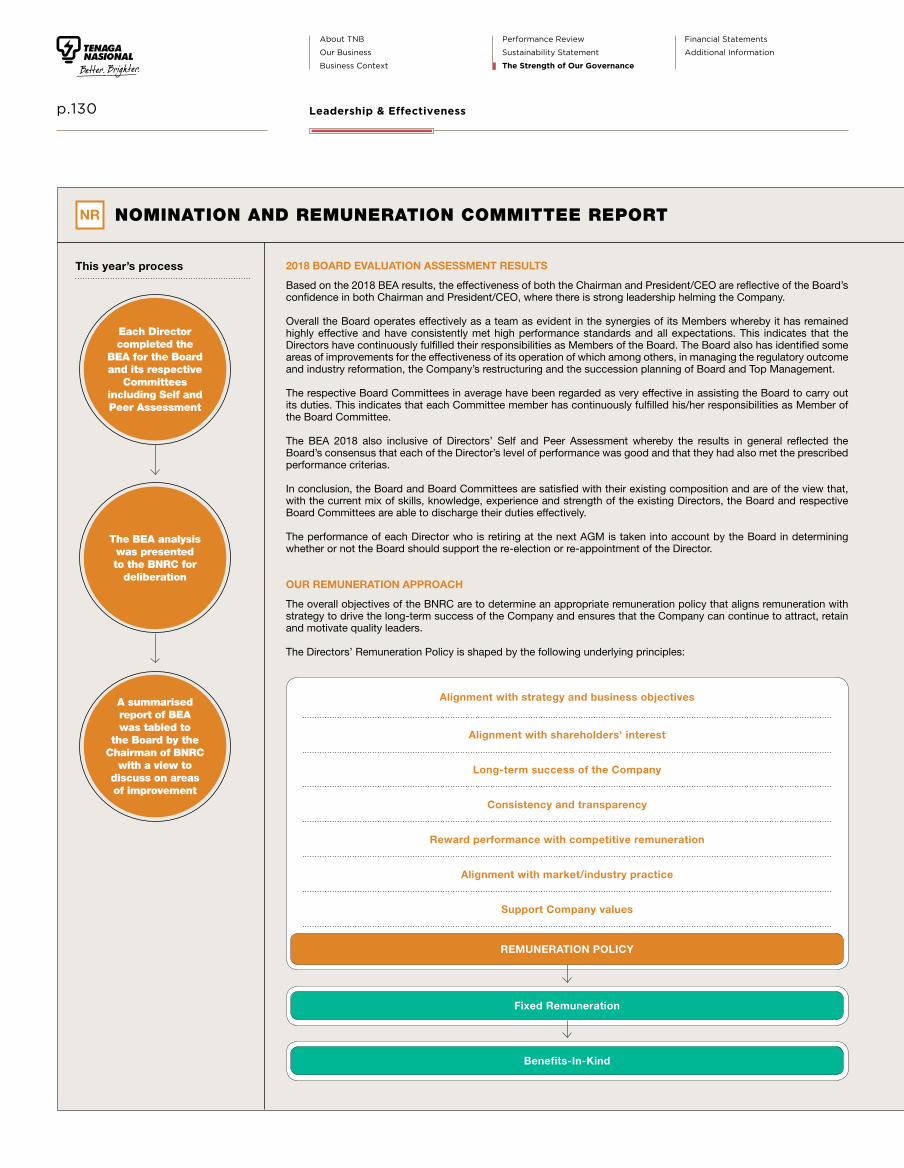
About TNB
Our Business
Business Context
Performance Review
Sustainability Statement
The Strength of Our Governance
Financial Statements
Additional Information
p.130
NOMINATION AND REMUNERATION COMMITTEE REPORTNR
Alignment with strategy and business objectives
Alignment with shareholders' interest
Long-term success of the Company
Consistency and transparency
Reward performance with competitive remuneration
Alignment with market/industry practice
Support Company values
REMUNERATION POLICY
Fixed Remuneration
Benefits-In-Kind
2018 BOARD EVALUATION ASSESSMENT RESULTS
Based on the 2018 BEA results, the effectiveness of both the Chairman and President/CEO are reflective of the Board’s confidence in both Chairman and President/CEO, where there is strong leadership helming the Company.
Overall the Board operates effectively as a team as evident in the synergies of its Members whereby it has remained highly effective and have consistently met high performance standards and all expectations. This indicates that the Directors have continuously fulfilled their responsibilities as Members of the Board. The Board also has identified some areas of improvements for the effectiveness of its operation of which among others, in managing the regulatory outcome and industry reformation, the Company’s restructuring and the succession planning of Board and Top Management.
The respective Board Committees in average have been regarded as very effective in assisting the Board to carry out its duties. This indicates that each Committee member has continuously fulfilled his/her responsibilities as Member of the Board Committee.
The BEA 2018 also inclusive of Directors’ Self and Peer Assessment whereby the results in general reflected the Board’s consensus that each of the Director’s level of performance was good and that they had also met the prescribed performance criterias.
In conclusion, the Board and Board Committees are satisfied with their existing composition and are of the view that, with the current mix of skills, knowledge, experience and strength of the existing Directors, the Board and respective Board Committees are able to discharge their duties effectively.
The performance of each Director who is retiring at the next AGM is taken into account by the Board in determining whether or not the Board should support the re-election or re-appointment of the Director.
OUR REMUNERATION APPROACH
The overall objectives of the BNRC are to determine an appropriate remuneration policy that aligns remuneration with strategy to drive the long-term success of the Company and ensures that the Company can continue to attract, retain and motivate quality leaders.
The Directors’ Remuneration Policy is shaped by the following underlying principles:
Each Director completed the
BEA for the Board and its respective
Committees including Self and Peer Assessment
The BEA analysis was presented to the BNRC for
deliberation
A summarised report of BEA was tabled to
the Board by the Chairman of BNRC
with a view to discuss on areas of improvement
This year’s process
Leadership & Effectiveness

About TNB
Our Business
Business Context
Performance Review
Sustainability Statement
The Strength of Our Governance
Financial Statements
Additional InformationIntegrated Annual Report 2018
Tenaga Nasional Berhad
p.131
DETAILS OF EACH DIRECTOR’S REMUNERATION FOR THE FINANCIAL YEAR ENDED 31 DECEMBER 2018:
Name of Directors
Director’s Fees Meeting Allowances
Salary Company Subsidiaries Company Subsidiaries Emoluments1Benefits-
in-Kind2 Total
(RM) (RM) (RM) (RM) (RM) (RM) (RM) (RM)
Executive Director
Datuk Seri Ir. Azman bin Mohd 2,760,000.00 - - - - 8,694,961.00 44,500.223 11,499,461.22
2,760,000.00 - - - - 8,694,961.00 44,500.22 11,499,461.22
Non-Executive Directors
Tan Sri Leo Moggie - 360,000.00 300,000.00 78,500.00 32,800.00 - 111,739.71 883,039.71
Datuk Ahmad Badri bin Mohd Zahir(Appointed w.e.f. 1 November 2018)
- 40,000.00 - 8,000.00 - - - 48,000.00
Amran Hafiz bin Affifudin - 240,000.004 - 101,500.004 - - 33,460.70 374,960.70
Noraini binti Che Dan(Redesignated w.e.f. 28 February 2019)
- 240,000.00 - 116,500.00 - - 27,657.33 384,157.33
Gee Siew Yoong - 240,000.005 - 102,500.00 - - 18,313.96 360,813.96
Juniwati Rahmat Hussin - 240,000.00 - 84,500.00 - - 18,931.18 343,431.18
Gopala Krishnan K.Sundaram(Appointed w.e.f. 4 July 2018)
- 118,064.51 - 43,500.00 - - 23,294.40 184,858.91
Ong Ai Lin(Appointed w.e.f. 1 August 2018)
- 100,000.005 - 33,000.00 - - 18,541.43 151,541.43
Datuk Seri Hashmuddin bin Mohammad (Resigned w.e.f. 1 April 2018)
- 60,000.00 - 22,000.00 - 200,000.00 4,849.20 286,849.20
Dato’ Abd Manaf bin Hashim(Cessation of Office as Director w.e.f. 15 May 2018)
- 89,677.42 33,333.33 50,000.00 5,000.00 568,500.003 67,411.603 813,922.35
Datuk Sakthivel Alagappan(Cessation of Office as Director w.e.f. 15 May 2018)
- 89,677.42 - 32,500.00 - 200,000.00 71,193.97 393,371.39
Tan Sri Dato’ Seri Chor Chee Heung(Resigned w.e.f. 30 June 2018)
- 120,000.00 - 66,000.00 - 200,000.00 43,782.25 429,782.25
Badrul Ilahan bin Abd Jabbar (Resigned w.e.f. 30 June 2018)
- 120,000.00 - 51,500.00 - 60,000.00 67,630.64 299,130.64
Total 2,760,000.00 2,057,419.35 333,333.33 790,000.00 37,800.00 9,923,461.00 551,306.59 16,453,320.27
NOTES1 Contribution to EPF, Bonus, Car Allowance, Flexi Benefits, LTIP and Gratuity.2 Electricity Bills, Telephone Bills, Business Peripherals, Purchase of Handphone, Medicals and Travelling Expenses.3 Include Subsidiary.4 Paid to Khazanah Nasional Berhad, in respect of Director’s Fees and Meeting Allowances provided for Amran Hafiz bin Affifudin.5 Receivable by the Directors upon shareholders’ approval.
EXECUTIVE DIRECTOR’S REMUNERATION
The remuneration package for the Executive Director is structured to link rewards to corporate and individual performance. It comprises salary, allowances, bonuses and other customary benefits as accorded by comparable companies. A significant portion of an Executive Director’s compensation package has been made variable and is determined by performance during the year against individual KPIs in a scorecard aligned with the corporate objectives as approved by the Board. The Executive Director recuses himself from deliberation and voting on his remuneration at Board meetings.
The BNRC reviews the performance of the Executive Director annually and submits views/recommendations to the Board on adjustments in remuneration and/or rewards to reflect the Executive Director’s contributions towards the Group’s achievements for the year.
NON-EXECUTIVE DIRECTORS' REMUNERATION
The Board as a whole shall determine and recommend the remuneration of the Non-Executive Directors for shareholders’ approval at the AGM. The Non-Executive Directors are remunerated through fixed monthly fees, meeting allowances and benefits-in-kind, inclusive of the reimbursement of electricity bills, telephone bills and business peripherals.
The level of remuneration of Non-Executive Directors reflects the current demanding challenges in discharging their fiduciary duties, roles and responsibilities, whether individually or collectively, as well as the complexity of the Company’s operations and the industry. The existing remuneration by the Board, was last reviewed on 31 January 2013.
In 2018, the Board engaged Willis Towers Watson (WTW) to conduct a holistic and independent review of the Non-Executive Directors’ Remuneration with the view to determine its market competitiveness and alignment with the latest regulations/corporate governance guidelines in Malaysia.
Due to limited listed company data in utilities industry in Malaysia, multiple data sources, combining of local and regional listed companies, beyond the local market and industry, are considered and benchmarked.
From the study, overall, TNB is at par with the market for most of the compensation elements offered to the Non-Executive Directors. With that the current remuneration framework of TNB Non-Executive Directors be retained, and to be reviewed in the next one (1) or two (2) years time to ensure its market competitiveness, as recommended by WTW.
Leadership & Effectiveness

About TNB
Our Business
Business Context
Performance Review
Sustainability Statement
The Strength of Our Governance
Financial Statements
Additional Information
p.132
AUDIT COMMITTEE REPORTA
ACCOUNTABILITY
The Board Audit Committee (BAC) was established on 9 December 1990 by the Board of Directors to assist the Directors to carry out their responsibilities. The BAC is guided by its Terms of Reference.
MEMBERSHIP AND MEETINGS
The BAC comprises four (4) Independent Directors as at 31 December 2018, all of whom are Non-Executive Directors. The Chairman of BAC is not the Chairman of TNB’s Board of Directors. This composition is aligned with Paragraph 15.09 (a) and (b) of the MMLR.
Details of BAC members and their attendance record at BAC meetings held during the Financial Year ended 31 December 2018 (FY2018) are as follows:
No. Name Status of Directorship Independent No. of Meetings Attended
1. Noraini binti Che DanChairman
Non-Executive Director Yes 18/18
2. Gee Siew YoongMember
Non-Executive Director Yes 17/18
3. Gopala Krishnan K.SundaramAppointed as Member w.e.f. 4 July 2018
Non-Executive Director Yes 8/8
4. Ong Ai LinAppointed as Member w.e.f. 1 August 2018
Non-Executive Director Yes 7/7
5. Tan Sri Dato’ Seri Chor Chee Heung Ceased as Member w.e.f. 30 June 2018
Non-Executive Director Yes 10/10
6. Badrul Ilahan bin Abd JabbarCeased as Member w.e.f. 30 June 2018
Non-Executive Director Yes 10/10
7. Datuk Sakthivel AlagappanCeased as Member w.e.f. 15 May 2018
Non-Executive Director Yes 7/7
8. Dato’ Abd Manaf bin Hashim Ceased as Member w.e.f. 15 May 2018
Non-Executive Director Yes 6/7
During the financial year under review, 18 BAC meetings were held. This satisfies Paragraph 5.1 of the BAC Terms of Reference, which requires the Committee to meet at least six (6) times a year.
The Company Secretary, who is the secretary to the BAC, and the Chief Internal Auditor (CIA) were in attendance during the meetings. The President/CEO and other officers were invited to the meetings to deliberate on matters within their purview.
After each meeting, the BAC Chairman submits a report to the Board of Directors on the matters deliberated. Matters reserved for the Board’s approval are tabled at the TNB Board meetings. Action sheets are issued by the Company Secretary on the decisions made and the actions required. These are circulated to the Management for their further action.

About TNB
Our Business
Business Context
Performance Review
Sustainability Statement
The Strength of Our Governance
Financial Statements
Additional InformationIntegrated Annual Report 2018
Tenaga Nasional Berhad
p.133 Accountability
SUMMARY OF ACTIVITIES OF THE BOARD AUDIT COMMITTEE
Principal activities performed by the BAC during FY2018 are summarised as below:
Internal Audit• Approved the 2019 Group Internal Audit (GIA) Annual Audit Plan in
November 2018, in which 90 audits were proposed to be conducted. The plan consists of audits in the form of full scope, design reviews, surprise audits, and external assessments.
Reviewed GIA’s methodology in assessing the risk levels of various auditable areas based on a number of considerations, including high and significant risk rating, TNB’s strategic objectives, business landscape, regulatory requirements, and inputs from BAC and the Senior Management.
The approved plan was established based on an estimated requirement of 9,345 man-days and a projected operating cost of RM20.5 million.
• Approved the FY2019 Key Performance Indicators (KPI) for CIA, relating to TNB’s stakeholders, namely, our shareholders, employees and customers.
• Approved the revised FY2018 Annual Audit Plan in September 2018 to ensure its pertinence and in consideration of changes in current business requirements, as well as to meet requests from BAC and the Management.
• Deliberated on the internal audit reports for TNB and its subsidiaries issued by GIA, which, among others, focused on the effectiveness and adequacy of governance, risk management, and internal controls, audit recommendations, and the Management’s response towards the issues highlighted in the presence of Management. Among the reports presented include security assessment for SCADA control, cyber security strategy, personal data protection, and international investment.
• Two (2) BAC meetings were held at Sabah Electricity Sdn. Bhd. (SESB) on 16 April 2018 and 7 September 2018, respectively, to deliberate on audit findings related to fuel management, human resources, long-term incentive plan, generation planning, collection and credit management, as well as safety.
• BAC took note of the status of actions taken by the Management on matters arising from previous meetings.
• Reviewed TNB’s State of Internal Controls, tabled by GIA on a quarterly basis. Matters reported include audit plan coverage status, audit scope and the risks covered as at the date of the reports, audit rating summary for completed audits, significant audit findings, findings escalated for the Management’s immediate action, and the status of corrective actions.
• BAC was updated quarterly on GIA’s performance, which included percentage completion of the audit plan, cycle time of audit completion, and contribution(s) to the organisation in terms of cost savings/recoveries and/or business process improvements.
Among other matters reported during the meeting were Auditee Satisfaction Survey results, budget utilisation status, summary of trainings attended by auditors, number of auditors with/currently pursuing professional certifications, and improvement initiatives undertaken by GIA.
• Approved the revised Group Internal Audit Charter, after taking into consideration the changes made to the Internal Audit Activity Model Charter 2017, issued by the Institute of Internal Auditors (IIA) Global.
Key revisions made were in the areas of the mission statement of GIA, BAC’s authority on GIA, conditions that may impair the objectivity and independence of internal auditors, and quality assurance and improvement programme.
• BAC reviewed GIA’s organisational independence declaration for FY2018, which was prepared in accordance with the IIA Standards 1110 (Organisation Independence) and 1130 (Impairment to Independence and Objectivity).
It was brought to the BAC’s attention that there had been no conflicts of interest arising from GIA’s audit engagements in FY2018. In the event the CIA determines that GIA’s independence or objectivity may be impaired in fact or appearance, details of impairment will be disclosed to the appropriate parties as stated in the Internal Audit Charter.
External Audit • Deliberated and recommended for the Board’s approval, the external
auditor’s 2018 Audit Plan encompassing the proposed audit approach, the nature and scope for the year’s audit, audit fees, reporting schedule, and potential key audit matters. The external auditor informed that focus will be placed on areas related to information technology risk assurance i.e. security, application control, sales and service tax, and change of handled devices.
• Evaluated the independence and objectivity of the external auditor by reviewing the fees and the list of non-audit services provided by the external auditor to TNB and the Group on a quarterly basis.
BAC requested that justifications are to be provided by the Management for the appointment of external auditors for non-audit services. Additionally, allocation of non-audit services to the external auditor that exceeds the threshold set (i.e. 50% of audit and audit-related services), will need to be reported to BAC and the Board.
About TNB
Our Business
Business Context
Performance Review
Sustainability Statement
The Strength of Our Governance
Financial Statements
Additional Information
p.134
AUDIT COMMITTEE REPORTA
During the year, BAC was informed that the non-audit services amount for external auditors had exceeded the threshold limit. This was due to contracts awarded prior to the implementation of the threshold limit. Subsequently, the appointment of PricewaterhouseCoopers (PwC) as TNB’s tax advisor for year assessment 2019 and 2020 was deferred as the non-audit services amount had exceeded the threshold set, and to avoid potential impairment of independence.
• BAC exercised its rights, as stipulated in its Terms of Reference, to hold meetings with the appointed external auditor without the presence of Management to enable open discussions with the BAC.
During the year, three (3) meetings were held without the Management’s presence, namely, on 28 February 2018, 30 August 2018 and 27 November 2018.
• Reviewed the overall performance of the external auditor for the period from 1 September 2017 to 31 December 2017.
A survey was coordinated by GIA, and assessments on the effectiveness of the external auditor was performed by members of BAC and the Management. The external auditor was assessed based on:
(1) Quality of service;(2) Sufficiency of resources; (3) Communication and interaction; and (4) Independence, objectivity and professional scepticism.
Based on the assessments, the external auditor was informed on areas that required further improvement to enhance their services.
• Deliberated and endorsed the revised policy on external auditors for the Board’s approval. Changes made took into consideration the provisions under the Malaysian Code on Corporate Governance (MCCG) 2017 and the TNB Implementation Guidelines on External Auditors’ Independence.
Financial Results• In February 2018, BAC endorsed and recommended the audited
financial statements of the Company and the Group for the Financial Year ended 31 December 2017 for the Board’s approval.
• Reviewed the quarterly Unaudited Financial Results of the Group and the draft announcements before recommending them for the Board’s approval. The recommendations were made upon deliberation on the external auditor’s Audit Committee Report, comprising:
(1) Significant accounting matters;(2) Key developments during the quarter involving the acquisition
of subsidiaries, transition of the Malaysian Financial Reporting Standards (MFRS) framework, new projects and renewable energy;
(3) Overseas investments; and (4) Key accounting developments including MFRS 16 (Leases).
• Recommended the proposed final dividend for the period ended 31 December 2017 and Interim 1 Single-Tier Dividend for the quarter ended 30 June 2018. BAC reviewed and received assurance from the Management, based on the solvency test conducted, that the distribution of dividends was in accordance with the provisions made under the Companies Act 2016.
Related Party Transactions• In February 2018, BAC reviewed all related party/recurrent related party
transactions entered into by TNB Group for the Financial Year ended 31 December 2017, and recommended to the Board that TNB Group complied with the MMLR.
Annual Reporting• Reviewed and endorsed the BAC Report, Statement on Internal Audit
Function, TNB Sustainability Statement and Corporate Governance Overview Statement for the Board’s approval.
Others• Discussed and adviced newly-acquired subsidiaries on compliance
with the Group External Auditors Policy for the appointment of external auditors.
• Reviewed the proposal for the granting and vesting of performance shares, as well as restricted shares under TNB’s Long Term Incentive Plan (LTIP) for the Board’s approval.
• During the BAC meeting in March 2018, key highlights and findings of the Regulatory Compliance Audit (RCA) 2016, carried out in conjunction with the requirement of the Malaysian Electricity Supply Act 1990 and the operator license granted to TNB were discussed. BAC commented that the RCA 2016 results were satisfactory, as the initiatives planned by TNB showed consistent improvements as compared to previous audit results.
NORAINI BINTI CHE DANChairman, Board Audit CommitteeSenior Independent Non-Executive Director
Accountability

About TNB
Our Business
Business Context
Performance Review
Sustainability Statement
The Strength of Our Governance
Financial Statements
Additional InformationIntegrated Annual Report 2018
Tenaga Nasional Berhad
p.135
LIMITS OF AUTHORITY
The Limits of Authority outline principles to govern decision making within the Group, including appropriate escalation and reporting to the Board. The Board has also delegated to the President/CEO, and through the President/CEO to other Executives, responsibility to manage the Company’s day-to-day activities. The Limits of Authority encompass both monetary and non-monetary limits of authority for recommending and approving operational and management decision-making activities prior to its execution. This allows for balanced effective oversight with appropriate empowerment and accountability of the Management.
CODE OF ETHICS
The Board of Directors is guided by a high standard of ethical conduct in accordance with the Code of Ethics for Company Directors as established by the Companies Commission of Malaysia.
Each Non-Executive Director is supplied with the Non-Executive Directors’ Handbook as reference of their professional responsibilities as well as the terms and conditions of their service. The Non-Executive Directors’ Handbook is updated as and when the need arises to reflect any changes of the applicable rules and regulations as well as in the policies/procedures that govern the conduct of the Directors.
TNB has a Code of Ethics to govern the conduct of its employees. The provisions set out in the Code of Ethics ensure compliance with laws and regulations, sound employment practices, confidentiality and privacy. It also includes provisions on conflicts of interest, giving and accepting business courtesies and the protection and proper use of TNB’s assets and resources.
TNB’s Code of Ethics also defines how TNB relates to its shareholders, employees, customers, suppliers and the communities in which it operates. It includes TNB’s general principles on business integrity. All employees are expected to conduct business in accordance with the applicable laws, rules and regulations and in a manner so as to enhance and protect the reputation of TNB.
TNB’s Procurement Code of Conduct guides TNB’s Directors and employees as well as all existing and potential suppliers/contractors including their directors and employees. TNB believes that all supplier/contractor relationships should be based on principles of good governance such as integrity, accountability, fairness and a zero-tolerance rule towards bribery and corruption. These principles are enforced in the Procurement Code of Conduct, which is constantly revised to reflect changes in regulations, reputational demands and business challenges.
The Procurement & Supply Chain Policy and Procedures provides a set of general policy and procedures as guidance in executing procurement within TNB. The Policy and Procedures enables TNB to obtain the best value in procurement, adopt leading business practice, advance TNB’s business priorities, add value to customers and uphold good corporate governance.
TNB’s Code of Ethics and Procurement Code of Conduct are available at their respective sections of the Company’s website at www.tnb.com.my.
CONFLICTS OF INTEREST
To foster ethical and independent decision-making, the Company requires Directors with any direct or indirect interest in a proposal or transaction being considered by the Board or its Committees to declare that interest and recuse himself/herself from the deliberations. The affected Director will take no part in the decision-making.
WHISTLE BLOWING PROCEDURE
The Whistle Blowing Procedure embodies TNB’s commitment to maintaining an open working environment in which employees, contractors and members of the public are able to report instances of unethical, unlawful or undesirable conduct on a confidential basis without any fear of intimidation or reprisal. An independent investigation team investigates all reported concerns and where applicable, provides feedback regarding the investigation’s outcome.
The objectives of the Whistle Blowing Procedure are as follows:
• to detect and address unacceptable conduct;• to provide employees and contractors with a supportive working
environment in which they feel able to raise issues of legitimate concern to them and to TNB; and
• to protect people who report unacceptable conduct in good faith.
Complaints can be channeled online via wbis.tnb.com.my or [email protected] or by calling the toll-free line at 1-800-888-862.
TNB had been awarded the ISO 37001 Anti-Corruption Management System from SIRIM on 15 November 2018, strengthening its integrity values through the publication of the TNB Corporate Integrity Management System (TCIMS) Handbook.
The objectives for the TCIMS are summarised below:
• Bring TNB up to international standards of integrity infrastructure• Impact corruption costs; and• Improve Company culture.
The TCIMS Handbook was launched by the Deputy Minister of Energy, Science, Technology, Environment and Climate Change (MESTECC), Isnaraissah Munirah Majilis, in conjunction with TNB’s Integrity Day 2018, which was held on 20 December 2018, at Dewan Serbaguna, Kompleks Sukan TNB, Jalan Pantai Baru, 59200 Kuala Lumpur. The TCIMS Handbook, is based on the ISO 37001 standard, covers elements such as due diligence, financial and non-financial controls, policies on specific high-risk bribery areas, whistleblowing policy, and training and communication.
The 61-page book covers five (5) TCIMS policies; Anti Bribery Policy, Gifts, Hospitability and Related Benefits Policy, Conflicts of Interest Policy, Whistleblowing Policy and Integrity Pact and Committee Integrity Pledges Policy.
Accountability

About TNB
Our Business
Business Context
Performance Review
Sustainability Statement
The Strength of Our Governance
Financial Statements
Additional Information
p.136 Accountability
RISK COMMITTEE REPORTR
BOARD RISKCOMMITTEE
KEY RESPONSIBILITIES
• Oversees the establishment and implementation of the risk management framework that is embedded into the culture, processes and structures of the Group and is responsive to changes in the business environment.
• Approves the risk management framework and policies on behalf of the Board.
• Ensures that the principles and requirements of managing risk are consistently communicated and adopted throughout the Group.
• Deliberates the Group’s strategic risks as well as key operating risks and risk issues through timely and regular reports and ensures the implementation of appropriate systems to manage these risks. It has the authority to direct special investigations, on behalf of the Board, into significant risk management activities, as and when necessary.
• Approves on behalf of the Board, the risk appetite for the strategic risks and key operating risks and ensures that actions are taken in a timely manner when risks are outside tolerable ranges.
• Reviews the adequacy of and to provide independent assurance to the Board of the effectiveness of the risk management framework implemented in the Group on an annual basis.
CHAIRMANGee Siew YoongIndependent Non-Executive Director(Appointed as Chairman w.e.f. 16 May 2018)
Dato’ Abd Manaf bin HashimSenior Independent Non-Executive Director(Ceased as Chairman w.e.f. 15 May 2018)
MEMBERSNoraini binti Che DanSenior Independent Non-Executive Director
Juniwati Rahmat HussinIndependent Non-Executive Director
Gopala Krishnan K.SundaramIndependent Non-Executive Director(Appointed as Member w.e.f. 1 August 2018)
Ong Ai LinIndependent Non-Executive Director(Appointed as Member w.e.f. 15 August 2018)
Datuk Seri Hashmuddin bin MohammadNon-Independent Non-Executive Director (Ceased as Member w.e.f. 1 April 2018)
Badrul Ilahan bin Abd JabbarIndependent Non-Executive Director(Ceased as Member w.e.f. 30 June 2018)
ROLE OF COMMITTEE
The Board Risk Committee (BRC) was established on 5 June 2013 by the Board of Directors (Board) to assist the Board to carry out its responsibilities. The Board, through the BRC, is responsible to oversee the effectiveness and adequacy of the Group’s risk management framework and ensure it forms part of the corporate culture. This is in line with the requirements stated in the Malaysian Code on Corporate Governance and Bursa Malaysia’s Main Market Listing Requirements.
The main role of the BRC is to assist the Board in ensuring that the Group has in place a sound and robust enterprise risk management framework and such framework has been effectively implemented to enhance the Group’s ability to achieve its strategic objectives.
HOW THE COMMITTEE OPERATES
The BRC meetings are pre-determined for the following financial year and is tabled to the Board. It is thereafter communicated to the members with the specific meeting agenda prior to each meeting.
In FY2018, there were 12 BRC sittings. Prior to the meeting, BRC members were provided with papers approved for tabling and updates of outstanding matters from previous meetings for the members’ perusal.
The Chief Risk Officer (CRO) and Company Secretary, who is also secretary to the BRC, attended the meetings. Other attendees, internal or external, were invited to deliberate on matters within their purview.
Action sheets were issued by the Company Secretary on decisions made and action required. These were circulated to Management for their further action. The BRC Chairman Reports were tabled at the Board meetings for notification and/or further deliberation on matters within the purview of the Board.
SUMMARY OF ACTIVITIES FOR FY2018
The BRC principal activities in the year under review are summarised below: • Reviewed the Statement of Risk Management and Internal
Control, which summarised the risk management practices and internal controls implemented by Management. Assurances from the President/CEO and CFO were given to the Board that the Group’s risk management and internal control system is operating adequately and effectively, in all material aspects.
• Deliberated the Group’s key operational risks and key controls taken to manage the risks. Additional mitigations to strengthen the management of existing and emerging risks were recommended for further action.
• Reviewed and deliberated Key Risk Indicators that were reported through a Quarterly Risk Dashboard. Relevant business units reported the status of action taken to mitigate potential adverse impacts.

About TNB
Our Business
Business Context
Performance Review
Sustainability Statement
The Strength of Our Governance
Financial Statements
Additional InformationIntegrated Annual Report 2018
Tenaga Nasional Berhad
p.137 Accountability
• Reviewed reports on risk incidents and deliberated the adequacy and effectiveness of preventive and corrective action.
• Reviewed the risk profiles and mitigation plans for projects and proposed investments with recommendations for further action and/or study of the feasibility and commerciality of the projects and investments in meeting the Group’s strategic objectives.
• Reviewed the Group’s insurance programmes and recommended improvements for an adequate and effective risk transfer mechanism in the interests of the Group.
RISK MANAGEMENT
BRC is assisted by the CRO and the Risk Management Department (RMD) in discharging its duties and responsibilities.
RMD is responsible for the effective implementation of the TNB Risk Management Framework for informed decision-making. The TNB Risk Management Framework had been developed in alignment with the ISO 31000 international standard. RMD is responsible to consolidate, assess and report risk information from across the Group. The implementation of the TNB Risk Management Framework in the Group is subjected to the independent assurance and assessment of the Group Internal Audit Department. Additionally, RMD establishes appropriate insurance programmes as an effective risk transfer mechanism for the Group.
RMD ensures the implementation of the TNB Risk Management Process across the Group. The TNB Risk Management Process is a step-by-step process of risk identification, analysis evaluation and treatment in view of the business objectives and strategy. In the year under review, RMD facilitated 24 risk workshops with relevant risk owners across the Group in applying the TNB Risk Management Process. The online and real-time TNB Risk Information System (TRIS) captures the risk registers of the Group and functions as a platform for monitoring and reporting.
The TNB Investment Risk Assessment (TIRA) was developed by RMD in 2015 with the objective of providing a standardised risk assessment methodology for investment proposals that reflects the risk appetite of the BRC. In the year under review, the TIRA guideline was applied for five (5) investment proposals.
In accordance with the TNB Risk Management Structure, risk matters especially cross-divisional issues are deliberated at the quarterly Group Risk Management Working Committee meetings chaired by the CRO. In addition, a Subsidiary Risk Management Working Committee (SRMWC) with Managing Directors of TNB subsidiaries as members, was formed for the purpose of effective implementation and integration of risk management in TNB subsidiaries. RMD, secretariat of the above-mentioned committees, collates and reports the risk profiles, Key Risk Indicators, lessons learned from risk events and emerging risks.
In the year under review, RMD assessed the risk maturity of 12 business units and subsidiaries with the objective of gauging the risk culture and risk management effectiveness of the organisation and providing value-added recommendations for risk management improvements.
Moreover, in the effort to inculcate a risk-thinking mentality amongst TNB employees, two (2) risk conferences for executives were organised in Johor Bahru and Kuala Lumpur with the theme “Let’s Manage Risk Together”. Furthermore, an inaugural TNB Cyber Security Risk Conference was organised to heighten the mindfulness of decision makers of cyber security risks and related mitigation in view of the potential catastrophic impact to business and reputation. In addition, 376 non-executives in total attended three (3) risk forums held across Peninsular Malaysia. Besides learning lessons from case studies, the non-executives had the opportunity to brainstorm potential risks and mitigations related to their areas of responsibility.
CONCLUSION
The BRC continues to diligently exercise its risk oversight responsibilities by ensuring that risk management is an integral part of strategic planning and decision making for the achievement of the Group’s strategic outcomes and long-term objectives.
This statement was made in accordance with the resolution of the Board of Directors dated 28 February 2019.
GEE SIEW YOONGChairman, Board Risk CommitteeIndependent Non-Executive Director

About TNB
Our Business
Business Context
Performance Review
Sustainability Statement
The Strength of Our Governance
Financial Statements
Additional Information
p.138
INTERNAL AUDIT FUNCTION
TNB’s internal audit function, which is under the purview of the Group Internal Audit Department (GIA), is established by TNB’s Board of Directors to provide independent, objective assurance, and consulting services designed to add value and improve TNB’s operations.
GIA is currently headed by Rosli bin Mohd Rose, who is the Chief Internal Auditor (CIA). He joined GIA as the Deputy CIA (Core Business) in 2006, and was appointed as the CIA in 2014. He holds a Degree of Electrical and Electronic Engineering from Brighton Polytechnic (currently known as University of Brighton), United Kingdom, and a Master of Engineering from Universiti Tenaga Nasional, Malaysia. Prior to joining GIA, he had extensive experience in various aspects of TNB’s operations, such as operations and maintenance, project management, asset management, human resources, and business development. Additionally, he is an Associate Member of Institute of Internal Auditors Malaysia.
PRACTICES AND FRAMEWORK
GIA endeavours to enhance and protect TNB Group’s organisational value by providing independent, risk-based and objective assurance, advice and insight. GIA helps TNB accomplish its objective by bringing a systematic, disciplined approach to evaluate and improve the effectiveness of governance, risk management, and internal control processes.
GIA is guided by internal policies and procedures, as well as the Internal Control Framework of Committee of Sponsoring Organisation of the Treadway Commission (COSO) and the Control Objectives for Information and Related Technologies (COBIT), in assessing and reporting the adequacy and effectiveness of the design and implementation of the organisation’s overall system of internal controls, risk management, and governance.
Additionally, to effectively manage its functions and perform audit engagements, GIA adopts the standards and principles outlined in the International Professional Practices Framework (IPPF) of the Institute of Internal Auditors (IIA) Global, which comprises the Core Principles for the Professional Practice of Internal Auditing, the International Standards for the Professional Practice of Internal Auditing, the definition of Internal Auditing, and our Code of Ethics.
SCOPE AND COVERAGE
GIA formulated its annual audit plan using a risk-based approach, taking into consideration TNB’s strategic objectives, business landscape, regulatory requirements, as well as inputs from the BAC and the Senior Management.
The audit universe covered during the FY2018 includes, but not limited to, departments, divisions, and corporate functions, such as: generation, grid, distribution, procurement, projects, engineering, accounting and finance, human resources, information and communication technology, strategy and regulatory, corporate communications, energy ventures, and subsidiaries.
Among the key operational areas reviewed during FY2018 include:• Operations and maintenance;• Project management;• Fuel/coal management; • Production and quality assurance; • Corporate governance; • System security and data centre management; • Financial management; • Key leadership management; • Human resource and compensation/benefit management; • Strategic risk management; • Procurement and contract management; • Supplier management; • Fleet management; • Regulatory compliance management; • Insurance management; • Management of security services; • Meter installation management; • Collection and credit management; • Investment management; • Integrity management; and • Health, safety and environmental management.
Based on the audits carried out in FY2018, among the key risks covered include non-compliance with regulatory requirements, fraud, cyber threat including data manipulation/security breach, ineffective credit management and delay in collections, competency mismatch to drive strategy, inability to adapt to changing market environment, incapability to leverage on available technology, and ineffective engagements and communications with stakeholders.
Accountability

About TNB
Our Business
Business Context
Performance Review
Sustainability Statement
The Strength of Our Governance
Financial Statements
Additional InformationIntegrated Annual Report 2018
Tenaga Nasional Berhad
p.139 Accountability
RESOURCES
As at 31 December 2018, GIA is staffed with 63 auditors from diverse disciplines, as summarised below:
Discipline No. of Auditors Percentage (%)
Accounting, Finance and Business 32 51
Engineering 20 32
Quantity Surveying 4 6
System Analyst/Computer Science/Information Technology 7 11
Total 63 100
The total cost incurred in managing the internal audit function for FY2018 was RM18.4 million, comprising mainly staff costs and spending related to audit activities, as follows:
Category RM (Million) % of Total Cost
Staff costs 12.5 68
Operating costs 2.7 15
Consultancy fees 3.2 17
Total 18.4 100
During FY2018, GIA issued a total of 196 reports arising from 70 planned audits, three (3) investigation audits, two (2) surprise audits, and 121 follow-up audits.
PROFESSIONAL QUALIFICATIONS AND COMPETENCY DEVELOPMENT
GIA continuously encourages its auditors to uphold professional skills and proficiency by obtaining the relevant professional qualifications and/or certifications, namely, Certified Internal Auditor (CIA), Certified Information System Auditor (CISA), Certification in Risk Management Assurance (CRMA), Chartered Accountant (CA) and Professional Engineer.
As at 31 December 2018, GIA had in its team a total of 19 qualified professionals who possess various professional qualifications and/or certifications, as shown below:
Certification No. of Auditors
CIA 7
CRMA 2
CISA 1
CPA/ACCA/CIMA/MICPA/CA 7
Professional Engineer 2
Total 19
Note: CPA – Certified Public Accountant, ACCA – Association of Chartered Certified Accountant, CIMA – Chartered Institute of Management Accountant, MICPA – Malaysian Institute of Certified Public Accountant

About TNB
Our Business
Business Context
Performance Review
Sustainability Statement
The Strength of Our Governance
Financial Statements
Additional Information
p.140 Accountability
INTERNAL AUDIT FUNCTION
In addition to the above, 33% (equivalent to 21 auditors) are in the midst of pursuing their respective professional qualifications and/or certifications at various levels.
GIA commits to ensure that the level of its auditors’ skills, knowledge, and competencies are maintained as stipulated in GIA’s Charter. These are accomplished through the following:
• Involvement of auditors in conferences and trainings in the area of auditing skills, technical skills, leadership and communication skills, business acumen, strategic management and personal development;
• Assignment of auditors to other divisions/special projects to gain operational experience; and
• Participation in knowledge sharing sessions with government-linked companies and presentation of audit papers in conferences.
As at 31 December 2018, GIA incurred a total cost of RM201,000 on such trainings and conferences.
SUMMARY OF GIA’S ACTIVITIES IN FY2018
The following summarises the activities undertaken by GIA in FY2018:
• Presented TNB’s State of Internal Controls to the BAC on a quarterly basis to highlight the implementation status of GIA’s audit plan and coverage, audit scope and the risks covered as at the report date, audit rating summary for completed audits, significant audit findings, findings escalated for the Management’s immediate action, and status of corrective actions.
• Coordinated and attended meetings with the Risk Management Department to deliberate on emerging risks and relevant mitigation plans.
• Carried out advisory services, among which include:
(1) Engaged with Top Management during TNB Leadership Group (TLG) meetings to discuss key highlights of internal audit reports and participated in management seminars to brief on TNB’s current internal audit structure, execution of surprise audits, and corrective actions status update; and
(2) Conducted control self-assessment training for the Security Services Department.
• Provided independent and objective assurance on the adequacy of internal controls implemented to mitigate risk exposures. Reports on audits performed, which consist of observations, improvement opportunities, Management responses, deadlines and the persons-in-charge for the implementation of corrective actions were issued to the respective auditees, Senior Management and BAC.
• Performed follow-up audits on corrective actions agreed by the Management to assess whether the necessary actions have been implemented adequately and in a timely manner.
• Conducted quality assurance and improvement activities, including:
(1) Internal quality assessment on the audit function to assess conformance to the IPPF; and
(2) Established quality assurance and improvement programmes which are monitored on a quarterly basis and reported to the BAC.
• Rolled out electronic updating/monitoring of corrective actions via TeamCentral, as part of Management updates.
• Enhanced GIA’s audit approach and coverage through the use of technology (i.e. Audit Management System and Computer-Assisted Audit Tools) and carried out resource optimisation to further improve audit efficiency and effectiveness.
ROSLI BIN MOHD ROSE
Chief Internal Auditor
NORAINI BINTI CHE DAN
Chairman, Board Audit Committee Senior Independent Non-Executive Director

About TNB
Our Business
Business Context
Performance Review
Sustainability Statement
The Strength of Our Governance
Financial Statements
Additional InformationIntegrated Annual Report 2018
Tenaga Nasional Berhad
p.141
COMMUNICATION AND ENGAGEMENT WITH SHAREHOLDERS
The Group values engagement with investment community and consistently improving transparency by having various channels of communication for shareholders and investors. The Group believes that having continues effective relationship with investors, as well as acknowledges the importance of timely, accurate and transparent in disseminating information to the investment community are the fundamentals in maximising the shareholder value.
The Board encourages continuous disclosure and communication of information to its stakeholders. This is essential to strengthen the Group relationship with the stakeholders in realising the Company’s aspiration to become a Global Top 10 Utility by 2025. Keeping that in mind, the Group proactively sets investor engagement sessions with the investment community to instill confidence and enhancing their understanding of the Company’s strategic decisions.
The Group has outlined various extensive channels, which allows TNB Senior Management and Investor Relations (IR) team to communicate relevant and material information in order to maintain close and transparent relationships with our institutional and retail investors, fund managers and research analysts.
These channels include:• Quarterly and Full Year Financial Results Announcements• Engagement session with investors and analysts through One-on-One/
Group Meetings, IR Conferences and Non-Deal Roadshows• Interactive session with investors at Annual General Meeting• Site Visits• IR section of the website• Bursa filings and Press Release• Annual reports
CORPORATE DISCLOSURE POLICY
The Corporate Disclosure Policy, as well as associated guidelines, reinforce TNB’s commitment to continuous disclosure and outline Management’s accountabilities and the processes to be followed in ensuring compliance.
TNB’s practice is to release all price-sensitive information to Bursa Malaysia Securities Berhad in a timely manner as required under the MMLR and to the market and community generally through TNB’s media releases, website and other appropriate channels.
For disclosure purposes, price-sensitive information is information that a reasonable person would expect to have a material effect on the price or value of TNB’s securities. The Company Secretary is responsible for reviewing proposed disclosures and making decisions in relation to the disclosure of information to the market. Each Division in TNB is required to inform the Company Secretary of any potential price-sensitive information concerning TNB as soon as this becomes known.
ANNUAL GENERAL MEETING
Our Annual General Meeting is attended by our Board and Top Management and all our eligible shareholders are welcomed to attend.
A presentation of the Company’s financial and technical/operational highlights is given before the Chairman deals with the formal business of the meeting. Shareholders are encouraged to attend the AGMs and to use the opportunity to ask questions on the Company's performance under review and to vote on the proposed resolutions including but not limited to the receipt of the audited financial statements and the reports of Directors and Auditors, re-election of Directors of those retiring and the fixing of the fees of Directors. TNB conducts its AGM by poll/ e-voting in accordance with Paragraph 8.29A of the MMLR (voting by poll). The outcomes of voting on the proposed resolutions are disclosed to the market and posted on the Company’s website after the AGM. The External Auditors attend the AGM to answer shareholders’ questions on the conduct of the audit, the preparation and content of the audit report, the accounting policies adopted by the Company and the independence of the auditors in the audit process. TNB further encourages shareholders to access the Integrated Annual Report online to complement the Group’s commitment to the environment, as well as to achieve greater cost efficiencies. Nevertheless, shareholders are still provided with the Integrated Annual Report in CD-ROM format together with a summarised version of the Financial Statements, Notice of AGM and Proxy Form.
INVESTOR RELATIONS
TNB strives to continuously aim and building strong and long-term relationships with our various stakeholders, especially the financial community. TNB are committed in maintaining high standard in the dissemination of relevant and material information on the Company’s development through effective engagement and communication, while ensuring these information are comprehensive, timely and transparent. The information communicated to the financial community consists mainly of TNB business strategies and directions, regulatory updates, financial and technical performance.
IR uses numerous platforms to maintain our engagements with shareholders and stakeholders through Quarterly and Full Year Financial Announcements, Analysts Briefing Presentations, Conference Calls, One-on-One and Group Meetings at Investor Conferences, Non-Deal Roadshows (NDR) and In-House Meetings.
FINANCIAL REPORTING
The Board aims to provide a clear, balanced and comprehensive assessment of the Group’s financial performance and prospects to shareholders, investors and relevant regulatory authorities via the quarterly financial reports, audited financial statements, annual reports and other reports or statements as well as through material disclosures made in accordance with the MMLR.
The BAC assists the Board in overseeing the integrity of the Group’s financial reporting, including the operation of the financial reporting processes. The processes are aimed at providing assurance that the financial statements and related notes are completed in accordance with applicable legal requirements and accounting standards and give a true and fair view of the Group’s financial position.
RELATIONS WITHSHAREHOLDERS

About TNB
Our Business
Business Context
Performance Review
Sustainability Statement
The Strength of Our Governance
Financial Statements
Additional Information
p.142 Relations with Shareholders
RELATIONSHIP WITH EXTERNAL AUDITORS
The Board maintains a transparent and professional relationship with the External Auditors, with the BAC responsible for recommending the appointment or removal of the External Auditors, the approval of their remuneration and the terms of their engagement to the Board.
As underlined by its TOR, the BAC shall meet the External and Internal Auditors or both at least twice a year to discuss issues arising out of audits and any matters that the auditors may wish to discuss in the absence of the Management.
For the Financial Year under review, three (3) sessions between the BAC and the External Auditors in the absence of Management was held for greater exchange of views and opinions between both parties in relation to financial reporting.
The Board/BAC are responsible for reviewing, assessing and monitoring the performances, suitability and independence of External Auditors. The Board has set a policy on External Auditors which stipulates the guidelines and procedures for the Board/BAC to assess and monitor the performances and independence of External Auditors.
The policy covers Selection and Appointment, Independence, Conflict of Interest, Non-Audit Services, Rotation of Audit Partner (applies to lead audit engagement partner), Annual Reporting, Annual Assessment and Audit Fees.
The appointed Audit Partner by the External Auditors is subject to rotation at least every five (5) financial years.
The External Auditors can also be engaged to perform non-audit services provided such services do not impair either in fact or appearance, the auditors’ objectivity, judgment or independence.
The External Auditors are required to provide their written assurance of meeting the independence requirements for each non-audit service undertaken by them for TNB Group.
The prohibition of non-audit services is based on three (3) basic principles that the External Auditors cannot function in the role of Management; cannot audit their own work; and cannot serve in an advocacy role of TNB Group.
The External Auditors shall observe and comply with the By-Laws of the Malaysian Institute of Accountants in relation to the provision of non-audit services and if necessary, apply safeguards as stipulated in the By-Laws.
The BAC assists the Board in assessing whether the independence of the External Auditors has been maintained, having regard to any non-audit related services. The BAC has considered the provision of non-audit fees by the External Auditors for the non-audit services provided to the Group and the Company during the Financial Year and has concluded that the provision of these fees does not compromise and impair the External Auditors’ independence or objectivity.
The Auditors’ Remuneration including Non-Audit Fees for the Company and the Group for the Financial Year ended 31 December 2018 is as follows:
GroupRM ‘Million
CompanyRM ‘Million
Statutory Audit 3.5 1.5
Audit Related Services 2.6 2.6
Non-audit Services:
- Tax Related Services 2.8 2.4
- Other Non-Audit Services* 4.8 4.4
* Other non-audit services primarily relates to consultancy services and project management.
All services were procured competitively in accordance with TNB’s Procurement & Supply Chain Policy and Procedures and External Auditors Policy. Non-audit services can be offered by the External Auditors of the Group if there are clear efficiencies and value added benefits to the Group.
Based on the External Auditors Assessment Results for the Financial Year under review, the Board/BAC are satisfied with the quality of service, adequacy of resources provided, communication, interaction skills and independence, objectivity and professionalism demonstrated by the External Auditors in carrying out their functions.
Being satisfied with the External Auditors’ performance, the Board recommends their re-appointment for shareholders’ approval at the AGM.
INSIDER TRADING
The Directors and Top Management of TNB are prohibited from trading in securities or any kind of price-sensitive information and knowledge which have not been publicly announced in accordance with the MMLR and relevant provisions of the Capital Markets & Services Act 2007. Where applicable, notices on the closed period for trading in TNB’s securities are circulated to Directors and Top Management who are deemed to be privy to any price-sensitive information and knowledge, in advance of the closed period.
PROMOTING SUSTAINABILITY
The Board recognises that the Company’s stakeholders are increasingly interested in understanding its approach and performance in embedding sustainability in the organisation.
For this Financial Year, TNB has published a Sustainability Statement which discloses TNB’s efforts and initiatives in managing its material economic, environmental and social risks and opportunities. The reporting is guided by the Global Reporting Initiative (GRI) standard. The Sustainability Statement is on pages 66 to 96 of this Integrated Annual Report.

About TNB
Our Business
Business Context
Performance Review
Sustainability Statement
The Strength of Our Governance
Financial Statements
Additional InformationIntegrated Annual Report 2018
Tenaga Nasional Berhad
p.143 Relations with Shareholders
RESPONSIBILITY STATEMENT IN RESPECT OF THE FINANCIAL YEAR UNDER REVIEW
The Board is fully accountable for ensuring the Audited Financial Statements are prepared in accordance with the Companies Act 2016 and the applicable approved accounting standards set out by the Malaysian Accounting Standards Board so as to present a true and fair view of the Group’s state of affairs and of the profit or loss and cash flow as at the end of the accounting period.
In preparing the Audited Financial Statements, the Directors are satisfied that the applicable approved accounting standards in Malaysia have been complied with and reasonable and prudent judgements and estimates have been made. The Audited Financial Statements are also prepared on a going concern basis as the Board has a reasonable expectation, after having made enquiries that the Group has adequate resources to continue its operational existence for the foreseeable future.
ADDITIONAL COMPLIANCE STATEMENT
(1) Utilisation of Proceeds Raised from Any Corporate Proposal Utilisation of Proceeds Raised from Corporate Proposals by the
Company during the Financial Year under review:
A Multicurrency Sukuk Issuance Programme of USD2.5 billion (Or its Equivalent In Other Currencies) by TNB Global Ventures Capital Berhad with TNB as the Obligor
First Issuance on 10 October 2016 USD750 million
Total utilisation as at 31 December 2018 USD596 million
Balance of proceeds as at 31 December 2018 USD154 million
Establishment of Sukuk Wakalah Programme of up to RM5.0 billion by TNB
First issuance on 3 August 2017 RM2.0 billionSecond issuance on 29 August 2018 RM3.0 billionBalance of proceeds as at 31 December 2018 Nil
(2) Material Contracts There were no material contracts entered into by the Company
and its Subsidiaries involving the interest of the Directors or Major Shareholders, either still subsisting at the end of the Financial Year or, if not then subsisting, entered into since the end of the previous Financial Year.
(3) Related Party Transactions The Group has established appropriate procedures to ensure it
complies with the MMLR with regards to related party transactions. All related party transactions are reviewed by the Group Internal Audit Department, following which a Group-Wide Report is submitted to the BAC on a quarterly basis for monitoring purposes.
The Group did not seek any mandate of its shareholders pertaining to related party transactions during the Financial Year under review.
STATEMENT ON COMPLIANCE WITH THE REQUIREMENTS OF BURSA MALAYSIA IN RELATION TO APPLICATION OF PRINCIPLES AND ADOPTION OF BEST PRACTICES LAID DOWN IN THE MALAYSIAN CODE ON CORPORATE GOVERNANCE 2017
(Pursuant to paragraph 15.25 of the MMLR)
The Board has reviewed, deliberated and approved this Statement. The Board is pleased to report to its shareholders that to the best of its knowledge, the Company has complied with and shall remain committed to attaining the highest possible standards of corporate governance through the continuous adoption of the principles and best practices of the MCCG 2017 and all other applicable laws.
Signed on behalf of the Board of Directors in accordance with their resolution dated 28 February 2019.
NORAINI BINTI CHE DANSenior Independent Non-Executive Director
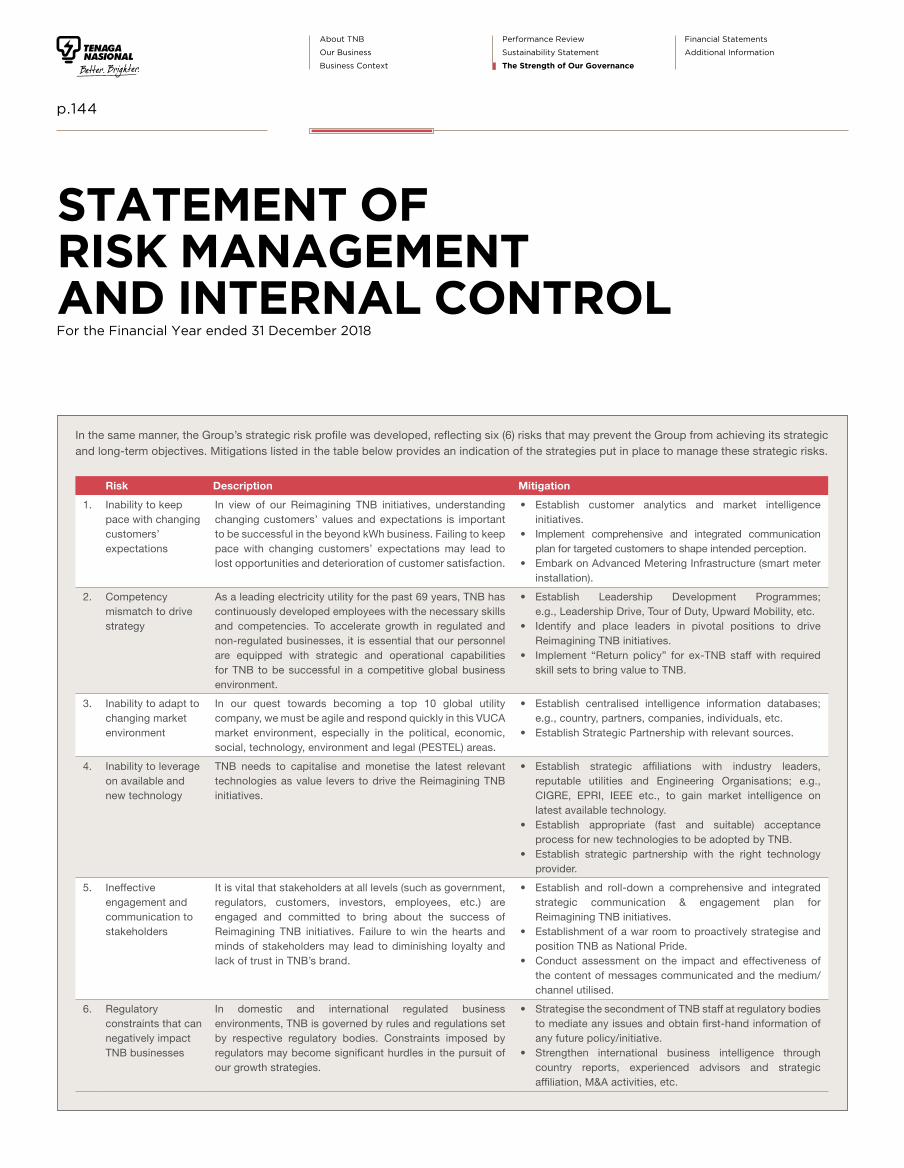
About TNB
Our Business
Business Context
Performance Review
Sustainability Statement
The Strength of Our Governance
Financial Statements
Additional Information
p.144
STATEMENT OFRISK MANAGEMENT AND INTERNAL CONTROLFor the Financial Year ended 31 December 2018
In the same manner, the Group’s strategic risk profile was developed, reflecting six (6) risks that may prevent the Group from achieving its strategic and long-term objectives. Mitigations listed in the table below provides an indication of the strategies put in place to manage these strategic risks.
Risk Description Mitigation
1. Inability to keep pace with changing customers’ expectations
In view of our Reimagining TNB initiatives, understanding changing customers’ values and expectations is important to be successful in the beyond kWh business. Failing to keep pace with changing customers’ expectations may lead to lost opportunities and deterioration of customer satisfaction.
• Establish customer analytics and market intelligence initiatives.
• Implement comprehensive and integrated communication plan for targeted customers to shape intended perception.
• Embark on Advanced Metering Infrastructure (smart meter installation).
2. Competency mismatch to drive strategy
As a leading electricity utility for the past 69 years, TNB has continuously developed employees with the necessary skills and competencies. To accelerate growth in regulated and non-regulated businesses, it is essential that our personnel are equipped with strategic and operational capabilities for TNB to be successful in a competitive global business environment.
• Establish Leadership Development Programmes; e.g., Leadership Drive, Tour of Duty, Upward Mobility, etc.
• Identify and place leaders in pivotal positions to drive Reimagining TNB initiatives.
• Implement “Return policy” for ex-TNB staff with required skill sets to bring value to TNB.
3. Inability to adapt to changing market environment
In our quest towards becoming a top 10 global utility company, we must be agile and respond quickly in this VUCA market environment, especially in the political, economic, social, technology, environment and legal (PESTEL) areas.
• Establish centralised intelligence information databases; e.g., country, partners, companies, individuals, etc.
• Establish Strategic Partnership with relevant sources.
4. Inability to leverage on available and new technology
TNB needs to capitalise and monetise the latest relevant technologies as value levers to drive the Reimagining TNB initiatives.
• Establish strategic affiliations with industry leaders, reputable utilities and Engineering Organisations; e.g., CIGRE, EPRI, IEEE etc., to gain market intelligence on latest available technology.
• Establish appropriate (fast and suitable) acceptance process for new technologies to be adopted by TNB.
• Establish strategic partnership with the right technology provider.
5. Ineffective engagement and communication to stakeholders
It is vital that stakeholders at all levels (such as government, regulators, customers, investors, employees, etc.) are engaged and committed to bring about the success of Reimagining TNB initiatives. Failure to win the hearts and minds of stakeholders may lead to diminishing loyalty and lack of trust in TNB’s brand.
• Establish and roll-down a comprehensive and integrated strategic communication & engagement plan for Reimagining TNB initiatives.
• Establishment of a war room to proactively strategise and position TNB as National Pride.
• Conduct assessment on the impact and effectiveness of the content of messages communicated and the medium/channel utilised.
6. Regulatory constraints that can negatively impact TNB businesses
In domestic and international regulated business environments, TNB is governed by rules and regulations set by respective regulatory bodies. Constraints imposed by regulators may become significant hurdles in the pursuit of our growth strategies.
• Strategise the secondment of TNB staff at regulatory bodies to mediate any issues and obtain first-hand information of any future policy/initiative.
• Strengthen international business intelligence through country reports, experienced advisors and strategic affiliation, M&A activities, etc.
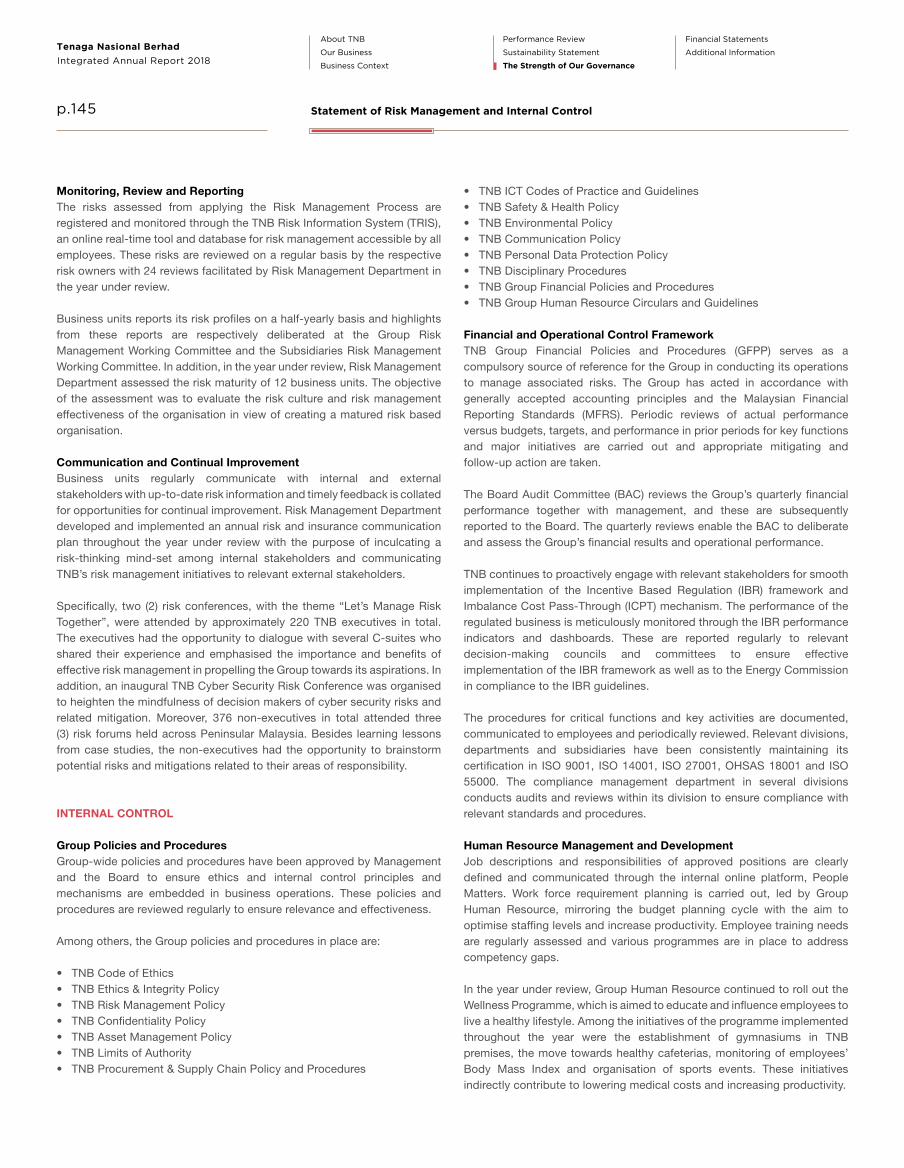
About TNB
Our Business
Business Context
Performance Review
Sustainability Statement
The Strength of Our Governance
Financial Statements
Additional InformationIntegrated Annual Report 2018
Tenaga Nasional Berhad
p.145 Statement of Risk Management and Internal Control
Monitoring, Review and ReportingThe risks assessed from applying the Risk Management Process are registered and monitored through the TNB Risk Information System (TRIS), an online real-time tool and database for risk management accessible by all employees. These risks are reviewed on a regular basis by the respective risk owners with 24 reviews facilitated by Risk Management Department in the year under review.
Business units reports its risk profiles on a half-yearly basis and highlights from these reports are respectively deliberated at the Group Risk Management Working Committee and the Subsidiaries Risk Management Working Committee. In addition, in the year under review, Risk Management Department assessed the risk maturity of 12 business units. The objective of the assessment was to evaluate the risk culture and risk management effectiveness of the organisation in view of creating a matured risk based organisation.
Communication and Continual ImprovementBusiness units regularly communicate with internal and external stakeholders with up-to-date risk information and timely feedback is collated for opportunities for continual improvement. Risk Management Department developed and implemented an annual risk and insurance communication plan throughout the year under review with the purpose of inculcating a risk-thinking mind-set among internal stakeholders and communicating TNB’s risk management initiatives to relevant external stakeholders.
Specifically, two (2) risk conferences, with the theme “Let’s Manage Risk Together”, were attended by approximately 220 TNB executives in total. The executives had the opportunity to dialogue with several C-suites who shared their experience and emphasised the importance and benefits of effective risk management in propelling the Group towards its aspirations. In addition, an inaugural TNB Cyber Security Risk Conference was organised to heighten the mindfulness of decision makers of cyber security risks and related mitigation. Moreover, 376 non-executives in total attended three (3) risk forums held across Peninsular Malaysia. Besides learning lessons from case studies, the non-executives had the opportunity to brainstorm potential risks and mitigations related to their areas of responsibility.
INTERNAL CONTROL
Group Policies and ProceduresGroup-wide policies and procedures have been approved by Management and the Board to ensure ethics and internal control principles and mechanisms are embedded in business operations. These policies and procedures are reviewed regularly to ensure relevance and effectiveness.
Among others, the Group policies and procedures in place are:
• TNB Code of Ethics• TNB Ethics & Integrity Policy• TNB Risk Management Policy• TNB Confidentiality Policy• TNB Asset Management Policy• TNB Limits of Authority• TNB Procurement & Supply Chain Policy and Procedures
• TNB ICT Codes of Practice and Guidelines • TNB Safety & Health Policy• TNB Environmental Policy• TNB Communication Policy• TNB Personal Data Protection Policy • TNB Disciplinary Procedures• TNB Group Financial Policies and Procedures• TNB Group Human Resource Circulars and Guidelines
Financial and Operational Control FrameworkTNB Group Financial Policies and Procedures (GFPP) serves as a compulsory source of reference for the Group in conducting its operations to manage associated risks. The Group has acted in accordance with generally accepted accounting principles and the Malaysian Financial Reporting Standards (MFRS). Periodic reviews of actual performance versus budgets, targets, and performance in prior periods for key functions and major initiatives are carried out and appropriate mitigating and follow-up action are taken.
The Board Audit Committee (BAC) reviews the Group’s quarterly financial performance together with management, and these are subsequently reported to the Board. The quarterly reviews enable the BAC to deliberate and assess the Group’s financial results and operational performance.
TNB continues to proactively engage with relevant stakeholders for smooth implementation of the Incentive Based Regulation (IBR) framework and Imbalance Cost Pass-Through (ICPT) mechanism. The performance of the regulated business is meticulously monitored through the IBR performance indicators and dashboards. These are reported regularly to relevant decision-making councils and committees to ensure effective implementation of the IBR framework as well as to the Energy Commission in compliance to the IBR guidelines.
The procedures for critical functions and key activities are documented, communicated to employees and periodically reviewed. Relevant divisions, departments and subsidiaries have been consistently maintaining its certification in ISO 9001, ISO 14001, ISO 27001, OHSAS 18001 and ISO 55000. The compliance management department in several divisions conducts audits and reviews within its division to ensure compliance with relevant standards and procedures.
Human Resource Management and DevelopmentJob descriptions and responsibilities of approved positions are clearly defined and communicated through the internal online platform, People Matters. Work force requirement planning is carried out, led by Group Human Resource, mirroring the budget planning cycle with the aim to optimise staffing levels and increase productivity. Employee training needs are regularly assessed and various programmes are in place to address competency gaps.
In the year under review, Group Human Resource continued to roll out the Wellness Programme, which is aimed to educate and influence employees to live a healthy lifestyle. Among the initiatives of the programme implemented throughout the year were the establishment of gymnasiums in TNB premises, the move towards healthy cafeterias, monitoring of employees’ Body Mass Index and organisation of sports events. These initiatives indirectly contribute to lowering medical costs and increasing productivity.

About TNB
Our Business
Business Context
Performance Review
Sustainability Statement
The Strength of Our Governance
Financial Statements
Additional Information
p.146
Tenaga Safety CultureIn the year under review, the Tenaga Safety Culture programme was implemented to inculcate four (4) core behaviours among employees, namely ‘Assess’, ‘Comply’, ‘Intervene’ and ‘Actively Caring’. The aim of the programme is promote safety as part of the everyday working culture, transforming it from a mere compliance activity. The programme was launched Group-wide by TNB President/Chief Executive Officer alongside the Chairman of the National Institute of Occupational Safety and Health (NIOSH). In addition, Spiritual Hour has been embedded in the programme to align good safety practices with religious teachings as an additional emphasis on the value of safety as a lifestyle.
Management Information SystemsLeveraging on information and communication technology is vital in promoting effective and efficient business operations as well as timely and accurate communication with internal and external stakeholders. Key information systems utilised by the Group for that purpose are:
• Enterprise Resource Management System (ERMS)• Enterprise Human Resources Management System (EHRMS)• Corporate Geospatial Information System (CGIS)• Supervisory Control and Data Acquisition System (SCADA)• TNB Outage Management Systems (TOMS)• Billing Customer Relation Management (BCRM)• Employee Self Service (ESS)
Super User Privilege Management and Governance, Risk and Compliance systems have been implemented to control and govern access to core systems and servers. This is to ensure that access to critical information systems and confidential information is adequately monitored and controlled. Annual disaster recovery tests are carried out at the data centres and ICT security assessments are regularly carried out on IT systems at the business units. In addition, various enhancements are implemented to strengthen cyber security for Information Technology and Operational Technology Systems.
Personal Data Protection TNB is committed to safeguard customers' privacy rights and personal data. TNB was an active contributor in the development of The Personal Data Protection Code of Practice for The Utilities Sector (Electricity), which serves as a guide for the processing and handling of customers’ personal data. The code of practice is aligned to the Personal Data Protection Act 2010 (Section 23) (PDPA), which protects personal information of an individual being processed for commercial transaction purposes. The Legal Services Department is committed to consistently educate and communicate the requirements of the PDPA and the Code of Practice across the Group to heighten awareness and compliance as well as enhance controls.
Customer FeedbackCustomer feedback is regularly collated and analysed with appropriate follow-up action. The TNB One Stop Engagement Centre offers a single point of contact to respond to customer enquiries and feedback on billing and account related matters. A variety of channels utilising online infrastructure and social media is made available for customers to submit queries or report problems.
Business Continuity ManagementThe objective of the TNB Business Continuity Management (BCM) Framework is to provide a structured approach in managing business continuity in the Group. It enables a prompt, coordinated and effective response to a crisis and maintaining continuity of essential activities while protecting human life, assets, brand and reputation. This framework is the focal point of reference for business units in formulating and implementing its BCM strategy and practices that are tailored to its business objectives and critical functions. The effectiveness of the framework is tested through drills and in the year under review, two (2) communication drills and one (1) full-scaled drill were carried out at the corporate level. Drills to test preparedness of business units are carried out according to plan and improvements identified in post-mortem reports are implemented to improve promptness of response.
CONCLUSION
The Board has obtained assurances from the President/Chief Executive Officer, Chief Financial Officer and Chief Internal Auditor that the Group’s Risk Management and Internal Control System is operating adequately and effectively, in all material aspects. Where weaknesses are identified, rectification steps have been put in place.
The Board is of the view that the Risk Management and Internal Control System in place for the year under review and up to the date of approval of this statement for inclusion into the annual report, is adequate and effective to safeguard shareholders’ investment, the interests of customers, regulators and employees, and the Group’s assets.
Statement of Risk Management and Internal Control
REVIEW OF THE STATEMENT BY EXTERNAL AUDITORAs required by Paragraph 15.23 of the Main Market Listing Requirements of Bursa Malaysia Securities Berhad, the external auditors have reviewed this Statement on Risk Management and Internal Control. Their limited assurance engagement was performed in accordance with Malaysia Approved Standard on Assurance Engagements, ISAE 3000 (Revised) Assurance Engagements Other than Audits or Reviews of Historical Financial Information and AAPG 3, Guidance for Auditors on Engagements to Report on the Statement on Risk Management and Internal Control Included in the Annual Report.
This statement is made in accordance with the resolution of the Board of Directors dated 28 February 2019.

148 Directors’ Report
153 Consolidated Statement of Profit or Loss
154 Consolidated Statement of Comprehensive Income
155 Consolidated Statement of Financial Position
157 Consolidated Statement of Changes in Equity
160 Consolidated Statement of Cash Flows
163 Notes to the Financial Statements
FINANCIAL STATEMENTS
308 Statement by Directors
308 Statutory Declaration
309 Independent Auditors’ Report
Note 1: General Information
Note 2: Basis of Preparation
Note 3: Summary of Significant Accounting Policies
Note 4: Critical Accounting Estimates and Judgements
Note 5: Revenue
Note 6: Operating Expenses
Note 7: Staff Cost
Note 8: Other Operating Income
Note 9: Foreign Exchange (Loss)/Gain
Note 10: Finance Income/Cost and Fair Value
Changes of Financial Instruments
Note 11: Taxation and Zakat
Note 12: Earnings Per Share (‘EPS’)
Note 13: Dividends
Note 14: Property, Plant and Equipment (‘PPE’)
Note 15: Subsidiaries
Note 16: Joint Arrangements
Note 17: Associates
Note 18: Goodwill on Consolidation
Note 19: Investment in Unquoted Debt Security
Note 20: Deferred Taxation
Note 21: Long Term Receivables
Note 22: Amount Due From/(To) Subsidiaries
Note 23: Finance Leases
Note 24: Prepaid Operating Leases
Note 25: Financial Assets at FVOCI
(Available-for-Sale Financial Assets)
Note 26: Contract Balances
Note 27: Financial Assets at FVTPL
Note 28: Derivative Financial Instruments
Note 29: Inventories
Note 30: Receivables, Deposits and Prepayments
Note 31: Deposits, Bank and Cash Balances
Note 32: Payables
Note 33: Employee Benefits
Note 34: Consumer Deposits
Note 35: Short Term Borrowings
Note 36: Borrowings
Note 37: Government Development Grants
Note 38: Other Liabilities
Note 39: Share Capital
Note 40: Other Reserves
Note 41: Commitments
Note 42: Contingent Liabilities
Note 43: Significant Related Party Disclosures
Note 44: Segmental Reporting
Note 45: Financial Instruments
Note 46: Capital Risk Management
Note 47: Restatement and Effects of Changes in
Accounting Policies
Note 48: Significant Acquisition during
the Financial Year
Note 49: Events after Reporting Period

About TNB
Our Business
Business Context
Performance Review
Sustainability Statement
The Strength of Our Governance
Financial Statements
Additional Information
p.148
The Directors hereby submit their report and the audited financial statements of the Group and of the Company for the financial year ended 31 December 2018.
PRINCIPAL ACTIVITIES
The Group and Company are primarily involved in the business of the generation, transmission, distribution and sales of electricity and those tabulated in Note 15 to the financial statements, which also includes the details of the subsidiaries of the Group.
There have been no significant changes in these activities during the financial year.
FINANCIAL RESULTS
GroupRM’million
CompanyRM’million
Profit for the financial year attributable to:
- Owners of the Company 3,723.7 3,218.6
- Non-controlling interests 21.3 0
Profit for the financial year 3,745.0 3,218.6
DIVIDENDS
The dividends paid or declared since the previous financial period ended 31 December 2017 were as follows:
RM’million
In respect of the financial period ended (‘FPE’) 31 December 2017:
Final single tier dividend of 21.41 sen per ordinary share, paid on 19 April 2018 1,213.1
In respect of the financial year ended 31 December 2018:
Interim single tier dividend of 30.27 sen per ordinary share, paid on 11 October 2018 1,718.8
The Directors have proposed a final single tier dividend of 23.0 sen per share, on 5,686,888,771 ordinary shares in respect of the financial year ended 31 December 2018 amounting to a total of RM1,308.0 million. The books closure and payment dates will be announced in due course.
RESERVES AND PROVISIONS
All material transfers to or from reserves and provisions during the financial year are shown in the financial statements.
DIRECTORS’REPORT

About TNB
Our Business
Business Context
Performance Review
Sustainability Statement
The Strength of Our Governance
Financial Statements
Additional InformationIntegrated Annual Report 2018
Tenaga Nasional Berhad
p.149
ISSUE OF SHARES
During the financial year, the paid-up share capital of the Company increased due to the vesting of Long Term Incentive Plan (‘LTIP’) granted to eligible employees, details of which are disclosed in Note 7 to the financial statements. The new ordinary shares rank pari passu in all respects with the existing ordinary shares of the Company.
TENAGA NASIONAL BERHAD’S LONG TERM INCENTIVE PLAN (‘LTIP’)
The Company implemented a LTIP on 30 April 2015 for a period of 10 years. The LTIP is governed by the by-laws, which were approved by the shareholders at an Extraordinary General Meeting on 18 December 2014.
The main features and details of the number of grants over the shares of the Company are set out in Note 7 to the financial statements.
The Company has been granted an exemption by the Companies Commission of Malaysia via letter dated 18 February 2019 from having to disclose in this report the names of the persons to whom LTIP have been granted under the scheme and details of their holdings pursuant to Section 255(1) Paragraph 5, Part 1, Fifth Schedule of the Companies Act 2016 except for information on employees who were granted the offering of up to 133,200 and more ordinary shares under the LTIP scheme.
The employees of the Company who were granted the offering of up to 133,200 and more ordinary shares under the LTIP scheme are as follows:
Number ofordinary
sharesgranted
under PS*
Number ofordinary
sharesgranted
under RS** Total
Datuk Seri Ir. Azman bin Mohd 522,700 235,700 758,400
Datuk Fazlur Rahman bin Zainuddin 130,000 78,200 208,200
Datuk Wira Roslan bin Ab Rahman 129,600 77,900 207,500
Dato’ Muhammad Razif bin Abdul Rahman 125,200 75,200 200,400
Dato’ Nor Azman bin Mufti @ Jaafar 124,600 74,800 199,400
Datuk Ir. Baharin bin Din 121,400 72,900 194,300
Datuk Zainudin bin Ibrahim 114,500 68,600 183,100
Dato’ Ir. Ho Peng Choong 103,100 66,800 169,900
Fazil bin Ibrahim 87,900 56,600 144,500
Nazmi bin Othman 70,100 63,100 133,200
* PS - Performance Share Grant** RS - Restricted Share Grant
None of the subsidiaries’ employees were granted offering representing 133,200 or more ordinary shares under the LTIP scheme.
Directors’ Report

About TNB
Our Business
Business Context
Performance Review
Sustainability Statement
The Strength of Our Governance
Financial Statements
Additional Information
p.150
DIRECTORS
The Directors who have held office during the financial year and during the period from the end of the financial year to the date of the report are:Tan Sri Leo MoggieDatuk Seri Ir. Azman bin MohdDatuk Ahmad Badri bin Mohd Zahir Appointed w.e.f. 1 November 2018Amran Hafiz bin AffifudinGee Siew YoongNoraini binti Che DanJuniwati Rahmat binti HussinGopala Krishnan K. Sundaram Appointed w.e.f. 4 July 2018Ong Ai Lin Appointed w.e.f. 1 August 2018Dato’ Roslina binti Zainal Appointed w.e.f. 15 March 2019Tan Sri Dato’ Seri Chor Chee Heung Resigned w.e.f. 30 June 2018Badrul Ilahan bin Abd Jabbar Resigned w.e.f. 30 June 2018Dato’ Abd Manaf bin Hashim Cessation of office w.e.f. 15 May 2018Datuk Sakthivel Alagappan Cessation of office w.e.f. 15 May 2018Datuk Seri Hashmuddin bin Mohammad Resigned w.e.f. 1 April 2018
The Directors of subsidiaries who have held office during the financial year and during the period from the end of the financial year to the date of the report are set out in the respective subsidiary’s statutory accounts and the said information is deemed incorporated herein by such reference and made part thereof.
DIRECTORS’ BENEFITS
During and at the end of the financial year, no arrangements subsisted to which the Company is a party, being arrangements with the object or objects of enabling Directors of the Company to acquire benefits by means of the acquisition of shares in or debentures of the Company or any other body corporate.
Since the end of the previous financial period, no Director has received or become entitled to receive a benefit (other than benefits shown under Directors’ Remuneration below and in Note 6 to the financial statements) by reason of a contract made by the Company or a related corporation with the Director or with a firm of which the Director is a partner, or with a company in which the Director has a substantial financial interest.
INDEMNITY AND INSURANCE COSTS
TNB Group and Company have their own Directors and Officers Liability Insurance at a premium of RM283,125 to cover the liability of Directors and Officers in discharging their duties for the period of 1 November 2018 until 31 October 2019.
Directors’ Report

About TNB
Our Business
Business Context
Performance Review
Sustainability Statement
The Strength of Our Governance
Financial Statements
Additional InformationIntegrated Annual Report 2018
Tenaga Nasional Berhad
p.151
DIRECTORS’ INTERESTS IN SHARES AND DEBENTURES
According to the Register of Directors’ Shareholdings required to be kept under Section 59 of the Companies Act 2016, none of the Directors who held office at the end of the financial year held any shares or debentures in the Company or its subsidiaries during the financial year except as follows:
Number of ordinary shares
As at1.1.2018 Acquired Disposed
As at31.12.2018
Datuk Seri Ir. Azman bin Mohd 54,600 276,100 0 330,700
Ordinary shares granted pursuant to the Company’s LTIP granted to the Director during the financial year are as follows:
Number of ordinary shares
As at1.1.2018 Granted Vested
As at31.12.2018
Datuk Seri Ir. Azman bin Mohd
Performance Share Grant (‘PS Grant’)
PS Grant 1 109,200 0 *(217,300) 0
PS Grant 2 142,400 0 0 142,400
PS Grant 3 134,200 0 0 134,200
PS Grant 4 0 136,900 0 136,900
Restricted Share Grant (‘RS Grant’)
RS Grant 1 16,100 0 (16,100) 0
RS Grant 2 44,400 0 (22,200) 22,200
RS Grant 3 61,400 0 (20,500) 40,900
RS Grant 4 0 59,200 0 59,200
* The final amount of vesting under PS Grant 1 amounting to 217,300 includes additional 108,100 in accordance with terms and condition approved by the Board Nomination and Remuneration Committee (‘BNRC’) LTIP/BOD.
DIRECTORS’ REMUNERATION
Group Company
31.12.2018RM
31.12.2017RM
31.12.2018RM
31.12.2017RM
Directors’ fees 2,390,753 1,038,280 2,057,419 911,613
Directors’ other emoluments* 2,586,710 2,216,893 2,468,410 2,199,093
4,977,463 3,255,173 4,525,829 3,110,706
* In respect of the Directors or past Directors of the Company, there were benefits receivable by the Directors from the Company and its subsidiaries as Directors’ other emoluments for their services. The estimated monetary value of benefits received by the Directors was RM512,806 (FPE 31.12.2017: RM205,423) for the Group and Company.
Directors’ Report

About TNB
Our Business
Business Context
Performance Review
Sustainability Statement
The Strength of Our Governance
Financial Statements
Additional Information
p.152
STATUTORY INFORMATION ON THE FINANCIAL STATEMENTS
(a) Before the financial statements of the Group and of the Company were prepared, the Directors took reasonable steps:(i) to ascertain that proper action had been taken in relation to the writing off of bad debts and the making of provision for doubtful debts
and satisfied themselves that all known bad debts had been written off and that adequate provision had been made for doubtful debts; and
(ii) to ensure that any current assets, which were unlikely to be realised in the ordinary course of business, including the values of current assets as shown in the accounting records of the Group and of the Company had been written down to an amount which the current assets might be expected so to realise.
(b) At the date of this report, the Directors are not aware of any circumstances:(i) which would render the amount written off for bad debts or the amount of the provision for doubtful debts inadequate to any substantial
extent; or(ii) which would render the values attributed to current assets in the financial statements of the Group and of the Company misleading; or(iii) which have arisen which would render adherence to the existing method of valuation of assets or liabilities of the Group and of the
Company misleading or inappropriate.
(c) At the date of this report:(i) there are no charges on the assets of the Group and of the Company which have arisen since the end of the financial year which secures
the liabilities of any other person; and(ii) there are no contingent liabilities in the Group and in the Company which have arisen since the end of the financial year.
(d) No contingent or other liability of any company in the Group has become enforceable or is likely to become enforceable within the period of twelve months after the end of the financial year which, in the opinion of the Directors, will or may affect the ability of the Group and its subsidiaries to meet their obligations when they fall due.
(e) At the date of this report, the Directors are not aware of any circumstances not otherwise dealt with in this report or the financial statements of the Group and of the Company which would render any amount stated in the respective financial statements misleading.
(f) In the opinion of the Directors:(i) the results of the operations of the Group and of the Company during the financial year were not substantially affected by any item,
transaction or event of a material and unusual nature, except as disclosed in Notes 6, 15 and 17 to the financial statements; and(ii) there has not arisen in the interval between the end of the financial year and the date of this report any item, transaction or event of a
material and unusual nature likely to affect substantially the results of the operations of the Group and of the Company for the financial year in which this report is made.
AUDITORS
The auditors, PricewaterhouseCoopers PLT (LLP0014401-LCA & AF 1146), have expressed their willingness to accept re-appointment as auditors.
Details of the auditors’ remuneration are set out in Note 6 to the financial statements.
This report was approved by the Board of Directors on 19 March 2019. Signed on behalf of the Board of Directors:
TAN SRI LEO MOGGIE DATUK SERI IR. AZMAN BIN MOHDCHAIRMAN PRESIDENT/CHIEF EXECUTIVE OFFICER
Directors’ Report
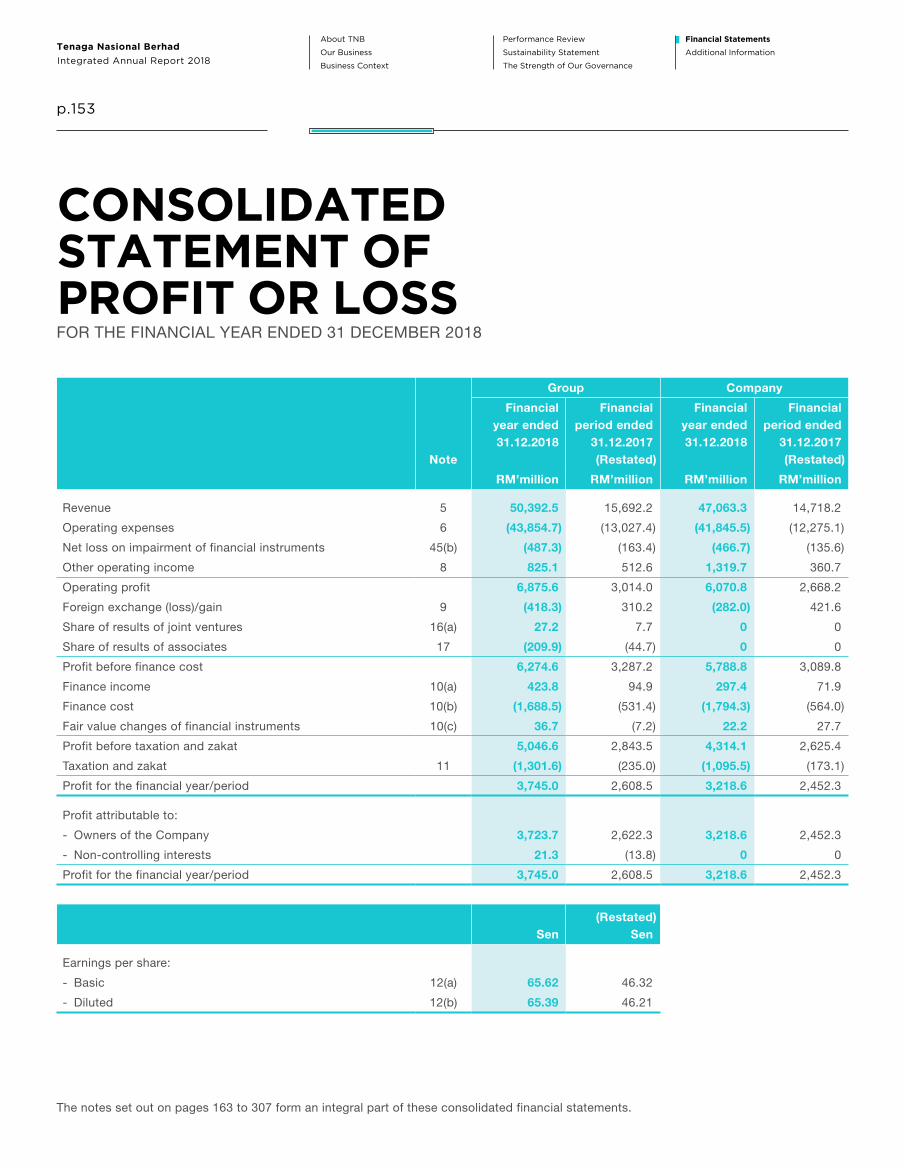
About TNB
Our Business
Business Context
Performance Review
Sustainability Statement
The Strength of Our Governance
Financial Statements
Additional InformationIntegrated Annual Report 2018
Tenaga Nasional Berhad
p.153
Group Company
Note
Financialyear ended31.12.2018
Financialperiod ended
31.12.2017(Restated)
Financialyear ended31.12.2018
Financialperiod ended
31.12.2017(Restated)
RM’million RM’million RM’million RM’million
Revenue 5 50,392.5 15,692.2 47,063.3 14,718.2
Operating expenses 6 (43,854.7) (13,027.4) (41,845.5) (12,275.1)
Net loss on impairment of financial instruments 45(b) (487.3) (163.4) (466.7) (135.6)
Other operating income 8 825.1 512.6 1,319.7 360.7
Operating profit 6,875.6 3,014.0 6,070.8 2,668.2
Foreign exchange (loss)/gain 9 (418.3) 310.2 (282.0) 421.6
Share of results of joint ventures 16(a) 27.2 7.7 0 0
Share of results of associates 17 (209.9) (44.7) 0 0
Profit before finance cost 6,274.6 3,287.2 5,788.8 3,089.8
Finance income 10(a) 423.8 94.9 297.4 71.9
Finance cost 10(b) (1,688.5) (531.4) (1,794.3) (564.0)
Fair value changes of financial instruments 10(c) 36.7 (7.2) 22.2 27.7
Profit before taxation and zakat 5,046.6 2,843.5 4,314.1 2,625.4
Taxation and zakat 11 (1,301.6) (235.0) (1,095.5) (173.1)
Profit for the financial year/period 3,745.0 2,608.5 3,218.6 2,452.3
Profit attributable to:
- Owners of the Company 3,723.7 2,622.3 3,218.6 2,452.3
- Non-controlling interests 21.3 (13.8) 0 0
Profit for the financial year/period 3,745.0 2,608.5 3,218.6 2,452.3
Sen(Restated)
Sen
Earnings per share:
- Basic 12(a) 65.62 46.32
- Diluted 12(b) 65.39 46.21
The notes set out on pages 163 to 307 form an integral part of these consolidated financial statements.
CONSOLIDATEDSTATEMENT OFPROFIT OR LOSSFOR THE FINANCIAL YEAR ENDED 31 DECEMBER 2018

About TNB
Our Business
Business Context
Performance Review
Sustainability Statement
The Strength of Our Governance
Financial Statements
Additional Information
p.154
Group Company
Note
Financialyear ended31.12.2018
Financialperiod ended
31.12.2017(Restated)
Financialyear ended31.12.2018
Financialperiod ended
31.12.2017(Restated)
RM’million RM’million RM’million RM’million
Profit for the financial year/period 3,745.0 2,608.5 3,218.6 2,452.3
Other comprehensive (expense)/income
Items that will not be reclassified subsequently to profit or loss:
Defined benefit plan actuarial loss (204.3) (107.6) (50.7) (99.8)
Items that may be reclassified subsequently to profit or loss:
Foreign currency translation differences (13.1) (219.8) 0 0
Available-for-sale (‘AFS’) financial assets 0 (2.6) 0 (2.6)
Financial assets at fair value through other comprehensive income (‘FVOCI’) 7.1 0 7.1 0
Share of other comprehensive income (‘OCI’) of associates accounted for using the equity method 17 74.3 94.2 0 0
Total other comprehensive expense (136.0) (235.8) (43.6) (102.4)
Total comprehensive income for the financial year/period 3,609.0 2,372.7 3,175.0 2,349.9
Attributable to:
- Owners of the Company 3,587.7 2,386.5 3,175.0 2,349.9
- Non-controlling interests 21.3 (13.8) 0 0
Total comprehensive income 3,609.0 2,372.7 3,175.0 2,349.9
The notes set out on pages 163 to 307 form an integral part of these consolidated financial statements.
CONSOLIDATEDSTATEMENT OFCOMPREHENSIVE INCOMEFOR THE FINANCIAL YEAR ENDED 31 DECEMBER 2018

About TNB
Our Business
Business Context
Performance Review
Sustainability Statement
The Strength of Our Governance
Financial Statements
Additional InformationIntegrated Annual Report 2018
Tenaga Nasional Berhad
p.155
Group Company
Note31.12.2018 31.12.2017
(Restated)1.9.2017
(Restated)31.12.2018 31.12.2017
(Restated)1.9.2017
(Restated)RM’million RM’million RM’million RM’million RM’million RM’million
NON-CURRENT ASSETS
Property, plant and equipment 14 111,445.5 104,807.6 103,083.7 83,921.1 81,792.6 75,841.9Subsidiaries 15 0 0 0 8,603.8 9,799.2 8,820.2Joint ventures 16(a) 166.0 153.1 152.3 0 0 0Associates 17 1,543.7 2,799.2 2,937.8 59.9 70.3 70.3Goodwill on consolidation 18 240.7 211.0 211.0 0 0 0Investment in unquoted debt security 19 326.7 318.5 275.7 8.7 0 0Tax recoverable 1,765.1 1,765.1 1,765.1 1,765.1 1,765.1 1,765.1Deferred tax assets 20 87.7 68.3 77.0 0 0 0Long term receivables 21 1,245.5 829.4 549.7 260.5 197.0 200.6Amounts due from subsidiaries 22(a) 0 0 0 1,052.0 1,213.4 2,209.8Finance lease receivables 23(a) 12.4 13.4 13.8 0 0 0Prepaid operating leases 24(a) 5,944.1 5,505.2 5,353.7 5,934.9 5,417.0 5,241.2AFS financial assets 25 0 69.3 71.9 0 68.6 71.2Financial assets at FVOCI 25 76.4 0 0 75.7 0 0Contract cost assets 26(a) 0.5 0.1 0 0 0 0Financial assets at fair value through
profit or loss (‘FVTPL’) 27 90.9 0 0 90.9 0 0Derivative financial instruments 28(c) 0.2 0 0 0 0 0
122,945.4 116,540.2 114,491.7 101,772.6 100,323.2 94,220.3
CURRENT ASSETS
Inventories 29 1,295.9 885.0 828.7 294.0 279.2 261.9Receivables, deposits and prepayments 30 6,803.4 7,275.5 5,734.6 4,769.8 3,335.2 3,067.3Contract assets 26(b) 3,361.8 3,059.3 3,222.3 3,205.0 2,925.7 3,051.8Tax recoverable 422.6 104.7 83.8 247.1 0 0Finance lease receivables 23(a) 1.0 0.8 0.7 0 0 0Prepaid operating leases 24(a) 164.8 146.2 139.1 156.5 137.6 129.0Amounts due from subsidiaries 22(b) 0 0 0 3,702.9 4,186.9 3,097.3Amounts due from joint ventures 10.8 1.1 0.6 0 0 0Amounts due from associates 364.9 332.0 226.3 7.5 9.2 1.0Derivative financial instruments 28(a) 1.2 0 1.2 0 0 0Financial assets at FVTPL 27 9,652.4 10,490.2 12,221.9 5,133.7 3,850.5 6,097.9Deposits, bank and cash balances 31 8,670.8 5,415.0 5,056.2 5,852.4 3,001.3 3,335.4
30,749.6 27,709.8 27,515.4 23,368.9 17,725.6 19,041.6
CONSOLIDATEDSTATEMENT OFFINANCIAL POSITIONAS AT 31 DECEMBER 2018

About TNB
Our Business
Business Context
Performance Review
Sustainability Statement
The Strength of Our Governance
Financial Statements
Additional Information
p.156
Group Company
Note31.12.2018 31.12.2017
(Restated)1.9.2017
(Restated)31.12.2018 31.12.2017
(Restated)1.9.2017
(Restated)
RM’million RM’million RM’million RM’million RM’million RM’million
CURRENT LIABILITIES
Payables 32 (9,797.5) (9,036.4) (10,228.8) (6,237.2) (5,819.8) (6,641.1)
Contract liabilities 26(c) (347.4) (287.5) (276.7) (227.9) (223.5) (240.3)
Derivative financial instruments 28(a) (44.0) (47.3) (10.9) 0 (0.2) 0
Finance lease payables 23(b) (357.8) (336.4) (329.6) (1,096.1) (1,122.1) (1,149.1)
Amounts due to subsidiaries 22(b) 0 0 0 (1,459.4) (1,086.3) (1,258.1)
Amounts due to associates (656.3) (691.2) (636.9) (646.4) (683.0) (628.9)
Amount due to joint ventures (0.5) 0 0 0 0 0
Current tax liabilities (96.2) (132.9) (85.2) (72.2) (109.7) (58.7)
Employee benefits 33 (777.0) (748.8) (749.9) (759.6) (737.1) (738.3)
Consumer deposits 34 (5,761.6) (5,209.2) (5,073.4) (5,442.4) (4,910.9) (4,778.2)
Short term borrowings 35 (3,927.8) (1,745.3) (1,808.1) (2,252.2) (227.6) (290.4)
(21,766.1) (18,235.0) (19,199.5) (18,193.4) (14,920.2) (15,783.1)
NET CURRENT ASSETS 8,983.5 9,474.8 8,315.9 5,175.5 2,805.4 3,258.5
TOTAL ASSETS LESS CURRENT LIABILITIES 131,928.9 126,015.0 122,807.6 106,948.1 103,128.6 97,478.8
NON-CURRENT LIABILITIES
Borrowings 36 (43,904.6) (39,698.4) (37,038.4) (19,384.8) (15,120.5) (15,686.6)
Derivative financial instruments 28(b) (11.5) 0 0 0 0 0
Contract liabilities 26(c) (2,902.9) (2,450.0) (2,194.3) (2,354.9) (2,082.6) (1,836.1)
Government development grants 37 (1,005.0) (964.1) (977.8) 0 0 0
Finance lease payables 23(b) (4,516.3) (4,874.1) (4,988.9) (15,572.7) (16,668.8) (10,722.4)
Deferred tax liabilities 20 (8,009.3) (7,645.7) (7,728.4) (6,665.4) (6,289.9) (6,339.9)
Other liabilities 38 (1,396.2) (1,357.4) (1,413.1) (720.0) (642.3) (631.7)
Employee benefits 33 (11,131.2) (11,036.3) (10,887.3) (10,520.2) (10,581.7) (10,442.5)
(72,877.0) (68,026.0) (65,228.2) (55,218.0) (51,385.8) (45,659.2)
TOTAL NET ASSETS 59,051.9 57,989.0 57,579.4 51,730.1 51,742.8 51,819.6
EQUITY
Share capital 39 11,446.1 11,199.6 11,124.9 11,446.1 11,199.6 11,124.9
Other reserves 40 (6,392.7) (6,373.0) (6,128.8) (5,324.0) (5,301.7) (5,190.9)
Retained profits 52,784.4 52,239.2 52,109.9 45,608.0 45,844.9 45,885.6
CAPITAL AND RESERVES ATTRIBUTABLE TO OWNERS OF THE COMPANY 57,837.8 57,065.8 57,106.0 51,730.1 51,742.8 51,819.6
NON-CONTROLLING INTERESTS 1,214.1 923.2 473.4 0 0 0
TOTAL EQUITY 59,051.9 57,989.0 57,579.4 51,730.1 51,742.8 51,819.6
The notes set out on pages 163 to 307 form an integral part of these consolidated financial statements.
Consolidated Statement of Financial Position

About TNB
Our Business
Business Context
Performance Review
Sustainability Statement
The Strength of Our Governance
Financial Statements
Additional InformationIntegrated Annual Report 2018
Tenaga Nasional Berhad
p.157
Attributable to owners of the Company Non-controlling
interestsRM’million
Totalequity
RM’millionNote
Ordinaryshares
RM’million
Otherreserves
RM’million
Retainedprofits
RM’million
Group
At 31 December 2017 (restated) 11,199.6 (6,373.0) 52,239.2 923.2 57,989.0
Effects of adoption of MFRS 9 47 0 0 (189.4) (3.4) (192.8)
At 1 January 2018 (restated) 11,199.6 (6,373.0) 52,049.8 919.8 57,796.2
Profit for the financial year 0 0 3,723.7 21.3 3,745.0
Foreign currency translation reserve 40 0 (13.1) 0 0 (13.1)
Fair value of financial assets at OCI 40 0 7.1 0 0 7.1
Share of OCI of associates accounted for using the equity method 40 0 74.3 0 0 74.3
Employee benefits reserve 40 0 (204.3) 0 0 (204.3)
Total comprehensive (expense)/income for the financial year 0 (136.0) 3,723.7 21.3 3,609.0
LTIP share-based payment expense 7 0 267.8 0 0 267.8
LTIP shares issued 39 246.5 (246.5) 0 0 0
Dividends paid:
- Final dividend for FPE 31.12.2017 13 0 0 (1,213.1) 0 (1,213.1)
- Interim dividend for FY2018 13 0 0 (1,718.8) 0 (1,718.8)
Dividend paid to NCI 0 0 0 (2.0) (2.0)
Exercise of put option on shares of a subsidiary by NCI 0 95.0 (57.2) (37.8) 0
Acquisition of additional equity by NCI 0 0 0 312.8 312.8
Total transactions with owners 246.5 116.3 (2,989.1) 273.0 (2,353.3)
At 31 December 2018 11,446.1 (6,392.7) 52,784.4 1,214.1 59,051.9
CONSOLIDATEDSTATEMENT OFCHANGES IN EQUITYFOR THE FINANCIAL YEAR ENDED 31 DECEMBER 2018

About TNB
Our Business
Business Context
Performance Review
Sustainability Statement
The Strength of Our Governance
Financial Statements
Additional Information
p.158
Note
Attributable to owners of the Company Non-controlling
interestsTotal
equityOrdinary
sharesOther
reservesRetained
profits
RM’million RM’million RM’million RM’million RM’million
Group
At 31 August 2017 (as previously reported) 11,124.9 (6,128.8) 52,115.3 473.4 57,584.8
Effects of adoption of MFRS 15 47 0 0 (5.4) 0 (5.4)
At 1 September 2017 (restated) 11,124.9 (6,128.8) 52,109.9 473.4 57,579.4
Profit for the financial period 0 0 2,622.3 (13.8) 2,608.5
Foreign currency translation reserve 40 0 (219.8) 0 0 (219.8)
Fair value of AFS financial assets 40 0 (2.6) 0 0 (2.6)
Share of OCI of associates accounted for using the equity method 40 0 94.2 0 0 94.2
Employee benefits reserve 40 0 (107.6) 0 0 (107.6)
Total comprehensive (expense)/income for the financial period 0 (235.8) 2,622.3 (13.8) 2,372.7
LTIP share-based payment expense 7 0 66.3 0 0 66.3
LTIP shares issued 39 74.7 (74.7) 0 0 0
Final dividend paid for FY2017 0 0 (2,493.0) 0 (2,493.0)
Subscription of shares in a subsidiary 0 0 0 4.9 4.9
Acquisition of additional equity by NCI 0 0 0 458.7 458.7
Total transactions with owners 74.7 (8.4) (2,493.0) 463.6 (1,963.1)
At 31 December 2017 (restated) 11,199.6 (6,373.0) 52,239.2 923.2 57,989.0
Consolidated Statement of Changes in Equity
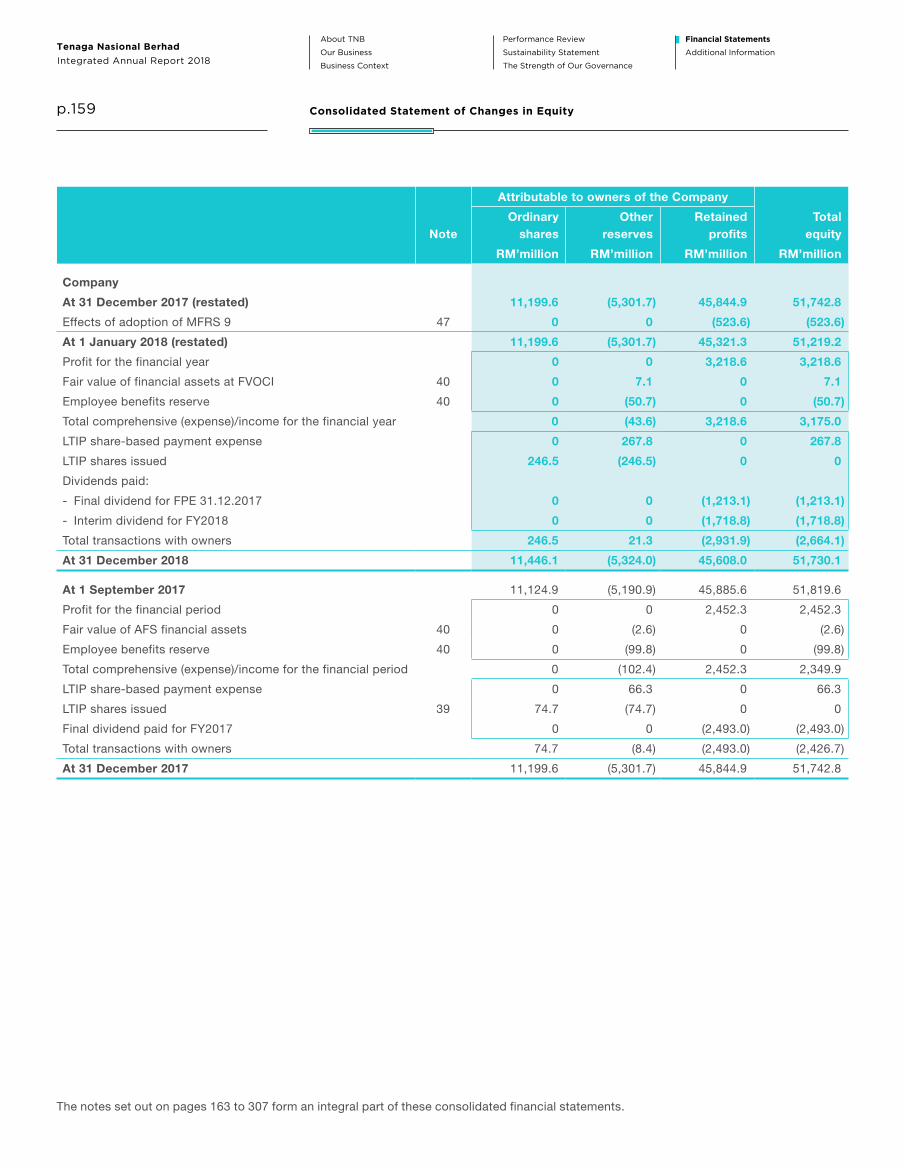
About TNB
Our Business
Business Context
Performance Review
Sustainability Statement
The Strength of Our Governance
Financial Statements
Additional InformationIntegrated Annual Report 2018
Tenaga Nasional Berhad
p.159
Note
Attributable to owners of the Company
Totalequity
Ordinaryshares
Otherreserves
Retainedprofits
RM’million RM’million RM’million RM’million
Company
At 31 December 2017 (restated) 11,199.6 (5,301.7) 45,844.9 51,742.8
Effects of adoption of MFRS 9 47 0 0 (523.6) (523.6)
At 1 January 2018 (restated) 11,199.6 (5,301.7) 45,321.3 51,219.2
Profit for the financial year 0 0 3,218.6 3,218.6
Fair value of financial assets at FVOCI 40 0 7.1 0 7.1
Employee benefits reserve 40 0 (50.7) 0 (50.7)
Total comprehensive (expense)/income for the financial year 0 (43.6) 3,218.6 3,175.0
LTIP share-based payment expense 0 267.8 0 267.8
LTIP shares issued 246.5 (246.5) 0 0
Dividends paid:
- Final dividend for FPE 31.12.2017 0 0 (1,213.1) (1,213.1)
- Interim dividend for FY2018 0 0 (1,718.8) (1,718.8)
Total transactions with owners 246.5 21.3 (2,931.9) (2,664.1)
At 31 December 2018 11,446.1 (5,324.0) 45,608.0 51,730.1
At 1 September 2017 11,124.9 (5,190.9) 45,885.6 51,819.6
Profit for the financial period 0 0 2,452.3 2,452.3
Fair value of AFS financial assets 40 0 (2.6) 0 (2.6)
Employee benefits reserve 40 0 (99.8) 0 (99.8)
Total comprehensive (expense)/income for the financial period 0 (102.4) 2,452.3 2,349.9
LTIP share-based payment expense 0 66.3 0 66.3
LTIP shares issued 39 74.7 (74.7) 0 0
Final dividend paid for FY2017 0 0 (2,493.0) (2,493.0)
Total transactions with owners 74.7 (8.4) (2,493.0) (2,426.7)
At 31 December 2017 11,199.6 (5,301.7) 45,844.9 51,742.8
The notes set out on pages 163 to 307 form an integral part of these consolidated financial statements.
Consolidated Statement of Changes in Equity
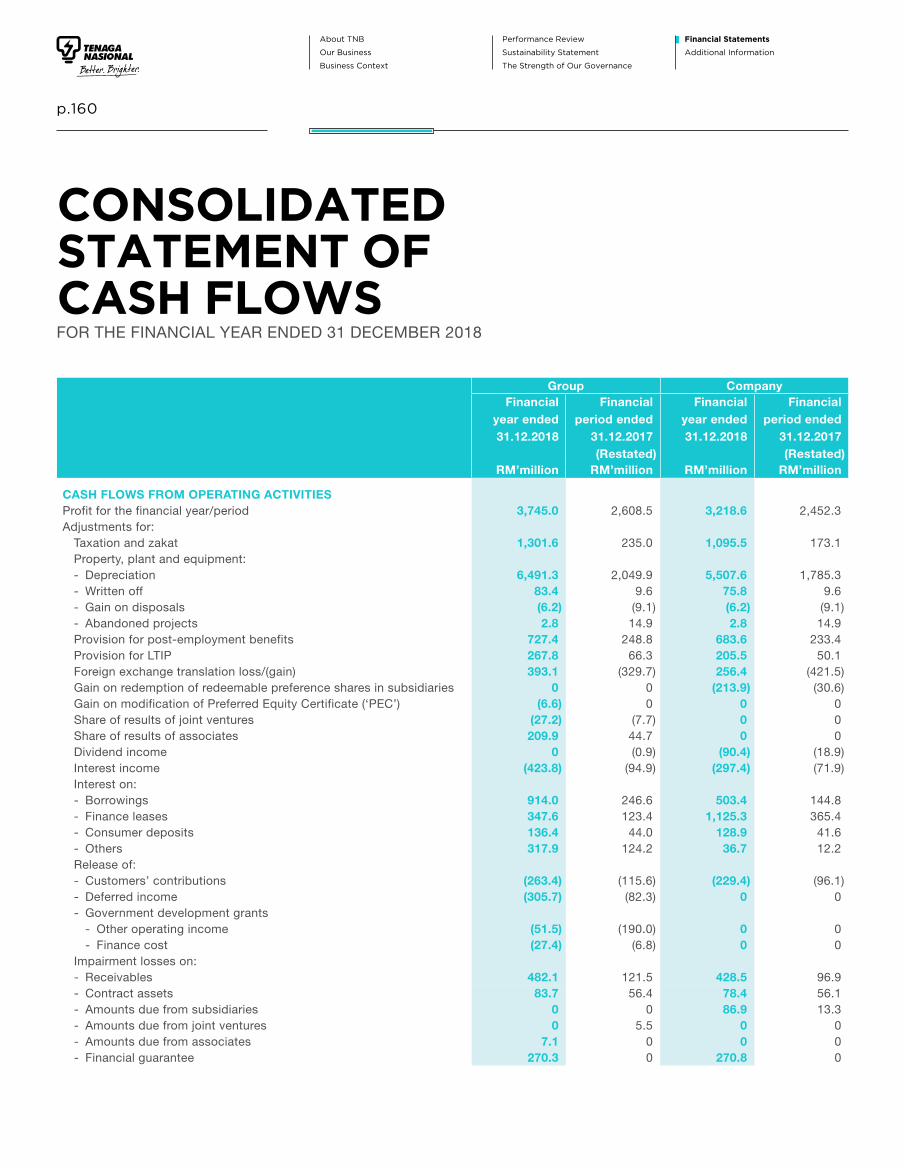
About TNB
Our Business
Business Context
Performance Review
Sustainability Statement
The Strength of Our Governance
Financial Statements
Additional Information
p.160
Group CompanyFinancial
year ended31.12.2018
Financialperiod ended
31.12.2017(Restated)
Financialyear ended31.12.2018
Financialperiod ended
31.12.2017(Restated)
RM’million RM’million RM’million RM’million
CASH FLOWS FROM OPERATING ACTIVITIESProfit for the financial year/period 3,745.0 2,608.5 3,218.6 2,452.3Adjustments for: Taxation and zakat 1,301.6 235.0 1,095.5 173.1 Property, plant and equipment: - Depreciation 6,491.3 2,049.9 5,507.6 1,785.3 - Written off 83.4 9.6 75.8 9.6 - Gain on disposals (6.2) (9.1) (6.2) (9.1) - Abandoned projects 2.8 14.9 2.8 14.9 Provision for post-employment benefits 727.4 248.8 683.6 233.4 Provision for LTIP 267.8 66.3 205.5 50.1 Foreign exchange translation loss/(gain) 393.1 (329.7) 256.4 (421.5) Gain on redemption of redeemable preference shares in subsidiaries 0 0 (213.9) (30.6) Gain on modification of Preferred Equity Certificate (‘PEC’) (6.6) 0 0 0 Share of results of joint ventures (27.2) (7.7) 0 0 Share of results of associates 209.9 44.7 0 0 Dividend income 0 (0.9) (90.4) (18.9) Interest income (423.8) (94.9) (297.4) (71.9) Interest on: - Borrowings 914.0 246.6 503.4 144.8 - Finance leases 347.6 123.4 1,125.3 365.4 - Consumer deposits 136.4 44.0 128.9 41.6 - Others 317.9 124.2 36.7 12.2 Release of: - Customers’ contributions (263.4) (115.6) (229.4) (96.1) - Deferred income (305.7) (82.3) 0 0 - Government development grants - Other operating income (51.5) (190.0) 0 0 - Finance cost (27.4) (6.8) 0 0 Impairment losses on: - Receivables 482.1 121.5 428.5 96.9 - Contract assets 83.7 56.4 78.4 56.1 - Amounts due from subsidiaries 0 0 86.9 13.3 - Amounts due from joint ventures 0 5.5 0 0 - Amounts due from associates 7.1 0 0 0 - Financial guarantee 270.3 0 270.8 0
CONSOLIDATEDSTATEMENT OFCASH FLOWSFOR THE FINANCIAL YEAR ENDED 31 DECEMBER 2018

About TNB
Our Business
Business Context
Performance Review
Sustainability Statement
The Strength of Our Governance
Financial Statements
Additional InformationIntegrated Annual Report 2018
Tenaga Nasional Berhad
p.161
Group CompanyFinancial
year ended31.12.2018
Financialperiod ended
31.12.2017(Restated)
Financialyear ended31.12.2018
Financialperiod ended
31.12.2017(Restated)
RM’million RM’million RM’million RM’million
CASH FLOWS FROM OPERATING ACTIVITIES (CONTINUED)Adjustments for: (continued) Reversal of impairment losses on: - Receivables (279.5) (5.8) (242.4) (2.0) - Contract assets (76.1) (14.2) (75.8) (14.2) - Amounts due from subsidiaries 0 0 (79.4) (14.5) - Amounts due from associates (0.3) 0 (0.3) 0 Impairment losses on investment in: - Subsidiaries 0 0 1,661.6 43.1 - Associates 802.7 0 0 0 Inventories: - Provision for obsolescence 293.4 69.9 292.9 69.9 - Write back of obsolescence (278.6) (62.9) (278.6) (62.9) - Written off 27.6 0.2 23.1 0.2 Changes in fair value of financial instruments (36.7) 7.2 (22.2) (27.7)Cash from operations before working capital changes 15,122.1 5,156.7 14,146.3 4,792.8Inventories (453.3) (63.5) (52.2) (24.5)Receivables (721.6) (2,142.1) (1,985.0) (581.5)Contract assets (302.5) 163.0 (279.3) 126.1Payables 126.6 (905.0) (58.1) (995.2)Subsidiaries balances 0 0 (402.1) (1,263.3)Associates balances (75.4) (51.4) (35.0) 45.9Joint ventures balances (9.2) (6.0) 0 0Cash generated from operations 13,686.7 2,151.7 11,334.6 2,100.3Post-employment benefits paid (824.6) (240.1) (805.0) (232.2)Contract liabilities received 1,081.9 464.4 506.1 325.8Consumer deposits received 415.9 91.8 402.6 91.1Taxation and zakat paid (1,324.5) (250.6) (887.1) (140.6)Net cash flows generated from operating activities 13,035.4 2,217.2 10,551.2 2,144.4
CASH FLOWS FROM INVESTING ACTIVITIESAcquisition of subsidiaries net of cash and cash equivalent (401.1) 0 (28.0) 0Additional investments in: - Subsidiaries 0 0 (23.9) (5.1)- FVTPL (64,589.3) (27,579.4) (63,912.0) (23,512.0)- Joint venture (1.0) 0 0 0Proceeds from redemptions:- Redeemable preference shares in subsidiaries 0 0 700.0 100.0- Redeemable preference shares in associate 10.4 0 10.4 0Disposals of FVTPL 65,602.7 29,311.1 62,774.0 25,802.8Dividend income received 44.9 24.9 90.4 18.0Interest income received 203.9 96.6 57.4 22.5Property, plant and equipment:- Additions (11,287.1) (3,768.6) (7,407.9) (1,424.5)- Proceeds from disposals 27.6 29.0 54.1 10.6Advances granted to subsidiaries 0 0 (426.6) 0Repayment of advances from subsidiaries 0 0 158.9 0Net cash flows (used in)/generated from investing activities (10,389.0) (1,886.4) (7,953.2) 1,012.3
Consolidated Statement of Cash Flows

About TNB
Our Business
Business Context
Performance Review
Sustainability Statement
The Strength of Our Governance
Financial Statements
Additional Information
p.162
Group Company
Financialyear ended31.12.2018
Financialperiod ended
31.12.2017(Restated)
Financialyear ended31.12.2018
Financialperiod ended
31.12.2017(Restated)
RM’million RM’million RM’million RM’million
CASH FLOWS FROM FINANCING ACTIVITIES
Government development grants received 5.6 174.7 0 0
Long term borrowings:
- Drawdowns 7,309.4 3,757.6 6,326.1 0
- Repayments (1,087.4) (701.1) (305.5) (62.0)
Short term borrowings:
- Drawdowns 897.0 434.0 0 0
- Repayments (867.0) (329.5) 0 0
Interests paid:
- Borrowings (1,986.9) (575.4) (681.4) (278.8)
- Others (8.9) (9.8) (8.9) (9.8)
Repayment of finance lease obligations (682.7) (232.0) (2,137.7) (638.6)
Dividends paid to shareholders (2,931.9) (2,493.0) (2,931.9) (2,493.0)
Dividends paid to NCI (2.0) 0 0 0
Purchase of shares by NCI 57.8 4.9 0 0
Exercise of put option on shares of a subsidiary by NCI (90.6) 0 0 0
Net decrease in debt reserve accounts 3.8 0 0 0
Net decrease in cash at bank, held in trust 40.9 3.7 0 0
Net increase in restricted cash (16.3) 0 0 0
Net increase in deposits maturing more than 90 days (561.0) 0 0 0
Net cash flows generated from/(used in) financing activities 79.8 34.1 260.7 (3,482.2)
NET INCREASE/(DECREASE) IN CASH AND CASH EQUIVALENTS 2,726.2 364.9 2,858.7 (325.5)
EFFECTS OF CHANGES IN FOREIGN CURRENCY (3.0) (2.4) (7.6) (8.6)
CASH AND CASH EQUIVALENTS AT THE BEGINNING OF THE FINANCIAL YEAR/PERIOD 4,875.4 4,512.9 3,001.3 3,335.4
CASH AND CASH EQUIVALENTS AT THE END OF THE FINANCIAL YEAR/PERIOD (NOTE 31) 7,598.6 4,875.4 5,852.4 3,001.3
The changes in liabilities arising from financing activities have been disclosed in Notes 23(b), 36 and 37 respectively.
The notes set out on pages 163 to 307 form an integral part of these consolidated financial statements.
Consolidated Statement of Cash Flows

About TNB
Our Business
Business Context
Performance Review
Sustainability Statement
The Strength of Our Governance
Financial Statements
Additional InformationIntegrated Annual Report 2018
Tenaga Nasional Berhad
p.163
1 GENERAL INFORMATION
The Group and Company are primarily involved in the business of the generation, transmission, distribution and sales of electricity and those tabulated in Note 15 to these financial statements, which also includes the details of the subsidiaries of the Group.
There have been no significant changes in these activities of the Group and Company during the financial year.
The Company is a public limited liability company, incorporated and domiciled in Malaysia and is listed on the Main Market of Bursa Malaysia Securities Berhad.
The address of the registered office of the Company is Pejabat Setiausaha Syarikat, Tingkat 2, Ibu Pejabat Tenaga Nasional Berhad, No. 129, Jalan Bangsar, 59200 Kuala Lumpur, Malaysia.
2 BASIS OF PREPARATION
The financial statements of the Group and Company have been prepared in accordance with the provisions of the Malaysian Financial Reporting Standards (‘MFRS’), International Financial Reporting Standards (‘IFRS’) and the requirements of the Companies Act 2016 in Malaysia.
The financial statements have been prepared under the historical cost convention, except as disclosed in this summary of significant accounting policies.
The preparation of financial statements in conformity with MFRS requires the use of certain critical accounting estimates and assumptions that affect the reported amounts of assets and liabilities and disclosure of contingent assets and liabilities at the date of the financial statements, and the reported amounts of revenues and expenses during the reported period. It also requires Directors to exercise their judgement in the process of applying the Group and Company’s accounting policies. Although these estimates and judgement are based on the Directors’ best knowledge of current events and actions, actual results may differ. The areas involving a higher degree of judgement or complexity, or areas where assumptions and estimates are significant to the financial statements are disclosed in Note 4.
(a) Change of financial year end
The Group and Company had changed its financial year end from 31 August to 31 December effective from the previous reporting period. Consequently, the comparative figures are the previous 4 months period from 1 September 2017 to 31 December 2017. The current financial statements are for a period of 12 months from 1 January 2018 to 31 December 2018. Due to the change in the financial year end, the amounts presented in the financial statements are not entirely comparable.
(b) New standards, amendments and improvements to published standards that are effective and applicable to the Group and Company.
The Group and Company have applied the following new standards, amendments and improvements to the published standards that are applicable to the Group and Company for the first time for the financial year beginning on 1 January 2018: (i) MFRS 9 ‘Financial Instruments’ (‘MFRS 9’) (ii) MFRS 15 ‘Revenue from Contracts with Customers’ (‘MFRS 15’)(iii) IC Interpretation 22 ‘Foreign Currency Transactions and Advance Consideration’ (‘IC 22’)(iv) Amendments to MFRS 128 ‘Investments in Associates and Joint Ventures’ (‘MFRS 128’) in ‘Annual Improvements to MFRS Standards
2014-2016 Cycle’(v) Amendments to MFRS 2 ‘Share-Based Payment’ (‘MFRS 2’) on ‘Classification and Measurement of Share-Based Payment Transactions’
The Group and Company had to change its accounting policies and make certain retrospective adjustments following the adoption of MFRS 9 and MFRS 15. This is disclosed in Note 47. The other amendments listed above did not have any impact on the amounts recognised in prior periods and are not expected to significantly affect the current or future periods.
NOTES TO THEFINANCIAL STATEMENTS31 DECEMBER 2018

About TNB
Our Business
Business Context
Performance Review
Sustainability Statement
The Strength of Our Governance
Financial Statements
Additional Information
p.164 Notes to the Financial Statements
2 BASIS OF PREPARATION (CONTINUED)
(c) New standards, amendments to published standards, interpretations and improvements to existing standards that are applicable to the Group and Company but not yet effective.
The Group and Company will apply the new standards, amendments to published standards, interpretations and improvements to existing standards in the following periods:
(i) Financial year beginning on or after 1 January 2019
• MFRS 16 ‘Leases’ (‘MFRS 16’) supersedes MFRS 117 ‘Leases’ (‘MFRS 117’) and the related interpretations.
Under MFRS 16, a lease is a contract (or part of a contract) that conveys the right to control the use of an identified asset for a period of time in exchange for consideration.
MFRS 16 eliminates the classification of leases by the lessee as either finance leases (on balance sheet) or operating leases (off balance sheet). MFRS 16 requires a lessee to recognise a ‘right-of-use’ of the underlying asset and a lease liability reflecting future lease payments. The only exceptions are short term and low-value leases.
The right-of-use asset is depreciated in accordance with the principle in MFRS 116 ‘Property, Plant and Equipment’ (‘MFRS 116’) and the lease liability is accreted over time with interest expense recognised in the income statement.
The standard will affect primarily the accounting for the Group and Company’s leases previously recognised as operating leases under MFRS 117 disclosed in Note 24 and Note 41(b) and other rentals of buildings and equipments.
The Group and Company will apply the standard from 1 January 2019 and intends to apply the simplified transition approach and will not restate comparatives for the year prior to first adoption. All right-of-use assets will be measured at the amount of the lease liablity on adoption (adjusted for any prepaid or accrued lease expenses).
At 1 January 2019, the Group and Company is estimated to recognise lease liabilities of RM29,404.7 million and RM41,147.4 million respectively with a corresponding estimated ROU assets of RM35,358.7 million and RM47,065.7 million respectively.
For lessors, MFRS 16 retains most of the requirements in MFRS 117. Lessors continue to classify all leases as either operating leases or finance leases and account for them differently. As such, the Group and Company does not expect any significant impact from activities as a lessor on the financial statements. However, some additional disclosures will be required from next year.
• IC Interpretation 23 ‘Uncertainty over Income Tax Treatments’ (‘IC 23’) provides guidance on how to recognise and measure deferred and current income tax assets and liabilities where there is uncertainty over a tax treatment.
If an entity concludes that it is not probable that the tax treatment will be accepted by the tax authority, the effect of the tax uncertainty should be included in the period when such determination is made. An entity shall measure the effect of uncertainty using the method which best predicts the resolution of the uncertainty.
IC 23 shall be applied retrospectively. Earlier application is permitted and should be disclosed.
• Amendments to MFRS 128 on Long-term Interests in Associates and Joint Ventures clarifies that MFRS 9, including its impairment requirements shall be applied when accounting for long-term interests in an associate or joint venture that, in substance, form part of the net investment in the associate or joint venture to which the equity method is not applied.
The amendments shall be applied retrospectively with transitional reliefs available. Earlier application is permitted and should be disclosed.

About TNB
Our Business
Business Context
Performance Review
Sustainability Statement
The Strength of Our Governance
Financial Statements
Additional InformationIntegrated Annual Report 2018
Tenaga Nasional Berhad
p.165 Notes to the Financial Statements
2 BASIS OF PREPARATION (CONTINUED)
(c) New standards, amendments to published standards, interpretations and improvements to existing standards that are applicable to the Group and Company but not yet effective. (continued)
(i) Financial year beginning on or after 1 January 2019 (continued)
• Amendments to MFRS 9 on Prepayment Features with Negative Compensation allows the measurement of prepayable financial assets with negative compensation to be at amortised cost or at FVOCI if certain conditions are met.
The amendments shall be applied retrospectively with transitional reliefs available. Earlier application is permitted and should be disclosed.
• Amendments to MFRS 3 ‘Business Combinations’ (‘MFRS 3’) in Annual Improvements to MFRS Standards 2015-2017 Cycle clarify that obtaining control of a business that is a joint operation (as defined in MFRS 11 ‘Joint Arrangements’ (‘MFRS 11’)) is a business combination achieved in stages. The acquirer must remeasure its previously held interest in the joint operation at its acquisition-date fair value. Accordingly, the acquirer effectively:- derecognises its previously held interest in the joint operation; and- recognises a controlling interest in all of the assets and liabilities of the former joint operation.
These amendments shall be applied to business combinations with acquisition dates on or after 1 January 2019. Earlier application is permitted and should be disclosed.
• Amendments to MFRS 11 in Annual Improvements to MFRS Standards 2015-2017 Cycle clarify that when the party that participates in (but does not have joint control over) a joint operation, obtains joint control over that joint operation that is a business (as defined in MFRS 3), it should not remeasure its previously held interest in the joint operation.
These amendments shall be applied to transactions resulting in obtaining joint control on or after 1 January 2019. Earlier application is permitted and should be disclosed.
• Amendments to MFRS 112 ‘Income Taxes’ (‘MFRS 112’) in Annual Improvements to MFRS Standards 2015-2017 Cycle clarify that all income tax consequences of dividends should be recognised either in profit or loss, other comprehensive income (‘OCI’) or equity, depending on where the past transactions or events that generated the distributable profits were recognised.
These amendments shall be applied to income tax consequences of dividends recognised on or after the beginning of the earliest comparative period. Earlier application is permitted and should be disclosed.
• Amendments to MFRS 123 ‘Borrowing Costs’ (‘MFRS 123’) in Annual Improvements to MFRS Standards 2015-2017 Cycle clarify that if a specific borrowing remains outstanding after the related qualifying asset is ready for its intended use or sale, it becomes part of the funds an entity borrows generally.
Based on the assessment performed to date, the application of this amendment is expected to increase profit by 1.0% to 2.0% for the Group and Company. The amendment is also expected to not have a material impact on the property, plant and equipment (‘PPE’) for the Group and Company.
These amendments shall be applied prospectively. Earlier application is permitted and should be disclosed.
• Amendments to MFRS 119 ‘Employee Benefits’ (‘MFRS 119’) on Plan Amendments, Curtailment or Settlement requires an entity to use updated actuarial assumptions to determine current service cost and net interest for the remainder of the annual reporting period after a plan amendment, curtailment or settlement. In addition, the amendments require the entity to recognise in profit or loss as part of past service cost, or a gain or loss on settlement, any reduction in a surplus, even if that surplus was not previously recognised because of the impact of the asset ceiling. These amendments shall be applied prospectively. Earlier application is permitted and should be disclosed.

About TNB
Our Business
Business Context
Performance Review
Sustainability Statement
The Strength of Our Governance
Financial Statements
Additional Information
p.166 Notes to the Financial Statements
2 BASIS OF PREPARATION (CONTINUED)
(c) New standards, amendments to published standards, interpretations and improvements to existing standards that are applicable to the Group and Company but not yet effective. (continued)
(ii) Financial year beginning on or after 1 January 2020
• Amendments to References to the Conceptual Framework in MFRS Standards are to update the references and quotations in these Standards so as to clarify the version of the Conceptual Framework these Standards refer to.
The Revised Conceptual Framework for Financial Reporting comprises of a comprehensive set of concepts for financial reporting. It is built on the previous version issued in 2011. The changes to the chapters on the objective of financial reporting and qualitative characteristics of useful information are limited, but with improved wording to give more prominence to the importance of providing information needed to assess management’s stewardship of the entity’s economic resources.
Other improvements include a new chapter on measurement, guidance on reporting financial performance, improved definitions and guidance – in particular the definition of a liability – and clarifications in important areas, such as the role of prudence and measurement uncertainty in financial reporting.
The amendments to the following Standards which are applicable to the Group and Company are as follows:- Amendments to MFRS 2- Amendment to MFRS 3 - Amendments to MFRS 101 ‘Presentation of Financial Statements’ (‘MFRS 101’)- Amendments to MFRS 108 ‘Accounting Policies, Changes in Accounting Estimates and Errors’ (‘MFRS 108’)- Amendments to MFRS 134 ‘Interim Financial Reporting’ (‘MFRS 134’)- Amendment to MFRS 137 ‘Provisions, Contingent Liabilities and Contingent Assets’ (‘MFRS 137’)- Amendment to MFRS 138 ‘Intangible Assets’ (‘MFRS 138’)- Amendment to IC Interpretation 12 ‘Service Concession Arrangements’ (‘IC 12’)- Amendment to IC Interpretation 19 ‘Extinguishing Financial Liabilities with Equity Instruments’ (‘IC 19’)- Amendment to IC 22- Amendments to IC Interpretation 132 ‘Intangible Assets – Web Site Costs’ (‘IC 132’)
The amendments are effective for annual periods beginning or after 1 January 2020. Earlier application is permitted if at the same time an entity also applies all other amendments made by Amendments to References to the Conceptual Framework in MFRS Standards.
• Amendments to MFRS 3 on Definition of a Business clarifies the definition to determine whether a transaction should be accounted for as a business combination or as an asset acquisition. The distinction is important as an acquirer does not recognise goodwill in an asset acquisition.
The amendments clarify that to be considered a business, an acquired set of activities and assets must include, at a minimum, an input and a substantive process that together significantly contribute to the ability to create outputs. The amendments also add an optional concentration test that permits a simplified assessment of whether an acquired set of activities and assets is not a business.
The amendments shall be applied to business combinations with acquisition dates on or after the beginning of the first annual reporting period beginning on or after 1 January 2020 and to asset acquisitions that occur on or after the beginning of that period. Earlier application is permitted and should be disclosed.
About TNB
Our Business
Business Context
Performance Review
Sustainability Statement
The Strength of Our Governance
Financial Statements
Additional InformationIntegrated Annual Report 2018
Tenaga Nasional Berhad
p.167 Notes to the Financial Statements
2 BASIS OF PREPARATION (CONTINUED)
(c) New standards, amendments to published standards, interpretations and improvements to existing standards that are applicable to the Group and Company but not yet effective. (continued)
(ii) Financial year beginning on or after 1 January 2020 (continued)
• Amendments to MFRS 101 and MFRS 108 on Definition of material refines the definition by including ‘obscuring information’ to address the issue of including immaterial information should not reduce the understandability of a company’s financial statements. The prior definition focuses only on information that cannot be omitted (material information) and does not also consider the effect of including immaterial information.
The amendments also align the definition of material across MFRS Standards and other publications.
These amendments shall be applied prospectively. Earlier application is permitted and should be disclosed.
(iii) Financial year beginning on or after 1 January 2021
• MFRS 17 ‘Insurance Contracts’ (‘MFRS 17’) introduces consistent accounting for all insurance contracts based on a current measurement model. MFRS 17 requires entities that issue insurance contracts to recognise and measure a group of insurance contracts at: (i) a risk-adjusted present value of future cash flows that incorporates information that is consistent with observable market information; plus (ii) an amount representing the unearned profit in the group of contracts. Profits from the group of insurance contracts are recognised over the insurance coverage period. MFRS 17 also changes the financial statements presentations of insurance service results – insurance revenue is presented separately from insurance financial income or expenses.
For insurance contracts with coverage period of one year or less, MFRS 17 allows an entity to measure the amount relating to remaining service by allocating the premium over the coverage period.
MFRS 17 shall be applied with transitional reliefs available. Earlier application is permitted provided the entities have applied MFRS 9 and MFRS 15 on or before the date of initial application of MFRS 17. If MFRS 17 is applied earlier, that fact should be disclosed.
(iv) Effective date yet to be determined by Malaysian Accounting Standards Board
• Amendments to MFRS 10 ‘Consolidated Financial Statements’ (‘MFRS 10’) and MFRS 128 on Sale or Contribution of Assets between an Investor and its Associate or Joint Venture.
The adoption of the above applicable new standards, amendments to published standards, interpretations and improvements to existing standards are not expected to have a material impact on the financial statements of the Group and Company except for MFRS 16 and MFRS 123.
There are no other standards, amendments to published standards and interpretations to existing standards that are not effective that would be expected to have a material impact on the Group and Company.

About TNB
Our Business
Business Context
Performance Review
Sustainability Statement
The Strength of Our Governance
Financial Statements
Additional Information
p.168 Notes to the Financial Statements
3 SUMMARY OF SIGNIFICANT ACCOUNTING POLICIES
Unless otherwise stated, the following accounting policies have been applied consistently in dealing with items that are considered material in relation to the financial statements. These policies have been consistently applied to all the year/period presented, unless otherwise stated.
(a) Subsidiaries and basis of consolidation
(i) Subsidiaries
Subsidiaries are all entities (including structured entities) over which the Group has control. The Group controls an entity when the Group is exposed to, or has rights to, variable returns from its involvement with the entity and has the ability to affect those returns through its power to direct the relevant activities of the entity. The existence and effect of potential voting rights are considered only when such rights are substantive when assessing control.
The amounts due from subsidiaries of which the Company does not expect repayment in the foreseeable future are considered as part of the Company’s investment in subsidiaries.
In the Company’s separate financial statements, investments in subsidiaries are stated at cost less accumulated impairment losses. On disposal of such investments, the difference between net disposal proceeds and their carrying amounts is included in the statement of profit or loss.
(ii) Basis of consolidation
The consolidated financial statements comprise the financial statements of the Company and its subsidiaries. The financial statements of the subsidiaries are prepared for the same reporting date as the Company.
Subsidiaries are consolidated from the date on which the Group obtains control, and continue to be consolidated until the date that such control ceases. In preparing the consolidated financial statements, intragroup balances, transactions and unrealised gains or losses are eliminated in full. Uniform accounting policies are adopted in the consolidated financial statements for like transactions and events in similar circumstances.
The Group applies the acquisition method to account for business combinations. The consideration transferred for acquisition of a subsidiary is the fair values of the assets transferred, the liabilities incurred and the equity interests issued by the Group. The consideration transferred includes the fair value of any asset or liability resulting from a contingent consideration arrangement and fair value of any pre-existing equity interest in the subsidiary. Acquisition-related costs are expensed as incurred. Identifiable assets acquired, liabilities and contingent liabilities assumed in a business combination are, with limited exceptions, measured initially at their fair values at the acquisition date.
In a business combination achieved in stages, the carrying value of the acquirer’s previously held equity interest in the acquiree is remeasured at its acquisition date fair value and the resulting gain or loss is recognised in the statement of profit or loss.
The excess of the consideration transferred, the amount of any Non-Controlling Interest (‘NCI’) in the acquiree and the acquisition-date fair value of any previous equity interest in the acquiree over the fair value of the Group share of the identifiable net assets acquired is recorded as goodwill. If this is less than the fair value of the net assets of the subsidiary acquired in the case of a bargain purchase, the gain is recognised in the statement of profit or loss. Refer to Note 18 for accounting policy on goodwill.
NCI is the equity in a subsidiary not attributable, directly or indirectly, to a parent. On an acquisition-by-acquisition basis, the Group measures any NCI in the acquiree either at fair value or at the NCI’s proportionate share of the acquiree’s identifiable net assets. At the end of reporting period, NCI consists of amount calculated on the date of combinations and its share of changes in the subsidiary’s equity since the date of combination.
All earnings and losses of the subsidiary are attributed to the parent and the NCI, even if the attribution of losses to the NCI results in a debit balance in the shareholders’ equity.

About TNB
Our Business
Business Context
Performance Review
Sustainability Statement
The Strength of Our Governance
Financial Statements
Additional InformationIntegrated Annual Report 2018
Tenaga Nasional Berhad
p.169 Notes to the Financial Statements
3 SUMMARY OF SIGNIFICANT ACCOUNTING POLICIES (CONTINUED)
(a) Subsidiaries and basis of consolidation (continued)
(iii) Changes in ownership interest
When the Group ceases to consolidate because of a loss of control, any retained interest in the entity is remeasured to its fair value with the change in carrying amount recognised in the statement of profit or loss. This fair value becomes the initial carrying amount for the purposes of subsequently accounting for the retained interest as an associate, joint venture or financial asset. In addition, any amounts previously recognised in OCI in respect of that entity are accounted for as if the Group had directly disposed of the related assets or liabilities. This may mean that amounts previously recognised in OCI are reclassified to profit or loss. Gains or losses on the disposal of subsidiaries include the carrying amount of goodwill relating to the subsidiaries sold.
(b) Transactions with NCI
Transactions with NCI that do not result in loss of control are accounted for as transactions with equity owners of the Group. A change in ownership interest results in an adjustment between the carrying amounts of the controlling and NCI to reflect their relative interests in the subsidiary. Any differences between the amount of the adjustment to NCI and any consideration paid or received are recognised in equity attributable to owners of the Group.
(c) Impairment of non-financial assets
Assets that are subject to amortisation are reviewed for impairment losses whenever events or changes in circumstances indicate that the carrying amount may not be recoverable. Impairment loss is recognised in the statement of profit or loss for the amount by which the carrying amount of the asset exceeds its recoverable amount. The recoverable amount is the higher of fair value less cost to sell and its value-in-use. For the purpose of assessing impairment, assets are grouped at the lowest levels for which there are separately identifiable cash flows which are largely independent of the cash inflows from other assets or groups of assets (cash-generating units). Non-financial assets other than goodwill previously impaired are reviewed for possible reversal of the impairment at each reporting date. Any subsequent increase in recoverable amount is recognised in the statement of profit or loss.
(d) Research and development
Expenditure on research activities, undertaken with the prospect of gaining new scientific or technical knowledge and understanding, is recognised in the statement of profit or loss as an expense as incurred.
Expenditure on development activities, whereby the application research findings are applied to a plan or design for the production of new or substantially improved products and processes, is capitalised only when all the following criteria are fulfilled:(i) it is technically feasible to complete the intangible asset so that it will be available for use or sale;(ii) management intends to complete the intangible asset and use or sell it;(iii) there is an ability to use or sell the intangible asset;(iv) it can be demonstrated how the intangible asset will generate probable future economic benefits;(v) adequate technical, financial and other resources to complete the development and to use or sell the intangible asset are
available; and(vi) the expenditure attributable to the intangible asset during its development can be reliably measured.
Capitalised development costs are recognised as intangible assets and amortised from the point at which the asset is ready for use on a straight line method over its useful life.
The expenditure capitalised includes the cost of materials, direct labour and overheads costs that are directly attributable to preparing the assets for its intended use. Other development expenditure is recognised in the statement of profit or loss as incurred. Development costs previously recognised as an expense are not recognised as an asset in a subsequent period.
All other significant accounting policies are disclosed in their respective notes.

About TNB
Our Business
Business Context
Performance Review
Sustainability Statement
The Strength of Our Governance
Financial Statements
Additional Information
p.170 Notes to the Financial Statements
4 CRITICAL ACCOUNTING ESTIMATES AND JUDGEMENTS
Estimates and judgements are continuously evaluated by the Directors and are based on historical experience and other factors, including expectations of future events that are believed to be reasonable under the circumstances.
The Group and Company make estimates and assumptions concerning the future. The resulting accounting estimates will, by definition, rarely equate to the related actual results. To enhance the information content of the estimates, certain key variables that are anticipated to have a material impact on the Group and Company’s results and financial position are tested for sensitivity to changes in the underlying parameters.
The estimates and assumptions that have a significant risk of causing a material adjustment to the carrying amounts of assets and liabilities within the next financial year are outlined below:
(a) Revenue recognition
Electricity revenue for energy supply activities includes an assessment of energy supplied to customers between the date of the last meter reading and the financial year end of the Group and Company (unread and unbilled). An assessment is also made on any factors that are likely to materially affect the ultimate economic benefits which will flow to the Group and Company, including bill cancellations and adjustments. These assessments will have a corresponding adjustment to trade receivables. To the extent that the economic benefits are not expected to flow to the Group and Company, the value of that revenue is not recognised.
Included in the receivables, deposits and prepayments balance in Note 30 is the estimated under-recovery of costs under the Imbalance Cost Pass-Through (‘ICPT’) mechanism. The Group and Company continuously assess the balances by considering factors such as changes in the applicable regulatory implementation guidelines and political environment, the ability to recover costs through regulated rates, and the status of any pending or potential deregulation legislation. Based on this continuous assessment, the Company believes the existing balances reflects the best estimate of the Company’s receivable from the Government. This assessment reflects the current political and regulatory climate, and may be subject to change in the future.
Included in the revenue, is the Annual Regulatory Adjustment (‘ARA’) for the over recovery of revenue and other income earned during the financial year. The Company has taken into account the principles laid out in the Guidelines on Electricity Tariff Determination (‘Guidelines’) under the Incentive Based Regulation (‘IBR’) for Peninsular Malaysia 2018, where the allowed revenue in each year is calculated as the sum of actual revenue earned and any applicable adjustments, such as those related to the revenue-cap, price-cap and other income adjustment mechanisms as described in the Guidelines. Other Income which is earned from services not directly related to electricity supply, but which are provided using the assets and/or staff of a licensee is deducted from the revenues to be earned from regulated tariffs.
(b) Estimated useful lives of Property, Plant and Equipment (‘PPE’)
The Group and Company regularly reviewed the estimated useful lives of PPE based on factors such as business plans and strategies, expected level of usage and future technological developments. Future results of operations could be materially affected by changes in these estimates brought about by changes in the factors mentioned above. A reduction in the estimated useful lives of PPE would increase the recorded depreciation and decrease the net book value (‘NBV’) of PPE.
(c) Impairment of PPE
The Group and Company assess impairment of assets whenever the events or changes in circumstances indicate that the carrying amount of an asset may not be recoverable, i.e., the carrying amount of the asset is more than the recoverable amount.
Recoverable amount is measured at the higher of the fair value less cost to sell for that asset and its value-in-use. The value-in-use is the net present value of the projected future cash flows derived from that asset discounted at an appropriate discount rate. Projected future cash flows are based on the Group and Company’s estimates calculated based on historical, sector and industry trends, general market and economic conditions, changes in technology and other available information.
In particular for TNB Liberty Power Limited (‘LPL’), as disclosed in Note 14(a), the appropriateness of the assumptions required for impairment purpose is dependent on the extension of the Gas Supply Agreement (‘GSA’) by the Government of Pakistan where the subsidiary is operating, till the end of the Power Purchase Agreement (‘PPA’) term. The Government of Pakistan through its Economic Coordination Committee (‘ECC’) has approved the extension for gas allocation from Oil and Gas Development Company Limited (‘OGDCL’) Qadirpur gas field until the end of the PPA in 2026. Accordingly, the Group is of the view that the carrying amount of the subsidiary’s PPE is recoverable.

About TNB
Our Business
Business Context
Performance Review
Sustainability Statement
The Strength of Our Governance
Financial Statements
Additional InformationIntegrated Annual Report 2018
Tenaga Nasional Berhad
p.171 Notes to the Financial Statements
4 CRITICAL ACCOUNTING ESTIMATES AND JUDGEMENTS (CONTINUED)
The estimates and assumptions that have a significant risk of causing a material adjustment to the carrying amounts of assets and liabilities within the next financial year are outlined below: (continued)
(d) Impairment of subsidiaries and associates
The Group and Company assess impairment of its investment in subsidiaries and associates whenever the events or changes in circumstances indicate that the carrying amount may not be recoverable i.e. the carrying amount is more than the recoverable amount. Recoverable amount is measured at the higher of the fair value less cost to sell and its value-in-use. The value-in-use is the net present value of the projected future cash flow derived discounted at an appropriate discount rate.
Projected future cash flows are based on the Group and Company’s estimates calculated based on historical, sector and industry trends, general market and economic conditions, changes in technology and other available information.
(e) Impairment of goodwill
The Group tests goodwill for impairment annually in accordance with its accounting policy and whenever events or change in circumstances indicate that this is necessary within the financial period. This requires an estimation of the value-in-use of the Group as the cash generating unit to which the goodwill is allocated. Estimating the value-in-use requires the Group to make an estimate of the expected future cash flows from the Group and also to apply a suitable discount rate in order to calculate the present value of those cash flows. The assumptions used, results and sensitivity of the impairment assessment of goodwill are disclosed in Note 18 to the financial statements.
(f) Measurement of expected credit loss (‘ECL’) allowance for financial assets
The loss allowances for financial assets are based on assumptions about risk of default and expected loss rates. The Group and Company use judgements in making these assumptions and selecting the inputs to the impairment calculation, based on the Group and Company’s past history, existing market conditions as well as forward looking estimates at the end of each reporting period. Details of key assumptions and inputs used are disclosed in Note 45.
(g) Lease accounting
As a result of adopting IC Interpretation 4 ‘Determining Whether an Arrangement Contains a Lease’ (‘IC 4’), certain of the Group and Company’s power purchase agreements have been accounted for as a finance lease rather than the normal sale and purchase arrangements. This has resulted in finance lease accounting being applied to these power purchase agreements.
To apply finance lease accounting, a number of assumptions in the lease models have been made, such as the determination of minimum lease payments, implicit interest rates and residual values of the power plants at the end of contract periods. Any changes to these assumptions will affect the lease income and expenses.
(h) Fair value of derivatives and other financial instruments
Certain financial instruments such as investments and derivative financial instruments are carried on the statement of financial position at fair value, with changes in fair value reflected in the statement of profit or loss.
Fair values are estimated by reference in part to published price quotations and in part by using valuation techniques. The fair value of financial instruments that are not traded in an active market (for example, over-the-counter derivatives) is determined by using valuation techniques.
The Group and Company use its judgement to select a variety of methods and make assumptions that are mainly based on market conditions existing at the end of each reporting periods, as disclosed in Note 45 to the financial statements.
About TNB
Our Business
Business Context
Performance Review
Sustainability Statement
The Strength of Our Governance
Financial Statements
Additional Information
p.172 Notes to the Financial Statements
4 CRITICAL ACCOUNTING ESTIMATES AND JUDGEMENTS (CONTINUED)
The estimates and assumptions that have a significant risk of causing a material adjustment to the carrying amounts of assets and liabilities within the next financial year are outlined below: (continued)
(i) Estimation of income taxes
(i) Income tax
Income tax is estimated based on the rules governed under the Income Tax Act, 1967.
Differences in determining the capital allowances, deductibility of certain expenses and subsequent utilisation of reinvestment allowance may arise during the estimation of the provision for income tax between tax calculated at the statement of financial position date, and the final submission to the tax authority as a result of obtaining further detailed information that may become available subsequent to the statement of financial position date.
Where the final tax outcome of these matters is different from the amounts that were initially recognised, such differences will impact the income tax provisions and deferred tax balance in the period in which such determination is made.
The Group and Company have recorded tax recoverable for which the Group and Company believe that there is a reasonable basis for recognition. Where the final tax outcome of this matter is different from the amount that was initially recorded, such difference may cause a material adjustment to the carrying amount of the tax recoverable balance recorded in the period in which such determination is made.
On 23 November 2015, Inland Revenue Board (‘IRB’) had disallowed the Company’s reinvestment allowance (‘RIA’) claims for Year Assessment 2013 and 2014 and had issued notices of additional assessments (‘Notices’) of RM2,068.2 million to the Company. The Company had filed an appeal to the Special Commissioners of the Income Tax (‘SCIT’) on the Notices.
As at 31 December 2018, the Group and Company recorded a tax recoverable of RM1,765.1 million from Inland Revenue Board (‘IRB’) arising from the resubmission of tax computations in the financial year ended 31 August 2014, pursuant to the explicit approval given by IRB on 21 January 2013 on the eligibility of the Company in claiming the RIA.
In addition, the Group and Company have not recorded the potential additional tax liability arising from the tax impact if the RIA claimed is disallowed and the Company loses its appeal. The realisation of this tax recoverable and the potential tax liability is dependent on the outcome of judgement on the RIA claims by the SCIT and by the Kuala Lumpur High Court, including if there is a subsequent appeal by either party, as disclosed in Note 42 to the financial statements.
The Directors have performed an assessment on the tax recoverable of RM1,765.1 million and the potential tax liability based on a legal view obtained from external legal counsel and the facts surrounding its RIA claims. The Directors have exercised judgement that there is sufficient evidence and case law to support the Company’s appeal against the Notices.
(ii) Deferred tax assets
Deferred tax assets are recognised to the extent that it is probable that taxable profit will be available against which the deductible temporary differences or unused tax losses can be utilised. This involves judgement regarding the future financial performance of the particular entity in which the deferred tax asset has been recognised.

About TNB
Our Business
Business Context
Performance Review
Sustainability Statement
The Strength of Our Governance
Financial Statements
Additional InformationIntegrated Annual Report 2018
Tenaga Nasional Berhad
p.173 Notes to the Financial Statements
4 CRITICAL ACCOUNTING ESTIMATES AND JUDGEMENTS (CONTINUED)
The estimates and assumptions that have a significant risk of causing a material adjustment to the carrying amounts of assets and liabilities within the next financial year are outlined below: (continued)
(j) Post-employment employee benefits
The Group and Company provide both Retirement Benefit Plan and Post Retirement Medical Plan for certain employees. The present value of the employee benefits obligations depends on a number of factors that are determined on an actuarial basis using certain assumptions. The key assumptions used in determining the net cost/(income) for the employee benefits include discount rate, medical claim inflation rate and salary increment rate. Any changes in these assumptions will impact the carrying amount of employee benefits obligations, as disclosed in Note 33.
• Discount rate
The Group and Company determine the appropriate discount rate at the end of each financial period. This is the interest rate that should be used to determine the present value of estimated future cash outflows expected to be required to settle the pension obligations. In determining the appropriate discount rate, the Group and Company consider the interest rates of high-quality corporate bonds that are denominated in the currency in which the benefits will be paid and that have terms to maturity approximating the terms of the related employee benefits obligation.
• Medical claim inflation rate
The medical claim inflation rate for general practitioner, hospitalisation, specialist and dialysis medical claims, as determined by the Group and Company are based on the annualised increase in average claims over the past 7 years.
• Salary increment rate
The salary increment rate for employees receiving the Retirement Benefit Plan as determined by the Group and Company is based on the average salary increment rate for the past 8 years and considerations for price inflation, real salary increase, promotions and Collective Agreement (‘CA’) negotiation.
(k) Fair value of LTIP
The Group introduces an equity-settled share-based compensation plan under which the entity receives services from employees as consideration for equity instruments of the Group.
The Group and Company measure the equity-settled share-based payments by reference to the fair value of the equity instruments at the date which they are granted, and revise the estimated number of shares that are expected to vest at the reporting period.
Estimating fair value for share-based payment transactions requires determining the most appropriate valuation model (i.e. Monte Carlo simulation model). The estimate requires determining the most appropriate inputs to the valuation model including the expected life of the share scheme, volatility and dividend yield and making assumptions about them, as disclosed in Note 7 to the financial statements.

About TNB
Our Business
Business Context
Performance Review
Sustainability Statement
The Strength of Our Governance
Financial Statements
Additional Information
p.174 Notes to the Financial Statements
5 REVENUE
Accounting Policy
Revenue which represents income arising in the course of the Group’s and Company’s ordinary activities is recognised by reference to each distinct performance obligation promised in the contract with customer. Revenue from contracts with customers is measured at its transaction price, being the amount of consideration which the Group and Company expect to be entitled in exchange for transferring promised goods or services to a customer, net of goods and service tax, returns, rebates and discounts. Transaction price is allocated to each performance obligation on the basis of the relative stand-alone selling prices of each distinct good or services promised in the contract. Depending on the substances of the respective contract with the customer, revenue is recognised when the performance obligation is satisfied, which may be at a point in time or over time.
The Group and Company do not expect any contracts where the period between the transfer of the promised goods or services to the customer and payment by the customer exceeds one year. As a consequence, the Group and Company do not adjust any of the transaction prices for the time value of money.
(a) Electricity revenue
Revenue from the supply of electricity in Peninsular Malaysia is regulated based on certain formulae and parameters as set out in the regulatory implementation guidance under the Incentive Based Regulation (‘IBR’) framework and as agreed with the Ministry of Energy, Science, Technology, Environment and Climate Change.
The contract with customers is for the supply of electricity in accordance to the Tariff rates pursuant to the provision of the Electricity Supply Act 1990. Collection of the contract consideration from customers is considered probable.
The promise to supply electricity represents a promise to transfer a series of distinct goods that are substantially the same and
that have the same pattern of transfer to the customer. The performance obligation to deliver electricity is satisfied over time as the customers simultaneously received and consumed the benefits provided by the Group and Company’s performance. Hence, electricity revenue is recognised over time by the Group and Company when electricity is consumed by customers.
Generally, customers are billed on a monthly basis. As the amount at which the Group and Company have a right to invoice, corresponds directly with the value to the customer, the revenue from electricity sales is also recognised on a monthly basis. Payment should be made by customers within 30 days from the date the bill is issued. A penalty charge will be imposed if payment is made later than 30 days after the bill date.
Electricity revenue includes an estimated value of the electricity consumed by customers from the date of their last meter reading and reporting period end. Accrued unbilled revenues recognised as contract assets are reversed the following month when actual billings occur.
ICPT, a mechanism established under the IBR allows the Company to pass through the volatility in fuel and other generation specific costs (termed as the ‘Single Buyer Generation Cost’) to the consumers, such that the Company remains financially neutral. The Company’s claims and undertakings under the ICPT mechanism are such that any over or under-recovery of costs would be payable to or reimbursable from the Government, and would be recognised as part of revenue in the period the costs are incurred. Actual base tariff billed to the customer remains unchanged.
Included in the revenue, is the ARA for the over recovery of revenue and other income earned during the year. The Company has taken into account the principles laid out in the Guidelines on Electricity Tariff Determination under the IBR for Peninsular Malaysia 2018, where the allowed revenue in each year is calculated as the sum of actual revenue earned and any applicable adjustments, such as those related to the revenue-cap, price-cap and other income adjustment mechanisms as described in the Guidelines. Other income which is earned from services not directly related to electricity supply, but which are provided using the assets and/or staff of a licensee is deducted from the revenues to be earned from regulated tariffs.
(b) Goods and services
(i) Sale of goods
Sale of goods is recognised when control of the products has transferred, being when the products are delivered to the customer and there is no unfulfilled obligation that could affect the customer’s acceptance of the products. Delivery occurs when the products have been transported to the specific location, the risks of obsolescence and loss have been transferred to the customer, and either the customer has accepted the products in accordance with the sales contract, the acceptance provisions have lapsed, or the Group has objective evidence that all criteria for acceptance have been satisfied.
About TNB
Our Business
Business Context
Performance Review
Sustainability Statement
The Strength of Our Governance
Financial Statements
Additional InformationIntegrated Annual Report 2018
Tenaga Nasional Berhad
p.175 Notes to the Financial Statements
5 REVENUE (CONTINUED)
Accounting Policy (continued)
(b) Goods and services (continued)
(i) Sale of goods (continued)
Revenue from these sales is recognised based on the price specified in the contract, net of the estimated discounts. Accumulated experience is used to estimate and provide for the discounts, using the expected value method, and revenue is only recognised to the extent that it is highly probable that a significant reversal will not occur. No element of financing is deemed present as the sales are made with a credit term of on average 30 to 60 days, which is consistent with market practice. The Group’s obligation to repair or replace faulty products under the standard warranty terms is recognised as a provision.
A receivable is recognised when the goods are delivered as this is the point in time that the consideration is unconditional because only the passage of time is required before the payment is due.
(ii) Rendering of services
Revenue from providing services is recognised over the period in which the services are rendered. Revenue is recognised based on the actual service provided to the end of the reporting period as a proportion of the total services to be provided because the customer received and uses the benefits simultaneously.
In cases of fixed-price contracts, the customer pays the fixed amount based on a payment schedule. If the services rendered exceed the payment, a contract asset is recognised. If the payments exceed the services rendered, a contract liability is recognised.
If the contract includes hourly fees, revenue is recognised in the amount to which the Group has a right to invoice. The amounts are billed within 60 to 180 days from satisfying the performance obligation and payment is expected within 30 days from the billing date.
(c) Construction contracts
Construction contracts revenue is recognised over time or at a point in time in accordance to performance obligations satisfied. Where revenue is recognised over time, the satisfaction of performance obligation is by reference to the stage of completion which is assessed by reference to the contract costs incurred over the total estimated costs for each contract as at the reporting date. Otherwise, revenue is recognised at a point in time when the customer obtains control of the assets. The related costs are recognised in profit or loss when they are incurred.
Where the contracts include multiple performance obligations, the transaction price will be allocated to each performance obligation based on the stand-alone selling prices. Where these are not directly observable, they are estimated based on expected cost plus margin. If contracts include sale of goods as a separate performance obligation, revenue from this sale is recognised at a point in time when the goods are delivered, the legal title has passed and the customer has accepted the goods.
When the consideration of a construction contract cannot be estimated reliably, contract revenue is recognised only to the extent of contract costs incurred that are likely to be recoverable. An expected loss on a contract is recognised immediately in the statement of profit or loss.
Estimates of revenues, costs or extent of progress toward completion are revised if circumstances change. Any resulting increases or decreases in estimated revenues or costs are reflected in profit or loss in the period in which the circumstances that give rise to the revision become known by management.
Advances received are now included in contract liabilities.
The amounts will be billed within 60 to 180 days for satisfying the performance obligations and payment is expected within 30 days from billing date.
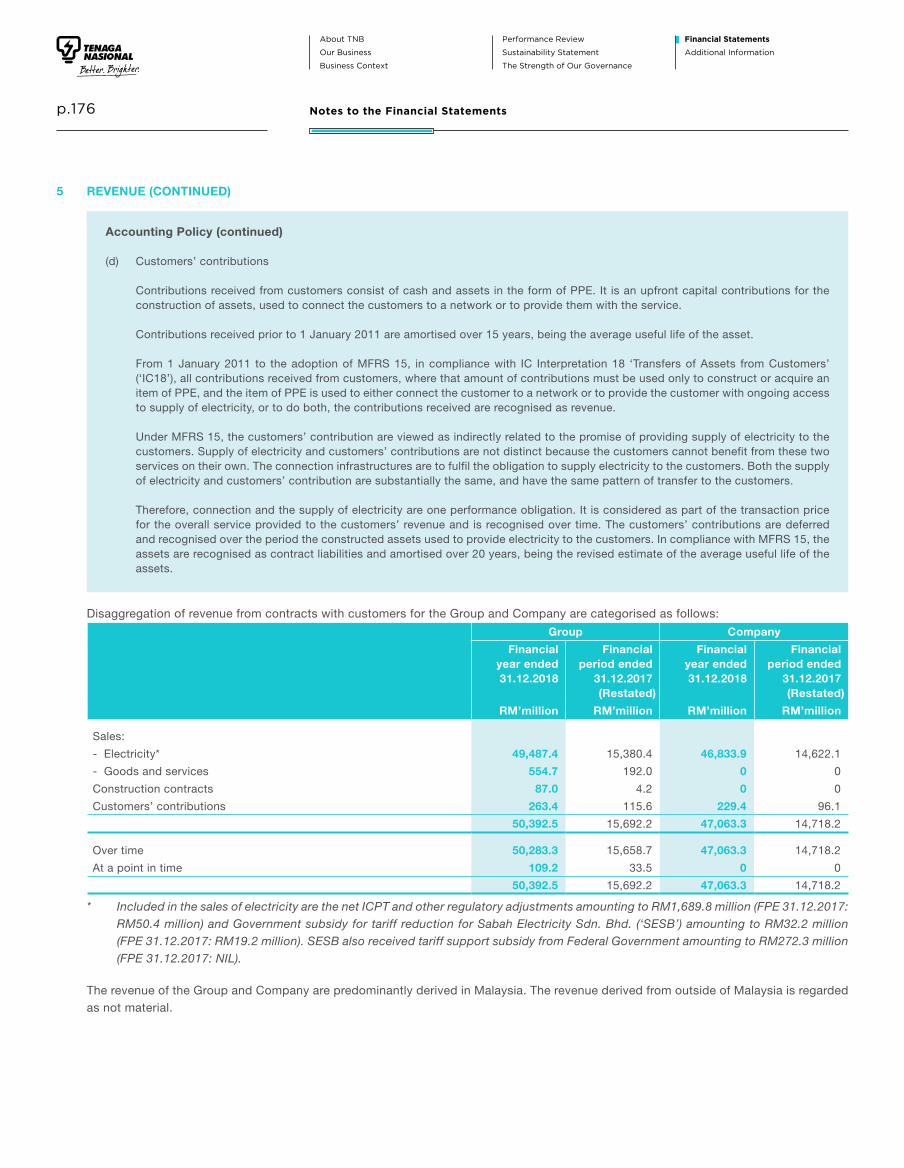
About TNB
Our Business
Business Context
Performance Review
Sustainability Statement
The Strength of Our Governance
Financial Statements
Additional Information
p.176 Notes to the Financial Statements
5 REVENUE (CONTINUED)
Accounting Policy (continued)
(d) Customers’ contributions
Contributions received from customers consist of cash and assets in the form of PPE. It is an upfront capital contributions for the construction of assets, used to connect the customers to a network or to provide them with the service.
Contributions received prior to 1 January 2011 are amortised over 15 years, being the average useful life of the asset.
From 1 January 2011 to the adoption of MFRS 15, in compliance with IC Interpretation 18 ‘Transfers of Assets from Customers’ (‘IC18’), all contributions received from customers, where that amount of contributions must be used only to construct or acquire an item of PPE, and the item of PPE is used to either connect the customer to a network or to provide the customer with ongoing access to supply of electricity, or to do both, the contributions received are recognised as revenue.
Under MFRS 15, the customers’ contribution are viewed as indirectly related to the promise of providing supply of electricity to the customers. Supply of electricity and customers’ contributions are not distinct because the customers cannot benefit from these two services on their own. The connection infrastructures are to fulfil the obligation to supply electricity to the customers. Both the supply of electricity and customers’ contribution are substantially the same, and have the same pattern of transfer to the customers.
Therefore, connection and the supply of electricity are one performance obligation. It is considered as part of the transaction price for the overall service provided to the customers’ revenue and is recognised over time. The customers’ contributions are deferred and recognised over the period the constructed assets used to provide electricity to the customers. In compliance with MFRS 15, the assets are recognised as contract liabilities and amortised over 20 years, being the revised estimate of the average useful life of the assets.
Disaggregation of revenue from contracts with customers for the Group and Company are categorised as follows:
Group Company
Financialyear ended31.12.2018
Financialperiod ended
31.12.2017(Restated)
Financialyear ended31.12.2018
Financialperiod ended
31.12.2017(Restated)
RM’million RM’million RM’million RM’million
Sales:
- Electricity* 49,487.4 15,380.4 46,833.9 14,622.1
- Goods and services 554.7 192.0 0 0
Construction contracts 87.0 4.2 0 0
Customers’ contributions 263.4 115.6 229.4 96.1
50,392.5 15,692.2 47,063.3 14,718.2
Over time 50,283.3 15,658.7 47,063.3 14,718.2
At a point in time 109.2 33.5 0 0
50,392.5 15,692.2 47,063.3 14,718.2
* Included in the sales of electricity are the net ICPT and other regulatory adjustments amounting to RM1,689.8 million (FPE 31.12.2017: RM50.4 million) and Government subsidy for tariff reduction for Sabah Electricity Sdn. Bhd. (‘SESB’) amounting to RM32.2 million (FPE 31.12.2017: RM19.2 million). SESB also received tariff support subsidy from Federal Government amounting to RM272.3 million (FPE 31.12.2017: NIL).
The revenue of the Group and Company are predominantly derived in Malaysia. The revenue derived from outside of Malaysia is regarded as not material.
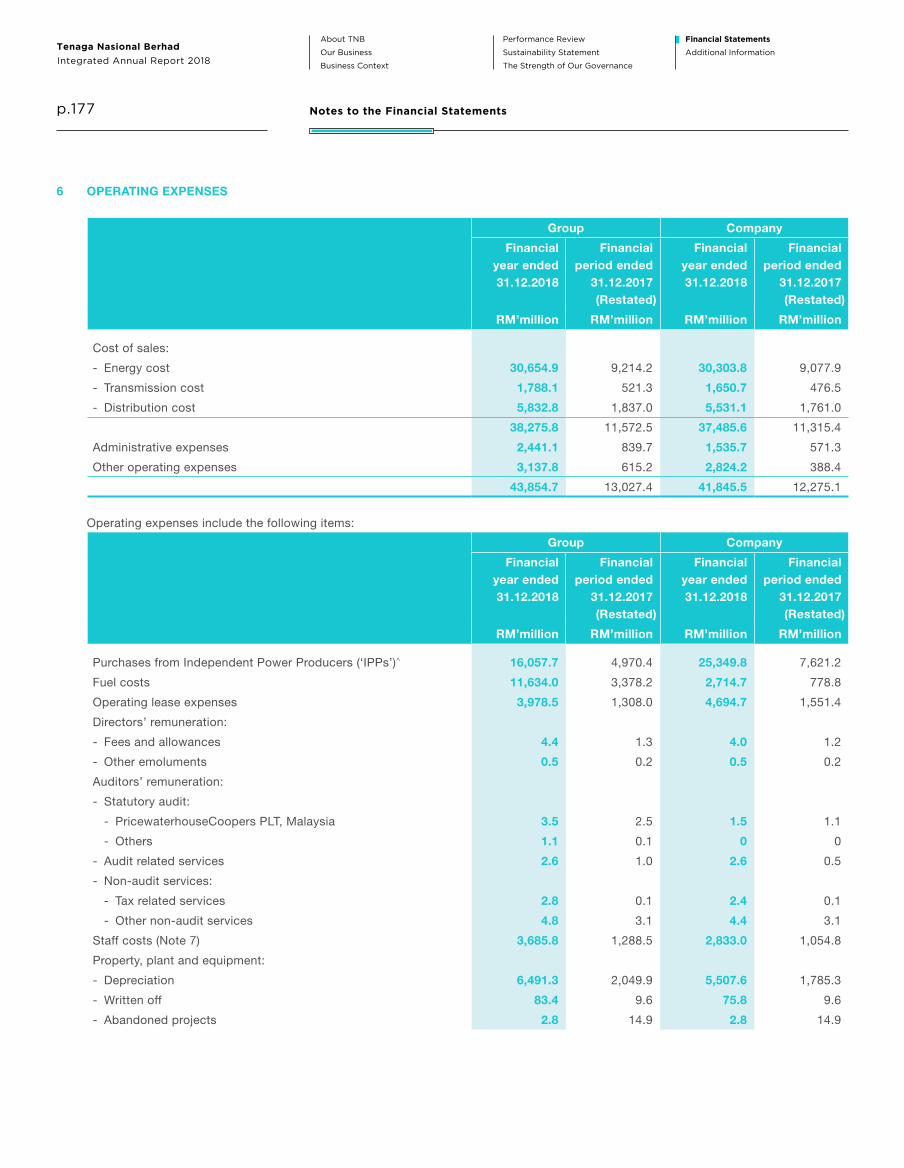
About TNB
Our Business
Business Context
Performance Review
Sustainability Statement
The Strength of Our Governance
Financial Statements
Additional InformationIntegrated Annual Report 2018
Tenaga Nasional Berhad
p.177 Notes to the Financial Statements
6 OPERATING EXPENSES
Group Company
Financialyear ended31.12.2018
Financialperiod ended
31.12.2017(Restated)
Financialyear ended31.12.2018
Financialperiod ended 31.12.2017
(Restated)
RM’million RM’million RM’million RM’million
Cost of sales:
- Energy cost 30,654.9 9,214.2 30,303.8 9,077.9
- Transmission cost 1,788.1 521.3 1,650.7 476.5
- Distribution cost 5,832.8 1,837.0 5,531.1 1,761.0
38,275.8 11,572.5 37,485.6 11,315.4
Administrative expenses 2,441.1 839.7 1,535.7 571.3
Other operating expenses 3,137.8 615.2 2,824.2 388.4
43,854.7 13,027.4 41,845.5 12,275.1
Operating expenses include the following items:
Group Company
Financialyear ended31.12.2018
Financialperiod ended
31.12.2017(Restated)
Financialyear ended31.12.2018
Financialperiod ended 31.12.2017
(Restated)
RM’million RM’million RM’million RM’million
Purchases from Independent Power Producers (‘IPPs’)^ 16,057.7 4,970.4 25,349.8 7,621.2
Fuel costs 11,634.0 3,378.2 2,714.7 778.8
Operating lease expenses 3,978.5 1,308.0 4,694.7 1,551.4
Directors’ remuneration:
- Fees and allowances 4.4 1.3 4.0 1.2
- Other emoluments 0.5 0.2 0.5 0.2
Auditors’ remuneration:
- Statutory audit:
- PricewaterhouseCoopers PLT, Malaysia 3.5 2.5 1.5 1.1
- Others 1.1 0.1 0 0
- Audit related services 2.6 1.0 2.6 0.5
- Non-audit services:
- Tax related services 2.8 0.1 2.4 0.1
- Other non-audit services 4.8 3.1 4.4 3.1
Staff costs (Note 7) 3,685.8 1,288.5 2,833.0 1,054.8
Property, plant and equipment:
- Depreciation 6,491.3 2,049.9 5,507.6 1,785.3
- Written off 83.4 9.6 75.8 9.6
- Abandoned projects 2.8 14.9 2.8 14.9

About TNB
Our Business
Business Context
Performance Review
Sustainability Statement
The Strength of Our Governance
Financial Statements
Additional Information
p.178 Notes to the Financial Statements
6 OPERATING EXPENSES (CONTINUED)
Operating expenses include the following items: (continued)
Group Company
Financialyear ended31.12.2018
Financialperiod ended
31.12.2017(Restated)
Financialyear ended31.12.2018
Financialperiod ended 31.12.2017
(Restated)
RM’million RM’million RM’million RM’million
Impairment losses on investment in:
- Subsidiaries 0 0 1,661.6 43.1
- Associates 802.7 0 0 0
Inventories:
- Provision for obsolescence 293.4 69.9 292.9 69.9
- Write back of obsolescence (278.6) (62.9) (278.6) (62.9)
- Written off 27.6 0.2 23.1 0.2
Rental of land and buildings 53.0 18.8 51.0 16.0
Rental of plant and machinery 71.4 12.1 71.3 12.1
Research and development expenses 157.7 35.9 157.7 34.7
Receipt of Government subsidies# (124.7) (70.5) 0 0
^ These include amounts related to the Electricity Industry Fund amounting to RM43.6 million (FPE 31.12.2017: RM11.2 million).# This represents the subsidies that SESB received for diesel and medium fuel oil from the Government of Malaysia. The total amount
credited in the current year/period has been offsetted against energy cost.
The estimated monetary value of benefits received by the Directors was RM506,806 (FPE 31.12.2017: RM202,090) for the Group and Company.
All non-audit services were procured competitively in accordance with TNB Procurement Policies and Procedures. Non-audit services can be offered by the external auditors of the Group if there are clear efficiencies and value added benefits to the Group.
7 STAFF COST
Group Company
Financialyear ended31.12.2018
Financialperiod ended
31.12.2017
Financialyear ended31.12.2018
Financialperiod ended 31.12.2017
RM’million RM’million RM’million RM’million
Wages, salaries and bonuses 1,939.6 771.5 1,348.2 605.3
Defined contribution retirement plan 403.8 106.1 327.3 87.1
Long Term Incentive Plan 267.8 66.3 205.5 50.1
Retirement benefit plan 165.6 59.3 145.2 51.7
Post retirement medical plan 561.8 189.5 538.4 181.7
Other employee benefits 347.2 95.8 268.4 78.9
3,685.8 1,288.5 2,833.0 1,054.8

About TNB
Our Business
Business Context
Performance Review
Sustainability Statement
The Strength of Our Governance
Financial Statements
Additional InformationIntegrated Annual Report 2018
Tenaga Nasional Berhad
p.179 Notes to the Financial Statements
7 STAFF COST (CONTINUED)
Details of the retirement benefit and retirement medical plans of the Group and Company are set out in Note 33 to the financial statements.
Long Term Incentive Plan (‘LTIP’)
The Group operates an equity-settled share-based compensation plan under which the entity receives services from employees as consideration for equity instruments of the Group.
The fair value of the employee services received in exchange for the grant of the Company’s shares is recognised as an expense in the statement of profit or loss over the vesting period of the grant, with a corresponding increase in share-based payment reserve in equity.
The total amount to be expensed over the vesting period is determined by reference to the fair value of the shares granted.
Non-market vesting conditions are included in the assumptions to arrive at the number of shares that are expected to vest. At the end of the reporting period, the Group and Company revise its estimate of the number of shares that are expected to vest. The impact of the revision of original estimates, if any, is recognised in the statement of profit or loss, with a corresponding adjustment to share-based payment reserve in equity.
The fair value of shares granted to employees of subsidiaries is allocated to the subsidiaries.
The Company implemented a LTIP on 30 April 2015 for a period of 10 years. The LTIP is governed by the by-laws, which was approved by the shareholders at an Extraordinary General Meeting on 18 December 2014. LTIP is intended to allow the Company to award the grant of new shares to be vested to selected employees for the attainment of identified performance objectives.
(a) The main features of the LTIP
The LTIP comprises a Restricted Share Grant (‘RS Grant’) and a Performance Share Grant (‘PS Grant’). The main difference in the features of the RS Grant and the PS Grant is the eligibility of the selected employees in terms of their job grades in the Group and the performance targets and/or performance conditions to be met prior to the offer and vesting of the grant to the selected employees.
The details of the grant are as follows:
(i) RS Grant
The RS Grant is a restricted share grant for all eligible employees selected on a basis designated by the LTIP Committee. The RS Grant will be awarded annually to the selected employees to be vested over a period of 3 years on pro-rata basis and after fulfillment of individual performance targets based on the Group’s performance management system (such as individual performance rating) and certain performance conditions (such as financial targets) as determined by the LTIP Committee from time to time at its discretion in accordance with the terms and conditions of the LTIP.
(ii) PS Grant
The PS Grant is a performance share grant for senior executives of the Group and Executive Director as well as key employees of the Group selected on a basis designated by the LTIP Committee. The PS Grant will be awarded annually to the selected employees to be vested at the end of the 3-year period and after fulfilment of certain performance targets and/or conditions at the time of grant and vesting, which may include, among other factors, total shareholders’ return and the long term financial performance targets/ratios of the Group as determined by the LTIP Committee from time to time at its discretion in accordance with the terms and conditions of the LTIP. At the point of vesting, the final award of the PS Grant is based on a multiple of the initial grant whereby the multiple is determined according to the performance targets and/or conditions. In the event the performance targets and/or conditions are not met by the selected employees, the grant will not be vested to them at the end of the performance period.
The new ordinary shares to be allotted and issued upon the vesting of the ordinary shares pursuant to the RS Grant and PS Grant will not be subjected to any retention period or restriction on transfer.

About TNB
Our Business
Business Context
Performance Review
Sustainability Statement
The Strength of Our Governance
Financial Statements
Additional Information
p.180 Notes to the Financial Statements
7 STAFF COST (CONTINUED)
Long Term Incentive Plan (‘LTIP’) (continued)
(a) The main features of the LTIP (continued)
The details of the grant are as follows: (continued)
(ii) PS Grant (continued)
In implementing the LTIP, the grant will be satisfied by way of allotment and issuance of new ordinary shares to the respective RS and PS grantees upon vesting of the grant.
The LTIP Committee shall decide from time to time at its discretion to determine or vary the terms and conditions of the offer, such as the eligibility criteria and allocation in each grant, the timing and frequency of the award of the grant, the performance targets and/or performance conditions to be met prior to the offer and vesting of the grant and the vesting period.
(b) Maximum number of new ordinary shares available under the LTIP
The maximum number of new ordinary shares which may be made available under the LTIP and/or allotted and issued upon vesting of the new ordinary shares under the LTIP shall not be more than 10.0% of the issued and paid-up ordinary share capital of the Company (excluding treasury shares) at any point in time during the duration of the LTIP.
(c) Basis of allocation and maximum allowable allotment
The total number of new ordinary shares that may be offered to any one of the selected employees and/or to be vested in any one of the grantees under the LTIP at any time shall be at the discretion of the LTIP Committee (subject to the by-laws and any applicable law).
(d) Eligibility
Employees of the Group and Company (including the Executive Director) who meet the following criteria as at the date of offer shall be eligible to be considered as an eligible employee to participate in the LTIP: (i) has attained the age of 18 years;(ii) has entered into a full-time or fixed-term contract of employment with, and is on the payroll of any company within the Group and
has not served a notice of resignation or received a notice of termination;(iii) whose service/employment has been confirmed in writing;(iv) is not a non-executive or independent director of the Company; and(v) has fulfilled any other eligibility criteria which has been determined by the LTIP Committee at its discretion from time to time, as the
case may be.
The LTIP Committee may determine any other eligibility criteria for the purpose of selecting an eligible employee at any time and from time to time, at its discretion.
(e) Ranking of the new ordinary shares
The new ordinary shares to be allotted and issued pursuant to the LTIP shall, upon allotment and issuance, rank equally in all respects with the then existing issued ordinary shares.
The new ordinary shares to be allotted and issued pursuant to the vesting of the grant under the LTIP shall not be entitled to any dividends, rights, allotments and/or any other distributions, for which the entitlement date is prior to the date on which the new ordinary shares are credited into the Central Depository System (‘CDS’) accounts of the respective grantees upon vesting of the grant under the LTIP.
(f) Alteration of share capital and adjustment
If the LTIP Committee so decides (but not otherwise), in the event of any alteration in the capital structure of the Company during the duration of LTIP, which expires on 29 April 2025, such corresponding alterations (if any) may be made to the LTIP in:(i) the number of unvested new ordinary shares comprised in a grant; and/or(ii) the method and/or manner in the vesting of the new ordinary shares comprised in a grant.

About TNB
Our Business
Business Context
Performance Review
Sustainability Statement
The Strength of Our Governance
Financial Statements
Additional InformationIntegrated Annual Report 2018
Tenaga Nasional Berhad
p.181 Notes to the Financial Statements
7 STAFF COST (CONTINUED)
Long Term Incentive Plan (‘LTIP’) (continued)
The movement in the total number of share grants during the financial year/period is as follows:
Financial year ended 31 December 2018
Group Company
At
1.1.2018
‘000
Granted
‘000
Additional*
‘000
Forfeited
‘000
Vested
‘000
At
31.12.2018
‘000
At
1.1.2018
‘000
Granted
‘000
Additional*
‘000
Forfeited
‘000
Vested
‘000
At
31.12.2018
‘000
LTIP 1
RS Grant 5,938.2 0 0 (398.6) (5,539.6) 0 4,556.7 0 0 (365.0) (4,191.7) 0
PS Grant 2,067.0 0 1,575.5 (473.9) (3,168.6) 0 1,817.4 0 1,355.7 (416.7) (2,756.4) 0
LTIP 2
RS Grant 10,619.6 0 0 (667.8) (5,386.3) 4,565.5 8,446.6 0 0 (602.8) (4,270.5) 3,573.3
PS Grant 1,883.1 0 0 (282.2) 0 1,600.9 1,697.8 0 0 (268.6) 0 1,429.2
LTIP 3
RS Grant 20,299.7 0 0 (1,663.7) (6,808.0) 11,828.0 15,381.3 0 0 (1,322.6) (5,238.0) 8,820.7
PS Grant 2,123.4 0 0 (209.5) 0 1,913.9 1,875.8 0 0 (202.7) 0 1,673.1
LTIP 4
RS Grant 0 18,571.6 0 (540.7) 0 18,030.9 0 14,148.3 0 (463.2) 0 13,685.1
PS Grant 0 2,058.1 0 (73.4) 0 1,984.7 0 1,822.0 0 (63.2) 0 1,758.8
* The final amount of vesting under PS01 is in accordance with terms and condition approved by the Board Nomination and Remuneration Committee (‘BNRC’) LTIP/Board as stated in Note 7(a)(ii) above.
Financial period ended 31 December 2017
Group Company
At
1.9.2017
‘000
Transfer
‘000
Forfeited
‘000
Vested
‘000
At
31.12.2017
‘000
At
1.9.2017
‘000
Transfer
‘000
Forfeited
‘000
Vested
‘000
At
31.12.2017
‘000
LTIP 1
RS Grant 13,177.8 0 (268.4) (6,971.2) 5,938.2 10,229.7 (153.7) (130.9) (5,388.4) 4,556.7
PS Grant 2,067.0 0 0 0 2,067.0 1,815.7 1.7 0 0 1,817.4
LTIP 2
RS Grant 10,815.6 0 (196.0) 0 10,619.6 8,679.2 (130.8) (101.8) 0 8,446.6
PS Grant 1,883.1 0 0 0 1,883.1 1,692.8 5.0 0 0 1,697.8
LTIP 3
RS Grant 20,609.9 0 (310.2) 0 20,299.7 15,785.3 (159.1) (244.9) 0 15,381.3
PS Grant 2,123.4 0 0 0 2,123.4 1,879.5 (3.7) 0 0 1,875.8

About TNB
Our Business
Business Context
Performance Review
Sustainability Statement
The Strength of Our Governance
Financial Statements
Additional Information
p.182 Notes to the Financial Statements
7 STAFF COST (CONTINUED)
Long Term Incentive Plan (‘LTIP’) (continued)
The fair value of the share granted is estimated using the Monte Carlo Simulation Model with the following inputs:
Group and Company
LTIP 1 LTIP 2 LTIP 3 LTIP 4
RS Grant PS Grant RS Grant PS Grant RS Grant PS Grant RS Grant PS Grant
Fair value at grant date RM10.46 - RM8.70^ RM12.87 - RM12.04^ RM12.33 - RM11.67^ RM13.96 - RM12.60^
RM10.96 RM13.53 RM13.21 RM15.21
Share price at grant date RM11.18 RM11.18 RM13.88 RM13.88 RM13.74 RM13.74 RM15.92 RM15.92
Expected volatility* 18.5% 18.5% 18.9% 18.9% 16.5% 16.5% 13.3% 13.3%
Expected dividend yield 2.3% 2.3% 2.5% 2.5% 3.6% 3.6% 4.4% 4.4%
Risk-free interest rate** 3.8% 3.8% 3.0% 3.0% 3.5% 3.5% 3.4% 3.5%
Grant date 3 August 3 August 1 April 1 April 28 March 28 March 18 April 18 April
2015 2015 2016 2016 2017 2017 2018 2018
Vesting date 28 November 30 April 30 April 30 April
2018 2019 2020 2021
- Tranche 1 15 November - 2 May - 30 April - 30 April -
2016 2017 2018 2019
- Tranche 2 23 November - 30 April - 30 April - 30 April -
2017 2018 2019 2020
- Tranche 3 28 November - 30 April - 30 April - 30 April -
2018 2019 2020 2021^ Market considerations have been included in the consideration of fair value.* Expected volatility is based on TNB’s 3 year average daily historical volatility.** Risk-free interest is based on Malaysian Government Securities yield.

About TNB
Our Business
Business Context
Performance Review
Sustainability Statement
The Strength of Our Governance
Financial Statements
Additional InformationIntegrated Annual Report 2018
Tenaga Nasional Berhad
p.183 Notes to the Financial Statements
8 OTHER OPERATING INCOME
Group Company
Financialyear ended31.12.2018RM’million
Financialperiod ended
31.12.2017RM’million
Financialyear ended31.12.2018RM’million
Financialperiod ended 31.12.2017
RM’million
Dividend income from:
- Quoted shares 0 0.9 0 0.9
- Subsidiaries 0 0 64.0 0
- Associates 0 0 26.4 18.0
Leasing income 27.1 13.1 19.4 11.2
Rental income 16.0 7.8 38.0 15.7
Release of Government development grants (Note 37) 51.5 190.0 0 0
Gain on disposals of PPE 6.2 9.1 6.2 9.1
Interest on late payments 247.6 84.0 240.6 82.4
Minimum charges 41.7 13.4 41.7 13.4
Gain on redemption of redeemable preference shares in subsidiaries 0 0 213.9 30.6
Sundry receipts 82.0 75.7 85.1 75.7
Project management and consultancy 0 0 277.1 0
Theft of electricity 163.1 46.0 162.2 45.0
Other income 189.9 72.6 145.1 58.7
825.1 512.6 1,319.7 360.7
Other income comprises primarily of income from sales of scrap and rechargeable works.
Accounting Policy
Other operating income are the non-core revenue received for sales of goods and services rendered by the Group and Company. Leasing income is accrued, unless collectability is in doubt. Dividend income is recognised when the shareholders’ rights to receive payment is established. All others are recognised upon completion of the rendering of services or sale not in ordinary course of the Group and Company’s business.

About TNB
Our Business
Business Context
Performance Review
Sustainability Statement
The Strength of Our Governance
Financial Statements
Additional Information
p.184 Notes to the Financial Statements
9 FOREIGN EXCHANGE (LOSS)/GAIN
Accounting Policy
(a) Functional and presentation currency
Items included in the financial statements of each of the Group’s entities are measured using the currency of the primary economic environment in which the entity operates (the ‘functional currency’). The financial statements are presented in Ringgit Malaysia (‘RM’), which is the Company’s functional and presentation currency.
(b) Transactions and balances
Foreign currency transactions are translated into the functional currency using the exchange rates prevailing at the dates of the transactions or valuation where items are remeasured. Foreign exchange gains and losses resulting from the settlement of such transactions and from the translation at year/period end exchange rates of monetary assets and liabilities denominated in foreign currencies are recognised in the statement of profit or loss. However, exchange differences are deferred in OCI when they are attributable to items that form part of the net investment in a foreign operation.
(c) Group companies
The results and financial positions of the Group’s entities (none of which has the currency of a hyperinflationary economy) that have functional currencies which are different from the presentation currency are translated into the presentation currency as follows:(i) assets and liabilities for each statement of financial position presented are translated at the closing rate at the date of
that statement of financial position;(ii) income and expenses for each statement of profit or loss and OCI are translated at average exchange rates (unless this
average is not a reasonable approximation of the cumulative effect of the rates prevailing on the transaction dates, in which case income and expenses are translated at the rate on the dates of the transactions); and
(iii) all resulting exchange differences are recognised as a separate component of equity.
Goodwill and fair value adjustments arising on the acquisition of a foreign operation are treated as assets and liabilities of the foreign operation and translated at the closing rate. Exchange differences arising are recognised in OCI.
On consolidation, exchange differences arising from the translation of the net investment in foreign operations are taken to shareholders’ equity.
On the disposal of a foreign operation (that is, a disposal of the Group’s entire interest in a foreign operation, or a disposal involving loss of control over a subsidiary that includes a foreign operation, a disposal involving loss of joint control over a joint venture that includes a foreign operation, or a disposal involving loss of significant influence over an associate that includes a foreign operation), the cumulative amount of the exchange differences relating to that foreign operation recognised in OCI, and accumulated in the separate component of equity, are reclassified from equity to profit or loss, as part of the gain or loss on disposal.
In the case of a partial disposal that does not result in the Group losing control over a subsidiary that includes a foreign operation, the proportionate share of accumulated exchange differences recognised in OCI are re-attributed to NCI in that foreign operation, and are not recognised in profit or loss. For all other partial disposals (that is, reductions in the Group’s ownership interest in associates or joint ventures that do not result in the Group losing significant influence or joint control) the proportionate share of the accumulated exchange difference is reclassified to profit or loss.

About TNB
Our Business
Business Context
Performance Review
Sustainability Statement
The Strength of Our Governance
Financial Statements
Additional InformationIntegrated Annual Report 2018
Tenaga Nasional Berhad
p.185 Notes to the Financial Statements
9 FOREIGN EXCHANGE (LOSS)/GAIN (CONTINUED)
Group Company
Financialyear ended31.12.2018RM’million
Financialperiod ended
31.12.2017RM’million
Financialyear ended31.12.2018RM’million
Financialperiod ended 31.12.2017
RM’million
Foreign exchange (loss)/gain comprises:
Translation (loss)/gain – foreign term loans (185.8) 522.3 (185.8) 516.3
Translation loss – others (207.3) (192.6) (70.6) (94.8)
Total foreign exchange translation (loss)/gain (393.1) 329.7 (256.4) 421.5
Transaction (loss)/gain – foreign term loans (12.1) 2.4 (12.0) 2.4
Transaction loss – others (13.1) (21.9) (13.6) (2.3)
(418.3) 310.2 (282.0) 421.6
10 FINANCE INCOME/COST AND FAIR VALUE CHANGES OF FINANCIAL INSTRUMENTS
Accounting Policy
Finance income are interests and dividends received from investments or financial instruments.
Investment income earned on the temporary investment of specific borrowing pending their expenditure on qualifying assets is deducted from the borrowing costs eligible for capitalisation.
General and specific borrowing costs that are directly attributable to the acquisition, construction or production of a qualifying asset are capitalised during the period of time that is required to complete and prepare the asset for its intended use. Qualifying assets are assets that necessarily takes substantial period of time to get ready for their intended use.
Other borrowing costs are expensed in the period in which they are incurred.
MFRS 9 requires the fair value of financial instruments to be calculated by using the effective interest method to the gross carrying amount of a financial asset except for financial assets that subsequently become credit-impaired. For credit-impaired financial assets the effective interest rate is applied to the net carrying amount of the financial asset (after deduction of the loss allowances).
Accounting policy on finance cost for finance lease and government grants are disclosed in Note 23 and Note 37 respectively.

About TNB
Our Business
Business Context
Performance Review
Sustainability Statement
The Strength of Our Governance
Financial Statements
Additional Information
p.186 Notes to the Financial Statements
10 FINANCE INCOME/COST AND FAIR VALUE CHANGES OF FINANCIAL INSTRUMENTS (CONTINUED)
Group Company
Financialyear ended31.12.2018RM’million
Financialperiod ended
31.12.2017RM’million
Financialyear ended31.12.2018RM’million
Financialperiod ended 31.12.2017
RM’million
(a) Finance income:
Interest from subsidiaries 0 0 46.0 16.0
Interest from deposits, staff loans and associates 531.8 259.2 251.4 55.9
Less: Reduction of borrowing costs capitalised into PPE (108.0) (164.3) 0 0
423.8 94.9 297.4 71.9
(b) Finance cost:
Interest on:
- Borrowings 1,937.8 533.9 763.9 228.2
- Consumer deposits 136.4 44.0 128.9 41.6
- Others 317.9 124.2 36.7 12.2
Release of Government grants (Note 37) (27.4) (6.8) 0 0
Finance charges under finance leases (Note 23) 347.6 123.4 1,125.3 365.4
Less: Amount capitalised into PPE (1,023.8) (287.3) (260.5) (83.4)
1,688.5 531.4 1,794.3 564.0
(c) Fair value changes of financial instruments:
Gain on changes in fair value of financial assets 44.8 37.4 22.0 27.9
(Loss)/Gain on changes in fair value of financial liabilities (8.1) (44.6) 0.2 (0.2)
36.7 (7.2) 22.2 27.7
11 TAXATION AND ZAKAT
Accounting Policy
(a) Income tax
Current tax expense is determined by the expected income taxes payable in respect of the taxable profit for the financial year and is measured using the applicable tax rates according to the tax laws of the countries in which the Company and its subsidiaries operate and generate the taxable profits.
Management periodically evaluates positions taken in tax returns with respect to situation in which applicable tax regulation is subject to interpretation. Provisions are established where appropriate on the basis of amounts expected to be paid to the tax authorities.
Tax is recognised in the profit or loss except to the extent that it relates to items recognised directly in OCI. In this case, the item is recognised in OCI, net of tax.
(b) Zakat
The Group and Company recognise its obligation towards the payment of zakat on business income in the statement of profit or loss. Zakat payment is an obligation and is accrued based on 2.5% of profit before tax and determined according to the percentage of Muslim shareholding in the Company.

About TNB
Our Business
Business Context
Performance Review
Sustainability Statement
The Strength of Our Governance
Financial Statements
Additional InformationIntegrated Annual Report 2018
Tenaga Nasional Berhad
p.187 Notes to the Financial Statements
11 TAXATION AND ZAKAT (CONTINUED)
The taxation and zakat for the Group and Company comprise:
Note
Group Company
Financialyear ended31.12.2018
Financialperiod ended
31.12.2017(Restated)
Financialyear ended31.12.2018
Financialperiod ended 31.12.2017
RM’million RM’million RM’million RM’million
Current tax:- Malaysian corporate income tax 960.5 277.4 597.5 191.6Deferred tax 20 266.8 (42.4) 423.7 (18.5)Tax expense 1,227.3 235.0 1,021.2 173.1Zakat 74.3 0 74.3 0
1,301.6 235.0 1,095.5 173.1
The analysis of the tax expense is as follows:Current tax:- Current financial year/period 962.8 277.4 581.4 191.6- (Over)/Under accrual in prior financial years (2.3) 0 16.1 0
960.5 277.4 597.5 191.6Deferred tax:- Origination and reversal of temporary differences 20 266.8 (42.4) 423.7 (18.5)
1,227.3 235.0 1,021.2 173.1
The explanation of the relationship between tax expense and profit before taxation and zakat is as follows:
Group Company
Financialyear ended31.12.2018
RM’million
Financialperiod ended 31.12.2017
(Restated)RM’million
Financialyear ended31.12.2018
RM’million
Financialperiod ended 31.12.2017
(Restated)RM’million
Profit before taxation and zakat 5,046.6 2,843.5 4,314.1 2,625.4
Tax calculated at the Malaysian corporate income tax rate of 24% (31.12.2017: 24%) 1,211.2 682.4 1,035.4 630.1
Tax effects of:- Share of results of associates and joint ventures 43.8 8.9 0 0- Income not subject to tax (284.2) (253.0) (215.5) (204.3)- Expenses not deductible for tax purposes 1,008.5 142.6 1,003.5 142.5- Expenses qualifying for double deduction (33.2) (5.2) (33.2) (5.2)- Current financial year/period unrecognised temporary differences
and unused tax losses 27.6 12.6 0 0- Foreign jurisdictions 31.8 0 0 0(Over)/Under accrual of tax in prior financial years (2.3) 0 16.1 0Recognition and utilisation of previously unrecognised temporary differences 11.0 36.7 1.8 0Zakat 74.3 0 74.3 0Utilisation of reinvestment allowances (786.9) (390.0) (786.9) (390.0)Tax and zakat charge 1,301.6 235.0 1,095.5 173.1
Average effective tax rate (%) 25.8 8.3 25.4 6.6

About TNB
Our Business
Business Context
Performance Review
Sustainability Statement
The Strength of Our Governance
Financial Statements
Additional Information
p.188 Notes to the Financial Statements
11 TAXATION AND ZAKAT (CONTINUED)
The tax charge relating to components of OCI is as follows:
Financial year ended 31.12.2018 Financial period ended 31.12.2017
Before taxRM’million
Taxcharged
RM’millionAfter tax
RM’millionBefore taxRM’million
Taxcharged
RM’millionAfter tax
RM’million
Group
Defined benefit plan actuarial loss (Note 33) (220.3) 16.0 (204.3) (139.2) 31.6 (107.6)
Foreign currency translation differences (13.1) 0 (13.1) (219.8) 0 (219.8)
AFS financial assets 0 0 0 (2.6) 0 (2.6)
Financial assets at FVOCI 7.1 0 7.1 0 0 0
Share of OCI of associates accounted for using the equity method 74.3 0 74.3 94.2 0 94.2
(152.0) 16.0 (136.0) (267.4) 31.6 (235.8)
Company
Defined benefit plan actuarial loss (Note 33) (66.7) 16.0 (50.7) (131.3) 31.5 (99.8)
AFS financial assets 0 0 0 (2.6) 0 (2.6)
Financial assets at FVOCI 7.1 0 7.1 0 0 0
(59.6) 16.0 (43.6) (133.9) 31.5 (102.4)
12 EARNINGS PER SHARE (‘EPS’)
(a) Basic earnings per share
Basic earnings per share is calculated by dividing the profit attributable to owners of the Company for the financial year/period by the weighted average number of ordinary shares issued during the financial year/period.
Group
Financialyear
ended31.12.2018
Financialperiod ended
31.12.2017
(Restated)
Profit attributable to owners of the Company (RM’million) 3,723.7 2,622.3
Weighted average number of ordinary shares in issue (’000) 5,674,992 5,661,204
Basic earnings per share (sen) 65.62 46.32

About TNB
Our Business
Business Context
Performance Review
Sustainability Statement
The Strength of Our Governance
Financial Statements
Additional InformationIntegrated Annual Report 2018
Tenaga Nasional Berhad
p.189 Notes to the Financial Statements
12 EARNINGS PER SHARE (‘EPS’) (CONTINUED)
(b) Diluted earnings per share
For the purpose of calculating diluted earnings per share, the profit attributable to owners of the Company for the financial year/period and the weighted average number of ordinary shares issued during the financial year/period has been adjusted for the dilutive effects of all potential ordinary shares such as the LTIP granted to employees.
Group
Financialyear ended31.12.2018
Financialperiod ended
31.12.2017
(Restated)
Profit attributable to owners of the Company (RM’million) 3,723.7 2,622.3
Weighted average number of ordinary shares in issue (‘000) 5,674,992 5,661,204
Adjustment for LTIP (‘000) 19,726 13,597
Weighted average number of ordinary shares for diluted earnings per share (‘000) 5,694,718 5,674,801
Diluted earnings per share (sen) 65.39 46.21
13 DIVIDENDS
Group and Company
Financialyear ended31.12.2018RM’million
Financialperiod ended
31.12.2017RM’million
Interim single tier dividend for the financial year 2018 of 30.27 sen per share on 5,678,180,571 ordinary shares
(FPE 31.12.2017: interim single tier dividend of NIL) 1,718.8 0
Proposed final single tier dividend for the financial year 2018 of 23.0 sen per share on 5,686,888,771 ordinary shares
(FPE 31.12.2017: final single tier dividend of 21.41 sen per share on 5,665,986,271 ordinary shares) 1,308.0 1,213.1
3,026.8 1,213.1
Interim dividends are paid and accounted for in shareholders’ equity as an appropriation of retained profits in the financial year.
The Directors have proposed a final single tier dividend of 23.0 sen per share, on 5,686,888,771 ordinary shares in respect of the financial year ended 31 December 2018 amounting to a total of RM1,308.0 million. The books closure and payment dates will be announced in due course.

About TNB
Our Business
Business Context
Performance Review
Sustainability Statement
The Strength of Our Governance
Financial Statements
Additional Information
p.190 Notes to the Financial Statements
14 PROPERTY, PLANT AND EQUIPMENT (‘PPE’)
Accounting Policy
PPE are stated at cost less accumulated depreciation and accumulated impairment losses. Cost includes expenditure that is directly attributable to the construction or acquisition of the items and bringing them to the location and condition so as to render them operational in the manner intended by the Group. The Group allocates the cost of an item of PPE to its significant system and component parts.
Subsequent costs are included in the asset’s carrying amount or recognised as a separate asset, as appropriate, only when it is probable that future economic benefits associated with the item will flow to the Group and the cost of the item can be measured reliably. The carrying amount of the replaced part is derecognised.
The cost of major overhaul/inspection is recognised in the asset’s carrying amount as a replacement and the remaining carrying amount of the previous major overhaul/inspection is derecognised.
Major spare parts and standby equipment are recognised as assets when the Group expects to use them during more than one period. Similarly, if the spare parts and servicing equipment can be used only in connection with an item of PPE, they are accounted for as PPE.
Gains or losses on disposal of PPE are determined by reference to their carrying amount and are included in profit or loss.
Freehold land and capital work-in-progress are not depreciated. Leasehold land classified as finance lease (Note 23) is amortised over the remaining period of the respective leases ranging from 5 to 99 years on the straight line method. Land with lease period less than 50 years is classified as short leasehold land and land with lease period greater than or equal to 50 years is classified as long leasehold land.
Other property, plant and equipment are depreciated on the straight line method to allocate the cost to their residual values over their estimated useful lives, summarised as follows:Buildings and civil works 10 - 60 yearsPlant and machinery 3 - 40 yearsLines and distribution mains 10 - 60 yearsDistribution services 20 yearsMeters 10 - 15 yearsPublic lighting 15 - 20 yearsFurniture, fittings and office equipment 3 - 15 yearsMotor vehicles 5 - 15 years
Residual values and useful lives of assets are reviewed, and adjusted if appropriate, at the end of the reporting period.
At the end of the reporting period, the Group assesses whether there is any indication of impairment. If such indication exist, an analysis is performed to assess whether the carrying amount of the asset is fully recoverable. A write down is made if the carrying amount exceeds the recoverable amount (Note 3(c)).

About TNB
Our Business
Business Context
Performance Review
Sustainability Statement
The Strength of Our Governance
Financial Statements
Additional InformationIntegrated Annual Report 2018
Tenaga Nasional Berhad
p.191 Notes to the Financial Statements
14 PROPERTY, PLANT AND EQUIPMENT (‘PPE’) (CONTINUED)
31.12.2018
As at 1.1.2018
RM’million
Exchangerate
adjustmentsRM’million
Acquisition of
subsidiariesRM’million
AdditionsRM’million
DisposalsRM’million
Transfers/Adjustments/
Reclassi-fication/
Write offsRM’million
As at31.12.2018RM’million
GroupCost Freehold land 1,478.2 (0.3) 0 405.1 0 0 1,883.0 Long leasehold land 1,889.1 0 0 100.0 (12.0) 1.0 1,978.1 Short leasehold land 186.6 0 0 0 0 3.1 189.7 Buildings and civil works 20,884.8 (0.5) 0 21.4 (131.0) 1,293.5 22,068.2
24,438.7 (0.8) 0 526.5 (143.0) 1,297.6 26,119.0 Plant and machinery: - Owned 69,948.6 (112.2) 1,039.0 381.7 (1,324.3) 2,141.8 72,074.6 - Leased 8,163.6 0 0 0 0 0 8,163.6 Lines and distribution mains 44,215.2 0 0 72.8 (25.5) 2,251.3 46,513.8 Distribution services 4,411.7 0 0 8.2 0 210.8 4,630.7 Meters 2,812.3 0 0 6.1 (15.9) 177.0 2,979.5 Public lighting 688.4 0 0 0.1 (0.2) 215.3 903.6 Furniture, fittings and office
equipment 2,221.3 (1.2) 0.2 386.1 (10.6) 5.9 2,601.7 Motor vehicles 647.3 0.8 0 26.8 (25.6) 5.5 654.8
157,547.1 (113.4) 1,039.2 1,408.3 (1,545.1) 6,305.2 164,641.3 Capital work-in-progress 18,820.4 0 0 11,087.1 (35.8) (6,547.6) 23,324.1
176,367.5 (113.4) 1,039.2 12,495.4 (1,580.9) (242.4) 187,965.4
31.12.2018
As at1.1.2018
RM’million
Chargedfor the
financial yearRM’million
Released ondisposals/Transfers/Write offs
RM’million
As at31.12.2018RM’million
GroupAccumulated depreciation Long leasehold land 332.2 28.4 (11.7) 348.9 Short leasehold land 117.0 7.2 0 124.2 Buildings and civil works 6,536.9 528.4 (99.2) 6,966.1
6,986.1 564.0 (110.9) 7,439.2 Plant and machinery: - Owned 32,079.0 3,157.1 (1,353.2) 33,882.9 - Leased 2,393.2 512.4 0 2,905.6 Lines and distribution mains 22,507.3 1,663.0 (14.0) 24,156.3 Distribution services 2,664.8 175.2 0 2,840.0 Meters 1,797.4 145.8 (8.6) 1,934.6 Public lighting 356.8 46.1 (0.2) 402.7 Furniture, fittings and office equipment 1,859.0 186.3 (18.2) 2,027.1 Motor vehicles 530.7 41.4 (26.2) 545.9
71,174.3 6,491.3 (1,531.3) 76,134.3
Accumulated impairment losses Plant and machinery - owned 385.6 0 0 385.6

About TNB
Our Business
Business Context
Performance Review
Sustainability Statement
The Strength of Our Governance
Financial Statements
Additional Information
p.192 Notes to the Financial Statements
14 PROPERTY, PLANT AND EQUIPMENT (‘PPE’) (CONTINUED)
31.12.2017
As at1.9.2017
RM’million
Exchangerate
adjustmentsRM’million
AdditionsRM’million
DisposalsRM’million
Transfers/Adjustments/
Reclassi-fication/
Write offsRM’million
As at31.12.2017RM’million
GroupCost Freehold land 1,353.9 (0.2) 103.6 (1.4) 22.3 1,478.2 Long leasehold land 1,759.4 0 126.8 0 2.9 1,889.1 Short leasehold land 186.6 0 0 0 0 186.6 Buildings and civil works 20,814.9 (0.3) 2.8 (3.8) 71.2 20,884.8
24,114.8 (0.5) 233.2 (5.2) 96.4 24,438.7 Plant and machinery: - Owned 64,377.1 (71.6) 17.5 (22.5) 5,648.1 69,948.6 - Leased 8,163.6 0 0 0 0 8,163.6 Lines and distribution mains 43,517.8 0 4.8 0 692.6 44,215.2 Distribution services 4,373.8 0 2.3 0 35.6 4,411.7 Meters 2,780.6 0 1.2 (0.5) 31.0 2,812.3 Public lighting 664.4 0 0 0 24.0 688.4 Furniture, fittings and office equipment 2,193.9 (1.1) 31.2 (1.0) (1.7) 2,221.3 Motor vehicles 657.8 (0.2) 0.7 (4.0) (7.0) 647.3
150,843.8 (73.4) 290.9 (33.2) 6,519.0 157,547.1 Capital work-in-progress 21,819.7 0 3,498.6 (29.4) (6,468.5) 18,820.4
172,663.5 (73.4) 3,789.5 (62.6) 50.5 176,367.5
31.12.2017
As at1.9.2017
RM’million
Chargedfor the
financialperiod
RM’million
Released ondisposals/Transfers/Write offs
RM’million
As at31.12.2017RM’million
GroupAccumulated depreciation Long leasehold land 324.2 8.0 0 332.2 Short leasehold land 114.6 2.4 0 117.0 Buildings and civil works 6,365.4 173.4 (1.9) 6,536.9
6,804.2 183.8 (1.9) 6,986.1 Plant and machinery: - Owned 31,151.5 979.6 (52.1) 32,079.0 - Leased 2,222.4 170.8 0 2,393.2 Lines and distribution mains 21,970.7 536.6 0 22,507.3 Distribution services 2,609.4 55.4 0 2,664.8 Meters 1,752.4 45.4 (0.4) 1,797.4 Public lighting 346.1 10.7 0 356.8 Furniture, fittings and office equipment 1,810.6 52.8 (4.4) 1,859.0 Motor vehicles 526.9 14.8 (11.0) 530.7
69,194.2 2,049.9 (69.8) 71,174.3
Accumulated impairment losses Plant and machinery - owned 385.6 0 0 385.6

About TNB
Our Business
Business Context
Performance Review
Sustainability Statement
The Strength of Our Governance
Financial Statements
Additional InformationIntegrated Annual Report 2018
Tenaga Nasional Berhad
p.193 Notes to the Financial Statements
14 PROPERTY, PLANT AND EQUIPMENT (‘PPE’) (CONTINUED)
31.12.2018
As at1.1.2018
RM’millionAdditions
RM’millionDisposals
RM’million
Transfers/Adjustments/
Reclassi-fication/
Write offsRM’million
As at31.12.2018RM’million
CompanyCost Freehold land 1,480.5 405.1 0 0 1,885.6 Long leasehold land 1,431.7 26.7 (0.4) 0.1 1,458.1 Short leasehold land 4.5 0 0 0 4.5 Buildings and civil works 17,099.5 0 (130.6) 304.2 17,273.1
20,016.2 431.8 (131.0) 304.3 20,621.3 Plant and machinery: - Owned 42,865.6 0 (1,203.2) 2,452.0 44,114.4 - Leased 25,018.6 0 0 0 25,018.6 Lines and distribution mains 42,040.1 0 (25.2) 2,219.1 44,234.0 Distribution services 4,118.3 0 0 197.5 4,315.8 Meters 2,710.5 0 (15.6) 177.0 2,871.9 Public lighting 688.4 0 (0.2) 215.3 903.5 Furniture, fittings and office equipment 1,892.8 362.0 (6.9) (0.1) 2,247.8 Motor vehicles 520.2 21.3 (20.2) 5.1 526.4
139,870.7 815.1 (1,402.3) 5,570.2 144,853.7Capital work-in-progress 7,868.7 6,962.4 (44.4) (5,588.3) 9,198.4
147,739.4 7,777.5 (1,446.7) (18.1) 154,052.1
31.12.2018
As at1.1.2018
RM’million
Chargedfor the
financial yearRM’million
Released ondisposals/Transfers/Write offs
RM’million
As at31.12.2018RM’million
CompanyAccumulated depreciation Long leasehold land 320.7 19.5 0 340.2 Short leasehold land 2.6 0.1 0 2.7 Buildings and civil works 5,451.3 356.3 (98.5) 5,709.1
5,774.6 375.9 (98.5) 6,052.0 Plant and machinery: - Owned 22,832.4 1,850.9 (1,175.4) 23,507.9 - Leased 9,067.5 1,176.3 0 10,243.8 Lines and distribution mains 21,645.9 1,578.1 (14.0) 23,210.0 Distribution services 2,498.8 159.8 0 2,658.6 Meters 1,735.9 138.8 (8.4) 1,866.3 Public lighting 356.8 46.1 (0.2) 402.7 Furniture, fittings and office equipment 1,594.1 152.7 (6.9) 1,739.9 Motor vehicles 440.8 29.0 (20.0) 449.8
65,946.8 5,507.6 (1,323.4) 70,131.0

About TNB
Our Business
Business Context
Performance Review
Sustainability Statement
The Strength of Our Governance
Financial Statements
Additional Information
p.194 Notes to the Financial Statements
14 PROPERTY, PLANT AND EQUIPMENT (‘PPE’) (CONTINUED)
31.12.2017
As at1.9.2017
RM’millionAdditions
RM’millionDisposals
RM’million
Transfers/Adjustments/
Reclassi-fication/
Write offsRM’million
As at31.12.2017RM’million
CompanyCost
Freehold land 1,356.0 103.6 (1.4) 22.3 1,480.5
Long leasehold land 1,426.4 5.3 0 0 1,431.7
Short leasehold land 4.5 0 0 0 4.5
Buildings and civil works 17,028.9 0 (0.1) 70.7 17,099.5
19,815.8 108.9 (1.5) 93.0 20,016.2
Plant and machinery:
- Owned 43,273.2 0 (21.9) (385.7) 42,865.6
- Leased 18,763.1 6,255.5 0 0 25,018.6
Lines and distribution mains 41,349.5 0 0 690.6 42,040.1
Distribution services 4,084.0 0 0 34.3 4,118.3
Meters 2,679.5 0 0 31.0 2,710.5
Public lighting 664.3 0 0 24.1 688.4
Furniture, fittings and office equipment 1,868.6 28.7 (0.4) (4.1) 1,892.8
Motor vehicles 524.9 0.1 (4.0) (0.8) 520.2
133,022.9 6,393.2 (27.8) 482.4 139,870.7
Capital work-in-progress 7,608.0 1,648.8 0 (1,388.1) 7,868.7
140,630.9 8,042.0 (27.8) (905.7) 147,739.4
31.12.2017
As at1.9.2017
RM’million
Chargedfor the
financialperiod
RM’million
Released ondisposals/Transfers/Write offs
RM’million
As at31.12.2017RM’million
CompanyAccumulated depreciation
Long leasehold land 313.8 6.9 0 320.7
Short leasehold land 2.6 0 0 2.6
Buildings and civil works 5,322.5 128.8 0 5,451.3
5,638.9 135.7 0 5,774.6
Plant and machinery:
- Owned 22,861.3 590.5 (619.4) 22,832.4
- Leased 8,675.4 392.1 0 9,067.5
Lines and distribution mains 21,136.7 509.2 0 21,645.9
Distribution services 2,448.2 50.6 0 2,498.8
Meters 1,692.8 43.1 0 1,735.9
Public lighting 346.1 10.7 0 356.8
Furniture, fittings and office equipment 1,554.7 42.9 (3.5) 1,594.1
Motor vehicles 434.9 10.5 (4.6) 440.8
64,789.0 1,785.3 (627.5) 65,946.8

About TNB
Our Business
Business Context
Performance Review
Sustainability Statement
The Strength of Our Governance
Financial Statements
Additional InformationIntegrated Annual Report 2018
Tenaga Nasional Berhad
p.195 Notes to the Financial Statements
14 PROPERTY, PLANT AND EQUIPMENT (‘PPE’) (CONTINUED)
Group Company
31.12.2018RM’million
31.12.2017RM’million
31.12.2018RM’million
31.12.2017RM’million
Net book value
Freehold land 1,883.0 1,478.2 1,885.6 1,480.5
Long leasehold land 1,629.2 1,556.9 1,117.9 1,111.0
Short leasehold land 65.5 69.6 1.8 1.9
Buildings and civil works 15,102.1 14,347.9 11,564.0 11,648.2
Total land and buildings 18,679.8 17,452.6 14,569.3 14,241.6
Plant and machinery:
- Owned 37,806.1 37,484.0 20,606.5 20,033.2
- Leased 5,258.0 5,770.4 14,774.8 15,951.1
Lines and distribution mains 22,357.5 21,707.9 21,024.0 20,394.2
Distribution services 1,790.7 1,746.9 1,657.2 1,619.5
Meters 1,044.9 1,014.9 1,005.6 974.6
Public lighting 500.9 331.6 500.8 331.6
Furniture, fittings and office equipment 574.6 362.3 507.9 298.7
Motor vehicles 108.9 116.6 76.6 79.4
88,121.4 85,987.2 74,722.7 73,923.9
Capital work-in-progress 23,324.1 18,820.4 9,198.4 7,868.7
111,445.5 104,807.6 83,921.1 81,792.6
The title deeds of certain lands are in the process of being registered in the name of the Company and certain subsidiaries.
Net book value of PPE pledged as security for borrowings are disclosed in Note 36.
Inclusive in the capital work-in-progress is interest capitalised during FY2018 for the Group and the Company of RM915.8 million (FPE 31.12.2017: RM123.0 million) and RM260.5 million (FPE 31.12.2017: RM83.4 million) respectively.
The capitalisation rate used to determine the amount of borrowing cost eligible for capitalisation is 5.8% (FPE 31.12.2017: 6.0%).
(a) Impairment test for PPE
TNB Liberty Power Limited (‘LPL’) has recognised in prior years, a provision for impairment totalling RM385.6 million. Current financial period assessment showed that no further impairment loss is required for the carrying amount of PPE assessed. The carrying value of the PPE at statement of financial position date is RM227.2 million (FPE 31.12.2017: RM233.5 million). The recoverable amount of the PPE is determined based on value in use.
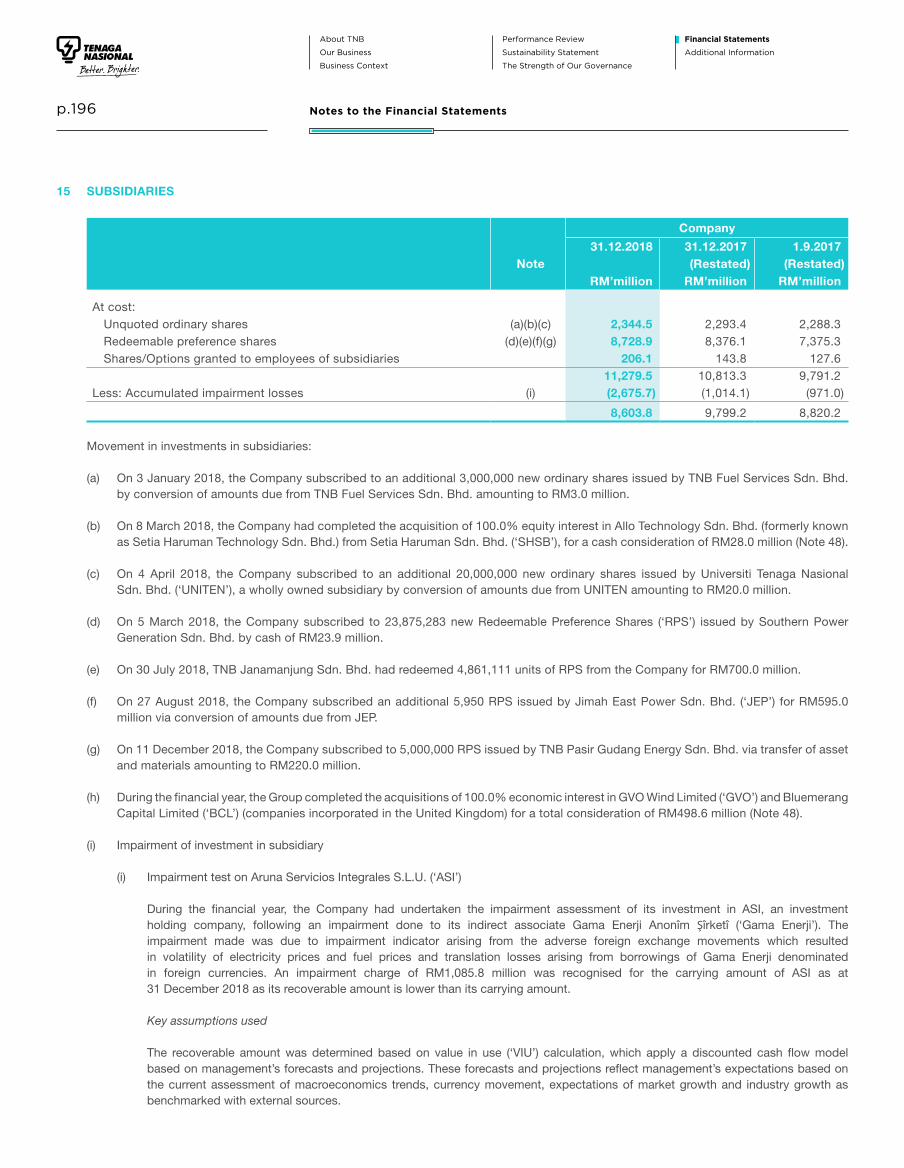
About TNB
Our Business
Business Context
Performance Review
Sustainability Statement
The Strength of Our Governance
Financial Statements
Additional Information
p.196 Notes to the Financial Statements
15 SUBSIDIARIES
Company
Note31.12.2018
RM’million
31.12.2017(Restated)
RM’million
1.9.2017(Restated)
RM’million
At cost: Unquoted ordinary shares (a)(b)(c) 2,344.5 2,293.4 2,288.3 Redeemable preference shares (d)(e)(f)(g) 8,728.9 8,376.1 7,375.3 Shares/Options granted to employees of subsidiaries 206.1 143.8 127.6
11,279.5 10,813.3 9,791.2Less: Accumulated impairment losses (i) (2,675.7) (1,014.1) (971.0)
8,603.8 9,799.2 8,820.2
Movement in investments in subsidiaries:
(a) On 3 January 2018, the Company subscribed to an additional 3,000,000 new ordinary shares issued by TNB Fuel Services Sdn. Bhd. by conversion of amounts due from TNB Fuel Services Sdn. Bhd. amounting to RM3.0 million.
(b) On 8 March 2018, the Company had completed the acquisition of 100.0% equity interest in Allo Technology Sdn. Bhd. (formerly known as Setia Haruman Technology Sdn. Bhd.) from Setia Haruman Sdn. Bhd. (‘SHSB’), for a cash consideration of RM28.0 million (Note 48).
(c) On 4 April 2018, the Company subscribed to an additional 20,000,000 new ordinary shares issued by Universiti Tenaga Nasional Sdn. Bhd. (‘UNITEN’), a wholly owned subsidiary by conversion of amounts due from UNITEN amounting to RM20.0 million.
(d) On 5 March 2018, the Company subscribed to 23,875,283 new Redeemable Preference Shares (‘RPS’) issued by Southern Power Generation Sdn. Bhd. by cash of RM23.9 million.
(e) On 30 July 2018, TNB Janamanjung Sdn. Bhd. had redeemed 4,861,111 units of RPS from the Company for RM700.0 million.
(f) On 27 August 2018, the Company subscribed an additional 5,950 RPS issued by Jimah East Power Sdn. Bhd. (‘JEP’) for RM595.0 million via conversion of amounts due from JEP.
(g) On 11 December 2018, the Company subscribed to 5,000,000 RPS issued by TNB Pasir Gudang Energy Sdn. Bhd. via transfer of asset and materials amounting to RM220.0 million.
(h) During the financial year, the Group completed the acquisitions of 100.0% economic interest in GVO Wind Limited (‘GVO’) and Bluemerang Capital Limited (‘BCL’) (companies incorporated in the United Kingdom) for a total consideration of RM498.6 million (Note 48).
(i) Impairment of investment in subsidiary
(i) Impairment test on Aruna Servicios Integrales S.L.U. (‘ASI’)
During the financial year, the Company had undertaken the impairment assessment of its investment in ASI, an investment holding company, following an impairment done to its indirect associate Gama Enerji Anonîm Şîrketî (‘Gama Enerji’). The impairment made was due to impairment indicator arising from the adverse foreign exchange movements which resulted in volatility of electricity prices and fuel prices and translation losses arising from borrowings of Gama Enerji denominated in foreign currencies. An impairment charge of RM1,085.8 million was recognised for the carrying amount of ASI as at 31 December 2018 as its recoverable amount is lower than its carrying amount.
Key assumptions used
The recoverable amount was determined based on value in use (‘VIU’) calculation, which apply a discounted cash flow model based on management’s forecasts and projections. These forecasts and projections reflect management’s expectations based on the current assessment of macroeconomics trends, currency movement, expectations of market growth and industry growth as benchmarked with external sources.

About TNB
Our Business
Business Context
Performance Review
Sustainability Statement
The Strength of Our Governance
Financial Statements
Additional InformationIntegrated Annual Report 2018
Tenaga Nasional Berhad
p.197 Notes to the Financial Statements
15 SUBSIDIARIES (CONTINUED)
Movement in investments in subsidiaries (continued)
(i) Impairment of investment in subsidiary (continued)
(i) Impairment test on ASI (continued)
Key assumptions used (continued)
The key assumptions used in determining the VIU are:
Assumptions: %
Cost of equity 16.3 - 31.5Terminal growth rate 2.4 - 2.8
The Company’s review includes on impact assessment of changes in key assumptions. The effect of the movement in the key assumptions to the recoverable amount is as follows:
Key assumptions:Changes in
assumptions
Impact to recoverable amountIncrease
RM’millionDecrease
RM’million
Discount rate 1.0% (11.5) 13.1Terminal growth rate 1.0% 8.8 (8.1)
(ii) Impairment test on Power and Energy International (Mauritius) Ltd. (‘PEIM’)
During the financial year, the Company had undertaken the impairment assessment of its investment in PEIM, an investment holding company, following an impairment done to its associate GMR Energy Limited (‘GEL’). The impairment made was due to an impairment indicator arising from the delay in commencement of operations for certain power plants in GEL group and the shortage of fuel supply. An impairment loss of RM535.6 million was required for the carrying amount of PEIM as at 31 December 2018 as its recoverable amount is lower than its carrying amount.
Key assumptions used
The recoverable amount was determined based on VIU calculation, which apply a discounted cash flow model of PEIM for the period of the remaining useful lives of the respective power plants of the group which range between 15 to 40 years. The cash flows used are the most recent forecast and projections approved by management of PEIM.
The key assumptions used in determining the VIU are:
Assumptions: %
Average Plant Availability Factor 47.2 - 51.2Average Plant Load Factor 50.0 - 85.0Cost of equity 14.1 - 19.3
The cash flows are discounted using cost of equity based on the risk specific to the investments. The key assumptions take into account the macroeconomic environment in India.
The Company’s review includes on impact assessment of changes in key assumptions. The effect of the movement in the key assumptions to the recoverable amount is as follows:
Key assumptions:Changes in
assumptions
Impact to recoverable amountIncrease
RM’millionDecrease
RM’million
Plant Availability Factor 5.0% 27.7 (13.9)Plant Load Factor 10.0% 169.0 (178.7)Discount rate 1.0% (55.6) 72.6

About TNB
Our Business
Business Context
Performance Review
Sustainability Statement
The Strength of Our Governance
Financial Statements
Additional Information
p.198 Notes to the Financial Statements
15 SUBSIDIARIES (CONTINUED)
The details of the subsidiaries are as follows:
Name of subsidiary
Group’s interest
Principal activitiesCountry ofincorporation31.12.2018 31.12.2017
TNB Janamanjung Sdn. Bhd. 100% 100% Generate and deliver electricity energy and maintain generating capacity to TNB
Malaysia
TNB Power Daharki Ltd.# 100% 100% Investment holding company Mauritius
TNB Fuel Services Sdn. Bhd. 100% 100% Supplying fuel and coal for power generation Malaysia
TNB Energy Services Sdn. Bhd. 100% 100% Generating, distributing, supplying, dealing, selling of different kinds of energy sources and related technical services
Malaysia
TNB Research Sdn. Bhd. 100% 100% Research and development, consultancy and other services
Malaysia
TNB Ventures Sdn. Bhd. 100% 100% Investment holding company Malaysia
TNB Engineering Corporation Sdn. Bhd.
100% 100% Principally engaged as turnkey contractors, energy project development specialising in district cooling system and co-generation including operation and maintenance works
Malaysia
TNB Repair And Maintenance Sdn. Bhd.
100% 100% Providing repair and maintenance services to heavy industries and other related services
Malaysia
TNB Capital (L) Ltd. 100% 100% Investment holding company Malaysia
Universiti Tenaga Nasional Sdn. Bhd. 100% 100% Providing higher education Malaysia
Malaysia Transformer Manufacturing Sdn. Bhd.
100% 100% Principally engaged in the business of manufacturing, selling and repairing distribution, power and earthing transformers
Malaysia
Power and Energy International (Mauritius) Ltd.*
100% 100% Investment holding Mauritius
Orion Mission Sdn. Bhd. 100% 100% Investment holding company Malaysia
Sabah Electricity Sdn. Bhd. (‘SESB’) 83% 83% Business of generation, transmission, distribution and sale of electricity and services in Sabah and the Federal Territory of Labuan
Malaysia
Tenaga Switchgear Sdn. Bhd. 60% 60% Principally engaged in the business of assembling and manufacturing of high voltage switchgears and contracting of turnkey transmission substations
Malaysia
Kapar Energy Ventures Sdn. Bhd. (‘KEV’)
60% 60% Generate and deliver electricity energy and generating capacity to TNB
Malaysia
TNB Integrated Learning Solution Sdn. Bhd.
100% 100% Providing training courses Malaysia
TNB Prai Sdn. Bhd. 100% 100% Generate and deliver electricity energy and maintain generating capacity to TNB
Malaysia
TNB Pasir Gudang Energy Sdn. Bhd. 100% 100% Carry business of any matter relating to electricity especially the business of generation and supply of electricity for any purpose in Malaysia
Malaysia
TNB Manjung Five Sdn. Bhd. 100% 100% Generate and deliver electricity energy and maintain generating capacity to TNB
Malaysia
TNB Connaught Bridge Sdn. Bhd. 100% 100% To generate and deliver electricity energy and maintain generating capacity to TNB
Malaysia

About TNB
Our Business
Business Context
Performance Review
Sustainability Statement
The Strength of Our Governance
Financial Statements
Additional InformationIntegrated Annual Report 2018
Tenaga Nasional Berhad
p.199 Notes to the Financial Statements
15 SUBSIDIARIES (CONTINUED)
The details of the subsidiaries are as follows: (continued)
Name of subsidiary
Group’s interest
Principal activitiesCountry ofincorporation31.12.2018 31.12.2017
Integrax Berhad 100% 100% Investment holding company Malaysia
Jimah East Power Sdn. Bhd. (‘JEP’) 70% 70% Involved in power generation Malaysia
Yayasan Tenaga Nasional - - A trust established under the provision of Trustees (Incorporation) Act 1952 (Act 258), for promotion and advancement of education and for charitable purposes
Malaysia
Manjung Island Energy Berhad - - Special purpose company to raise Islamic securities under the Islamic Securities Programme
Malaysia
TNB Global Ventures Capital Berhad 100% 100% Investment holding company Malaysia
Aruna Servicios Integrales S.L.U.* 100% 100% Investment holding Spain
TNB-IT Sdn. Bhd. 100% 100% To provide telecommunication and IT infrastructure solution and services, focusing on engineering design and consultancy, project management and development, operation and maintenance (‘O&M’) and training for telecommunication services
Malaysia
TNB International Sdn. Bhd. 100% 100% Invesment holding company Malaysia
TNB Sepang Solar Sdn. Bhd. 100% 100% Operation of generation facilities that produce electric energy
Malaysia
Southern Power Generation Sdn. Bhd.
51% 51% To construct a 1,440MW combine cycle gas fired power plant in Pasir Gudang, Johor
Malaysia
TNBX Sdn. Bhd. 100% 100% To act as the single-fronting entity for customers to purchase/obtain solutions beyond the meter.The solutions comprises of non-regulated products and services such as energy efficiency, renewable energy and smart cities
Malaysia
TNB Renewables Sdn. Bhd. 100% - To carry on business of an investment holding company
Malaysia
Allo Technology Sdn. Bhd. (Formerly known as Setia Haruman Technology Sdn. Bhd.)&
100% - Information technology related services Malaysia
TNB Global Captive (L) Ltd. 100% - Insurance and reinsurance related business Malaysia
TNB Topaz Energy Sdn. Bhd. 100% - Investment holding for developing and investing in overseas power generation projects
Malaysia
TNB Transmission Network Sdn. Bhd. 100% 100% Dormant Malaysia
TNB Distribution Sdn. Bhd. 100% 100% Dormant Malaysia
TNB Quantum Solutions Sdn. Bhd. (Dissolved w.e.f. 9.7.2018)
- 100% Dormant Malaysia
TNB Risk Management Sdn. Bhd. 100% 100% Dormant Malaysia
TNB Engineers Sdn. Bhd. 100% 100% Dormant Malaysia
TNB Generation Sdn. Bhd. 100% 100% Dormant Malaysia
TNB Hidro Sdn. Bhd. 100% 100% Dormant Malaysia
TNB Properties Sdn. Bhd. 100% 100% Dormant Malaysia

About TNB
Our Business
Business Context
Performance Review
Sustainability Statement
The Strength of Our Governance
Financial Statements
Additional Information
p.200 Notes to the Financial Statements
15 SUBSIDIARIES (CONTINUED)
The details of the subsidiaries are as follows: (continued)
Name of subsidiary
Group’s interest
Principal activitiesCountry ofincorporation31.12.2018 31.12.2017
Sepang Power Sdn. Bhd. 70% 70% Dormant Malaysia
TNB Coal International Limited* 100% 100% Dormant Mauritius
Subsidiary of TNB Power Daharki Ltd.
TNB Liberty Power Limited# 100% 100% Operation of power plant and generation of electricity
Pakistan
Subsidiaries of TNB Energy Services Sdn. Bhd.
MAEVI Sdn. Bhd. 70% - Providing infrastructure for hosting, data processing services and related activities research and development on engineering and technology
Malaysia
Tenaga E Mobility Solutions Sdn. Bhd. 100% - Operation of parking facilities for motor vehicles, (parking lots), operation of generation facilities that produce electric energy and engineering services
Malaysia
Subsidiary of TNB Research Sdn. Bhd.
TNB LABS Sdn. Bhd. (Formerly known as TNBR QATS Sdn. Bhd.)
100% 100% Technical and laboratory services, consultancy and other services
Malaysia
Subsidiary of TNB Ventures Sdn. Bhd.
Tenaga Cable Industries Sdn. Bhd. 76% 76% Manufacturing and distribution of power and general cables, aluminium rods and related activities
Malaysia
Subsidiaries of TNB Engineering Corporation Sdn. Bhd.
Bangsar Energy Systems Sdn. Bhd. 100% 100% Operating an integrated district cooling system for air conditioning systems of office buildings
Malaysia
TNEC Construction Sdn. Bhd. 100% 100% Dormant Malaysia
TNEC Operations And Maintenance Sdn. Bhd.
100% 100% The company ceased business and has remained as investment holding company
Malaysia
Subsidiary of Bangsar Energy Systems Sdn. Bhd.
Selesa Energy Systems Sdn. Bhd. 70% 70% Dormant Malaysia
Subsidiary of TNEC Operations And Maintenance Sdn. Bhd.
Tomest Energy Management Sdn. Bhd. (In members’ voluntary winding up)
51% 51% Operating an integrated district cooling system for air conditioning systems of office buildings
Malaysia
Subsidiaries of TNB Repair And Maintenance Sdn. Bhd.
Trichy Power Limited* 100% 100% Dormant India
Trichy Energy Limited* 100% 100% Dormant India

About TNB
Our Business
Business Context
Performance Review
Sustainability Statement
The Strength of Our Governance
Financial Statements
Additional InformationIntegrated Annual Report 2018
Tenaga Nasional Berhad
p.201 Notes to the Financial Statements
15 SUBSIDIARIES (CONTINUED)
The details of the subsidiaries are as follows: (continued)
Name of subsidiary
Group’s interest
Principal activitiesCountry ofincorporation31.12.2018 31.12.2017
Subsidiaries of TNB Repair And Maintenance Sdn. Bhd. (continued)
TNB Operations & Maintenance International Ltd.
100% 100% Investment holding Mauritius
TNB REMACO Pakistan (Private) Limited#
100% 100% Providing repair and maintenance services to heavy industries and other related services
Pakistan
Tenaga WHR 1 Sdn. Bhd. 100% 100% To carry on the business of establishing, constructing, commissioning, setting up, operating and maintaining electric power generation systems, transmission systems/networks, power systems, generating stations/plants based on waste heat recovery and/or power efficiency technology
Malaysia
Subsidiary of TNB Operations & Maintenance International Ltd.
Oasis Parade Sdn. Bhd. 100% 100% Investment company Malaysia
Subsidiaries of Universiti Tenaga Nasional Sdn. Bhd.
UNITEN R&D Sdn. Bhd. 100% 100% Providing research and development in areas related to engineering, information technology, business, accountancy, liberal studies and other services
Malaysia
Yayasan Canselor Universiti Tenaga Nasional
- - A trust established under the provision of Trustees (Incorporation) Act 1952 (Act 258) to receive and administer funds for educational and charitable purposes
Malaysia
Subsidiary of Power and Energy International (Mauritius) Ltd.
Independent Power International Ltd.* 100% 100% Investment holding Mauritius
Subsidiary of Orion Mission Sdn. Bhd.
Lahad Datu Holdings Sdn. Bhd. 100% 100% Investment holding company Malaysia
Subsidiary of Lahad Datu Holdings Sdn. Bhd.
Lahad Datu Energy Sdn. Bhd. 100% 100% Dormant Malaysia
Subsidiary of Sabah Electricity Sdn. Bhd.
Elopura Power Sdn. Bhd. 100% 100% Dormant Malaysia

About TNB
Our Business
Business Context
Performance Review
Sustainability Statement
The Strength of Our Governance
Financial Statements
Additional Information
p.202 Notes to the Financial Statements
15 SUBSIDIARIES (CONTINUED)
The details of the subsidiaries are as follows: (continued)
Name of subsidiary
Group’s interest
Principal activitiesCountry ofincorporation31.12.2018 31.12.2017
Subsidiaries of Tenaga Switchgear Sdn. Bhd.
TSG Ormazabal Sdn. Bhd. 60% 60% Assembling, manufacture, test, reconditioning, distribution and other sources of medium voltage switchgear and control gear for transmission and distribution of electric power
Malaysia
PT. Tenaga Nusa Bakti* 95% 95% Dormant Indonesia
Subsidiary of TNB Prai Sdn. Bhd.
TNB Northern Energy Berhad 100% 100% Principally to construct a 1,071MW gas fired power plant in Seberang Perai Tengah, Seberang Perai, Pulau Pinang
Malaysia
Subsidiary of TNB Manjung Five Sdn. Bhd.
TNB Western Energy Berhad 100% 100% Principally engaged in the construction of 1,000MW coal fired power plant in Lumut, Perak, Malaysia
Malaysia
Subsidiaries of Integrax Berhad
Pelabuhan Lumut Sdn. Bhd. 100% 100% Investment holding Malaysia
LBT Two Sdn. Bhd. 100% 100% Dormant Malaysia
Segmen Kembara Sdn. Bhd. 100% 100% Dormant Malaysia
Trek Kembara Sdn. Bhd. 100% 100% Dormant Malaysia
Subsidiary of Pelabuhan Lumut Sdn. Bhd.
Lekir Bulk Terminal Sdn. Bhd. 100% 80% Development, ownership and management of a dry bulk terminal
Malaysia
Subsidiary of Aruna Servicios Integrales S.L.U.
Global Power Enerjî Sanayî Ve Tîcaret Anonîm Şîrketî*
100% 100% To engage in activities related to building and operating electricity production facilities, producing electricity and/or capacity and distributing the generated electricity and/or capacity to customers and/or to legal entities with wholesale trade licences and to free consumers
Turkey
Subsidiary of TNB International Sdn. Bhd.
Tenaga Investments UK Ltd.* 100% 100% Investment company United Kingdom
Subsidiary of Tenaga Investments UK Ltd.
Tenaga Wind Ventures UK Ltd. * 100% 100% Investment company United Kingdom

About TNB
Our Business
Business Context
Performance Review
Sustainability Statement
The Strength of Our Governance
Financial Statements
Additional InformationIntegrated Annual Report 2018
Tenaga Nasional Berhad
p.203 Notes to the Financial Statements
15 SUBSIDIARIES (CONTINUED)
The details of the subsidiaries are as follows: (continued)
Name of subsidiary
Group’s interest
Principal activitiesCountry ofincorporation31.12.2018 31.12.2017
Subsidiaries of Tenaga Wind Ventures UK Ltd.
GVO Wind Limited^* 100% - Direct investment holding company of assets involved in generation and sale of power through renewable energy (wind turbines) in the UK
United Kingdom
Bluemerang Capital Ltd.^* 100% - Direct investment holding company of assets involved in generation and sale of power through renewable energy (wind turbines) in the UK
United Kingdom
Subsidiaries of GVO Wind Limited
GVO Wind F-1 Limited* 100% - Operation of wind assets for the generation and sale of electricity in the UK
United Kingdom
GVO Wind No. 1 Limited* 100% - Operation of wind assets for the generation and sale of electricity in the UK
United Kingdom
GVO Wind No. 2 Limited* 100% - Operation of wind assets for the generation and sale of electricity in the UK
United Kingdom
GVO Wind No. 3 Limited* 100% - Operation of wind assets for the generation and sale of electricity in the UK
United Kingdom
GVO Wind No. 4 Limited* 100% - Operation of wind assets for the generation and sale of electricity in the UK
United Kingdom
GVO Wind No. 5 Limited* 100% - Operation of wind assets for the generation and sale of electricity in the UK
United Kingdom
GVO Wind No. 6 Limited* 100% - Operation of wind assets for the generation and sale of electricity in the UK
United Kingdom
GVO Wind No. 7 Limited* 100% - Operation of wind assets for the generation and sale of electricity in the UK
United Kingdom
Boghead WT Limited* 100% - Operation of wind assets for the generation and sale of electricity in the UK
United Kingdom
GVO Wind No. 9 Limited* 100% - Operation of wind assets for the generation and sale of electricity in the UK
United Kingdom
GVO Wind No. 10 Limited* 100% - Operation of wind assets for the generation and sale of electricity in the UK
United Kingdom
GVO Wind No. 11 Limited* 100% - Operation of wind assets for the generation and sale of electricity in the UK
United Kingdom
GVO Wind No. 12 Limited* 100% - Operation of wind assets for the generation and sale of electricity in the UK
United Kingdom
GVO Wind No. 13 Limited* 100% - Operation of wind assets for the generation and sale of electricity in the UK
United Kingdom
GVO Wind No. 14 Limited* 100% - Operation of wind assets for the generation and sale of electricity in the UK
United Kingdom
GVO Wind No. 16 Limited* 100% - Operation of wind assets for the generation and sale of electricity in the UK
United Kingdom

About TNB
Our Business
Business Context
Performance Review
Sustainability Statement
The Strength of Our Governance
Financial Statements
Additional Information
p.204 Notes to the Financial Statements
15 SUBSIDIARIES (CONTINUED)
The details of the subsidiaries are as follows: (continued)
Name of subsidiary
Group’s interest
Principal activitiesCountry ofincorporation31.12.2018 31.12.2017
Subsidiaries of GVO Wind Limited (continued)
GVO/CME Wind No. 17 Limited* 100% - Operation of wind assets for the generation and sale of electricity in the UK
United Kingdom
GVO/CME Wind No. 18 Limited* 100% - Operation of wind assets for the generation and sale of electricity in the UK
United Kingdom
GVO Wind No. 20 Limited* 100% - Operation of wind assets for the generation and sale of electricity in the UK
United Kingdom
GVO Wind No. 21 Limited* 100% - Operation of wind assets for the generation and sale of electricity in the UK
United Kingdom
GVO Wind No. 22 Limited* 100% - Operation of wind assets for the generation and sale of electricity in the UK
United Kingdom
GVO Wind No. 23 Limited* 100% - Operation of wind assets for the generation and sale of electricity in the UK
United Kingdom
GVO Wind No. 24 Limited* 100% - Operation of wind assets for the generation and sale of electricity in the UK
United Kingdom
GVO Wind No. 25 Limited* 100% - Operation of wind assets for the generation and sale of electricity in the UK
United Kingdom
GVO Wind No. 27 Limited* 100% - Operation of wind assets for the generation and sale of electricity in the UK
United Kingdom
GVO Wind No. 28 Limited* 100% - Operation of wind assets for the generation and sale of electricity in the UK
United Kingdom
GVO Wind No. 29 Limited* 100% - Operation of wind assets for the generation and sale of electricity in the UK
United Kingdom
GVO Wind No. 30 Limited* 100% - Operation of wind assets for the generation and sale of electricity in the UK
United Kingdom
GVO Wind No. 31 Limited* 100% - Operation of wind assets for the generation and sale of electricity in the UK
United Kingdom
GVO Wind No. 32 Limited* 100% - Operation of wind assets for the generation and sale of electricity in the UK
United Kingdom
GVO Wind No. 35 Limited* 100% - Operation of wind assets for the generation and sale of electricity in the UK
United Kingdom
GVO Wind No. 36 Limited* 100% - Operation of wind assets for the generation and sale of electricity in the UK
United Kingdom
GVO Wind No. 39 Limited* 100% - Operation of wind assets for the generation and sale of electricity in the UK
United Kingdom
GVO Wind No. 40 Limited* 100% - Operation of wind assets for the generation and sale of electricity in the UK
United Kingdom

About TNB
Our Business
Business Context
Performance Review
Sustainability Statement
The Strength of Our Governance
Financial Statements
Additional InformationIntegrated Annual Report 2018
Tenaga Nasional Berhad
p.205 Notes to the Financial Statements
15 SUBSIDIARIES (CONTINUED)
The details of the subsidiaries are as follows: (continued)
Name of subsidiary
Group’s interest
Principal activitiesCountry ofincorporation31.12.2018 31.12.2017
Subsidiaries of GVO Wind Limited (continued)
GVO Wind No. 41 Limited* 100% - Operation of wind assets for the generation and sale of electricity in the UK
United Kingdom
GVO Wind No. 42 Limited* 100% - Operation of wind assets for the generation and sale of electricity in the UK
United Kingdom
GVO Wind No. 43 Limited* 100% - Operation of wind assets for the generation and sale of electricity in the UK
United Kingdom
GVO Wind No. 44 Limited* 100% - Operation of wind assets for the generation and sale of electricity in the UK
United Kingdom
Durpley WT Limited* 100% - Operation of wind assets for the generation and sale of electricity in the UK
United Kingdom
OGPW No.1 Limited* 100% - Operation of wind assets for the generation and sale of electricity in the UK
United Kingdom
Warren WT Limited* 100% - Operation of wind assets for the generation and sale of electricity in the UK
United Kingdom
Weston Town WT Limited* 100% - Operation of wind assets for the generation and sale of electricity in the UK
United Kingdom
Subsidiaries of Bluemerang Capital Ltd.
BCL Murex Bennacott Ltd* 100% - Operation of wind assets for the generation and sale of electricity in the UK
United Kingdom
BLC Hunday Limited* 100% - Operation of wind assets for the generation and sale of electricity in the UK
United Kingdom
BCL Caslterigg Limited* 100% - Operation of wind assets for the generation and sale of electricity in the UK
United Kingdom
LE18 Limited* 100% - Operation of wind assets for the generation and sale of electricity in the UK
United Kingdom
LE19 Limited* 100% - Operation of wind assets for the generation and sale of electricity in the UK
United Kingdom
Murex Bennacott Limited* 100% - Operation of wind assets for the generation and sale of electricity in the UK
United Kingdom
Ili (Wellgreen) Limited* 100% - Operation of wind assets for the generation and sale of electricity in the UK
United Kingdom
BCL Harmeston Limited* 100% - Operation of wind assets for the generation and sale of electricity in the UK
United Kingdom
BCL Gwynt Limited* 100% - Operation of wind assets for the generation and sale of electricity in the UK
United Kingdom
Subsidiaries of TNB Renewables Sdn. Bhd.
TNB Bukit Selambau Solar Sdn. Bhd. 100% - Operation of generation facilities that produce electric energy
Malaysia
GSPARX Sdn. Bhd. 100% - Operation of generation facilities that produce electric energy
Malaysia

About TNB
Our Business
Business Context
Performance Review
Sustainability Statement
The Strength of Our Governance
Financial Statements
Additional Information
p.206 Notes to the Financial Statements
15 SUBSIDIARIES (CONTINUED)
The details of the subsidiaries are as follows: (continued)
Name of subsidiary
Group’s interest
Principal activitiesCountry ofincorporation31.12.2018 31.12.2017
Subsidiary of TNB Properties Sdn. Bhd.
TNP Construction Sdn. Bhd. 100% 100% Dormant Malaysia
Subsidiary of TNB Coal International Limited
Dynamic Acres Sdn. Bhd.* (Dissolved w.e.f. 15.12.2018)
- 100% Dormant Malaysia
# Audited by a member firm of PricewaterhouseCoopers International Limited which is a separate and independent legal entity from PricewaterhouseCoopers PLT, Malaysia.
* Not audited by PricewaterhouseCoopers PLT.& Company has completed the acquisition of 100.0% equity interest in Allo Technology Sdn. Bhd. (‘Allo’) (formerly known as Setia
Haruman Technology Sdn. Bhd. (‘SHTech’)) from Setia Haruman Sdn. Bhd. (‘SHSB’) on 8 March 2018.^ On 1 March 2018, Tenaga Wind Ventures (‘TWV’) UK Ltd. acquired 100.0% of economic interest in GVO and BCL for a purchase
consideration of GBP77.4 million in cash and future consideration of GBP13.4 million through Share Purchase Agreements (‘SPAs’).
Capital and other commitments for the subsidiaries are disclosed in Note 41. There are no material contingent liabilities relating to the subsidiaries.
The NCI is not material to the financial performance, financial position and cash flows of the Group. The NCI information for KEV, SESB and JEP, which contribute to substantial portion of total NCI is set out below:
KEV SESB JEP
Otherindividually
immaterial NCI Total
31.12.2018
RM’million
31.12.2017
RM’million
31.12.2018
RM’million
31.12.2017(Restated)
RM’million
31.12.2018
RM’million
31.12.2017
RM’million
31.12.2018
RM’million
31.12.2017
RM’million
31.12.2018
RM’million
31.12.2017(Restated)
RM’million
Carrying amount of NCI 186.5 218.7 231.5 175.6 688.6* 449.6 107.5 79.3 1,214.1 923.2
Financial year/period ended
Total comprehensive (expenses)/ income allocated to NCI (32.2) (12.0) 55.9 25.5 (16.0) (3.6) 13.6 (23.7) 21.3 (13.8)
* Included in carrying amount of NCI in JEP is a subscription of RPS by NCI via conversion of amount due to NCI amounting to RM255.0 million.

About TNB
Our Business
Business Context
Performance Review
Sustainability Statement
The Strength of Our Governance
Financial Statements
Additional InformationIntegrated Annual Report 2018
Tenaga Nasional Berhad
p.207 Notes to the Financial Statements
15 SUBSIDIARIES (CONTINUED)
The summarised financial information of KEV, SESB and JEP before inter-company eliminations are as follows:
KEV SESB JEP
31.12.2018
RM’million
31.12.2017
RM’million
31.12.2018
RM’million
31.12.2017(Restated)
RM’million
31.12.2018
RM’million
31.12.2017
RM’million
Summarised statement of financial position
Non-current assets 1,904.3 2,086.0 7,552.8 7,358.0 10,683.2 8,207.2
Current assets 1,988.9 1,759.7 1,580.4 1,345.8 1,306.2 2,885.4
Non-current liabilities (1,843.3) (2,267.4) (6,244.3) (6,194.5) (8,980.6) (8,962.3)
Current liabilities (1,591.0) (1,034.6) (2,170.4) (1,792.6) (793.2) (714.1)
Net assets/(liabilities) 458.9 543.7 718.5 716.7 2,215.6 (1,416.2)
Summarised statement of comprehensive income
Financial year/period ended
Revenue 2,244.9 747.6 2,148.4 622.5 0 0
(Loss)/Profit after tax (80.4) (29.9) 174.4 161.5 (53.4) (11.9)
Other comprehensive (expense)/income 0 0 (154.0) (7.5) 0 0
Total comprehensive (expense)/income (80.4) (29.9) 20.4 154.0 (53.4) (11.9)
Summarised statement of cash flows
Financial year/period ended
Net cash flows generated from/(used in) operating activities 494.0 277.1 1,108.9 376.9 352.1 (194.3)
Net cash flows generated from/(used in) investing activities 29.9 2.2 (878.3) (158.3) (168.4) 167.1
Net cash flows (used in)/generated from financing activities (385.4) (4.8) (222.0) (65.4) (98.2) 57.3
Net increase in cash and cash equivalents 138.5 274.5 8.6 153.2 85.5 30.1

About TNB
Our Business
Business Context
Performance Review
Sustainability Statement
The Strength of Our Governance
Financial Statements
Additional Information
p.208 Notes to the Financial Statements
16 JOINT ARRANGEMENTS
Accounting Policy
A joint arrangement is an arrangement over which there is contractually agreed sharing of control by the Group with one or more parties where decisions about the relevant activities relating to the joint arrangement require unanimous consent of the parties sharing control. The classification of a joint arrangement as a joint operation or a joint venture depends upon the rights and obligations of the parties to the arrangement. A joint venture is a joint arrangement whereby the joint venturers have rights to the net assets of the arrangement. Joint operations are joint arrangements whereby the Company has the rights to the assets and obligations for the liabilities. In respect of its interests in joint operations, the Company shall recognise in its financial statements the assets that it controls and the expenses and liabilities that it incurs and its share of the income that it earns from the sale of goods or services.
The Group’s interest in joint ventures is accounted for in the consolidated financial statements using the equity method of accounting.
Equity accounting involves recognising in the consolidated statement of profit or loss, consolidated statement of OCI and consolidated statement of changes in equity, the Group’s share of profits less losses of the joint ventures based on the latest audited financial statements or management accounts of the joint ventures, made up to the financial year end of the Group. Where necessary, adjustments are made to the results and net assets of the joint ventures to ensure consistency of accounting policies with those of the Group. The Group’s investments in joint ventures are recorded at cost inclusive of goodwill and adjusted thereafter for accumulated impairment losses and the post-acquisition change in the Group’s share of net assets of the joint ventures.
Unrealised gains on transactions between the Group and its joint ventures are eliminated to the extent of the Group’s interest in joint ventures. Unrealised losses are also eliminated on the same basis but only to the extent of the costs that can be recovered, and the balances that provide evidence of reduction in net realisable value or an impairment of the asset transferred are recognised in the consolidated statement of profit or loss.
(a) Joint ventures
Group Company
31.12.2018RM’million
31.12.2017RM’million
31.12.2018RM’million
31.12.2017RM’million
Unquoted shares 82.7 81.7 7.9 7.9
Share of post-acquisition results and reserves 91.2 79.3 0 0
173.9 161.0 7.9 7.9
Less: Accumulated impairment losses (7.9) (7.9) (7.9) (7.9)
166.0 153.1 0 0
Share of net assets of joint ventures 166.0 153.1
None of the joint ventures are material individually to the financial position, financial performance and cash flows of the Group.
The aggregated financial information of the Group’s joint ventures is as follows:
Total
Financialyear ended 31.12.2018RM’million
Financialperiod ended
31.12.2017RM’million
Group’s share of results:
Profit after tax and total comprehensive income 27.2 7.7
Dividend received 15.3 6.9

About TNB
Our Business
Business Context
Performance Review
Sustainability Statement
The Strength of Our Governance
Financial Statements
Additional InformationIntegrated Annual Report 2018
Tenaga Nasional Berhad
p.209 Notes to the Financial Statements
16 JOINT ARRANGEMENTS (CONTINUED)
(a) Joint ventures (continued)
The details of the Group’s joint ventures are as follows:
Name of joint venture
Group’s interest
Principal activitiesCountry ofincorporation31.12.2018 31.12.2017
Seatrac Sdn. Bhd. 50% 50% Dormant Malaysia
Joint ventures of TNB Energy Services Sdn. Bhd.
FTJ Bio Power Sdn. Bhd. 40% 40% Generation and distribution of electricity using palm empty fruit bunches as its main fuel source
Malaysia
Metrosphere Hydro Tersat Sdn. Bhd.
49% - Business related in hydro power plant and general trading
Malaysia
Joint venture of TNB Engineering Corporation Sdn. Bhd.
Airport Cooling Energy Supply Sdn. Bhd.
77% 77% To develop, design, engineer, procure, construct, finance district cooling projects in the airport sector, to undertake the comprehensive operational maintenance of district cooling projects in the airport sector and to carry on the business of producing, distributing, applying, dealing and selling of chilled water
Malaysia
(b) Joint operations
The details of the Group’s joint operations are as follows:
Name of joint operation
Group’s interest
Principal activitiesCountry ofincorporation31.12.2018 31.12.2017
Joint operations of TNB Repair And Maintenance Sdn. Bhd.
TNB Repair And Maintenance Sdn. Bhd. & Kharafi National KSC JV (Closed) (‘TNB REMACO & KN JV’)
50% 50% Operation and maintenance services in the State of Kuwait
Malaysia
TNB Repair And Maintenance Sdn. Bhd. & Al-Dhow Engineering General Trading & Contracting Co. W.L.L JV (‘TNB REMACO & Al-Dhow JV’)
50% - Maintenance works for instrumentation & control systems and mechanical equipment services in the State of Kuwait
Malaysia
The impact of the Group’s joint operations to the Group is immaterial.

About TNB
Our Business
Business Context
Performance Review
Sustainability Statement
The Strength of Our Governance
Financial Statements
Additional Information
p.210 Notes to the Financial Statements
17 ASSOCIATES
Accounting Policy
Associates are all entities over which the Group has significant influence but not control or joint control, generally accompanying a shareholding of between 20.0% and 50.0% of the voting rights.
Investments in associates are accounted for in the consolidated financial statements using the equity method of accounting and are initially recognised at cost. Equity accounting is discontinued when the Group ceases to have significant influence over the associates.
The Group’s share of its associates’ post-acquisition profits or losses is recognised in the statement of profit or loss, and its share of post-acquisition movements is recognised in OCI. The cumulative post-acquisition movements are adjusted against the carrying amount of the investment. When the Group’s share of losses in an associate equals or exceeds its interests in the associate, including any long-term interests that, in substance, form part of the Group’s net investment in the associate, the Group does not recognise further losses, unless it has incurred legal or constructive obligations or made payments on behalf of the associate. If the associate subsequently reports profits, the Group resumes recognising its share of those profits only after its share of the profits equals the share of losses not recognised. The Group’s investments in associates include goodwill identified on acquisition, net of any accumulated impairment losses (Note 3(c)).
Profits and losses resulting from upstream and downstream transactions between the Group and its associates are recognised in the Group’s financial statements only to the extent of unrelated investor’s interests in the associates. Unrealised losses are eliminated unless the transaction provides evidence of an impairment of the asset transferred. Accounting policies of associates have been changed where necessary to ensure consistency with the policies adopted by the Group.
Dilution of gains and losses in associates are recognised in the consolidated statement of profit or loss.
If the ownership interest in an associate is reduced but significant influence is retained, only a proportionate share of the amounts previously recognised in OCI is reclassified to profit or loss where appropriate.
Group Company
31.12.2018RM’million
31.12.2017RM’million
31.12.2018RM’million
31.12.2017RM’million
Unquoted shares 2,736.4 2,736.4 50.6 50.6
Share of post-acquisition results and reserves (492.1) (49.7) 0 0
Redeemable preference shares 102.1 112.5 9.3 19.7
2,346.4 2,799.2 59.9 70.3
Less: Accumulated impairment losses (802.7) 0 0 0
Share of net assets of associates 1,543.7 2,799.2 59.9 70.3
The aggregated financial information of the Group’s associates is as follows:
Total
Financialyear ended 31.12.2018RM’million
Financialperiod ended
31.12.2017RM’million
Group’s share of results:
Loss after tax (209.9) (44.7)
Total OCI 74.3 94.2
Dividend received 29.6 18.0
Foreign exchange loss (277.2) (170.1)

About TNB
Our Business
Business Context
Performance Review
Sustainability Statement
The Strength of Our Governance
Financial Statements
Additional InformationIntegrated Annual Report 2018
Tenaga Nasional Berhad
p.211 Notes to the Financial Statements
17 ASSOCIATES (CONTINUED)
In the opinion of the Directors, the associates that are material to the Group are Gama Enerji and GEL. The following summarises the financial information of material associates to the Group and reconciles the information to the carrying amount of the Group’s interest in the associates.
(a) The summarised statement of comprehensive income from material associates that is significant to the Group:
Gama Enerji GEL
Financialyear ended 31.12.2018RM’million
Financialperiod ended
31.12.2017RM’million
Financialyear ended 31.12.2018RM’million
Financialperiod ended
31.12.2017RM’million
Revenue 2,149.4 826.0 1,221.2 963.7
Loss after tax from:
- Continued operation (1,677.6) (7.2) (82.2) (227.0)
- Discontinued operation 0 0 (174.8) 0
Other comprehensive income/(expense) 514.5 289.0 (4.9) 44.0
Total comprehensive (expense)/income (1,163.1) 281.8 (261.9) (183.0)
(b) The summarised statement of financial position from material associates that is significant to the Group:
Gama Enerji GEL
31.12.2018RM’million
31.12.2017RM’million
31.12.2018RM’million
31.12.2017RM’million
Non-current assets 6,017.0 7,092.9 5,354.0 5,974.6
Current assets 897.6 896.1 554.0 702.8
Non-current liabilities (4,997.2) (4,430.2) (2,812.0) (3,496.5)
Current liabilities (1,071.2) (1,083.0) (1,277.0) (1,096.9)
Less: NCI 1.2 (66.5) (108.0) (119.2)
847.4 2,409.3 1,711.0 1,964.8
(c) Reconciliation of the summarised financial information of material associates presented to the carrying amount of its interest in the associates:
Gama Enerji GEL
31.12.2018RM’million
31.12.2017RM’million
31.12.2018RM’million
31.12.2017RM’million
Group’s share of net assets 254.2 722.8 513.3 589.4
Goodwill 152.3 207.1 523.4 557.8
Less: Share of loss not equity accounted:
- Loss after tax 274.8 0 0 0
- Other comprehensive income (94.7) 0 0 0
Less: Impairment losses (498.0) 0 (304.7) 0
Foreign exchange (88.6) 0 0 0
Carrying amount 0 929.9 732.0 1,147.2

About TNB
Our Business
Business Context
Performance Review
Sustainability Statement
The Strength of Our Governance
Financial Statements
Additional Information
p.212 Notes to the Financial Statements
17 ASSOCIATES (CONTINUED)
(d) Put option over shares held by NCI in Gama Enerji
The Company via the shareholders agreement, granted the other NCI of Gama Enerji a put option which allows the NCI to sell all or part of their equity interest respectively to the majority shareholder and the Company at a price based on the fair market value at the exercised date (exercisable at any time for the period from 1 July 2019 to 31 December 2020) or at a price determined at higher of Earnings Before Interest, Tax, Depreciation and Amortisation (‘EBITDA’) with a fixed multiple or the adjusted initial cost of investment of the NCI (exercisable at any time if the Company defaults on the shareholders agreement). The fair value of the put option is not significant as at 31 December 2018.
Individually immaterial associates:
31.12.2018RM’million
31.12.2017RM’million
Aggregate carrying amount of individually immaterial associates 811.7 722.1
Aggregate amounts of the Group’s share of profit:
- Profit after tax 95.7 25.6
- Other comprehensive income/(expense) 16.1 (5.7)
The details of the Group’s associates are as follows:
Name of associate
Group’s interest
Principal activitiesCountry ofincorporation31.12.2018 31.12.2017
Teknologi Tenaga Perlis Consortium Sdn. Bhd.
20% 20% Design, construction, divesting, operation and maintenance of electricity generating facility
Malaysia
GB3 Sdn. Bhd. 20% 20% Design, construction, operation and maintenance of electricity generating facility
Malaysia
Fibrecomm Network (M) Sdn. Bhd. 49% 49% Provision of fibre optic transmission network services
Malaysia
Jimah Energy Ventures Holdings Sdn. Bhd.
20% 20% Investment holdings Malaysia
Associate of TNB Properties Sdn. Bhd.KM Metro-TNB Properties Sdn. Bhd. 40% 40% Dormant Malaysia
Associate of TNB Ventures Sdn. Bhd.
Northern Utility Resources Sdn. Bhd. (Dissolved w.e.f 5.12.2018)
- 20% Dormant Malaysia
Associate of Independent Power International Ltd.
Malaysian Shoaiba Consortium Sdn. Bhd.
20% 20% Acquiring and hold for investment, shares, stocks, debentures in Malaysia or elsewhere
Malaysia
Associate of Power and Energy International (Mauritius) Ltd.
GMR Energy Limited 30% 30% Development, operation and maintenance of power generation projects and sale of power to off-takers
India
Associate of Oasis Parade Sdn. Bhd.Saudi-Malaysia Operation And
Maintenance Services Company Limited
30% 30% Operation and maintenance of electricity generation stations and water desalination plants
Kingdom of Saudi Arabia

About TNB
Our Business
Business Context
Performance Review
Sustainability Statement
The Strength of Our Governance
Financial Statements
Additional InformationIntegrated Annual Report 2018
Tenaga Nasional Berhad
p.213 Notes to the Financial Statements
17 ASSOCIATES (CONTINUED)
The details of the Group’s associates are as follows: (continued)
Name of associate
Group’s interest
Principal activitiesCountry ofincorporation31.12.2018 31.12.2017
Associates of TNB Energy Services Sdn. Bhd.
Jana Landfill Sdn. Bhd. 20% 20% Generation and distribution of heat and electricity using methane gas from landfill sites
Malaysia
Sime Darby TNBES Renewable Energy Sdn. Bhd.
49% 49% To develop, set up, construct, install, operate and maintain renewable energy or biogas power plant which uses the palm oil mill effluent as its main source of fuel
Malaysia
Associate of TNB Engineering Corporation Sdn. Bhd.
Abraj Cooling LLC 49% 49% Contracting works for the construction of district cooling plants
United Arab Emirates
Associate of TNB Research Sdn. Bhd.
Gunung Tenaga Sdn. Bhd. 40% 40% Environmental services and research Malaysia
Associate of Orion Mission Sdn. Bhd.
Eastern Sabah Power Consortium Sdn. Bhd.
50% 50% To develop, construct and operate a gas-fired power plant and to generate and sell electricity. The company has not commenced its operation since the date of incorporation
Malaysia
Associate of Global Power Enerjî Sanayî Ve Tîcaret Anonîm Şîrketî
Gama Enerji Anonîm Şîrketî 30% 30% To enter into commitments related to energy investments and to carry out industrial, commercial and business activities
Turkey
Associate of Pelabuhan Lumut Sdn. Bhd.
Lumut Maritime Terminal Sdn. Bhd. 50% less1 share
50% less1 share
Development of an integrated privatised project encompassing ownership and operations of multi-purpose port facilities, operation and maintenance of a bulk terminal, sales and rental of port related land and other ancillary activities
Malaysia
Associate of TNB International Sdn. Bhd.
Vortex Solar Investment S.A.R.L. 50% 50% Investment holding company Luxembourg

About TNB
Our Business
Business Context
Performance Review
Sustainability Statement
The Strength of Our Governance
Financial Statements
Additional Information
p.214 Notes to the Financial Statements
17 ASSOCIATES (CONTINUED)
The list of contingent liabilities of material associates are as follows:
Potentialexposure
31.12.2018RM’million
Potentialexposure
31.12.2017RM’million
Gama Enerji
Letters of guarantee 345.2 493.3
The letters of guarantee are mainly provided to certain regulators within the energy market and Ministry of Water and Irrigation of Jordan.
GEL
(a) Corporate guarantees 357.6 381.1
(b) Bank guarantees outstanding/Letter of credit outstanding 226.4 880.8
(c) Claims against the GEL Group not acknowledged as debts 1,039.4 165.2
(d) Matters relating to income tax under dispute 52.4 55.8
(e) Disputed arrears of electricity charges 6.2 0
(f) Disputed entry tax liabilities 95.9 0
(g) Disputed demand for deposit of fund setup by Water Resource department 31.3 0
(h) Custom duties refunds In 2010, a subsidiary of GEL was granted a refund of customs duty which was paid earlier towards
the import of plant and machinery. In 2011, the subsidiary received an intimation from the Office of the Joint Director General of Foreign Trade (‘DGFT’) for cancellation of duty drawback refund order granted thereby seeking refund of the amount that has been received earlier.
In the opinion of experts, the management is confident that the duty drawback refund granted earlier was appropriate and that the cancellation of the duty drawback refund is not tenable. During the financial year ended 31 March 2015, the matter has been transferred to the Hon‘ble Supreme Court of India and will be concluded along with other similar cases and is pending finalisation.
35.2 37.5
(i) Payment of electricity duty towards Chief Electrical Inspectorate, Government of Andhra Pradesh (‘GoAP’) The associate and a subsidiary received demands from the Chief Electrical Inspectorate, GoAP for
electricity duties on generation and sale of electrical energy since the commencement of commercial operations date of its plants.
Based on internal assessment and expert legal opinion, the management of GEL is confident that the provisions of Electricity Duty Act and Rules, 1939 in respect of payment of electricity duty are not applicable to GEL.
46.3 49.4
(j) Appeals and disputes GEL is in dispute with its fuel supplier which is currently being heard at the District Civil Court of Bangalore. Based on independent legal opinion and internal assessment, the management of GEL is confident
that it has a strong defense against these claims.
162.5 173.2
(k) Amount payable to vendors GEL group has an amount payable in foreign currency to certain vendors, which is outstanding for
more than 3 years. The Group has applied for condonation of delay with the Reserve Bank of India.
14.6 0
Total exposure 2,067.8 1,743.0
Total exposure of the Group 723.9 670.9

About TNB
Our Business
Business Context
Performance Review
Sustainability Statement
The Strength of Our Governance
Financial Statements
Additional InformationIntegrated Annual Report 2018
Tenaga Nasional Berhad
p.215 Notes to the Financial Statements
17 ASSOCIATES (CONTINUED)
(a) Impairment test on Gama Enerji
During the financial year, the Group had undertaken the impairment assessment of its investment in Gama Enerji following an impairment indicator arising from the adverse foreign exchange movements which resulted in volatility of electricity prices and fuel prices and translation losses arising from borrowings denominated in foreign currencies. An impairment charge of RM498.0 million was recognised for the carrying amount of Gama Enerji as at 31 December 2018 as its recoverable amount is lower than its carrying amount.
Key assumptions used
The recoverable amount was determined based on VIU calculation, which apply a discounted cash flow model based on management’s forecasts and projections. These forecasts and projections reflect management’s expectations based on the current assessment of macroeconomics trends, currency movement, expectations of market growth and industry growth as benchmarked with external sources.
The key assumptions used in determining the VIU are:
Assumptions: %
Cost of equity 16.3 - 31.5
Terminal growth rate 2.4 - 2.8
The Group’s review includes impact assessment of changes in key assumptions. The effect of the movement in the key assumptions to the recoverable amount is as follows:
Key assumptions:Changes in
assumptions
Impact to recoverable amount
IncreaseRM’million
DecreaseRM’million
Discount rate 1.0% (11.5) 13.1
Terminal growth rate 1.0% 8.8 (8.1)
(b) Impairment test on GEL
During the financial year, the Group had undertaken the test of impairment of its investment in GEL following an impairment indicator arising from the delay in commencement of operations for certain power plants in GEL group and the shortage of fuel supply. An impairment loss of RM304.7 million was required for the carrying amount of GEL as at 31 December 2018 as its recoverable amount is lower than its carrying amount.
Key assumptions used
The recoverable amount was determined based on VIU calculation, which apply a discounted cash flow model of GEL for the period of the remaining useful lives of the respective power plants of the group which range between 15 to 40 years. The cash flows used are the most recent forecast and projections approved by management of GEL.

About TNB
Our Business
Business Context
Performance Review
Sustainability Statement
The Strength of Our Governance
Financial Statements
Additional Information
p.216 Notes to the Financial Statements
17 ASSOCIATES (CONTINUED)
(b) Impairment test on GEL (continued)
The key assumptions used in determining the VIU are:
Assumptions: %
Average Plant Availability Factor 47.2 - 51.2
Average Plant Load Factor 50.0 - 85.0
Cost of equity 14.1 - 19.3
The cash flows are discounted using cost of equity based on the risk specific to the investments. The key assumptions take into account the macroeconomic environment in India.
The Group’s review includes impact assessment of changes in key assumptions. The effect of the movement in the key assumptions to the recoverable amount is as follows:
Key assumptions:Changes in
assumptions
Impact to recoverable amount
IncreaseRM’million
DecreaseRM’million
Plant Availability Factor 5.0% 27.7 (13.9)
Plant Load Factor 10.0% 169.0 (178.7)
Discount rate 1.0% (55.6) 72.6
18 GOODWILL ON CONSOLIDATION
Accounting Policy
Goodwill arises from a business combination and represents the excess of the aggregate of fair value of consideration transferred, the amount of any non-controlling interest in the acquiree and the fair value of any previous equity interest in the acquiree over the fair value of the net identifiable assets acquired and liabilities assumed on the acquisition date. If the fair value of consideration transferred, the amount of non-controlling interest and the fair value of previously held interest in the acquiree are less than the fair value of the net identifiable assets of the acquiree, the resulting gain is recognised in profit or loss.
Goodwill is tested for impairment annually or more frequently if events or changes in circumstances indicate that it might be impaired, and carried at cost less accumulated impairment losses. For the purpose of impairment testing, goodwill acquired in a business combination is allocated to each of the cash generating units (‘CGU’s), or groups of CGUs, that is expected to benefit from synergies of the combination. Each unit or group of units to which the goodwill is allocated represents the lowest level within the entity at which the goodwill is monitored for internal management purposes. The carrying value of goodwill is compared to the recoverable amount, which is the higher of value in use and the fair value less costs of disposal. Any impairment is recognised immediately to the statement of profit or loss and is not subsequently reversed. Gains and losses on the disposal of an entity include the carrying amount of goodwill relating to the entity disposed.
Group
31.12.2018RM’million
31.12.2017RM’million
As at the beginning of the financial year/period 211.0 211.0
Acquisition of subsidiaries (Note 48) 29.7 0
As at the end of the financial year/period 240.7 211.0

About TNB
Our Business
Business Context
Performance Review
Sustainability Statement
The Strength of Our Governance
Financial Statements
Additional InformationIntegrated Annual Report 2018
Tenaga Nasional Berhad
p.217 Notes to the Financial Statements
18 GOODWILL ON CONSOLIDATION (CONTINUED)
Impairment tests for goodwill
Annual impairment test is conducted on the Group as a whole excluding its operations and investments in overseas, as it is treated as a CGU. No impairment loss was required as at 31 December 2018 as the recoverable amount exceeded the carrying amount.
The recoverable amount of the CGU including goodwill, is determined based on its VIU. This VIU calculation applies a discounted cash flow model using cash flow projection based on forecast approved by management covering a five-year period. The forecast reflects management’s expectation of revenue growth, operating costs and margins for the Group based on current assessment of market share, expectations of market growth and industry growth. Cash flows beyond the fifth year are extrapolated using an estimated terminal growth rate.
The discount rate applied to the cash flow forecast refers to the industry’s pre-tax Weighted Average Cost of Capital (‘WACC’).
The following key assumptions have been applied in the VIU calculation:
31.12.2018%
31.12.2017%
Revenue growth rate 3.1 3.8
Pre-tax discount rate 9.6 9.6
Terminal growth rate 3.1 3.8
The Group’s review includes an impact assessment of changes in key assumptions used. Based on the sensitivity analysis performed, it was concluded that no reasonable change in the base case assumptions would cause the carrying amount of the CGU to exceed its recoverable amount.
No impairment assessment performed on goodwill which arose from the acquisition of the newly acquired foreign subsidiaries as the amount is not material.
19 INVESTMENT IN UNQUOTED DEBT SECURITY
Accounting Policy
Investment in unquoted debt security is a financial instrument and the accounting policy is disclosed in Note 45.
Group Company
31.12.2018RM’million
31.12.2017RM’million
31.12.2018RM’million
31.12.2017RM’million
Preferred Equity Certificate (‘PEC’) 318.0 318.5 0 0
Unsecured Loan Notes 8.7 0 8.7 0
Total 326.7 318.5 8.7 0
The PEC earns interest of 8.0% (FPE 31.12.2017: 8.0%) per annum and has a maturity period of 12 years.
Credit risks relating to debt instruments above are disclosed in Note 45(b) to the financial statements.

About TNB
Our Business
Business Context
Performance Review
Sustainability Statement
The Strength of Our Governance
Financial Statements
Additional Information
p.218 Notes to the Financial Statements
20 DEFERRED TAXATION
Accounting Policy
Deferred tax is recognised on temporary difference arising between the tax bases of assets and liabilities and their carrying amounts in the financial statements including those arising from business combinations. Deferred tax is not recognised on goodwill and those arising from initial recognition of an asset or liability which at the time of the transaction affects neither accounting nor taxable profit or loss.
Deferred tax assets are recognised to the extent that it is probable that taxable profit will be available against which the deductible temporary differences, unused tax losses and unutilised tax credits can be utilised. Deferred tax is recognised on temporary differences arising on investment in subsdiaries, joint ventures and associates except where the timing of the reversal of the temporary difference can be controlled and it is probable that the temporary differences will not reverse in the foreseeable future.
Under the Malaysia Finance Act 2018 which was gazetted on 27 December 2018, the Group’s unutilised tax losses with no expiry period amounting to RM2,598.3 million as at 31 December 2018 will be imposed with a time limit of utilisation. Any accumulated unutilised tax losses brought forward from year of assessment 2018 can be carried forward for another 7 consecutive years of assessment (i.e. from year of assessments 2019 to 2025).
Tax benefit from reinvestment allowance is recognised when the tax credit is utilised and no deferred tax asset is recognised when the tax credit is receivable.
Deferred tax is measured at the tax rates (and laws) that have been enacted or substantially enacted at the end of the reporting period and are expected to apply when the related deferred tax asset is realised or the deferred tax liability is settled.
Deferred tax assets and liabilities are offset when there is a legally enforceable right to set off current tax assets against current tax liabilities and when the deferred taxes relate to the same tax authority. The following amounts, determined after appropriate offsetting, are shown in the statement of financial position:
Group Company
31.12.2018
RM’million
31.12.2017(Restated)
RM’million
1.9.2017(Restated)
RM’million
31.12.2018
RM’million
31.12.2017
RM’million
Deferred tax assets:
- Deferred tax assets to be realised after more than 12 months 47.9 42.1 37.4 0 0
- Deferred tax assets to be realised within 12 months 39.8 26.2 39.6 0 0
87.7 68.3 77.0 0 0
Deferred tax liabilities:
- Deferred tax liabilities to be realised after more than 12 months (7,755.8) (7,258.6) (7,086.6) (6,414.0) (5,905.7)
- Deferred tax liabilities to be settled within 12 months (253.5) (387.1) (641.8) (251.4) (384.2)
(8,009.3) (7,645.7) (7,728.4) (6,665.4) (6,289.9)
Deferred tax assets 87.7 68.3 77.0 0 0
Deferred tax liabilities (8,009.3) (7,645.7) (7,728.4) (6,665.4) (6,289.9)
Net total (7,921.6) (7,577.4) (7,651.4) (6,665.4) (6,289.9)

About TNB
Our Business
Business Context
Performance Review
Sustainability Statement
The Strength of Our Governance
Financial Statements
Additional InformationIntegrated Annual Report 2018
Tenaga Nasional Berhad
p.219 Notes to the Financial Statements
20 DEFERRED TAXATION (CONTINUED)
The movements during the financial year/period relating to deferred tax are as follows:
Group Company
31.12.2018
RM’million
31.12.2017(Restated)
RM’million
31.12.2018
RM’million
31.12.2017
RM’million
As at the beginning of the financial year/period (7,577.4) (7,651.4) (6,289.9) (6,339.9)
Adjustment on adoption of MFRS 9 (Note 47) 32.5 0 32.2 0
As at the beginning of the financial year/period (Restated) (7,544.9) (7,651.4) (6,257.7) (6,339.9)
(Charged)/Credited to statement of profit or loss: (Note 11)
- Property, plant and equipment (254.5) (0.4) (268.1) 38.5
- Provisions and allowances 72.6 (5.0) 29.9 (32.9)
- Unbilled revenue (76.4) 48.2 (76.4) 48.2
- Finance leases 111.1 49.0 14.7 7.6
- Prepaid operating leases (119.6) (49.4) (123.8) (42.9)
(266.8) 42.4 (423.7) 18.5
Credited to OCI:
- Provisions and allowances 16.0 31.6 16.0 31.5
Acquisition of subsidiaries (125.9) 0 0 0
As at the end of the financial year/period (7,921.6) (7,577.4) (6,665.4) (6,289.9)
Group Company
31.12.2018
RM’million
31.12.2017(Restated)
RM’million
1.9.2017(Restated)
RM’million
31.12.2018
RM’million
31.12.2017
RM’million
Subject to income tax
Deferred tax assets (before offsetting):
- Provisions and allowances 4,611.2 4,490.1 4,463.5 3,236.0 3,157.9
- Finance leases 377.7 266.6 217.6 412.7 398.0
- Property, plant and equipment 41.8 36.7 30.1 0 0
Offsetting (4,943.0) (4,725.1) (4,634.2) (3,648.7) (3,555.9)
Deferred tax assets (after offsetting) 87.7 68.3 77.0 0 0
Deferred tax liabilities (before offsetting):
- Property, plant and equipment (10,594.6) (10,209.1) (10,202.1) (8,105.7) (7,837.6)
- Unbilled revenue (788.0) (711.6) (759.8) (788.0) (711.6)
- Prepaid operating leases (1,569.7) (1,450.1) (1,400.7) (1,420.4) (1,296.6)
Offsetting 4,943.0 4,725.1 4,634.2 3,648.7 3,555.9
Deferred tax liabilities (after offsetting) (8,009.3) (7,645.7) (7,728.4) (6,665.4) (6,289.9)

About TNB
Our Business
Business Context
Performance Review
Sustainability Statement
The Strength of Our Governance
Financial Statements
Additional Information
p.220 Notes to the Financial Statements
20 DEFERRED TAXATION (CONTINUED)
The amount of deductible temporary differences, unused tax losses, reinvestment allowance and investment tax allowance for which no deferred tax asset is recognised in the statement of financial position are as follows:
Group Company
31.12.2018
RM’million
31.12.2017(Restated)
RM’million
1.9.2017(Restated)
RM’million
31.12.2018
RM’million
31.12.2017
RM’million
Deductible temporary differences 1,516.1 1,482.9 1,446.9 0 0
Tax losses* 1,570.8 1,488.9 1,472.2 0 0
Reinvestment allowance and investment tax allowance* 5,328.9 6,243.3 8,049.9 0 914.4
* The amount of unused tax losses, reinvestment allowance and investment tax allowance as at 31 December 2018 will expire in year of assessment 2025.
21 LONG TERM RECEIVABLES
Accounting Policy
Long term receivables is a financial instrument and the accounting policy is disclosed in Note 45.
Note
Group Company
31.12.2018
RM’million
31.12.2017
RM’million
31.12.2018
RM’million
31.12.2017(Restated)
RM’million
1.9.2017(Restated)
RM’million
Financial assets:
- Other receivables (a) 102.7 249.5 86.1 197.0 200.6
Non-financial assets:
- Advance payment to contractors (b) 292.8 319.0 0 0 0
- Indirect tax (c) 850.0 260.9 174.4 0 0
1,245.5 829.4 260.5 197.0 200.6
(a) Included in the Group and Company are advances given to staff and other non-trade receivables, which are not expected to be received within 12 months from the statement of financial position date.
In the previous financial period/year, other debtors include loans to students. These balances have been reclassified to FVTPL on adoption of MFRS 9.
Credit risks are disclosed in Note 45(b) to the financial statements.
(b) Advance payment to contractors primarily relates to construction of plants which will be utilised against milestone payment invoices, which is more than 12 months.
(c) Included in the Group and Company are indirect tax receivables which are not expected to be received within 12 months from the statement of financial position date.

About TNB
Our Business
Business Context
Performance Review
Sustainability Statement
The Strength of Our Governance
Financial Statements
Additional InformationIntegrated Annual Report 2018
Tenaga Nasional Berhad
p.221 Notes to the Financial Statements
22 AMOUNTS DUE FROM/(TO) SUBSIDIARIES
Note
Company
31.12.2018
RM’million
31.12.2017(Restated)
RM’million
1.9.2017(Restated)
RM’million
Non-current
Amounts due from subsidiaries 2,494.6 2,467.1 3,460.0
Less: Loss allowances (1,442.6) (1,253.7) (1,250.2)
(a) 1,052.0 1,213.4 2,209.8
Current
Amounts due from subsidiaries 4,674.7 4,990.9 3,906.0
Less: Loss allowances (971.8) (804.0) (808.7)
(b) 3,702.9 4,186.9 3,097.3
Amounts due to subsidiaries (b) (1,459.4) (1,086.3) (1,258.1)
(a) Amount due from SESB is subject to interest rates of 6.0% (FPE 31.12.2017: 6.0%) per annum, is unsecured and has no fixed term of repayment.
Amount due from KEV relating to the Redeemable Unsecured Loan Stocks (‘RULS’) bears interest at 8.0% (FPE 31.12.2017: 8.0%) per annum on the outstanding nominal value of the principal. The principal and interest due from KEV are amounting to RM744.6 million (FPE 31.12.2017: RM781.4 million). Refer to Note 36(c) for the RULS terms.
(b) Amounts due from/(to) all subsidiaries are classified as current are unsecured, interest free and repayable on demand.
Credit risks are disclosed in Note 45(b) to the financial statements.

About TNB
Our Business
Business Context
Performance Review
Sustainability Statement
The Strength of Our Governance
Financial Statements
Additional Information
p.222 Notes to the Financial Statements
23 FINANCE LEASES
Accounting Policy
A lease is an agreement whereby the lessor conveys to the lessee in return for a payment, or series of payments, the right to use an asset for an agreed period of time.
The Group and Company enter into lease agreements as lessees for certain PPE. Leases of PPE where the Group and Company have substantially transferred all the risks and rewards of ownership (i.e. the Group is the lessor), and leases of PPE where the lessors have substantially transferred all the risks and rewards of ownership to the Group and Company (i.e. the Group is the lessee), are classified as finance leases.
When assets are leased out under finance lease, the Group derecognises the leased asset and recognises the net investment in the lease as a receivable. The difference between the gross receivable and the present value of the receivable is recognised as unearned finance income. Lease income is recognised over the term of the lease using the net investment method, which reflects a constant periodic rate of return.
When external assets are leased, finance leases are capitalised at the leases’ commencement at the lower of the fair value of the leased assets and the present value of the minimum lease payments. Each lease payment is allocated between the liability and finance charges so as to achieve a constant rate on the finance balance outstanding. The corresponding rental obligations, net of finance charges, are included in other short term and long term payables. The interest element of the finance cost is charged to the statement of profit or loss within finance cost over the lease period so as to produce a constant periodic rate of interest on the remaining balance of the liability for each period. The PPE acquired under finance leases are depreciated or amortised over the lease term. Initial direct costs incurred by the Group in negotiating and arranging finance leases are added to the carrying amount of the leased assets and recognised as an expense in the statement of profit or loss over the lease term on the same basis as the lease expense.
(a) Finance lease receivables
The Group’s finance lease receivables arises predominantly from a Cooling Energy Supply Agreement (‘CESA’). This CESA is accounted for as a finance lease in accordance with IC 4 and MFRS 117.
Group
Minimum lease payments
Present value of minimum lease payments
31.12.2018RM’million
31.12.2017RM’million
31.12.2018RM’million
31.12.2017RM’million
Within 1 year 2.4 2.1 1.0 0.8
After 1 year and not later than 5 years 9.1 9.7 4.9 4.7
After 5 years 9.6 11.6 7.5 8.7
18.7 21.3 12.4 13.4
21.1 23.4 13.4 14.2
Less: Unearned finance income (7.7) (9.2)
Present value of minimum lease payment receivable 13.4 14.2
The effective interest rate implicit in the finance lease is approximately 9.5% (FPE 31.12.2017: 9.5%). The carrying amount of the finance lease receivable approximate to its fair value.

About TNB
Our Business
Business Context
Performance Review
Sustainability Statement
The Strength of Our Governance
Financial Statements
Additional InformationIntegrated Annual Report 2018
Tenaga Nasional Berhad
p.223 Notes to the Financial Statements
23 FINANCE LEASES (CONTINUED)
(b) Finance lease payables
Note
Group Company
31.12.2018RM’million
31.12.2017RM’million
31.12.2018RM’million
31.12.2017RM’million
Finance lease liabilities (i) 4,868.0 5,200.7 16,668.8 17,790.9
Hire purchase creditors (ii) 6.1 9.8 0 0
4,874.1 5,210.5 16,668.8 17,790.9
(i) The Group and Company’s obligations under finance lease liabilities arise predominantly from the power purchase agreements with several IPPs. These power purchase agreements are accounted for as a finance lease in accordance with IC 4 and MFRS 117.
Group Company
31.12.2018RM’million
31.12.2017RM’million
31.12.2018RM’million
31.12.2017RM’million
Minimum lease payments:
- Within 1 year 694.8 693.8 2,142.1 2,247.5
- 1 to 2 years 696.0 694.9 1,932.5 2,142.1
- 3 to 5 years 2,078.7 2,093.1 5,270.8 5,703.5
- More than 5 years 4,031.7 4,713.2 17,149.2 18,648.9
6,806.4 7,501.2 24,352.5 26,494.5
Total minimum lease payments 7,501.2 8,195.0 26,494.6 28,742.0
Future finance charges (2,633.2) (2,994.3) (9,825.8) (10,951.1)
4,868.0 5,200.7 16,668.8 17,790.9
Amount payable under finance lease:
- Within 1 year 354.0 332.7 1,096.1 1,122.1
- After 1 year and not later than 5 years 1,647.1 1,562.7 3,741.2 4,102.4
- After 5 years 2,866.9 3,305.3 11,831.5 12,566.4
4,514.0 4,868.0 15,572.7 16,668.8
4,868.0 5,200.7 16,668.8 17,790.9
Average effective interest rate (%) 7.1 7.0 6.5 6.6
The finance charges associated with the finance leases were charged to the statement of profit or loss in the financial year/period in which they were actually incurred. As at 31 December 2018, the net book value of assets under finance leases for the Group and Company are as disclosed in Note 14 to the financial statements. The fair value of the finance lease liabilities are RM5,213.8 million (FPE 31.12.2017: RM6,808.8 million) for the Group and RM18,435.7 million (FPE 31.12.2017: RM19,486.5 million) for the Company.

About TNB
Our Business
Business Context
Performance Review
Sustainability Statement
The Strength of Our Governance
Financial Statements
Additional Information
p.224 Notes to the Financial Statements
23 FINANCE LEASES (CONTINUED)
(b) Finance lease payables (continued)
(ii) This represents future instalments under hire purchase of motor vehicles, repayable as follows:
Group
31.12.2018RM’million
31.12.2017RM’million
Minimum lease payments:
- Within 1 year 4.0 4.1
- After 1 year and not later than 5 years 2.4 6.4
Total minimum lease payments 6.4 10.5
Future finance charges (0.3) (0.7)
6.1 9.8
Amount payable under hire purchase:
- Within 1 year 3.8 3.7
- After 1 year and not later than 5 years 2.3 6.1
6.1 9.8
Hire purchase liabilities are effectively secured as the rights to the assets revert to the lessors in the event of default.
The weighted average effective interest rate applicable to the lease liabilities as at the financial year end is 5.1% (FPE 31.12.2017: 5.1%) per annum and interest for the financial year is at 2.7% (FPE 31.12.2017: 2.7%) per annum for the Group. The carrying amounts of the hire purchase payables approximate to their fair values.
Reconciliation of finance lease payables during the financial year/period is as follows:
Group Company
31.12.2018 RM’million
31.12.2017 RM’million
31.12.2018 RM’million
31.12.2017 RM’million
As at beginning of the financial year/period 5,210.5 5,318.5 17,790.9 11,871.5
Cash flows (682.7) (232.0) (2,137.7) (638.6)
Non-cash changes
- Additional finance lease 0 0 0 6,255.5
- Transfer (to)/from payables (1.3) 0.6 (109.7) (62.9)
- Finance charges under finance leases (Note 10) 347.6 123.4 1,125.3 365.4
As at end of the financial year/period 4,874.1 5,210.5 16,668.8 17,790.9

About TNB
Our Business
Business Context
Performance Review
Sustainability Statement
The Strength of Our Governance
Financial Statements
Additional InformationIntegrated Annual Report 2018
Tenaga Nasional Berhad
p.225 Notes to the Financial Statements
24 PREPAID OPERATING LEASES
Accounting Policy
Operating leases - where the Group and Company are the lessees
Leases where substantially all of the risks and rewards of ownership are not transferred to the Group are classified as operating leases. Payments made under operating leases (net of any incentives received from the lessor) are charged to the statement of profit or loss within other operating expenses on the straight line basis over the period of the lease.
Operating leases - where the Group and Company are the lessor
Leases where substantially all of the risks and rewards of ownership are not transferred to the lessee (i.e. the Group is a lessor) are classified as operating leases. Payments received under operating leases that relate to sales of electricity are recognised in the statement of profit or loss within revenue on the straight line basis over the period of the lease. All other payments received under operating leases are presented in the statement of profit or loss within other operating income.
(a) Prepaid operating leases
Group Company
31.12.2018RM’million
31.12.2017RM’million
31.12.2018RM’million
31.12.2017RM’million
Non-current
Prepaid operating leases 5,944.1 5,505.2 5,934.9 5,417.0
Current
Prepaid operating leases 164.8 146.2 156.5 137.6
Payments made in advance to IPPs are primarily to reserve generating capacity for future goods and services. There is no contractual right to receive a refund in cash or another financial instrument from the IPPs.
(b) Lease payables and prepayment by lessee
Group Company
31.12.2018RM’million
31.12.2017RM’million
31.12.2018RM’million
31.12.2017RM’million
Non-current
Lease payables* (Note 38) 139.3 128.6 157.5 140.0
Prepayment by lessee** (Note 38) 215.9 301.9 0 0
355.2 430.5 157.5 140.0
Current
Lease payables* (Note 32) 15.6 12.2 15.6 12.2
Prepayment by lessee** (Note 32) 32.4 39.4 0 0
48.0 51.6 15.6 12.2
* The Group and Company as lessees** The Group as lessor
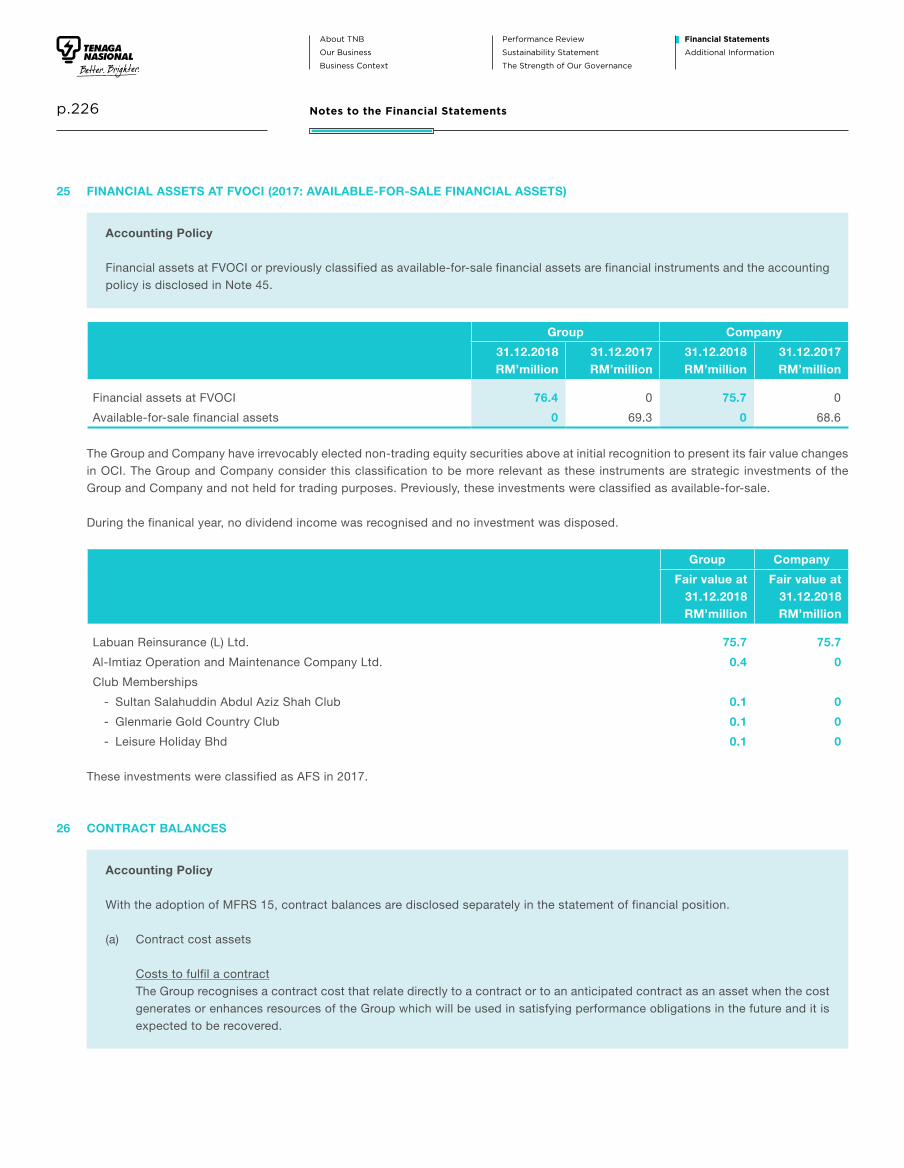
About TNB
Our Business
Business Context
Performance Review
Sustainability Statement
The Strength of Our Governance
Financial Statements
Additional Information
p.226 Notes to the Financial Statements
25 FINANCIAL ASSETS AT FVOCI (2017: AVAILABLE-FOR-SALE FINANCIAL ASSETS)
Accounting Policy
Financial assets at FVOCI or previously classified as available-for-sale financial assets are financial instruments and the accounting policy is disclosed in Note 45.
Accounting Policy
With the adoption of MFRS 15, contract balances are disclosed separately in the statement of financial position.
(a) Contract cost assets
Costs to fulfil a contract The Group recognises a contract cost that relate directly to a contract or to an anticipated contract as an asset when the cost
generates or enhances resources of the Group which will be used in satisfying performance obligations in the future and it is expected to be recovered.
Group Company
31.12.2018RM’million
31.12.2017RM’million
31.12.2018RM’million
31.12.2017RM’million
Financial assets at FVOCI 76.4 0 75.7 0
Available-for-sale financial assets 0 69.3 0 68.6
The Group and Company have irrevocably elected non-trading equity securities above at initial recognition to present its fair value changes in OCI. The Group and Company consider this classification to be more relevant as these instruments are strategic investments of the Group and Company and not held for trading purposes. Previously, these investments were classified as available-for-sale.
During the finanical year, no dividend income was recognised and no investment was disposed.
Group Company
Fair value at31.12.2018RM’million
Fair value at 31.12.2018RM’million
Labuan Reinsurance (L) Ltd. 75.7 75.7
Al-Imtiaz Operation and Maintenance Company Ltd. 0.4 0
Club Memberships
- Sultan Salahuddin Abdul Aziz Shah Club 0.1 0
- Glenmarie Gold Country Club 0.1 0
- Leisure Holiday Bhd 0.1 0
These investments were classified as AFS in 2017.
26 CONTRACT BALANCES

About TNB
Our Business
Business Context
Performance Review
Sustainability Statement
The Strength of Our Governance
Financial Statements
Additional InformationIntegrated Annual Report 2018
Tenaga Nasional Berhad
p.227 Notes to the Financial Statements
26 CONTRACT BALANCES (CONTINUED)
Accounting Policy (continued)
(a) Contract cost assets (continued)
Costs to fulfil a contract (continued) These contract costs are initially measured at cost and amortised on a systematic basis that is consistent with the pattern of
revenue recognition to which the asset relates. An impairment loss is recognised in the profit or loss when the carrying amount of the contract cost exceeds the expected revenue less expected cost that will be incurred. Where the impairment condition no longer exists or has improved, the impairment loss is reversed to the extent that the carrying amount of the contract cost does not exceed the amount that would have been recognised had there been no impairment loss recognised previously.
(b) Contract assets
A contract asset is recognised when the Group and Company’s right to consideration is conditional on something other than the passage of time. A contract asset is subject to impairment in accordance to MFRS 9 (Note 45). Typically, the amount will be billed within 30 days of the supply of electricity for electricity customers and 60 to 180 days from satisfying the performance obligation for other revenue streams. The amounts of the electricity supplied before the bills are issued is recognised as contract asset. Payment is expected within 30 days from the billing date for all trade receivables.
(c) Contract liabilities
A contract liability represents the obligation of the Group and Company to transfer goods or services to a customer for which consideration has been received (or the amount is due) from the customers.
Contract liabilities primarily relate to contributions paid in advance by electricity customers for the construction of electricity network assets. The customers’ contribution are expected to be recognised as revenue over a period of 20 years, being the estimated average useful life of the electricity network assets used to connect the customers to the electricity supply. Other contract liabilities within the Group are relating to students fees. All other contract liabilities are expected to be recognised as revenue over the next 12 months.
The Group and Company have recognised the following assets and liabilities related to contracts with customers:
Note
Group Company
31.12.2018
RM’million
31.12.2017(Restated)
RM’million
31.12.2018
RM’million
31.12.2017(Restated)
RM’million
(a) Contract cost assets (i)
- Cost to fulfil a contract 0.5 0.1 0 0
(b) Contract assets (ii)
As at the beginning of the financial year/period 3,059.3 3,222.3 2,925.7 3,051.8
Effects of adoption of MFRS 9 (19.7) 0 (19.7) 0
As restated 3,039.6 3,222.3 2,906.0 3,051.8
Performance obligations completed 3,425.6 3,099.0 3,283.4 2,981.8
Transfer to receivables (3,019.7) (3,205.6) (2,906.0) (3,051.8)
Loss allowances (83.7) (56.4) (78.4) (56.1)
As at the end of the financial year/period 3,361.8 3,059.3 3,205.0 2,925.7

About TNB
Our Business
Business Context
Performance Review
Sustainability Statement
The Strength of Our Governance
Financial Statements
Additional Information
p.228 Notes to the Financial Statements
26 CONTRACT BALANCES (CONTINUED)
The Group and Company have recognised the following assets and liabilities related to contracts with customers: (continued)
Note
Group Company
31.12.2018
RM’million
31.12.2017(Restated)
RM’million
31.12.2018
RM’million
31.12.2017(Restated)
RM’million
(c) Contract liabilities (iii)
As at the beginning of the financial year/period 2,737.5 2,454.8 2,306.1 2,076.4
Effect of adoption of MFRS 15 0 16.2 0 0
As restated 2,737.5 2,471.0 2,306.1 2,076.4
Received during the financial year/period 1,081.9 464.4 506.1 325.8
Release to statement of profit or loss:
- Customers’ contributions (263.4) (115.6) (229.4) (96.1)
- Deferred income (305.7) (82.3) 0 0
As at the end of the financial year/period 3,250.3 2,737.5 2,582.8 2,306.1
Group Company
31.12.2018
RM’million
31.12.2017(Restated)
RM’million
1.9.2017(Restated)
RM’million
31.12.2018
RM’million
31.12.2017(Restated)
RM’million
1.9.2017(Restated)
RM’million
Contract liabilities analysed:
Realised within 12 months 347.4 287.5 276.7 227.9 223.5 240.3
Realised after 12 months 2,902.9 2,450.0 2,194.3 2,354.9 2,082.6 1,836.1
3,250.3 2,737.5 2,471.0 2,582.8 2,306.1 2,076.4
(i) Assets recognised from costs to fulfil a contract
In addition to the contract balances disclosed above, the Group and Company have also recognised assets in relation to costs to fulfil a contract.
Group
31.12.2018
RM’million
31.12.2017(Restated)
RM’million
Assets recognised from costs incurred to fulfil a contract 0.5 0.1

About TNB
Our Business
Business Context
Performance Review
Sustainability Statement
The Strength of Our Governance
Financial Statements
Additional InformationIntegrated Annual Report 2018
Tenaga Nasional Berhad
p.229 Notes to the Financial Statements
26 CONTRACT BALANCES (CONTINUED)
(ii) Significant changes in contract assets and liabilities
Contract assets have increased as the Group and Company have provided more services ahead of the agreed payment schedules for fixed-price contracts. The Group and Company also recognised a loss allowance for contract assets following the adoption of MFRS 9, see Note 45(b)(i) for further information.
Contract liabilities have increased for the Group and Company due to larger prepayments or contributions received from customers.
(iii) Revenue recognised in relation to contract liabilities
The following table shows how much of the revenue recognised in the current financial year/period relates to carried-forward contract liabilities and how much relates to performance obligations that were satisfied in a prior financial year/period:
Group Company
Financialyear ended 31.12.2018
RM’million
Financialperiod ended
31.12.2017(Restated)
RM’million
Financialyear ended 31.12.2018
RM’million
Financialperiod ended
31.12.2017(Restated)
RM’million
Revenue recognised, included in the contract liabilities balance at the beginning of the financial year/period (569.1) (197.9) (229.4) (96.1)
Unsatisfied performance obligations in long term contracts
The following table shows unsatisfied performance obligations resulting from long term contracts:
Group Company
31.12.2018RM’million
31.12.2017RM’million
31.12.2018RM’million
31.12.2017RM’million
Aggregate amount of the transaction price allocated to contracts that are partially or fully unsatisfied 3,250.3 2,737.5 2,582.8 2,306.1
Management expects 8.8% of the transaction price allocated to the unsatisfied contracts as at 31 December 2018 will be recognised as revenue during the next financial year. The remaining 91.2% will be recognised from FY2020 to FY2039.
All contracts for periods of one year or less are billed based on services provided. As permitted under MFRS 15, the transaction price allocated to these unsatisfied contracts is not disclosed.

About TNB
Our Business
Business Context
Performance Review
Sustainability Statement
The Strength of Our Governance
Financial Statements
Additional Information
p.230 Notes to the Financial Statements
27 FINANCIAL ASSETS AT FVTPL
Accounting Policy
Financial assets at FVTPL is a financial instrument and the accounting policy is disclosed in Note 45.
Accounting Policy
Derivatives are initially recognised at fair value on the date a derivative contract is entered into and are subsequently remeasured at their fair value at the end of each reporting period.
Fair value changes on derivatives that are not designated or do not qualify for hedge accounting are recognised in the statement of profit or loss when the changes arise.
Group Company31.12.2018RM’million
31.12.2017RM’million
31.12.2018RM’million
31.12.2017RM’million
Financial assets at FVTPL 9,743.3 10,490.2 5,224.6 3,850.5
Current 9,652.4 10,490.2 5,133.7 3,850.5Non-current 90.9 0 90.9 0
9,743.3 10,490.2 5,224.6 3,850.5
Financial assets at FVTPL represents investments in unit trusts and students’ loan.
Note 47 explains the changes in accounting policy and reclassification of certain financial assets from loans and receivables to FVTPL following the adoption of MFRS 9.
Credit risks relating to financial assets at FVTPL are disclosed in Note 45(b) to the financial statements.
28 DERIVATIVE FINANCIAL INSTRUMENTS
NoteNationalamount
RM’millionAssets
RM’millionLiabilities
RM’million
Non-hedge accounting qualified derivative financial instruments:31.12.2018GroupForward foreign currency contracts - current (a) 949.7 1.2 (44.0)Interest rate swap contracts - non-current (b) 622.4 0 (11.5)Put option - non-current (c) 14.2 0.2 0
31.12.2017GroupForward foreign currency contracts - current (a) 975.1 0 (47.3)
CompanyForward foreign currency contracts - current (d) 19.8 0 (0.2)
(a) The Group entered into forward foreign currency contracts with forward rates ranging from RM4.1627 to RM4.4100 (FPE 31.12.2017: RM4.0880 to RM4.4100) for 1 US Dollar, RM3.6540 to RM3.7890 (FPE 31.12.2017: RM3.6209 to RM3.8271) for 100 Japanese Yen and NIL (FPE 31.12.2017: RM4.8736) for 1 Euro.

About TNB
Our Business
Business Context
Performance Review
Sustainability Statement
The Strength of Our Governance
Financial Statements
Additional InformationIntegrated Annual Report 2018
Tenaga Nasional Berhad
p.231 Notes to the Financial Statements
28 DERIVATIVE FINANCIAL INSTRUMENTS (CONTINUED)
(b) The Group entered into two Interest Rate Swap (‘IRS’) contracts transaction that entitled the Group to received interest at floating rates, and oblige to pay interest at fixed rate of 1.3% and 1.7% on aggregate notional principal of GBP30.7 million and GBP89.3 million respectively.
(c) The put option is a right to sell back an asset as a protection to the Group against any unfulfilment in the stipulated conditions of agreements entered from the acquisition of GVO and BCL.
(d) The Company entered into forward foreign currency contracts with forward rates RM4.0889 for 1 US Dollar.
There were no derivative financial instruments at Company level as at 31 December 2018.
Credit risks relating to derivations are disclosed in Note 45(b) to the financial statements.
29 INVENTORIES
Accounting Policy
Inventories are stated at the lower of cost and net realisable value.
Cost of work-in-progress and finished goods comprise raw materials, direct labour and a proportion of the production overheads. Cost is determined on the weighted average basis and comprises all costs of purchase and other costs incurred in bringing the inventories to their present location and condition.
Net realisable value is the estimated selling price in the ordinary course of business, less the costs of completion and selling expenses.
Accounting Policy
Trade and other receivables are amounts due from customers for goods sold or services performed in the ordinary course of business. Other receivables generally arise from transactions outside the usual operating activities of the Group and Company. If collection is expected in one year or less (or in the normal operating cycle of the business if longer), they are classified as current assets. If not, they are presented as non-current assets.
Trade and other receivables are recognised initially at fair value, which is the amount of consideration that is unconditional unless they contain significant financing components. The Group and Company hold the trade receivables with the objective to collect the contractual cash flows and therefore measures them subsequently at amortised cost less accumulated impairment losses. The impairment is determined based on the expected credit loss (‘ECL’) model and is further disclosed in Note 45.
Group Company
31.12.2018RM’million
31.12.2017RM’million
31.12.2018RM’million
31.12.2017RM’million
Fuel and consumables 1,262.7 872.4 294.0 279.2
Work-in-progress 18.4 6.8 0 0
Finished goods 14.8 5.8 0 0
1,295.9 885.0 294.0 279.2
30 RECEIVABLES, DEPOSITS AND PREPAYMENTS

About TNB
Our Business
Business Context
Performance Review
Sustainability Statement
The Strength of Our Governance
Financial Statements
Additional Information
p.232 Notes to the Financial Statements
30 RECEIVABLES, DEPOSITS AND PREPAYMENTS (CONTINUED)
Group Company
31.12.2018
RM’million
31.12.2017(Restated)
RM’million
1.9.2017(Restated)
RM’million
31.12.2018
RM’million
31.12.2017(Restated)
RM’million
1.9.2017(Restated)
RM’million
Trade receivables 5,278.7 5,697.0 5,225.8 3,831.7 4,248.9 4,033.0
Staff advances/loans 65.2 60.0 62.9 59.7 51.5 54.1
Deposits and prepayments 480.5 296.7 269.7 289.1 84.7 89.6
Other receivables 2,423.2 1,595.7 1,427.4 1,869.1 181.8 232.2
Rechargeable job orders debtors 337.3 405.0 185.4 305.6 355.1 150.3
Partial payment to contractors 44.2 945.9 172.5 0.8 0.8 0.8
8,629.1 9,000.3 7,343.7 6,356.0 4,922.8 4,560.0
Impairment losses on:
Trade receivables (Note 45(b)(i)) (1,640.1) (1,495.0) (1,388.5) (1,471.8) (1,385.9) (1,290.7)
Others (Note 45(b)(iii)) (185.6) (229.8) (220.6) (114.4) (201.7) (202.0)
(1,825.7) (1,724.8) (1,609.1) (1,586.2) (1,587.6) (1,492.7)
6,803.4 7,275.5 5,734.6 4,769.8 3,335.2 3,067.3
The Group and Company’s credit policy provides trade receivables with a 30 days (FPE 31.12.2017: 30 days) credit period.
Credit risks relating to receivables are disclosed in Note 45(b)(i) to the financial statements.
Included in other receivables of the Group and Company are amounts due from the Government amounting to RM1,670.9 million under the ICPT mechanism.
31 DEPOSITS, BANK AND CASH BALANCES
Accounting Policy
For the purpose of the consolidated statement of cash flows, cash equivalents are held for the purpose of meeting short term cash commitments rather than for investment or other purposes. Cash and cash equivalents comprise cash in hand, deposits held at call with financial institutions, other short term investments with original maturity of 3 months or less that are readily convertible to known amounts of cash and which are subject to an insignificant risk of changes in value, and bank overdrafts. In the statement of financial position, bank overdrafts are shown within borrowings in current liabilities.
Group Company
31.12.2018RM’million
31.12.2017RM’million
31.12.2018RM’million
31.12.2017RM’million
Cash in hand and at bank 3,430.1 1,488.0 1,798.9 361.0
Deposits with licensed banks 5,240.7 3,927.0 4,053.5 2,640.3
8,670.8 5,415.0 5,852.4 3,001.3

About TNB
Our Business
Business Context
Performance Review
Sustainability Statement
The Strength of Our Governance
Financial Statements
Additional InformationIntegrated Annual Report 2018
Tenaga Nasional Berhad
p.233 Notes to the Financial Statements
31 DEPOSITS, BANK AND CASH BALANCES (CONTINUED)
The interest rates per annum of bank balances and deposits with licensed banks that were effective as at the end of the reporting date were as follows:
Group Company
31.12.2018%
31.12.2017%
31.12.2018%
31.12.2017%
Bank balances 0.1 - 3.3 0.1 - 3.3 0.1 - 3.3 0.1 - 3.3
Deposits with licensed banks 0.8 - 4.1 1.4 - 4.0 0.8 - 3.0 1.5 - 1.7
Deposits with licensed banks have maturity periods ranging from 1 to 90 days (31.12.2017: 14 to 90 days) for the Group and 1 to 85 days for the Company (31.12.2017: 32 to 90 days).
Group Company
31.12.2018RM’million
31.12.2017RM’million
31.12.2018RM’million
31.12.2017RM’million
Cash and cash equivalents at the end of the financial year/period comprise:
Cash in hand and at bank 3,430.1 1,488.0 1,798.9 361.0
Deposits with licensed banks 5,240.7 3,927.0 4,053.5 2,640.3
Deposits, bank and cash balances 8,670.8 5,415.0 5,852.4 3,001.3
Debt reserve account* (Note 36(b)(iii)) (246.0) (249.8) 0 0
Cash at bank held in trust** (248.9) (289.8) 0 0
Restricted cash (16.3) 0 0 0
Deposits with maturity 90 days and more (561.0) 0 0 0
Total cash and cash equivalents at the end of the financial year/period 7,598.6 4,875.4 5,852.4 3,001.3
* Debt reserve account relate to deposits placed with licensed financial institutions as part of security obligations for bond financing.** The cash at bank held in trust is in respect of grants received from the Government of Malaysia by a subsidiary for designated capital
projects.
32 PAYABLES
Accounting Policy
Trade and other payables are obligations to pay for goods or services that have been acquired in the ordinary course of business from suppliers. Other payables generally arise from transactions outside the usual operating activities of the Group. Trade and other payables are classified as current liabilities if payment is due within one year or less (or in the normal operating cycle of the business if longer). If not, they are presented as non-current liabilities.
Trade and other payables are recognised initially at fair value and subsequently measured at amortised cost, which is the fair value of the consideration to be paid in the future for the goods and services received.
Provisions are recognised when the Group has a present legal or constructive obligation as a result of past events, it is probable that an outflow of resources will be required to settle the obligation and a reliable estimate of the amount can be made.
Where the Group expects a provision to be reimbursed by another party, the reimbursement is recognised as a separate asset but only when the reimbursement is virtually certain. Provisions are not recognised for future operating losses.
Where there are a number of similar obligations, the likelihood that an outflow will be required in settlement is determined by considering the class of obligations as a whole. A provision is recognised even if the likelihood of an outflow with respect to any one item included in the same class of obligations may be small.
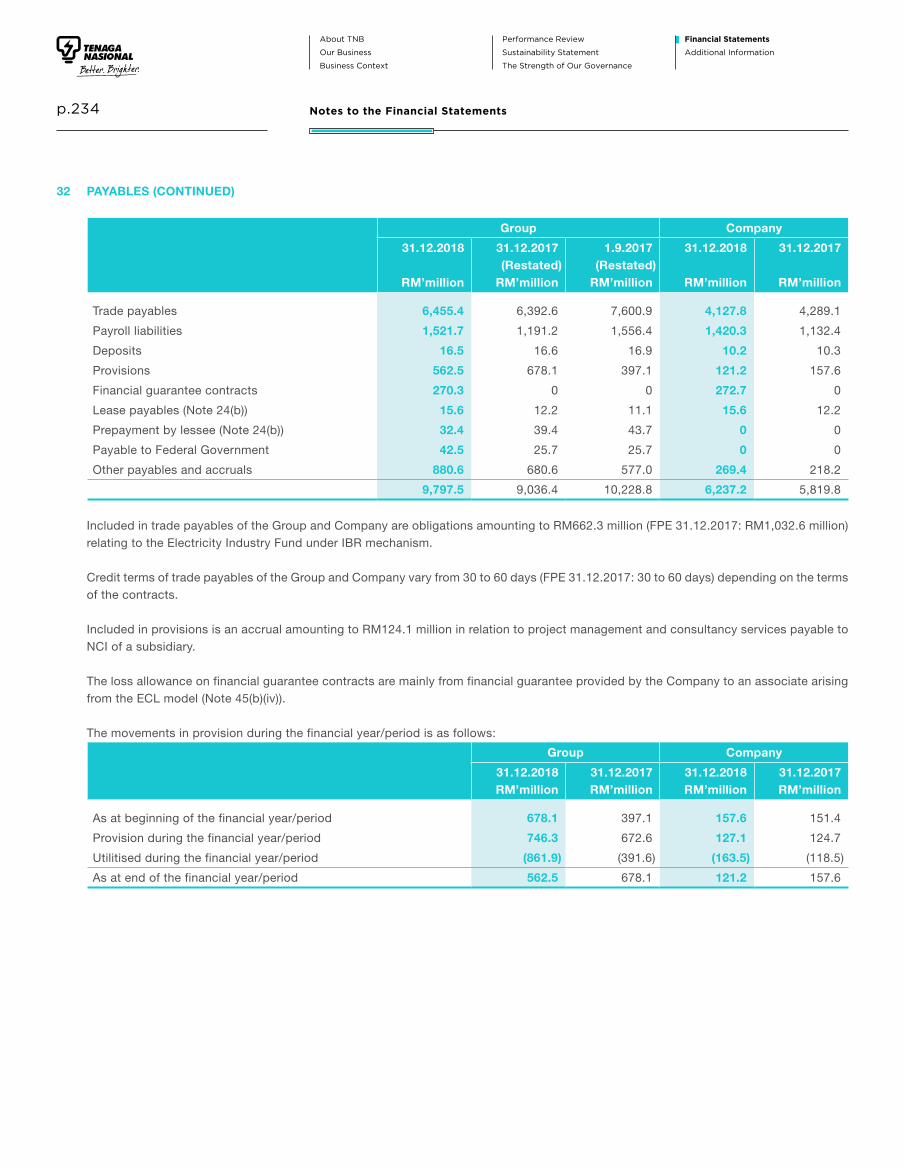
About TNB
Our Business
Business Context
Performance Review
Sustainability Statement
The Strength of Our Governance
Financial Statements
Additional Information
p.234 Notes to the Financial Statements
32 PAYABLES (CONTINUED)
Group Company
31.12.2018
RM’million
31.12.2017(Restated)
RM’million
1.9.2017(Restated)
RM’million
31.12.2018
RM’million
31.12.2017
RM’million
Trade payables 6,455.4 6,392.6 7,600.9 4,127.8 4,289.1
Payroll liabilities 1,521.7 1,191.2 1,556.4 1,420.3 1,132.4
Deposits 16.5 16.6 16.9 10.2 10.3
Provisions 562.5 678.1 397.1 121.2 157.6
Financial guarantee contracts 270.3 0 0 272.7 0
Lease payables (Note 24(b)) 15.6 12.2 11.1 15.6 12.2
Prepayment by lessee (Note 24(b)) 32.4 39.4 43.7 0 0
Payable to Federal Government 42.5 25.7 25.7 0 0
Other payables and accruals 880.6 680.6 577.0 269.4 218.2
9,797.5 9,036.4 10,228.8 6,237.2 5,819.8
Included in trade payables of the Group and Company are obligations amounting to RM662.3 million (FPE 31.12.2017: RM1,032.6 million) relating to the Electricity Industry Fund under IBR mechanism.
Credit terms of trade payables of the Group and Company vary from 30 to 60 days (FPE 31.12.2017: 30 to 60 days) depending on the terms of the contracts.
Included in provisions is an accrual amounting to RM124.1 million in relation to project management and consultancy services payable to NCI of a subsidiary.
The loss allowance on financial guarantee contracts are mainly from financial guarantee provided by the Company to an associate arising from the ECL model (Note 45(b)(iv)).
The movements in provision during the financial year/period is as follows:
Group Company
31.12.2018RM’million
31.12.2017RM’million
31.12.2018RM’million
31.12.2017RM’million
As at beginning of the financial year/period 678.1 397.1 157.6 151.4
Provision during the financial year/period 746.3 672.6 127.1 124.7
Utilitised during the financial year/period (861.9) (391.6) (163.5) (118.5)
As at end of the financial year/period 562.5 678.1 121.2 157.6

About TNB
Our Business
Business Context
Performance Review
Sustainability Statement
The Strength of Our Governance
Financial Statements
Additional InformationIntegrated Annual Report 2018
Tenaga Nasional Berhad
p.235 Notes to the Financial Statements
33 EMPLOYEE BENEFITS
Accounting Policy
(a) Short term employee benefits
Wages, salaries, paid annual leave, bonuses, and non-monetary benefits that are expected to be settled wholly within 12 months after the end of the period in which the employees render the related services are recognised in respect of employees’ services up to the end of the reporting period and are measured at the amounts expected to be paid when the liabilities are settled.
(b) Post employment benefits
The Group and Company have various post-employment benefit schemes which are either defined contribution or defined benefit plans. A defined contribution plan is a pension plan under which the Group and Company pay fixed contributions into a separate entity (a fund) on a mandatory, contractual or voluntary basis and the Group and Company have no legal or constructive obligations to pay further contributions if the fund does not hold sufficient assets to pay all employees benefits relating to employee service in the current and prior periods.
Defined contribution plans
The Group and Company’s contributions to the defined contribution plans are charged to the statement of profit or loss in the financial year to which they relate. Once the contributions have been paid, the Group and Company have no further payment obligations.
Defined benefit plans
The Group and Company make contributions to the Company’s Retirement Benefit Plan, a defined benefit plan and approved fund independent of the Company’s finances. A book provision is also provided by the Group and Company as the contribution rate required to fund the benefits under the said plan is in excess of the Inland Revenue maximum limit. The Group and Company also provide for a Post-Retirement Medical Plan for certain employees, which is unfunded.
The liability in respect of a defined benefit plan is the present value of the defined benefit obligation at the statements of financial position date minus the fair value of plan assets. The Group and Company determine the present value of the defined benefit obligation and the fair value of any plan assets with sufficient regularity such that the amounts recognised in the financial statements do not differ materially from the amounts that would be determined at the end of reporting date.
The defined benefit obligation, calculated using the Projected Unit Credit Method, is determined by an independent actuarial firm, considering the estimated future cash outflows using market yields at statement of financial position date of high-quality corporate bonds which have currency and terms to maturity approximating the terms of the related liability.
The current service cost of the defined benefit plan reflects the increase in the defined benefit obligation resulting from employee service in the current year. It is recognised in the statement of profit or loss in employee benefits expense.
The net interest cost is calculated by applying the discount rate to the net balance of the defined benefits obligation and the fair value of plan assets. This cost is included in employee benefit expense in the statement of profit or loss. Actuarial gains and losses arising from experience adjustments and changes in actuarial assumptions are recognised directly to the OCI in the period in which they arise. The actuarial gains and losses are not subsequently reclassified to the statement of profit or loss.
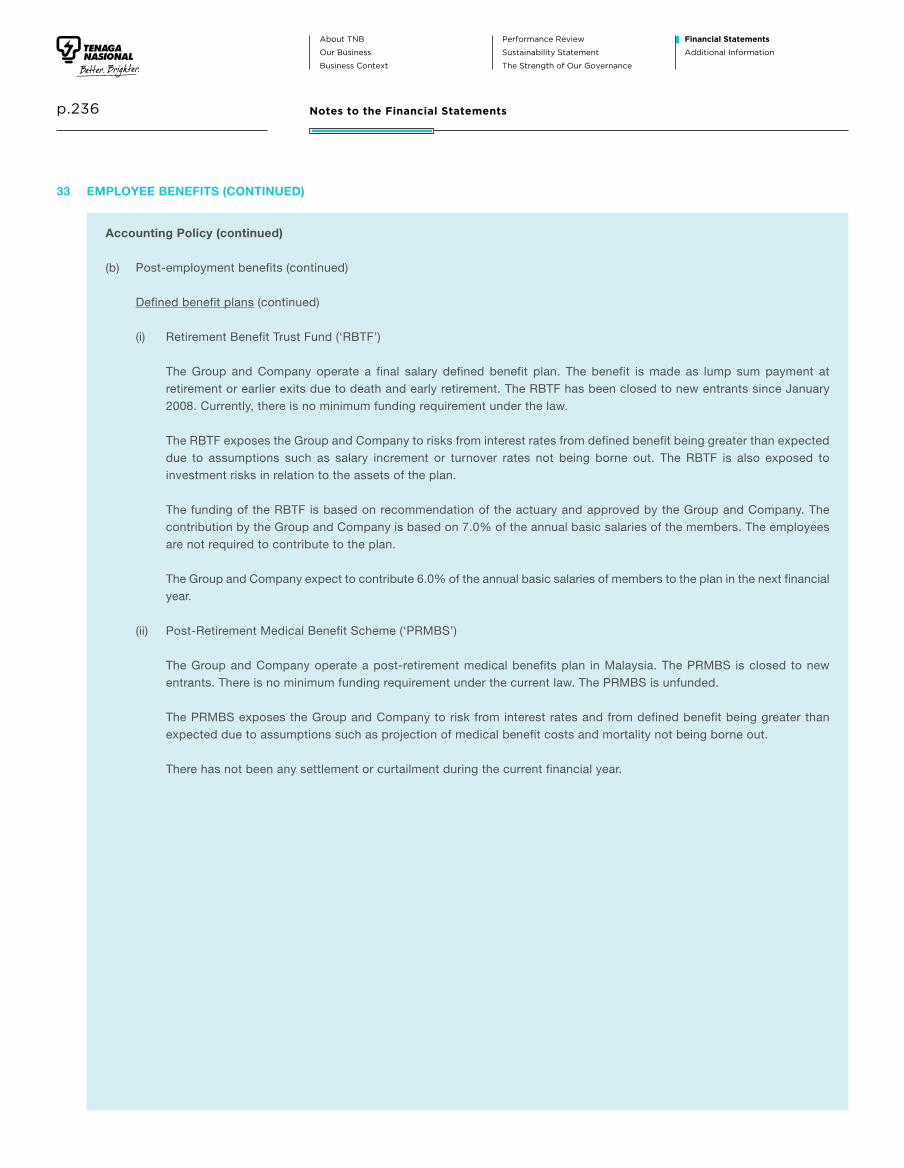
About TNB
Our Business
Business Context
Performance Review
Sustainability Statement
The Strength of Our Governance
Financial Statements
Additional Information
p.236 Notes to the Financial Statements
33 EMPLOYEE BENEFITS (CONTINUED)
Accounting Policy (continued)
(b) Post-employment benefits (continued)
Defined benefit plans (continued)
(i) Retirement Benefit Trust Fund (‘RBTF’)
The Group and Company operate a final salary defined benefit plan. The benefit is made as lump sum payment at retirement or earlier exits due to death and early retirement. The RBTF has been closed to new entrants since January 2008. Currently, there is no minimum funding requirement under the law.
The RBTF exposes the Group and Company to risks from interest rates from defined benefit being greater than expected due to assumptions such as salary increment or turnover rates not being borne out. The RBTF is also exposed to investment risks in relation to the assets of the plan.
The funding of the RBTF is based on recommendation of the actuary and approved by the Group and Company. The contribution by the Group and Company is based on 7.0% of the annual basic salaries of the members. The employees are not required to contribute to the plan.
The Group and Company expect to contribute 6.0% of the annual basic salaries of members to the plan in the next financial year.
(ii) Post-Retirement Medical Benefit Scheme (‘PRMBS’)
The Group and Company operate a post-retirement medical benefits plan in Malaysia. The PRMBS is closed to new entrants. There is no minimum funding requirement under the current law. The PRMBS is unfunded.
The PRMBS exposes the Group and Company to risk from interest rates and from defined benefit being greater than expected due to assumptions such as projection of medical benefit costs and mortality not being borne out.
There has not been any settlement or curtailment during the current financial year.

About TNB
Our Business
Business Context
Performance Review
Sustainability Statement
The Strength of Our Governance
Financial Statements
Additional InformationIntegrated Annual Report 2018
Tenaga Nasional Berhad
p.237 Notes to the Financial Statements
33 EMPLOYEE BENEFITS (CONTINUED)
The movements in the financial statements are as follows:
RBTF
PRMBSRM’million
TotalRM’million
Definedbenefit
obligationRM’million
Fair valueof plan
assetRM’million
Net definedbenefitliability
RM’million
Group
At 1 January 2018 2,786.3 (1,600.5) 1,185.8 10,599.3 11,785.1
Included in profit or loss
Current service costs 113.9 0 113.9 0 113.9
Interest cost/(income) 132.4 (80.7) 51.7 561.8 613.5
246.3 (80.7) 165.6 561.8 727.4
Included in OCI
Remeasurement of loss (Note 11):
- Actuarial (loss)/gain arising from:
- financial assumptions (16.9) 0 (16.9) 225.0 208.1
- experience assumptions 20.7 0 20.7 (67.4) (46.7)
- Return on plan assets excluding interest income 0 58.9 58.9 0 58.9
3.8 58.9 62.7 157.6 220.3
Others
Contribution paid by the employer 0 (361.8) (361.8) 0 (361.8)
Benefits paid (377.7) 375.0 (2.7) (460.1) (462.8)
(373.9) 72.1 (301.8) (302.5) (604.3)
At 31 December 2018 2,658.7 (1,609.1) 1,049.6 10,858.6 11,908.2
Current 325.8 451.2 777.0
Non-current 723.8 10,407.4 11,131.2
1,049.6 10,858.6 11,908.2
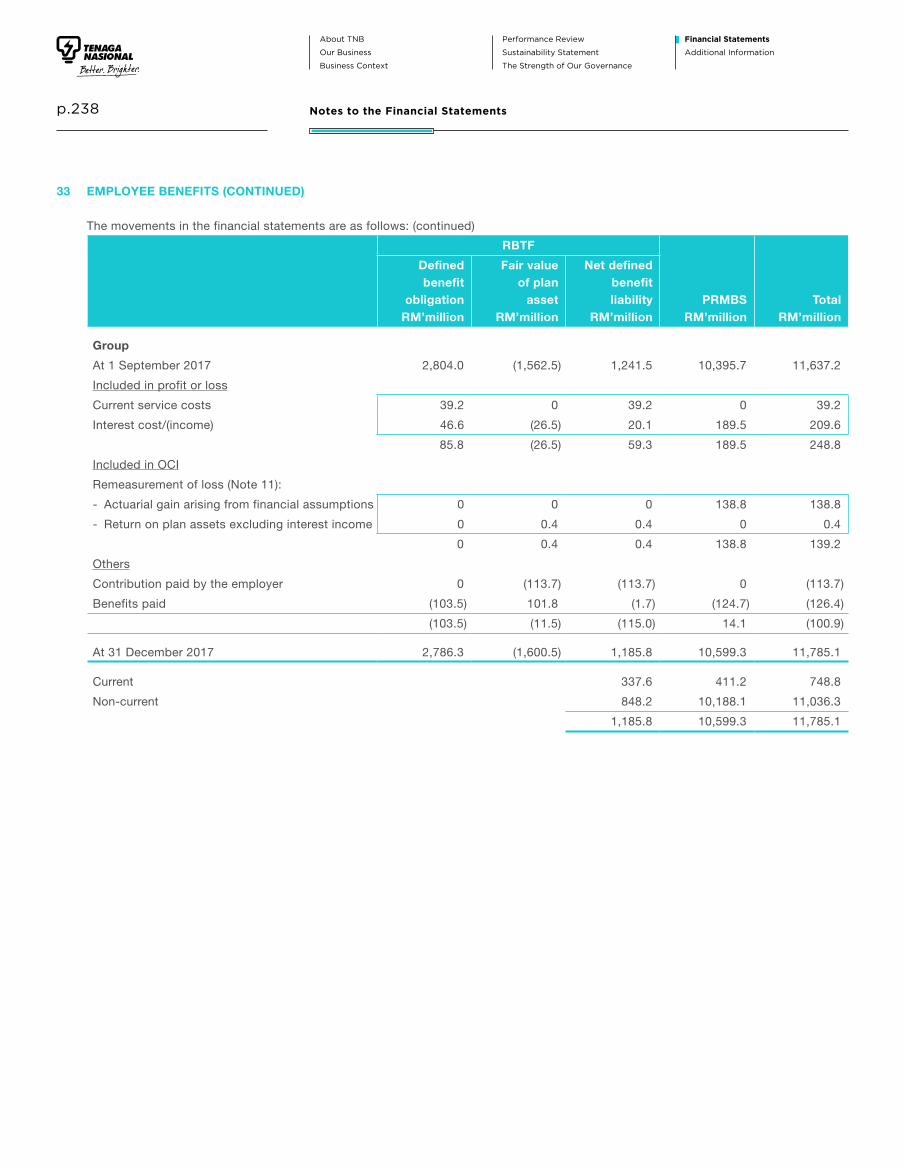
About TNB
Our Business
Business Context
Performance Review
Sustainability Statement
The Strength of Our Governance
Financial Statements
Additional Information
p.238 Notes to the Financial Statements
33 EMPLOYEE BENEFITS (CONTINUED)
The movements in the financial statements are as follows: (continued)
RBTF
PRMBSRM’million
TotalRM’million
Definedbenefit
obligationRM’million
Fair valueof plan
assetRM’million
Net definedbenefitliability
RM’million
Group
At 1 September 2017 2,804.0 (1,562.5) 1,241.5 10,395.7 11,637.2
Included in profit or loss
Current service costs 39.2 0 39.2 0 39.2
Interest cost/(income) 46.6 (26.5) 20.1 189.5 209.6
85.8 (26.5) 59.3 189.5 248.8
Included in OCI
Remeasurement of loss (Note 11):
- Actuarial gain arising from financial assumptions 0 0 0 138.8 138.8
- Return on plan assets excluding interest income 0 0.4 0.4 0 0.4
0 0.4 0.4 138.8 139.2
Others
Contribution paid by the employer 0 (113.7) (113.7) 0 (113.7)
Benefits paid (103.5) 101.8 (1.7) (124.7) (126.4)
(103.5) (11.5) (115.0) 14.1 (100.9)
At 31 December 2017 2,786.3 (1,600.5) 1,185.8 10,599.3 11,785.1
Current 337.6 411.2 748.8
Non-current 848.2 10,188.1 11,036.3
1,185.8 10,599.3 11,785.1

About TNB
Our Business
Business Context
Performance Review
Sustainability Statement
The Strength of Our Governance
Financial Statements
Additional InformationIntegrated Annual Report 2018
Tenaga Nasional Berhad
p.239 Notes to the Financial Statements
33 EMPLOYEE BENEFITS (CONTINUED)
The movements in the financial statements are as follows: (continued)
RBTF
PRMBSRM’million
TotalRM’million
Definedbenefit
obligationRM’million
Fair valueof plan
assetRM’million
Net definedbenefitliability
RM’million
CompanyAt 1 January 2018 2,749.1 (1,600.9) 1,148.2 10,170.6 11,318.8Included in profit or lossCurrent service costs 95.0 0 95.0 0 95.0Interest cost/(income) 130.9 (80.7) 50.2 538.4 588.6
225.9 (80.7) 145.2 538.4 683.6Charged to subsidiaries 15.7 0 15.7 0 15.7
241.6 (80.7) 160.9 538.4 699.3Included in OCIRemeasurement of loss (Note 11):- Actuarial (loss)/gain arising from: - financial assumptions (16.5) 0 (16.5) 75.5 59.0 - experience assumptions 20.7 0 20.7 (71.9) (51.2)- Return on plan assets excluding interest income 0 58.9 58.9 0 58.9
4.2 58.9 63.1 3.6 66.7OthersContribution paid by the employer 0 (361.8) (361.8) 0 (361.8)Benefits paid (375.0) 375.0 0 (443.2) (443.2)
(370.8) 72.1 (298.7) (439.6) (738.3)At 31 December 2018 2,619.9 (1,609.5) 1,010.4 10,269.4 11,279.8
Current 325.8 433.8 759.6Non-current 684.6 9,835.6 10,520.2
1,010.4 10,269.4 11,279.8

About TNB
Our Business
Business Context
Performance Review
Sustainability Statement
The Strength of Our Governance
Financial Statements
Additional Information
p.240 Notes to the Financial Statements
33 EMPLOYEE BENEFITS (CONTINUED)
The movements in the financial statements are as follows: (continued)
RBTF
PRMBSRM’million
TotalRM’million
Definedbenefit
obligationRM’million
Fair valueof plan
assetRM’million
Net definedbenefitliability
RM’million
CompanyAt 1 September 2017 2,767.2 (1,562.5) 1,204.7 9,976.1 11,180.8Included in profit or lossCurrent service costs 32.2 0 32.2 0 32.2Interest cost/(income) 46.0 (26.5) 19.5 181.7 201.2
78.2 (26.5) 51.7 181.7 233.4Charged to subsidiaries 5.5 0 5.5 0 5.5
83.7 (26.5) 57.2 181.7 238.9Included in OCIRemeasurement of loss (Note 11):- Actuarial gain arising from financial assumptions 0 0 0 131.3 131.3OthersContribution paid by the employer 0 (113.7) (113.7) 0 (113.7)Benefits paid (101.8) 101.8 0 (118.5) (118.5)
(101.8) (11.9) (113.7) 12.8 (100.9)At 31 December 2017 2,749.1 (1,600.9) 1,148.2 10,170.6 11,318.8
Current 337.6 399.5 737.1Non-current 810.6 9,771.1 10,581.7
1,148.2 10,170.6 11,318.8
The latest actuarial revaluation for RBTF and PRMBS was carried out in February 2019. The principal actuarial assumptions used in respect of defined benefit plans were as follows:
Group Company
RBTF%
PRMBS%
RBTF%
PRMBS%
31.12.2018Discount rates 5.0 - 13.3 5.4 - 5.5 5.2 5.4Salary increment rate 5.0 - 13.3 N/A 7.0 N/AMedical cost inflation:- Inpatient N/A 5.5 N/A 5.5- Outpatient N/A 4.5 - 5.8 N/A 4.5Others:- Specialist N/A 4.5 N/A 4.5- Dialysis N/A 5.5 N/A 5.5
31.12.2017Discount rates 5.0 - 7.8 5.4 - 5.5 5.1 5.4Salary increment rate 5.0 - 7.8 N/A 7.0 N/AMedical cost inflation:- Inpatient N/A 5.5 N/A 5.5- Outpatient N/A 5.8 N/A 5.8Others:- Specialist N/A 4.5 N/A 4.5- Dialysis N/A 5.5 N/A 5.5

About TNB
Our Business
Business Context
Performance Review
Sustainability Statement
The Strength of Our Governance
Financial Statements
Additional InformationIntegrated Annual Report 2018
Tenaga Nasional Berhad
p.241 Notes to the Financial Statements
33 EMPLOYEE BENEFITS (CONTINUED)
The effect of a 1.0% movement in the key assumptions to the defined benefit obligation balances are as follows:
RBTF PRMBS
IncreaseRM’million
DecreaseRM’million
IncreaseRM’million
DecreaseRM’million
Group
Medical cost trend rate N/A N/A 1,471.6 (1,232.2)
Discount rate (155.3) 173.6 (1,256.9) 1,533.2
Salary increment rate 158.9 (145.1) N/A N/A
Company
Medical cost trend rate N/A N/A 1,374.5 (1,153.3)
Discount rate (155.3) 173.6 (1,176.9) 1,432.7
Salary increment rate 158.9 (145.1) N/A N/A
The sensitivity analysis has been provided based on membership data as at 31 December 2018 and considered a change of each principal assumption in isolation. The method and types of assumptions used in preparing the sensitivity analyses did not change compared to the previous period.
The weighted average duration of the Group and Company’s liability is estimated at approximately 7 and 14 years for RBTF and PRMBS respectively.
Plan assets for RBTF comprise:
Group and Company
31.12.2018%
31.12.2017%
Equity instruments - quoted 33.7 45.7
Debt instruments - quoted 20.0 18.6
- unquoted 19.5 18.5
Others 26.8 17.2
100.0 100.0
The plan assets for RBTF did not include any ordinary share of the Company.
The Group and Company’s RBTF are conditional on future employment of the members of the plan. The Group and Company’s PRMBS is not conditional on future employment and has been fully vested as at 31 December 2018.
34 CONSUMER DEPOSITS
Consumers (with the exception of employees and government departments/agencies) are required to deposit a sum sufficient to cover charges for two months supply of energy as allowed under the regulation of the Licensee Supply (Amendment) regulations 2002. In default of payment of the deposit within the time specified, the supply to the consumer’s installation may be disconnected, subject to certain conditions laid out in the regulations.
In January of every calender year, the Company and SESB pay an interest of 2.5% per annum on the amount of cash deposits.
Consumer deposits are classified as current liabilities as the amounts shall be refunded within 30 days upon request for termination of electricity supply by the consumer.

About TNB
Our Business
Business Context
Performance Review
Sustainability Statement
The Strength of Our Governance
Financial Statements
Additional Information
p.242 Notes to the Financial Statements
35 SHORT TERM BORROWINGS
Accounting Policy
Borrowings are recognised initially at fair value, net of transaction costs incurred. In subsequent periods, borrowings are stated at amortised cost using the effective interest method, any differences between proceeds (net of transaction costs) and the redemption value are recognised in the statement of profit or loss over the period of the borrowings.
Borrowings are classified as current liabilities unless the Group and Company have an unconditional right to defer settlement of the liability for at least 12 months after the statement of financial position date.
Fees paid on the establishment of loan facilities are recognised as transaction costs of the loan to the extent that it is probable that some or all of the facilities will be drawdown. In this case, the fee is deferred until the drawdown occurs.
Borrowing costs directly attributable to the acquisition, construction or production of qualifying assets, which are assets that necessarily take a substantial period of time to get ready for their intended use or sale, are added to the cost of those assets, until such time as the assets are substantially ready for their intended use or sale. All other borrowing costs are recognised in the statement of profit or loss in the period in which they are incurred.
Investment income earned on the temporary investment of specific borrowings pending their expenditure on qualifying assets is deducted from the borrowing costs eligible for capitalisation.
Group Company
31.12.2018RM’million
31.12.2017RM’million
31.12.2018RM’million
31.12.2017RM’million
Portion of borrowings due within 1 year (Note 36):
- Secured 1,076.2 1,046.9 0 0
- Unsecured 2,392.5 296.1 2,252.2 227.6
3,468.7 1,343.0 2,252.2 227.6
Short term loans:
- Secured 269.1 270.5 0 0
- Unsecured 105.6 61.5 0 0
Bankers’ acceptances (unsecured) 84.4 70.3 0 0
3,927.8 1,745.3 2,252.2 227.6
The short term borrowings carry interest at rates ranging from 0.8% to 10.2% (FPE 31.12.2017: 0.8% to 8.2%) per annum for the Group and from 0.8% to 8.0% (FPE 31.12.2017: 0.8% to 7.5%) per annum for the Company.

About TNB
Our Business
Business Context
Performance Review
Sustainability Statement
The Strength of Our Governance
Financial Statements
Additional InformationIntegrated Annual Report 2018
Tenaga Nasional Berhad
p.243 Notes to the Financial Statements
36 BORROWINGS
Accounting Policy
The accounting policy for borrowings is as disclosed in Note 35.
Group Company
31.12.2018RM’million
31.12.2017RM’million
31.12.2018RM’million
31.12.2017RM’million
Secured:
- Term loans (Note (a)) 2,750.1 1,955.8 0 0
- Bonds (Note (b)) 21,357.2 22,115.9 0 0
24,107.3 24,071.7 0 0
Unsecured:
- Term loans (Note (a)) 6,700.4 6,664.3 6,578.0 6,562.5
- Bonds (Note (b)) 16,052.2 9,784.5 15,059.0 8,785.6
- Redeemable Unsecured Loan Stocks (Note (c)) 513.4 520.9 0 0
23,266.0 16,969.7 21,637.0 15,348.1
47,373.3 41,041.4 21,637.0 15,348.1
Payable within 1 year under short term borrowings excluding short term loans and bankers’ acceptance (Note 35) 3,468.7 1,343.0 2,252.2 227.6
Borrowings repayable after 1 year:
- After 1 and up to 2 years 2,257.1 6,741.1 819.9 2,031.4
- After 2 and up to 5 years 5,805.4 5,849.7 3,060.0 3,745.3
- After 5 and up to 10 years 13,626.6 8,818.7 8,870.0 5,660.4
- After 10 and up to 20 years 19,535.1 15,511.1 6,199.9 3,151.0
- After 20 and up to 30 years 2,365.6 2,475.8 120.2 230.4
- After 30 years 314.8 302.0 314.8 302.0
43,904.6 39,698.4 19,384.8 15,120.5
47,373.3 41,041.4 21,637.0 15,348.1
Add:
- Short term loans 374.7 332.0 0 0
- Bankers’ acceptances 84.4 70.3 0 0
Total borrowings 47,832.4 41,443.7 21,637.0 15,348.1
Group
31.12.2018RM’million
31.12.2017RM’million
Net book values of PPE pledged as security for borrowings:
Machinery, lines and equipment 5,080.1 4,918.7
Buildings 863.9 892.6
Long leasehold land 170.3 169.3
6,114.3 5,980.6

About TNB
Our Business
Business Context
Performance Review
Sustainability Statement
The Strength of Our Governance
Financial Statements
Additional Information
p.244 Notes to the Financial Statements
36 BORROWINGS (CONTINUED)
(a) Term loans
(i) The Federal Government loans obtained by SESB are secured by the following:• A debenture creating:
- a first fixed charge over all present and future freehold and leasehold properties including all buildings and fixtures; and
- a first floating charge over all present and future assets of SESB not effectively charged by way of the fixed charge.• A deed of assignment transferring all SESB’s present and future rights and interests in all sales proceeds or revenue
derived from the sale of electricity generated from the projects funded.• A deed of assignment transferring all SESB’s present and future rights and interests in the bank accounts in which the loan
proceeds are credited.
The tenure of the loans ranges from 20 to 25 years with a profit rate of between 0% to 4.0% per annum.
(ii) 15-Year RM73.3 Million Term Loan
On 20 December 2010, TNB Engineering Corporation Sdn. Bhd. (‘TNEC’) entered into a 15-year RM73.3 million secured loan, paying interest at a fixed rate of 5.9%. The loan will mature on 24 December 2025. The principal is payable in 12 annual instalments.
The term loan is secured by a corporate guarantee from the Company. The term loan also requires TNEC to comply with certain affirmative and restrictive non-financial covenants.
(iii) USD300.0 Million Term Loan
On 30 March 2016, the Company entered into a 3-year USD300.0 million unsecured loan, paying interest at a floating interest rate with margin of 0.7%. The loan will mature on 30 March 2019.
(iv) Commodity Murabahah Financing-I
On 2 May 2017, Malaysia Transformer Manufacturing Sdn. Bhd. entered into a RM25.0 million unsecured loan, with a floating interest rate of 1.6% plus prevailing Kuala Lumpur Interbank Offered Rate (‘KLIBOR’) to part finance the construction and development of a new plant at Kapar, Klang.
(v) Islamic Facility Agreement
On 19 July 2017, TNB Sepang Solar Sdn. Bhd. (‘TSS’) obtained a RM323.0 million Islamic facility agreement to finance the construction of a 50MW solar power plant. The tenure of the facility agreement is up to 20 years with a periodic distribution rate for pre Commercial Operation Date (‘COD’) (KLIBOR+1.2%) and post COD (KLIBOR+1.3%) per annum.
(vi) GBP120.0 Million Term Loan
On 23 March 2018, Tenaga Wind Ventures UK Ltd obtained bank loans and overdrafts which are secured by a fixed and floating charge over the assets held by Tenaga Investments UK Ltd and Tenaga Wind Ventures UK Ltd (‘TWV’). TWV has bank loans with Bayerische Landesbank for the amount of GBP119.1 million with a tenure of 15 years. The rate of interest is at a margin of 1.8% over LIBOR subject to interest rate swap agreements.

About TNB
Our Business
Business Context
Performance Review
Sustainability Statement
The Strength of Our Governance
Financial Statements
Additional InformationIntegrated Annual Report 2018
Tenaga Nasional Berhad
p.245 Notes to the Financial Statements
36 BORROWINGS (CONTINUED)
(b) Bonds
(i) Islamic Securities Programme
On 25 November 2011, TNB Janamanjung Sdn. Bhd. (‘TNBJ’) obtained a RM4.9 billion Islamic Securities Programme to finance the construction of a 1,010MW coal fired power plant. The tenure of the Islamic Securities Programme ranging from 5 to 20 years with profit rates between 3.8% and 4.9% per annum.
The Islamic Securities Programme was issued by Manjung Island Energy Berhad (‘MIEB’) which is a special purpose vehicle company incorporated in Malaysia with a paid up ordinary share capital of RM2.00. All of the issued shares of MIEB are held by Equity Trust (Malaysia) Berhad as share trustee for the benefit of certain specified charities, under the terms of a declaration of trust.
The Islamic Securities Programme consists of 2 series and the details of the series are as follows:• Series 1 consists of 15 tranches, with tenures ranging from 5 to 19 years.• Series 2 consists of 1 tranche, with a tenure of 20 years.
The Islamic Securities Programme Series 1 is secured by the followings:• a first ranking assignment of TNBJ’s rights, interests, titles and benefits under PPA1 (Manjung 1, 2 & 3) and PPA2
(Manjung 4) inclusive of the proceeds therefrom; and• a first ranking assignment of all designated accounts and the related credit balances.
The Islamic Securities Programme Series 2 is unsecured and has the benefit of unconditional and irrevocable guarantee from the Company, to meet the payment obligations of TNBJ.
(ii) Sukuk - Gas Fired Power Plant
On 22 May 2013, TNB Northern Energy Berhad (‘TNEB’) entered into a RM1.6 billion sukuk facility agreement to finance the construction of a 1,071MW gas fired power plant. The tenure of the facility agreement is 23 years with periodic distribution rates between 3.6% and 4.8% per annum. The sukuk facility agreement consists of 39 tranches with tenures ranging from 4 to 23 years.
(iii) Sukuk Ijarah
On 5 July 2013, Kapar Energy Ventures Sdn. Bhd. (‘KEV’) issued a sukuk facility based on the Shariah principles of Ijarah (‘Sukuk Ijarah’) of RM2.0 billion in nominal value. The tenure of the sukuk ranging from 1 to 13 years with profit rates of 3.8% to 5.0%.
The Sukuk Ijarah is secured by the followings:• First fixed charge over the lease of the land owned by the Company where the power plant, coal yard and jetty are located;• A first ranking debenture comprising fixed and floating charges over all present and future assets of KEV; and• Assignment of all rights, titles, interests and benefits of:
- the project documents;- the applicable Takaful/insurances; and- the designated accounts.
(iv) Sukuk - Coal Fired Power Plant
On 24 January 2014, TNB Western Energy Berhad (‘TWEB’) entered into a RM3.7 billion sukuk facility agreement to finance the construction of a 1,000MW coal fired power plant. The tenure of the facility agreement is 23 years with periodic distribution rates between 5.1% and 5.8% per annum. The sukuk facility agreement consists of 20 tranches with tenures ranging from 10 to 20 years.

About TNB
Our Business
Business Context
Performance Review
Sustainability Statement
The Strength of Our Governance
Financial Statements
Additional Information
p.246 Notes to the Financial Statements
36 BORROWINGS (CONTINUED)
(b) Bonds (continued)
(iv) Sukuk - Coal Fired Power Plant (continued)
On 4 December 2015, Jimah East Power Sdn. Bhd. (‘JEP’) issued a Sukuk Murabahah of RM9.0 billion nominal value. The proceeds from the Sukuk Murabahah shall be utilised by JEP for shariah-compliant purposes in connection with the financing, design, engineering, procurement, construction, installation, testing, commissioning, ownership, operation and maintenance of a 2,000MW coal fired power plant and associated facilities, including the transmission line and interconnection facilities. The tenure of the facility agreement is 23 years with periodic distribution rates between 5.0% and 6.8% per annum. The sukuk facility agreement consists of 36 tranches with tenures ranging from 6 to 23 years.
(v) RM2.0 Billion Islamic Medium Term Note Sukuk Wakalah
On 3 August 2017, the Company issued RM2.0 billion Islamic Medium Term Note Sukuk Wakalah to finance capital expenditure, investment, general corporate purpose, working capital requirements and equity injection into Tenaga Nasional Berhad’s power plant projects. The issuance comprises RM500.0 million 15 years tranche and RM1.5 billion 20 years tranche, with periodic distribution rates between 5.0% and 5.2% respectively.
On 29 August 2018, the Company issued a RM1.0 billion 15 years tranche and RM2.0 billion 20 years tranche, with a fixed periodic distribution rate of 4.8% and 5.0% respectively.
(vi) Multi-Currency Sukuk Programme
On 19 October 2016, TNB Global Ventures Capital Berhad (‘TGVC’) established a USD2.5 billion Multi-Currency Medium Term Note Sukuk Programme to provide flexibility to Tenaga Nasional Berhad fund raising exercise for its future investment.
The Sukuk Programme is unsecured and has the benefit of unconditional and irrecoverable guarantee from Tenaga Nasional Berhad, to meet the payment obligations of TGVC.
On 19 October 2016, the Company issued a USD750.0 million sukuk with a tenure of 10 years with fixed periodic distribution rate of 3.2%.
On 1 November 2018, the Company had a second issuance of USD750.0 million for 10 years with a periodic distribution rate of 4.9%.
(vii) RM3.7 Billion Sukuk Wakalah
On 31 October 2017, Southern Power Generation Sdn. Bhd. (‘SPG’) issued a Sukuk Wakalah of RM3.7 billion in nominal value. The proceeds from the Sukuk Wakalah shall be utilised for the following shariah-compliant purposes in connection with the financing, design, engineering, procurement, construction, installation, testing, commissioning, ownership, operation and maintenance of a 1,440MW coal-fired power plant and associated facilities, including the transmission line and interconnection facilities.
The tenure of the facility agreement is 18 years with a periodic distribution rate between 4.7% and 5.6% per annum. The sukuk facility agreement consists of 28 tranches with tenures ranging from 4.5 years to 18 years.
(c) RULS
On 29 June 2004, KEV issued RM957.6 million of RULS to the Company and Malakoff Corporation Berhad to finance the acquisition of Stesen Janaelektrik Sultan Salahuddin Abdul Aziz, Kapar.
The main features of the RULS are as follows:(i) The RULS bears interest at 8.0% per annum on the outstanding nominal value of the RULS. The interest is repayable semi-
annually on the last day of the relevant six month period from the issue date of RULS. No compounding interest will be charged on the unpaid interest after the due date.
(ii) The RULS is repayable from the third year from the issue date of RULS as stipulated in the agreement dated 29 June 2004. The RULS has to be settled in full by the final maturity date of 8 July 2029.

About TNB
Our Business
Business Context
Performance Review
Sustainability Statement
The Strength of Our Governance
Financial Statements
Additional InformationIntegrated Annual Report 2018
Tenaga Nasional Berhad
p.247 Notes to the Financial Statements
36 BORROWINGS (CONTINUED)
Reconciliation of borrowings from financing activities during the financial year/period is as follows:
Group Company
31.12.2018 RM’million
31.12.2017 RM’million
31.12.2018 RM’million
31.12.2017 RM’million
As at beginning of the financial year/period 41,443.7 38,846.5 15,348.1 15,977.0
Cash flows:
- Drawdowns 8,206.4 4,191.6 6,326.1 0
- Repayments (1,954.4) (1,030.6) (305.5) (62.0)
- Interest paid (1,986.9) (575.4) (681.4) (278.8)
Non-cash changes:
- Interest on borrowings 1,937.8 533.9 763.9 228.2
- Translation loss/(gain) - foreign term loans 185.8 (522.3) 185.8 (516.3)
As at end of the financial year/period 47,832.4 41,443.7 21,637.0 15,348.1
37 GOVERNMENT DEVELOPMENT GRANTS
Accounting Policy
Grants from the government are recognised at their fair values where there is a reasonable assurance that the grants will be received and the Group will comply with all attached conditions.
Government grants relating to costs are deferred and recognised in the statement of profit or loss over the period necessary to match them with the costs they are intended to compensate.
Government grants relating to construction of PPE are included in non-current liabilities as deferred income and are credited to the statement of profit or loss on the straight line method over the expected lives of the related assets.
A subsidiary of the Group obtained Government loans at an interest rate which is below the market rate of interest. The differential between the initial carrying value of the loan based on market rate and the Government rate is recognised as a deferred income and is credited to the statement of profit or loss over the period necessary to match the interest costs.
Group
31.12.2018RM’million
31.12.2017RM’million
As at the beginning of the financial year/period 964.1 977.8
Reclassification made from payables 8.7 0
Additions during the financial year/period:
- Cash 5.6 174.7
- Assets 69.2 0
- Receivables 23.2 0
- In relation to Government loans 13.1 8.4
Released to statement of profit or loss:
- Other operating income (Note 8) (51.5) (190.0)
- Finance cost (Note 10(b)) (27.4) (6.8)
As at the end of the financial year/period 1,005.0 964.1

About TNB
Our Business
Business Context
Performance Review
Sustainability Statement
The Strength of Our Governance
Financial Statements
Additional Information
p.248 Notes to the Financial Statements
37 GOVERNMENT DEVELOPMENT GRANTS (CONTINUED)
The development grants are provided by the Government to a subsidiary mainly for the construction of PPE of RM728.8 million (FPE 31.12.2017: RM705.5 million) and government loan below market interest of RM244.4 million (FPE 31.12.2017: RM258.6 million).
Reconciliation of Government development grants from financing activities during the financial year/period is as follows:
Group
31.12.2018RM’million
31.12.2017RM’million
As at the beginning of the financial year/period 964.1 977.8
Cash 5.6 174.7
Non-cash changes:
- Reclassification made from payables 8.7 0
- Receivables from Government 23.2 0
- Assets 69.2 0
- Deferred income relating to Government loans 13.1 8.4
- Other operating income (51.5) (190.0)
- Finance cost (interest accretion) (27.4) (6.8)
As at the end of the financial year/period 1,005.0 964.1
38 OTHER LIABILITIES
Group Company
Note31.12.2018RM’million
31.12.2017RM’million
31.12.2018RM’million
31.12.2017RM’million
Payable to:
- Federal Government 0 15.3 0 0
- State Government 22.8 26.0 22.8 26.0
Lease payables 24(b) 139.3 128.6 157.5 140.0
Prepayment by lessee 24(b) 215.9 301.9 0 0
Retention monies 602.0 517.2 536.9 473.5
Others* 416.2 368.4 2.8 2.8
1,396.2 1,357.4 720.0 642.3
* Included in Others is the deferred consideration arising from the acquisition of GVO and BCL by a subsidiary (Note 15) amounting to RM66.2 million.

About TNB
Our Business
Business Context
Performance Review
Sustainability Statement
The Strength of Our Governance
Financial Statements
Additional InformationIntegrated Annual Report 2018
Tenaga Nasional Berhad
p.249 Notes to the Financial Statements
39 SHARE CAPITAL
Accounting Policy
(a) Classification
Ordinary shares and non-redeemable preference shares with dividends are classified as equity. Other shares are classified as equity and/or liability according to the economic substance of the particular instrument.
Distributions to holders of a financial instrument classified as an equity instrument are charged directly to equity.
(b) Share issue costs
Incremental external costs directly attributable to the issuance of new shares or options are shown in equity as a deduction, net of tax, from the proceeds.
(c) Dividends to shareholders of the Company
Dividends are recognised as liability in the period in which they are declared.
Group and Company
Note 31.12.2018 31.12.2017
Issued and fully paid:
Ordinary shares 5,686,888,771 5,665,986,271
Special Rights Redeemable Preference Share (a) 1 1
Total share capital issued and fully paid as at the end of the financial year/period 5,686,888,772 5,665,986,272
Group and Company
Note
Number ofshares
31.12.2018Million
Amount31.12.2018RM’million
Number ofshares
31.12.2017Million
Amount31.12.2017RM’million
Issued and fully paid:
Ordinary shares
As at the beginning of the financial year/period 5,666.0 11,199.6 5,659.0 11,124.9
LTIP shares issued during the financial year/period (b) 20.9 246.5 7.0 74.7
As at the end of the financial year/period 5,686.9 11,446.1 5,666.0 11,199.6

About TNB
Our Business
Business Context
Performance Review
Sustainability Statement
The Strength of Our Governance
Financial Statements
Additional Information
p.250 Notes to the Financial Statements
39 SHARE CAPITAL (CONTINUED)
(a) Special Rights Redeemable Preference Share (‘Special Share’)
(i) The Special Share would enable the Government of Malaysia through the Minister of Finance Incorporated (‘MOF Incorporated’) to ensure that certain major decisions affecting the operations of the Company are consistent with the Government’s policies. The Special Shareholder, which may only be the Government or any representative or person acting on its behalf, is entitled to receive notices of meetings but not to vote at such meetings of the Company. However, the Special Shareholder is entitled to attend and speak at such meetings.
The Special Shareholder has the right to appoint any person, but not more than six at any time, to be a member of the Board of Directors of the Company.
(ii) Certain matters, in particular the alteration of the Articles of Association of the Company relating to the rights of the Special Shareholder, creation and issue of additional shares which carry different voting rights, the dissolution of the Company, substantial disposal of assets, amalgamations, merger and takeover, require the prior consent of the Special Shareholder.
(iii) The Special Shareholder does not have any right to participate in the capital or profits of the Company.
(iv) The Special Shareholder has the right to require the Company to redeem the Special Share, at par, at any time.
(b) The Company issued and allotted 12,194,300 on 30 April 2018 and 8,708,200 on 28 November 2018 ordinary shares in the Company to eligible executives or eligible employees, pursuant to the letter of offer dated 1 April 2016, 28 March 2017 and 3 August 2015 respectively in accordance with the By-laws of the LTIP scheme of the Company. Subsequent to the above, the issued and paid up share capital of the Company increased to 5,686,888,771 ordinary shares.
40 OTHER RESERVES
Group Company
31.12.2018RM’million
31.12.2017RM’million
31.12.2018RM’million
31.12.2017RM’million
LTIP reserve 308.7 287.4 308.7 287.4
Employee benefits reserve (6,034.8) (5,830.5) (5,670.4) (5,619.7)
Foreign currency translation reserve (705.0) (766.2) 0 0
AFS reserve 0 31.3 0 30.6
Fair value of financial assets at FVOCI 38.4 0 37.7 0
Others* 0 (95.0) 0 0
(6,392.7) (6,373.0) (5,324.0) (5,301.7)
* This relates to put option to NCI on shares of a subsidiary which was exercised in the current financial year.

About TNB
Our Business
Business Context
Performance Review
Sustainability Statement
The Strength of Our Governance
Financial Statements
Additional InformationIntegrated Annual Report 2018
Tenaga Nasional Berhad
p.251 Notes to the Financial Statements
40 OTHER RESERVES (CONTINUED)
The movements in each category of reserves are as follows:
LTIP reserveRM’million
Employeebenefits
reserveRM’million
Foreigncurrency
translation reserveRM’million
FVOCI/AFS
reserveRM’million
OthersRM’million
TotalRM’million
Group
31.12.2018
As at the beginning of the financial year 287.4 (5,830.5) (766.2) 31.3 (95.0) (6,373.0)
Arising in the financial year 21.3 (204.3) 61.2 7.1 95.0 (19.7)
As at the end of the financial year 308.7 (6,034.8) (705.0) 38.4 0 (6,392.7)
31.12.2017
As at the beginning of the financial period 295.8 (5,722.9) (640.6) 33.9 (95.0) (6,128.8)
Arising in the financial period (8.4) (107.6) (125.6) (2.6) 0 (244.2)
As at the end of the financial period 287.4 (5,830.5) (766.2) 31.3 (95.0) (6,373.0)
LTIPreserve
RM’million
Employeebenefitsreserve
RM’million
FVOCI/AFS
reserveRM’million
TotalRM’million
Company
31.12.2018
As at the beginning of the financial year 287.4 (5,619.7) 30.6 (5,301.7)
Arising in the financial year 21.3 (50.7) 7.1 (22.3)
As at the end of the financial year 308.7 (5,670.4) 37.7 (5,324.0)
31.12.2017
As at the beginning of the financial period 295.8 (5,519.9) 33.2 (5,190.9)
Arising in the financial period (8.4) (99.8) (2.6) (110.8)
As at the end of the financial period 287.4 (5,619.7) 30.6 (5,301.7)

About TNB
Our Business
Business Context
Performance Review
Sustainability Statement
The Strength of Our Governance
Financial Statements
Additional Information
p.252 Notes to the Financial Statements
41 COMMITMENTS
(a) Capital commitments for 5 years
Group Company
Financialyear ended31.12.2018RM’million
Financialperiod ended
31.12.2017RM’million
Financialyear ended31.12.2018RM’million
Financialperiod ended 31.12.2017
RM’million
Authorised capital expenditure not provided in the financial statements:
Property, plant and equipment
- Contracted 1,534.8 1,109.4 737.9 681.7
- Not contracted 69,393.4 36,641.7 61,384.9 35,937.4
70,928.2 37,751.1 62,122.8 36,619.1
(b) Operating lease commitments - as lessee
The Group and Company lease a number of plant and machineries, office buildings and equipment under operating leases. These leases have average tenures between 3 and 25 years.
Future minimum rental payable under non-cancellable operating leases at the reporting date are as follows:
Group Company
Financialyear ended31.12.2018RM’million
Financialperiod ended
31.12.2017RM’million
Financialyear ended31.12.2018RM’million
Financialperiod ended 31.12.2017
RM’million
Payable not later than 1 year 4,224.3 4,437.5 5,203.4 5,412.6
Payable later than 1 year and not later than 5 years 13,032.6 14,323.8 16,777.2 18,320.7
Payable more than 5 years 23,415.4 26,322.3 36,388.9 40,022.6
40,672.3 45,083.6 58,369.5 63,755.9
(c) Operating lease commitments - as lessor
The Group and Company lease out its plant and equipment under non-cancellable operating leases. The lessees are required to pay absolute fixed lease payments during the lease period. Total future minimum lease receivables under non-cancellable operating leases contracted for at the reporting date but not recognised as receivables, are as follows:
Group Company
Financialyear ended31.12.2018RM’million
Financialperiod ended
31.12.2017RM’million
Financialyear ended31.12.2018RM’million
Financialperiod ended 31.12.2017
RM’million
Payable not later than 1 year 65.2 79.7 57.3 61.8
Payable later than 1 year and not later than 5 years 261.0 318.7 229.1 247.4
Payable more than 5 years 122.4 204.7 12.8 13.1
448.6 603.1 299.2 322.3

About TNB
Our Business
Business Context
Performance Review
Sustainability Statement
The Strength of Our Governance
Financial Statements
Additional InformationIntegrated Annual Report 2018
Tenaga Nasional Berhad
p.253 Notes to the Financial Statements
42 CONTINGENT LIABILITIES
Accounting Policy
The Group and Company do not recognise contingent assets and liabilities other than those arising from business combinations, but disclose its existence in the financial statements. A contingent liability is a possible obligation that arises from past events whose existence will be confirmed by the occurrence or non-occurrence of one or more uncertain future events beyond the control of the Group and Company or a present obligation that is not recognised because it is not probable that an outflow of resources will be required to settle the obligation. A contingent liability also arises in the extremely rare case where there is a liability that cannot be recognised because it cannot be measured reliably. However, contingent liabilities do not include financial guarantee contracts. A contingent asset is a possible asset that arises from past events whose existence will be confirmed by the occurrence or non-occurrence of one or more uncertain future events beyond the control of the Group and Company. The Group and Company do not recognise contingent assets but disclose its existence where inflows of economic benefits are probable, but not virtually certain.
Determination of the treatment of contingent liabilities is based on the Group and Company’s view of the expected outcome of the contingencies after consulting legal counsel for litigation cases and internal and external experts to the Group and Company for matters in the ordinary course of business.
Group Company
31.12.2018RM’million
31.12.2017RM’million
31.12.2018RM’million
31.12.2017RM’million
Claims by third parties:
- Contractors 115.4 125.4 115.4 104.6
- Customers 18.0 78.7 18.0 78.7
- Others 176.7 136.8 120.0 120.9
310.1 340.9 253.4 304.2
Trade guarantees and performance bonds 27.5 66.0 0 0
337.6 406.9 253.4 304.2
All third party claims are being resolved and the Directors are of the opinion that their outcomes will not have a material adverse effect on the financial positions of both the Group and Company.
On 7 December 2016, the Company and the Inland Revenue Board (‘IRB’) entered into a consent judgement before the Kuala Lumpur High Court to substitute the judicial review proceedings with regard to the notices of additional assessment dated 23 November 2015 (‘Notices’) arising from the disallowance of the Company’s re-investment allowance (‘RIA’) claims by filing an appeal to the Special Commissioners of Income Tax (‘SCIT’). The consent judgement also provides that the IRB will not commence any proceedings relating to the Notices until this matter is determined by the SCIT and by the High Court, if there is a subsequent appeal by either party. On 15 December 2016, the Company filed notices of appeal against the Notices to the SCIT according to Section 99(1) of the Income Tax Act 1967. The appeals have since been registered before the SCIT. The Company has obtained legal advice from its tax solicitors on the merits of the appeals and on this basis, the Directors are of the opinion that no provision is required in the financial statements for the potential tax liability up to the reporting date.

About TNB
Our Business
Business Context
Performance Review
Sustainability Statement
The Strength of Our Governance
Financial Statements
Additional Information
p.254 Notes to the Financial Statements
43 SIGNIFICANT RELATED PARTY DISCLOSURES
For the purposes of these financial statements, parties are considered to be related to the Group or the Company if the Group or the Company has the ability, directly or indirectly, to control the party or exercise significant influence over the party in making financial and operating decisions, or vice versa, or where the Group or the Company and the party are subject to common control or common significant influence.
The related parties of the Group and Company are:
(a) Subsidiary companies
Details of the subsidiary companies are shown in Note 15.
(b) Associate companies
Associate companies are those entities in which the Group has significant influence but not control as disclosed in Note 17.
(c) Key Management Personnel (‘KMP’)
KMP are defined as those persons having authority and responsibility for planning, directing and controlling the activities of the Group and Company either directly or indirectly. The KMP of the Group or of the Company includes Executive Directors and Non-Executive Directors of the Company and certain members of senior management of the Company.
Whenever exist, related party transactions also include transactions with entities that are controlled, jointly controlled or significantly influenced directly or indirectly by any key management personnel or their close family members.
(d) Government-related entities
Government-linked corporations are related to the Group and Company by virtue of the substantial shareholdings of Khazanah Nasional Berhad (‘KNB’), with 28.8% (2017: 28.1%) equity interest. KNB is a wholly-owned entity of MoF Incorporated which is in turn owned by the Ministry of Finance. KNB and entities directly controlled by the Government of Malaysia are collectively referred to as government-related entities to the Group and Company.
The Government of Malaysia and bodies controlled or jointly controlled by the Government of Malaysia are related parties of the Group and Company. The Group and Company enter into transactions with many of these bodies, which include but are not limited to purchasing of goods, including use of public utilities and amenities, and the placing of bank deposits.
All the transactions entered into by the Group and Company with the government-related entities are conducted in the ordinary course of the Group and Company’s businesses on negotiated terms or terms comparable to those with other entities that are not government-related, except otherwise disclosed elsewhere in the financial statements.
The Group and Company are principally involved in the provision of electricity as part of their ordinary operations. These services are carried out generally on commercial terms that are consistently applied to all customers. These transactions have been established on terms and conditions that are not materially different from those obtainable in transactions with unrelated parties.
Apart from the individually significant transactions and balances as disclosed elsewhere in the financial statements, the Group and Company have collectively, but not individually significant transactions with related parties.

About TNB
Our Business
Business Context
Performance Review
Sustainability Statement
The Strength of Our Governance
Financial Statements
Additional InformationIntegrated Annual Report 2018
Tenaga Nasional Berhad
p.255 Notes to the Financial Statements
43 SIGNIFICANT RELATED PARTY DISCLOSURES (CONTINUED)
In addition to the transactions detailed elsewhere in the financial statements, the Group and Company had the following significant transactions with the following related parties based on agreed terms during the financial year/period:
Associate companies KMP
Financialyear ended31.12.2018RM’million
Financialperiod ended
31.12.2017RM’million
Financialyear ended31.12.2018RM’million
Financialperiod ended 31.12.2017
RM’million
Group
Income:
- Sales of electricity 1.2 0.4 0 0
- Interest income 14.8 3.6 0 0
- Dividend income 29.6 18.0 0 0
- Rental income 8.4 4.7 0 0
- Leasing income 14.1 8.5 0 0
Expenses:
- Purchase of electricity 3,736.5 1,269.9 0 0
- Key management compensations:
- Salaries, allowances and bonuses 0 0 27.4 6.7
- Benefits-in-kind 0 0 1.7 0.2
- Defined contribution retirement plan 0 0 3.5 0.9
- Other staff benefits 0 0 0.7 0.6
- LTIP expense 0 0 11.6 2.4
- Leasing expense 18.2 5.6 0 0
Amounts due from 364.9 332.0
Amounts due to (656.3) (691.2)
Investment in unquoted debt securities 326.7 318.5
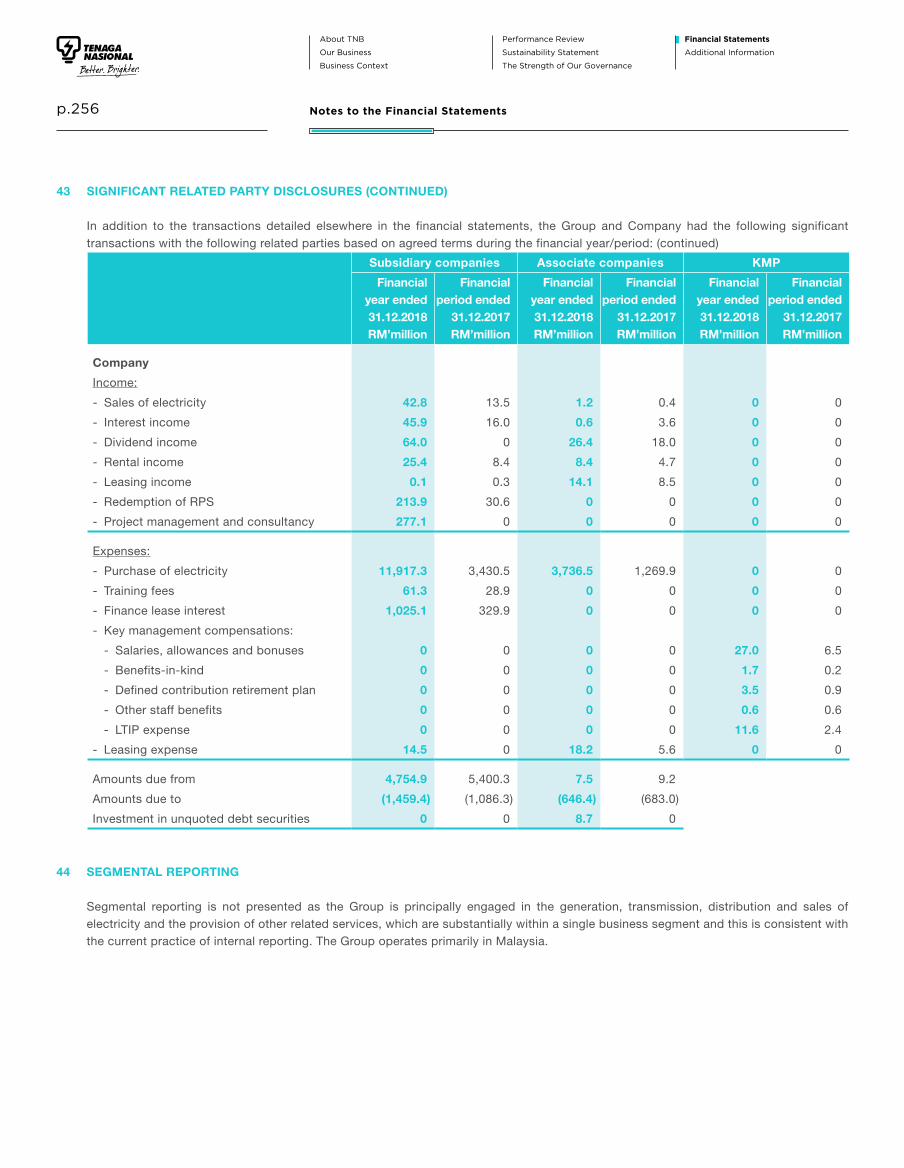
About TNB
Our Business
Business Context
Performance Review
Sustainability Statement
The Strength of Our Governance
Financial Statements
Additional Information
p.256 Notes to the Financial Statements
43 SIGNIFICANT RELATED PARTY DISCLOSURES (CONTINUED)
In addition to the transactions detailed elsewhere in the financial statements, the Group and Company had the following significant transactions with the following related parties based on agreed terms during the financial year/period: (continued)
Subsidiary companies Associate companies KMP
Financialyear ended31.12.2018RM’million
Financialperiod ended
31.12.2017RM’million
Financialyear ended31.12.2018RM’million
Financialperiod ended
31.12.2017RM’million
Financialyear ended31.12.2018RM’million
Financialperiod ended
31.12.2017RM’million
Company
Income:
- Sales of electricity 42.8 13.5 1.2 0.4 0 0
- Interest income 45.9 16.0 0.6 3.6 0 0
- Dividend income 64.0 0 26.4 18.0 0 0
- Rental income 25.4 8.4 8.4 4.7 0 0
- Leasing income 0.1 0.3 14.1 8.5 0 0
- Redemption of RPS 213.9 30.6 0 0 0 0
- Project management and consultancy 277.1 0 0 0 0 0
Expenses:
- Purchase of electricity 11,917.3 3,430.5 3,736.5 1,269.9 0 0
- Training fees 61.3 28.9 0 0 0 0
- Finance lease interest 1,025.1 329.9 0 0 0 0
- Key management compensations:
- Salaries, allowances and bonuses 0 0 0 0 27.0 6.5
- Benefits-in-kind 0 0 0 0 1.7 0.2
- Defined contribution retirement plan 0 0 0 0 3.5 0.9
- Other staff benefits 0 0 0 0 0.6 0.6
- LTIP expense 0 0 0 0 11.6 2.4
- Leasing expense 14.5 0 18.2 5.6 0 0
Amounts due from 4,754.9 5,400.3 7.5 9.2
Amounts due to (1,459.4) (1,086.3) (646.4) (683.0)
Investment in unquoted debt securities 0 0 8.7 0
44 SEGMENTAL REPORTING
Segmental reporting is not presented as the Group is principally engaged in the generation, transmission, distribution and sales of electricity and the provision of other related services, which are substantially within a single business segment and this is consistent with the current practice of internal reporting. The Group operates primarily in Malaysia.

About TNB
Our Business
Business Context
Performance Review
Sustainability Statement
The Strength of Our Governance
Financial Statements
Additional InformationIntegrated Annual Report 2018
Tenaga Nasional Berhad
p.257 Notes to the Financial Statements
45 FINANCIAL INSTRUMENTS
Accounting Policy
Financial assets
(a) Classification
From 1 January 2018, the Group and Company classify its financial assets in the following categories: at amortised cost (‘AC’), at FVOCI and at FVTPL. The classification depends on the entity’s business model for managing the financial assets and the contractual terms of the cash flows.
(i) Financial assets at AC:• The asset is held within a business model whose objective is to collect the contractual cash flows; and• The contractual terms give rise to cash flows that are solely payments of principal and interest.
(ii) Financial assets at FVOCI:• equity securities which are not held for trading, and which the Group and Company have irrevocably elected at
initial recognition to recognise in this category. These are strategic investments and the Group and Company consider this classification to be more relevant; and
• debt securities where the contractual cash flows are solely principal and interest and the objective of the Group and Company’s business model is achieved both by collecting cash flows and selling financial assets.
(iii) Financial assets at FVTPL:• debts instruments that do not qualify for measurement at either AC or FVOCI;• equity instruments that are held for trading; and• equity instruments for which the Group and Company have not elected to recognise fair value gains and losses
through OCI.
The Group and Company reclassify debt investments when and only when its business model for managing those assets changes.
See Note 47 for the impact of the change in accounting policy following the adoption of MFRS 9 on the classification of financial assets.
(b) Recognition and derecognition
Regular purchases and sales of financial assets are recognised on the trade-date, the date on which the Group and Company commit to purchase or sell the assets. Financial assets are derecognised when the rights to receive cash flows from the financial assets have expired or have been transferred and the Group and Company have transferred substantially all the risks and rewards of ownership.

About TNB
Our Business
Business Context
Performance Review
Sustainability Statement
The Strength of Our Governance
Financial Statements
Additional Information
p.258 Notes to the Financial Statements
45 FINANCIAL INSTRUMENTS (CONTINUED)
Accounting Policy (continued)
Financial assets (continued)
(c) Measurement
(i) Initial recognition
At initial recognition, the Group and Company measure a financial asset at its fair value plus, in the case of a financial asset not at FVTPL, transaction costs that are directly attributable to the acquisition of the financial asset. Transaction costs of financial assets carried at FVTPL are expensed in the statement of profit or loss.
Financial assets with embedded derivatives are considered in their entirety when determining whether their cash flows are solely payment of principal and interest.
(ii) Subsequent measurement
• Debt instruments
Subsequent measurement of debt instruments depends on the Group and Company’s business model for managing the asset and the cash flow characteristics of the asset. There are three measurement categories into which the Group and Company classify its debt instruments:- AC: Interest income from financial assets at AC is included in finance income using the effective interest rate
method. Any gain or loss arising on derecognition is recognised directly in profit or loss and presented in other gains/(losses) together with foreign exchange gains and losses. Impairment losses are presented as separate line item in the statement of profit or loss.
- FVOCI: Movements in the carrying amount of debt instruments classified under FVOCI are taken through OCI. Upon derecognition of the assets, the cumulative gain or loss previously recognised in OCI is recognised to the statement of profit or loss. The interest income from these financial assets is included in the finance income using the effective interest rate method. The foreign exchange gains and losses are presented in other gains/(losses) and impairment expenses are presented as a separate line item in the statement of profit or loss.
- FVTPL: Financial assets that do not meet the criteria for AC or FVOCI are measured at FVTPL. A gain or loss on debt instruments which are measured at FVTPL are recognised in the profit or loss.
• Equity instruments
The Group and Company have elected to present fair value gains and losses on equity instruments in OCI. The fair value gains and losses of these instruments will not be reclassified subsequently to the profit or loss. Dividends from such investments are recognised in the profit or loss as other income. Impairment losses (and reversal of impairment losses) on equity instruments measured at FVOCI are also reported as other changes in fair value.

About TNB
Our Business
Business Context
Performance Review
Sustainability Statement
The Strength of Our Governance
Financial Statements
Additional InformationIntegrated Annual Report 2018
Tenaga Nasional Berhad
p.259 Notes to the Financial Statements
45 FINANCIAL INSTRUMENTS (CONTINUED)
Accounting Policy (continued)
Financial assets (continued)
(d) Impairment
From 1 January 2018, the Group and Company assess on a forward looking basis the expected credit losses associated with its debt instruments carried at AC and FVOCI. The impairment methodology applied depends on whether there has been a significant increase in credit risk.
The Group and Company have four broad types of financial instruments that are subject to the ECL model:(i) Trade receivables(ii) Contract assets(iii) Non-trade receivables
• intercompany loans/advances• rechargeable job orders (‘RJO’) debtors • sundry deposits for rental spaces• rental receivables• staff loans/advances• investment in unquoted debt security
(iv) Financial guarantee contracts issued
While cash and cash equivalents are also subject to the impairment requirements of MFRS 9, the identified impairment loss was immaterial.
ECL represents a probability-weighted estimate of the difference between the present value of the cash flows according to the contract and present value of the cash flows the Group and Company expected to receive, over the remaining life of the financial instruments. For financial guarantee contracts, the ECL is the difference between the expected payments to be reimbursed to the holder of the guaranteed debt instrument less any amounts that the Company expects to receive from the holder, the debtor or any other party.
The measurement of ECL reflects:(i) an unbiased and probability-weighted amount that is determined by evaluating a range of possible outcomes;(ii) the time value of money; and (iii) reasonable and supportable information that is available without undue cost or effort at the reporting date about past
events, current conditions and forecasts of future economic conditions.
For trade receivables, the Group and Company apply the simplified approach, which requires expected lifetime losses to be recognised from initial recognition of the receivables, except for those which are in default or credit impaired are assessed individually.
For non-trade receivables, at each reporting date the Group and Company measure ECL through a loss allowance at an amount equal to 12 month ECL if credit risk on a financial instrument or a group of financial instruments has not increased significantly since initial recognition.

About TNB
Our Business
Business Context
Performance Review
Sustainability Statement
The Strength of Our Governance
Financial Statements
Additional Information
p.260 Notes to the Financial Statements
45 FINANCIAL INSTRUMENTS (CONTINUED)
Accounting Policy (continued)
Financial assets (continued)
(d) Impairment (continued)
The Group and Company use the three-stage approach for non-trade receivables which reflect their credit risks and how the loss allowances are determined for each of those stages. Summary of the assumptions underpinning the Group and Company’s ECL model for non-trade receivables are as follows:
Types of non-trade receivables
Stage 1Low credit risk(12 month ECL Model)
Stage 2 Significantincrease in credit risk(Lifetime ECL Model)
Stage 3Credit impaired(Lifetime ECL Model)
• Intercompany loans/advances Positive operating cash flows/Net tangible assets (Total Assets - Total Liabilities)/Subsidiaries with assets under construction having guaranteed long term revenue contract and agents
Negative operating cash flows and net tangible liabilities (Total Assets - Total Liabilities)/ Without defaulting on loan repayments
Dormant/History of default
• Rechargeable job orders (‘RJO’) debtors Covered by indent/ downpayment/Letter of Undertaking (‘LOU’)
No indent/downpayment/LOU
Accident cases
• Sundry deposits for rental spaces Active contracts Inactive contracts and amounts outstanding less or equal to 12 months
Inactive contracts and amounts outstanding more than 12 months
• Rental receivables Active contracts and amounts outstanding less or equal to 3 months
Active contracts and amounts outstanding more than 3 months
Inactive contracts
• Staff loans/advances Current employees Ex-employees with no default in payment
Ex-employees with default in payment
• Investment in unquoted debt security No history of default and no current default
History of default but no current default
History of default and currently defaulted

About TNB
Our Business
Business Context
Performance Review
Sustainability Statement
The Strength of Our Governance
Financial Statements
Additional InformationIntegrated Annual Report 2018
Tenaga Nasional Berhad
p.261 Notes to the Financial Statements
45 FINANCIAL INSTRUMENTS (CONTINUED)
Accounting Policy (continued)
Financial assets (continued)
(d) Impairment (continued)
When determining whether the credit risk of a financial asset has increased significantly since initial recognition and when estimating ECL, the Group and Company consider reasonable and supportable information that is relevant and available without undue cost or effort. This includes both quantitative and qualitative information and analysis, based on the Group’s historical experience and informed credit assessment including forward-looking information, where available. Regardless of the analysis above, a significant increase in credit risk is presumed if the financial asset is past due in making a contractual payment.
The gross carrying amount of a financial asset is written off (either partially or fully) to the extent that there is no realistic prospect of recovery. This is generally the case when either the Group or Company determines that the debtor does not have assets or sources of income that could generate sufficient cash flows to repay the amounts subjected to the write-off. However, financial assets that are written off could still be subject to enforcement activities in order to comply with the Group or Company’s procedures for recovery of amounts due.
Financial liabilities
MFRS 9 retains most of the MFRS 139 requirements for financial liabilities. From 1 January 2018, the Group and Company classify its financial liabilities in the following categories: at amortised cost (‘AC’) and at FVTPL.
Offsetting financial instruments
Financial assets and liabilities are offset and the net amount presented in the statement of financial position (‘SOFP’) when there is a legally enforceable right to offset the recognised amounts and there is an intention to settle on a net basis, or realise the asset and settle the liability simultaneously. The legally enforceable right must not be contingent on future events and must be enforceable in the normal course of business and in the event of default, insolvency or bankruptcy.
Financial guarantee contracts
Financial guarantee contracts are contracts that require the Group or the Company to make specified payments to reimburse the holder for a loss it incurs because a specified debtor fails to make payments when due, in accordance with the terms of a debt instrument.
Financial guarantee contracts are recognised as a financial liability at the time the guarantee is issued. The liability is initially measured at fair value and subsequently at the higher of;(i) the amount determined in accordance with the expected credit loss model under MFRS 9; and (ii) the amount initially recognised less, where appropriate, the cumulative amount of income recognised in accordance with the
principles of MFRS 15.
The fair value of financial guarantees is determined as the present value of the difference in net cash flows between the contractual payments under the debt instrument and the payments that would be required without the guarantee, or the estimated amount that would be payable to a third party for assuming the obligations.
Where guarantees in relation to loans or other payables of associates are provided for no compensation, the fair values are accounted for as contributions and recognised as part of the cost of the investment.

About TNB
Our Business
Business Context
Performance Review
Sustainability Statement
The Strength of Our Governance
Financial Statements
Additional Information
p.262 Notes to the Financial Statements
45 FINANCIAL INSTRUMENTS (CONTINUED)
Accounting Policy (continued)
Accounting policies applied until 31 December 2017
Financial assets
The Group and Company have applied MFRS 9 retrospectively, but have elected not to restate comparative information. As a result, the comparative information provided continues to be accounted for in accordance with the Group and Company’s previous accounting policy.
(i) Classification
Until 31 December 2017, the Group and Company classified its financial assets in the following categories:• financial assets at FVTPL;• loans and receivables (‘L&R’); and• available-for-sale (‘AFS’) financial assets.
The classification depended on the purpose for which the investments were acquired. Management determined the
classification of its investments at initial recognition.
• Financial assets at FVTPL
Financial assets at FVTPL are financial assets held-for-trading. A financial asset is classified in this category if it is acquired or incurred principally for the purpose of selling or repurchasing it in the near term. Derivatives are also categorised as held-for-trading unless they are designated as hedges.
• L&R
L&R are non-derivative financial assets with fixed or determinable payments that are not quoted in an active market. If collection of the amounts is expected in one year or less, they are classified as current assets. If not, they are classified as non-current assets.
• AFS financial assets
AFS financial assets are non-derivatives that are either designated in this category or not classified in any of the other categories. They are included in non-current assets unless the investments mature or management intends to dispose it within 12 months of the end of the reporting period.
(ii) Reclassification
The Group and Company could choose to reclassify a non-derivative trading financial asset out of the held for trading category if the financial asset was no longer held for the purpose of selling it in the near term. Financial assets other than L&R were permitted to be reclassified out of the held for trading category only in rare circumstances arising from a single event that was unusual and highly unlikely to recur in the near term. In addition, the Group and Company could choose to reclassify financial assets that would meet the definition of L&R out of the held for trading or AFS categories if the Group and Company had the intention and ability to hold these financial assets for the foreseeable future or until maturity at the date of reclassification.
Reclassifications were made at fair value as of the reclassification date. Fair value became the new cost or AC as applicable, and no reversals of fair value gains or losses recorded before reclassification date were subsequently made. Effective interest rates for financial assets reclassified to L&R category were determined at the reclassification date. Further increases in estimates of cash flows adjusted effective interest rates prospectively.

About TNB
Our Business
Business Context
Performance Review
Sustainability Statement
The Strength of Our Governance
Financial Statements
Additional InformationIntegrated Annual Report 2018
Tenaga Nasional Berhad
p.263 Notes to the Financial Statements
45 FINANCIAL INSTRUMENTS (CONTINUED)
Accounting Policy (continued)
Accounting policies applied until 31 December 2017 (continued)
Financial assets (continued)
(iii) Subsequent measurement
• Gain and losses
AFS financial assets and financial assets at FVTPL are subsequently carried at fair value. L&R financial assets are subsequently carried at AC using the effective interest method.
Changes in the fair values of financial assets at FVTPL, including the effects of currency translation are recognised in the statement of profit or loss in the period in which the changes arise.
• Impairment of financial assets
The Group and Company assess at the end of the reporting period whether there is objective evidence that a financial asset or a group of financial assets is impaired. A financial asset or a group of financial assets is impaired and an impairment loss is incurred only if there is objective evidence of impairment as a result of one or more events that occurred after the initial recognition of the asset (a ‘loss event’) and that loss event (or events) has an impact on the estimated future cash flows of the financial asset or group of financial assets that can be reliably estimated.
- Assets carried at AC
Evidence of impairment may include indications that the debtors or a group of debtor is experiencing significant financial difficulty, default or delinquency in interest or principal payments, the probability that they will enter bankruptcy or other financial reorganisation, and where observable data indicates that there is a measurable decrease in the estimated future cash flows, such as changes in arrears or economic conditions that correlate with defaults.
The amount of the loss is measured as the difference between the asset’s carrying amount and the present value of estimated future cash flows (excluding future credit losses that have not been incurred) discounted at the financial asset’s original effective interest rate method. The asset’s carrying amount is reduced and the amount of the loss is recognised in the statement of profit or loss. If L&R have a variable interest rate, the discount rate for measuring any impairment loss is the current effective interest rate determined under the contract. As a practical expedient, the Group and Company may measure impairment on the basis of an instrument’s fair value using an observable market price.
If, in a subsequent period, the amount of the impairment loss decreases and the decrease can be objectively related to an event occurring after the impairment was recognised (such as an improvement in the debtor’s credit rating), the reversal of the previously recognised impairment loss is recognised in the statement of profit or loss.
When an asset is uncollectible, it is written off against the related accumulated impairment losses account. Such assets are written off after all the necessary procedures have been completed and the amount of the losses have been determined.
- Assets classified as AFS
For debt securities, the Group and Company use criteria and measurement of impairment loss applicable for ‘assets carried at AC’ above. If, in a subsequent period, the fair value of a debt instrument classified as AFS increases and the increase can be objectively related to an event occurring after the impairment loss was recognised in the statement of profit or loss, the impairment loss is reversed through the statement of profit or loss.

About TNB
Our Business
Business Context
Performance Review
Sustainability Statement
The Strength of Our Governance
Financial Statements
Additional Information
p.264 Notes to the Financial Statements
45 FINANCIAL INSTRUMENTS (CONTINUED)
Accounting Policy (continued)
Accounting policies applied until 31 December 2017 (continued)
Financial assets (continued)
(iii) Subsequent measurement (continued)
• Impairment of financial assets (continued)
- Assets classified as AFS (continued)
In the case of equity securities classified as AFS, in addition to the criteria for ‘assets carried at AC’ above, a significant or prolonged decline in the fair value of the security below its cost is also considered as an indicator that the assets are impaired. If any such evidence exists for AFS financial assets, the cumulative losses that had been recognised directly in equity is removed from equity and recognised in the statement of profit or loss. The amount of cumulative losses that is reclassified to the statement of profit or loss is the difference between the acquisition cost and the current fair value, less any impairment loss on that financial asset previously recognised in the statement of profit or loss. Impairment losses recognised in the statement of profit or loss on equity instruments classified as AFS are not reversed through the statement of profit or loss.
(iv) Derecognition
Financial assets are derecognised when the rights to receive cash flows from the investments have expired or have been transferred and the Group and Company have transferred substantially all risks and rewards of ownership to related party.
Financial liabilities
The Group and Company classify its financial liabilities in two categories, at FVTPL or other financial liabilities. The Group and Company determine the classification of its financial liabilities at initial recognition.
Other financial liabilities are non-derivative financial liabilities, initially recognised at fair value plus transaction costs and subsequently carried at amortised cost using the effective interest method. Changes in the carrying value of these liabilities are recognised in the statement of profit or loss.
The Group and Company’s other financial liabilities comprise trade and other payables and borrowings in the statement of financial position. Financial liabilities are classified as current liabilities; except for maturities more than 12 months after the reporting date, in which case they are classified as non-current liabilities.
Financial liabilities are derecognised when the liability is either discharged, cancelled, expired or has been restructured with substantially different terms.
Financial guarantee contracts
Financial guarantee contracts are recognised as a financial liability at the time the guarantee is issued. The liability is initially measured at fair value and subsequently at the higher of the amount determined in accordance with MFRS 137 and the amount initially recognised less cumulative amortisation, where appropriate.
The fair value of financial guarantees is determined as the present value of the difference in net cash flows between the contractual payments under the debt instrument and the payments that would be required without guarantee, or the estimated amount that would be payable to a third party for assuming the obligations.

About TNB
Our Business
Business Context
Performance Review
Sustainability Statement
The Strength of Our Governance
Financial Statements
Additional InformationIntegrated Annual Report 2018
Tenaga Nasional Berhad
p.265 Notes to the Financial Statements
45 FINANCIAL INSTRUMENTS (CONTINUED)
(a) Categories of financial instruments in compliance to MFRS 9 with comparative of MFRS 139 compliance.
The financial instruments are categorised as follows:(i) Financial assets and financial liabilities at amortised cost (‘AC’);(ii) Financial assets and financial liabilities at FVTPL;(iii) Financial assets at FVOCI;(iv) Loans and receivables (‘L&R’);(v) Available-for-sale financial assets (‘AFS’); and(vi) Other financial liabilities measured at amortised cost (‘OL’).
31.12.2018
Carryingamount
RM’millionAC
RM’millionFVTPL
RM’millionFVOCI
RM’million
Group
Financial assets
Investments in unquoted debt securities 326.7 326.7 0 0
Long term receivables 102.7 102.7 0 0
Finance lease receivable 13.4 13.4 0 0
Financial assets at FVOCI 76.4 0 0 76.4
Receivables 4,620.9 4,620.9 0 0
Amounts due from joint ventures 10.8 10.8 0 0
Amounts due from associates 364.9 364.9 0 0
Financial assets at FVTPL 9,743.3 0 9,743.3 0
Deposits, bank and cash balances 8,670.8 8,670.8 0 0
Derivative financial instruments 1.4 0 1.4 0
23,931.3 14,110.2 9,744.7 76.4
Company
Financial assets
Investment in unquoted debt security 8.7 8.7 0 0
Long term receivables 86.1 86.1 0 0
Financial assets at FVOCI 75.7 0 0 75.7
Receivables 2,822.1 2,822.1 0 0
Amounts due from subsidiaries 4,754.9 4,754.9 0 0
Amounts due from associates 7.5 7.5 0 0
Financial assets at FVTPL 5,224.6 0 5,224.6 0
Deposits, bank and cash balances 5,852.4 5,852.4 0 0
18,832.0 13,531.7 5,224.6 75.7

About TNB
Our Business
Business Context
Performance Review
Sustainability Statement
The Strength of Our Governance
Financial Statements
Additional Information
p.266 Notes to the Financial Statements
45 FINANCIAL INSTRUMENTS (CONTINUED)
(a) Categories of financial instruments (continued)
31.12.2017 (Restated)
Carryingamount
RM’millionL&R
RM’millionFVTPL
RM’millionAFS
RM’million
Group
Financial assets
Investment in unquoted debt security 318.5 318.5 0 0
Long term receivables 249.5 249.5 0 0
Finance lease receivable 14.2 14.2 0 0
AFS financial assets 69.3 0 0 69.3
Receivables 6,016.2 6,016.2 0 0
Amounts due from joint ventures 1.1 1.1 0 0
Amounts due from associates 332.0 332.0 0 0
Financial assets at FVTPL 10,490.2 0 10,490.2 0
Deposits, bank and cash balances 5,415.0 5,415.0 0 0
22,906.0 12,346.5 10,490.2 69.3
Company
Financial assets
Long term receivables 197.0 197.0 0 0
AFS financial assets 68.6 0 0 68.6
Receivables 3,233.3 3,233.3 0 0
Amounts due from subsidiaries 5,400.3 5,400.3 0 0
Amounts due from associates 9.2 9.2 0 0
Financial assets at FVTPL 3,850.5 0 3,850.5 0
Deposits, bank and cash balances 3,001.3 3,001.3 0 0
15,760.2 11,841.1 3,850.5 68.6

About TNB
Our Business
Business Context
Performance Review
Sustainability Statement
The Strength of Our Governance
Financial Statements
Additional InformationIntegrated Annual Report 2018
Tenaga Nasional Berhad
p.267 Notes to the Financial Statements
45 FINANCIAL INSTRUMENTS (CONTINUED)
(a) Categories of financial instruments (continued)
31.12.2018
Carryingamount
RM’millionAC
RM’millionFVTPL
RM’million
Group
Financial liabilities
Payables 9,166.2 9,166.2 0
Financial guarantee contract 270.3 0 270.3
Finance lease payables 4,874.1 4,874.1 0
Amounts due to associates 656.3 656.3 0
Amounts due to joint ventures 0.5 0.5 0
Borrowings 47,832.4 47,832.4 0
Derivative financial instruments 55.5 0 55.5
Other liabilities 602.0 602.0 0
63,457.3 63,131.5 325.8
Company
Financial liabilities
Payables 5,635.9 5,635.9 0
Financial guarantee contracts 272.7 0 272.7
Finance lease payables 16,668.8 16,668.8 0
Amounts due to subsidiaries 1,459.4 1,459.4 0
Amounts due to associates 646.4 646.4 0
Borrowings 21,637.0 21,637.0 0
Other liabilities 536.9 536.9 0
46,857.1 46,584.4 272.7

About TNB
Our Business
Business Context
Performance Review
Sustainability Statement
The Strength of Our Governance
Financial Statements
Additional Information
p.268 Notes to the Financial Statements
45 FINANCIAL INSTRUMENTS (CONTINUED)
(a) Categories of financial instruments (continued)
31.12.2017 (Restated)
Carryingamount
RM’millionOL
RM’millionFVTPL
RM’million
Group
Financial liabilities
Payables 8,668.3 8,668.3 0
Finance lease payables 5,210.5 5,210.5 0
Amounts due to associates 691.2 691.2 0
Borrowings 41,443.7 41,443.7 0
Derivative financial instruments 47.3 0 47.3
Other liabilities 517.2 517.2 0
56,578.2 56,530.9 47.3
Company
Financial liabilities
Payables 5,491.1 5,491.1 0
Finance lease payables 17,790.9 17,790.9 0
Amounts due to subsidiaries 1,086.3 1,086.3 0
Amounts due to associates 683.0 683.0 0
Borrowings 15,348.1 15,348.1 0
Derivative financial instruments 0.2 0 0.2
Other liabilities 473.5 473.5 0
40,873.1 40,872.9 0.2
(b) Financial risk management
The Group and Company have exposure to the following risks from their use of financial instruments:• Credit risk;• Liquidity risk; and• Market risk.
Credit risk
Credit risk is the risk of a financial loss to the Group and Company if a customer or counterparty to a financial instrument fails to meet its contractual obligations. The Group and Company’s exposures to credit risk arise principally from its receivables from customers, investments in unquoted debt securities, deposits, bank and cash balances and derivative financial instruments. In addition, the Company’s exposure to credit risk arises principally from loans and advances to subsidiaries and financial guarantees given to banks in respect of banking facilities granted to certain subsidiaries and an associate.

About TNB
Our Business
Business Context
Performance Review
Sustainability Statement
The Strength of Our Governance
Financial Statements
Additional InformationIntegrated Annual Report 2018
Tenaga Nasional Berhad
p.269 Notes to the Financial Statements
45 FINANCIAL INSTRUMENTS (CONTINUED)
(b) Financial risk management (continued)
Credit risk (continued)
Net loss on impairment of financial instruments and contract assets are mainly from:
Group Company
31.12.2018RM’million
31.12.2017RM’million
31.12.2018RM’million
31.12.2017RM’million
Net (losses)/gains on:
Trade receivables
- recognised in profit or loss (402.9) (106.5) (392.6) (95.2)
- reversed 212.8 0 176.0 0
Contract assets
- recognised in profit or loss (83.7) (56.4) (78.4) (56.1)
- reversed 76.1 14.2 75.8 14.2
Intercompany loans/advances
- recognised in profit or loss 0 0 (86.9) (13.3)
- reversed 0 0 79.4 14.5
Other non-trade receivables
- recognised in profit or loss (79.2) (15.0) (35.9) (1.7)
- reversed 66.7 5.8 66.4 2.0
Amounts due from associates
- recognised in profit or loss (7.1) 0 0 0
- reversed 0.3 0 0.3 0
Amounts due from joint ventures
- recognised in profit or loss 0 (5.5) 0 0
Financial guarantee contracts
- recognised in profit or loss (270.3) 0 (270.8) 0
(487.3) (163.4) (466.7) (135.6)
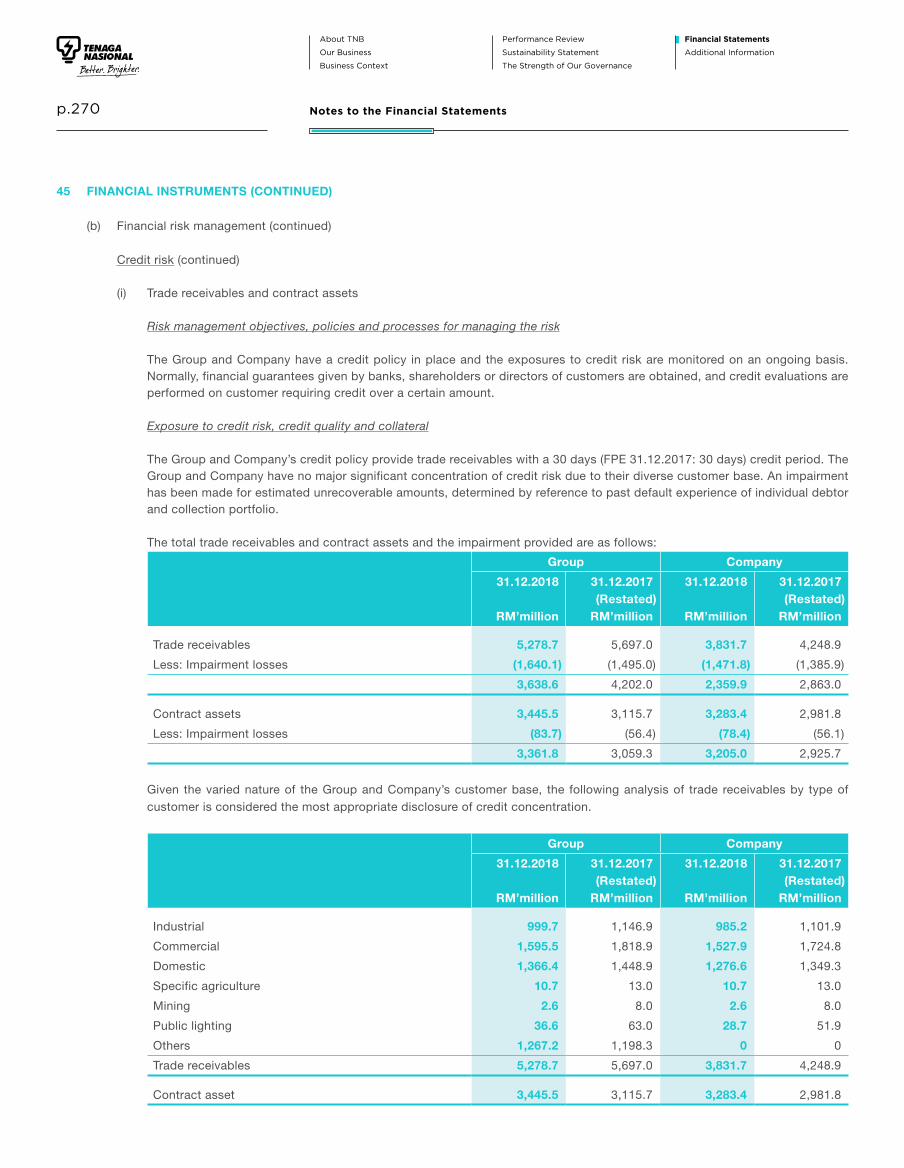
About TNB
Our Business
Business Context
Performance Review
Sustainability Statement
The Strength of Our Governance
Financial Statements
Additional Information
p.270 Notes to the Financial Statements
45 FINANCIAL INSTRUMENTS (CONTINUED)
(b) Financial risk management (continued)
Credit risk (continued)
(i) Trade receivables and contract assets
Risk management objectives, policies and processes for managing the risk
The Group and Company have a credit policy in place and the exposures to credit risk are monitored on an ongoing basis. Normally, financial guarantees given by banks, shareholders or directors of customers are obtained, and credit evaluations are performed on customer requiring credit over a certain amount.
Exposure to credit risk, credit quality and collateral
The Group and Company’s credit policy provide trade receivables with a 30 days (FPE 31.12.2017: 30 days) credit period. The Group and Company have no major significant concentration of credit risk due to their diverse customer base. An impairment has been made for estimated unrecoverable amounts, determined by reference to past default experience of individual debtor and collection portfolio.
The total trade receivables and contract assets and the impairment provided are as follows:
Group Company
31.12.2018
RM’million
31.12.2017(Restated)
RM’million
31.12.2018
RM’million
31.12.2017(Restated)
RM’million
Trade receivables 5,278.7 5,697.0 3,831.7 4,248.9
Less: Impairment losses (1,640.1) (1,495.0) (1,471.8) (1,385.9)
3,638.6 4,202.0 2,359.9 2,863.0
Contract assets 3,445.5 3,115.7 3,283.4 2,981.8
Less: Impairment losses (83.7) (56.4) (78.4) (56.1)
3,361.8 3,059.3 3,205.0 2,925.7
Given the varied nature of the Group and Company’s customer base, the following analysis of trade receivables by type of customer is considered the most appropriate disclosure of credit concentration.
Group Company
31.12.2018
RM’million
31.12.2017(Restated)
RM’million
31.12.2018
RM’million
31.12.2017(Restated)
RM’million
Industrial 999.7 1,146.9 985.2 1,101.9
Commercial 1,595.5 1,818.9 1,527.9 1,724.8
Domestic 1,366.4 1,448.9 1,276.6 1,349.3
Specific agriculture 10.7 13.0 10.7 13.0
Mining 2.6 8.0 2.6 8.0
Public lighting 36.6 63.0 28.7 51.9
Others 1,267.2 1,198.3 0 0
Trade receivables 5,278.7 5,697.0 3,831.7 4,248.9
Contract asset 3,445.5 3,115.7 3,283.4 2,981.8

About TNB
Our Business
Business Context
Performance Review
Sustainability Statement
The Strength of Our Governance
Financial Statements
Additional InformationIntegrated Annual Report 2018
Tenaga Nasional Berhad
p.271 Notes to the Financial Statements
45 FINANCIAL INSTRUMENTS (CONTINUED)
(b) Financial risk management (continued)
Credit risk (continued)
(i) Trade receivables and contract assets (continued)
Impairment losses
The loss allowance for the trade receivables and the contract assets as at 31 December 2018 and 1 January 2018 (on adoption of MFRS 9) was as follows:
31.12.2018 GrossRM’million
IndividualimpairmentRM’million
Expected loss rate
%
CollectiveimpairmentRM’million
NetRM’million
Group
Not past due 1,659.3 (35.9) 1.3 (20.4) 1,603.0
Past due 0 - 30 days 522.3 (0.9) 2.7 (14.0) 507.4
Past due 31 - 120 days 914.3 (86.2) 8.2 (67.9) 760.2
Past due 121 - 240 days 487.0 (64.3) 31.4 (132.6) 290.1
Past due 241 - 365 days 347.1 (54.4) 62.9 (184.0) 108.7
Past due more than 365 days 1,348.7 (292.6) 65.0 (686.9) 369.2
Trade receivables 5,278.7 (534.3) (1,105.8) 3,638.6
Contract assets 3,445.5 (34.5) 1.4 (49.2) 3,361.8
Company
Not past due 1,329.6 (34.8) 1.4 (17.5) 1,277.3
Past due 0 - 30 days 294.4 (0.9) 4.1 (12.0) 281.5
Past due 31 - 120 days 610.8 (86.2) 11.1 (58.3) 466.3
Past due 121 - 240 days 379.3 (61.9) 35.8 (113.8) 203.6
Past due 241 - 365 days 263.7 (51.9) 74.6 (158.0) 53.8
Past due more than 365 days 953.9 (287.0) 88.4 (589.5) 77.4
Trade receivables 3,831.7 (522.7) (949.1) 2,359.9
Contract assets 3,283.4 (34.5) 1.4 (43.9) 3,205.0

About TNB
Our Business
Business Context
Performance Review
Sustainability Statement
The Strength of Our Governance
Financial Statements
Additional Information
p.272 Notes to the Financial Statements
45 FINANCIAL INSTRUMENTS (CONTINUED)
(b) Financial risk management (continued)
Credit risk (continued)
(i) Trade receivables and contract assets (continued)
Impairment losses (continued)
The loss allowance for the trade receivables and the contract assets as at 31 December 2018 and 1 January 2018 (on adoption of MFRS 9) was as follows: (continued)
1.1.2018 (Restated) GrossRM’million
IndividualimpairmentRM’million
Expected loss rate
%
CollectiveimpairmentRM’million
NetRM’million
Group
Not past due 1,889.7 (41.2) 1.1 (20.1) 1,828.4
Past due 0 - 30 days 592.2 (7.3) 2.6 (15.2) 569.7
Past due 31 - 120 days 1,306.4 (85.9) 7.7 (93.6) 1,126.9
Past due 121 - 240 days 461.5 (46.5) 40.6 (168.3) 246.7
Past due more than 240 days 1,447.2 (405.2) 74.9 (780.2) 261.8
Trade receivables 5,697.0 (586.1) (1,077.4) 4,033.5
Contract assets 3,115.7 (39.7) 1.1 (36.4) 3,039.6
Company
Not past due 1,473.4 (40.4) 1.2 (17.3) 1,415.7
Past due 0 - 30 days 372.7 (6.4) 3.5 (13.0) 353.3
Past due 31 - 120 days 827.2 (83.2) 10.8 (80.2) 663.8
Past due 121 - 240 days 408.0 (43.6) 39.6 (144.3) 220.1
Past due more than 240 days 1,167.6 (397.4) 86.8 (668.8) 101.4
Trade receivables 4,248.9 (571.0) (923.6) 2,754.3
Contract assets 2,981.8 (39.7) 1.2 (36.1) 2,906.0
The Group and Company apply MFRS 9 simplified approach to measure expected credit losses which uses a lifetime expected loss allowance for all trade receivables and contract assets.
For certain large customers with high risk of default, the Group and Company assessed the risk of loss of each customer individually based on their financial information, past trend of payments and external credit ratings, where applicable.

About TNB
Our Business
Business Context
Performance Review
Sustainability Statement
The Strength of Our Governance
Financial Statements
Additional InformationIntegrated Annual Report 2018
Tenaga Nasional Berhad
p.273 Notes to the Financial Statements
45 FINANCIAL INSTRUMENTS (CONTINUED)
(b) Financial risk management (continued)
Credit risk (continued)
(i) Trade receivables and contract assets (continued)
Impairment losses (continued)
To measure the expected credit losses, trade receivables and contract assets have been grouped based on shared credit risk characteristics and the days past due. The contract assets relate to unbilled customers are substantially have the same risk characteristics as the trade receivables for the same types of contracts. The Group and Company have therefore concluded that the expected loss rates for trade receivables are a reasonable approximation the loss rates of the contract assets.
The expected loss rates are based on the payment profiles of sales over a period of 2 to 6 years and the corresponding historical credit losses experienced within this period. The historical loss rates are adjusted to reflect current and forward-looking information on macroeconomic factors affecting the ability of the customers to settle the receivables. The Group and Company have identified growth rates of real Gross Domestic Product (‘GDP’) of Malaysia to be the most relevant factor, and accordingly, adjusts the historical loss rates based on the expected changes in this factor. As at 31 December 2018, for non-government customers, a combination of growth rates of real GDP and inflation rates were identified as the most relevant factors.
On that basis, the loss allowance was determined as follows for both trade receivables and contract assets are reflected in the tables above.
The closing loss allowances for trade receivables and contract assets as at 31 December 2018 reconcile to the opening loss allowances on 1 January 2018 and to the closing loss allowances as at 31 December 2018 as follows:
Trade receivables
Group Company
31.12.2018
RM’million
31.12.2017(Restated)
RM’million
31.12.2018
RM’million
31.12.2017(Restated)
RM’million
As at the beginning of the financial year/period (1,495.0) (1,388.5) (1,385.9) (1,290.7)
Amount restated through opening retained profits (168.5) 0 (108.7) 0
Opening loss allowances (1,663.5) (1,388.5) (1,494.6) (1,290.7)
Impairment loss recognised (402.9) (106.5) (392.6) (95.2)
Impairment loss reversed 212.8 0 176.0 0
Provision written-off 213.5 0 239.4 0
As at the end of the financial year/period (Note 30) (1,640.1) (1,495.0) (1,471.8) (1,385.9)

About TNB
Our Business
Business Context
Performance Review
Sustainability Statement
The Strength of Our Governance
Financial Statements
Additional Information
p.274 Notes to the Financial Statements
45 FINANCIAL INSTRUMENTS (CONTINUED)
(b) Financial risk management (continued)
Credit risk (continued)
(i) Trade receivables and contract assets (continued)
Impairment losses (continued)
The closing loss allowances for trade receivables and contract assets as at 31 December 2018 reconcile to the opening loss allowances on 1 January 2018 and to the closing loss allowances as at 31 December 2018 as follows: (continued)
Contract assets
Group Company
31.12.2018
RM’million
31.12.2017(Restated)
RM’million
31.12.2018
RM’million
31.12.2017(Restated)
RM’million
As at the beginning of the financial year/period (56.4) (14.2) (56.1) (14.2)
Amount restated through opening retained profits (19.7) 0 (19.7) 0
Opening loss allowances (76.1) (14.2) (75.8) (14.2)
Impairment loss recognised (83.7) (56.4) (78.4) (56.1)
Impairment loss reversed 76.1 14.2 75.8 14.2
As at the end of the financial year/period (Note 26(b)) (83.7) (56.4) (78.4) (56.1)
Trade receivables are secured by deposits in the form of cash and bank guarantees. ECL is not provided on receivable balances fully secured by deposits. The deposits amount are reviewed on an individual basis periodically.
Of the above impairment losses, RM83.7 million (FPE 31.12.2017: RM56.4 million) for the Group and RM78.4 million (FPE 31.12.2017: RM56.1 million) for the Company are related to receivables arising from contracts with customers.
Individual receivables which were known to be uncollectible were written off by reducing the carrying amount directly.
Impairment losses on trade receivables and contract assets are presented as net impairment losses within operating profit. Subsequent recoveries of amounts previously written off are credited against the same line item.

About TNB
Our Business
Business Context
Performance Review
Sustainability Statement
The Strength of Our Governance
Financial Statements
Additional InformationIntegrated Annual Report 2018
Tenaga Nasional Berhad
p.275 Notes to the Financial Statements
45 FINANCIAL INSTRUMENTS (CONTINUED)
(b) Financial risk management (continued)
Credit risk (continued)
(ii) Investments in unquoted debt securities, deposits, bank and cash balances, derivative financial instruments and financial assets measured at FVTPL
Risk management objectives, policies and processes for managing the risk
Investments, deposits, bank and cash balances, derivative financial instruments and financial assets measured at FVTPL are allowed only in liquid securities and only with reputable financial institutions.
Investment in unquoted debt security is an investment in an associate’s financial instruments. The credit risk of this associate is monitored on a quarterly basis.
For investment in unquoted debt security, there has been no history of default and there are no indicators that this financial instrument may default. The Group is of the view that the loss allowance is not material, and hence, it is not provided for.
Exposure to credit risk, credit quality and collateral
The maximum exposure to credit risk is represented by the carrying amounts in the statement of financial position.
In view of the sound credit rating of counterparties, the Group and Company do not expect any counterparty to fail to meet its obligations. The Group and Company do not have overdue investments that have not been impaired.
The investments, deposits, cash and bank balances and derivative financial instruments are unsecured.
Bank and cash balances are held with banks and financial institutions which have lower credit risks. In addition, some of the bank balances are insured by Government agencies. Consequently, the Group and Company are of the view that the loss allowance is not material and hence, it is not provided for.
Impairment losses
The impairment for investment in unquoted debt security during the financial year and previous financial period was insignificant.
(iii) Non-trade receivables
• Intercompany loans/advances
Risk management objectives, policies and processes for managing the risk
The Company provides unsecured loans and advances to subsidiaries. The Company monitors the results of the subsidiaries regularly.
Exposure to credit risk, credit quality and collateral
As at the end of the financial year, the maximum exposure to credit risk is represented by their carrying amounts in the statement of financial position.
Loans and advances are only provided to subsidiaries by the Company.

About TNB
Our Business
Business Context
Performance Review
Sustainability Statement
The Strength of Our Governance
Financial Statements
Additional Information
p.276 Notes to the Financial Statements
45 FINANCIAL INSTRUMENTS (CONTINUED)
(b) Financial risk management (continued)
Credit risk (continued)
(iii) Non-trade receivables (continued)
• Intercompany loans/advances (continued)
Exposure to credit risk, credit quality and collateral (continued)
The total amounts due from subsidiaries and impairment provided are as follows:
Company
31.12.2018
RM’million
31.12.2017(Restated)
RM’million
Amounts due from subsidiaries 7,169.3 7,458.0
Less: Impairment losses (2,414.4) (2,057.7)
4,754.9 5,400.3
Impairment losses
Generally, the Company considers loans and advances to subsidiaries have low credit risk. The Company assumes that there is a significant increase in credit risk when a subsidiary’s financial position deteriorates significantly based on stages determined in the accounting policy part (d) of this note. As the Company is able to determine the timing of payments of the subsidiaries’ loans and advances when they are payable, the Company considers the loans and advances to be in default when the subsidiaries are not able to pay when demanded. The Company considers a subsidiary’s loan or advances to be impaired when:- The subsidiary is unlikely to repay its loans and advances to the Company in full; - The subsidiary is having a negative operating cash flows and is in a net tangible liabilities position; or- The subsidiary is a dormant entity or has a history of default.
As at the end of the financial year, there was no indication that the loans and advances to the subsidiaries are not recoverable other than those which have already been impaired. The Company does not specifically monitor the ageing of advances to the subsidiaries.
The closing loss allowances for intercompany balances as at 31 December 2017 reconcile to the opening loss allowances on 1 January 2018 and to the closing loss allowances as at 31 December 2018 as follows:
Company
31.12.2018
RM’million
31.12.2017(Restated)
RM’million
As at the beginning of the financial year/period (2,057.7) (2,058.9)
Amount restated through opening retained profits (458.8) 0
Opening loss allowances (2,516.5) (2,058.9)
Impairment loss recognised (86.9) (13.3)
Impairment loss reversed 79.4 14.5
Impairment written off 109.6 0
As at the end of the financial year/period (Note 22) (2,414.4) (2,057.7)

About TNB
Our Business
Business Context
Performance Review
Sustainability Statement
The Strength of Our Governance
Financial Statements
Additional InformationIntegrated Annual Report 2018
Tenaga Nasional Berhad
p.277 Notes to the Financial Statements
45 FINANCIAL INSTRUMENTS (CONTINUED)
(b) Financial risk management (continued)
Credit risk (continued)
(iii) Non-trade receivables (continued)
• Intercompany loans/advances (continued)
Impairment losses (continued)
The loss allowances for intercompany loans/advances using the general 3-stage approach as at 31 December 2018 reconcile to the opening loss allowances for that provision as follows:
Stage 1RM’million
Stage 2RM’million
Stage 3RM’million
TotalRM’million
At 31.12.2017 before restatement (calculated under MFRS 139) (104.3) (21.8) (1,931.6) (2,057.7)
Amounts restated through opening retained profits (264.0) (57.9) (136.9) (458.8)
Opening loss allowances as at 1.1.2018 (calculated under MFRS 9) (368.3) (79.7) (2,068.5) (2,516.5)
Current year movements 21.3 (16.3) 97.1 102.1
Closing loss allowances as at 31.12.2018 (347.0) (96.0) (1,971.4) (2,414.4)
The impact on the carrying value of the intercompany loans/advances presented by the stages are as follows:
Stage 1RM’million
Stage 2RM’million
Stage 3RM’million
TotalRM’million
Gross carrying amount 4,772.3 425.6 1,971.4 7,169.3
Loss allowances (347.0) (96.0) (1,971.4) (2,414.4)
Net carrying amount 4,425.3 329.6 0 4,754.9
• Other non-trade receivables
Risk management objectives, policies and processes for managing the risk
Credit risks on other non-trade receivables are mainly arising from rechargeable job orders (‘RJO’) debtors which are receivables from specific works requested by customers.
Credit risks also arises from sundry deposits for rental of office spaces from third parties and rental receivables. The Company manages the credit risk together with the specific leasing arrangements.
Staff advances and staff loans have low credit risks as these are mostly provided to existing staff. These are managed on a monthly basis.
Amounts due from associates are mostly due to transactions within the Group and have a low credit risks. These balances are managed on a monthly basis.
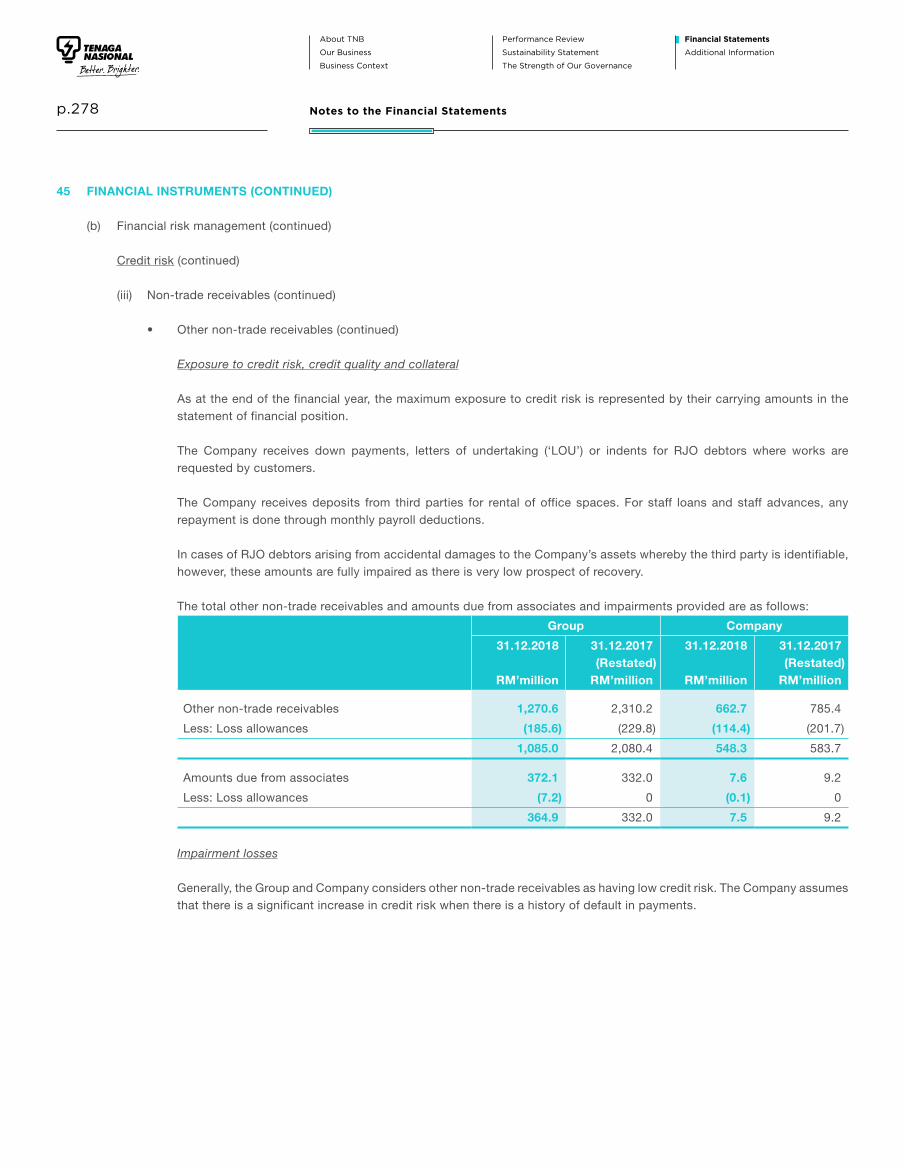
About TNB
Our Business
Business Context
Performance Review
Sustainability Statement
The Strength of Our Governance
Financial Statements
Additional Information
p.278 Notes to the Financial Statements
45 FINANCIAL INSTRUMENTS (CONTINUED)
(b) Financial risk management (continued)
Credit risk (continued)
(iii) Non-trade receivables (continued)
• Other non-trade receivables (continued)
Exposure to credit risk, credit quality and collateral
As at the end of the financial year, the maximum exposure to credit risk is represented by their carrying amounts in the statement of financial position.
The Company receives down payments, letters of undertaking (‘LOU’) or indents for RJO debtors where works are requested by customers.
The Company receives deposits from third parties for rental of office spaces. For staff loans and staff advances, any repayment is done through monthly payroll deductions.
In cases of RJO debtors arising from accidental damages to the Company’s assets whereby the third party is identifiable, however, these amounts are fully impaired as there is very low prospect of recovery.
The total other non-trade receivables and amounts due from associates and impairments provided are as follows:
Group Company
31.12.2018
RM’million
31.12.2017(Restated)
RM’million
31.12.2018
RM’million
31.12.2017(Restated)
RM’million
Other non-trade receivables 1,270.6 2,310.2 662.7 785.4
Less: Loss allowances (185.6) (229.8) (114.4) (201.7)
1,085.0 2,080.4 548.3 583.7
Amounts due from associates 372.1 332.0 7.6 9.2
Less: Loss allowances (7.2) 0 (0.1) 0
364.9 332.0 7.5 9.2
Impairment losses
Generally, the Group and Company considers other non-trade receivables as having low credit risk. The Company assumes that there is a significant increase in credit risk when there is a history of default in payments.
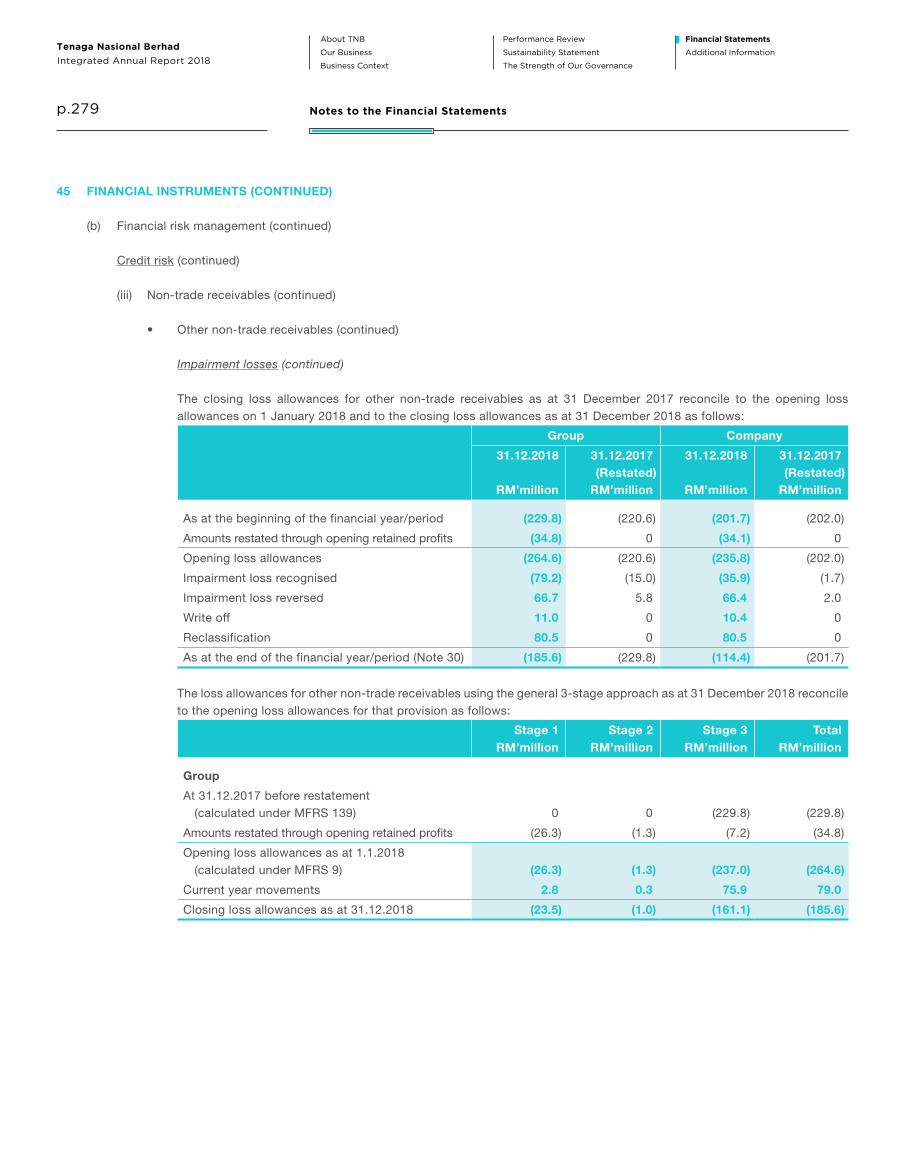
About TNB
Our Business
Business Context
Performance Review
Sustainability Statement
The Strength of Our Governance
Financial Statements
Additional InformationIntegrated Annual Report 2018
Tenaga Nasional Berhad
p.279 Notes to the Financial Statements
45 FINANCIAL INSTRUMENTS (CONTINUED)
(b) Financial risk management (continued)
Credit risk (continued)
(iii) Non-trade receivables (continued)
• Other non-trade receivables (continued)
Impairment losses (continued)
The closing loss allowances for other non-trade receivables as at 31 December 2017 reconcile to the opening loss allowances on 1 January 2018 and to the closing loss allowances as at 31 December 2018 as follows:
Group Company
31.12.2018
RM’million
31.12.2017(Restated)
RM’million
31.12.2018
RM’million
31.12.2017(Restated)
RM’million
As at the beginning of the financial year/period (229.8) (220.6) (201.7) (202.0)
Amounts restated through opening retained profits (34.8) 0 (34.1) 0
Opening loss allowances (264.6) (220.6) (235.8) (202.0)
Impairment loss recognised (79.2) (15.0) (35.9) (1.7)
Impairment loss reversed 66.7 5.8 66.4 2.0
Write off 11.0 0 10.4 0
Reclassification 80.5 0 80.5 0
As at the end of the financial year/period (Note 30) (185.6) (229.8) (114.4) (201.7)
The loss allowances for other non-trade receivables using the general 3-stage approach as at 31 December 2018 reconcile to the opening loss allowances for that provision as follows:
Stage 1RM’million
Stage 2RM’million
Stage 3RM’million
TotalRM’million
Group
At 31.12.2017 before restatement (calculated under MFRS 139) 0 0 (229.8) (229.8)
Amounts restated through opening retained profits (26.3) (1.3) (7.2) (34.8)
Opening loss allowances as at 1.1.2018 (calculated under MFRS 9) (26.3) (1.3) (237.0) (264.6)
Current year movements 2.8 0.3 75.9 79.0
Closing loss allowances as at 31.12.2018 (23.5) (1.0) (161.1) (185.6)

About TNB
Our Business
Business Context
Performance Review
Sustainability Statement
The Strength of Our Governance
Financial Statements
Additional Information
p.280 Notes to the Financial Statements
45 FINANCIAL INSTRUMENTS (CONTINUED)
(b) Financial risk management (continued)
Credit risk (continued)
(iii) Non-trade receivables (continued)
• Other non-trade receivables (continued)
Impairment losses (continued)
The loss allowances for other non-trade receivables using the general 3-stage approach as at 31 December 2018 reconcile to the opening loss allowances for that provision as follows: (continued)
Stage 1RM’million
Stage 2RM’million
Stage 3RM’million
TotalRM’million
Company
At 31.12.2017 before restatement (calculated under MFRS 139) 0 0 (201.7) (201.7)
Amounts restated through opening retained profits (25.8) (1.3) (7.0) (34.1)
Opening loss allowances as at 1.1.2018 (calculated under MFRS 9) (25.8) (1.3) (208.7) (235.8)
Current year movements 4.3 0.5 116.6 121.4
Closing loss allowances as at 31.12.2018 (21.5) (0.8) (92.1) (114.4)
The impact on the carrying value of other non-trade receivables presented by the stages are as follows:
Stage 1RM’million
Stage 2RM’million
Stage 3RM’million
TotalRM’million
Group
Gross carrying amount 996.2 70.5 203.9 1,270.6
Loss allowances (23.5) (1.0) (161.1) (185.6)
Net carrying amount 972.7 69.5 42.8 1,085.0
Company
Gross carrying amount 534.7 29.9 98.1 662.7
Loss allowances (21.5) (0.8) (92.1) (114.4)
Net carrying amount 513.2 29.1 6.0 548.3
(iv) Financial guarantees
Risk management objectives, policies and processes for managing the risk
The Company provides financial guarantees to banks in respect of banking facilities granted to certain subsidiaries and an associate. The Company monitors the ability of the subsidiaries and the associate to service their loans on an individual basis.
Exposure to credit risk, credit quality and collateral
The maximum exposure to the Company amounts to RM3,330.0 million (FPE 31.12.2017: RM1,968.5 million) representing banking facilities utilised by the subsidiaries and an associate as at the end of the financial year/period.
The financial guarantees are provided as credit enhancements to the subsidiaries’ and associate’s secured loans.
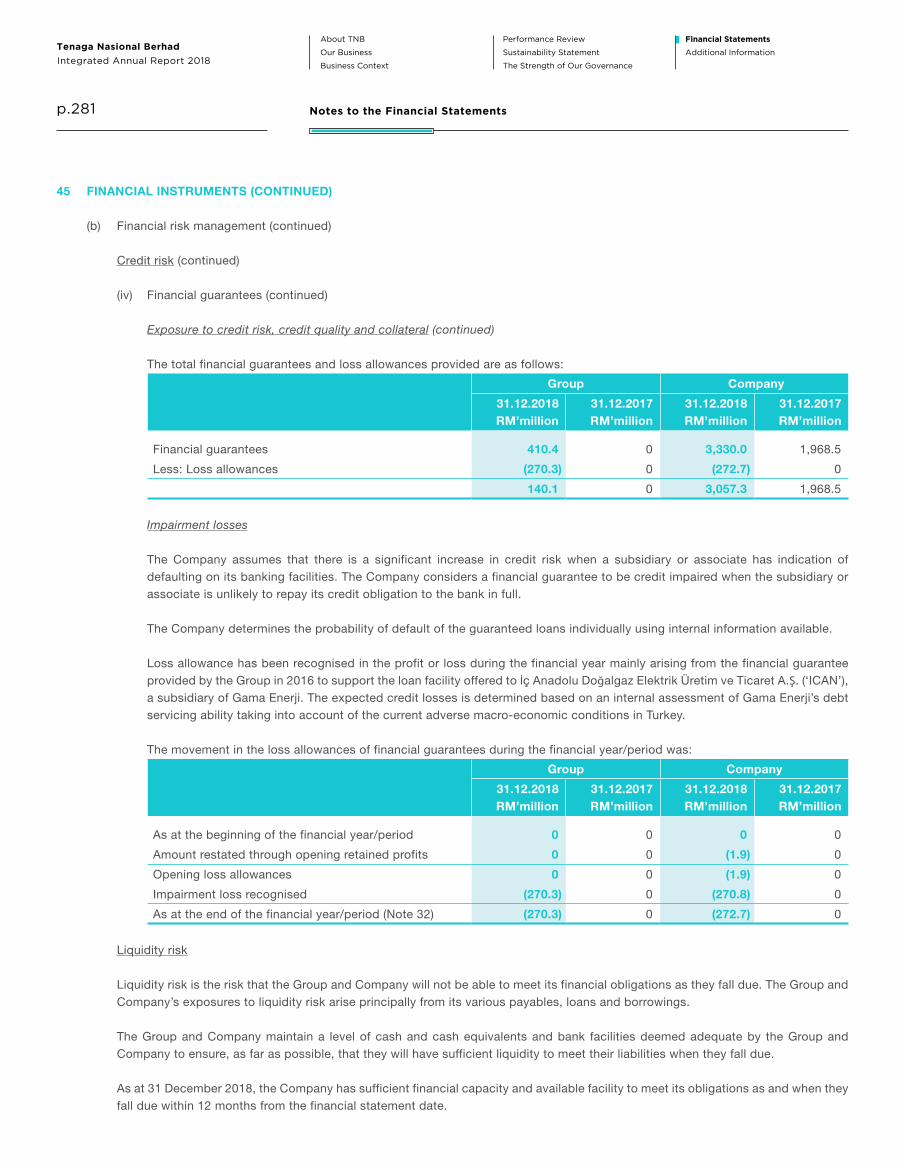
About TNB
Our Business
Business Context
Performance Review
Sustainability Statement
The Strength of Our Governance
Financial Statements
Additional InformationIntegrated Annual Report 2018
Tenaga Nasional Berhad
p.281 Notes to the Financial Statements
45 FINANCIAL INSTRUMENTS (CONTINUED)
(b) Financial risk management (continued)
Credit risk (continued)
(iv) Financial guarantees (continued)
Exposure to credit risk, credit quality and collateral (continued)
The total financial guarantees and loss allowances provided are as follows:
Group Company
31.12.2018RM’million
31.12.2017RM’million
31.12.2018RM’million
31.12.2017RM’million
Financial guarantees 410.4 0 3,330.0 1,968.5
Less: Loss allowances (270.3) 0 (272.7) 0
140.1 0 3,057.3 1,968.5
Impairment losses
The Company assumes that there is a significant increase in credit risk when a subsidiary or associate has indication of defaulting on its banking facilities. The Company considers a financial guarantee to be credit impaired when the subsidiary or associate is unlikely to repay its credit obligation to the bank in full.
The Company determines the probability of default of the guaranteed loans individually using internal information available.
Loss allowance has been recognised in the profit or loss during the financial year mainly arising from the financial guarantee provided by the Group in 2016 to support the loan facility offered to İç Anadolu Doğalgaz Elektrik Üretim ve Ticaret A.Ş. (‘ICAN’), a subsidiary of Gama Enerji. The expected credit losses is determined based on an internal assessment of Gama Enerji’s debt servicing ability taking into account of the current adverse macro-economic conditions in Turkey.
The movement in the loss allowances of financial guarantees during the financial year/period was:
Group Company
31.12.2018RM’million
31.12.2017RM’million
31.12.2018RM’million
31.12.2017RM’million
As at the beginning of the financial year/period 0 0 0 0
Amount restated through opening retained profits 0 0 (1.9) 0
Opening loss allowances 0 0 (1.9) 0
Impairment loss recognised (270.3) 0 (270.8) 0
As at the end of the financial year/period (Note 32) (270.3) 0 (272.7) 0
Liquidity risk
Liquidity risk is the risk that the Group and Company will not be able to meet its financial obligations as they fall due. The Group and Company’s exposures to liquidity risk arise principally from its various payables, loans and borrowings.
The Group and Company maintain a level of cash and cash equivalents and bank facilities deemed adequate by the Group and Company to ensure, as far as possible, that they will have sufficient liquidity to meet their liabilities when they fall due.
As at 31 December 2018, the Company has sufficient financial capacity and available facility to meet its obligations as and when they fall due within 12 months from the financial statement date.

About TNB
Our Business
Business Context
Performance Review
Sustainability Statement
The Strength of Our Governance
Financial Statements
Additional Information
p.282 Notes to the Financial Statements
45 FINANCIAL INSTRUMENTS (CONTINUED)
(b) Financial risk management (continued)
Liquidity risk (continued)
The table below summarises the maturity profiles of the Group and Company’s financial liabilities as at the end of the financial year/period based on the undiscounted contractual payments:
31.12.2018
Carrying amountRM’million
Contractualcash flowsRM’million
Below1 year
RM’million 1 - 2 yearsRM’million
3 - 5 yearsRM’million
More than5 years
RM’million
Group
Non-derivative financial liabilities
Payables 9,166.2 9,166.2 9,166.2 0 0 0
Finance lease payables 4,874.1 7,507.6 698.8 698.4 2,078.7 4,031.7
Amounts due to associates 656.3 656.3 656.3 0 0 0
Borrowings 47,832.4 71,377.3 5,671.6 4,679.4 12,134.7 48,891.6
Financial guarantee contracts 270.3 410.4 410.4 0 0 0
Other financial liabilities at amortised cost 602.0 618.6 304.2 306.6 2.6 5.2
63,401.3 89,736.4 16,907.5 5,684.4 14,216.0 52,928.5
Derivative financial liabilities
Interest rate swap 11.5 622.4 622.4 0 0 0
Forward exchange contracts (gross settled):
- Outflows 44.0 907.0 907.0 0 0 0
- Inflows (1.2) (42.7) (42.7) 0 0 0
Put option (0.2) (14.2) (14.2) 0 0 0
63,455.4 91,208.9 18,380.0 5,684.4 14,216.0 52,928.5
Company
Non-derivative financial liabilities
Payables 5,635.9 5,635.9 5,635.9 0 0 0
Finance lease payables 16,668.8 26,494.6 2,142.1 1,932.5 5,270.8 17,149.2
Amounts due to subsidiaries 1,459.4 1,459.4 1,459.4 0 0 0
Amounts due to associates 646.4 646.4 646.4 0 0 0
Borrowings 21,637.0 30,486.8 3,028.9 1,707.9 4,651.1 21,098.9
Financial guarantee contracts 272.7 3,330.0 3,330.0 0 0 0
Other financial liabilities at amortised cost 536.9 553.5 272.2 274.3 2.3 4.6
46,857.1 68,606.6 16,514.9 3,914.7 9,924.2 38,252.7

About TNB
Our Business
Business Context
Performance Review
Sustainability Statement
The Strength of Our Governance
Financial Statements
Additional InformationIntegrated Annual Report 2018
Tenaga Nasional Berhad
p.283 Notes to the Financial Statements
45 FINANCIAL INSTRUMENTS (CONTINUED)
(b) Financial risk management (continued)
Liquidity risk (continued)
The table below summarises the maturity profiles of the Group and Company’s financial liabilities as at the end of the financial year/period based on the undiscounted contractual payments: (continued)
31.12.2017
Carrying amountRM’million
Contractualcash flowsRM’million
Below1 year
RM’million 1 - 2 yearsRM’million
3 - 5 yearsRM’million
More than5 years
RM’million
Group
Non-derivative financial liabilities
Payables 8,668.3 8,668.3 8,668.3 0 0 0
Finance lease payables 5,210.5 8,205.5 697.9 701.3 2,093.1 4,713.2
Amounts due to associates 691.2 691.2 691.2 0 0 0
Borrowings 41,443.7 48,136.6 2,753.5 6,075.5 9,481.0 29,826.6
Other liabilities 517.2 531.0 263.8 264.3 0.7 2.2
56,530.9 66,232.6 13,074.7 7,041.1 11,574.8 34,542.0
Derivative financial liabilities
Forward exchange contracts (gross settled):
- Outflows 47.3 975.1 975.1 0 0 0
56,578.2 67,207.7 14,049.8 7,041.1 11,574.8 34,542.0
Company
Non-derivative financial liabilities
Payables 5,491.1 5,491.1 5,491.1 0 0 0
Finance lease payables 17,790.9 28,742.0 2,247.5 2,142.1 5,703.5 18,648.9
Amounts due to subsidiaries 1,086.3 1,086.3 1,086.3 0 0 0
Amounts due to associates 683.0 683.0 683.0 0 0 0
Borrowings 15,348.1 21,854.0 765.7 2,661.5 5,243.5 13,183.3
Other liabilities 473.5 487.3 242.1 242.6 0.6 2.0
40,872.9 58,343.7 10,515.7 5,046.2 10,947.6 31,834.2
Derivative financial liabilities
Forward exchange contracts (gross settled):
- Outflows 0.2 19.8 19.8 0 0 0
40,873.1 58,363.5 10,535.5 5,046.2 10,947.6 31,834.2

About TNB
Our Business
Business Context
Performance Review
Sustainability Statement
The Strength of Our Governance
Financial Statements
Additional Information
p.284 Notes to the Financial Statements
45 FINANCIAL INSTRUMENTS (CONTINUED)
(b) Financial risk management (continued)
Market risk
Market risk is the risk that changes in market prices, such as foreign exchange rates, interest rates and other prices will affect the Group and Company’s financial positions or cash flows.
(i) Foreign currency risk
The Group and Company are exposed to foreign currency risk on sales, purchases and borrowings that are denominated in currencies other than the respective functional currencies of the Group and Company. The currencies giving rise to this risk are primarily USD, JPY, GBP, PKR and EUR.
Risk management objectives, policies and processes for managing the risk
The Group and Company are required to hedge a minimum of 50.0% of TNB’s known foreign currency exposure up to 12 months period. The Group and Company use forward exchange contracts and maintains foreign currencies float to hedge its foreign currency risk.
Exposure to foreign currency risk
The currency exposure of financial assets and financial liabilities of the Group and Company that are not denominated in the functional currency of the respective companies is set out below:
31.12.2018USD
RM’millionJPY
RM’millionGBP
RM’millionEUR
RM’millionOthers
RM’million
Group
Financial assets
Financial assets at FVOCI 0 0 0 0 0.4
Deposits, bank and cash balances 4,061.0 1.2 134.9 0.5 0.8
4,061.0 1.2 134.9 0.5 1.2
Financial liabilities
Payables 25.1 2.5 0 2.7 0.5
Borrowings 9,210.1 2,526.2 609.1 0 66.1
9,235.2 2,528.7 609.1 2.7 66.6
Company
Financial assets
Amounts due from subsidiaries 303.9 0 0 0 0
Deposits, bank and cash balances 4,027.8 0 134.9 0 0
4,331.7 0 134.9 0 0
Financial liability
Borrowings 9,210.1 2,526.2 0 0 0
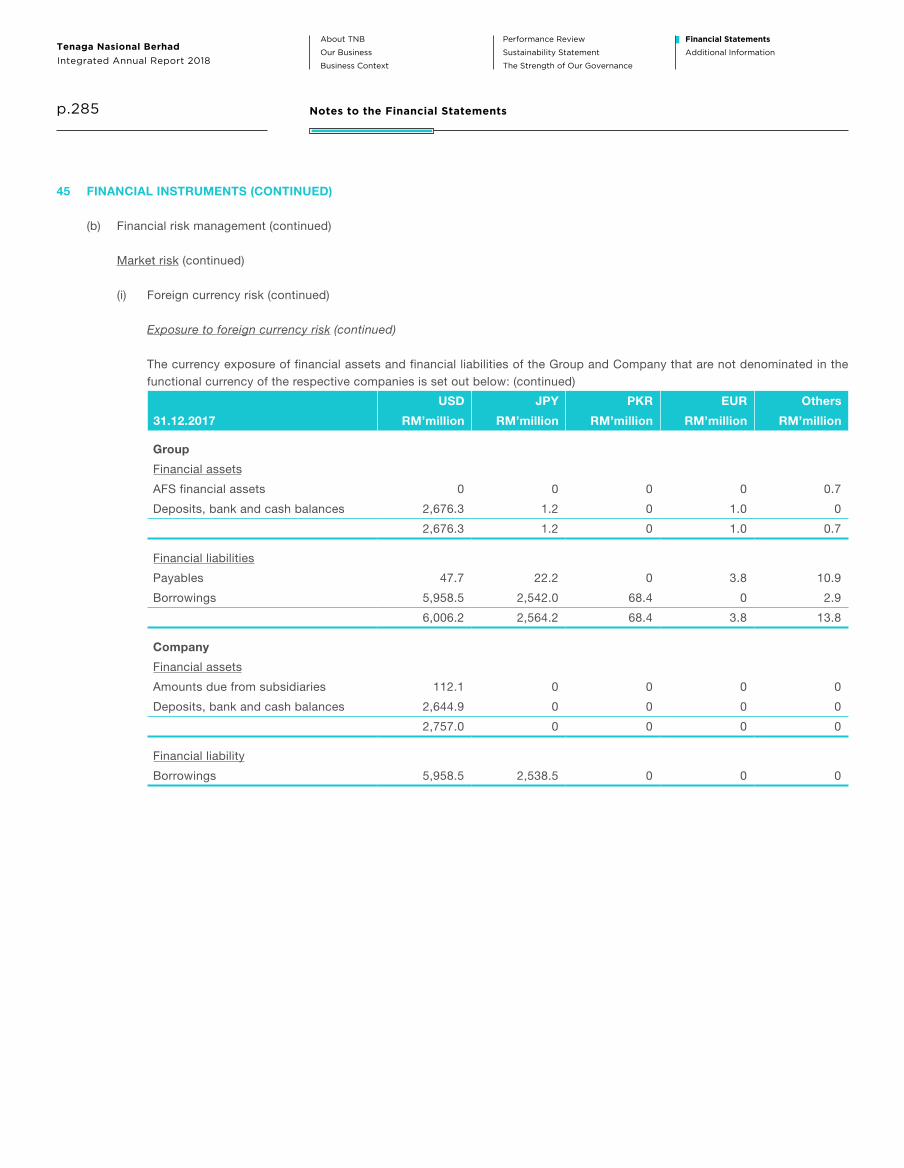
About TNB
Our Business
Business Context
Performance Review
Sustainability Statement
The Strength of Our Governance
Financial Statements
Additional InformationIntegrated Annual Report 2018
Tenaga Nasional Berhad
p.285 Notes to the Financial Statements
45 FINANCIAL INSTRUMENTS (CONTINUED)
(b) Financial risk management (continued)
Market risk (continued)
(i) Foreign currency risk (continued)
Exposure to foreign currency risk (continued)
The currency exposure of financial assets and financial liabilities of the Group and Company that are not denominated in the functional currency of the respective companies is set out below: (continued)
USD JPY PKR EUR Others
31.12.2017 RM’million RM’million RM’million RM’million RM’million
Group
Financial assets
AFS financial assets 0 0 0 0 0.7
Deposits, bank and cash balances 2,676.3 1.2 0 1.0 0
2,676.3 1.2 0 1.0 0.7
Financial liabilities
Payables 47.7 22.2 0 3.8 10.9
Borrowings 5,958.5 2,542.0 68.4 0 2.9
6,006.2 2,564.2 68.4 3.8 13.8
Company
Financial assets
Amounts due from subsidiaries 112.1 0 0 0 0
Deposits, bank and cash balances 2,644.9 0 0 0 0
2,757.0 0 0 0 0
Financial liability
Borrowings 5,958.5 2,538.5 0 0 0

About TNB
Our Business
Business Context
Performance Review
Sustainability Statement
The Strength of Our Governance
Financial Statements
Additional Information
p.286 Notes to the Financial Statements
45 FINANCIAL INSTRUMENTS (CONTINUED)
(b) Financial risk management (continued)
Market risk (continued)
(i) Foreign currency risk (continued)
Currency risk sensitivity analysis
A 10.0% strengthening of the foreign currencies against RM at the end of the financial year/period would have decreased post-tax profit or loss by the amounts shown below. This analysis assumes that all other variables, in particular interest rates, remained constant and ignores any impact of forecasted sales and purchases.
Profit or loss/equity
Financialyear ended31.12.2018RM’million
Financialperiod ended
31.12.2017RM’million
Group
USD (566.9) (275.1)
JPY (354.9) (55.3)
Company
USD (534.4) (275.1)
JPY (354.7) (55.4)
A 10.0% weakening of the foreign currencies against RM at the end of the financial year/period would have had equal but opposite effect on the above currencies to the amounts shown above, on the basis that all other variables remained constant.
Foreign currency risk for the Group and Company which have a functional currency other than USD and JPY are not material and hence, sensitivity analysis is not presented.
(ii) Interest rate risk
The Group and Company’s investments in fixed rate debt securities and its fixed rate borrowings are not exposed to a significant risk of change in their fair values due to changes in interest rates. The Group and Company’s variable rate borrowings are exposed to a risk of change in cash flows due to changes in interest rates. Investment in equity securities and short term receivables and payables are not significantly exposed to interest rate risk.
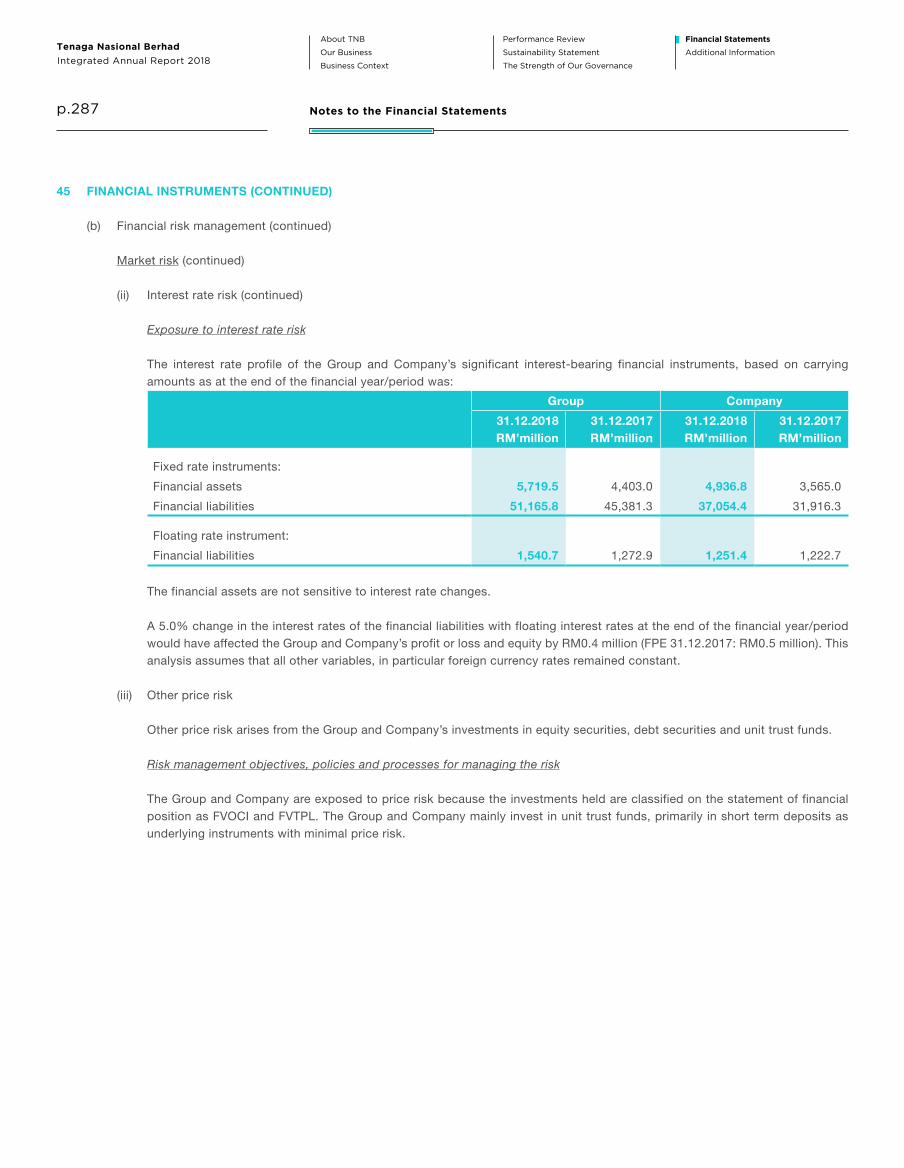
About TNB
Our Business
Business Context
Performance Review
Sustainability Statement
The Strength of Our Governance
Financial Statements
Additional InformationIntegrated Annual Report 2018
Tenaga Nasional Berhad
p.287 Notes to the Financial Statements
45 FINANCIAL INSTRUMENTS (CONTINUED)
(b) Financial risk management (continued)
Market risk (continued)
(ii) Interest rate risk (continued)
Exposure to interest rate risk
The interest rate profile of the Group and Company’s significant interest-bearing financial instruments, based on carrying amounts as at the end of the financial year/period was:
Group Company
31.12.2018RM’million
31.12.2017RM’million
31.12.2018RM’million
31.12.2017RM’million
Fixed rate instruments:
Financial assets 5,719.5 4,403.0 4,936.8 3,565.0
Financial liabilities 51,165.8 45,381.3 37,054.4 31,916.3
Floating rate instrument:
Financial liabilities 1,540.7 1,272.9 1,251.4 1,222.7
The financial assets are not sensitive to interest rate changes.
A 5.0% change in the interest rates of the financial liabilities with floating interest rates at the end of the financial year/period would have affected the Group and Company’s profit or loss and equity by RM0.4 million (FPE 31.12.2017: RM0.5 million). This analysis assumes that all other variables, in particular foreign currency rates remained constant.
(iii) Other price risk
Other price risk arises from the Group and Company’s investments in equity securities, debt securities and unit trust funds.
Risk management objectives, policies and processes for managing the risk
The Group and Company are exposed to price risk because the investments held are classified on the statement of financial position as FVOCI and FVTPL. The Group and Company mainly invest in unit trust funds, primarily in short term deposits as underlying instruments with minimal price risk.

About TNB
Our Business
Business Context
Performance Review
Sustainability Statement
The Strength of Our Governance
Financial Statements
Additional Information
p.288 Notes to the Financial Statements
45 FINANCIAL INSTRUMENTS (CONTINUED)
(b) Financial risk management (continued)
Fair value of financial instruments
The carrying amounts of deposits, bank and cash balances, short term receivables and payables, short term borrowings and short term derivative financial instruments approximate their fair values and are equivalent to nominal values due to the relatively short term nature of these financial instruments.
The table below analyses financial instruments carried at fair value and those not carried at fair value for which fair value is disclosed, together with their fair values and carrying amounts shown in the statement of financial position.
The classifications in the fair value hierarchy of the Group and Company’s assets and liabilities measured at fair value are summarised in the table below:
Fair value of financial
instruments carried at fair value
Fair value of financial
instruments not carried at fair value Total fair
value
RM’million
Carrying
amount
RM’million31.12.2018
Level 1
RM’million
Level 2
RM’million
Level 3
RM’million
Total
RM’million
Level 1
RM’million
Level 2
RM’million
Level 3
RM’million
Total
RM’million
Group
Financial assets
Investment in unquoted debt security 0 0 0 0 0 326.7 0 326.7 326.7 326.7
Long term receivables 0 0 0 0 0 139.2 0 139.2 139.2 102.7
Derivative financial instruments 0 0.2 0 0.2 0 0 0 0 0.2 0.2
Financial assets at FVOCI 0 76.4 0 76.4 0 0 0 0 76.4 76.4
Financial assets at FVTPL 9,743.3 0 0 9,743.3 0 0 0 0 9,743.3 9,743.3
9,743.3 76.6 0 9,819.9 0 465.9 0 465.9 10.285.8 10,249.3
Financial liabilities
Borrowings 0 0 0 0 1,972.1 47,298.2 0 49,270.3 49,270.3 47,832.4
Other financial liabilities at amortised cost 0 0 0 0 0 606.1 0 606.1 606.1 602.0
Derivative financial instruments 0 11.5 0 11.5 0 0 0 0 11.5 11.5
0 11.5 0 11.5 1,972.1 47,904.3 0 49,876.4 49,887.9 48,445.9

About TNB
Our Business
Business Context
Performance Review
Sustainability Statement
The Strength of Our Governance
Financial Statements
Additional InformationIntegrated Annual Report 2018
Tenaga Nasional Berhad
p.289 Notes to the Financial Statements
45 FINANCIAL INSTRUMENTS (CONTINUED)
(b) Financial risk management (continued)
Fair value of financial instruments (continued)
The classifications in the fair value hierarchy of the Group and Company’s assets and liabilities measured at fair value are summarised in the table below: (continued)
Fair value of financial
instruments carried at fair value
Fair value of financial
instruments not carried at fair value Total fair
value
RM’million
Carrying
amount
RM’million31.12.2018Level 1
RM’million
Level 2
RM’million
Level 3
RM’million
Total
RM’million
Level 1
RM’million
Level 2
RM’million
Level 3
RM’million
Total
RM’million
Company
Financial assets
Investment in unquoted debt securities 0 0 0 0 0 8.7 0 8.7 8.7 8.7
Long term receivables 0 0 0 0 0 104.7 0 104.7 104.7 86.1
Financial assets at FVOCI 0 75.7 0 75.7 0 0 0 0 75.7 75.7
Amounts due from subsidiaries 0 0 0 0 0 1,142.1 0 1,142.1 1,142.1 1,052.0
Financial assets at FVTPL 5,224.6 0 0 5,224.6 0 0 0 0 5,224.6 5,224.6
5,224.6 75.7 0 5,300.3 0 1,255.5 0 1,255.5 6,555.8 6,447.1
Financial liabilities
Borrowings 0 0 0 0 1,972.1 20,183.0 0 22,155.1 22,155.1 21,637.0
Other liabilities 0 0 0 0 0 541.1 0 541.1 541.1 536.9
0 0 0 0 1,972.1 20,724.1 0 22,696.2 22,696.2 22,173.9

About TNB
Our Business
Business Context
Performance Review
Sustainability Statement
The Strength of Our Governance
Financial Statements
Additional Information
p.290 Notes to the Financial Statements
45 FINANCIAL INSTRUMENTS (CONTINUED)
(b) Financial risk management (continued)
Fair value of financial instruments (continued)
The classifications in the fair value hierarchy of the Group and Company’s assets and liabilities measured at fair value are summarised in the table below: (continued)
Fair value of financial
instruments carried at fair value
Fair value of financial
instruments not carried at fair value Total fair
value
RM’million
Carrying
amount
RM’million31.12.2017Level 1
RM’million
Level 2
RM’million
Level 3
RM’million
Total
RM’million
Level 1
RM’million
Level 2
RM’million
Level 3
RM’million
Total
RM’million
Group
Financial assets
Investment in unquoted debt security 0 0 0 0 0 318.5 0 318.5 318.5 318.5
Long term receivables 0 0 0 0 0 214.3 0 214.3 214.3 249.5
AFS financial assets 0 69.3 0 69.3 0 0 0 0 69.3 69.3
Financial assets at FVTPL 10,490.2 0 0 10,490.2 0 0 0 0 10,490.2 10,490.2
10,490.2 69.3 0 10,559.5 0 532.8 0 532.8 11,092.3 11,127.5
Financial liabilities
Borrowings 0 0 0 0 2,023.1 40,711.2 0 42,734.3 42,734.3 41,443.7
Other liabilities 0 0 0 0 0 520.6 0 520.6 520.6 517.2
Derivative financial instruments 0 47.3 0 47.3 0 0 0 0 47.3 47.3
0 47.3 0 47.3 2,023.1 41,231.8 0 43,254.9 43,302.2 42,008.2

About TNB
Our Business
Business Context
Performance Review
Sustainability Statement
The Strength of Our Governance
Financial Statements
Additional InformationIntegrated Annual Report 2018
Tenaga Nasional Berhad
p.291 Notes to the Financial Statements
45 FINANCIAL INSTRUMENTS (CONTINUED)
(b) Financial risk management (continued)
Fair value of financial instruments (continued)
The classifications in the fair value hierarchy of the Group and Company’s assets and liabilities measured at fair value are summarised in the table below: (continued)
Fair value of financial
instruments carried at fair value
Fair value of financial
instruments not carried at fair value Total fair
value
RM’million
Carrying
amount
RM’million31.12.2017Level 1
RM’million
Level 2
RM’million
Level 3
RM’million
Total
RM’million
Level 1
RM’million
Level 2
RM’million
Level 3
RM’million
Total
RM’million
Company
Financial assets
Long term receivables 0 0 0 0 0 183.9 0 183.9 183.9 197.0
AFS financial assets 0 68.6 0 68.6 0 0 0 0 68.6 68.6
Amounts due from subsidiaries 0 0 0 0 0 584.4 0 584.4 584.4 1,213.4
Financial assets at FVTPL 3,850.5 0 0 3,850.5 0 0 0 0 3,850.5 3,850.5
3,850.5 68.6 0 3,919.1 0 768.3 0 768.3 4,687.4 5,329.5
Financial liabilities
Borrowings 0 0 0 0 2,023.1 14,112.9 0 16,136.0 16,136.0 15,348.1
Other liabilities 0 0 0 0 0 476.7 0 476.7 476.7 473.5
0 0 0 0 2,023.1 14,589.6 0 16,612.7 16,612.7 15,821.6

About TNB
Our Business
Business Context
Performance Review
Sustainability Statement
The Strength of Our Governance
Financial Statements
Additional Information
p.292 Notes to the Financial Statements
45 FINANCIAL INSTRUMENTS (CONTINUED)
(b) Financial risk management (continued)
Fair value of financial instruments (continued)
(i) Policy on transfer between levels
The fair value of an asset to be transferred between levels is determined as of the date of the event or change in circumstances that caused the transfer.
There were no transfer between levels during the financial year.
(ii) Level 1 fair value
Level 1 fair value is derived from quoted prices (unadjusted) in active markets for identical assets or liabilities that the entity can access at the measurement date.
(iii) Level 2 fair value
Level 2 fair value is estimated using inputs other than quoted prices included within Level 1 that are observable for the financial assets or liabilities, either directly or indirectly.
Derivative financial instruments
The fair value is estimated by the difference between the contractual forward price and the current forward price for the residual maturity of the contract.
Non-derivative financial instruments
Fair value, which is determined for disclosure purpose, is calculated based on the present value of future principal and interest cash flows, discounted at the market rate of interest at the end of the reporting period.
(iv) Level 3 fair value
Level 3 fair values for the financial assets and liabilities are estimated using unobservable inputs.
(v) Interest rates used to determine fair value
The interest rates used to discount estimated cash flows, when applicable, ranging between 0.1% to 10.0% (FPE 31.12.2017: 0.1% to 8.9%).
Although the Group and Company believe that their estimates of fair value are appropriate, the use of different methodologies or assumptions could lead to different measurements of fair value.
The favourable and unfavourable effects of using reasonably possible alternative assumptions have been calculated by recalibrating the model values using expected cash flows and risk-adjusted discount rates based on the probability weighted average of the Group and Company’s ranges of possible outcomes.

About TNB
Our Business
Business Context
Performance Review
Sustainability Statement
The Strength of Our Governance
Financial Statements
Additional InformationIntegrated Annual Report 2018
Tenaga Nasional Berhad
p.293 Notes to the Financial Statements
45 FINANCIAL INSTRUMENTS (CONTINUED)
(c) Offsetting of financial assets and financial liabilities
The following financial assets and financial liabilities are subject to offsetting arrangements based on Group policies and procedures:
Group Company
Gross amounts
recognisedRM’million
Gross amountsset-off in the SOFP
RM’million
Net amounts
presented inthe SOFP
RM’million
Gross amounts
recognisedRM’million
Gross amountsset-off inthe SOFP
RM’million
Net amounts
presented inthe SOFP
RM’million
Financial assets31.12.2018Amounts due from associates 364.9 0 364.9 7.5 0 7.5Amounts due from subsidiaries 0 0 0 7,816.0 (3,061.1) 4,754.9
31.12.2017Amounts due from associates 337.4 (5.4) 332.0 14.6 (5.4) 9.2Amounts due from subsidiaries 0 0 0 6,312.7 (912.4) 5,400.3
Financial liabilities31.12.2018Amounts due to associates (656.3) 0 (656.3) (646.4) 0 (646.4)Amounts due to subsidiaries 0 0 0 (2,116.2) 656.8 (1,459.4)
31.12.2017Amounts due to associates (691.2) 0 (691.2) (683.0) 0 (683.0)Amounts due to subsidiaries 0 0 0 (4,130.5) 3,044.2 (1,086.3)
46 CAPITAL RISK MANAGEMENT
The Group and Company’s main objective of capital management is to safeguard the Group and Company’s ability to continue as a going concern in order to provide returns for shareholders and benefits for other stakeholders. The Group and Company will also strive to maintain an optimal capital structure to reduce the cost of capital.
For the purpose of sustaining or changing the capital structure, the Group and Company may adjust the amount of dividends paid to shareholders, issue new shares or return capital to shareholders.
In order to be consistent with industry norms, the Group and Company monitor its capital structure on the basis of the gearing ratio. This ratio is calculated as total borrowings divided by capital employed. Total borrowings include non-current borrowings, current borrowings and hire purchase as shown in the consolidated statement of financial position. Capital employed is the summation of total equity and total borrowings.
The gearing ratios are as follows:
Group Company31.12.2018
RM’million
31.12.2017(Restated)
RM’million
1.9.2017(Restated)
RM’million
31.12.2018
RM’million
31.12.2017(Restated)
RM’million
Total borrowings 47,838.5 41,453.5 38,857.5 21,637.0 15,348.1Total equity 59,051.9 57,989.0 57,579.4 51,730.1 51,742.8Total capital employed 106,890.4 99,442.5 96,436.9 73,367.1 67,090.9
Gearing ratios 0.45 0.42 0.40 0.29 0.23
The Group and Company have met all externally imposed capital requirements.
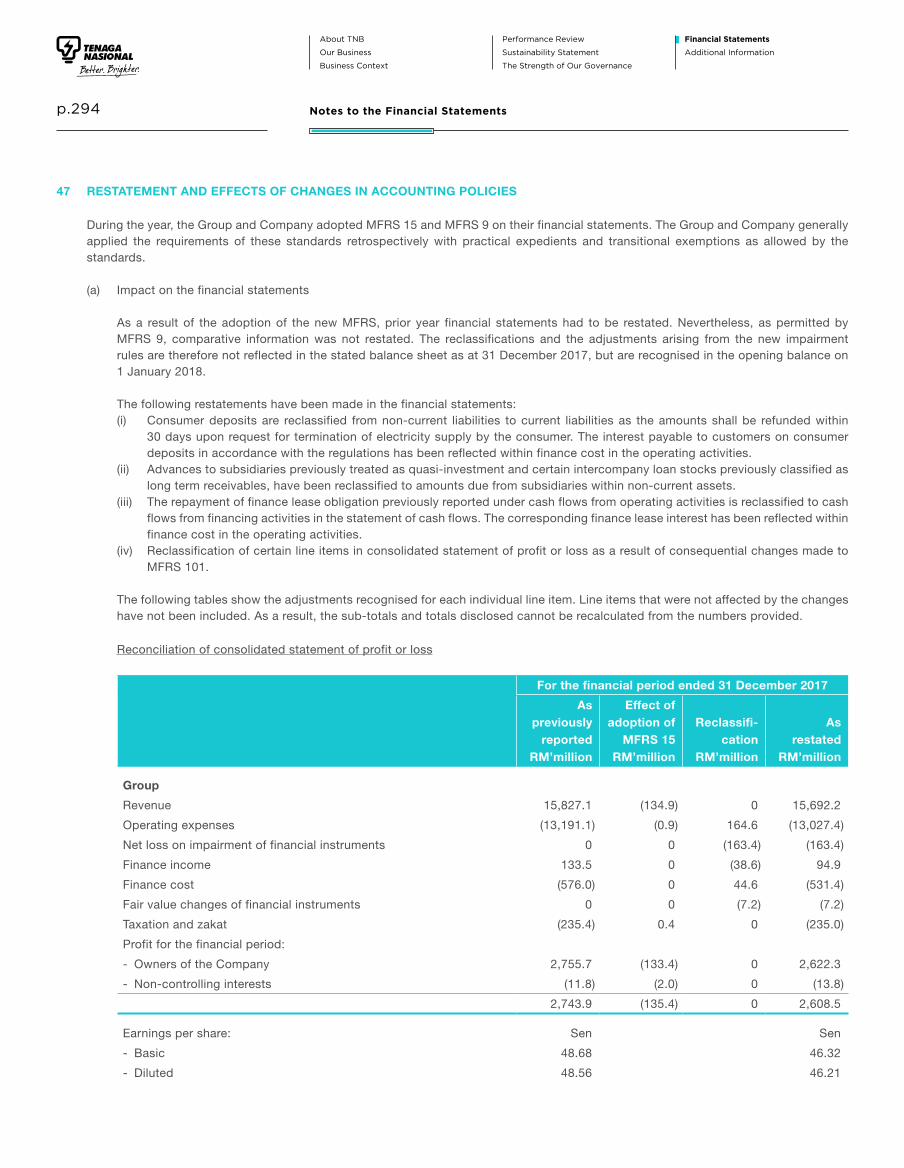
About TNB
Our Business
Business Context
Performance Review
Sustainability Statement
The Strength of Our Governance
Financial Statements
Additional Information
p.294 Notes to the Financial Statements
47 RESTATEMENT AND EFFECTS OF CHANGES IN ACCOUNTING POLICIES
During the year, the Group and Company adopted MFRS 15 and MFRS 9 on their financial statements. The Group and Company generally applied the requirements of these standards retrospectively with practical expedients and transitional exemptions as allowed by the standards.
(a) Impact on the financial statements
As a result of the adoption of the new MFRS, prior year financial statements had to be restated. Nevertheless, as permitted by MFRS 9, comparative information was not restated. The reclassifications and the adjustments arising from the new impairment rules are therefore not reflected in the stated balance sheet as at 31 December 2017, but are recognised in the opening balance on 1 January 2018.
The following restatements have been made in the financial statements:(i) Consumer deposits are reclassified from non-current liabilities to current liabilities as the amounts shall be refunded within
30 days upon request for termination of electricity supply by the consumer. The interest payable to customers on consumer deposits in accordance with the regulations has been reflected within finance cost in the operating activities.
(ii) Advances to subsidiaries previously treated as quasi-investment and certain intercompany loan stocks previously classified as long term receivables, have been reclassified to amounts due from subsidiaries within non-current assets.
(iii) The repayment of finance lease obligation previously reported under cash flows from operating activities is reclassified to cash flows from financing activities in the statement of cash flows. The corresponding finance lease interest has been reflected within finance cost in the operating activities.
(iv) Reclassification of certain line items in consolidated statement of profit or loss as a result of consequential changes made to MFRS 101.
The following tables show the adjustments recognised for each individual line item. Line items that were not affected by the changes have not been included. As a result, the sub-totals and totals disclosed cannot be recalculated from the numbers provided.
Reconciliation of consolidated statement of profit or loss
For the financial period ended 31 December 2017
Aspreviously
reportedRM’million
Effect ofadoption of
MFRS 15RM’million
Reclassifi-cation
RM’million
Asrestated
RM’million
Group
Revenue 15,827.1 (134.9) 0 15,692.2
Operating expenses (13,191.1) (0.9) 164.6 (13,027.4)
Net loss on impairment of financial instruments 0 0 (163.4) (163.4)
Finance income 133.5 0 (38.6) 94.9
Finance cost (576.0) 0 44.6 (531.4)
Fair value changes of financial instruments 0 0 (7.2) (7.2)
Taxation and zakat (235.4) 0.4 0 (235.0)
Profit for the financial period:
- Owners of the Company 2,755.7 (133.4) 0 2,622.3
- Non-controlling interests (11.8) (2.0) 0 (13.8)
2,743.9 (135.4) 0 2,608.5
Earnings per share: Sen Sen
- Basic 48.68 46.32
- Diluted 48.56 46.21

About TNB
Our Business
Business Context
Performance Review
Sustainability Statement
The Strength of Our Governance
Financial Statements
Additional InformationIntegrated Annual Report 2018
Tenaga Nasional Berhad
p.295 Notes to the Financial Statements
47 RESTATEMENT AND EFFECTS OF CHANGES IN ACCOUNTING POLICIES (CONTINUED)
(a) Impact on the financial statements (continued)
Reconciliation of consolidated statement of profit or loss (continued)
For the financial period ended 31 December 2017
Aspreviously
reportedRM’million
Effect ofadoption of
MFRS 15RM’million
Reclassifi-cation
RM’million
Asrestated
RM’million
Company
Revenue 14,820.6 (102.4) 0 14,718.2
Operating expenses (12,411.9) 0 136.8 (12,275.1)
Net loss on impairment of financial instruments 0 0 (135.6) (135.6)
Finance income 101.0 0 (29.1) 71.9
Finance cost (564.2) 0 0.2 (564.0)
Fair value changes of financial instruments 0 0 27.7 27.7
Profit for the financial period 2,554.7 (102.4) 0 2,452.3
Reconciliation of consolidated statement of comprehensive income
For the financial period ended 31 December 2017
Aspreviously
reportedRM’million
Effect ofadoption of
MFRS 15RM’million
Asrestated
RM’million
Group
Total comprehensive income 2,508.1 (135.4) 2,372.7
Total comprehensive income for the financial period is attributable to:
- Owners of the Company 2,519.9 (133.4) 2,386.5
- Non-controlling interests (11.8) (2.0) (13.8)
2,508.1 (135.4) 2,372.7
Company
Total comprehensive income 2,452.3 (102.4) 2,349.9

About TNB
Our Business
Business Context
Performance Review
Sustainability Statement
The Strength of Our Governance
Financial Statements
Additional Information
p.296 Notes to the Financial Statements
47 RESTATEMENT AND EFFECTS OF CHANGES IN ACCOUNTING POLICIES (CONTINUED)
(a) Impact on the financial statements (continued)
Reconciliation of consolidated statement of financial position
Balance as at 1 January 2018
Aspreviously
reported31.12.2017RM’million
Effect ofadoption of
MFRS 15RM’million
Reclassifi-cation
RM’million
Asrestated
31.12.2017RM’million
Effect ofadoption
of MFRS 9RM’million
Asrestated
RM’million
Group
Non-current assets
Contract cost assets 0 0.1 0 0.1 0 0.1
Current assets
Receivables, deposits and prepayments 10,362.1 (3,086.6) 0 7,275.5 (203.3) 7,072.2
Contract assets 0 3,059.3 0 3,059.3 (19.7) 3,039.6
Amounts due from associates 332.0 0 0 332.0 (0.4) 331.6
Current liabilities
Payables (9,065.2) 28.8 0 (9,036.4) (1.9) (9,038.3)
Contract liabilities (Deferred income) (1,487.2) 1,199.7 0 (287.5) 0 (287.5)
Consumer deposits 0 0 (5,209.2) (5,209.2) 0 (5,209.2)
Non-current liabilities
Contract liabilities (Deferred income) (1,107.6) (1,342.4) 0 (2,450.0) 0 (2,450.0)
Deferred tax liabilities (7,646.0) 0.3 0 (7,645.7) 32.5 (7,613.2)
Consumer deposits (5,209.2) 0 5,209.2 0 0 0
Equity
Retained profits (52,378.0) 138.8 0 (52,239.2) 189.4 (52,049.8)
Non-controlling interests (925.2) 2.0 0 (923.2) 3.4 (919.8)

About TNB
Our Business
Business Context
Performance Review
Sustainability Statement
The Strength of Our Governance
Financial Statements
Additional InformationIntegrated Annual Report 2018
Tenaga Nasional Berhad
p.297 Notes to the Financial Statements
47 RESTATEMENT AND EFFECTS OF CHANGES IN ACCOUNTING POLICIES (CONTINUED)
(a) Impact on the financial statements (continued)
Reconciliation of consolidated statement of financial position (continued)
Balance as at 1 September 2017
As previously
reported 31.8.2017
RM’million
Effect ofadoption of
MFRS 15RM’million
Reclassifi-cation
RM’million
Asrestated1.9.2017
RM’million
Group (continued)
Current assets
Receivables, deposits and prepayments 8,962.2 (3,227.6) 0 5,734.6
Contract assets 0 3,222.3 0 3,222.3
Current liabilities
Payables (10,245.0) 16.2 0 (10,228.8)
Contract liabilities (Deferred income) (1,460.9) 1,184.2 0 (276.7)
Consumer deposits 0 0 (5,073.4) (5,073.4)
Non-current liabilities
Contract liabilities (Deferred income) (993.9) (1,200.4) 0 (2,194.3)
Deferred tax liabilities (7,728.3) (0.1) 0 (7,728.4)
Consumer deposits (5,073.4) 0 5,073.4 0
Equity
Retained profits (52,115.3) 5.4 0 (52,109.9)

About TNB
Our Business
Business Context
Performance Review
Sustainability Statement
The Strength of Our Governance
Financial Statements
Additional Information
p.298 Notes to the Financial Statements
47 RESTATEMENT AND EFFECTS OF CHANGES IN ACCOUNTING POLICIES (CONTINUED)
(a) Impact on the financial statements (continued)
Reconciliation of consolidated statement of financial position (continued)
Balance as at 1 January 2018
Aspreviously
reported31.12.2017RM’million
Effect ofadoption of
MFRS 15RM’million
Reclassifi-cation
RM’million
Asrestated
31.12.2017RM’million
Effect ofadoption
of MFRS 9RM’million
Asrestated
RM’million
Company
Non-current assets
Subsidiaries 9,991.5 0 (192.3) 9,799.2 0 9,799.2
Amounts due from subsidiaries 527.6 0 685.8 1,213.4 (106.6) 1,106.8
Long term receivables 690.5 0 (493.5) 197.0 0 197.0
Current assets
Receivables, deposits and prepayments 6,260.9 (2,925.7) 0 3,335.2 (142.8) 3,192.4
Contract assets 0 2,925.7 0 2,925.7 (19.7) 2,906.0
Amounts due from subsidiaries 4,186.9 0 0 4,186.9 (284.4) 3,902.5
Amounts due from associates 9.2 0 0 9.2 (0.4) 8.8
Current liabilities
Payables (5,819.8) 0 0 (5,819.8) (1.9) (5,821.7)
Contract liabilities (Deferred income) (1,377.7) 1,154.2 0 (223.5) 0 (223.5)
Consumer deposits 0 0 (4,910.9) (4,910.9) 0 (4,910.9)
Non-current liabilities
Contract liabilities (Deferred income) (826.0) (1,256.6) 0 (2,082.6) 0 (2,082.6)
Deferred tax liabilities (6,289.9) 0 0 (6,289.9) 32.2 (6,257.7)
Consumer deposits (4,910.9) 0 4,910.9 0 0 0
Equity
Retained profits (45,947.3) 102.4 0 (45,844.9) 523.6 (45,321.3)

About TNB
Our Business
Business Context
Performance Review
Sustainability Statement
The Strength of Our Governance
Financial Statements
Additional InformationIntegrated Annual Report 2018
Tenaga Nasional Berhad
p.299 Notes to the Financial Statements
47 RESTATEMENT AND EFFECTS OF CHANGES IN ACCOUNTING POLICIES (CONTINUED)
(a) Impact on the financial statements (continued)
Reconciliation of consolidated statement of financial position (continued)
Balance as at 1 September 2017
As previously
reported 31.8.2017
RM’million
Effect ofadoption of
MFRS 15RM’million
Reclassifi-cation
RM’million
Asrestated1.9.2017
RM’million
Company (continued)
Non-current assets
Subsidiaries 10,081.5 0 (1,261.3) 8,820.2
Amounts due from subsidiaries 455.0 0 1,754.8 2,209.8
Long term receivables 694.1 0 (493.5) 200.6
Current assets
Receivables, deposits and prepayments 6,119.1 (3,051.8) 0 3,067.3
Contract assets 0 3,051.8 0 3,051.8
Current liabilities
Contract liabilities (Deferred income) (1,384.9) 1,144.6 0 (240.3)
Consumer deposits 0 0 (4,778.2) (4,778.2)
Non-current liabilities
Contract liabilities (Deferred income) (691.5) (1,144.6) 0 (1,836.1)
Consumer deposits (4,778.2) 0 4,778.2 0

About TNB
Our Business
Business Context
Performance Review
Sustainability Statement
The Strength of Our Governance
Financial Statements
Additional Information
p.300 Notes to the Financial Statements
47 RESTATEMENT AND EFFECTS OF CHANGES IN ACCOUNTING POLICIES (CONTINUED)
(a) Impact on the financial statements (continued)
Reconciliation of consolidated statement of cash flows
For the financial period ended 31 December 2017
As previously
reportedRM’million
Effect ofadoption of
MFRS 15RM’million
Reclassifi-cation
RM’million
Asrestated
RM’million
Group
Profit for the financial period 2,743.9 (135.4) 0 2,608.5
Taxation and zakat 235.4 (0.4) 0 235.0
Interest on:
Finance leases 0 0 123.4 123.4
Consumer deposits 0 0 44.0 44.0
Release of:
Customers’ contribution (142.5) 26.9 0 (115.6)
Deferred income (116.8) 34.5 0 (82.3)
Receivables (2,006.3) (135.8) 0 (2,142.1)
Contract assets 0 163.0 0 163.0
Payables (995.7) (17.9) 108.6 (905.0)
Cash generated from operations 1,940.8 (65.1) 276.0 2,151.7
Contract liabilities received 399.3 65.1 0 464.4
Consumer deposits received 135.8 0 (44.0) 91.8
Net cash flows generated from operating activities 1,985.2 0 232.0 2,217.2
Repayment of finance lease obligations 0 0 (232.0) (232.0)
Net cash flows generated from financing activities 266.1 0 (232.0) 34.1
Company
Profit for the financial period 2,554.7 (102.4) 0 2,452.3
Interest on:
Finance leases 0 0 365.4 365.4
Consumer deposits 0 0 41.6 41.6
Release of:
Customers’ contribution (120.9) 24.8 0 (96.1)
Deferred income (77.6) 77.6 0 0
Receivables (455.4) (126.1) 0 (581.5)
Contract assets 0 126.1 0 126.1
Payables (1,268.4) 0 273.2 (995.2)
Cash generated from operations 1,420.1 0 680.2 2,100.3
Consumer deposits received 132.7 0 (41.6) 91.1
Net cash flows generated from operating activities 1,505.8 0 638.6 2,144.4
Repayment of finance lease obligations 0 0 (638.6) (638.6)
Net cash flows used in financing activities (2,843.6) 0 (638.6) (3,482.2)

About TNB
Our Business
Business Context
Performance Review
Sustainability Statement
The Strength of Our Governance
Financial Statements
Additional InformationIntegrated Annual Report 2018
Tenaga Nasional Berhad
p.301 Notes to the Financial Statements
47 RESTATEMENT AND EFFECTS OF CHANGES IN ACCOUNTING POLICIES (CONTINUED)
(b) Adoption of MFRS 15 ‘Revenue from Contracts with Customers’ (‘MFRS 15’)
The Group and Company have adopted MFRS 15 from 1 January 2018 which resulted in changes in accounting policies and adjustments to the amounts recognised in the current and prior financial year/period’s financial statements. In accordance with the transition provisions in MFRS 15, the Group and Company have adopted the new rules retrospectively and have restated comparatives for the 2017 financial period.
The Group and Company used the following practical expedients as permitted under the Standard:
• effects of significant financing component are disregarded if at contract inception the period between customer payment and the transfer of goods or services is expected to be one year or less
• incremental costs of obtaining a contract are expensed if the amortisation period of the asset is one year or less• revenue is recognised at the invoice amount if billing corresponds directly with performance to date• completed contracts at the beginning of the earliest period presented are not restated• completed contracts with the variable consideration will use the transaction price at the date the contract was completed• completed contracts for customers’ contributions received from customers and customers are connected to the network
between 1 September 2017 to 31 December 2017• contracts modified before the beginning of the earliest period presented will reflect the aggregate effect of all of the modifications
that occurred• for all reporting periods presented before the date of initial application, the amount of the transaction price allocated to the
remaining performance obligations and an explanation of when the entity expects to recognise that amount as revenue need not be disclosed
The impact on the Group and Company’s retained profits as at 31 December 2017 and 1 September 2017 are as follows:
Group Company
31.12.2017RM’million
1.9.2017RM’million
31.12.2017RM’million
Retained profits 52,378.0 52,115.3 45,947.3
Change in timing of revenue recognition (27.2) (5.3) 0
Amortisation of customers’ contribution (113.9) 0 (102.4)
Decrease/(Increase) in deferred tax liabilities 0.3 (0.1) 0
Decrease in NCI 2.0 0 0
Adjustments to retained profits from adoption of MFRS 15 (138.8) (5.4) (102.4)
Opening retained profits – MFRS 15 52,239.2 52,109.9 45,844.9

About TNB
Our Business
Business Context
Performance Review
Sustainability Statement
The Strength of Our Governance
Financial Statements
Additional Information
p.302 Notes to the Financial Statements
47 RESTATEMENT AND EFFECTS OF CHANGES IN ACCOUNTING POLICIES (CONTINUED)
(b) Adoption of MFRS 15 ‘Revenue from Contracts with Customers’ (‘MFRS 15’) (continued)
The impact of the adoption has resulted in changes to the following:
(i) Accounting for customers’ contribution
Prior to MFRS 15, revenue from customers’ contribution are recognised upon the connection of electricity supply. With effect from 1 September 2017, in compliance with MFRS 15, the contributions received from customers are recognised over time, through the amortisation over the estimated useful life of the constructed assets [Note 5(d)]. To reflect this change, the adjustments of RM113.9 million and RM102.4 million for the Group and Company respectively were made to the retained profits as at 31 December 2017 for the Group and Company.
Customers’ contributions received from customers and these customers are connected to the network within the reporting period from 1 September 2017 to 31 December 2017 are considered as completed contracts and will not be restated. Furthermore, revenue from customers’ contributions recognised prior to 1 September 2017 are also considered completed contracts and will not be restated.
(ii) Accounting for other revenue streams from subsidiaries
Revenue from other streams based on performance obligations satisfied has changed the timing of revenue recognition for some subsidiaries. To reflect this change of accounting policy, the adjustment of RM5.3 million was made to the opening retained profits as at 1 September 2017 and a further adjustment of RM27.2 million was made to the retained profits as at 31 December 2017.
(iii) Presentation of assets and liabilities related to contracts with customers
• Contract assets recognised in relation to unbilled revenue were previously presented as part of receivables, deposits and prepayments (RM3,039.6 million as at 31 December 2017 and RM3,222.3 million as at 1 September 2017 for the Group; RM2,906.0 million as at 31 December 2017 and RM3,051.8 million as at 1 September 2017 for the Company).
• Contract liabilities in relation to customers’ contribution were previously presented as part of deferred income (RM2,708.7 million as at 31 December 2017 and RM2,454.8 million as at 1 September 2017 for the Group; RM2,306.1 million as at 31 December 2017 and RM2,076.4 million as at 1 September 2017 for the Company).

About TNB
Our Business
Business Context
Performance Review
Sustainability Statement
The Strength of Our Governance
Financial Statements
Additional InformationIntegrated Annual Report 2018
Tenaga Nasional Berhad
p.303 Notes to the Financial Statements
47 RESTATEMENT AND EFFECTS OF CHANGES IN ACCOUNTING POLICIES (CONTINUED)
(c) Adoption of MFRS 9 ‘Financial Instruments’ (‘MFRS 9’)
MFRS 9 replaces the provisions of MFRS 139 that relate to the recognition, classification and measurement of financial assets and financial liabilities, derecognition of financial instruments and impairment of financial assets.
The adoption of MFRS 9 from 1 January 2018 resulted in changes in accounting policies and adjustments to the amounts recognised in the financial statements. The new accounting policies are set out in Note 45 above. In accordance with the transitional provisions in MFRS 9, comparative figures have not been restated.
The total impact on the Group and Company’s retained profits are as follows:
GroupRM’million
CompanyRM’million
Closing retained profits 31 December 2017 after restatement for MFRS 15 52,239.2 45,844.9
Increase in provision for receivables, deposits and prepayments (203.3) (142.8)
Increase in loss allowances for contract assets (19.7) (19.7)
Increase in provision for amounts due from subsidiaries 0 (391.0)
Increase in provision for amounts due from associates (0.4) (0.4)
Loss allowances on financial guarantee contract (1.9) (1.9)
Decrease in deferred tax liabilities 32.5 32.2
Decrease in NCI 3.4 0
Adjustments to retained profits from adoption of MFRS 9 on 1 January 2018 (189.4) (523.6)
Opening retained profits 1 January 2018 – MFRS 9 52,049.8 45,321.3
(i) Classification and measurement
On 1 January 2018 (the date of initial application of MFRS 9), the Group and Company’s management had assessed which business models apply to the financial assets held by the Group and Company and had classified its financial instruments into the appropriate MFRS 9 categories. The main effects resulting from this reclassification are as follows:• Reclassification from AFS to FVOCI Investment in unquoted shares are investments that the Group and Company intend to hold for long term strategic
purposes. As permitted by MFRS 9, the Group and Company have designated these investments as measured at FVOCI at the date of initial application.
• Reclassification from L&R to FVTPL Convertible students loans offered under Yayasan Tenaga Nasional (‘YTN’) were classified as L&R previously. These
financial assets do not meet the business model criteria of collecting contractual cash flows due to the convertible feature of the scholarships. Hence, these student loans are reclassified as FVTPL on 1 January 2018.

About TNB
Our Business
Business Context
Performance Review
Sustainability Statement
The Strength of Our Governance
Financial Statements
Additional Information
p.304 Notes to the Financial Statements
47 RESTATEMENT AND EFFECTS OF CHANGES IN ACCOUNTING POLICIES (CONTINUED)
(c) Adoption of MFRS 9 ‘Financial Instruments’ (‘MFRS 9’) (continued)
(ii) Reclassification of financial instruments on adoption of MFRS 9
On the date of initial application, 1 January 2018, the financial instruments of the Group and Company were as follows, with any reclassification noted:
Group Company
Measurement category Measurement category
OriginalMFRS 139
NewMFRS 9
OriginalMFRS 139
NewMFRS 9
Financial assets
Investment in unquoted debt security L&R AC L&R AC
Long term receivables L&R AC L&R AC
Finance lease receivables L&R AC L&R AC
AFS financial assets AFS FVOCI AFS FVOCI
Trade and other receivables L&R AC L&R AC
Amounts due from subsidiaries - - L&R AC
Amounts due from joint ventures L&R AC L&R AC
Amounts due from associates L&R AC L&R AC
Financial assets at FVTPL FVTPL FVTPL FVTPL FVTPL
Deposits, cash and bank balances L&R AC L&R AC
Derivative financial instruments FVTPL FVTPL FVTPL FVTPL
Financial liabilities
Trade and other payables AC AC AC AC
Finance lease payables AC AC AC AC
Amounts due to subsidiaries - - AC AC
Amounts due to associates AC AC AC AC
Borrowings AC AC AC AC
Derivative financial instruments FVTPL FVTPL FVTPL FVTPL
Other liabilities AC AC AC AC
The changes in the measurement category above did not have any impact on the carrying amount of the financial assets and liabilities.

About TNB
Our Business
Business Context
Performance Review
Sustainability Statement
The Strength of Our Governance
Financial Statements
Additional InformationIntegrated Annual Report 2018
Tenaga Nasional Berhad
p.305 Notes to the Financial Statements
47 RESTATEMENT AND EFFECTS OF CHANGES IN ACCOUNTING POLICIES (CONTINUED)
(c) Adoption of MFRS 9 ‘Financial Instruments’ (‘MFRS 9’) (continued)
(iii) Impairment of financial assets and financial guarantee contracts
The Group and Company have four types of financial instruments that are subject to MFRS 9’s new ECL model:- trade receivables;- contract assets; - related company balances; - non-trade receivables carried at amortised cost; and- financial guarantee contracts.
The Group and Company also have financial gurantee contracts that are subject to MFRS 9’s new ECL model.
The Group and Company were required to revise its impairment methodology under MFRS 9 for each of these classes of assets. The impact of the change in impairment methodology on the Group and Company’s retained profits and equity is disclosed in the table in Note 45 above.
While cash and cash equivalents are also subject to the impairment requirements of MFRS 9, the identified impairment loss was immaterial.
The Group and Company apply the MFRS 9 simplified approach to measuring expected credit losses which uses a lifetime expected credit loss allowance for all receivables and financial guarantee contracts. This resulted in an increase in the loss allowance on 1 January 2018 by RM225.3 million for the Group and RM555.8 million for the Company. Note 45 provide details about the calculation of the allowance.
The loss allowance increased by RM223.0 million and RM162.5 million for the Group and Company for trade receivables and contract assets on 1 January 2018. Loss allowance on contract assets is referring to impairment on unbilled revenue.
Applying the ECL model for non-trade receivables (amounts due from subsidiaries and associates) carried at amortised cost resulted in the recognition of a loss allowance of RM0.4 million and RM391.4 million on 1 January 2018 for the Group and Company. Note 45 provides the details on non-trade receivables.
Financial guarantee contracts (i.e. contracts that require the Company to make specified payments to reimburse the holder for a loss it incurs because a specified debtor fails to make payments when due in accordance with the terms of a debt instrument) are also subject to impairment requirements under the ECL model.
Applying the ECL model for financial guarantee contracts resulted in the recognition of a loss allowance of RM1.9 million on 1 January 2018 for the Group and Company. Note 45 provides the details on financial guarantee contracts.
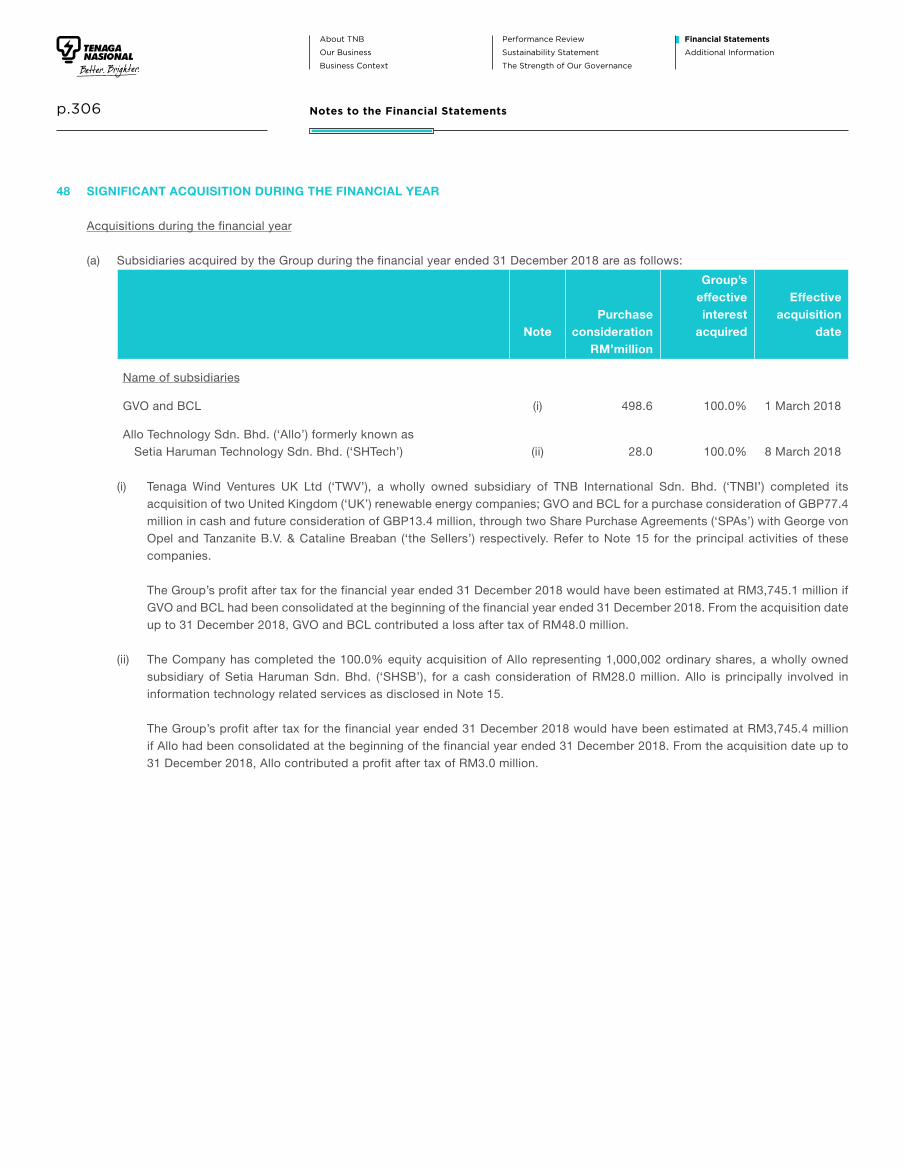
About TNB
Our Business
Business Context
Performance Review
Sustainability Statement
The Strength of Our Governance
Financial Statements
Additional Information
p.306 Notes to the Financial Statements
48 SIGNIFICANT ACQUISITION DURING THE FINANCIAL YEAR
Acquisitions during the financial year
(a) Subsidiaries acquired by the Group during the financial year ended 31 December 2018 are as follows:
NotePurchase
considerationRM’million
Group’seffectiveinterest
acquired
Effectiveacquisition
date
Name of subsidiaries
GVO and BCL (i) 498.6 100.0% 1 March 2018
Allo Technology Sdn. Bhd. (‘Allo’) formerly known as Setia Haruman Technology Sdn. Bhd. (‘SHTech’) (ii) 28.0 100.0% 8 March 2018
(i) Tenaga Wind Ventures UK Ltd (‘TWV’), a wholly owned subsidiary of TNB International Sdn. Bhd. (‘TNBI’) completed its acquisition of two United Kingdom (‘UK’) renewable energy companies; GVO and BCL for a purchase consideration of GBP77.4 million in cash and future consideration of GBP13.4 million, through two Share Purchase Agreements (‘SPAs’) with George von Opel and Tanzanite B.V. & Cataline Breaban (‘the Sellers’) respectively. Refer to Note 15 for the principal activities of these companies.
The Group’s profit after tax for the financial year ended 31 December 2018 would have been estimated at RM3,745.1 million if GVO and BCL had been consolidated at the beginning of the financial year ended 31 December 2018. From the acquisition date up to 31 December 2018, GVO and BCL contributed a loss after tax of RM48.0 million.
(ii) The Company has completed the 100.0% equity acquisition of Allo representing 1,000,002 ordinary shares, a wholly owned subsidiary of Setia Haruman Sdn. Bhd. (‘SHSB’), for a cash consideration of RM28.0 million. Allo is principally involved in information technology related services as disclosed in Note 15.
The Group’s profit after tax for the financial year ended 31 December 2018 would have been estimated at RM3,745.4 million if Allo had been consolidated at the beginning of the financial year ended 31 December 2018. From the acquisition date up to 31 December 2018, Allo contributed a profit after tax of RM3.0 million.
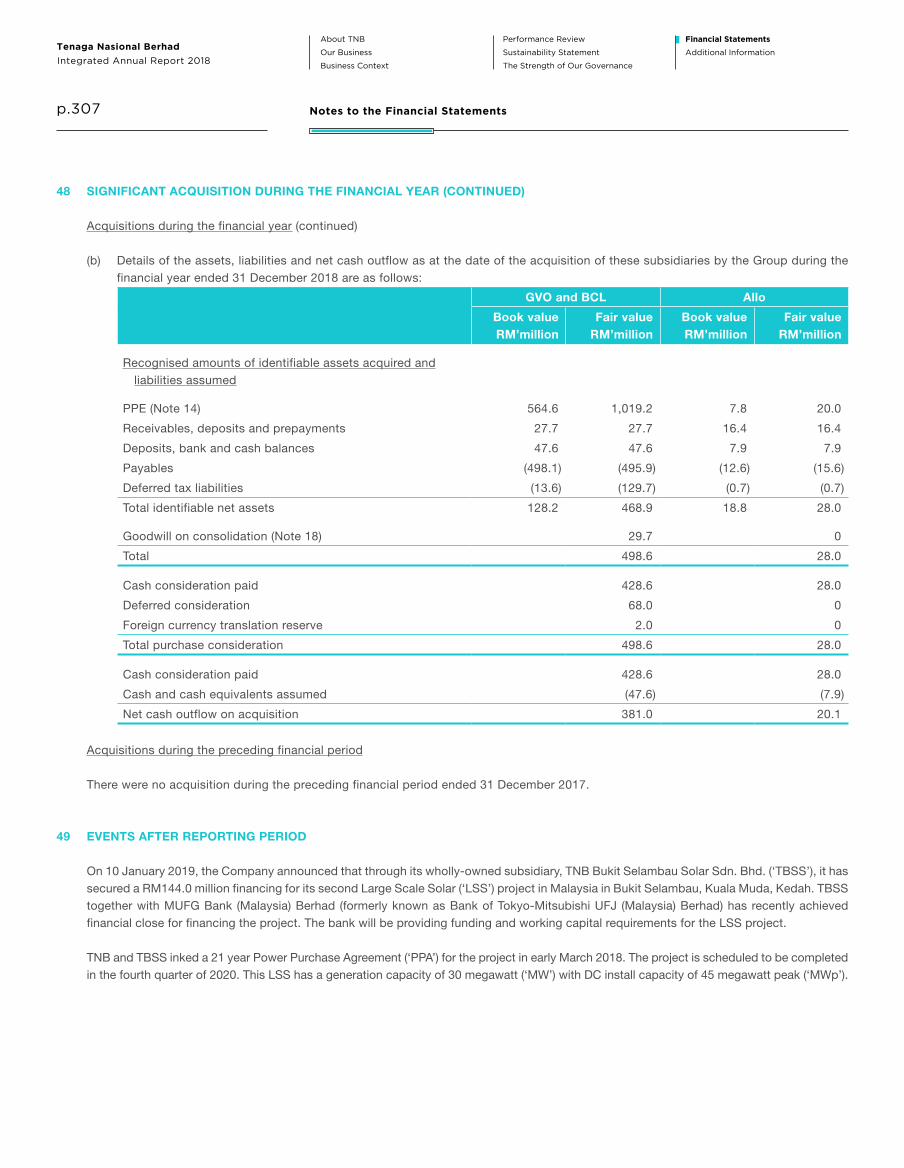
About TNB
Our Business
Business Context
Performance Review
Sustainability Statement
The Strength of Our Governance
Financial Statements
Additional InformationIntegrated Annual Report 2018
Tenaga Nasional Berhad
p.307 Notes to the Financial Statements
48 SIGNIFICANT ACQUISITION DURING THE FINANCIAL YEAR (CONTINUED)
Acquisitions during the financial year (continued)
(b) Details of the assets, liabilities and net cash outflow as at the date of the acquisition of these subsidiaries by the Group during the financial year ended 31 December 2018 are as follows:
GVO and BCL Allo
Book valueRM’million
Fair valueRM’million
Book valueRM’million
Fair valueRM’million
Recognised amounts of identifiable assets acquired and liabilities assumed
PPE (Note 14) 564.6 1,019.2 7.8 20.0
Receivables, deposits and prepayments 27.7 27.7 16.4 16.4
Deposits, bank and cash balances 47.6 47.6 7.9 7.9
Payables (498.1) (495.9) (12.6) (15.6)
Deferred tax liabilities (13.6) (129.7) (0.7) (0.7)
Total identifiable net assets 128.2 468.9 18.8 28.0
Goodwill on consolidation (Note 18) 29.7 0
Total 498.6 28.0
Cash consideration paid 428.6 28.0
Deferred consideration 68.0 0
Foreign currency translation reserve 2.0 0
Total purchase consideration 498.6 28.0
Cash consideration paid 428.6 28.0
Cash and cash equivalents assumed (47.6) (7.9)
Net cash outflow on acquisition 381.0 20.1
Acquisitions during the preceding financial period
There were no acquisition during the preceding financial period ended 31 December 2017.
49 EVENTS AFTER REPORTING PERIOD
On 10 January 2019, the Company announced that through its wholly-owned subsidiary, TNB Bukit Selambau Solar Sdn. Bhd. (‘TBSS’), it has secured a RM144.0 million financing for its second Large Scale Solar (‘LSS’) project in Malaysia in Bukit Selambau, Kuala Muda, Kedah. TBSS together with MUFG Bank (Malaysia) Berhad (formerly known as Bank of Tokyo-Mitsubishi UFJ (Malaysia) Berhad) has recently achieved financial close for financing the project. The bank will be providing funding and working capital requirements for the LSS project.
TNB and TBSS inked a 21 year Power Purchase Agreement (‘PPA’) for the project in early March 2018. The project is scheduled to be completed in the fourth quarter of 2020. This LSS has a generation capacity of 30 megawatt (‘MW’) with DC install capacity of 45 megawatt peak (‘MWp’).

About TNB
Our Business
Business Context
Performance Review
Sustainability Statement
The Strength of Our Governance
Financial Statements
Additional Information
p.308
STATEMENT BYDIRECTORSPURSUANT TO SECTION 251(2) OF THE COMPANIES ACT 2016
We, Tan Sri Leo Moggie and Datuk Seri Ir. Azman bin Mohd, the Directors of Tenaga Nasional Berhad, do hereby state that, in the opinion of the Directors, the financial statements set out on pages 153 to 307 are drawn up so as to give a true and fair view of the financial position of the Group and of the Company as at 31 December 2018 and financial performance of the Group and of the Company for the financial year ended 31 December 2018 in accordance with Malaysian Financial Reporting Standards, International Financial Reporting Standards and the requirements of the Companies Act 2016 in Malaysia.
Signed on behalf of the Board of Directors, in accordance with their resolution dated 19 March 2019.
TAN SRI LEO MOGGIE DATUK SERI IR. AZMAN BIN MOHDCHAIRMAN PRESIDENT/CHIEF EXECUTIVE OFFICER
I, Nazmi bin Othman, the Officer primarily responsible for the financial management of Tenaga Nasional Berhad, do solemnly and sincerely declare that the financial statements set out on pages 153 to 307 are, in my opinion, correct and I make this solemn declaration conscientiously believing the same to be true, and by virtue of the provisions of the Statutory Declarations Act, 1960.
NAZMI BIN OTHMAN
Subscribed and solemnly declared by the abovenamed Nazmi bin Othman at Kuala Lumpur, Malaysia on 19 March 2019, before me.
COMMISSIONER FOR OATHS
STATUTORYDECLARATIONPURSUANT TO SECTION 251(1) OF THE COMPANIES ACT 2016

About TNB
Our Business
Business Context
Performance Review
Sustainability Statement
The Strength of Our Governance
Financial Statements
Additional InformationIntegrated Annual Report 2018
Tenaga Nasional Berhad
p.309
REPORT ON THE AUDIT OF THE FINANCIAL STATEMENTS
Our opinion
In our opinion, the financial statements of Tenaga Nasional Berhad (‘the Company’) and its subsidiaries (‘the Group’) give a true and fair view of the financial position of the Group and of the Company as at 31 December 2018, and of their financial performance and their cash flows for the financial year then ended in accordance with Malaysian Financial Reporting Standards, International Financial Reporting Standards and the requirements of the Companies Act 2016 in Malaysia.
What we have audited
We have audited the financial statements of the Group and of the Company, which comprise the statements of financial position as at 31 December 2018 of the Group and of the Company, and the statements of profit or loss, statements of comprehensive income, statements of changes in equity and statements of cash flows of the Group and of the Company for the financial year then ended, and notes to the financial statements, including a summary of significant accounting policies, as set out on pages 153 to 307.
Basis for opinion
We conducted our audit in accordance with approved standards on auditing in Malaysia and International Standards on Auditing. Our responsibilities under those standards are further described in the “Auditors’ responsibilities for the audit of the financial statements” section of our report.
We believe that the audit evidence we have obtained is sufficient and appropriate to provide a basis for our opinion.
Independence and other ethical responsibilities
We are independent of the Group and of the Company in accordance with the By-Laws (on Professional Ethics, Conduct and Practice) of the Malaysian Institute of Accountants (‘By-Laws’) and the International Ethics Standards Board for Accountants’ Code of Ethics for Professional Accountants (‘IESBA Code’), and we have fulfilled our other ethical responsibilities in accordance with the By-Laws and the IESBA Code.
Our audit approach
As part of designing our audit, we determined materiality and assessed the risks of material misstatement in the financial statements of the Group and the Company. In particular, we considered where the Directors made subjective judgements; for example, in respect of significant accounting estimates that involved making assumptions and considering future events that are inherently uncertain. As in all of our audits, we also addressed the risk of management override of internal controls, including among other matters, consideration of whether there was evidence of bias that represented a risk of material misstatement due to fraud.
We tailored the scope of our audit in order to perform sufficient work to enable us to provide an opinion on the financial statements as a whole, taking into account the structure of the Group and of the Company, the accounting processes and controls, and the industry in which the Group and the Company operate.
INDEPENDENTAUDITORS’ REPORTTO THE MEMBERS OF TENAGA NASIONAL BERHAD
(Incorporated in Malaysia)
(Company No. 200866-W)

About TNB
Our Business
Business Context
Performance Review
Sustainability Statement
The Strength of Our Governance
Financial Statements
Additional Information
p.310
REPORT ON THE AUDIT OF THE FINANCIAL STATEMENTS (CONTINUED)
Key audit matters
Key audit matters are those matters that, in our professional judgement, were of most significance in our audit of the financial statements of the Group and of the Company for the current financial year. These matters were addressed in the context of our audit of the financial statements of the Group and of the Company as a whole, and in forming our opinion thereon, and we do not provide a separate opinion on these matters.
Key audit matters How our audit addressed the key audit matters
Revenue recognition for sales of electricity
Refer to Note 4 – Critical Accounting Estimates and Judgements and Note 5 – Revenue
Sales of electricity of RM49,487.4 million and RM46,883.9 million is the most significant component of the Group’s and Company’s revenue respectively for the financial year ended 31 December 2018.
Revenue from sales of electricity is based on the end customers’ consumption and the related tariff rates, which are governed by the Incentive Based Regulations imposed by the Suruhanjaya Tenaga.
We focused on the revenue recognition for sales of electricity as it involves the use of complex billing and accounting systems to process large volumes of data with different tariffs based on respective customer categories and consumption.
We performed the following audit procedures:
• Tested the overall information technology general controls of the billing and accounting systems recording the revenue transactions.
• Tested the application controls within the billing systems over the:- maintenance of tariff rates in the billing systems;- accuracy of calculation of amounts billed to customers; and- recording of revenue transactions.
• Tested the billings and revenue adjustments on a sampling basis to assess whether the revenue recognised and revenue adjustments are valid and recorded accurately.
Based on the above procedures performed, we did not find any material exceptions.
Reinvestment allowance (‘RIA’) claims
Refer to Note 4 – Critical Accounting Estimates and Judgements and Note 42 – Contingent Liabilities
On 23 November 2015, Inland Revenue Board (‘IRB’) had disallowed the Company’s RIA claims of RM2,068.2 million for Year Assessment 2013 and 2014 and had issued notices of additional assessments (‘Notices’) to the Company. The Company had filed an appeal to the Special Commissioners of the Income Tax (‘SCIT’) on the Notices.
As at 31 December 2018, the Group and Company recorded a tax recoverable of RM1,765.1 million from IRB arising from the resubmission of tax computations in the financial year ended 31 August 2014, pursuant to the explicit approval given by IRB on 21 January 2013 on the eligibility of TNB in claiming RIA, and based on a legal view obtained from external legal counsel.
In addition, the Group and Company have not recorded the potential tax liability arising from the tax impact if the RIA claimed is disallowed and the Company loses its appeal.
We focused on this area due to the inherent uncertainties involved in the outcome of judgement on the RIA claims by the SCIT and by the Kuala Lumpur High Court, including if there is a subsequent appeal by either party.
We evaluated the Directors’ assessment on the basis of recoverability of the tax recoverable of RM1,765.1 million and the potential tax liability by assessing the independent legal confirmation obtained from management’s external legal counsel.
Examined the correspondence between the Company and the tax authority and assessed the matters in dispute based on advice received from our own tax experts to review the basis of application of the relevant tax laws.
Based on the procedures performed above, we did not find any material exceptions to the Directors’ judgement in the treatment of the tax recoverable balance and the potential tax liability.
Independent Auditors’ Report

About TNB
Our Business
Business Context
Performance Review
Sustainability Statement
The Strength of Our Governance
Financial Statements
Additional InformationIntegrated Annual Report 2018
Tenaga Nasional Berhad
p.311
REPORT ON THE AUDIT OF THE FINANCIAL STATEMENTS (CONTINUED)
Key audit matters (continued)
Key audit matters How our audit addressed the key audit matters
Assessment on carrying value of post-employment benefits
Refer to Note 4 – Critical Accounting Estimates and Judgements and Note 33 – Employee Benefits
As at 31 December 2018, the Group and Company recorded post-employment benefits of RM11,908.2 million and RM11,279.8 million respectively.
Management assessed the present value of post-employment benefit plans by relying on the actuarial valuation reports from an actuary. The actuarial valuation reports estimated the present value of post-employment benefit plans based on key assumptions that comprised expected rate of salary increases, medical cost inflation and discount rates.
We focused on this area because of the significant estimates made by management in determining the present value of post-employment benefit plans.
We performed the following audit procedures:
• Obtained an understanding of the terms and conditions of the post-employment benefit plans.
• Tested the present value of post-employment benefit plans based on the actuarial valuation reports by performing the following:
- Discussed with actuary the valuation method used and checked that the valuation method is acceptable in accordance with MFRS 119 ‘Employee Benefits’;
- Discussed with actuary on the key assumptions used in the actuarial valuation and checked the reasonableness by comparing to historical data;
- Checked the reasonableness of the discount rates with the assistance of our valuation experts by comparing to market yields of high quality government securities at reporting date;
- Checked the membership data used in the actuarial models through inspection of payroll personnel files and other supporting documents; and
- Compared the fair value of plan assets based on the actuary report against the trustee’s report.
Based on the procedures performed above, we did not find any material exceptions to the Director’s estimates of the post-employment benefits carrying value.
Independent Auditors’ Report

About TNB
Our Business
Business Context
Performance Review
Sustainability Statement
The Strength of Our Governance
Financial Statements
Additional Information
p.312
REPORT ON THE AUDIT OF THE FINANCIAL STATEMENTS (CONTINUED)
Key audit matters (continued)
Key audit matters How our audit addressed the key audit matters
Impairment assessments of non-current assets other than goodwill
Refer to Note 4 – Critical Accounting Estimates and Judgements, Note 15 – Subsidiaries and Note 17 – Associates
Management performed impairment assessments of certain non-current assets of the Group and Company, other than goodwill, which had impairment indicators. As a result, the following impairment losses were recognised during the financial year ended 31 December 2018:
• Impairment totalling RM802.7 million at TNB Group in respect of the Group’s investments in Gama Enerji Anonîm Şîrketî (‘Gama Enerji’) and GMR Energy Limited (‘GEL’), associates in Turkey and India respectively.
• Impairment totalling RM1,621.4 million at TNB Company in respect of the Company’s investments in Aruna Servicios Integrales S.L.U. (‘ASI’) and Power and Energy International (Mauritius) Ltd. (‘PEIM’), wholly owned subsidiaries of TNB Company.
We focused on this area as the recoverable amounts of the non-current assets are determined based on discounted cash flows projections, which require judgement on the part of management on the future financial performance and the key assumptions used, in particular, plant load factor, plant availability factor and terminal growth rate.
We have assessed management’s impairment assessments. Our procedures in relation to management’s impairment assessment includes the following:
• We assessed the reliability of management’s forecast through the review of past trends of actual financial performances against previous forecasted results;
• We assessed the key assumptions used by management in the discounted future cash flows projections, in particular, plant load factor, plant availability factor and terminal growth rate, by comparing with historical results and market outlook;
• We performed sensitivity analysis on discount rates, plant load factors and terminal growth rate used to evaluate the impact on the impairment assessment; and
• We assessed the adequacy and reasonableness of the disclosures in the financial statements.
Based on the procedures performed, we noted no significant exceptions.
Information other than the financial statements and auditors’ report thereon
The Directors of the Company are responsible for the other information. The other information comprises Directors’ Report, Statement on Risk Management and Internal Control, Board Risk Committee Report and the Chairman’s Statement, which we obtained prior to the date of this auditors’ report, and the remaining Annual Report 31 December 2018 of Tenaga Nasional Berhad, which is expected to be made available to us after that date. Other information does not include the financial statements of the Group and of the Company and our auditors’ report thereon.
Our opinion on the financial statements of the Group and of the Company does not cover the other information and we do not express any form of assurance conclusion thereon.
In connection with our audit of the financial statements of the Group and of the Company, our responsibility is to read the other information and, in doing so, consider whether the other information is materially inconsistent with the financial statements of the Group and of the Company or our knowledge obtained in the audit or otherwise appears to be materially misstated.
If, based on the work we have performed, we conclude that there is a material misstatement of this other information, we are required to report that fact. We have nothing to report in this regard.
Independent Auditors’ Report

About TNB
Our Business
Business Context
Performance Review
Sustainability Statement
The Strength of Our Governance
Financial Statements
Additional InformationIntegrated Annual Report 2018
Tenaga Nasional Berhad
p.313
REPORT ON THE AUDIT OF THE FINANCIAL STATEMENTS (CONTINUED)
Responsibilities of the Directors for the financial statements
The Directors of the Company are responsible for the preparation of the financial statements of the Group and of the Company that give a true and fair view in accordance with Malaysian Financial Reporting Standards, International Financial Reporting Standards and the requirements of the Companies Act 2016 in Malaysia. The Directors are also responsible for such internal control as the Directors determine is necessary to enable the preparation of financial statements of the Group and of the Company that are free from material misstatement, whether due to fraud or error.
In preparing the financial statements of the Group and of the Company, the Directors are responsible for assessing the Group’s and the Company’s ability to continue as a going concern, disclosing, as applicable, matters related to going concern and using the going concern basis of accounting unless the Directors either intend to liquidate the Group or the Company or to cease operations, or have no realistic alternative but to do so.
Auditors’ responsibilities for the audit of the financial statements
Our objectives are to obtain reasonable assurance about whether the financial statements of the Group and of the Company as a whole are free from material misstatement, whether due to fraud or error, and to issue an auditors’ report that includes our opinion. Reasonable assurance is a high level of assurance, but is not a guarantee that an audit conducted in accordance with approved standards on auditing in Malaysia and International Standards on Auditing will always detect a material misstatement when it exists. Misstatements can arise from fraud or error and are considered material if, individually or in the aggregate, they could reasonably be expected to influence the economic decisions of users taken on the basis of these financial statements.
As part of an audit in accordance with approved standards on auditing in Malaysia and International Standards on Auditing, we exercise professional judgement and maintain professional scepticism throughout the audit. We also:
(a) Identify and assess the risks of material misstatement of the financial statements of the Group and of the Company, whether due to fraud or error, design and perform audit procedures responsive to those risks, and obtain audit evidence that is sufficient and appropriate to provide a basis for our opinion. The risk of not detecting a material misstatement resulting from fraud is higher than for one resulting from error, as fraud may involve collusion, forgery, intentional omissions, misrepresentations, or the override of internal control.
(b) Obtain an understanding of internal control relevant to the audit in order to design audit procedures that are appropriate in the circumstances, but not for the purpose of expressing an opinion on the effectiveness of the Group’s and the Company’s internal control.
(c) Evaluate the appropriateness of accounting policies used and the reasonableness of accounting estimates and related disclosures made by the Directors.
(d) Conclude on the appropriateness of the Directors’ use of the going concern basis of accounting and, based on the audit evidence obtained, whether a material uncertainty exists related to events or conditions that may cast significant doubt on the Group’s or the Company’s ability to continue as a going concern. If we conclude that a material uncertainty exists, we are required to draw attention in our auditors’ report to the related disclosures in the financial statements of the Group and of the Company or, if such disclosures are inadequate, to modify our opinion. Our conclusions are based on the audit evidence obtained up to the date of our auditors’ report. However, future events or conditions may cause the Group or the Company to cease to continue as a going concern.
(e) Evaluate the overall presentation, structure and content of the financial statements of the Group and of the Company, including the disclosures, and whether the financial statements of the Group and of the Company represent the underlying transactions and events in a manner that achieve fair presentation.
(f) Obtain sufficient appropriate audit evidence regarding the financial statements of the entities or business activities within the Group to express an opinion on the financial statements of the Group. We are responsible for the direction, supervision and performance of the group audit. We remain solely responsible for our audit opinion.
Independent Auditors’ Report

About TNB
Our Business
Business Context
Performance Review
Sustainability Statement
The Strength of Our Governance
Financial Statements
Additional Information
p.314
REPORT ON THE AUDIT OF THE FINANCIAL STATEMENTS (CONTINUED)
Auditors’ responsibilities for the audit of the financial statements (continued)
We communicate with the Directors regarding, among other matters, the planned scope and timing of the audit and significant audit findings, including any significant deficiencies in internal control that we identify during our audit.
We also provide the Directors with a statement that we have complied with relevant ethical requirements regarding independence, and to communicate with them all relationships and other matters that may reasonably be thought to bear on our independence, and where applicable, related safeguards.
From the matters communicated with the Directors, we determine those matters that were of most significance in the audit of the financial statements of the Group and of the Company for the current financial year and are therefore the key audit matters. We describe these matters in our auditors’ report unless law or regulation precludes public disclosure about the matter or when, in extremely rare circumstances, we determine that a matter should not be communicated in our report because the adverse consequences of doing so would reasonably be expected to outweigh the public interest benefits of such communication.
REPORT ON OTHER LEGAL AND REGULATORY REQUIREMENTS
In accordance with the requirements of the Companies Act 2016 in Malaysia, we report that the subsidiaries of which we have not acted as auditors, are disclosed in Note 15 to the financial statements.
OTHER MATTERS
This report is made solely to the members of the Company, as a body, in accordance with Section 266 of the Companies Act 2016 in Malaysia and for no other purpose. We do not assume responsibility to any other person for the content of this report.
PRICEWATERHOUSECOOPERS PLT AZIZAN BIN ZAKARIALLP0014401-LCA & AF 1146 02930/05/2020 JChartered Accountants Chartered Accountant
Kuala Lumpur19 March 2019
Independent Auditors’ Report

About TNB
Our Business
Business Context
Performance Review
Sustainability Statement
The Strength of Our Governance
Financial Statements
Additional InformationIntegrated Annual Report 2018
Tenaga Nasional Berhad
p.315
316 Statistics of Shareholdings
Proxy Form
ADDITIONAL INFORMATION

About TNB
Our Business
Business Context
Performance Review
Sustainability Statement
The Strength of Our Governance
Financial Statements
Additional Information
p.316
SHARE CAPITAL
Issued Shares : 5,686,888,771 ordinary shares One (1) Special Rights Redeemable Preference Share
Voting Right : One (1) vote per ordinary share
ANALYSIS BY SIZE OF SHAREHOLDINGS
Size of Shareholdings
No. of
Shareholders
Total No. of
Shareholders
No. of
Issued Shares
Total No. of
Issued Shares
Malaysian Foreigner No. % Malaysian Foreigner No. %
1 - 99 1,784 29 1,813 4.14 60,944 1,029 61,973 0.00
100 - 1,000 19,343 148 19,491 44.49 8,368,929 83,640 8,452,569 0.15
1,001 - 10,000 19,090 294 19,384 44.25 52,518,261 1,235,361 53,753,622 0.95
10,001 - 100,000 1,630 371 2,001 4.57 41,603,637 15,566,223 57,169,860 1.00
100,001 - less than 5% of issued shares 468 649 1,117 2.55 1,648,154,125 1,075,189,679 2,723,343,804 47.89
5% and above of issued shares 3 0 3 0.00 2,844,106,943 0 2,844,106,943 50.01
Total 42,318 1,491 43,809 100.00 4,594,812,839 1,092,075,932 5,686,888,771 100.00
ANALYSIS OF EQUITY STRUCTURE
No. Category of ShareholdersNo. of Shareholders No. of Issued Shares % of Issued Shares
Malaysian Foreigner Malaysian Foreigner Malaysian Foreigner
1. Individuals 37,464 281 81,358,522 1,120,974 1.43 0.02
2. Body Corporate
a. Banks/Finance Companies 135 1 1,494,431,863 46 26.28 0.00
b. Investment Trusts/Foundation/Charities 9 0 180,612 0 0.00 0.00
c. Other Type of Companies 359 14 1,660,854,196 9,210,062 29.21 0.16
3. Government Agencies/Institutions 16 0 12,356,662 0 0.22 0.00
4. Nominees 4,335 1,195 1,345,630,984 1,081,744,850 23.66 19.02
5. Others 0 0 0 0 0.00 0.00
Total 42,318 1,491 4,594,812,839 1,092,075,932 80.80 19.20
STATISTICS OFSHAREHOLDINGSAS AT 18 MARCH 2019

About TNB
Our Business
Business Context
Performance Review
Sustainability Statement
The Strength of Our Governance
Financial Statements
Additional InformationIntegrated Annual Report 2018
Tenaga Nasional Berhad
p.317 Statistics of Shareholdings
DIRECTORS’ SHAREHOLDINGS
No. Name of Directors No. of Shares
Direct Interest %
1. Tan Sri Leo Moggie 0 0.00
2. Datuk Seri Ir. Azman bin Mohd 330,700 0.01
3. Datuk Ahmad Badri bin Mohd Zahir (Appointed w.e.f. 1 November 2018) 0 0.00
4. Amran Hafiz bin Affifudin 0 0.00
5. Noraini binti Che Dan (Redesignated w.e.f. 28 February 2019) 0 0.00
6. Gee Siew Yoong 0 0.00
7. Juniwati Rahmat Hussin 0 0.00
8. Gopala Krishnan K.Sundaram (Appointed w.e.f. 4 July 2018) 0 0.00
9. Ong Ai Lin (Appointed w.e.f. 1 August 2018) 0 0.00
10. Dato’ Roslina binti Zainal (Appointed w.e.f. 15 March 2019) 18,400 0.00
SUBSTANTIAL SHAREHOLDERS ACCORDING TO THE REGISTER OF SUBSTANTIAL SHAREHOLDERS
No. Name of Substantial Shareholders No. of Shares %
1. Khazanah Nasional Berhad 1,635,655,861 28.76
2. Employees Provident Fund Board* 788,778,782 13.87
3. Amanah Saham Bumiputera** 517,606,500 9.10
4. Kumpulan Wang Persaraan (Diperbadankan)*** 308,066,925 5.42
Total 3,250,108,068 57.15
Notes:-* Registered with Citigroup Nominees (Tempatan) Sdn. Bhd.** Registered with AmanahRaya Trustees Berhad*** Kumpulan Wang Persaraan (Diperbadankan)
- Registered with Citigroup Nominees (Tempatan) Sdn. Bhd. (40,562,000)
TOP 30 SECURITIES ACCOUNT HOLDERS
No. Name of Shareholders No. of Shares %
1. Khazanah Nasional Berhad 1,635,655,861 28.76
2. Citigroup Nominees (Tempatan) Sdn. Bhd.Employees Provident Fund Board
690,844,582 12.15
3. AmanahRaya Trustees BerhadAmanah Saham Bumiputera
517,606,500 9.10
4. Kumpulan Wang Persaraan (Diperbadankan) 267,504,925 4.70
5. Permodalan Nasional Berhad 153,796,300 2.70
6. AmanahRaya Trustees BerhadAmanah Saham Malaysia 2 - Wawasan
97,714,800 1.72

About TNB
Our Business
Business Context
Performance Review
Sustainability Statement
The Strength of Our Governance
Financial Statements
Additional Information
p.318
No. Name of Shareholders No. of Shares %
7. AmanahRaya Trustees BerhadAmanah Saham Malaysia
79,861,600 1.40
8. Cartaban Nominees (Asing) Sdn. Bhd.Exempt AN For State Street Bank & Trust Company (West CLT OD67)
79,003,662 1.39
9. HSBC Nominees (Asing) Sdn. Bhd.JPMCB NA For Vanguard Emerging Markets Stock Index Fund
62,393,811 1.10
10. HSBC Nominees (Asing) Sdn. Bhd.JPMCB NA For Vanguard Total International Stock Index Fund
61,226,011 1.08
11. Cartaban Nominees (Tempatan) Sdn. Bhd.PAMB For Prulink Equity Fund
58,931,450 1.04
12. Malaysia Nominees (Tempatan) Sendirian BerhadGreat Eastern Life Assurance (Malaysia) Berhad (Par 1)
58,234,125 1.02
13. Citigroup Nominees (Tempatan) Sdn. Bhd.Exempt AN For AIA Bhd.
47,520,025 0.84
14. AmanahRaya Trustees BerhadAmanah Saham Bumiputera 2
41,895,700 0.74
15. Cartaban Nominees (Asing) Sdn. Bhd.GIC Private Limited For Government of Singapore (C)
34,659,775 0.61
16. AmanahRaya Trustees BerhadAmanah Saham Bumiputera 3 - Didik
34,362,992 0.60
17. Citigroup Nominees (Tempatan) Sdn. Bhd.Employees Provident Fund Board (NOMURA)
34,229,600 0.60
18. Maybank Nominees (Tempatan) Sdn. Bhd.Maybank Trustees Berhad For Public Ittikal Fund (N14011970240)
33,000,000 0.58
19. AmanahRaya Trustees BerhadAmanah Saham Malaysia 3
32,634,300 0.57
20. AmanahRaya Trustees BerhadPublic Islamic Dividend Fund
30,222,975 0.53
21. Lembaga Tabung Haji 30,080,000 0.53
22. Maybank Nominees (Tempatan) Sdn. Bhd.MTrustee Berhad For CIMB Islamic DALI Equity Growth Fund (UT-CIMB-DALI) (419455)
24,098,300 0.42
23. Malaysia Nominees (Tempatan) Sendirian BerhadGreat Eastern Life Assurance (Malaysia) Berhad (Par 3)
22,863,550 0.40
24. HSBC Nominees (Asing) Sdn. Bhd.JPMBL SA For Nordea 1, Sicav
22,751,360 0.40
25. HSBC Nominees (Asing) Sdn. Bhd.Pictet And CIE (Europe) For Pictet Global Selection Fund - Global Utilities Equity Fund
18,526,600 0.33
26. AmanahRaya Trustees BerhadPublic Islamic Equity Fund
17,626,037 0.31
27. HSBC Nominees (Asing) Sdn. Bhd.JPMCB NA For MSCI Equity Index Fund B - Malaysia
17,543,418 0.31
28. DB (Malaysia) Nominee (Asing) Sdn. Bhd.BNYM SA/NV For People's Bank of China (SICL ASIA EM)
17,523,100 0.31
29. AmanahRaya Trustees BerhadPublic Ittikal Sequel Fund
17,504,400 0.31
30. Citigroup Nominees (Tempatan) Sdn. Bhd.Employees Provident Fund Board (CIMB PRIN)
17,424,100 0.31
Total 4,257,239,859 74.86
Statistics of Shareholdings

PROXY FORM29TH ANNUAL GENERAL MEETING (Before completing the form, please refer to the notes overleaf)
Number of Ordinary Share(s) held CDS Account No.
– –
I/We, _____________________________________________________________________________________________________________________________________________________(FULL NAME OF SHAREHOLDER AS PER NRIC/CERTIFICATE OF INCORPORATION IN CAPITAL LETTERS)
NRIC No./Passport No./Company No. ____________________________________ of ________________________________________________________________________________ (FULL ADDRESS)
__________________________________________________________________________________________________________________________________________________________ (FULL ADDRESS)
Telephone No. ________________________________________________
being a Member of Tenaga Nasional Berhad, hereby appoint:
FULL NAME OF PROXY AS PER NRIC IN CAPITAL LETTERS NO. OF SHARES PERCENTAGE (%)
Proxy1 or failing him/her
NRIC No./Passport No.:
Proxy2 or failing him/her
NRIC No./Passport No.:
TOTAL 100%
the *Chairman of the Meeting, as my/our proxy, to attend and vote for me/us and on my/our behalf at the 29TH ANNUAL GENERAL MEETING (29TH AGM) of TENAGA NASIONAL BERHAD (“TNB” or “the Company”) to be held at mySpace1@Ballroom, Level 3, The Malaysia International Trade & Exhibition Centre (MITEC), Kompleks MITEC, No. 8, Jalan Dutamas 2, 50480 Kuala Lumpur, Malaysia on TUESDAY, 14 MAY 2019 at 10.00 a.m. and/or at any adjournment thereof.
My/Our proxy is to vote as indicated below:
NO. RESOLUTIONS FOR AGAINST
ORDINARY BUSINESS
Re-election of the following Directors who retire in accordance with Clause 64(1) of the Company’s Constitution:
1. Tan Sri Leo Moggie ORDINARY RESOLUTION 1
2. Juniwati Rahmat Hussin ORDINARY RESOLUTION 2
Re-election of the following Directors who retire in accordance with Clause 63(2) of the Company’s Constitution:
3. Gopala Krishnan K.Sundaram ORDINARY RESOLUTION 3
4. Ong Ai Lin ORDINARY RESOLUTION 4
5. Datuk Ahmad Badri bin Mohd Zahir ORDINARY RESOLUTION 5
6. Dato’ Roslina binti Zainal ORDINARY RESOLUTION 6
7. Amir Hamzah bin Azizan ORDINARY RESOLUTION 7
8. Approval for payment of Non-Executive Directors’ fees for the Financial Year ended 31 December 2018 ORDINARY RESOLUTION 8
9. Approval for payment of the following Non-Executive Directors’ fees from 1 January 2019 until the next Annual General Meeting (AGM) of the Company:(i) Director’s fee of RM30,000.00 per month for the Non-Executive Chairman(ii) Director’s fee of RM20,000.00 per month for each Non-Executive Directors
ORDINARY RESOLUTION 9
10. Approval for payment of benefits to the Non-Executive Directors (excluding Non-Executive Directors’ fees) from the 29th AGM until the next AGM of the Company
ORDINARY RESOLUTION 10
11. Re-appointment of Messrs PricewaterhouseCoopers PLT as Auditors of the Company and to authorise the Directors to fix their remuneration
ORDINARY RESOLUTION 11
Please indicate with an “X” in the box provided for each Resolution as how you wish your votes to be cast. If no voting instruction is given, the proxy(ies) is/are hereby authorised to vote, or abstain from voting at his/her/their discretion.
*If you do not wish to appoint the Chairman of the Meeting as your proxy/one (1) of your proxies, please strike out the words “the Chairman of the Meeting” and insert the name(s) of the proxy(ies) you wish to appoint in the blank spaces provided.
Signature(s) or Common Seal of Member(s)Dated this day of , 2019

BOARDROOM SHARE REGISTRARS SDN. BHD.(formerly known as Symphony Share Registrars Sdn. Bhd.)
Level 6, Symphony HousePusat Dagangan Dana 1Jalan PJU 1A/4647301 Petaling JayaSelangor Darul EhsanMalaysia
AFFIX
STAMP
NOTES:
1. A member of a Company shall be entitled to appoint another person as his/her proxy to exercise all or any of his/her rights to attend, participate, speak and vote at a meeting of members of the Company, in accordance with Section 334(1) of the Companies Act 2016.
2. Only members whose names appear in the Record of Depositors as at 7 May 2019 shall be entitled to attend the AGM or appoint proxy(ies) to attend and/or vote on their behalf. There shall be no restriction as to the qualification of a proxy.
3. Where a member is an authorised nominee as defined in accordance with the provisions of the Securities Industry (Central Depositories) Act 1991, it may appoint up to two (2) proxies in respect of each Securities Account it holds with ordinary shares in the Company standing to the credit of the said Securities Account.
4. A member entitled to attend and vote at the Meeting is entitled to appoint not more than two (2) proxies to attend and vote on his/her behalf. Where a member appoints two (2) proxies, the appointments shall be invalid unless the proportion of the shareholdings to be represented by each proxy is specified.
5. The instrument appointing a proxy/Proxy Form shall be in writing under the hand of the appointer or of his attorney duly appointed under a power of attorney. Where the instrument appointing a proxy/Proxy Form is executed by a corporation, it shall be executed either under its common seal or under the hand of any officer or attorney duly appointed under a power of attorney.
6. A corporation which is a member may by resolution of its Directors or other governing body authorise such person as it thinks fit to act as its representative at the Meeting in accordance with Clause 51 of the Company’s Constitution.
7. Duly completed Proxy Form must be deposited to the Boardroom Share Registrars Sdn. Bhd., Level 6, Symphony House, Pusat Dagangan Dana 1, Jalan PJU 1A/46, 47301 Petaling Jaya, Selangor Darul Ehsan, Malaysia not less than twenty-four (24) hours before the time appointed for the taking of the poll or no later than 13 May 2019 at 12.00 p.m.
8. Pursuant to Paragraph 8.29A of the Main Market Listing Requirements of Bursa Malaysia Securities Berhad, voting at the 29th AGM of the Company will be conducted by poll. Poll Administrator and Independent Scrutineers will be appointed respectively to conduct the polling/e-voting process and to verify the results of the poll.
9. Registration of members/proxies attending the Meeting will start from 7.00 a.m. on the day of the Meeting and shall remain open until such time as may be determined by the Chairman of the Meeting. At the closure thereof, no person will be allowed to register for the Meeting nor enter the Meeting venue. Members/proxies are required to produce identification documents for registration.
1. Fold Here
2. Fold Here To Seal


TENAGA NASIONAL BERHAD (200866-W)
No. 129, Jalan Bangsar, 59200 Kuala Lumpur Tel: +603 2180 4582 Fax: +603 2180 4589 Email: [email protected]
www.tnb.com.my