Empowered lives. Resilient nations. - ReliefWeb
269
Empowered lives. Resilient nations.
-
Upload
khangminh22 -
Category
Documents
-
view
1 -
download
0
Transcript of Empowered lives. Resilient nations. - ReliefWeb

Empowered lives.Resilient nations.
Empowered lives.Resilient nations.
People in Asia-Pacific will be profoundly affected by climate change. Home to more than half of humanity, the region straddles some of the world's most geographically diverse and climate-exposedareas. Despite having contributed little to the steady upward climb in the greenhouse gas emissions that cause global warming, some of the region's most vulnerable communities — whether mountain dwellers, island communities or the urban poor — face the severest consequences.
Poverty continues to decline in this dynamic region, but climate change may undercut hard-won gains. Growing first and cleaning up later is no longer an option, as it once was for the developed countries. Developing nations need to grow and manage climate consequences at the same time. They must both support resilience, especially among vulnerable populations, and shift to lower-carbonpathways. Emerging threats, whether from melting glaciers or rising sea levels, cross borders and demand coordinated regional and global action.
There may be some uncomfortable trade-offs, but the way forward is clear — it lies in sustaining human development for the future we want. When people have equitable access to basics such as livelihoods, clean energy, health and pollution-free air, greater climate resilience and improved emissions management will follow. This report outlines where transformation can begin: in cleaner, more efficient production, in fair and balanced consumption, and in both rural and urban areas. Through better institutions, more accurate knowledge and changed attitudes, Asia-Pacific societies can find smarter strategies for adapting to a warmer world.
ONE PLANET TO SHARE
US$ 45
-
From the Human Development Report UnitUNDP Asia-Pacific Regional Centre, Bangkok
UNDP Asia-Paci�c Human Development FellowshipsAcademic
Objective: To encourage and strengthen capacity among Ph.D. students from UNDP Asia-Pacific programme countries to analyse issues from a human development perspective, contributing to cutting-edge research on theory, applications and policies.
MediaObjective: To develop capacity amongst media professionals from UNDP Asia-Pacific programme countries for enhanced reporting, dissemination and outreach campaigns to bring people’s issues to the centre of advocacy efforts.
Other Publications• Asia-Pacific Human Development Report on Gender Background Papers Series (2011)• Enforcing Rights and Correcting Wrongs: Overcoming Gender Barriers in Legal Systems (2011)• E-Discussion on Climate Change and Human Development (2011)• Benchmarking National Legislation for Gender Equality: Findings from Five Asian Countries (2010)• Building Security for the Poor: Potential and Prospects for Microinsurance in India — Second Edition (2009)• Challenging Corruption: Prioritising Social Services for Human Development (2009)• Estimating Sub-national Human Development Indices in the Presence of Limited Information: The Case of Bhutan (2009)• E-Discussion: Gender — Overcoming Unequal Power , Unequal Voice (2009)• Perspectives on Corruption and Human Development — Volume 1 and Volume 2 (2009)• Targeted Interventions Against Hunger: A Case for Preschool and School Feeding (2008)• Two Background Papers for the Asia-Pacific Human Development Report 2006: Trade on Human Terms (2008)• E-Discussion on Transforming Corruption through Human Development (2008)
Tools• Cracking the HDI: Human Development Indexing Exercise (Updated 2009)• From Development to Human Development: Tool for Applying the Human Development Perspective (Updated 2009)• Getting the Most Out of Feedback: Peer Review Guidelines (2007)• Surviving the Publication Process: Prepkit for Publications (2005)• Tool for Credit Rating of Micro Credit Recipients (2005)
For more information please visit: http://asia-pacific.undp.org
The cover design plays upon a traditional sepak takraw ball as a metaphor for
the Earth. Hand-fashioned from rattan and unique to Asia-Pacific, the ball
symbolises interconnectedness, resilience and creativity — leveraging these
can help deal with climate change, while ignoring them will affect human
development negatively. Climate change is a threat on a planetary scale.
People everywhere, especially the poor, are increasingly exposed to the
consequences of global warming regardless of where the causes originate.
The woven rattan represents how collaborating for collective good can result
in a harmonious future. Equally, humanity could go the other way — if
climate change is not managed in a coordinated way, it will unravel human
progress now and in the days to come.

One Planet to Share Sustaining Human Progress in a Changing Climate
LONDON NEW YORK NEW DELHI
Published for theUnited NationsDevelopment Programme
Empowered lives.Resilient nations.

© 2012by the United Nations Development ProgrammeUNDP Asia-Pacific Regional CentreUnited Nations Service Building, 3rd Floor Rajdamnern Nok Avenue, Bangkok, Thailand
ISBN: 978-0-415-62570-8Assigned UN sales number: E.12.III.B.2
British Library Cataloguing-in-Publication DataA catalogue record of this book is available from the British Library
All rights reserved. No part of this book may be reproduced or utilised in any form or by any electronic, mechanical or other means, now known or hereafter invented, including photocopying and recording, or in any information storage and retrieval system without permission in writing from the publishers.
First published in April 2012for UNDP by Routledge912 Tolstoy House, 15–17 Tolstoy Marg, Connaught Place, New Delhi 110 001, India
Routledge is an imprint of the Taylor & Francis Group, an informa business
Photo credits: The separators for chapters 1, 3, 4, 6, and the Indicators feature stills from the film Hard Rain, produced by DevTV and supported by the UNDP Asia-Pacific Regional Centre (APRC). Photos for chapters 2 and 5 separators were original entries to an exhibition on ‘Cities and Climate Change’, held in Bangkok to commemorate World Habitat Day 2011. The exhibition was jointly organised by APRC and UN-HABITAT, Bangkok Office.
Typeset byStar Compugraphics Private Limited 5, CSC, Near City ApartmentsVasundhara EnclaveDelhi 110 096
Printed and bound in India byNutech PhotolithographersB-240, Okhla Industrial Area Phase-I, New Delhi 110 020
The paper used in this publication is elemental chlorine free. It is manufactured with pulp supplied from sustainable managed forests.
UNDP partners with people at all levels of society to help build nations that can withstand crisis, and drive and sustain the kind of growth that improves the quality of life for everyone.

ASIA-PACIFIC HUMAN DEVELOPMENT REPORT TEAM
One Planet to ShareSustaining Human Progress in a Changing Climate
Team Leader
Anuradha Rajivan
Core Team
Caroline Borchard, Elena Borsatti, Supharat Kaewkhonkaen, Rohini Kohli, Panvipa Lekluanngarm, Niranjan Sarangi, Omar Siddique, Bishwa Nath Tiwari, Susan Wong
Statistics Team
Supharat Kaewkhonkaen, Panvipa Lekluanngarm, Niranjan Sarangi, Bishwa Nath Tiwari
Editor
Peter Stalker
Cover Designer
Rustam Vania
Publisher
Routledge, New Delhi, Taylor and Francis Group
The Human Development Report Unit
The Human Development Report Unit team members, both past and present, who worked on this collaborative effort are Caroline Borchard, Elena Borsatti, Ramesh Gampat, Supharat Kaewkhonkaen, Rohini Kohli, Panvipa Lekluanngarm, Pradeepa Malkanthi, Anuradha Rajivan, Niranjan Sarangi, Ruwanthi Senarathne, Omar Siddique, Gaya Sriskanthan, Bishwa Nath Tiwari, Manoja Wickramarathne and Susan Wong.


ABOUT THE ASIA-PACIFIC HUMAN DEVELOPMENT REPORT
The Asia-Pacific Regional Human Development Report (APHDR) is an important resource and instrument to explore critical development concerns. The Report informs policies and actions from a human development perspective, putting people at the centre of development debates. As a regional public good, the APHDR focuses on issues that are of common concern to several countries in the region, have sensitivities that are better addressed at a regional level, or have clear cross-border dimensions, calling attention to the fact that development challenges are no longer confined within geographic spaces.
The APHDR is an independent intellectual exercise developed through a regional participatory process that draws on the contributions of many. The theme for each Report is also selected through consultations that include participants within and outside UNDP. The more nuanced focus of the Report is guided by substantive and diverse inputs that bring together Asia-Pacific stakeholders from governments, civil society, academia, research institutions, the media, faith-based groups, the private sector and others. Technical sub-regional consultations are held to hear stakeholders’ perspectives and experiences relating to the theme; to sharpen the direction and scope of specific issues; and to promote early buy-in among the stakeholders. The stakeholders’ consultations provide wide opportunity for country representation through participant nominations sought through UNDP country offices in the region. Multi-stakeholder national workshops are also organised in selected countries, depending on the theme of the Report, to promote national buy-in for the APHDR.
Technical background papers are prepared by eminent experts drawn largely from the region. An established peer review process contributes to the quality and impartiality of the background research. The work is enriched by a moderated discussion on the Asia-Pacific Human Development Network, which comprises members from the region and beyond. Within the overarching framework of the Report, sub-themes are discussed to explore some fundamental debates, promote a dialogue and identify strategic policy solutions.
Drawing from this rich material, the Report is prepared by the Human Development Report Unit team. The team works in close collaboration with the relevant technical team, depending on the theme of the Report, and the regional communications team. At the preparatory stage, the emerging messages of the Report are presented in strategic forums as early advocacy for the Report and to obtain feedback from various stakeholders from the region. The draft Report is shared with HQ, UNDP country offices in Asia-Pacific, technical committee members including representatives of different UN agencies, readers’ groups including different practice teams, and the UNDP regional communication team for their views and feedback. The review process is critical for quality assurance and also helps to strengthen the Report’s messages.
The APHDR is disseminated widely, helping to promote dialogue and bring together the people of Asia and the Pacific to accelerate human development and advocate for its messages across the globe.


CONTENTS vii
Foreword xiii
Acknowledgements xv
Abbreviations xix
OVERVIEW 1
CHAPTER 1: The Human Cost of Climate Change 13
Asia-Pacific’s Development Dilemmas 16The Age of Man 16Transboundary Impacts 18Assessing Vulnerabilities 20Vulnerable Groups Bear the Brunt 21Endangered Livelihoods 26Forced to Move 27The Health Impact 28Resource Conflicts and Social Unrest 30Sustaining Human Progress in the Face of Climate Change 30
CHAPTER 2: Producing for the Future 35
Greenhouse Gases from Production 37Emissions Cost of Industry 38Lower-Carbon Industrial Pathways 43The Footprint of Agriculture 48Greener Opportunities for Agriculture 49Energy Generation and Trade-Offs 50Push for Cleaner Energy Sources 55Producing for the Future 60
CHAPTER 3: Fair and Balanced Consumption 63
Pressure on Food Supplies 66Lack of Access to Energy Services 66Changing Consumption Patterns 69Energy for Building the Resilience of the Poor 79Reorienting Lifestyles 81Taking a Different Path 86
CHAPTER 4: Raising Rural Resilience 89
Rural Vulnerability to Climate Change 91Resilient Livelihoods 95Preparing for Greater Risks 100Valuing Ecosystem Services 103
Contents

ASIA-PACIFIC HUMAN DEVELOPMENT REPORTviii
Strengthening Institutions for Local Climate Change Planning 109Towards Rural Resilience 116
CHAPTER 5: Building Greener Cities 119
Urban Vulnerability to Climate Change 122Protecting the Poorest Residents 127City Emissions of Greenhouse Gases 128Tackling Urban Emissions 132Readying Urban Institutions 137Altering the Course of Urban Progress 142
CHAPTER 6: Planning for the Planet 145
An Agenda for Action 152A Fainter Footprint 157
Technical Terms 159
Notes 165
Bibliography 177
BOXES
1.1 Millions of People Are Affected by Climate-Related Disasters: A Snapshot of Recent Events in Asia 20
2.1 Enforcing Environmental Regulations in India 422.2 Strategic National Policies and Regulations for Adapting Low-Carbon Production 452.3 Nuclear Energy: Safety and Public Choice 512.4 Nationally Appropriate Mitigation Actions (NAMA) of Developing Country Parties 593.1 How Climate Shocks Hit the Consumption of Rural Households 663.2 Values of Sustainability Provide Opportunities for Change 824.1 From ‘Hard’ Engineering to ‘Soft’ Ecological Restoration in the Yangtze River Basin,
China 1044.2 The Benefits of Locally Managed Marine Areas 1054.3 A Commitment to the Forest and Its People — REDD+ in Indonesia 1074.4 Budgeting for Climate-Resilient Development in India 1135.1 Urban Women and Climate Change 1235.2 Poor Communities in Indore, India, Adapt to Flooding 1245.3 Upgrading Slums in Thailand 1276.1 Children Teach Their Parents 1516.2 Developing Solutions Together: Intergovernmental Organisations in Asia-Pacific
Respond to the Climate Challenge 156
TABLES
2.1 Industrial Emissions by Fuel Use, Selected Countries, ’000 Tonnes, 2007 392.2 Food Production: Factors Affecting GHG Emissions 412.3 Overcoming Barriers to the Deployment of Energy-Efficient Technologies
and Practices 442.4 Agricultural GHG Emissions by Major Sources, South and East Asia, 2005 48

CONTENTS ix
2.5 Asia-Pacific Energy Production and Use, 2009 512.6 Percentage of Population with Access to Electricity and Modern Fuels,
Selected Countries, 2007 522.7 Availability of Low-Emissions Technology in Selected ASEAN Countries 552.8 Renewable Energy Promotion in Selected Asia-Pacific Countries 563.1 Percentage of Population Estimated below Minimum Level of Dietary Energy
Consumption, Selected Countries, 1990–92 and 2006–08 653.2 Cooking Fuel Used, Selected Countries 673.3 Range of Household Emissions by Fuel Source, Selected Countries, 2005, Tonnes
CO2e ’000s 683.4 Per Capita Household Expenditure, 1990–99 and 2000–09 693.5 Ownership of Consumer Goods, Selected Countries, Percentage of Households 713.6 Distribution of Households by Class and by Ownership of Selected Durables 723.7 Extent of Road and Rail Transport, Selected Countries 733.8 Per Capita CO2 Emissions by Country Income Category 753.9 Ecological Footprints, Biocapacity and Ecological Deficits, 2007 775.1 The World’s 20 Most Populous Urban Agglomerations 1215.2 Per Capita Emissions from Selected Asian Cities 1315.3 Asian Green Cities Ranking 132
FIGURES
1.1 Per Capita GHG Emissions of Different Groups of Countries, 1990 and 2005, MtCO2e 171.2 Share of Total GHG Emissions of Different Groups of Countries in the
Total World Emission, 1990 and 2005, Per Cent 181.3 GNI Per Capita (PPP$ 2005) in Countries of Asia-Pacific, 2011 211.4 Per Capita CO2 Emissions and GNI Per Capita of Countries 311.5 Per Capita CO2 and HDI Values of Countries 311.6 Global Scenario Projections: Energy-Related CO2 Emissions, 1970–2050 321.7 Carbon Intensity Trends across Regions, 1980–2007 322.1 GHG Emissions Sources in Developing Countries in Asia and the Pacific 372.2 Sources of Industrial Energy Use, Developing Asia-Pacific and the Rest of
the World, 2007 382.3 Energy Mix in Industry, Selected Countries, 2007 382.4 Energy Intensity of Industrial Output, Tonnes of Oil Equivalent, for
Selected Countries (1990, 2008) 402.5 Policies for Supporting Low-Carbon Technologies 452.6 Composition of Primary Energy Use in Asia and the Pacific, 1990–2006 502.7 Energy Users in Asia and the Pacific, 1990–2006 522.8 Human Development Index (HDI) and Per Capita Electricity Use:
A Positive Association 532.9 Carbon Intensity of Energy, Tonnes of CO2 per terajoule of TPES,
for Selected Countries (1990, 2009) 542.10 CO2 Intensity in Electricity Production, Selected Countries, 2010 542.11 Fossil and Non-Fossil Sources in Electricity Generation, Selected Countries,
2010–11 553.1 Population Deprived of Access to Modern Fuels 2007, Share of Asia-Pacific
in Comparison to the Rest of the World 673.2 Changes in Per Capita Expenditure, 1990–2000s, Bottom 20% and Top 20% 703.3 Change in Percentage of the Middle Class by Global Region, 1990–2008 703.4 Ownership of Motorcycles, Selected Countries, Percentage of Households 713.5 Meat Consumption, Grammes per Person, 1995–97 and 2005–07 74

ASIA-PACIFIC HUMAN DEVELOPMENT REPORTx
3.6 Dietary Protein and Fat Consumption, Grammes per Day per Person, 1990–92 and 2005–07 74
3.7 Average Fat Intake in India, Grammes per Person per Day, by Residence, 1972–73 to 2004–05 75
3.8 Per Capita Consumption and Per Capita CO2 Emissions in Asia and the Pacific, 2007 753.9 Per Capita Consumption and Per Capita CO2 Consumption Emissions
by Sector, 2001 764.1 Rural People as a Percentage of Total Poor (Living on Less than US$1.25 per Day) 914.2 Access to Water and Sanitation in Rural vs Urban Areas, Percentage of
Population, 2008 934.3 Share of Irrigated Land in Arable Land and Permanent Crops in South-East Asia,
Per Cent 974.4 Linkages between Ecosystem Services and Human Wellbeing 1034.5 Disappearing Forests in South-East Asia, 1970–90, and Extent of Deforestation
in Borneo, 1950–2005, with Projections towards 2020 1065.1 Urban Population Growth in Developing Asia-Pacific, 1990–2030 1225.2 Percentages of Urban Populations Living in Low-Elevation Coastal Zones, 2000 1225.3 Water Consumption and the Per Capita Income of Select Asian Cities 1255.4 Lower Rainfall Affects Both Urban and Rural Lives 1265.5 Access to Improved Sanitation by Global Region, 2006 1265.6 Sources of Greenhouse Gas Emissions in Bangkok, 2007 1285.7 Sources of Related CO2 Emissions from Energy Demand by Source in
Urban Areas as a Percentage of Total Energy Demand, 2005 129
SPECIAL CONTRIBUTIONS
My Climate, My Change 24 Fe’iloakitau Kaho Tevi (Fiji)Doing Growth Differently in the Context of Climate Change 47 Sunita Narain (India)Climate Change and Bhutan’s Sustainable Development Philosophy 78 H. E. Lyonchhen Jigmi Yoeser Thinley (Bhutan)Practise a Green Life, Starting Today 85 Zhou Xun (China)Facing Up to Climate Change: The Albay Experience 114 Governor Joey Sarte Salceda (The Philippines) How Cities Can Lead Efforts to Tackle Climate Change 130 Professor Tommy Koh (Singapore)Thinking Global, Acting Local: Makassar City’s Quest for Clean Air and Greening Urban Development 138 Ilham Arief Sirajuddin, Mayor of Makassar (Indonesia)
INDICATORS 207
Readers’ Guide and Notes to Tables 209
Human Development, Poverty and Inequality1 HDI and Related Indices 2172 Poverty and Inequality 218
Population3 Growth and Density of Population 2194 Location of Population 221

xiCONTENTS
Production and Employment5 Gross Domestic Product (Per Capita), Growth and Share by Sectors 2226 Labour Force Participation and Employment Rates 224
Education and Health7 School Enrolment and Literacy 2258 Access to Water and Sanitation 2269 Undernourished Population and Children, and Life Expectancy 227
10 Maternal, Infant and Child Mortality 228
Energy Supply and Use11 Energy Supply 22912 Sources and Use of Electricity 23013 Number of Vehicles, Cars and Carrier Departures 231
Greenhouse Gas Emissions14 Amount and Share of Major Greenhouse Gases 23215 Intensity of Energy Use and CO2 Emissions 233
Human Vulnerability to Natural Disasters16 Existing Stock of Natural Resources 23517 Impact of Natural Disasters 236
International Environmental Treaties, National Strategies and Plans18 Status of International Environment Treaties 23819 National Reporting, Strategies and Plans on Climate Change 239
STATISTICAL REFERENCES 241


xiiiFOREWORD
Foreword
Asia and the Pacific hosts more than half of the world’s population, including nearly 900 million of the world’s poor, and 30 per cent of the global land mass. This densely-populated region also accounts for a large share of the developing world’s deprived people: more than 70 per cent of people lacking access to basic sanitation, close to 70 per cent of underweight children, and 67 per cent of the extreme poor (living below $1.25/day). These large deprivations are compounded by geo-graphic exposure, climate-sensitive livelihoods and low capacity to recover from shocks.
Human beings can no longer continue to think of themselves as distinct from the envir-onment. They have been transforming nature for too long — notably by releasing huge quantities of fossil carbon. The consequences are a warmer earth, with melting glaciers, higher sea levels and altered cycles of precipitation and evapor-ation. Everyone in Asia and the Pacific is facing the impacts; the poor, who have contributed negligibly, much more so. In this regard, the region has a big challenge to reduce poverty and promote human development in the face of rapid climate change.
Unlike the developed countries of today, Asia-Pacific does not have the option to ‘grow now and clean up later’ in view of the already accumulated huge amount of greenhouse gases in the atmosphere. The region can further accelerate the accumulation because of its large size and rapid economic growth in recent decades. Although per capita emissions in developing Asia-Pacific remain low, total emissions are on the rise, stemming from diverse circumstances in the region and the continued need for bridging inequalities and improving living conditions. The share of Asia-Pacific developing countries in global greenhouse gas emissions increased from 23 per cent in 1990 to about 32 per cent in 2005, only 4 percentage points lower than that of high-income OECD countries in 2005. The share is expected to increase rapidly in view of the high economic growth, continued urbanization, changing life styles, and the consequent higher demand for energy in future. Between 2005 and 2030, compared with an estimated average
world increase in energy demand of 1.5 per cent, the rate in Asia and the Pacific is expected to be 2.4 per cent per year. Against this backdrop, the region has to follow a different growth path using energy-efficient technologies, cleaner sources of energy, and reducing carbon intensity of output more rapidly in years to come. It must do this not only because our shared planet is becoming unsustainable but also because Asia-Pacific itself will continue to be adversely affected by climate change.
The consequences of climate change have already been evident in terms of increased frequency and intensity of climate-induced natural disasters, and the impact is higher on the poor and vulnerable who contributed the least to the global warming. The region was disproportionately hit in terms of natural disasters: 45 per cent of the world’s natural disasters occurred in Asia-Pacific in the last three decades. The region was also disproportionately hit in terms of economic losses — though it accounted for 25 per cent of the world’s GDP, it suffered from 42 per cent of the total economic losses from disasters.
If emissions cross borders, so do some of the most affected natural systems, such as glaciers, coral reefs and mangroves. Some of them act as natural buffers to the impacts of climate change, but at the same time are increasingly at risk of deterioration and destruction. Melting of Himalayan glaciers, loss of mangroves, stress on coral reefs and desertification pose serious challenges to people living in vulnerable areas of the region, such as coastal and mountain regions. Communities are already adapting to climate challenges. For example, Bhutan’s Himalayan mountain dwellers are fortifying themselves against glacial lake outburst flooding. Island communities in the Pacific, such as in Kiribati, are looking at ‘migrating with dignity’ due to rising sea levels. Deltaic farmers along Asia’s great river systems, such as those found in Bangladesh, are adapting their agricultural practices to cope with increasing floods. Growing urban populations experience acute climate vulnerability too, as we saw during the recent floods in Bangkok. But the

ASIA-PACIFIC HUMAN DEVELOPMENT REPORTxiv
poor and vulnerable cannot adapt adequately to such climate shocks.
In this context, the report analyses the climate change impacts from the perspectives of mountain dwellers, delta communities, islanders, indigenous and tribal peoples and the urban poor. The report states that simultaneous action on both adaptation and mitigation is required for building resilient societies in Asia and the Pacific. The report calls for alternative sustainable development paths that fulfill the urgent human development needs of today while preserving a habitable planet. The world’s common future is going to be impacted largely by the choices this large and growing region can make today. The goal is clear: reduce poverty, but leave a fainter carbon footprint.
Technology, finance, knowledge and cooperation are required for leveraging these opportunities. Countries from the region, such as China and India, are investing in renewable energy and energy efficiency. Lower-carbon technologies will be instrumental to help adapt production processes to stabilise emissions, sequester carbon better, and improve the quality of rural and urban lives by supporting resilience. Now is the time to consider opportunities for cleaner energy generation and use so that our common future is not locked into using high-emitting technology.
Public interest should not be compromised by interest groups — accurate knowledge needs to be promoted. Building knowledge exchange networks could provide opportunities for sharing and learning best practices for better-informed choices by public and private organisations.
In sum, the report sees climate change as a development issue rather than primarily an environmental one. It argues for the centrality of far more inclusive growth that embeds resilience into the very fabric of change and addresses existing development gaps to strengthen the capacity of poorer societies to face global warming.
These actions are concrete and can infuse tangible ideas into upcoming fora that will shape the direction of global, regional, national and local actions.
The recently concluded conference of parties (CoP 17) in Durban followed by the upcoming Rio+20 conference deals with opportunities to bring issues such as poverty, equity and sustainability back into global development dialogue, grid-locked for years over contentious positions between developed and developing countries. The report hopes to be a knowledge resource for the region for these discussions, re-invigorating climate change dialogue by bringing people’s concerns to the fore.
Continuing the practice of the previous Asia-Pacific HDRs, this report — sixth in the series — has been prepared taking into account a diversity of voices from within the Asia-Pacific region. An array of consultations with governments, civil society and the private sector from across the region — East Asia, South Asia and the Pacific — as well as country-level discussions have informed the report. Backed by technical papers produced by experts mainly from the region, the report is prepared by an editorially independent team. We thank everyone from the region and beyond who have been with us in the journey of moving this report from ideation to culmination. Thanks particularly to the Human Development Report team with Anuradha Rajivan at the helm, for steering this report through analytically complex waters. I also thank the members of the Asia-Pacific Human Development Network (AP-HDNet), drawn from all corners of the region for their thoughtful and interesting contributions. We are indebted to our UNDP Administrator, Helen Clark, for her sustained commitment and support to human development. It is our hope that this report spurs debate on a more human-oriented dialogue on the climate challenge facing us all.
Ajay ChhibberUN Assistant Secretary-General
and UNDP Assistant Administrator and Director, Regional Bureau for
Asia and the Pacific
The analysis and policy recommendations of this Report do not necessarily reflect the views of the United Nations Development Programme, its Executive Board or its Member States. Mention of firm names and commercial products does not imply endorsement by the United Nations. The Report is an independent publication commissioned by the UNDP. It is the fruit of a collaborative effort by a team of eminent experts, stakeholders, and the Human Development Report Unit (HDRU) team of the UNDP Asia-Pacific Regional Centre, Bangkok, led by Anuradha Rajivan.

xv
A thoroughly collaborative process of consulta-tions and research was instrumental in defining the focus and the messages of this Asia-Pacific Human Development Report. It draws upon the perspectives and expertise of varied stakeholders from the region: governments, experts, academia, think tanks, the media, faith-based groups, the private sector and civil society organisations. Multilateral agencies have also participated in the process. From UNDP, the contributors include Country Offices from the Asia-Pacific; the Asia-Pacific Regional Centre, Bangkok; the Pacific Centre, Suva; the Regional Bureau for Asia and the Pacific; and the Bureau for Development Policy in New York. Those instrumental in shaping this Report are acknowledged below. We are grateful to so many that there could well be some inadvertent omissions — hopefully they are not many.
We would first like to thank past members of the core team who were part of the early stages of this work: Ramesh Gampat, Pradeepa Malkanthi, Ruwanthi Senarathne, Gayathri Sriskanthan and Manoja Wickramarathne.
We would like especially to thank Martin Krause as well as Alex Heikens, Sameer Karki, Faris Khader, Angus MacKay, Manuel Soriano, Yusuke Taishi, Thiyagarajan Velumail and the entire Environment and Energy Team at the UNDP Asia-Pacific Regional Centre for tech-nical inputs and ongoing support throughout the process. They were always generous with their time.
CONTRIBUTORS
Thematic technical background papers, special contributions and notes covering a wide range of issues have informed the Report. The prin-cipal contributors were: Patil Balachandra, Sultana Bashir, Anand Prathivadi Bhayankaram, Simon Billet, Brad Blitz, Alice Blondel, Clemens M. Brunhuel, Joan Carling, C. P. Chandrasekhar, Biplove Choudhary, Andrea De Angelis, Mahendra Dev, the Environment and Energy Team, the International Centre for Integrated Mountain Development (ICIMOD), Iqbal Khan,
Tommy Koh, Amitabh Kundu, Local Govern-ments for Sustainability (ICLEI), Monirul Mirza, Sunita Narain, Patrick Nunn, Joey Sarte Salceda, Ilham Arief Sirajuddin, R. Sudarshan, The Energy and Resources Institute (TERI), Fe’iloakitau “Fei” Tevi, Lyonchhen Jigmi Yoeser Thinley, Kazuyuki Uji and Zhou Xun.
Members of the United Nations family pro-vided specific inputs and advice. These are: IAEA, UNEP, UNESCAP, UNESCO, UNFAO, UN-HABITAT, UNICEF and UN WOMEN.
TECHNICAL CONSULTATIONS
The Report also draws on the ideas, feedback and opinions expressed in regional technical meet-ings as part of the Report preparation process. Ivo Besselink, Pieter Bult, Ajay Chhibber, Patrice Coeur-Bizot, Kumi Furuyashiki, Ramesh Gampat, Cherie Hart, Thomas Jensen, Moortaza Jiwanji, Rohini Kohli, Martin Krause, Angus Mackay, Andrew Mears, Roohi Metcalfe, Takaaki Miyaguchi, Anuradha Rajivan, Nicholas Rosellini, Omar Siddique, Preeti Soni, Yusuke Taishi, Jan-Jilles van der Hoeven, Gabor Vereczi, Susan Wong and Sun Xuebing were the participants. The Report also benefited from dialogues with local municipal bodies and private-sector repre-sentatives during the Fifth Asia-Pacific Urban Forum (APUF) held in Bangkok on 22–24 June 2011. These events were held in partnership with the CITYNET, Embassy of France in Thailand, ICLEI, LOGOTRI, the Rockefeller Foundation, UNEP, UNESCAP, UN-HABITAT, UNICEF and the World Bank.
STAKEHOLDER CONSULTATIONS
The Report benefited from rich and fruitful inter-actions with a wide cross-section of stakeholders in sub-regional (East Asia, South Asia and the Pacific) as well as country consultations. Stake-holders came from governments, academia, the media, the private sector, faith-based groups, CSOs, think tanks and UN entities. Partici-pants were Mohammad Sadegh Ahadi, Matai Akauola, Seema Arora, Seema Arsenio Balisacan,
Acknowledgements
ACKNOWLEDGEMENTS

ASIA-PACIFIC HUMAN DEVELOPMENT REPORTxvi
Mahesh Banskota, Ernesto D. Bautista, Sharon Bhagwan-Rolls, Jaya Bhanot, Anand Prathivadi Bhayankaram, Dinesh Bhuju, Ambrose M. R. Bituura, Tep Boonny, Elizabeth Boulton, Annie Brett, Winnie Byanyima, Cai Wenjia, Ewan Cameron, Malancha Chakrabarty, C. P. Chandrasekhar, Ram Prasad Chaudhari, Anjana Chellani, Chen Minpeng, Jakie Cheng, Dhrupad Choudhury, Ben Chutaro, Suzanne Chutaro, Patrice Coeur-Bizot, Gillian Cook, Cosmin Corendea, Yumi Crisostomo, Pradeep Dadhich, Resham Dangi, Pradip Das, Jope Davetanivalu, Andrea De Angelis, Anne-Isabelle Degryse-Blateau, Seema Deo, Balaka Dey, Rita Dhakal, Ajaya Dixit, Komara Djaja, Lam Dorji, Peter Emberson, Simalua Enele, Michael Foon, Fu Sha, Jai K. Gaurav, Prema Gera, Zachary Gidwitz, Luis Gomez-Echeverri, Dibya Gurung, Cherie Hart, He Jiankun, Goerild Heggelund, Alex Heikens, Brigitte Hoermann, Michael Honeth, Heremoni Suapaia-Ah Hoy, Htun Paw Oo, Kiran Hunzai, Immala Inthaboualy, Chanel Iroi, Kicom Ishighr, Jane Ishiguro, Srinivasan Iyer, Ramesh Jalan, Edlin Jash, T. Jayaraman, Dirk Jena, Thomas Jensen, Robert Jukham, Kifle Kahsai, Meenakshi Kaithel, Asfaazam Kasbani, Zammath Khaleel, Khampadith Khammounheuang, Arshad M. Khan, Nand Kishor, Muttaya Klinhun, Michael Kollmair, Sutharin Koonphol, Martin Krause, Pramod Krishnan, Pulak Kumar, Amitabh Kundu, Russ Kunn, Toily Kurbanov, Anupa Lamichhane, Margaret Leniston, Tubtim Limsoontorn, Ma Jian, Iosefa Maiava, Sumitra Manandhar, Deborah Manase, Ajay Mathur, Ritu Mathur, Prattana Meesincharoen, Roohi Metcalfe, Paula Meyer, Mona Mishra, Muhamad Nahar Hj. Mohd Sidek, Emele Morgan, Taito Nakalevu, Darren Nakata, Subinay Nandy, Napoleon Navarro, Koos Neefjes, Meena Negi, Junan Nimoto, Nishu Nirula, Bernard O’Callaghan, Thangavel Palanivel, L. M. S. Palni, Ruchi Pant, Jyoti Parikh, Himanshu Pradhan, Satya Priya, Batugedara V. R. Punyawardena, Abdul Qadir Rafiq, Atiqur Rahman, Anuradha Rajivan, Karma Lodey Rapten, Asenaca Ravuvu, J. S. Rawat, Felix Ries, Charmaine Rodrigues, Espen Ronneberg, Nicholas Rosellini, Inger Marie Rossing, Satyabrata Sahu, Sulaiman Shah Sallari, Emma Samman, Niranjan Sarangi, S. Satapathy, Andreas Schild, Alfred Schuster, Ruwanthi Senarathne,
Thomas Shanahan, Jaishree Sharma, Sonia Shrivastava, Amelia Siamomua, Omar Siddique, Sandeep K. Singh, Vijaya Singh, Siddharth Singla, P. S. Sodhi, Alexandra Solovieva, Preeti Soni, Jackson Soram, Jorn Sorensen, Peter Stalker, Joseph Stanley, Paul Steele, Surekha Subarwal, R. Sudarshan, Sun Xuebing, Sun Zhen, Apichai Sunchindah, Chitra N. Swamy, Pauline Tamesis, Nescha Teckle, Jorelic Tibon, Bishwa Nath Tiwari, Banzragch Tsesed, Ngedikes Olai Uludong-Polloi, Isikeli Valemei, Sann Vathana, Gabor Vereczi, Cynthia Villena, K. R. Viswanathan, Wang Dong, Wang Ke, Tony Weir, Caitlin Wiesen, Zenaida Willison, Garry Wiseman, Susan Wong, Nanette Woonton, Wu Peng, Yang Fang, Benedict Yumamura, Zhang Kunmin, Zhong Lijin and Zou Ji.
STATISTICAL WORK
The statistical team was led by Bishwa Nath Tiwari and comprised Supharat Kaewkhonkaen, Panvipa Lekluanngarm and Niranjan Sarangi. Comments provided by Caroline Borchard, Elena Borsatti, Rohini Kohli, Anuradha Rajivan, Omar Siddique and Susan Wong helped greatly.
REVIEWERS
The technical background papers as well as the draft Report were peer-reviewed internally by the Human Development Report Unit and the larger UNDP Readers’ Group comprising: Dipa Bagai, Jennifer Baumwoll, Rebecca Carman, Ajay Chhibber, Clifton Cortez, Alex Heikens, Kim Henderson, Thomas Jensen, Eva Jespersen, Moortaza Jiwanji, Sameer Karki, Faris Khader, Jeni Klugman, Milorad Kovacevic, Martin Krause, Angus Mackay, Khalid Malik, Denis Nkala, Paola Pagliani, T. Palanivel, Nicholas Rosellini, Manuel Soriano, Scott Standley, R. Sudarshan, Yusuke Taishi, Pauline Tamesis, Nescha Teckle, Pia Treichel, Veerle Vandeweerd, Thiyagarajan Velumail and Garry Wiseman.
The technical background papers and draft Report were also reviewed externally by: Mozaharul Alam, Sharon Bhagwan-Rolls, John Connell, Anil Markandya, Amita Shah, Mercedita A. Sombilla, Indra de Soysa, Gopal B. Thapa, Richard Welford, Anoja Wickramasinghe and David Zhang. The Report greatly benefited

xvii
from feedback by UNESCAP, UNESCO, UNEP, UNFAO, UN-HABITAT, UNICEF and UN WOMEN.
ASIA-PACIFIC HUMAN DEVELOPMENT NETWORK (AP-HDNET) CONTRIBUTORS
Stimulating and focused discussions on AP-HDNet were held from February to July 2010, which enriched the Report. We are very grate-ful to Pak Sum Low and Bernarditas Muller who moderated the network discussions. The contributors were: Khurshid Alam, Anand Prathivadi Bhayankaram, Maria Melinda Ando, Ernesto Bautista, Heather Bell, Sribas Chandra Bhattacharya, Tep Boonny, Trevor Booth, Elena Borsatti, Inga Fritzen Buan, Kumi Careme, Itzá Castañeda, Chew-Hung Chang, Hasna Cheema, Pornsook Chongprasith, Binoy K. Choudhury, Sarwat Chowdhury, Ioana Creitaru, Va Dany, Purnamita Dasgupta, Andrea De Angelis, Thanakvaro De Lopez, Patrina Dumaru, Nishadi Eriyagama, Hans-Martin Füssel, J. C. Gaillard, Ramesh Gampat, Ma. Consuelo Garcia, Jayati Ghosh, Ulrik Halsteen, Sven Harmeling, David Hastings, Gørild Heggelund, Stephanie Hodge, Aminul Islam, Ilan Kelman, Ohnmar Khaing, Kishan Khoday, Marcia V. J. Kran, Raj Kumar, Alain Lambert, Moisés Herrezuelo López, Pak Sum Low, Lu Qi, Tun Lwin, Shiming Ma, Angus Mackay, Kien Tran Mai, Pradeepa Malkanthi, Michele Martin, Sudip Mitra, Amitava Mukherjee, Bernarditas Muller, Gerardo Munck, Ranjani K. Murthy, Usha Natarajan, Koos Neefjes, Peter Neil, Bonheur Neou, Keith Openshaw, G. Padmanabhan, Anthony Patt, Paula Pons, Abdul Qadir Rafiq, Anuradha Rajivan, Ramachandran Ramasamy, Purba H. Rao, Mukul Sanwal, Niranjan Sarangi, K. Madhava Sarma, Lisa Schipper, Ruwanthi Senarathne, Pradeep Sharma, Ray Shirkhodai, Suchitra Sugar, Sonia Sukdeo, Sumitra Sundram, Amelia Supetran, Sukthawee Suwannachairop, Massimo Tavoni, Tim Taylor, Try Thuon, Linda Too, Mai Van Trinh, Manoja Wickramarathne, Wong Poh Poh, Susan Wong and Yang Youlin.
DRAFTING RETREAT
A significant milestone was the preparation of the first draft of the Report. A pre-drafting
workshop with the HDRU and the editor was held in Bangkok. The participation of Daniela Gasparikova, Martin Krause, Angus Mackay, Nicholas Rossellini, Surekha Subarwal, R. Sudarshan and Yusuke Taishi is gratefully acknowledged. The drafting retreat of the HDRU team was held in Korat, Thailand. We are thankful for inputs from the editor, Peter Stalker.
UNDP COUNTRY OFFICES
The following Country and Multi-country Offices provided feedback and support: Afghanistan, Bangladesh, Bhutan, Cambodia, China, Democratic People’s Republic of Korea, Fiji, India, Indonesia, Islamic Republic of Iran, Lao People’s Democratic Republic, Malaysia, Maldives, Mongolia, Myanmar, Nepal, Pakistan, Papua New Guinea, Philippines, Sri Lanka, Thailand, Timor-Leste and Viet Nam.
UNDP REGIONAL BUREAU FOR ASIA AND THE PACIFIC
The support of the Regional Bureau for Asia and the Pacific from initiation to finalising the text was key — we thank all colleagues. In particular, the Regional Strategic and Policy Unit coordinated the process at New York under Thangavel Palanivel, who, along with Scott Standley and Fatma Gül Ünal, provided sub-stantive inputs.
OTHER
We thank Aparna Basnyat, Radhika Behuria, Ruangkhao Ryce Chanchai, Biplove Choudhary, Joseph D’Cruz, Butchai Gaddih, Rui Gomes, Ramya Gopalan, Alex Heikens, Sanny Ramos Jagillos, Thomas Jensen, Sameer Karki, Tanni Mukhopadhyay, Midori Paxton, Alexandre Sarmento, Manuel Soriano, Yusuke Taishi, Pia Triechel, Thiyagarajan Velumail, Gabor Vereczi and Yumiko Yamamoto for providing substantive input to the background research.
Verania Andria, Bakhodir Burkhanov, Dorji Choden, Goerild Heggelund, Srinivasan Iyer, Sanny Remos Jegillos, Toily Kurbanov, Kamal Malhotra, Renaud Meyer, Subinay Nandy, Tsehring Pem, Yeshi Penjor, Adam Pitt, Budhi Sayoko, Preeti Soni, Beate Trankmann,
ACKNOWLEDGEMENTS
ASIA-PACIFIC HUMAN DEVELOPMENT REPORTxviii
Tomoyuki Uno, Claire Van der Vaeren, Dong Wang, Zhang Wei, Caitlin Wiesen, Garry Wiseman and Timothy Wong are gratefully acknowledged for facilitat-ing the Special Contributions.
PRODUCTION
The Operations Support Team at the UNDP Asia-Pacific Regional Centre provided admin-istrative services. The publishers Routledge, New Delhi, Taylor and Francis Group are acknow-ledged for copy-editing and overall production of the report. Star Compugraphics Pvt. Ltd is acknowledged for work on the layout. Thanks are due to Rustam Vania for design inputs.
ADVOCACY AND DISSEMINATION
The regional communications and advocacy team of Cherie Hart and Surekha Subarwal handled advocacy and dissemination for this Report. We are grateful to Sian Powell for her support to the Report’s media kit. Gretchen Luchsinger pro-vided additional editorial guidance and helped refine the Report’s messages. Peter Siris and Matthew Peter Clark developed the website.
We are grateful to David Galipeau and Ramya Gopalan of the Knowledge Management Team on using social media as a tool for widening knowledge exchanges on the report. Thanks are due to Maya Nyagolova and Supaporn Daophises for their support to dissemination.
OVERALL
We gratefully acknowledge the support, guid-ance and advice of Ajay Chhibber, UN Assistant Secretary-General and Director of the UNDP Regional Bureau for Asia-Pacific. His keen inter-est and very specific inputs helped in refining the content.
The work reflects the strategic guidance and dedication of Anuradha Rajivan; without her leadership this Report would not have been possible.
Nicholas RoselliniDeputy Regional Director
UNDP Regional Bureau for Asia and the Pacific

xix
ACCCRN Asian Cities Climate Change Resilience NetworkADB Asian Development BankAECEN Asian Environmental Compliance and Enforcement NetworkAMDGO Albay Millennium Development Goals Office (Philippines)AP-HDNet Asia-Pacific Human Development NetworkAPHDR Asia-Pacific Human Development ReportAPRC Asia-Pacific Regional CentreAPSEMO Albay Public Safety and Emergency Office (Philippines)ASEAN Association of Southeast Asian NationsCCA Climate Change AdaptationCCCI Cities and Climate Change InitiativeCDM Clean Development MechanismCER Certified Emission ReductionCET Clean Energy TechnologyCFL Compact Fluorescent LampCIRCA Centre for Initiatives and Research for Climate Adaptation (Philippines)CO2 Carbon DioxideCO2e Carbon Dioxide EquivalentCOP Conference of the Parties (UNFCCC)CRed Community Carbon Reduction Programme (UK)CSE Centre for Science and Environment (India)CSO Civil Society OrganisationDRR Disaster Risk ReductionEIA Energy Information Administration (USA)EIU Economist Intelligence UnitEU FLEGT Forest Law Enforcement, Governance and Trade Action Plan of the European
UnionFAO Food and Agriculture Organization of the United NationsFIT Feed-In TariffGBI Green Building IndexGDP Gross Domestic ProductGEF Global Environment FacilityGHG Greenhouse GasGLOF Glacial Lake Outburst FloodGNI Gross National IncomeGPS Global Positioning SystemGWh Gigawatt HourHDI Human Development IndexHDRU Human Development Report Unit HKH Hindu Kush-HimalayanIAEA International Atomic Energy Agency ICCTF Indonesia Climate Change Trust FundICIMOD International Centre for Integrated Mountain DevelopmentICLEI Local Governments for SustainabilityICT Information and Communication TechnologyIEA International Energy Agency
Abbreviations
ABBREVIATIONS

ASIA-PACIFIC HUMAN DEVELOPMENT REPORTxx
IFAD International Fund for Agricultural Development IFFCO Indian Farmers Fertiliser Cooperative LimitedIGIF Indonesia Green Investment FundILO International Labour OrganizationIPCC Intergovernmental Panel on Climate ChangeIPR Intellectual Property RightskWh Kilowatt HourLDC Least Developed CountryLED Light-Emitting DiodeLGU Local Government Unit LMMA Locally Managed Marine AreaLPG Liquefied Petroleum GasMAFF Ministry of Agriculture, Forestry and FisheriesMDG Millennium Development GoalMEGTW Ministry of Energy, Green Technology and Water MSME Micro, Small and Medium Enterprise Mt Million TonnesMtCO2 Million Tonnes of Carbon DioxideMtoe Million Tonnes of Oil EquivalentMW MegawattNAMA Nationally Appropriate Mitigation ActionNAPA National Adaptation Programme of ActionNCCCA National Conference on Climate Change Adaptation (Philippines)NDRC National Development and Reform Commission (China) NEDA National Economic Development Authority (Philippines)NGO Non-Governmental OrganisationNTFP Non-Timber Forest ProductODA Official Development AssistanceOECD Organisation for Economic Cooperation and DevelopmentOPEC Organization of the Petroleum Exporting CountriesPACC Pacific Adaptation to Climate Change ProjectPCT Patent Cooperation TreatyPES Payment for Ecosystem ServicesPIFS Pacific Islands Forum Secretariat PPP Purchasing Power ParityPV PhotovoltaicR&D Research & DevelopmentRECOFTC Regional Community Forestry Training Center for Asia and PacificREDD+ Reducing Emissions from Deforestation and Forest DegradationSAARC South Asian Association for Regional Cooperation SAR Special Administrative RegionSHS Solar Home SystemSID Small Island Developing StateSME Small and Medium-Sized EnterpriseSPREP South Pacific Regional Environment ProgrammeTERI The Energy and Resources Institute (India)toe Tonnes of oil equivalentTRIPS Trade-Related Aspects of Intellectual Property RightsUK United KingdomUN United NationsUNDESA United Nations Department of Economic and Social Affairs

xxi
UNDP United Nations Development ProgrammeUNEP United Nations Environment ProgrammeUNESCAP United Nations Economic and Social Commission for Asia and the PacificUNESCO United Nations Educational, Scientific and Cultural OrganizationUNFCCC United Nations Framework Convention on Climate ChangeUN-HABITAT United Nations Human Settlements ProgrammeUNICEF United Nations Children’s FundUNISDR United Nations International Strategy for Disaster ReductionUN-REDD United Nations Collaborative Programme on Reducing Emissions from
Deforestation and Forest Degradation in Developing CountriesUN WOMEN United Nations Entity for Gender Equality and the Empowerment of
WomenUS United StatesUSAID United States Agency for International DevelopmentUS$ United States DollarVAT Value Added TaxVSPP Very Small Power Producer Programme (Thailand)WBCSD World Business Council for Sustainable DevelopmentWHO World Health OrganizationWIPO World Intellectual Property OrganizationWRI World Resources InstituteWTO World Trade Organization
ABBREVIATIONS


ONE PLANET TO SHARE: OVERVIEW 1
OVERVIEW
Asia-Pacific not only has many of the world’s most climate-exposed territories, it is also home to millions of the most vulnerable people. The unprecedented pace and scale of human activities have been transforming the natural environment and contributing to climate change. Emissions cross borders, and so do some of the most affected natural systems, such as glaciers, coral reefs and mangroves. Some of these natural systems that act as natural buffers to the impacts of climate change are increasingly at risk of deterioration and destruction, posing a serious challenge to people’s lives in the region. While the most vulnerable people have contributed little to greenhouse gas (GHG) emissions, they will face some of the most serious consequences. They are not just highly exposed and sensitive to climate events, but also lack adequate adaptive capacity. Unlike the developed countries of today, in a time of climate change, growing first and cleaning up later is no longer an option. Developing nations must grow, support climate resilience, especially among vulnerable populations, and shift to lower-carbon pathways to sustain hard-won human development gains attained in the past decades.
While growth in Asia is important for the world economy as well as for poverty reduction in the region, Asia-Pacific is starting to contribute noticeably to the world’s emissions. Progress in overall human development has been accom-panied by increasing inequality and rising emissions. Developing countries of the region present a startling contrast: their combined per capita GHG emissions are among the lowest in the world, but their share of global emis-sions is almost one-third. The challenge is to reduce the emissions intensity of growth while simultaneously improving the access of people living in poverty to cleaner energy as well as far better infrastructure and services — essential not only for poverty reduction, but also to build resilience to the impacts of climate change.
Developing countries in the region have to navigate a two-fold prosperity–emissions dilemma that developed countries did not face in their earlier industrialisation:
More growth is essential but this will also increase emissions. In order to reduce poverty and vulner-ability, many countries in region will need more rapid and far more inclusive economic growth. But this will mean using more energy, and thus involve greater emissions. Development agendas will compete with concerns around growing emissions.
In a globalised environment, nation-states have less individual control over their own destinies. Ecology and economics are bypassing borders, making national actions alone insufficient to address the climate change challenge. Many of the richer consumers and growing businesses are able to shift emissions towards poorer locations as a result of globally dispersed and interlinked production and consumption chains. Less effective domestic institutions for environmental management make many poorer countries ecologically vulnerable.
People in the Asia-Pacific region, especially the poor, will face numerous and complex impacts from climate change such as change in precipitation, extreme weather events, drought, floods and sea-level rise. While much of today’s warming stems from past industrialisation, mostly in the developed economies, the coun-tries of Asia-Pacific will be most affected, as the region is home to more than half of humanity, including nearly 900 million poor. Addressing climate change is therefore a strong development imperative.
Unless climate change challenges are much more fully addressed, current progress will be difficult to sustain, and the brunt of the im-pacts will be faced by the poor of Asia-Pacific.
One Planet to ShareSustaining Human Progress in a Changing Climate
Asia-Pacific is home to
millions of the most vulnerable
people, who lack adequate
adaptive capacity
Unlike the developed
countries of today, in a time
of climate change, growing first
and cleaning up later is no longer
an option

ASIA-PACIFIC HUMAN DEVELOPMENT REPORT2
Despite uncertainties, the urgency is compounded as some of the losses could be irreversible, like damage to natural ecosystems — undermining the valuable services and livelihood opportun-ities they provide. While increasing inequalities linked to economic growth can largely be tackled within a country, managing rising emissions from globally interlinked human activities will not be feasible without synchronising national efforts with cross-border cooperation.
The unfinished development agendas in countries of the region provide opportunities to address climate change: Asia-Pacific developing countries are much less locked into traditional ways of production and consumption as com-pared with industrialised countries. In the face of a global downturn, Asia-Pacific has demonstrated economic resilience. Can it also improve the lives of its people while becoming more resilient to climate change? There are some positive signs. The carbon intensity of developing Asia-Pacific is decreasing, and countries like China and India have shown a growing realisation of the problem.
While all countries are exposed to climate change, they differ greatly in their sensitivity and their adaptive capacity to address its effects. But in all societies, the poor are particularly vul-nerable and have fewer options for managing risks. This is often because of where they live — in coastal regions, on river banks, in mountains and remote locations. In urban areas, they are often housed in hazard-prone slums. Apart from low incomes and assets, they also have inadequate transport and limited access to information and social services.
Among the groups most vulnerable to climate change are:
Mountain dwellers: Mountain communities have long been exposed to many kinds of envir-onmental stress, but now they have to adapt to more rapid and intense change. They could face more frequent and severe riverine floods, glacial lake outburst floods, droughts and landslides, among other phenomena.
Delta communities: Many people have settled in delta areas because of their fertile soils and ample water. But low-lying areas adjacent to large quantities of water involve serious risks, such as coastal inundation, soil erosion and the intrusion of saline waters into surface water and
groundwater. All these risks will be heightened by a rise in the mean sea level.
Islanders: Small island states and territories are particularly exposed to coastal inundation, soil erosion, the intrusion of saline waters into surface and groundwater, and other consequences of a rise in sea level that threatens infrastructure, settlements and livelihoods.
Indigenous and tribal peoples: Since they depend on fragile ecosystems, indigenous and tribal groups are highly susceptible to changes in the environment. They typically have a deep understanding of their surroundings, which enables them to adapt autonomously, and they have developed considerable resilience. But more rapid, large-scale changes can threaten their collective survival.
The urban poor: Those most affected in cities are households living in fragile dwellings in low-lying, exposed areas, with little or irregular access to basic services such as water, sanitation, health care, electricity and food supplies. The working poor in many cities are more likely to labour outdoors unprotected from the extreme weather, and are more exposed to climate-induced disasters, including flooding.
Within these groups, vulnerability varies by demographic, social and economic features, including gender, age and social status; and access to social services and knowledge. Among all groups, women face particular risks, since they are often managers and users of natural resources and primary caregivers. With little information and restricted rights and voice in decision making, they cannot fully use their skills and knowledge about local conditions, community wellbeing and the management of ecological resources.
These and other groups will face threats to their livelihoods, especially those groups that rely on climate-sensitive livelihoods like cultivation and fisheries. Cultivation will be affected by changes in temperatures, precipitation, including uncertain changes in rainfall, and in levels of CO2
concentrations. South Asia may be hit hard by these changes, with large declines in yields for almost all crops. Fisheries will be affected not only by changes in water temperatures, but also
Living in coastal regions, on river banks and in mountains, the poor have fewer options for managing risks; in urban areas, they are often housed in hazard-prone slums

ONE PLANET TO SHARE: OVERVIEW 3
by precipitation, salinity, ocean circulation, river flow, sea and lake levels, ice cover and glacial melt, and storm frequency and intensity.
As well as affecting livelihoods, climate change can threaten human health and survival. Much of the direct health impact of climate change will be experienced through mortality and injuries due to climate-related disasters, particularly floods, droughts and extreme weather events. Climate change can spur water-, food- and vector-borne diseases, notably dengue, malaria, diarrhoea and cholera. And increases in heat stress will particularly affect children and the elderly. People across the region will also suffer if climate change depresses agricultural productivity and increases food insecurity and malnutrition, particularly for children.
A further consequence of climate change is likely to be migration. Thus far, migration has often been temporary and seasonal, following agricultural and weather cycles. But future climate change could contribute to migration on an entirely new scale. Many people could relocate if the land can no longer support their livelihoods, or, in some cases, as in smaller island countries, because the land has disappeared altogether. In East, South-East and South Asia, a rise in sea level of 0.5–2 metres over this cen-tury could displace 53 to 125 million people. Already, some Pacific Islands such as the Carteret Islands of Papua New Guinea are considering evacuation of their populations.
Migration could also heighten social tensions over limited or shrinking resources. Asia-Pacific has already been widely affected by conflicts, and climate change can act as a threat multiplier. Conflict itself can also damage the environment and reduce resources, thus compounding the cycle of insecurity.
Despite potentially difficult trade-offs, meet-ing the challenges of climate change will be the only way to sustain existing human development gains and achieve new ones. A moral imperative exists as well, in ensuring equitable access to resources, both among people living now and for the generations to follow. There is a way forward. It involves producing for the future, balancing consumption, raising rural resilience and building greener cities.
One key imperative will be extending clean, efficient energy to everyone, but particularly to
vulnerable people. They will reap the greatest benefits in terms of human development and stronger resilience to climate shifts.
PRODUCING FOR THE FUTURE
The prospect of climate change should encour-age countries all over the world to reconsider how they produce — how they manufacture goods, raise crops and livestock, and generate energy. Industrial production is of particular concern for Asia-Pacific’s developing countries, as industries are producing more and using more energy. Around 26 per cent of greenhouse gas emissions come from industrial production.
Existing methods of emissions monitoring do not, however, take full account of value chains of production and consumption linked via inter-national trade. These chains enable developed countries with a commitment to reducing emis-sions to relocate their carbon-intensive industries to countries that have no, or low, caps on emissions — the problem of ‘carbon leakage’. Asian countries, anxious to boost domestic economic growth, have often welcomed multinational businesses, even those in ‘dirty’ industries. As a result, their emissions increase, though the output is destined largely for developed countries.
The benefits of exploiting common ecosys-tems or damages caused to the environment also go unrecognised — a classic public goods dilemma of being valuable but uncounted; costly but not charged. A country’s GDP measures little more than market transactions, and excludes the contribution of ecosystem services. These are typically regarded as ‘free’, even though replacing them would require massive investment. As a result, producers are generally not required to pay for the depletion of resources, or for carbon emissions or pollution. A first priority in mov-ing towards better environmental accounting would be to strengthen statistical systems to improve the tracking of emissions and the socio-environmental costs.
Another major concern is transport. The proportion of emissions from fuel combustion in transportation shows a rising trend. Between 1990 and 2008, the total amount of carbon dioxide (CO2) emissions from fossil fuel combustion in transportation in Asia rose by 161 per cent, as compared to the world average of 44 per cent.
Industries are producing more and using more energy; around
26 per cent of greenhouse gas emissions come from industrial
production

ASIA-PACIFIC HUMAN DEVELOPMENT REPORT4
Asia-Pacific countries are charting ways of moving to lower-carbon production, dealing with the trade-offs while considering how to sustain development that reaches the poor and the vulnerable. Many countries have started greening production, and have committed to nationally appropriate mitigation actions. For example, China has committed to lowering its emissions per unit of GDP by 40 to 45 per cent by 2020 compared to the 2005 level, and India has committed to lowering its emissions per unit of GDP by 20 to 25 per cent for the same period.
Lower-Carbon Pathways in Industrial Production
In the face of climate change, countries in Asia and the Pacific will need to change their methods of production. In particular, they will need to find better ways of generating energy and using it more efficiently. There is considerable scope. According to one estimate, deploying commercially available technologies and best practices on a global scale could save between 18 to 26 per cent of current primary energy use in industry. Industries that produce large volumes of GHGs, such as iron and steel, cement, chemicals, and pulp and paper, should be able to make significant progress while also taking advantage of the potential for CO2 capture and underground storage.
Greening production will mean using more renewable energy and low-carbon technologies while reducing the use of fossil fuels. For this purpose, governments in developing countries should take the lead in encouraging shifts to-wards cleaner energy generation. Private-sector investments are required to scale up and trigger innovation, while they need to recognise that new markets and efficiencies can be tapped. Mean-while, enlightened citizen-investors represented by investment institutions can hold companies to account, and better-informed citizens and the media can serve a watchdog role.
A number of countries have demonstrated the potential for moving to low-carbon production. In Japan, for example, the Top Runner Programme requires manufacturers and importers to in-crease the energy efficiency of goods. In China, enterprises that together account for around half of industrial energy uses have signed energy-saving responsibility agreements. And in Viet Nam, small and medium enterprises
in five key industries are receiving technical and financial support to install energy-efficient technologies.
Greener Opportunities in Agriculture
In Asia and the Pacific, around 30 per cent of emis-sions come from agriculture, including emissions from growing crops and raising livestock, land use changes and deforestation. The principal greenhouse gases are nitrous oxide, especially from the use of fertilisers; methane from live-stock and rice production; and CO2, which is released when soil is ploughed. Another source of CO2 emissions is deforestation — when trees are burned, harvested or otherwise die. Some of this is a consequence of logging or clearing land for pasture. But a key driver of deforestation is cultivation, either for food crops or for cash crops such as rubber, sugar cane, coffee and oil palm. As with industry, many of these emissions should be attributed to the consuming societies.
To meet growing food needs, Asia-Pacific countries will need to increase agricultural output while minimising emissions and protecting the natural environment. This will require renewed attention to agriculture, which in recent years has been relatively neglected. Giving farmers incentives to reduce carbon emissions from soil and deforestation is one priority. Another is assisting farmers in protecting themselves against the adverse impacts of climate change by adapting agricultural practices.
Countries across the region have demon-strated the potential for greener agriculture. Options include: reducing methane in rice production by flooding fields only for a certain number of days; zero-tillage farming to avoid releasing CO2 from soils; and sequestering carbon by burning crop residues at low temperatures to produce ‘biochar’, which can then be buried in the soil. Many more countries now recognise the value of afforestation and reforestation. Others have shown the potential of chemical-free, non-irrigated, organic agriculture.
Cleaner Sources for Energy Generation
In 2005, around 28 per cent of developing Asia-Pacific greenhouse gas emissions came from energy supply. Overall, around 85 per cent of the region’s primary energy comes from fossil fuels,
Countries need to find better ways of generating energy and using it more efficiently not just for economic development but also for alleviating poverty and improving human welfare

ONE PLANET TO SHARE: OVERVIEW 5
in the form of coal, natural gas and oil — a propor-tion that has not changed much over the years.
Across the region, the demand for energy is certain to grow to meet current development deficits. Around one quarter of people in the region’s developing countries lack electricity. There are also significant disparities in access between and within countries. Even households and businesses with electricity connections experi-ence frequent fluctuations and power cuts.
Countries need more energy not just for economic development but also for alleviating poverty and improving human welfare. Most Asia-Pacific countries are net importers of energy. They could use this more efficiently while looking for alternative sources. For power, this will mean switching from coal to natural gas, and using more renewable energy resources, including biomass, solar, wind, hydro and geothermal energy. These changes will need to happen very soon, since most investments in the new energy infrastructure are normally locked in for 40 to 50 years.
A number of countries make extensive use of renewable energy resources — Nepal and New Zealand, for example, generate more than 60 per cent of their electricity from hydropower and other renewable sources. But governments across the region have taken steps to promote the use of renewable energy, for example, by obliging energy utilities to purchase renewable energy and adopt feed-in tariffs. Indonesia has introduced these measures for small-scale renewable energy plants. Thailand has also used these incentives for small power producers who use biomass and other renewable resources. Singapore has offered guaranteed prices for power based on municipal waste.
The deployment of these new technologies can also be speeded up by North–South and South–South cooperation. For example, under the renewable energy action plan of the Government of Viet Nam, scientists have developed three new types of micro-hydroelectricity generators suitable for remote areas with excellent water flow. These have become popular in other Asian countries, such as Nepal, Papua New Guinea and the Philippines.
The energy sector has also been one of the main beneficiaries of the Kyoto Protocol’s Clean Development Mechanism (CDM). Viet Nam, for example, has had 34 registered CDM projects.
But the CDM has come under some criticism, including its effectiveness in technology transfer to developing countries, and it will be important to ensure objective assessment of the possible benefits, as well as opening it up more to the least developed countries.
FAIR AND BALANCED CONSUMPTION
Asia-Pacific has become the world’s dynamo of economic growth and a vast consumer market, but a very unequal one. The region is confronted not just by rising consumption and waste but also by chronic under-consumption: almost one quarter of the region’s people live in extreme poverty, on PPP $1.25 or less a day. The region is also home to a major share of the world’s population lacking electricity and modern fuels for cooking. Some people consume too little — in 17 countries, 10 per cent or more of the population subsists on inadequate diets. Other people aspire to the high-consumption lifestyles of the global consumer class. While millions of people still live in poverty, lacking many basic resources, economic growth has translated into higher overall household expenditure. Between the decades 1990–99 and 2000–09, global per capita household expenditure increased by 18 per cent, while in a number of Asian countries it increased far more rapidly — by 48 per cent in Cambodia, for example, and 92 per cent in China. At the same time, there has been a rise in inequality. This does not mean that the rich are getting richer and the poor are getting poorer, but rather that the rich are getting richer faster, while the poor are missing out on most of this rising prosperity.
Global experience indicates that, on average, as per capita incomes increase, carbon emissions also tend to rise. Going up the income scale of country groupings, the sharpest rise is between the middle- and high-income categories.
Asia-Pacific now has a substantial middle class that aspires to lifestyles that could prove unsus-tainable in the face of climate change. Defining a middle-class income as $2 to $20 per capita per day, between 1990 and 2008 the middle class rose from 21 to 56 per cent of the region’s popula-tion. Rising incomes have driven up global de-mand for processed food, water, transport, energy, housing and a wide range of consumer goods.
Asia-Pacific is confronted not just by rising
consumption and waste but also
chronic under-consumption

ASIA-PACIFIC HUMAN DEVELOPMENT REPORT6
One of the most visible signs of this expenditure is the growth in the number of cars. Between 1999 and 2009, the production of cars in India increased on an average by 15 per cent annually, and in China by 36 per cent. By 2020, China is expected to have nearly 225 million automobiles plying its roads; and by 2050, India could have 811 million. These increases will have implica-tions for emissions.
As the middle class earns more, they are also changing diets — for better and for worse. Responding to wider choices and to advertis-ing, households in the developing Asia-Pacific countries, particularly those with young people, are eating more, especially meat and dairy prod-ucts as well as processed food and drinks. The dietary transition includes a strong preference for meat. This has implications for climate change, as livestock is a significant contributor to global emissions.
Countries thus have to strike a balance between cutting back on the over-exploitation of their resources and simultaneously increas-ing consumption of energy services, better food, water and sanitation services that would enable poor communities to become more resilient. The region must also look ahead. Human development involves expanding choices for all, including the generations to come.
Energy for Resilience
Addressing the present levels of under-consumption of basics, such as adequate food, water, shelter, transport and energy services, will need to be prioritised so that communities not only improve their human development but are also prepared to withstand the additional challenges of climate change. An important part of this agenda is to increase access to modern energy services that are not only affordable but now need to be cleaner too. Access to energy is particularly critical — for example, of all the rural people in the world deprived of modern fuels for cooking, 63 per cent are from Asia-Pacific. Extending cleaner energy to the poor supports better emissions management in the process of building energy security. It is also crucial to adaptation, helping vulnerable people build resilience, diversify and secure their livelihoods, and obtain quality health care and education.
At present, much of the debate on energy remains entangled in the issue of rising con-sumption and associated emissions. Discussions tackle the likely trade-offs between emissions and growth, with less recognition of the levels of ‘under-consumption’ and the centrality of access to energy services in boosting human development, building resilience and helping communities adapt. While much remains to be done, a number of countries have demonstrated what is possible. In Viet Nam, for instance, between 1986 and 2009 access to electricity grew from about 10 to 97 per cent — with almost all households now connected to the grid.
Switching to Energy-Effi cient Technologies
Asia-Pacific presents a wide diversity of life-styles. While the poor need to improve their consumption levels, the middle classes and the rich need to orient their lifestyles towards lower-carbon pathways. All countries, rich and poor, will need to consider how to manage emissions better as part of the process of adapting to climate change and supporting disadvantaged groups in accelerating their human development. For the developing countries, this will involve producing and consuming more — but differently, recog-nising the limits of scarce resources and fragile ecosystems. Fortunately, these countries do not need to follow automatically the path taken by the rich economies: grow first, clean up later. Instead, they can choose directions that take finite natural resources into account, such as switching to more energy-efficient technologies.
Governments can help by facilitating access to cleaner technology through international part-nerships, and providing regulatory frameworks along with fiscal measures and incentives that influence private-sector and consumer behaviour. China, for example, has started a Green Lighting Programme based on compact fluorescent lamps. Since these lamps have been used mainly by richer urban consumers, in 2008 the government started to subsidise compact fluorescent lamps to make them more affordable.
Reorienting Lifestyles
In addition to using more efficient technologies, it will also be important to help consumers make
Countries have to strike a balance between cutting back on the over-exploitation of their resources and simultaneously increasing energy, water and sanitation services

ONE PLANET TO SHARE: OVERVIEW 7
more informed and greener choices. Local govern-ments, civil society and consumer organisations can help in this by providing information about the carbon emissions of products and services and the opportunities for sustainable lifestyles. Carbon-labelling initiatives, for example, can help consumers make greener purchases. But in cases of products exported from develop-ing to developed countries, the lack of such labelling should not become an excuse for trade restrictions that could negatively impact livelihoods, especially for the poor.
Values that emphasise sustainability in Asia also provide opportunities for behaviour change, and carry the seeds that can shape consumer choices. These jostle with the values of present-day rising consumerism. For example, concepts like the ‘middle path’ and newer ideas like the ‘sufficiency economy’ of Thailand provide entry points. Springing from local realities, they can provide avenues through which scientific knowledge can spur an array of climate-friendly choices in daily lives.
Tapping Co-benefi ts
While many people may change their behav-iour just to play a part in reducing emissions, most people are more likely to act if there are ‘co-benefits’ — such as cleaner water and less polluted air. Measures to switch from private to public transport will cut emissions and reduce traffic congestion. Another co-benefit is cost savings — for example, more CFL lighting can save costs while lowering emissions.
But there may not always be co-benefits. In some cases, there will have to be trade-offs, requir-ing some groups to give up privileges for the common good. This could occur, for example, by taxing high-energy consumer durables such as large cars or putting limits on the consumption of energy. Countries across the region already have some experience that can usefully be shared. Singapore, for example, has pioneered systems for managing transport, and in the Republic of Korea some homes and businesses receive incentives for reducing their consumption of electricity and water.
Campaigns for behaviour change can be particularly powerful when spearheaded by youth and children who are keen to take action themselves by saving electricity and reducing
waste. Viet Nam, for example, has a green youth movement, ‘3R’, which is promoting the principles of ‘reduce, reuse and recycle’.
Counting Emissions by Consumption
Progress in human development expands choices; it also enables people to consume more. As incomes rise in developing countries, it will be important to track greenhouse gases not just through production but also through con-sumption. Independent researchers can develop norms for emissions over the entire life-cycle of products and services. This will contribute to carbon-labelling initiatives and help richer con-sumers make greener purchasing decisions.
RAISING RURAL RESILIENCE
In Asia and the Pacific, around 60 per cent of people, and three quarters of the extreme poor, live in rural areas. Rural areas play an important part in Asia and the Pacific as the ‘food supplier and carbon sink’ for this fast-growing region. More than half the region’s economically active population and their dependents — amounting to 2.2 billion people — work in agriculture, fishery or forestry. But much greater investment in infrastructure, institutions and capacities will be needed to ensure that the rural poor will gain resilience to climate change. Significant disruptions to rural lives may come from higher temperatures or concentrations of greenhouse gases. Extreme climatic events can wipe out crops, reduce opportunities for employment, increase food prices and destroy property. They can also lead to deaths, injuries and diseases — and place additional burdens on poor households that lack insurance and safety nets. Repeated climate shocks will reinforce inequality and trigger powerful downward spirals in human development.
Governments in the region recognise the risks, but have yet to build these new scenarios into programmes for reducing rural poverty. At present, rural communities get relatively little support in terms of funds or services; for example, they find it difficult to market goods if they do not have all-weather roads and often do not have reliable and accurate knowledge of climate-related issues. In larger countries, national governments are seldom able to reach out to the poorest rural communities and islands.
While people may change their behaviour to play a part in reducing
emissions, most people are
more likely to act if there are
co-benefits

ASIA-PACIFIC HUMAN DEVELOPMENT REPORT8
And in some countries, communities on remote outer islands rarely receive visits from officials, and so are unaware of government policies on climate change.
Ultimately, the best way to make rural women and men more resilient to climate change is through more sustainable and inclusive rural development. Communities that are well educated and have reliable sources of income and equal rights will be in a much stronger position to adjust to new demands. They can work effectively with local authorities to achieve strategic and planned adaptation, and be a part of greater coordination to manage demands for scarce resources between rural and urban areas. Recognising the value of sustainable rural ecosystem management will be an opportunity to adjust the balance in favour of rural development.
Rural communities are also likely to be more resilient if they have a broader range of liveli-hoods. Traditionally, they have diversified from subsistence agriculture by cultivating household vegetable gardens, rearing a few livestock or run-ning small shops. But they can also adopt more modern farm practices as well as rural industries, handicrafts or, in some areas, eco-tourism. For this they will need better markets and economic opportunities that are climate-resilient, as well as stronger public services and infrastructure. These strategies should pay particular attention to gender equity; climate change affects women and men differently, and their skills and needs also differ. Women are still more dependent on agriculture than men, who have shifted in larger proportions to non-farm jobs. While gender gaps in primary education are beginning to close up, women tend to receive less further education and vocational skill training, especially in South Asia, which prevents them from pursuing livelihoods less dependent on natural resources. Women are also less likely than men to be reached by extension services to increase the resilience of agricultural livelihoods.
Linking Autonomous with Planned Adaptation
When it comes to adaptation, rural communities are not starting from scratch. They may have little access to information on climate science, and tend to react to immediate problems rather than anticipating future changes. Nevertheless,
they have a broad array of strategies for coping with climate variability; some have evolved over generations and centuries, others have been developed only recently in response to new climatic stresses. These include controls on the cutting of trees, diversifying to more resilient crops and readjusting the methods and timing of cultivation to cope with new circumstances.
More empowered communities can work effectively with local authorities to achieve more strategic, planned adaptation. Building on local knowledge can be more effective than intro-ducing completely new practices that might force poor people into high-risk transitions. Governments should be able to reinforce past experience with the growing body of scientific information.
As well as saving lives, it is also important to protect assets. The rural poor often live in sub-standard housing in dangerous locations. In rural areas, where structures are smaller and simpler, better standards can often be achieved through redesign and retrofitting. However, this will also require better planning to minimise new settlements in high-risk locations, such as those prone to flooding. Many of these options for adaptation will be ‘no-regrets’ initiatives: they will pay off under current conditions and bring even higher returns in the event of climate change.
Governments can also strengthen local re-sponses to disaster. Since external support can be slow to arrive, rural communities can also be encouraged to help themselves. To enable them to do so more effectively, they will need better community-based vulnerability and risk assessment planning, as well as financial support. Community-based disaster risk management programmes are thus an important entry point for climate change adaptation, bringing immediate benefits to already disaster-prone communities.
Rural communities can also make use of private-sector involvement. Companies could, for example, help small-holders get irrigation and other technologies that will help them cope with unreliable rainfall. They can also devise finance and climate adaptation insurance products for the poor and develop tools for risk management, scenario planning and disaster preparedness.
In some countries, planned adaptation is already under way, based on national processes like the National Adaptation Programmes of
Rural communities are likely to be more resilient if they have a broader range of livelihoods

ONE PLANET TO SHARE: OVERVIEW 9
Action and National Communications under the UNFCCC framework, regional disaster management and adaptation roadmaps, as well as countries’ national strategies and policies and action plans. These have largely concentrated on assessing the potential impacts and risks of climate change at a national level, paying rela-tively little attention to supporting the special needs of local institutions in rural areas.
Diffi cult Decisions
Climate change opens up many uncertainties and will demand difficult decisions. Policy makers have to assess their proposals carefully, look-ing at the potential trade-offs and the impacts on different vulnerable groups. They have to be aware, for example, that some adaptation strategies could create other challenges — increasing emissions of greenhouse gases, for example, or disproportionately burdening the most vulnerable, or limiting the choices avail-able to future generations. While one group benefits from a particular measure, others might lose. For example, many governments in the region aiming to increase energy supply and reduce dependency on fossil fuels have built hydropower dams. These large-scale projects can not only displace millions of rural people, but also alter river ecosystems, thus undermining the livelihoods of those living downstream and reducing their resilience to climate change.
Adaptation often requires long-term invest-ment — particularly for making rural infra-structure such as roads more climate-resilient. Poorer countries, as well as poorer households and individuals, will struggle to find the funds to invest today for what may be a distant benefit. Funds can come from a variety of sources. Ministers in the region have recommended that 5 per cent of local government budgets should be allocated for climate-sensitive disaster risk management activities at the local authority and community level. Local governments can also get top-up grants or performance-based grants and use these to provide incentives to households or businesses for responsible, climate-smart investments — for climate-proofing infrastructure, for example, or for home im-provements that contribute to household risk reduction.
BUILDING GREENER CITIES
The Asia-Pacific region has some of the world’s largest and most dynamic cities, which must deal with both the causes and the consequences of climate change. On the one hand, cities generate large quantities of greenhouse gases, mainly through energy consumption and local trans-port. At the same time, they are vulnerable to the effects of climate change, including flooding, extended heat waves and the destruction of key economic assets.
In a changing climate, many coastal cities are more exposed to storm surges, with those along major rivers inundated by floods that may have originated hundreds of kilometres away. Most sensitive of all are urban poor communities. Asian cities tend to be densely populated, and a high proportion of people live in slums and shantytowns occupying marginal land in flood-prone areas alongside rivers or even directly on watercourses, or on steep and unstable slopes.
Cities are also vulnerable by virtue of their complex systems. Dense, interacting networks of communications, power, transport and trade make cities prone to sudden disruptions — in supplies of electricity, for example, or of food. A failure in one system is likely to have knock-on effects for many others. Severe climate events can also damage key infrastructure vital for lucrative economic activities such as tourism, including air-ports, ports and roads, with corresponding losses of income and jobs. Climate change that results in droughts or floods will put sanitation systems under further stress, compromising hygiene and increasing the risk of water-borne diseases.
City dwellers are also particularly affected if climate change raises air temperatures or leads to more frequent heat waves. Urban activities consume energy and produce heat, much of which is retained in concrete and asphalt: the ‘urban heat island’ effect. All city dwellers experience this to some extent, but the working poor are especially vulnerable since they either spend their days labouring out of doors, or work indoors without fans or airconditioning.
City Emissions of Greenhouse Gases
As well as suffering from the effects of climate change, cities are themselves adding to global
Asia-Pacific has some of the world’s largest
and most dynamic cities which must
deal with both the causes and the
consequences of climate change

ASIA-PACIFIC HUMAN DEVELOPMENT REPORT10
warming as major emitters of greenhouse gases. While city-level emissions data do not exist for most cities, by one estimate, cities globally occupy only 2 per cent of land, yet contribute more than two-thirds of greenhouse gases, primarily through transportation and the use of electricity.
Around one-third of emissions are from trans-portation. This includes private cars, motorcycles, road freight and public vehicles. A number of Asian cities now have well-functioning metro train systems, but many city dwellers still rely on buses, which are often poorly maintained and can contribute significantly to both greenhouse gas emissions and air pollution. As incomes rise and more people buy cars, the emissions will rise even faster.
With rising affluence, Asia-Pacific cities are gen-erating increasing volumes of solid waste, which they typically burn or dump in landfills. Much of this waste emerges from richer households. Poor communities also generate waste, but on a smaller scale, and they are more likely to reuse and recycle. Since slum areas seldom have effective services for waste collection, rubbish accumulates in canals, along roadways or in open ditches, which affects public health.
Dynamic Urban Adaptation
Cities are centres of dynamism through innova-tion and investment, and can learn to navigate newer, carbon-efficient pathways and adapt to a warmer world. Relatively few city administra-tors appreciate the full implications of climate change, however, and, even if they do, they may not have the institutional frameworks, tech-nical capacity or governance arrangements to respond adequately. Then there is the question of cost. Not all municipalities have strong local revenue bases, and national decentralisation systems typically devolve responsibilities to city administrations without transferring commen-surate fiscal resources or authority.
Fortunately, across the region elected city lead-ers who often have considerable autonomy have taken positive initiatives. From a human devel-opment perspective, their main task is to protect the poorest residents, helping people gain better incomes and housing, and providing sufficient so-cial protection, while fully incorporating the voices of both men and women in decision making.
At the same time, poor communities can better protect themselves from urban climate disasters even with small improvements to their houses and by making use of insurance pro-grammes linked to climate disaster.
Seeking Carbon-Effi cient Paths
Cities should also have the skills and capacity to adopt more carbon-efficient paths. Across Asia and the Pacific, urban governance institutions are starting to work with citizens on reducing greenhouse gases. Doing this on a large scale will involve a longer-term change in attitudes. Until then, the strategy should be to focus on initiatives that bring immediate benefits by improving the quality of urban life — through less pollution, for example, or a reduction in traffic congestion, or the creation of more pleasant urban spaces. City governments can also encourage climate-friendly energy use, more efficient transport, greener buildings and better waste management.
Finance for these activities can come from city budgets and user payment systems. Cities can also consider innovative market-based mechan-isms and strengthen ‘green’ partnerships with the private sector. External donor agencies can make funds available to complement national and local sources.
Knowledge cannot be taken for granted — not just knowledge about climate change, but also about options to manage it to improve people’s quality of life. Given the many interest groups with a stake in the status quo, building awareness based on access to accurate information is important. Cities can also benefit from sharing knowledge and cooperating more widely across borders. Internationally, they can share experiences through the Local Governments for Sustainability (ICLEI) initiative, the Asian Cities Climate Change Resilience Network (ACCCRN), the Cities and Climate Change Initiative (CCCI) and the C40 climate leadership group. These, as well as city twinning programmes, can enable South–South collaboration to exchange knowledge and technology and to develop advocacy positions. Cities can benefit from the relevant experiences of local, national and international NGOs as well as research organisations and capitalise on these to alter the course of urban development and move in lower-carbon, greener directions.
City governments can encourage climate-friendly energy use, more efficient transport, greener buildings and better waste management

ONE PLANET TO SHARE: OVERVIEW 11
PLANNING FOR THE PLANET
The world cannot turn back the clock or aim unrealistically for zero emissions. Societies need to focus less on emissions per se, and more on managing emissions for humanity to survive and thrive over generations through inevitable change. This requires not just clean energy but equitable access to energy, not just conserving trees but securing livelihoods, not restricting mobility but enabling transport for all. A funda-mental rethink needs to take place, based on a shared recognition that the planet’s natural resources are not free or inexhaustible. For all countries, managing development differently will require open and honest debate, including identifying the barriers to change. Some bottle-necks are:
Institutional mismatch: The basic unit of governance remains the nation-state, while climate change is borderless. Domestic control over climate change is also limited by globally interlinked economic and ecological value chains. Moreover, democratically elected governments may have limited time horizons, which reduce their incen-tives to focus on long-term issues. International mechanisms can get locked into a ‘rich country’ versus ‘poor country’ dichotomy.
Slow changes in attitudes: People will have to rapidly re-examine and modify old ways. This is harder than adjusting more slowly. There can be understandable reluctance to change familiar ways of doing things. Others may consider climate change to be an issue far removed from their lives. Or they may see global warming as inevitable and do nothing. Public opinion can also be deceived by corporate ‘greenwashing’ — intensifying green rhetoric rather than adopting environmentally sound practices.
Inadequate assessment tools: National data systems are unsuitable for tracking a cross-border phe-nomenon in which producers and consumers are geographically dispersed. Official data systems have yet to consider alternative tools like tracking emissions by consumption groups, or by rich and poor people, rather than by countries.
Governments will need to assess the suitability of existing institutions. At the national level,
this will entail ensuring better coordination between ministries, merging them if necessary. More effective planning and decision making should enable local administrations to articu-late priorities for adaptation and infrastructure. Going beyond electoral politics, deeper and wider participation is needed that extends beyond parliaments to the larger civil society, where climate change issues can also be debated by competitive media, for example, and through social networks. More inclusive participation can expand political voice and reveal who is bearing the costs of climate change. Actions by user groups can influence the use of land and water, and trigger the use of technologies that respond better to local complexities.
Actions on the ground need not wait for international agreements. While global con-sensus on common directions is important, the private sector, municipalities, civil society and individuals can already take an array of steps that accelerate change. As these initiatives grow in number, they can galvanise government commitment to cooperate better for the good of humanity.
While continuing to push at the larger, struc-tural barriers of institutions, attitudes and assess-ments identified so far, developing countries in Asia-Pacific can identify priority actions that meet local needs. This Report suggests four priorities:
Encourage the Transition to Green Technologies
Governments, international agencies and regional bodies can promote green technologies for more efficient and cleaner processes in energy, agriculture and transport. Through regulations and fiscal incentives, governments can encourage the private sector and individuals to switch to green technologies. Some of the technology is already available, and can be transferred through North–South and South–South cooperation. But governments and the private sector will also need to invest in local capacity to ensure that these technologies are used widely — for example, through retraining workers while avoiding job losses. Households can also consider using green technologies — the use of photovoltaic technology, for example, can be supported by feed-in tariffs.
While global consensus
on common directions is
important, the private sector,
municipalities, civil society and individuals can
already take steps that accelerate
change

ASIA-PACIFIC HUMAN DEVELOPMENT REPORT12
Expand Sources of Finance
Governments and private actors should harness all potential sources of finance — domestic and international, public and private. Domestic fiscal policy such as carbon taxes and levies can encourage more efficient use of energy, as well as generating revenue for addressing vulnerability. Although public sources of finance through taxes, fees, efficiency gains and lower subsidies may be limited, they can be leveraged to garner growing and varied private sources. Developing countries in Asia and the Pacific should also look further to the globally available public and private funds channelled through multilateral and bilateral agencies. Emissions trading under the Kyoto mechanism could help developing countries have improved access to finance. The REDD+ initiative, if managed well, could contribute to rural resilience while controlling emissions. Additional measures should foster greater equity and voice for developing countries in their access to climate change finance. Developing countries also need domestic reforms in policies and in-centives that would facilitate the public sector’s ability to leverage private finance.
Addressing the many facets of climate change in the process of development requires effective use of domestic public finance to the fullest extent possible. Measures such as increasing taxes or reducing subsidies require strong political commitment. With greater awareness and improved governance, citizen support will bolster political will.
Strengthen Knowledge to Shape Low-Carbon Preferences
Action on climate change should be built on a common knowledge base derived from independent and credible sources that people can use to shape their preferences and actions.
These include North–South and South–South exchanges between universities and research organisations. Governments and media can disseminate the latest information as a high priority. For farmers, for example, this would include seasonal weather forecasts to help them plan planting and harvesting. Consumer organisations can also provide non-partisan information to help buyers make greener and safer choices.
Join Forces across Borders
Concerted action to address climate change requires cooperation and coordination on trans-boundary issues. Combining endeavours can eliminate duplication of efforts, enhance fund-ing directed at adapting to climate change, and foster sustainable and more creative problem solving. Even as countries cooperate interna-tionally, however, they need to take domestic action for fairer impacts on the ground. Gov-ernments and regional organisations can sign up to international agreements that take full account of Asia-Pacific concerns. These should cover cooperation on conservation and protection of ecosystems, technology transfer, water policies, forest management and disaster management. Cooperation is important within countries too — local governments can take progressive steps to cooperate by learning from each other’s experi-ences on the ground, the specific pitfalls faced, innovative financing strategies to support adap-tation and practical entry points that work.
People have been transforming nature at an unprecedented pace — human activity is affecting the one planet we have to share. The only alternative is to follow a more sustainable path that fulfils the urgent human development needs of today while preserving a habitable planet. The goal is clear: reduce poverty, but leave a fainter footprint.
Concerted action to address climate change requires cooperation and coordination on transboundary issues
The goal is clear: reduce poverty but leave a fainter footprint

1THE HUMAN COST OF CLIMATE CHANGE

Treat the earth well:it was not given to you by your parents,it was loaned to you by your children.We do not inherit the earth from our ancestors, we borrow it from our children.
Ancient proverb
1 THE HUMAN COST OF CLIMATE CHANGE 15
1THE HUMAN COST OF CLIMATE CHANGE
Asia and the Pacific has more than half of the world’s population,1 including nearly 900 million of the world’s poor,2 and 30 per cent of the global land mass.3 Its size and remarkable ecological diversity mean that climate change will not only have enormous and varied impacts in the region, but will also carry implications around the globe. Many Asia-Pacific societies can already see the impacts of global warming, whether melting glaciers, sea-level rise or more frequent storms and floods.
The region has recorded considerable pro-gress in human development and demon-strated resilience in the context of the recent global economic downturn. During the last three decades, the Human Development Index (HDI) values for South Asia and for East Asia and the Pacific increased by over 50 per cent, in comparison to an increase of 22 per cent world-wide.4 Several countries in Asia-Pacific have graduated to the middle-income country category. Poverty is declining, yet challenges remain — 60 per cent of the global population surviving on less than $1.25 a day lives in five populous middle-income countries, of which four are in the Asia-Pacific region — China, India, Indonesia and Pakistan.5 The region has emerged as a global workshop for manufacturing, contributing to meet consumers’ needs elsewhere. While growth in Asia is important for the world economy, the region is starting to contribute noticeably to the world’s emissions. Progress in overall human development has been accompanied by increasing inequality.
The extent of warming is difficult to predict, due to the remarkable complexity of the earth’s
The region has emerged as a
global workshop for manufacturing,
contributing to meet consumers’ needs elsewhere
The region has emerged as a
global workshop for manufacturing,
contributing to meet consumers’ needs elsewhere
climate system, and uncertainty about how human-ity will control emissions. But this much is clear: the earth is getting warmer, and much of it is a result of human activity. People in the region, especially the poor, will face numerous and com-plex impacts from climate change, such as:
Changes in precipitation: Rainfall patterns are expected to change, with the main rainfalls occurring earlier or later in the year, or shifting from one area to another, while the intensity of rainfall events is also likely to increase.
Drought: Delays in the monsoon often linked to El Niño events can lengthen the dry season, leading to seasonal droughts.
Extreme weather events: The region is likely to see more intense weather extremes, in the form of waves of heat, droughts, floods and extreme rainfall. A warming trend in daily temperature extremes in Asia is expected with medium confidence.6 There is already evidence of such changes — in the Pacific, for example, in recent years, tides and El Niño–Southern Oscillation effects7 have contributed to more frequent high coastal water levels and associated flooding on some islands.8
Flooding: Floods can be caused by a number of factors, including intense and/or long-lasting precipitation, high tides, tidal waves and snowmelt. The retreat of glaciers and loss of snow cover in the uplands will increase river flows, leading to floods, including those from glacier lake outbursts.
Asia and the Pacific will be profoundly affected by climate change. The region has many of the world’s most climate-exposed territories, as well as millions of the most vulnerable people. While the latter have contributed little to greenhouse gas emissions, they will face some of the most serious consequences. Indeed, climate change threatens further progress in poverty reduction and it could also render already hard-won human development gains unsustainable. For developing countries in the region, growth needs to continue and become far more inclusive. But unlike the past experience of today’s industrialised world, countries in Asia-Pacific now have to strike a balance between rising prosperity and rising emissions. Their success or failure will have repercussions worldwide.

ASIA-PACIFIC HUMAN DEVELOPMENT REPORT16
Sea-level rise: If emissions remain low, compared with 1980–99, the global average sea levels are projected to rise by 0.18–0.38 metres by 2090–99. If emissions cross a higher threshold, the projected rise will be 0.26–0.59 metres.9 Among regions, by 2050 the impact of half-a-metre rise is estimated to be the largest in East Asia and the Pacific, affecting more than 63 million people.10
All of these climate impacts are intricately intertwined and will alter human development outcomes. While much of today’s warming stems from past industrialisation, mostly in the developed economies, present and future emis-sions will affect generations to come.
Unless climate change challenges are fully addressed, current progress will be difficult to sustain. While rising inequalities linked to economic growth can be tackled mostly within each country, managing rising emissions from globally interlinked human activities will not be possible without synchronising national efforts through cross-border cooperation.
ASIA-PACIFIC’S DEVELOPMENT DILEMMAS
How can the region address the implications of climate change while continuing to maintain a focus on human development? Developing countries have found it hard enough to tackle poverty. They now have to do so in a time of climate change. Not only do they have to meet the climate-related costs of reduced biodiversity, loss of valuable ecosystem services, constraints on people’s livelihoods, food insecurity and ill-health, but they also have to extend extra support to vulnerable groups.
The aim is not to tackle emissions per se, but to do so for human societies to survive and prosper through inevitable change. Developing countries in Asia and the Pacific have to navigate a prosperity–emissions dilemma that developed countries avoided in their earlier industriali-sation. The dilemma is two-fold:
More growth is essential but this will also increase emissions: In order to reduce poverty and vulner-ability, many countries in the region will need more rapid and far more inclusive economic growth. But this will mean using more energy,
The aim is not to tackle emissions per se, but to do so for human societies to survive and prosper through inevitable change
The aim is not to tackle emissions per se, but to do so for human societies to survive and prosper through inevitable change
and thus involve greater emissions. Development agendas will compete with concerns around growing emissions.
In a globalised environment, nation-states have less control over their own destinies: Ecology and eco-nomics are bypassing borders, making national action alone insufficient to address the climate change challenge. Many of the richer consumers and growing businesses are able to shift emissions towards poorer locations as a result of globally dispersed and interlinked production and con-sumption chains. Less effective domestic insti-tutions for environmental management make these poorer countries ecologically vulnerable.
THE AGE OF MAN
We may now be living in the anthropocene era — the age of man — in which the sheer scale of human activities is not only transforming the natural environment, but also changing how it functions and interacts with people.11 Historically, industrial development has har-vested economic gains at the expense of the natural environment, releasing vast quanti-ties of fossil-based carbon that the planet had locked up over millions of years. As well as burning vast quantities of fossil fuels, economic growth has involved constructing big dams, eroding deltas, clearing forests, building cities, changing ocean chemistry and interfering with the course of nature in a multitude of ways to enable people to live in overall material abund-ance as never before. Ecosystems increasingly carry the mark of human presence. By 2006, 47 per cent of South-East Asia’s peatlands had been deforested and mostly drained,12 and 17 per cent of Asia’s drylands had been degraded.13 Freshwater supplies are declining in quality and quantity.14
There has been a significant rise in the con-centration of the three principal greenhouse gases. Between 1750 and 2005, the concentra-tion of carbon dioxide (CO2) rose from 280 to 379 parts per million (ppm); that of methane from 715 to 1,774 parts per billion (ppb); and that of nitrous oxide from 270 to 319 ppb. The fastest CO2 growth rate was during the period 1995–2005 — 1.9 ppm per year.15 Without deter-mined efforts towards emissions management,

1 THE HUMAN COST OF CLIMATE CHANGE 17
atmospheric concentrations will continue their inexorable rise.
This global increase in greenhouse gas con-centrations has been accompanied by rising temperatures. Over the 100-year period ending 2005, average global surface temperatures rose by 0.74°C.16 Moreover, the pace of global warming appears to have accelerated: according to the World Meteorological Office, the 10 warmest years since 1854 have all occurred since 1998.17 And if greenhouse gas emissions continue un-checked between 1980–99 and 2090–99, global average surface air temperatures could increase between 1.8°C and 4°C.18
Like other developing regions, Asia-Pacific must endure the legacy not just of its own more recent industrialisation, but also that of accu-mulated emissions dating from the industrial-isation of Europe and North America. No doubt the built-up greenhouse gases in the atmosphere today are the result of the cumulative develop-ment in industrialised countries. The important principle of ‘common but differentiated respon-sibility’ under the UN Framework Convention on Climate Change (UNFCCC) recognises the historical differences in the contributions of developed and developing countries to the earth’s environmental problems, as well as the differences in their capacities to respond effect-ively. This implies that those with greater capacity and greater historical responsibility have a greater obligation to act in responding to climate change. Similar ideas based on equity can shape our understanding of the links between high-end consumers and the poor within countries.
At the same time, it is becoming increasingly evident that without lowering the current rate of worldwide emissions, all societies will face adverse climate-related consequences — regardless of the source of emissions. Both developed and developing countries need to respond to climate change by pursuing lower-carbon pathways.
Asia-Pacifi c Has Relatively Low Per Capita Emissions
In developing Asia-Pacific countries, emissions per capita on average remain relatively small — mainly as a consequence of their relatively low in-dustrial development, as well as the low access to energy by large shares of their populations. In 2005, per capita emissions in Asia-Pacific developing
countries were estimated at just 4 million tonnes of carbon dioxide equivalent (MtCO2e), much lower than those of the Asia-Pacific high-income countries at 14 MtCO2e, or the high-income Organisation for Economic Cooperation and Development (OECD) countries at 16 MtCO2e (Figure 1.1). They were also lower than the per capita emissions of the world (7 MtCO2e). There are wide variations, however; emissions per capita are almost negligible in some countries but exceed the global average in others.
Nevertheless, per capita emissions in Asia-Pacific developing countries are rising, growing from 3 to 4 MtCO2e between 1990 and 2005 (Figure 1.1). The pace has been quicker than in the high-income OECD countries — though the fastest increase has been in Asia-Pacific’s high-income countries. The rapid growth of the industrial and service sectors, progressive com-mercialisation of agriculture and growing energy use contribute considerably to emissions.
Total Emissions in Asia-Pacifi c Are Rising
Total emissions in Asia-Pacific are on the rise, stemming from diverse circumstances in the region and the continued need for bridging inequalities and improving living conditions. Developing Asia-Pacific’s share of global emis-sions increased from 23 per cent in 1990 to about 32 per cent in 2005, only 4 percentage points lower
Emissions per capita on average remain relatively
small; but total emissions in Asia-Pacific
are on the rise, stemming from
the continued need for bridging inequalities and
improving living conditions
Emissions per capita on average remain relatively
small; but total emissions in Asia-Pacific
are on the rise, stemming from
the continued need for bridging inequalities and
improving living conditions
FIGURE DEVELOPING COUNTRIES IN ASIA AND THE PACIFIC HAVE RELATIVELY LOW PER CAPITA GHG EMISSIONS1.1
Per Capita GHG Emissions of Different Groups of Countries, 1990 and 2005, MtCO2e
Source: Based on WRI 2011.
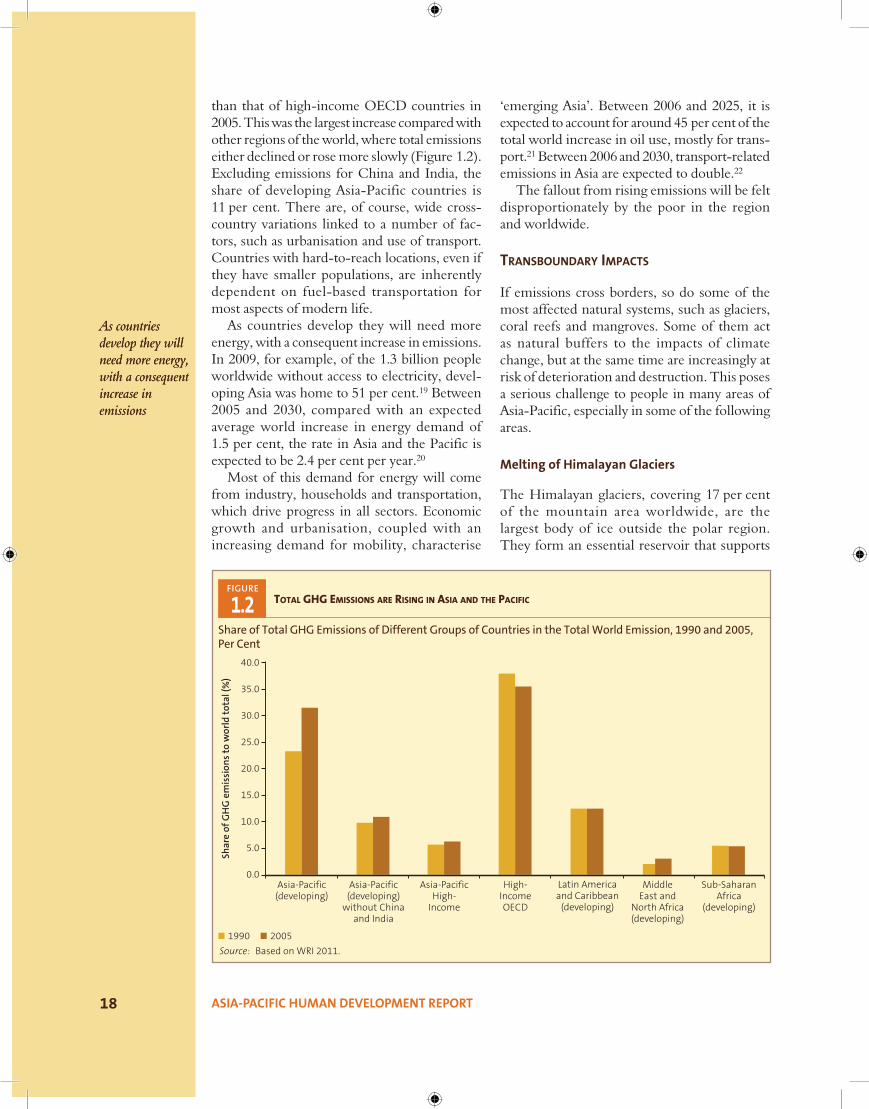
ASIA-PACIFIC HUMAN DEVELOPMENT REPORT18
than that of high-income OECD countries in 2005. This was the largest increase compared with other regions of the world, where total emissions either declined or rose more slowly (Figure 1.2). Excluding emissions for China and India, the share of developing Asia-Pacific countries is 11 per cent. There are, of course, wide cross-country variations linked to a number of fac-tors, such as urbanisation and use of transport. Countries with hard-to-reach locations, even if they have smaller populations, are inherently dependent on fuel-based transportation for most aspects of modern life.
As countries develop they will need more energy, with a consequent increase in emissions. In 2009, for example, of the 1.3 billion people worldwide without access to electricity, devel-oping Asia was home to 51 per cent.19 Between 2005 and 2030, compared with an expected average world increase in energy demand of 1.5 per cent, the rate in Asia and the Pacific is expected to be 2.4 per cent per year.20
Most of this demand for energy will come from industry, households and transportation, which drive progress in all sectors. Economic growth and urbanisation, coupled with an increasing demand for mobility, characterise
As countries develop they will need more energy, with a consequent increase in emissions
As countries develop they will need more energy, with a consequent increase in emissions
‘emerging Asia’. Between 2006 and 2025, it is expected to account for around 45 per cent of the total world increase in oil use, mostly for trans-port.21 Between 2006 and 2030, transport-related emissions in Asia are expected to double.22
The fallout from rising emissions will be felt disproportionately by the poor in the region and worldwide.
TRANSBOUNDARY IMPACTS
If emissions cross borders, so do some of the most affected natural systems, such as glaciers, coral reefs and mangroves. Some of them act as natural buffers to the impacts of climate change, but at the same time are increasingly at risk of deterioration and destruction. This poses a serious challenge to people in many areas of Asia-Pacific, especially in some of the following areas.
Melting of Himalayan Glaciers
The Himalayan glaciers, covering 17 per cent of the mountain area worldwide, are the largest body of ice outside the polar region. They form an essential reservoir that supports
FIGURETOTAL GHG EMISSIONS ARE RISING IN ASIA AND THE PACIFIC1.2
Share of Total GHG Emissions of Different Groups of Countries in the Total World Emission, 1990 and 2005, Per Cent
Source: Based on WRI 2011.

1 THE HUMAN COST OF CLIMATE CHANGE 19
perennial rivers such as the Indus, the Ganges and the Brahmaputra.23 The precipitation in the mountains, discharged directly or stored in the form of snow and ice for later release, is of vital importance to approximately 1.3 billion people downstream.24
Climate change affects the amount of snow and ice and rainfall patterns.25 Mass losses from glaciers and reductions in snow cover over recent decades are projected to accelerate in the 21st century, reducing freshwater avail-ability and hydropower potential, and changing the seasonality of flows in regions supplied by meltwater from mountain ranges.26 While the extent of the losses attributed to climate change has been debated, spatial variations in glacier behaviour, linked to topography and climate, have been observed between 2000 and 2008 in the greater Himalayas.27
The number and size of glacial lakes have increased, magnifying the potential threat of glacial lake outburst floods (GLOFs). Over the past 40 years, for example, the change in size of some glacial lakes in the Pho Chu basin of the Himalayas in Bhutan has been as high as 800 per cent. In Nepal, 15 GLOF events have occurred.28 As GLOFs often affect peoples in dif-ferent countries, a coordinated strategy to deal effectively both with the risk of outburst floods and with water management issues is required at the regional level.
Loss of Mangroves
Asia is home to the world’s most extensive man-grove area (approximately 6 million hectares), with exceptionally high biodiversity. Five of the world’s top 10 countries in terms of expanses of mangroves are in the region — Bangladesh, India, Indonesia, Malaysia and Myanmar. Indonesia has the region’s largest area (3.24 million ha in 2009), 56 per cent of which is in the Maluku and Papua regions. One of the largest transboundary mangrove forests in Asia is the Sundarbans, which covers about 1 million hectares in Bangladesh and India.29
The loss of mangroves has been alarming worldwide. From 1980 to 2005, Asia lost 25 per cent of its 7.8 million hectares of these forests, mainly due to changes in land use from 1980 to 1990.30 Climate change amplifies existing stresses on mangroves, with sea-level rise representing the
biggest threat.31 Continued losses will negatively impact the livelihoods of many fishermen, farm-ers and other rural populations, and reduce the vital ecosystem services mangroves provide to local communities. They will also contribute to emissions. According to a recent estimate, man-grove deforestation results in around 10 per cent of global emissions from deforestation.32 Moreover, mangroves store carbon — together with the soils they grow in, they sequester33 an estimated 22.8 million metric tonnes of carbon each year.34
Stress on Coral Reefs
Coral reefs are integral to marine ecosystems, bio-diversity and the communities dependent on them for food and livelihoods. They provide vital support to fish stocks, and act as a coastal buffer against strong waves. In the Pacific, people are especially connected to reefs — about 50 per cent of the population lives in coastal areas within 30 km of one. Many depend on the reefs for liveli-hoods, in the absence of alternatives. The world’s most extensive and diverse reefs are in South-East Asia, where they comprise about 28 per cent of the global total (almost 70,000 sq. km).35
Reefs face severe stresses from over-fishing, destructive fishing, coastal development and run-off from land, as well as from climate change.36 Increased CO2 concentrations have led to mass coral bleaching — a stress response to warming waters — and ocean acidification. Other impacts linked to climate shifts could stem from sea-level rise and high-intensity storms.37
Desertifi cation
Across the world, about 40 per cent (5.2 billion hectares) of the earth’s land area is threatened by desertification,38 which affects about 44 per cent of the world’s population (2.6 billion people).39 Asia, with around 1.7 billion hectares of arid, semi-arid and dry sub-humid land, is the region with the largest number of people confronting desertification and drought.40
A complex interplay of natural climate variabil-ity affecting drought patterns and unsustain-able land use practices causes desertification, which is further exacerbated by weather extremes associated with global warming. At the same time, the loss of vegetation from desertification
Emissions cross borders; so do
some of the most affected
natural systems, such as glaciers,
coral reefs and mangroves
Emissions cross borders; so do
some of the most affected
natural systems, such as glaciers,
coral reefs and mangroves
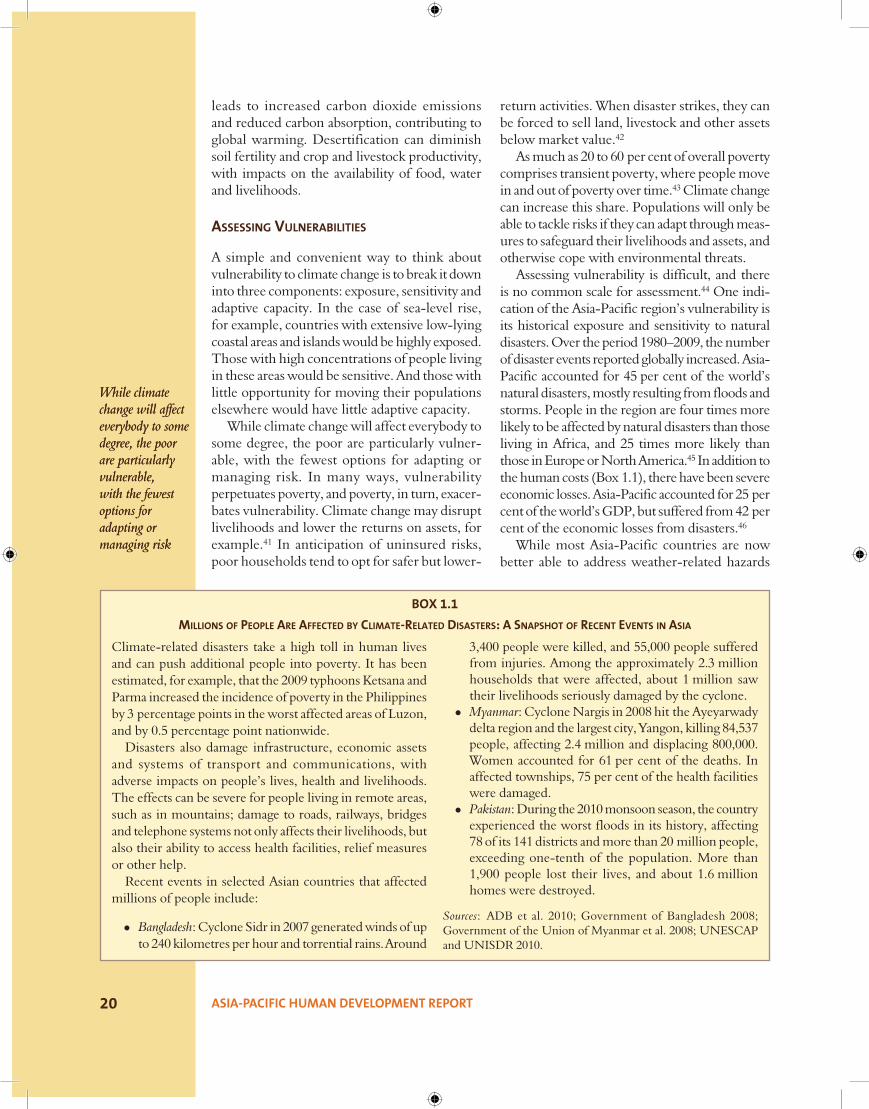
ASIA-PACIFIC HUMAN DEVELOPMENT REPORT20
leads to increased carbon dioxide emissions and reduced carbon absorption, contributing to global warming. Desertification can diminish soil fertility and crop and livestock productivity, with impacts on the availability of food, water and livelihoods.
ASSESSING VULNERABILITIES
A simple and convenient way to think about vulnerability to climate change is to break it down into three components: exposure, sensitivity and adaptive capacity. In the case of sea-level rise, for example, countries with extensive low-lying coastal areas and islands would be highly exposed. Those with high concentrations of people living in these areas would be sensitive. And those with little opportunity for moving their populations elsewhere would have little adaptive capacity.
While climate change will affect everybody to some degree, the poor are particularly vulner-able, with the fewest options for adapting or managing risk. In many ways, vulnerability perpetuates poverty, and poverty, in turn, exacer-bates vulnerability. Climate change may disrupt livelihoods and lower the returns on assets, for example.41 In anticipation of uninsured risks, poor households tend to opt for safer but lower-
While climate change will affect everybody to some degree, the poor are particularly vulnerable,with the fewest options for adapting or managing risk
While climate change will affect everybody to some degree, the poor are particularly vulnerable,with the fewest options for adapting or managing risk
return activities. When disaster strikes, they can be forced to sell land, livestock and other assets below market value.42
As much as 20 to 60 per cent of overall poverty comprises transient poverty, where people move in and out of poverty over time.43 Climate change can increase this share. Populations will only be able to tackle risks if they can adapt through meas-ures to safeguard their livelihoods and assets, and otherwise cope with environmental threats.
Assessing vulnerability is difficult, and there is no common scale for assessment.44 One indi-cation of the Asia-Pacific region’s vulnerability is its historical exposure and sensitivity to natural disasters. Over the period 1980–2009, the number of disaster events reported globally increased. Asia-Pacific accounted for 45 per cent of the world’s natural disasters, mostly resulting from floods and storms. People in the region are four times more likely to be affected by natural disasters than those living in Africa, and 25 times more likely than those in Europe or North America.45 In addition to the human costs (Box 1.1), there have been severe economic losses. Asia-Pacific accounted for 25 per cent of the world’s GDP, but suffered from 42 per cent of the economic losses from disasters.46
While most Asia-Pacific countries are now better able to address weather-related hazards
BOX 1.1
MILLIONS OF PEOPLE ARE AFFECTED BY CLIMATE-RELATED DISASTERS: A SNAPSHOT OF RECENT EVENTS IN ASIA
Climate-related disasters take a high toll in human lives and can push additional people into poverty. It has been estimated, for example, that the 2009 typhoons Ketsana and Parma increased the incidence of poverty in the Philippines by 3 percentage points in the worst affected areas of Luzon, and by 0.5 percentage point nationwide.
Disasters also damage infrastructure, economic assets and systems of transport and communications, with adverse impacts on people’s lives, health and livelihoods. The effects can be severe for people living in remote areas, such as in mountains; damage to roads, railways, bridges and telephone systems not only affects their livelihoods, but also their ability to access health facilities, relief measures or other help.
Recent events in selected Asian countries that affected millions of people include:
Bangladesh: Cyclone Sidr in 2007 generated winds of up to 240 kilometres per hour and torrential rains. Around
3,400 people were killed, and 55,000 people suffered from injuries. Among the approximately 2.3 million households that were affected, about 1 million saw their livelihoods seriously damaged by the cyclone.
Myanmar: Cyclone Nargis in 2008 hit the Ayeyarwady delta region and the largest city, Yangon, killing 84,537 people, affecting 2.4 million and displacing 800,000. Women accounted for 61 per cent of the deaths. In affected townships, 75 per cent of the health facilities were damaged.
Pakistan: During the 2010 monsoon season, the country experienced the worst floods in its history, affecting 78 of its 141 districts and more than 20 million people, exceeding one-tenth of the population. More than 1,900 people lost their lives, and about 1.6 million homes were destroyed.
Sources: ADB et al. 2010; Government of Bangladesh 2008; Government of the Union of Myanmar et al. 2008; UNESCAP and UNISDR 2010.

1 THE HUMAN COST OF CLIMATE CHANGE 21
FIGUREPER CAPITA INCOMES VARY WIDELY ACROSS DEVELOPING COUNTRIES IN ASIA-PACIFIC1.3
GNI Per Capita (PPP$ 2005) in Countries of Asia-Pacifi c, 2011
Source: Based on UNDP 2011d.
such as floods and tropical cyclones, many are struggling with growing risks of economic loss. In East Asia and the Pacific, for example, while the cyclone relative mortality risk in 2009 was only one-third of what it was in 1980, exposure to tropical cyclones in terms of GDP was nearly six times greater than in 1970.47
A country’s capacity to adapt to disasters and other fallouts from climate change is influ-enced not only by economic strength, but also by broader human development conditions. Education and health give individuals more choices, and strengthen institutions that can promote inclusive development and alleviate adverse climate impacts. Asia-Pacific developing countries vary greatly in terms of income as well as HDI (Figure 1.3). The least developed countries (LDCs), in particular, suffer not just from poverty and low human development, but from geographical isolation: many are remote, some are landlocked and others consist of groups of widely scattered, small islands.
VULNERABLE GROUPS BEAR THE BRUNT
Greater vulnerability of the poor to climate change is often because of the places in which
they live — in coastal regions, on river banks, in uplands and remote locations. In urban areas, they are often housed in hazard-prone slums.48 They also have inadequate transport and limited access to information and social services. In view of the impact of climate-related disasters on dis-advantaged groups, leaders from Asia-Pacific have now recognised the need to integrate disaster risk reduction and climate change adaptation into regular development processes.49
The following sections consider the vul-nerability of five major groups that face high exposure and low adaptive capacity: mountain dwellers, delta communities, islanders, indi-genous and tribal peoples and the urban poor. Even within these groups, vulnerability varies according to circumstances including social status, gender, age and access to social services and knowledge. Some groups confront multi-ple vulnerabilities, such as when indigenous peoples live in mountainous areas. Among all groups, women face particular risks, since they are often managers and users of exposed natural resources and primary caregivers. With little information and restricted rights and voice in decision making, they cannot use their skills and knowledge about local conditions, community
Greater vulner-ability of the poor to climate change
is often because of the places
in which they live — in coastal regions, on river
banks, in uplands and remote loca-
tions; in urban areas, they are
often housed in hazard-prone
slums
Greater vulner-ability of the poor to climate change
is often because of the places
in which they live — in coastal regions, on river
banks, in uplands and remote loca-
tions; in urban areas, they are
often housed in hazard-prone
slums

ASIA-PACIFIC HUMAN DEVELOPMENT REPORT22
wellbeing and the management of ecological resources.
Mountain Dwellers
Among the poor groups most vulnerable to climate change in the Asia-Pacific region are mountain communities.50 Asia-Pacific’s mountainous areas (8,294 thousand km2) account for 41 per cent of the region’s land mass, and are home to nearly half of the world’s mountain people. Of these, around 86 per cent live in rural areas.51
Mountain communities often comprise indi-genous peoples at the periphery of society. Living in remote areas, they experience even greater marginalisation and isolation.52 Working on steep slopes, at high altitudes, in harsh climates and a fragile environment, they have limited opportunities for intensive arable agriculture and often rely on external sources of food, which makes them far more vulnerable to shocks, such as higher prices.53 Some 140 million mountain people in Asia and the Pacific are vulnerable to food insecurity, particularly those living above 2,500 metres.54
Public services in remote settlements can be inaccessible, expensive and low in quality, and the gap in living standards between mountain communities and other rural or urban groups is increasing steadily. In Nepal, for example, in 2003–04, some 40 per cent of the mountain and hill population lived in poverty, compared to a national average of 31 per cent. Although poverty is decreasing, the disparities are not. Between 1995–96 and 2003–04, the poverty rate in the plains areas fell by 32 per cent, but among mountain and hill communities it declined by only 16 per cent.55
People living in marginal areas of the moun-tains have long been exposed to many kinds of environmental changes, and have a history of adapting to uncertainties. But they now face difficulties in adapting to more rapid and intense changes.56 The steep territories in which they live create gradients of temperature, precipitation and solar radiation, so they are strongly affected even by small changes in temperature.57 On the Tibetan Plateau, temperature levels could rise by 2.5°C by 2050.58 There are also likely to be significant changes in precipitation — increases
Mountain communities living in remote areas experience even greater marginalisation and isolation
Mountain communities living in remote areas experience even greater marginalisation and isolation
in the north-eastern,59 eastern and central parts of the Tibetan Plateau,60 and decreases in the western part.61 Mountains are already exposed to extreme events and natural hazards, but with climate change there could be more frequent and severe riverine floods, glacial lake outburst floods, droughts and landslides, among other phenomena.62
People in the Hindu Kush–Himalayas al-ready seem to be experiencing some of these changes.63 Communities say that the monsoons have become uncertain, with longer dry spells. In north-west India, mountain people observe that springs are drying up as a consequence of less rain and snowfall combined with deforestation. And throughout the region, communities report less snowfall as a result of milder winters and higher temperatures. Snowfall now lasts for only a few days while previously it could continue for some weeks. Changes are particularly significant at higher altitudes.64
This is already having an impact on agri-culture. In Nepal, for example, farmers observe that warmer temperatures are affecting fruiting seasons. Oranges that used to ripen in winter now ripen in autumn. In India and Nepal, mountain communities report more crop diseases and pests, attributing these to less snow in winter and shorter cold periods. New plant diseases have arrived, such as thaulya in Nepal, which affects millet and paddy. These developments further undermine community assets and capacities to cope with climate change.65
Delta Communities
At the other end of the geographical spectrum are river deltas. There are extensive, low-lying river deltas in a number of Asia-Pacific countries, in-cluding Bangladesh, China, India and Viet Nam. Many people have settled in these areas because of their fertile soils and ample water. But low-lying areas adjacent to large quantities of water involve serious risks, such as coastal inundation, soil erosion and the intrusion of saline waters into surface water and groundwater. All these risks will be heightened by a rise in mean sea level. As illustrated in the following country examples, vulnerabilities will vary considerably by location and by community capacities to adapt to change.66

1 THE HUMAN COST OF CLIMATE CHANGE 23
Bangladesh: River systems in Bangladesh provide the main sources of irrigation and fish stocks, and support much transportation infrastruc-ture. Because of its low-lying topography and funnel-shaped coast, the land and its people are exposed to cyclones, tidal surges and seasonal flooding.67 Historically, Bangladeshis have learnt to adapt; as regular monsoons can submerge one-third of the territory, people are used to relocation. Many families experience multiple displacements over their lifetimes. River bank erosion, for example, is estimated to displace 500,000 people every year.68 The impacts of climate change, however, could be of a different order of magnitude. A rise in mean sea level of 1 metre could affect up to 40 million people.69 Another estimate suggests that this would also reduce the land area by 21 per cent and affect 15 million people.70 And with a higher mean sea level, tropical cyclones are expected to be more frequent and intense.71 Climate change is also expected to disturb riverine and coastal morphological processes by eroding banks, changing the levels of river beds and estuaries and disturbing the balance between the transport and deposition of river sediment.72 Recognising these threats, Bangladesh has included research on delta development dynamics in coastal areas in its strategies for possible adaptation.73
Cambodia: The Mekong delta covers much of the country and includes the hydrological anomaly of the Tonle Sap River, which reverses its flow into and out of the Tonle Sap lake twice a year. This enables the lake to act as a reservoir for the huge flows of the Mekong during the wet season. This river system is also connected to multi-ple tributaries that experience corresponding floods. In the event of sea-level rise, many low-lying areas, including settlements, beach resorts, seaports, coastal fisheries and mangrove forests, could be submerged.74
China: The most vulnerable coastal regions are the Yellow River delta, the Yangtze River delta and the Pearl River delta. Since the 1950s, the level of the sea along China’s coastline has been rising at an average of 0.1 to 0.3 centimetres per year.75 By 2030, it is expected to rise by 1 to 16 centimetres, and by 2050 by 0.4 to 1.0 metres.76 A 1-metre rise in mean sea level would submerge
an area the size of Portugal.77 In the Zhujiang Estuary, rising mean sea levels of between 0.4 to 1 metre would cause saltwater to intrude inland by 1 to 3 kilometres, affecting supplies of both domestic and irrigation water.78
Viet Nam: The Mekong delta is one of the most densely populated parts of Viet Nam. It is home to 17 million people, of whom four million live in poverty.79 A 1-metre rise in mean sea level, expected at the earliest by 2100, would result in floods that would hit the Mekong delta harder than anywhere else in Viet Nam — it would constitute more than 80 per cent of the area under water. This would impact the lives of 5.5 million people, two-thirds of the entire affected population,80 and damage agricul-ture by inundating fertile land and increasing salinity.81 Even the sea-level rise projected for 2030 would expose around 45 per cent of the delta’s land area to extreme salinisation and crop damage.82 Saltwater intrusion and reduced river flow associated with climate change will also threaten the livelihoods of more than 150,000 people, mostly women, who depend on catfish aquaculture.83
Islanders
Many of the small island developing states in Asia and the Pacific are vulnerable to climate change because of low elevations. They include six LDCs: Kiribati, Samoa, Solomon Islands, Timor-Leste, Tuvalu and Vanuatu. These are among the world’s smallest and most remote countries, occupying a land area of less than 60,000 square kilometres,84 scattered across the world’s largest ocean. Small island states are particularly exposed to the risk of coastal inundation, soil erosion, intrusion of saline waters into surface water and groundwater and other consequences of a rise in sea level that threatens infrastructure, settlements and livelihoods.85 Their geographical remoteness also makes them more dependent on transpor-tation to meet their everyday needs; they require energy for both aviation and shipping.
All islands are already vulnerable to environ-mental disasters. These include tropical cyclones, flash floods and droughts. According to an environmental vulnerability index developed
Low-lying areas adjacent to large
quantities of water involve serious risks; many small
island developing states are
vulnerable to climate change because of low
elevations
Low-lying areas adjacent to large
quantities of water involve serious risks; many small
island developing states are
vulnerable to climate change because of low
elevations

ASIA-PACIFIC HUMAN DEVELOPMENT REPORT24
SPECIAL CONTRIBUTION
MY CLIMATE, MY CHANGE
FE’ILOAKITAU KAHO TEVI
In many of the speeches and pre-sentations thus far on the effects of climate change in the Pacific, the image of a canary in a coal mine is often used to depict the nature of changes that the world may soon endure. In other words, we serve as the alarm bell for the rest of the world. In this regard, I would venture to ask whether there is any need for a coal mine for this particular canary to do its task of raising the alarm when the whole environment is becoming a threat to the human person?
The Pacific is now undergoing what can be termed a slow, practically invisible attrition of its geographical, cultural and social settings that have made it a pleasant and attractive location to live in. The geographical nature of islands has generated a set of cultural and traditional norms that have under-girded our communities for the past centuries.Our relative isolation from the rest of the world had also contributed to this region being left alone as economic and social trends changed the other regions. As changes began to creep into our economic and social settings, our adaptive capacities towards change enabled us to cope with this first set of waves hitting our shores.
Pacific countries heeded the no-tions of sustainable development and applauded the UN summit in Rio in 1992 with great optimism for a better future. At the same time, at the UN General Assemblies, a small island country began talking about the effects of climate variations that were having a devastating effect on the geological and living conditions of its people. Did we pay any attention?
Twenty years on, after the UN Sum-mit in Rio, our reality has changed
dramatically. The Pacific is now facing the consequences of a multiplicity of effects caused by climate change. It faces a grim reality, being at forefront of having to cope with the changes in our climate that are wreaking havoc in the region — a forewarning for the world. The exacerbation of extreme weather patterns caused by unfettered economic growth policies and the unsustainable exploitation of natural resources, mainly by the industrialised nations, is now upon the world. Hence, climate change is now coupling up with a steady and unrelenting hike in fossil fuels and food commodity prices, hitting our Pacific Island countries at multiple levels.
Current solutions such as a search for renewable energy or the green-ing of our economies will do little to alter the course of increasing climate variations if our consumption pat-terns and life-styles do not change. Therein lies the message of climate change: modus operandi or any vari-ation of it is not a solution. If we are to have a chance, we will need to change the ‘modus’, whether it is a green economy or a blue economy or any other economic model that lacks the notion of sufficiency and sustainability.
In keeping with our call to change the modes of operation, the question that we need to ask ourselves as peo-ples of Oceania is: how can we best prepare ourselves politically, socially and physically for this eventuality? The challenge for the Pacific region is immediate — are we to take charge of our future or leave it for others to determine what it will be?
President Anote Tong of the Repub-lic of Kiribati openly discusses the relocation of its residents as an option
for the future of his people. For an increasing number of island atolls, this option is the only solution for survival as these islands atolls have become inhabitable. In the best-case scenarios for the Pacific region, it is envisaged that approximately 250,000 persons will need to be relocated within the next 40 years. The relocation of a small group is still manageable under cur-rent political and economic conditions. However, as the numbers swell, it is critical that our ability to address these problems shifts to a more appropriate level of response.
In our attempts to respond to this envisaged hike in the fluidity and mobility of our peoples, the current geopolitical set-up in the Pacific needs to shift from a nation-state platform to a region–state platform if we are to stand a chance. On such a platform, the notion of the sovereignty of nations will need to shift towards a notion of sovereignty for the entire region. While this may not be quite an attractive decision to take, much of the current regional policies aimed at forging a regional response to issues are first pointers in this direction.
The dismantling of current eco-nomic and political boundaries will then usher in a broader and more united approach among the many island countries in the Pacific to address the many challenges that our region faces. Innovative notions such as the blue economy, promoted by the Pacific Small Island Developing States, could become key elements of this response. Other initiatives aimed at address the future of our ‘liquid continent’86 that are based on this notion of the sovereignty of the nation-state will be superseded by innovative and chal-lenging initiatives that drive towards

1 THE HUMAN COST OF CLIMATE CHANGE 25
addressing our environment as our common heritage.
It is this perception of the common heritage of the ocean and the islands in our cultures and traditions that gives us the hope that we can and will survive. All around the Pacific, our intimate relationship with our ocean and our land is this common understanding and silver lining that weaves through the many cultures of this liquid continent. It is from within our traditions and cultures that we will discern our challenges and find our solutions to address climate change. It is from the island atolls such as
Nukulaelae in Tuvalu, Christmas Island in Kiribati, or from the village of Naivucini in the highlands of Fiji that we should begin this journey of rethinking who we are as a people, facing the challenges of climate change before us.
Our journey to Rio+20 should begin from the very places we per-ceive as vulnerable. It is in acknow-ledging our own vulnerabilities that we will begin to work as a region in addressing climate change. And signalling clearly to the world, perhaps we may even help alter the course of humankind.
Preach the gospel at all times, use words if necessary.
— St Francis of Assisi
Fe’iloakitau Kaho Tevi is former General Secretary of the Pacific Conference of Churches, a regional ecumenical organisation represent-ing close to 6.5 million of the 8.2 million Pacific Islanders. A polyglot, he is fluent in five languages and speaks another two. He is married to Eleni from Tonga and they have four children. He has post-graduate degrees in international relations, international economy and development cooperation.
by the South Pacific Applied Geoscience Commission, the United Nations Environment Programme (UNEP) and their partners, Kiribati, Maldives and Tuvalu are among the countries considered extremely vulnerable to environ-mental shocks.87 With climate change, these are expected to become more intense. Tropical cyclones, for instance, are likely to have higher peak wind speeds and bring heavier rainfall.88
Particularly alarming is the problem of sea-level rise. In the Maldives, Tuvalu and Kiribati, a significant portion of the land mass is made up of low-lying atolls that are no more than a few metres above the current sea level.89 As former President Mohamed Nasheed of the Republic of Maldives noted, ‘For the Maldives, climate change is no vague or distant irritation but a clear and present danger to our survival. But the Maldives is no special case; simply the canary in the world’s coal mine.’90
Already, the prospects are similarly bleak for the Cook Islands.91 Months of drought have dried up water supplies, while severe flooding has blocked water sources. Huge waves are degrading the land.
Indigenous and Tribal Peoples
A distinctly vulnerable group in Asia and the Pacific is the indigenous peoples and tribes. With a total population of at least 240 million and more than 500 ethnicities, they live in at
least 16 countries in Asia and 22 countries and territories in the Pacific.92
Indigenous peoples usually have a spiritual and symbiotic relationship with the natural environment. They believe that the spirits of their ancestors watch over the lands, forests, mountains and rivers. Many practise shifting cultivation and paddy field agriculture. Others engage in agroforestry, animal husbandry and hunting, or harvest non-timber forest products, or make handicrafts.93 In the Pacific, they often rely on fishing.
Many indigenous groups are inherently vulnerable, since few governments legally recognise them as distinct peoples. This under-mines their cultural integrity and their collect-ive rights, especially to their land, territories and resources. Access to basic social services is often limited. In the Pacific Islands, indigenous peoples, especially those in remote areas, usually have few options for health care or education.94
Since they depend on fragile ecosystems, indigenous groups are highly susceptible to changes in the environment and the climate. To some extent, they can respond. They typically have a deep understanding of their surroundings, which enables them to adapt continuously, and they have developed considerable resilience. But more rapid, large-scale changes can threaten their collective survival.
One system that has already been disturbed is weather forecasting. Among the Tagbanuas
Since they depend on fragile
ecosystems, indigenous
groups are highly susceptible to
changes in the environment and
the climate
Since they depend on fragile
ecosystems, indigenous
groups are highly susceptible to
changes in the environment and
the climate
ASIA-PACIFIC HUMAN DEVELOPMENT REPORT26
of Coron in the Philippines, for example, some elders are losing confidence in their experi-ence and traditional knowledge of making accurate forecasts.95 Since the 1980s, they have experienced more erratic weather, making it difficult to determine when the planting season would start. They also say that the warming of the seas has reduced fish catches: in some cases, from 30 kilogrammes a few years back to five kilogrammes today.96 For indigenous women in the Khuti district of Jharkhand, India, rising temperatures have meant a decrease in the har-vest of lac, a natural polymer from an insect used to polish handicrafts and help maintain the freshness of fruit.97
Indigenous peoples and tribes have been especially vulnerable to recent natural disasters. In Bac Me district in Viet Nam in 2008, they experienced seven flash floods, as against three to five flash floods in previous years. In mountainous areas, they have observed an increased number of cracks along mountain slopes resulting from drought or excessive rainfall.98
The Urban Poor
In developing countries in 2002, 290 million people in urban areas — 13 per cent of the total number of urban residents — lived on less than PPP $1.08 a day. The incidence of urban poverty in South Asia was 34.6 per cent, the second highest of all regions globally.99 By 2020, Asian cities will host 2.2 billion people: half of the world’s urban population.100 Many cities are home to extremely dense populations, and are located along coast-lines, river floodplains or deltas. While some are threatened by rising sea levels, others suffer from increasingly heavy precipitation or seasonal droughts. Little attention is being paid to the man-agement of water, soil and waste, leaving cities with few buffers against environmental stress.
Given the diverse conditions in the region, urban poverty takes different forms. But there are common aspects related to inadequacies in shelter, provision of public infrastructure, in-come, asset bases, social services, law enforce-ment, safety nets and political voice.101
Among the most affected poor households are those living in fragile dwellings in low-lying areas, including swamps and wetlands highly exposed to storm and tidal surges.102 Already
Many cities are home to extremely dense populations, and are located along coastlines, river floodplains or deltas
Many cities are home to extremely dense populations, and are located along coastlines, river floodplains or deltas
struggling with inadequate services for power, water, sanitation and health care, they have limited resources and capacities to respond to climate change. If drought reduces supplies of water, they will suffer more from increased prices and from compromised sanitation sys-tems that spread water-borne diseases. They are more likely to live in houses that can be easily swept away by floods, and to labour out of doors, unprotected even on days of extreme heat or cold.
Climate change will quickly push many of the urban poor beyond their capacity to cope or adapt.103 It may interfere with the achieve-ment of the Millennium Development Goal (MDG) target of improving the lives of at least 100 million slum dwellers by 2020.104 To in-crease resilience, urban administrations would need to set and enforce regulations that take into account the needs of the poor, and promote collaboration across institutions at national and local levels with genuinely participatory and strategic planning.
ENDANGERED LIVELIHOODS
Climate change will cut into many livelihoods, but some of the most immediate implications will be for poor rural communities who rely heavily on natural resources, particularly for cultivation and fisheries. Especially affected will be rural women, who are heavily involved in both.
Cultivation
Across Asia and the Pacific, more than 50 per cent of the total population relies on agricul-tural activities for the basic necessities of life.105 Since the 1960s, the world average of per capita agricultural production has increased by 25 per cent. But the highest increase was in Asia — 76 per cent.106 This success has, however, created environmental problems, including an increase in GHGs.
A recent study concluded that agriculture in South Asia will be hit hard by climate change, with large declines in the yields of almost all crops,107 including irrigated crops. Over the next four decades, irrigated rice yields could fall by 14 to 20 per cent, pushing up food prices and in-creasing the number of malnourished children.108

1 THE HUMAN COST OF CLIMATE CHANGE 27
Climate change affects agriculture in various ways, including:
Temperature increase: Much will depend on geography. Overall, modelling studies indicate that in mid- to high-latitude regions, moderate to medium temperature increases (1°C–3ºC), along with rainfall changes, will have moderate benefits for crop yields. In low-latitude regions, even moderate temperature increases (1°C–2ºC) are likely to reduce the yields of major cereals. Warming of more than 3ºC, however, would reduce food production in all regions.109 Tem-perature increases could also limit the effective-ness of farm inputs like fertilisers, requiring altered applications to sustain production, and could provide a more amenable environment for different pests.110
Uncertain rainfall: The farmers most likely to lose out are those whose crops are primarily rain-fed or rely on rainfall for irrigation. Poorer farming communities may also lack the drainage and flood control systems to deal with large flows of water.
Carbon fertilisation: In order to grow, plants absorb CO2 from the air. So a higher CO2 con-centration could promote plant growth, par-ticularly for rice, wheat and legumes. The extent of this effect is uncertain, though in some circumstances it could help offset the effects of temperature rise.
Fisheries
Asia-Pacific is one of the world’s most heavily fished areas.111 Across Asia, people depend on marine stocks for livelihoods and nutrition. In 2008, Asia accounted for 85 per cent of the 44.9 million people in the world engaged in fishing and fish farming.112 The fishing sector supports a large proportion of Pacific Islanders — fisheries are critical for the national economies of small island developing states.113
For many poor communities, fishing is an important source not only of livelihoods but of nourishment, accounting for as much as 40 per cent of their consumption of animal protein.114 Most people in the region eat largely rice, vegetables and pulses, diets in which even small quantities of fish can significantly increase
the nutritional quality. In some countries, diets are based largely on fish: in the Maldives, for example, tuna in many different forms is served daily in every meal.115 In the Pacific Island coun-tries, 70 per cent of the overall coastal fisheries production is for subsistence.116
Fisheries are under threat given that many of the region’s fishing grounds are already over-exploited,117 leading to an increase in the vulnerability of ocean ecosystems. There are also indications of ‘fishing down the food chain’ — catching smaller, shorter-lived and faster-reproducing species. Fish catches are being further reduced by pollution, includ-ing pollution from agricultural runoff and untreated wastewater. In parts of the region, between 80 and 90 per cent of this water is discharged untreated into the sea.118
Any further pressure on fish stocks would have grave consequences. The East China Sea, for example, is already over-fished for domestic consumption and export, and is heavily polluted by local industries. As a consequence, between 2001 and 2005 the catch dropped from 1.3 million to 980,000 tonnes, and employment in fishing fell from 250,000 to 210,000.119
Fish of all kinds will be affected by rising water temperatures, which are expected to alter their metabolisms and reproduction, and make them more susceptible to diseases and toxins.120 Other climate effects that could take a toll include precipitation, salinity, ocean circulation, river flow, sea and lake levels, ice cover and glacial melt, and storm frequency and intensity. The impacts will differ from one area to another, and the overall fallout is uncertain. In some cases, depending on the nature of the activity and the location, there could be positive results, such as lower natural winter mortality, and faster growth rates in higher latitudes.121
It is likely that fishing communities across the region will face threats to their livelihoods. In response, approaches specific to regions and ecosystems are needed. Specific vulnerability assessments would help to inform locally tailored strategies to support fishing communities.
FORCED TO MOVE
Climate change could cause many people to relocate because the land can no longer support
Climate change will cut into
many livelihoods, particularly for cultivation and
fisheries
Climate change will cut into
many livelihoods, particularly for cultivation and
fisheries

ASIA-PACIFIC HUMAN DEVELOPMENT REPORT28
their livelihoods, or, in some cases, as in the smaller island countries, because the land has disappeared altogether. This ‘push’ is likely to be a gradual process that operates along with other ‘pull’ factors. Across Asia and the Pacific, people are drawn to new places in search of security, including basic needs like food and shelter; others migrate in the hope of improv-ing their living standards, or for seeking better opportunities and varied experiences.
Women migrate less frequently than men, due to restrictions on their mobility and their traditional roles as caregivers for children and the elderly. This leaves a larger number of single, female-headed households.122 When they do migrate, particularly in Asia, women may leave their families behind, which leaves them exposed to risks in transit and at the destination.
Many people migrate out of choice. But they can face a number of problems. Migration can, for example, lead to family breakdown and the fragmentation of social networks. In destina-tion countries, immigration in some cases can put greater pressure on labour markets and lead to social friction, especially in urban areas where most migrants look for employment.123 Governments need to consider requirements for housing, services and integration.
Migration is often temporary and seasonal, following agricultural and weather cycles — for example, the practice of moving to higher ground during monsoon periods in South-East Asia. In other cases, people may be pushed out by disasters. In 2008, 17 of the 20 dis-asters that caused the greatest sudden move-ments of populations were in Asia, displacing 31 million people.124 As a result of Cyclone Aila in Bangladesh in 2009, 100,000 people, pri-marily men, migrated from four sub-districts looking for work.125 As of early 2010, 100,000 people were estimated as still living on em-bankments and many were considering leaving permanently.126
Climate change could contribute to migra-tion on an entirely new scale. While climate is unlikely to be the sole or even the most im-portant ‘push’ factor in migration decisions, climate events could accelerate relocation or even trigger sudden exodus. In East, South-East and South Asia, a rise of 0.5–2 metres in sea level
Climate change could cause many people to relocate because the land can no longer support their livelihoods, or because the land has disappeared altogether
Climate change could cause many people to relocate because the land can no longer support their livelihoods, or because the land has disappeared altogether
over this century could displace 53 to 125 million people.127 This will have direct implications not just for those displaced, but also for societies at the intermediate and end destinations to which they will have to move.
Already, some Pacific Islands are being evacuated. In the Carteret Islands of Papua New Guinea, rising waters as a result of coastal erosion have swamped valuable land, removing the thin soil crust and destroying fruit trees and other staples.128 The incoming waters have also brought higher levels of malaria and child malnutrition.129 Since the islands could be completely submerged by 2015, a political decision was reached in 2005 to relocate the population to mainland Bougainville.130 In 2006, the Carterets Council of Elders formed Tulele Peisa, a non-profit association to organise the voluntary relocation.131
In other parts of the Pacific, islanders have already started migrating, prompted partly by concerns about the environment.132 Between 2001 and 2006, the Tuvaluan population in New Zealand increased by 34 per cent, of whom only 37 per cent were born there. In 2006, the 2,625 Tuvaluans in New Zealand constituted the country’s seventh largest Pacific Island ethnic group.133 Kiribati is reported to be looking at labour migration options in order to resettle its people.134
THE HEALTH IMPACT
As well as harming livelihoods and locations, climate change can threaten human health and survival. The 2007 Fourth Assessment Report of the Intergovernmental Panel on Climate Change noted that, around the globe, climate change was causing increased morbidity and premature mortality. The report indicated that the health impacts were likely to get more severe over time.135 Children under five are the main victims of sanitation-related illnesses and, along with the elderly, are most affected by heat stress. In urban areas, in particular, children will be at the highest risk because of the urban heat island effect, high congestion and the lack of green spaces.136 Risks may be different for boys and girls because of gender discrimination in the allocation of resources, including those relating to nutrition and medicines.

1 THE HUMAN COST OF CLIMATE CHANGE 29
Disaster-Related Mortality
Much of the direct health impact of climate change will be experienced through mortality and injuries due to climate-related disasters, particularly floods, droughts and extreme weather events. The size and range of impacts can vary between wealthier and poorer countries, even with hazards of similar scale. Extreme hazards and events, in fact, are not synonymous with extreme risks.137 In low-income countries, particularly among the poor, loss of life during extreme events is especially high among children, women and the elderly.138 And the impacts can continue into the future, since families lose property and income, and have less to spend on health, especially for women.
Climate-Sensitive Diseases
Climate change constrains the fundamental requirements for good health: clean air, safe drinking water, adequate sanitation and suffi-cient food. A number of diseases are likely to be spurred by it, especially water-, food- and vector-borne diseases.
Dengue fever: This is perhaps the most important of the emerging infections likely to be affected by climate change.139 Asia-Pacific is the world’s most affected region, with more than 70 per cent of the global population at risk — 1.8 billion people.140 In some Asian countries, dengue accounts for a high proportion of childhood mortality.141 While there is as yet no concrete link with climate change, some data indicate a possible connection. For example, Singapore observed an increase of 1.5°C in temperature between 1978 and 1998. During the same period, the annual number of dengue cases soared from 384 to 5,258.142 In the South Pacific, the annual number of dengue epidemics between 1970 and 1995 was found to be positively correlated with La Niña conditions, which brought warmer and wetter weather.143
Malaria: In 2009, Asia and the Pacific accounted for 16 per cent of global malaria cases and 7 per cent of deaths.144 The incidence of malaria is expected to rise.145 Due to climate warming, mosquitoes that carry malaria parasites are
Climate change constrains the fundamental requirements
for good health: clean air,
safe drinking water, adequate sanitation and sufficient food
Climate change constrains the fundamental requirements
for good health: clean air,
safe drinking water, adequate sanitation and sufficient food
being detected for the first time in the high-elevation areas of Papua New Guinea,146 India and Bhutan.147 El Niño, which brings warm temperatures, has been associated with malaria epidemics in various parts of South Asia.148 Pregnant women are particularly susceptible to water-borne diseases and malaria. Anaemia, one consequence of malaria, causes one quarter of all maternal mortality.149
Diarrhoea: In 2004, about half of all recorded diarrhoea cases and deaths among children under five occurred in Asia and the Pacific.150 Diarrhoea is commonly the outcome of poor sanitation and contaminated water. The IPCC report projects that East, South and South-East Asia will see an increase in morbidity and mortality from diarrhoeal diseases associated primarily with floods and droughts, which are linked to climate change.151
Cholera: This water-borne disease is connected to floods and the contamination of drinking water.152 In South Asia, the prevalence and toxicity of cholera are expected to increase due to rising coastal water temperatures.153 In Bangladesh, cholera epidemics in coastal areas are associated with El Niño.154
Malnutrition
Malnutrition is projected to be the largest health effect of climate change,155 due to reductions in agricultural production and increased food insecurity. By 2030, climate change is projected to account for about 4.7 million cases of mal-nutrition, or about 10 per cent of the global total,156 a risk affecting children in particular. By 2050, the number of additional children suffering from malnutrition in developing Asia could be between 9 and 11 million.157
Already Asia and the Pacific has nearly 70 per cent of the developing world’s children below five years of age who are underweight.158 And the region had 578 million undernourished people as of 2010, around two-thirds of the global total.159 Research in India has found that girls’ nutrition suffers most during periods of low consumption, and rainfall shortages are more strongly associated with deaths among girls than boys.160

ASIA-PACIFIC HUMAN DEVELOPMENT REPORT30
Reducing malnutrition in an era of climate change will require greater investments in agriculture to boost productivity, including that of secondary crops. It will also be important to increase parental education and supplies of clean water; these do not contribute directly to calorie consumption, but help reduce child malnutrition.161
RESOURCE CONFLICTS AND SOCIAL UNREST
Asia-Pacific is particularly vulnerable to conflicts. In 2006, nearly half of the world’s intra-state conflicts took place here.162 And they tend to last longer in Asia than elsewhere.163 Conflicts generally emerge as a consequence of a number of factors, but climate change can act as a ‘threat multiplier’ — particularly in struggles over natural resources. It can lead to a revaluation of water or land, increasing their worth as survival resources and amplifying tensions.164 Migration can trigger some conflicts, with additional people having to utilise limited or shrinking resources — often a reflection of poor governance and management of resources.
Climate change could spark conflicts, even-tually threatening global peace and security, a concern expressed also by the United Nations Security Council.165 This risk may be greater when coupled with poor service delivery, corrup-tion, political instability and ethnic tensions.166 In turn, conflict itself can damage the environ-ment and reduce resources, thus compound-ing the cycle of insecurity. A decline in forests, for example, can reduce the capacity of forest-dependent communities to meet their livelihood needs, resulting in continuing poverty and ill-health, with conflicts between different interest groups around conservation efforts and the needs of communities.167 Conflicts over land, water and forests can also go beyond political and administrative borders as societies take steps to obtain dependable sources from their neighbours.
SUSTAINING HUMAN PROGRESS IN THE FACE OF CLIMATE CHANGE
A healthy natural environment is critical for human development. It offers water and food; resources for production, exchange and
Climate change could spark new conflicts, eventually threatening global peace and security; it is time to go beyond the ‘rich country’ and ‘poor country’ divide
Climate change could spark new conflicts, eventually threatening global peace and security; it is time to go beyond the ‘rich country’ and ‘poor country’ divide
consumption; and land for urban and rural communities. It absorbs wastes and emissions. Environmental resources, however, are generally undervalued in monetary terms, or not valued at all. This results in misuse and overuse.
Poor environmental management amplifies the harm from climate change, with consequences for people’s choices and opportunities both today and tomorrow, and for both rich and poor people. It is time, therefore, to go beyond the ‘rich country’ and ‘poor country’ divide, bypassing the false dichotomy of mitigation for the rich versus adaptation for the poor. Asia-Pacific’s development options are still unfolding. The region needs economic growth that is far more inclusive, but this growth also needs to be sustainable.
Emissions Are Rising with Progress
Past emission patterns do not present the only options. Data show a positive relationship be-tween CO2 emissions and gross national income (GNI) per capita or HDI across the countries of the world (Figure 1.4 and Figure 1.5). A closer look indicates, however, that even in the past, this relationship has not been perfect. Coun-tries with similar levels of economic or human development can have very different CO2 emis-sions per capita.
Clearly, many factors determine the levels of emissions — historical development paths, the ways in which incomes are generated and used, the structure of economies and the tech-nologies adopted. Prevailing institutions, pol-icies and incentives, and accurate knowledge and wider awareness of impending risks and practical options, can also influence emissions trajectories.
Growing Emissions Are Not Inevitable
Energy-related emissions constitute nearly two-thirds of the global total, and 60 per cent of emissions in developing Asia-Pacific.168 Coun-tries could reduce the carbon intensity of energy by developing more efficient technologies and deriving more power from gas, hydropower, solar and wind sources. They could strengthen existing public transport systems and encourage their use, and exploit communications and other

1 THE HUMAN COST OF CLIMATE CHANGE 31
technologies that can reduce some needs for long-distance travel.
Global scenario projections show that rais-ing energy use efficiency across sectors and expanding renewable energy will be critical for cutting energy-related emissions. Under the green investment scenario (G2), an estimated annual investment in these measures of 2 per cent of global GDP, about US$1.3 trillion, would result in a 36 per cent decline in global energy intensity by 2030 and approximately 60 per cent by 2050, as compared to the business-as-usual (BAU) scenario (Figure 1.6). In absolute amounts, this corresponds to a fall from 30.6 Gigatonnes (Gt) of energy-related CO2 emis-sions in 2010 to about 20 Gt in 2050.169
Societies may not inevitably need to become richer to change the character of their production and consumption. Instead, they could implant change in the very process of development. Greenhouse gas emissions can be cut by in-creasing efficiency, adopting lower-carbon tech-nologies, acting on non-energy emissions and reducing the demand for emissions-intensive goods and services.
Developing Asia-Pacifi c Has Potential for Change
Asia-Pacific has potential to cut emissions by using existing energy-efficient technologies and cleaner sources of energy, resulting in reduced emissions per unit of output. Already, since 1980, the carbon intensity of GDP, measured in terms of kg CO2 emissions per GDP (2005 PPP$), has declined faster in the developing countries of East Asia and the Pacific than in other regions of the world (Figure 1.7). In South Asia, carbon intensity increased gradually during the 1980s and early 1990s, but since the late 1990s it has been declining, with GDP growing faster than emissions.170
Nonetheless, the carbon intensity of output in developing Asia-Pacific countries is higher than that of the high-income OECD country group.171 For producing one PPP$ output, on average, the latter emit 0.36 kg of CO2, while in East Asia and the Pacific developing coun-tries generate 0.84 kg of CO2, and developing South Asia countries generate 0.49 kg of CO2. Carbon intensity varies across Asia-Pacific
Asia-Pacific has potential to cut
emissions by using existing
energy-efficient technologies and cleaner sources of
energy
Asia-Pacific has potential to cut
emissions by using existing
energy-efficient technologies and cleaner sources of
energy
FIGUREAS INCOMES RISE, SO DO CO2 EMISSIONS1.4
Per Capita CO2 Emissions and GNI Per Capita of Countries
Source: Based on UNDP 2011d; World Bank 2011b.
FIGURE A RISE IN THE HUMAN DEVELOPMENT INDEX (HDI) IS ALSO ACCOMPANIED BY A RISE IN PER CAPITA EMISSIONS1.5
Per Capita CO2 and HDI Values of Countries
Source: Based on UNDP 2011d; World Bank 2011b.
developing countries. For example, Singapore’s carbon intensity is nearly a quarter of China’s and less than half of that of India or even Australia.172 Such variations indicate huge potential for further reductions.
This is the time for the Asia-Pacific countries to act, especially as these countries are experienc-ing a fast pace of economic growth. There are some positive indications. China, for example, is committed to lower its carbon intensity of GDP by 40–45 per cent by 2020 compared to the 2005 level. India is also committed to

ASIA-PACIFIC HUMAN DEVELOPMENT REPORT32
Beyond GDP
A number of countries are already looking beyond GDP in defining their national policies. Bhutan, for example, has long argued that the purpose of public policy should be happiness. A 2011 UN General Assembly resolution spon-sored by Bhutan on the role of happiness and development has continued to push for this internationally. The resolution, supported by both developed and developing Asia-Pacific countries,173 calls for action to address unsus-tainable patterns of production and consump-tion, and take a more inclusive, equitable and balanced approach to economic growth that helps to promote sustainable development, era-dicates poverty and leads to human happiness and wellbeing.174 Larger countries in the region are also taking initiatives. China, in its 12th plan period (2011–15), is putting greater emphasis on the quality of growth while promoting low-carbon development.175
The developed world, too, has started to look towards measuring the quality of life, and not just flows of money through markets. A French initiative, the Commission on Measuring Eco-nomic Performance and Social Progress, is questioning the value of GDP as an indicator of economic performance and social progress.176 Many countries have begun discussing the idea of the green economy — ‘one that results in im-proved human well-being and social equity, while significantly reducing environmental risks and ecological scarcities’.177 From the perspec-tive of developing countries that need economic growth, however, debates around this concept point to potentially uncomfortable trade-offs, such as the possibility that developed countries might use environmental regulations and other non-tariff barriers to restrict trade.178 Given the wide variations in natural endowments and development challenges, these issues will have to be faced squarely.
Necessary measures can be driven by multi-ple goals beyond just addressing climate change. Reducing traffic congestion or pollution, for instance, is clearly valuable in its own right. As a growing number of consumers around the world become concerned about environmental issues such as air and water pollution, water scarcity or growing waste, matters linked to health and
FIGUREHUGE POTENTIAL FOR REDUCING CARBON INTENSITY OF GDP1.7
Carbon Intensity Trends across Regions, 1980–2007
Source: World Bank 2011b.
FIGURE GREEN INVESTMENT SCENARIO PROJECTS 60 PER CENT LOWER EMISSIONS IN 2050 AS COMPARED TO BUSINESS AS USUAL1.6
Global Scenario Projections: Energy-Related CO2 Emissions, 1970–2050
Source: UNEP 2011.
reduce emissions intensity of GDP by 20–25 per cent by 2020 compared to the 2005 level. National circumstances should define the appropriate strategy for each country. Quick and massive emission reduction is a major human development challenge in the short term. Countries should focus not only on reduc-ing emissions per se, but on promoting human progress beyond GDP growth.
A number of countries are already looking beyond GDP in defining their national policies
A number of countries are already looking beyond GDP in defining their national policies

1 THE HUMAN COST OF CLIMATE CHANGE 33
wellbeing could become entry points for action and behaviour change.179 Countries will also need to achieve shifts in governance institutions and public attitudes.
Zero-carbon per se is not possible, nor is it desirable. But as alternatives are considered, they need to be fully embedded in human develop-ment outcomes to help steer policies and behav-iour. Otherwise, the disadvantaged will face greater marginalisation and vulnerability.
Reaffi rming Human Development
Asia-Pacific faces both high exposure to the con-sequences of increasing temperatures and a large number of poor people. Despite rapid economic growth, inequality is increasing in many coun-tries. Even though the poor in the region have added little to greenhouse gas emissions, they will face the most serious consequences of global warming.
These facts make it imperative for Asia-Pacific to reaffirm the principles of human develop-ment in a time of climate change, and to sustain progress equitably and efficiently. Development strategies need to be reviewed to ensure that the poorest benefit from economic progress while countries as a whole minimise carbon emis-sions. It is not a question of choosing between adaptation and mitigation — the latter needs to be seen as an inherent part of adapting to changed circumstances. Asia-Pacific has the opportunity to avoid the traditional economic path of ‘grow first, clean up later’,180 and to lead the world in a different direction.
Individual countries can undertake a number of measures to fight climate change domestically. At the same time, it is becoming increasingly evident that progress will also require regional cooperation. This Asia-Pacific Human Devel-opment Report indicates the scale of the task. It highlights, through practical examples, what is
already possible, and what are the priority arenas for change.
Chapter 2 focuses on production. It highlights the intricate connections between economic and ecological systems, and argues that the countries of the region will need to reconsider the ways they manufacture goods, grow crops, raise ani-mals and generate and use energy.
Chapter 3 looks at consumption. It considers the urgent needs of the poor in the region, per-sistent development gaps and the purchasing power of the region’s new consumers, which will increase the demand for food, water, energy, housing and a wide range of consumer goods. This will put even greater pressure on natural resources. Countries across the world will have to plan for fairer and more balanced consump-tion patterns that are less energy- and resource-intensive.
Chapter 4 considers the implications for rural areas. The overriding priority is more equitable development that offers rural communities opportunities for more climate-resilient and diversified livelihoods. Governments need to provide the necessary infrastructure and social services to support local resilience; they need to stick with poverty reduction agendas that embed the protection of ecosystems.
Chapter 5 focuses on the region’s urban areas. Cities are major producers of greenhouse gases, but, because they concentrate people and infrastructure along rivers and coasts, they are also very vulnerable to climate change. Nevertheless, cities are also centres of finance, politics, dynamism and innovation, which should help them develop in more carbon-efficient ways, and find new and smarter strategies for adapting to a warmer world.
Chapter 6 sets out an agenda for sustaining lower-carbon human development that is climate-resilient, with proposals for governments, civil society and the private sector.
It is not a question of
choosing between adaptation and
mitigation — the latter needs to be seen as an inherent part
of adapting to changed
circumstances
It is not a question of
choosing between adaptation and
mitigation — the latter needs to be seen as an inherent part
of adapting to changed
circumstances


2PRODUCING FOR THE FUTURE

Unless we change direction, we are likely to end up where we are going.
Chinese proverb

2 PRODUCING FOR THE FUTURE 37
Producing for the Future
Economic growth in Asia and the Pacific is pri-marily dependent on fossil fuel energy, a pattern likely to become unsustainable. Countries will need to change the way they produce to reduce carbon emissions, enhance energy and resource efficiency, and prevent the loss of biodiversity and ecosystems. For some developing countries, this may involve uncomfortable trade-offs, but it can also open new opportunities for pursuing development that is sustainable and ensures progress for the poorest people.
While developing countries in the region must continue their economic growth to address development challenges, they must do so differently. Instead of following the historical trajectory of today’s industrialised countries, Asia-Pacific will need to explore less conven-tional options without compromising the cen-trality of people’s quality of life. In charting a greener development path for the region, this chapter uses a human development lens, focusing on people while seeing lower-carbon production as a prerequisite for continuing and widening overall human prosperity and wellbeing. Using recent evidence, it examines some greener options.
GREENHOUSE GASES FROM PRODUCTION
In the developing countries of the Asia-Pacific, an overwhelming share of total greenhouse gas (GHG) emissions comes from energy generation and industrial production, as well as from agriculture, whether in growing crops, husbanding animals or clearing forests. Overall, for developing countries in the region, indus-try, agriculture and energy generation, taken
Countries will need to change
the way they produce — for
pursuing development that
is sustainable and ensures progress
for the poorest
Countries will need to change
the way they produce — for
pursuing development that
is sustainable and ensures progress
for the poorest
together, contributed 84 per cent of emissions in 2005, as compared with an average of 74 per cent for the rest of the world. These three sectors will, therefore, need to play a central role in moving towards a lower-carbon future.1 Figure 2.1 shows the sources of greenhouse gases.
Between 1990 and 2005, the proportion of total GHG emissions from industrial production,
In the face of climate change, countries in Asia and the Pacific will need to change the way they manufacture goods, raise crops and livestock, and generate energy. This will mean moving to greener, more resilient, lower-emission options that not only sustain the environment, but also offer opportunities to the poor for employment and income. Countries will not be able to sustain human development unless they take climate change into account, nor will they be able to address climate change unless they reduce poverty and inequality and improve the quality of people’s lives.
FIGURE MOST GREENHOUSE GASES COME FROM INDUSTRY, AGRICULTURE AND ENERGY SUPPLY2.1
GHG Emissions Sources in Developing Countries in Asia and the Pacifi c
Source: Based on WRI 2011.Note: All fugitive emissions from the combustion of fuel are included in manufac-
turing and construction. Data do not include emissions from international bunkers.
2

ASIA-PACIFIC HUMAN DEVELOPMENT REPORT38
FIGUREENERGY MIX IN INDUSTRY, SELECTED COUNTRIES, 20072.3
Source: Patil 2011.Note: Calculations are based on data from United Nations 2010. The consumption of
coal, oil and natural gas by these industries does not include resources used in electricity generation.
supply rose from 14 to 28 per cent.2 The pro-portion of emissions from fuel combustion in transportation, though lower, also shows a rising trend — from 1990 to 2005, it rose from 4 to 6 per cent. In fact, between 1990 and 2008, the total amount of carbon dioxide (CO2) emis-sions from fossil fuel combustion in transport-ation in Asia rose by 161 per cent, compared with the world average of 44 per cent.3 Agriculture, including land use change and forestry, continues to be a major contributor, though its share declined from 47 to 30 per cent from 1990 to 2005.4
EMISSIONS COST OF INDUSTRY
For Asia-Pacific’s developing countries, the 26 per cent of GHG emissions from industrial pro-duction includes emissions from fuel combus-tion in manufacturing and construction, fugitive emissions from the extraction, processing, storage and transport of fuel to the point of final use, and emissions from industrial processes.5 The first two sources comprise more than two-thirds of total industrial emissions.6
Energy Use Sources
Around 40 per cent of energy use by industry in developing Asia-Pacific derives from coal.7 In this way, the region differs from the rest of the world, where a higher proportion comes from natural gas (Figure 2.2). Countries of developing Asia-Pacific burn 83 per cent of the world’s coal directly used for industry: China alone con-sumes 67 per cent of the regional total.8 This high share was driven mainly by energy-intensive manufacturing, including crude steel and cement, from 2000 to 2006.9 Coal is also the dominant fuel for industries in India, Indonesia, Nepal and Viet Nam (Figure 2.3). In Bangladesh and Malaysia, on the other hand, industry makes greater use of natural gas. The small island developing countries of the Pacific rely mostly on diesel and electricity.
The industrial energy use pattern in Asia-Pacific can be translated into an estimate of emissions as presented in Table 2.1. For 2007, total emissions from industrial energy use stood at 3,910 million tonnes of carbon dioxide equivalent (MtCO2e),10 which is nearly two-fifths of the total CO2 emissions in developing
FIGURECOAL IS A MORE DOMINANT ENERGY SOURCE FOR INDUSTRY2.2
Sources of Industrial Energy Use, Developing Asia-Pacifi c and the Rest of the World, 2007
Source: Patil 2011.
Notes: (a) Oil includes diesel, kerosene and fuel oil; ‘Other’ includes lignite and liquefi ed petroleum gas (LPG). (b) Calculations are based on data from United Nations 2010. The consumption of coal, oil and natural gas by industries does not include the resources used in electricity generation.
including manufacturing and construction, rose from 21 to 26 per cent, while that from energy

2 PRODUCING FOR THE FUTURE 39
TABLEINDUSTRIAL EMISSIONS ARE DOMINATED BY EMISSIONS FROM COAL AND ELECTRICITY PRODUCTION2.1
Industrial Emissions by Fuel Use, Selected Countries, ’000 Tonnes, 2007
Country Coal Kerosene Lignite Firewood Diesel Bagasse LPG Natural Gas/LNG
Residual Fuel Oil
Electricity Total (Million Tonnes)
Share of Asia-Pacifi c (%)
Bangladesh 1,279 15 · · · · 230 48 3.1 4,140 506 7,505 13.7 0.35
Cambodia · · · · · · · · 88 · · · · · · 88 235 0.4 0.01
China 761,790 1,231 · · · · 53,860 3,544 8,316 64,007 53,232 1,777,365 2,723.3 69.64
Fiji 1.8 · · · · · · 405 · · 9.2 · · 20 436 0.9 0.02
India 221,834 564 11,396 26,631 7,332 7,946 282 7,276 9,914 219,491 512.7 13.11
Indonesia 70,074 1,039 · · 28,145 13,348 795 448 25,385 6,750 37,878 183.9 4.70
Malaysia 3,552 79 66 · · 13,246 17 325 18,961 6,477 34,473 77.2 1.97
Mongolia 60 · · 248 · · · · · · · · · · 27 1,444 1.8 0.05
Nepal 798 34 · · 369 14 39 · · · · 3.4 720 2.0 0.05
Papua New Guinea
· · · · · · 33 507 10 46 · · 51 1,758 2.4 0.06
Philippines 3,232 49 4.4 710 601 351 261 182 3,198 13,664 22.3 0.57
Sri Lanka 124 · · · · 4,056 182 11 · · · · 732 2,173 7.3 0.19
Thailand 17,306 24 3,358 2,007 3,283 1,792 1,651 5,702 5,242 50,586 90.9 2.33
Viet Nam 14,046 40 · · · · 3,766 353 430 1,413 2,935 26,591 49.6 1.27
Asia-Pacifi c 1,137,443 3,578 20,492 61,951 105,184 16,347 12,579 199,522 111,437 2,241,928 3,910 100
World 1,375,000 18,501 58,129 167,620 382,803 31,682 61,245 1,213,989 345,689 5,879,988 9,535 · ·
Source: Patil 2011.Note: Asia-Pacifi c data refer to all developing countries of the region. Firewood used is assumed to come from unsustainable sources. The emissions
from coal, oil and natural gas do not include resources used in electricity generation. Calculations are based on data from United Nations 2010. · · Not available.
Countries of developing Asia-
Pacific burn 83 per cent of
the world’s coal directly used for
industry
Countries of developing Asia-
Pacific burn 83 per cent of
the world’s coal directly used for
industry
Asia-Pacific.11 Around 57 per cent of all industrial emissions were from electricity and 29 per cent from coal; the high share of emissions from the former indicates that most of it is derived from coal or other fossil sources.
China has the largest share of industrial emissions across developing countries in the region. Although it accounts for 61 per cent of the region’s industrial energy use, it is responsible for nearly 70 per cent of industrial emissions, mostly due to burning a larger amount of coal. India comes a distant second, with a share of about 13 per cent of industrial emissions, compared with its 16 per cent share of industrial energy use.12 Indonesia is third, accounting for around 5 per cent of industrial emissions, though its share of industrial energy use is 6.5 per cent.
Energy Use Effi ciency
Across the region, industries are producing more and using more energy, especially in the fast-growing countries. In 2006, industry’s total energy use of 1,073 million tonnes of oil equivalent (mtoe) was the largest of all sectors,
as shown in Figure 2.7. Between 1990 and 2006, however, industry’s share of total energy use fell from 45 to 42 per cent.13
The decline, while industrial output con-tinues to grow, is due mainly to improvements in energy efficiency.14 Over the past three decades, industrial energy intensity in Asia and the Pacific has improved in most sectors and across all manufacturing subsectors, as it has in other regions of the world.15 Globally, average industrial energy intensity fell 26 per cent between 1990 and 2008. For the developing East Asia and Pacific, and South and Central Asia,16 industrial energy intensity fell by 46 per cent and 45 per cent, respectively, during 1990–2008. Reductions in industrial energy inten-sity can be attributed to technological shifts and structural changes, such as moving from energy-intensive towards high-tech sectors, particularly in developed and high-income devel-oping economies. But among Asia-Pacific’s developing countries, in 2008, industrial energy intensity, measured by tonnes of oil equivalent (toe) per US$ million industrial output, varied widely — from 156 in Cambodia to 7,268 in Mongolia (Figure 2.4).17 In 2008, India, for

ASIA-PACIFIC HUMAN DEVELOPMENT REPORT40
distribution, preparation, consumption and waste management (Table 2.2). Emissions vary widely depending on the product and the man-agement of energy during each production phase.21
All countries could reduce their overall emis-sions by using energy more efficiently. If all the world’s steel manufacturers, for example, used the cleanest available technology, their emis-sions would fall by 340 million tonnes CO2 (MtCO2) per year.22 China’s big and medium iron and steel plants are 15 per cent less effi-cient than those in advanced countries, and could realise 143 million tonnes (Mt) of emis-sions reduction.23 This increasing efficiency would require significant investment or cross-border support in developing and diffusing existing advanced technologies.
Efficiency gains do not necessarily reduce overall energy use. Cheaper energy may, for example, attract new consumers who can now afford to buy more energy. It is important to sup-port overall reductions with appropriate policies and regulations.24
Environmental Regulations on Industrial Production
In the past, governments designed industrial policies primarily to increase production; there was much less concern for the environment. Today, developing countries in Asia-Pacific are taking greater account of environmental impacts. In most cases, they have started with the more visible problems of harmful industrial pollution, but are now also considering the threat of climate change.
Unfortunately, even where good policies or framework laws are in place, they may not be backed by detailed regulations, standards and enforcement mechanisms to ensure compliance. For example, China’s Energy Conservation Law was amended in 2007, but still needs further revisions and additional regulations on energy conservation measures. Its 2006 Renewable Energy Law, updated and adopted by the National People’s Congress in 2009, still needs to be backed by national criteria for solar applic-ations in buildings.25 In India, regulations are not enforced because they are not sufficiently flexible
If all the world’s steel manufacturers used the cleanest available technology, their emissions would fall by 340 million tonnes CO2 per year
If all the world’s steel manufacturers used the cleanest available technology, their emissions would fall by 340 million tonnes CO2 per year
FIGUREASIA-PACIFIC COUNTRIES DIFFER WIDELY IN INDUSTRIAL ENERGY INTENSITY2.4
Energy Intensity of Industrial Output, Tonnes of Oil Equivalent, for Selected Countries (1990, 2008)
Source: UNIDO 2011.Note: Energy intensity of industrial output is measured by toe/million US$ of
manufacturing value added (2000 constant prices).
example, used more energy per unit of indus-trial output than China, though over the past 20 years the energy intensity of India’s industrial production has decreased.18 The drivers of energy efficiency differ from country to country and from industry to industry, depending on plant technology, plant size, the capital costs of energy-efficient equipment, government policies on energy prices and regulation.19
More than two-thirds of the energy used by industry goes into producing raw materials; chemicals and petrochemicals account for 29 per cent, and iron and steel for 20 per cent.20 It is in these industries, therefore, that it is par-ticularly important to improve energy effi-ciency. And there are opportunities to do so. For example, in primary steel production, there are considerable differences in efficiency across countries and even between individual plants due to economies of scale, plant technology, the age of the plant, the quality of iron ore, operational know-how and quality control.
The food industry also absorbs consider-able amounts of energy through multiple phases of primary production, processing, packaging,

2 PRODUCING FOR THE FUTURE 41
to deal with minor but persistent infractions by smaller enterprises (Box 2.1).26
Strong institutions are important for enforce-ment, including enforcement at the local level. Local governments often lack the capacity or logistical support to act to enforce national regulations. Other hindrances include vested political and commercial interests or limited resources. In the Philippines, for example, field personnel of the Environmental Management Bureau are responsible for conducting inspec-tions of all regulated companies under their jurisdiction. But the Bureau has monitored and inspected only about a quarter of the regulated industrial units in its database, estimated to be less than 5 per cent of the total registered industrial establishments nationwide in 2003. Enforcement inspection reports are often ques-tioned because they lack crucial information for building a strong case against the violator.27 For example, in Viet Nam, Environmental Inspectorate agency officials may lack authority at local levels and may not have sufficient cap-acity or specialised knowledge for monitoring the compliance of industrial units.28 There can also be problems of cooperation between the relevant agencies involved in enforcement.
Incoherent state policies can be a major bottleneck for moves towards renewable energy even when there are interested private-sector companies. For instance, a recent consultation of high-level private-sector representatives in the fifth Asia-Pacific Urban Forum highlighted the growing interest among companies in renew-able energy, but pointed out that continued subsidies for fossil fuels remain a problem in some countries. Accessing funds for renewable energy through existing international finance mechanisms and taking advantage of carbon credits remain difficult for private-sector com-panies interested in pursuing low-carbon production.29
Incomplete Accounting of the Costs of Growth
Compared with other regions, Asia has recov-ered faster from the recent economic crisis. But its success has come at the cost of rising inequality and environmental degradation
Accessing funds for renewable
energy through existing
mechanisms remains difficult
for private-sector companies
interested in pursuing low-
carbon production
Accessing funds for renewable
energy through existing
mechanisms remains difficult
for private-sector companies
interested in pursuing low-
carbon production
TABLEFOOD PRODUCTION: FACTORS AFFECTING GHG EMISSIONS2.2
Phases in the Food Production Chain
GHG Impact Factors
Primary production Machinery used Age of machinery
Use of renewable energy vs fossil fuel
Type of produce (e.g., meat vs vegetables)
Organic vs conventional production, use of fertilisers and pesticides
Distance and mode of transport of inputs
Processing (includes assembly and storage)
Source of energy used in each stage of processing
Method and time of storage
Effi ciency of equipment
Distance and mode of transport between processing plants
Preparation and consumption Source of energy used in preparation
Method and time of storage (refrigeration and freezing)
Effi ciency of equipment
Number of people consuming the product
Distance and mode of transport for collection
Distribution Mode of transport (air, rail, sea, road)
Fuel type and effi ciency
Distance and speed travelled
Refrigerated transportation
Packaging and end-of-life management
Purpose of the packaging
Type of material (virgin material, recycled, reused)
Ability to recycle or reuse the material
Distance material travels from source/supplier
Distance to end-of-life management
Energy use during end-of-life treatment
Source: Adapted from Young et al. 2010.
that has disproportionately affected the poor. Growth in manufacturing and services has not been creating sufficient jobs, which is one reason for the persistent poverty. In East Asia and the Pacific, although manufacturing output increased by almost 180 per cent in the 1990s, the associated employment increased by only 3 per cent, amounting to ‘jobless growth’.30 Asia-Pacific has nearly two-thirds of the world’s ‘working poor’,31 and in many countries a high proportion of people are in ‘vulnerable employment’ — 56 per cent in East Asia, 62 per cent in South-East Asia and the Pacific, and 76 per cent in South Asia, compared with the world average of 51 per cent.32 Unfortunately, costs like these — assessing a complete cycle of production — go mostly uncounted in

ASIA-PACIFIC HUMAN DEVELOPMENT REPORT42
conventional measurements of economic pro-gress such as GDP.
Overlooking Social and Ecological Costs
The benefits of exploiting common ecosystems or damages caused to the environment also go unrecognised — a classic public goods dilemma of being valuable but uncounted, costly but not charged. A country’s GDP measures little more than market transactions, and excludes the con-tribution of ecosystem services. These are typ-ically regarded as ‘free’, even though replacing them would require massive investment. It would be very costly, maybe even impossible, to regenerate carbon sinks, replace fuel sources, pro-vide clean air in cities, duplicate nature’s water filtering system, extract freshwater from brack-ish water or reclaim cultivable land from coastal saline incursions.
The development of mega hydroelectricity projects such as the one in the Greater Mekong sub-region, for example, while beneficial in terms
of the fiscal resources it delivers to producer regions, comes at high, non-monetised costs. Producer states and regions bear the full social and environmental costs associated with the development of hydroelectricity, including mas-sive social dislocation, resettlement and inter-ruption of local livelihoods as well as a variety of environmental impacts that will be felt for generations to come.33
There has been little agreement on how envir-onmental and social costs could be measured so that producers would be required, for example, to pay for pollution.34 This tempts many to con-tinue with business as usual. As a result, many countries in the region have experienced un-checked industrialisation that has damaged communities and rich natural resources. For example, in the state of Sarawak in Malaysia, forest land is being used for developing a mas-sive industrial park for heavy industries.35 In the Indian states of Odisha and West Bengal, large-scale land acquisition by the state to facilitate the mining and industrial activities of big businesses
There has been little agreement on how environmental and social costs could be measured so that producers would be required, for example, to pay for pollution
There has been little agreement on how environmental and social costs could be measured so that producers would be required, for example, to pay for pollution
BOX 2.1
ENFORCING ENVIRONMENTAL REGULATIONS IN INDIA
When monitoring environmental legislation or enforc-ing compliance, governments focus pri-marily on large companies. In fact, however, many of the problems relating to compliance emerge in smaller enterprises. In India, for example, micro, small and medium enterprises (MSMEs) account for 45 per cent of the manufacturing output and 40 per cent of the total exports of the country.
But their energy intensity and inefficient production and management processes lead to greenhouse gas emissions. Brick kiln enterprises, for example, account for over 8 per cent of the total coal consumption of the country, besides using a large quantity of biomass fuels and topsoil. They contribute 42 million tonnes of CO2 per annum, which is about 4.5 per cent of total GHG emissions from India. The small and medium enterprises (SMEs) have few forms of pollution control in place, and are responsible for 70 per cent of the industrial pollution in the country. Yet as far as enforcement is concerned, these smaller enterprises are often ignored.
One of the problems is that the regulatory tools are not sufficiently flexible. They may not, for example, allow inspectors to address con-tinuous small-scale violations,
such as exceeding emissions on effluents or failing to comply with the requirements for self-monitoring and reporting. In addition, procedures are rigid and time-consuming, while penalties are too low and fail to consider the full economic and environmental impacts of the violation.
For smaller enterprises, the best approach is a mix of incentives and regulatory instruments. One option, which is employed in some states in India, is for larger enterprises to deposit bank guarantees — a certain percentage of total compliance cost. The prospect of forfeiting these is a powerful deterrent.
But smaller enterprises with low profit margins may be unable to afford cleaner technologies unless they can rely on a well-structured system of grants or loans. There is also a need for increasing their awareness about emerg-ing opportunities in cleaner and energy-efficient tech-nologies. This requires developing the knowledge base of smaller enterprises and encouraging their representa-tion in different climate change forums for overall policy making.
Sources: Government of India 2002; Government of India n.d.-a; Soni 2009; USAID et al. 2006.

2 PRODUCING FOR THE FUTURE 43
has resulted in the rapid degradation of natural resources and loss of land and livelihoods for local people, provoking protest movements.36 If industrial development is required to push higher economic growth, it needs to take into account the social and environmental costs of production to make growth more inclusive and sustainable.
Skewed Emissions Accounting
Asian countries, anxious to boost domestic economic growth, have often welcomed multi-national businesses, even those in ‘dirty’ indus-tries. As a result, their emissions increase, though the output is destined largely for developed countries. Value chains of production and con-sumption linked via international trade enable developed countries with a commitment to reduce emissions to relocate their carbon-intensive industries to countries that have no, or low, caps on emissions — the problem of ‘carbon leakage’. Global net emissions transfers from developing to developed countries through international trade increased from an estimated 0.4 gigatonnes of CO2 in 1990 to 1.6 gigatonnes of CO2 in 2008.37
This means, in effect, that some countries can continue consuming carbon-intensive goods without necessarily adding to their own domestic emissions. The United Kingdom, for example, has shifted some carbon-intensive pro-duction to developing countries in Asia, thus reducing its own emissions but increasing those in Asia.38 These practices are currently limited to a few industries, such as steel, cement and pri-mary aluminium. Nevertheless, since existing methods of emissions reporting are limited to the production location, they miss the geograph-ically dispersed value chains and exclude the consumer end altogether.
These considerations could be applied to environmental accounting, though a first pri-ority would be to strengthen statistical systems to improve tracking of emissions and the socio-environmental costs. This would not only improve monitoring of greenhouse gas emis-sions and human development indicators, it would also prepare countries for market-based finance instruments such as cap-and-trade, whether within or across national boundaries.
LOWER-CARBON INDUSTRIAL PATHWAYS
Energy Effi ciency
It is important to raise energy efficiency in order to shrink carbon footprints without sacrificing growth. Industrial energy efficiency could be improved either by substituting raw materials that would require less energy to process, or by using techniques that reduce the use of energy. According to one estimate, deploying commercially available technologies and best practices on a global scale could save between 18 to 26 per cent of current primary energy use in industry.39
The more energy-intensive industries, such as the manufacturing of chemicals, paper, steel and cement, should be able to boost energy effi-ciency by 10 to 20 per cent.40 Overall, industries could achieve energy savings of 15 to 30 per cent by improving the efficiency of their electric motor and steam systems. Even industries where current processes are already highly efficient can make further gains through innovations in materials and new technologies.
One emerging option is CO2 capture and underground storage, particularly for indus-tries that produce large volumes of gases with high CO2 concentrations, such as iron and steel, cement, chemicals and petrochemicals, and pulp and paper.41 Translating these innovations into useful applications, however, will require multi-sector and cross-border cooperation for financing.
Technology for Low-Carbon Emissions
Greening production will mean using more renewable energy and low-carbon technologies while reducing the use of fossil fuels,42 which would involve a paradigm shift in Asia-Pacific developing countries. Such measures will reduce emissions and could be good business, where lower-cost options emerge. But they come with a number of requirements, including reforming markets and ensuring well-informed consumer demand. Table 2.3 lists ways to overcome some of the current barriers.
The initial impetus would most likely have to come through public investment, as in Brazil
Existing emissions
reporting is limited to the
production location, it misses the value chains and excludes the
consumer end

ASIA-PACIFIC HUMAN DEVELOPMENT REPORT44
where the world’s first large-scale ethanol programme was launched in 1975 by the gov-ernment.43 Government support can be large in the early stages of innovation, diminishing as the technologies mature. In research and development (R&D), the public sector can support high-risk, fundamental research with a long-term perspective, while encouraging the private sector to invest and focus on near-competitive technologies and shorter-term dem-onstration projects. A number of policies that support low-carbon technologies are identified in Figure 2.5.44
Many countries in the region lack technical capabilities for developing or adapting techno-logies, especially those nations that are the least developed or face geographical challenges related to location on small islands or in moun-tainous terrain. The focus here should be on creating local capacities to facilitate technology transfer, adapting technologies to local market conditions and supporting private-sector players to install, manufacture, operate and maintain
the technologies. At the 16th session of the Conference of Parties (COP 16) in 2010 in Cancun, countries agreed to establish a ‘techno-logy mechanism’. Its purpose is to accelerate the development and transfer of environmentally sound technologies, especially to developing countries, to support immediate action on both mitigation and adaptation.45 But the exact mech-anism has yet to be specified.
Strategic National Policies and Regulations
Governments can encourage the low-carbon shift by providing the necessary regulations, enforcement and incentives (Box 2.2). China, for example, has formulated a set of national policies and programmes aimed at improv-ing industrial energy efficiency. China’s 11th five-year plan (2006–10) included the goals of reducing energy intensity by 20 per cent, a 30 per cent decrease in the use of water per unit of industrial value added, and a 10 per cent reduc-tion in the total emissions of major pollutants
TABLEOVERCOMING BARRIERS TO THE DEPLOYMENT OF ENERGY-EFFICIENT TECHNOLOGIES AND PRACTICES2.3
Barrier Why is This a Barrier? How to Overcome the Barrier
Low or volatile energy prices
Subsidies Prices do not include environment costs
Eliminate perverse subsidies globally Put a value on carbon and ecosystem services
High upfront costs and long payback periods
Most consumers value the present cost of consumption Lack of capital
Economic incentives (for example, tax reductions) to decrease fi rst cost
Use fi nance mechanism to leverage investments
Slow diffusion of technologies
Lack of skills, knowledge and support for the use of technologies
Fragmented and non-integrated industry structures (for example, the building sector)
Lack of effective intellectual property rights (IPR) protection
Technology standards Enhance capacity building Ensure IPR protection in accordance with WTO regulations Boost best-practice sharing and energy effi ciency education
Entrenched business models
Lack of incentives for energy companies to reduce customer demand
Internalise carbon prices in energy services Financially reward end-user energy effi ciency measures Promote energy service companies
Diversity of consumers and energy needs
No single solution fi ts all Promote voluntary sectoral initiatives and negotiated agreements
Information failures Lack of information or imperfect information regarding future energy prices and energy effi ciency alternatives
More effective technology standards (for example, building codes) Product energy labelling Advice on smart energy metering
Split incentives (principal agent problem)
Those making decisions on energy effi ciency do not benefi t (for example, building owners and tenants)
Provide clear information and incentives (for example, tax rebates, mortgages discounts, rebates, preferential loans)
Uncertainties of investment and risks
Uncertainties add a premium to investments Economic incentives to reduce costs and risks Develop robust energy and carbon markets Establish stable regulatory frameworks
Consumer behaviour Low priority of energy-effi cient investments Lack of awareness and information on energy consumption and
costs
Improve product information Incentives to remove and replace old equipment Raise education and awareness on energy effi ciency
Investment cost higher than expected
Projects do not include all transaction costs Boost best-practice sharing and energy effi ciency education
Source: WBCSD 2009, cited in TERI 2011.
Greening production will mean using more renewable energy and low-carbon technologies while reducing the use of fossil fuels

2 PRODUCING FOR THE FUTURE 45
such as sulphur dioxide and chemical oxygen.46 These targets have been met or exceeded. Energy consumption per unit of GDP fell 19 per cent, sulphur dioxide emissions fell 14 per cent and chemical oxygen demand decreased by 13 per cent. Further, water consumption per 10,000 Yuan of value added of industry decreased by 37 per cent.47
In the coming years, China is expected to focus more on energy-efficient products and emission reduction, while continuing to maintain steady and rapid economic development.48 For example, according to the 12th five-year plan, by 2015, non-fossil fuel energy consumption as a share of primary energy consumption should reach 11 per cent, annual energy consumption per unit GDP should be reduced by 16 per cent, and CO2 emissions per unit of GDP should be cut by 17 per cent compared to 2010.49
The Philippines has had environmental legislation for more than 30 years. The 1977
FIGUREPOLICIES FOR SUPPORTING LOW-CARBON TECHNOLOGIES2.5
Source: IEA 2010c, cited in TERI 2011.Notes: RD&D: Research, Development and Demonstration; CCS: Carbon Capture and
Storage; CSP: Concentrated Solar Power; PV: Photovoltaic; CHP: Combined Heat and Power.
BOX 2.2
STRATEGIC NATIONAL POLICIES AND REGULATIONS FOR ADAPTING LOW-CARBON PRODUCTION
Countries in parts of Asia and the Pacific have started to institutionalise strategic national policies and regulations for adapting low-carbon production. In fact, each country should have an institutional framework or a law that specifically addresses climate change, taking into account the best interests of that particular country. Establishing such policies and legislation would help to identify the strategic approach, create institutional arrangements, identify responsible bodies, empower and encourage voluntary actions, establish appropriate incentives and disincentives, and provide links to sector-based legislation for detailed implementation.
Legislating for low-carbon growth — Republic of Korea: In 2010, the government enacted legislation that requires the country to spend 2 per cent of its GDP on businesses and projects that will boost economic growth while reducing greenhouse gas emissions. The government has also announced that by 2020 it will reduce emissions to 20 per cent below their 2005 levels.
Energy conservation law — India: The 2001 Energy Con-servation Act aims to regulate energy use and promote energy efficiency in industries as well as other enduse sectors. It specifies energy use standards for appliances that consume, generate, transmit or supply energy, as well as codes for efficient use of energy in buildings. In actual
enforcement, the government can amend some of these codes to suit local conditions. Compliance is monitored by accredited energy auditors. India’s 11th five-year plan (2007–12) includes objectives such as reducing the energy intensity of output by 20 per cent by 2016–17, controlling vehicular emissions, promoting public transport and increasing access to renewable energy. This plan was supported by the 2006 National Environment Policy and the 2008 National Action Plan on Climate Change.
The national green technology policy — Malaysia: In order to promote low-carbon technologies and ensure sustainable development while conserving the natural environment and resources, the 2009 National Green Technology Policy has been promoted by the Ministry of Energy, Green Technology and Water (MEGTW). As a coordinator and facilitator for the green technology roadmap, the gov-ernment aspires to lead by example. Through adopting green technology in government facilities, such as the ‘low-energy office’ of the MEGTW and the UNDP-assisted green energy office of the Malaysia Greentech Corporation, the government demonstrates that a building can use less fossil fuel and instead draw power from its own renewable energy generation system.
Sources: Government of India 2001; Ministry of Natural Resources and Environment Malaysia n.d.; PCGG 2010.

ASIA-PACIFIC HUMAN DEVELOPMENT REPORT46
Philippine Environmental Policy requires pri-vate developers, as well as corporations that are government owned or controlled, to submit an impact statement for every activity that significantly affects the quality of the envir-onment.50 Subsequent laws have included the Philippine Clean Air Act of 1999, which imposes emissions fees to encourage industries and motor vehicles to reduce or prevent pollution. It also prescribes stiff penalties for emissions violations.51
Selected Good Practices for Low-Carbon Production
Energy audits — Melbourne, Australia: The city government, through its industry greenhouse programme, requires large greenhouse gas emit-ters to complete audits and to identify emissions reduction measures that can be paid back in three years. The programme commenced in 2004 and, to date, has seen $49 million invested, with an average payback period of less than two years. This focus on economic return has delivered immediate and sustained results — reducing CO2 emissions by 1.1 million tonnes and saving companies $34 million per year.52
Following the top runners — Japan: Incorporated as an element of the Energy Conservation Law in 1998, the Top Runner Programme requires manufacturers and importers to increase the end-use efficiency of goods that require large amounts of energy. Through a regular cycle of assessments, the programme identifies the best technology available — the ‘top runner’. This benchmark then becomes the standard for that product category. The target dates for achieving the standards, typically four to eight years, are agreed upon with all stakeholders. The programme covers 21 products that account for 80 per cent of residential energy use. During 1998–2006, the Top Runner Programme is estimated to have cut energy use by 10 per cent in the residential sector and by 5 per cent in passenger transportation. By 2030, these figures are expected to reach 30 per cent for residential and 26 per cent for transportation. The Green Procurement Law of 2001 requires public procurement of only those products that meet Top Runner standards.53
Discouraging high-emissions exports — China: The government is now trying to discourage environmentally unfriendly production. In 2006, it started levying export taxes on energy- and resource-intensive products to discourage their export and to save scarce energy and resources.54
Setting energy use efficiency improvements as job performance criteria — China: In 2006, China established the ‘Top 1,000 Enterprises Energy Conservation Action Programme’, which covered 1,008 enterprises in nine key energy sup-ply and consuming subsectors. The National Development and Reform Commission signed energy-saving responsibility agreements with these enterprises. Achieving energy-efficiency improvements has become a job performance criterion for the heads of these enterprises, which, between them, account for around half of total industrial energy use. The results have been encouraging, with savings of 20 million tonnes of coal equivalent in 2006 and 38 million in 2007.55 The programme aimed to save 100 million tonnes cumulatively by 2010, thus making a significant contribution to China’s overall goal of a 20 per cent improvement in energy intensity.
Moving towards renewable and cleaner energy use in the silk industry — Karnataka, India: Each year India produces 16,000 tonnes of raw silk. Heating the water for cooking the cocoons entails the use of around 145,000 tonnes per year of fuelwood and 170,000 tonnes per year of other biomass fuels, with corresponding CO2 emissions. In Karnataka, a new solar water heating system is being piloted, which has saved around 80 per cent of firewood use and is thought to have reduced CO2 emissions by around 70 per cent.56
Greening small businesses through technology and finance support — Viet Nam: Small and medium enterprises in Viet Nam use energy very in-efficiently. With funding from the Global Environment Facility, the UNDP and the Government of Viet Nam are helping raise awareness among more than 400 small and medium enterprises in five key sectors: brick-making, ceramics, textiles, paper production and food processing.57 The project offers technical and financial support to install energy-efficient technologies. Since 2006, this initiative has saved
Countries in parts of Asia and the Pacific have started to institutionalise strategic national policies and regulations for adopting low-carbon production

2 PRODUCING FOR THE FUTURE 47
SPECIAL CONTRIBUTION
DOING GROWTH DIFFERENTLY IN THE CONTEXT OF CLIMATE CHANGE
SUNITA NARAIN
We all know today that the threat of climate change is urgent. We also know that combating this threat will require deep and drastic cuts in greenhouse gas emissions. This is when, already, the poor of the world, who are more vulnerable and less able to cope, are feeling the pain of a changing and more variable climate. The question is: why has the world been desperately seeking every excuse not to act, even as science has confirmed and reconfirmed that climate change is real? Climate change is related to carbon dioxide and other emissions, in turn related to economic growth and wealth in the world. In other words, it is human-made and can devastate the world as we know it.
The issues are clear. But the answers are lost in prevarication. The reason is simple: climate change is related to economic growth. It is, as is famously said, the ‘market’s biggest failure’. In spite of years of protracted negotia-tions and targets set under the Kyoto Protocol, no country has been able to de-link economic growth from the growth of emissions. No country has shown how to build a low-carbon economy, as yet.
The inconvenient truth is not that climate change is real, but that climate change is about sharing that growth between nations and people. There is a stock of greenhouse gases in the atmosphere, built up over centuries in the process of creating the wealth of nations. This has already made the cli-mate unstable. Poorer nations will now add to this stock through their drive for economic growth. But that is not an excuse for the rich world not to take on tough, deep and binding emission reduction targets. The principle has to be that they must reduce so that
we can grow. The question is to find low-carbon growth strategies for emerging countries, without compro-mising their right to develop.
This can be done. It is clear that coun-tries like India and China provide the world the opportunity to ‘avoid’ additional emissions. The reason is that they are still in the process of building energy, transport or indus-trial infrastructure. They can make investments in leapfrog technologies to avoid pollution. In other words, we can build our cities on public trans-port; our energy security on local and distributed systems, from biofuels to renewables; our industries can use the most energy-efficient and so pollution-efficient technologies.
China and India know that it is not in their interest to first pollute, then clean up; or first be inefficient, then save energy. But the technologies that exist are costly. It is not as if China and India are bent on first investing in dirty and fuel-inefficient techno-logies. They invest in these, as the now rich world has done: first add to emissions; make money; then invest in efficiency. The global climate agree-ment must recognise this fact and pro-vide technology and funds to make the transition in the world.
There is another inconvenient truth: cutting emissions at the scale that is needed will require the world to seri-ously reinvent the way to growth. The agenda then is to reinvent growth without pollution.
But for the past 20-odd years of climate negotiations — from Rio to Copenhagen — the world has looked for small answers to this big problem. First it believed that the magic bullet was to plant biofuels — crops that could
fuel the world. It learned quickly that there was a trade-off in this business as the cost of food skyrocketed. The next techno-fix was to improve the fuel economy of each vehicle, till it was found that even as cars became more efficient, people ended up buying more and driving more. The end result was the same. Emissions increased. Now the world is banking on hybrids. It refuses to learn that the scale of transition will need more than just an efficiency revolution. It will need a sufficiency goal.
The hard truth is that the options for serious emissions reduction are limited in the industrial model we belong to or want to inherit. The world has to look for new ways to cut emissions and pay big-time for these. There are win–win options, but only if we consider that in all current options the planet is losing. This new growth model will need changes in behaviour and lifestyle to cut emissions. It will need new drivers to stimulate quick and aggressive tech-nology innovation. Changes to take the world much beyond the known and the ordinary. This change will not come cheap.
This is the most inconvenient of all truths. And this is precisely why the already rich world wants to spin a deal, which is weak on commitment and action. This is not good for climate change. It is not good for all of us.
Sunita Narain is a writer and environmentalist. She is currently Director-General of the Centre for Science and Environment (CSE), Director of the Society for Environmental Communications, and publisher of the fortnightly magazine, Down to Earth.

ASIA-PACIFIC HUMAN DEVELOPMENT REPORT48
TABLE AGRICULTURAL GHG EMISSIONS BY MAJOR SOURCES, SOUTH AND EAST ASIA, 20052.4
Nitrous Oxide from Soils
Methane from
Livestock
Methane from Rice
Methane and Nitrous Oxide from
Manure
Methane and Nitrous Oxide from
Burning
Total
South Asia
Tonnes CO2e/yr 536 275 129 40 24 1,005
% of region’s total 53 27 13 4 4 100
% of source’s world total 20 15 20 9 3 17
East Asia
Tonnes CO2e/yr 600 294 432 127 53 1,505
% of region’s total 40 20 29 8 4 100
% of source’s world total 23 16 68 29 14 25
Source: Rosegrant et al. 2010, cited in Dev 2011.Note: Tonnes CO2e/yr implies tonnes of carbon dioxide equivalent per year.
156 kilotonnes of oil equivalent, while boosting profits and increasing quality especially through the use of more modern kilns for bricks and ceramics. The project also aims to encourage energy efficiency through financial and tax incentives as well as energy use labelling. By the end of 2011, the project intends to have covered 500 enterprises and achieve a cumulative reduction of 700 kilotonnes of CO2 emissions and 160 kilotonnes of oil.
THE FOOTPRINT OF AGRICULTURE
While energy supply and use in industrial activ-ities account for the majority of GHG emissions in developing Asia-Pacific, around 30 per cent of emissions come from agriculture, including growing crops and raising livestock, land use changes and deforestation.58 Asian countries account for 37 per cent of world emissions from agricultural production.59 The principal gases are nitrous oxide and methane and, to a lesser extent, CO2. As with industry, many of these emis-sions should also be distributed for attribution to countries that consume the region’s agriculture-based exports — biofuels and timber products, for example.
Crop Production
Nitrous oxide is produced in agriculture from both natural and human-related sources, par-ticularly from the application of nitrogen-based
fertilisers. South Asia and East Asia together contribute 43 per cent of global nitrous oxide emissions from soils (Table 2.4).
Methane comes from, among other things, flooding land for rice cultivation. Asia produces and consumes 90 per cent of the world’s rice, and 90 per cent of rice land is at least temporarily flooded.60 East Asia alone contributes 68 per cent of global methane emissions from rice pro-duction. In addition, extractive farming over a long period has reduced the organic content of soil, a problem aggravated by the conversion of forests, prairies and steppes into crop and grazing lands. Most agricultural soils have lost 30 to 40 tonnes of carbon per hectare.61
Agriculture generates some CO2, as when conventional ploughing exposes soil to solar radiation, mixes residues into soil, and adds air to macrospores.62 Practices such as burning crop residues and other wastes or allowing them to decompose contribute as well.
Land Use Change and Deforestation
When trees are burned, harvested or otherwise die, they release CO2. In developing countries of Asia-Pacific, land use changes and deforestation contribute 14 per cent of total GHG emissions, compared to the global average of 12 per cent in 2005.63 Loss of forests also reduces the potential for subsequent carbon sequestration and under-mines the livelihoods of those who depend on forest resources.
Some of this deforestation in the region is the result of logging or clearing land for pasture. A key driver of deforestation is cultivation, either for food crops or for cash crops such as rubber, sugar cane, coffee and oil palm, a trend driven by better living conditions and a growing global demand for biodiesel.
Foodgrains and cash crops are key causes of deforestation throughout South-East Asia,64 where deforestation has been most rapid. Between 2000 and 2010, forest cover decreased by 0.41 per cent per annum, compared to a 0.36 per cent annual decrease in Oceania. Elsewhere, forest cover increased, by 0.28 per cent in South Asia and 1.16 per cent in East Asia.65 The most extensive loss of trees has been in tropical forests, where deforestation releases more CO2 than in boreal and temperate forests. South-East Asia
Around 30 per cent of emissions come from agriculture, including growing crops and raising livestock, land use changes and deforestation
2 PRODUCING FOR THE FUTURE 49
has approximately a third of the world’s tropical forest area. Indonesia alone accounts for around 9 per cent of the global total and nearly 13 per cent of global tropical deforestation.66
In general, reducing emissions from defor-estation and forest degradation is an important area of focus for mitigation efforts.67 This can begin by better measuring GHG emissions from agriculture and forestry. Countries need to strengthen their capacities for measurement, reporting and monitoring. They can also give farmers and forest-dependent communities incentives to reduce emissions, and make the conservation of natural forests a central part of climate change mitigation, since forests absorb more carbon than they release.
The Livestock Industry
The other major source of agricultural emis-sions is livestock. Following a life-cycle analysis approach, these contribute an estimated 18 per cent of global anthropogenic GHG emissions, consisting of methane from animals, CO2 from land use and its changes, and nitrous oxide from manure and slurry management. The more intense emissions come from industrial livestock operations rather than small-holder livestock systems.68
The increase in industrial livestock is prompted largely by changing diets and the rising consumption of meat.69 As countries get richer, more people can afford animal protein, which in Asia and the Pacific is primarily from beef, chicken and pork. Depending on the level of development, per capita annual meat consump-tion varies from 5 to 50 kilogrammes. The most developed countries, such as Australia and Japan, account for much of the beef. In East Asia, the predominant meat consumed is pork — 30 kilogrammes per capita per year. But poultry is also important across the region: China is the world’s largest importer of poultry products, and India in recent years has seen rapid increases in poultry production.70
GREENER OPPORTUNITIES FOR AGRICULTURE
To meet growing food needs, Asia-Pacific coun-tries will need to increase agricultural output while minimising emissions and protecting the
natural environment. This will require renewed attention to agriculture, which in recent years has been relatively neglected. Giving farmers incentives to reduce carbon emissions from soil and deforestation is one priority. Another is assisting farmers in protecting themselves against the adverse impacts of climate change by adapting agricultural practices. Country experiences reveal that there are opportunities for greener agriculture. A number of efforts are already under way.
Reducing methane in rice production — Philippines: Bohol Island is one of the biggest rice-growing areas in the Visayas regions. Rice production here as elsewhere typically involves continuous flooding, which generates large amounts of methane. A new technique developed by the International Rice Research Institute, in cooperation with national research institutes, is ‘alternate wetting and drying’. In this case, irrigation water is used to flood the field for only a certain number of days after the disappearance of ponded water. The number of non-flooded days can vary from one to more than 10. In Bohol, the initial motivation for trying this technique was a shortage of irrigation water. By making better use of water, farmers were able to increase cropping intensity from around 120 to 160 per cent. But alternate wetting and drying also has the benefit of halving methane emissions.71
Farming with zero-tillage — India: An alternative to ploughing, which releases greenhouse gases from the soil, is ‘zero-tillage’, which involves using special equipment to drill seeds into soil. Combined with residue management and proper fertiliser use, this can help preserve soil moisture, maximise water infiltration, minimise nutrient runoff and raise yields. Zero-tillage has been adopted mostly in high-income countries, but is expanding rapidly in Asia, including India. In 2005, in the rice–wheat farming system of the Indo-Gangetic plain, farmers adopted zero-tillage on 1.6 million hectares; by 2008, 20–25 per cent of the wheat in the states of Haryana and Punjab was cultivated using minimum tillage.72
Sequestering carbon with biochar — Cambodia, India and the Philippines: An alternative to burning crop
Giving farmers incentives to
reduce emissions from soil and deforestation
is one priority; another is
assisting farmers in adapting agricultural
practices

ASIA-PACIFIC HUMAN DEVELOPMENT REPORT50
residues, which releases CO2, is to transform the waste into ‘biochar’. This substance is similar to normal charcoal, but, instead of being produced for burning, the biochar is buried in the soil — a traditional technique used by indigenous peoples in the Amazon rainforest. Biochar is made by burning crop residues such as rice husks, sugarcane trash and corn cobs at low temperatures in the almost complete absence of oxygen. Field trials in India, Cambodia and the Philippines are encouraging, indicating the potential for sequestering carbon on a huge scale while improving soil productivity.73
Reforestation to sequester carbon — China: Most Asia-Pacific countries have now recognised the value of afforestation and reforestation. For example, the promotion of reforestation in China to develop carbon sinks has raised forest coverage from 12 per cent in 1980 to over 18 per cent in 2010.74
Changing farmers’ attitude towards organic farming, growing indigenous crops — Andhra Pradesh, India: To help combat and adapt to global warming, a collective of 5,000 women in 75 villages in this arid part of southern India is providing chemical-
free, non-irrigated, organic agriculture. The women successfully grow as many as 19 types of indigenous crops on previously degraded lands, as certified by the Participatory Guarantee Scheme of the Organic India Council.75
ENERGY GENERATION AND TRADE-OFFS
In 2005, energy supply (electricity and heat generation) accounted for around 28 per cent of developing Asia-Pacific greenhouse gas emis-sions.76 The region as a whole is responsible for around one quarter of the world’s production and use of energy.77 But, as Table 2.5 indicates, there is considerable variation in domestic energy supply. The Islamic Republic of Iran, Malaysia and, to some extent, Mongolia, Myanmar and Viet Nam have energy surpluses, with net imports being negative, whereas other countries in the region depend for their energy needs mostly on imports. Indonesia is no longer a net exporter of oil, and suspended its membership in OPEC in January 2009.78
Primary Energy Sources
Overall, around 85 per cent of the region’s pri-mary energy comes from fossil fuels in the form of coal, natural gas and oil — a proportion that has not changed much over the years (Figure 2.6).79 This proportion is higher than the world average of around 81 per cent, though the share varies considerably: from 11 per cent in Nepal to 99 per cent in the Islamic Republic of Iran, as shown in Table 2.5.
With respect to coal, most countries in the region are import-dependent. Since 2007, China has become a net importer; other major importers are India, Malaysia, Pakistan and the Republic of Korea. India has relatively large coal reserves, but these are of low quality, so it still has to import.80 Gas is cleaner and more efficient, and many countries are making greater efforts to increase their reserves, most of which are con-sumed domestically. Japan and the Republic of Korea are large importers of gas; India and China also are gas buyers. In 2010, the region imported 211 billion cubic metres of natural gas.81 The use of oil has continued to increase in Asia-Pacific at a much faster pace than the world average, largely for use in transport.82 Unable to meet its
FIGURECOAL IS STILL THE MAIN SOURCE OF ENERGY2.6
Composition of Primary Energy Use in Asia and the Pacifi c, 1990–2006
Source: Based on APEC and ADB 2009b.Note: Asia-Pacifi c in this fi gure refers to the ADB regional classifi cation, which includes
the developed and developing countries of the region as well as Central Asian countries (see note 79). Mtoe: million tonnes of oil equivalent.
Around 85 per cent of the region’s primary energy comes from fossil fuels in the form of coal, natural gas and oil — a proportion that has not changed much over the years

2 PRODUCING FOR THE FUTURE 51
oil demand from domestic resources, the region faces an increasing and acute dependence on crude oil imports, with aggregate net imports of 803 million tonnes in 2010.83
As net importers of energy, many Asia-Pacific countries are affected by volatile energy prices. Increasing energy needs have recently exerted a steady upward pressure on international oil and gas prices. Oil-importing countries therefore need to look for alternative energy sources to improve their energy security.84 One option is nuclear energy, more relevant to the countries having larger nuclear fuel resources,85 which offers cleaner energy than fossil sources. But in addition to its high capital cost and technological requirements, nuclear power also raises serious concerns for human security (Box 2.3). Other options include use of more diverse sources of renewable energy — biomass, solar, wind, geo-thermal and mini-hydropower — and support to off-grid energy supply that is cleaner and safe.
Growing Energy Needs
The Asia-Pacific region is certain to see a con-tinuing growth in the demand for energy. Between 2005 and 2030, while global demand is projected to increase by 1.5 per cent annually, rates in Asia and the Pacific are likely to be much higher, at 2.4 per cent per year.86 The industry, household and transport sectors are major end-users, consuming 42 per cent, 22 per cent and
TABLE MOST COUNTRIES IN DEVELOPING ASIA-PACIFIC ARE NET IMPORTERS OF ENERGY2.5
Asia-Pacifi c Energy Production and Use, 2009
Country Energy Produced
Net Imports
Total Primary Energy Supply
(Mtoe)
Share in Energy Consumption (%)
Renewables Fossils
Bangladesh 24.8 5.0 29.6 30.2 69.8Cambodia 3.7 1.6 5.2 70.8 27.8China 2,084.9 274.9 2,257.1 11.9 87.4India 502.5 182.0 675.8 26.1 73.0Indonesia∗ 351.8 –153.6 202.0 34.6 65.6Iran, Islamic Republic of 349.8 –132.1 216.2 0.5 99.7Korea, Democratic
People’s Republic of20.3 –1.0 19.3 11.0 89.0
Malaysia 89.7 –21.7 66.8 5.3 94.7Mongolia 7.7 –4.2 3.2 3.2 96.4Myanmar 22.4 –7.2 15.1 72.3 27.7Nepal 8.8 1.2 10.0 88.5 11.1Pakistan 64.9 19.8 85.5 37.4 61.8Philippines 23.5 16.3 38.8 43.0 57.0Sri Lanka 5.1 4.3 9.3 54.7 45.3Thailand 61.7 47.4 103.3 20.5 79.4Viet Nam 76.6 –13.8 64.1 43.3 56.2World 12,292.0 · · 12,150.0 13.1 80.7
Sources: IEA 2011b; IEA 2011d (share of renewables); World Bank 2011b (share of fossils, data accessed on 2 February 2012).
Note: There could be differences between data from national and international sources. ∗ Indonesia is no longer a net exporter of oil, and suspended its membership of the OPEC group of countries effective January 2009 (see OPEC n.d.; BBC 2008).
· · Not available.
BOX 2.3
NUCLEAR ENERGY: SAFETY AND PUBLIC CHOICE
When the life cycles of power plants are taken into consid-eration, nuclear power has some of the lowest CO2 emis-sions. A number of countries in the region, including China, India, Japan, Pakistan and the Republic of Korea, use nuclear energy. In fact, Japan draws 33 per cent of its energy from nuclear sources, and the Republic of Korea, 23 per cent. Many countries can also rely on a strong domestic tech-nology base for further expanding their nuclear capacities. Other countries in the region are seriously considering adding nuclear power to their energy mixes or are prepar-ing to build nuclear power plants, such as Bangladesh, Indonesia, Malaysia, Thailand and Viet Nam.
Several countries are now reconsidering their options, mainly due to concerns of human safety. After the Fukushima crisis following the 2011 tsunami, Japan is considering
abandoning its plans to expand nuclear power, and laying greater emphasis on renewables such as wind, solar and biomass energy.
Utility companies too have reservations about nuclear energy. As well as being concerned about the costs of ensur-ing safe plants, they are also struggling to identify locations: people may want electricity, but do not want nuclear power plants near their homes. Thailand, for example, is factoring in strong public opposition to new plants. While the legacy of existing plants is expected to decline, newer investment in nuclear plants is likely to face two types of constraints: (a) increasing costs from security concerns; and (b) strong resistance from people in the neighbourhood.
Sources: IAEA 2011; McCurry 2011; The Nation 2011.
18 per cent, respectively, in 2006 (Figure 2.7).87 Industry continues to be the dominant user, though energy use in other sectors has been growing faster. Between 1990 and 2006, energy use in industry grew 2.8 per cent annually,

ASIA-PACIFIC HUMAN DEVELOPMENT REPORT52
FIGURE THE INDUSTRIAL, RESIDENTIAL AND TRANSPORT SECTORS ARE THE MAJOR ENERGY USERS2.7
Energy Users in Asia and the Pacifi c, 1990–2006
Source: Based on APEC and ADB 2009b.Note: Asia-Pacifi c in this fi gure refers to the ADB regional classifi cation, which includes
the developed and developing countries of the region as well as Central Asian countries (see note 79). Mtoe: million tonnes of oil equivalent.
while energy use in the residential, transport and commercial sectors grew at 2.4, 4 and 5 per cent, respectively.88
In Asia and the Pacific, much of the increasing energy demand will be required to meet prevail-ing development deficits, particularly for elec-tricity. In 2009, developing Asia had 675 million people without access to electricity — 51 per cent of the 1.3 billion people without electri-city worldwide. For cooking, 1.9 billion people rely on the use of traditional biomass in the region out of 2.66 billion people worldwide.89 For lighting, people in many countries in the region rely mostly on kerosene, or they may use vegetable oils, candles or firewood.90 Future progress for many countries will demand wider and more assured availability of electricity in both production and daily life.
Electricity access for residential use in cooking and lighting was very uneven across Asia-Pacific in 2007 (Table 2.6). In some countries, including Afghanistan, Cambodia, Democratic People’s Republic of Korea, Myanmar, Papua New Guinea, Solomon Islands, Timor-Leste and Vanuatu, electricity access was lower than that of Sub-Saharan Africa — 26 per cent.91
Significant rural–urban disparities mean that 94 per cent of households in urban areas had electricity, whereas in rural areas the proportion was only 67 per cent in 2007 (Table 2.6). In Afghanistan, Democratic People’s Republic of Korea and Myanmar, less than 12 per cent of the rural population had electricity access. In parts of the Pacific, such as the Solomon Islands and Vanuatu, rural electricity access ranged between 5 and 7 per cent.92
But even households and businesses that do have connections to the electrical grid face frequent fluctuations and power cuts. In 2008, deficits in meeting peak demand ranged from 9 per cent in Nepal to about 28 per cent in Bangladesh.93
Without access to modern fuels, about half the region’s population (nearly two billion people) still relies on traditional use of biomass for cooking, often to the detriment of their health and the environment.94 In many countries, including Bangladesh, India, Indonesia and Pakistan, more than half the population uses biomass.95 Even in countries where access is high, people do not necessarily use electricity for cooking. In China,
TABLE PERCENTAGE OF POPULATION WITH ACCESS TO ELECTRICITY AND MODERN FUELS, SELECTED COUNTRIES, 20072.6
Country Electricity Access (%) Modern Fuel Access (%)
National Rural Urban National Rural Urban
Bangladesh 41.0 28.0 76.0 10.4 1.0 40.1
Cambodia 24.0 12.5 66.0 9.0 4.4 36.1
China 99.4 99.0 100.0 51.8 28.7 77.2
India 64.5 52.5 93.1 40.4 11.9 75.4
Indonesia 64.5 32.0 94.0 41.6 20.4 77.1
Malaysia 99.4 98.0 100.0 96.7 95.3 97.4
Mongolia 67.0 36.0 90.0 23.2 5.0 39.1
Nepal 43.6 34.0 89.7 18.4 8.6 63.7
Philippines 86.0 65.0 97.0 52.9 29.5 73.5
Solomon Islands 14.4 5.1 70.6 7.4 2.0 40.0
Sri Lanka 76.6 75.0 85.8 27.9 18.7 68.3
Thailand 99.3 99.0 100.0 75.5 52.7 88.7
Tonga 92.3 90.7 97.7 55.4 49.8 90.6
Vanuatu 19.0 7.0 61.0 14.5 4.6 47.0
Viet Nam 89.0 85.0 99.6 39.4 27.9 79.8
Asia-Pacifi c 77.0 66.7 93.6 44.1 18.7 74.2
Sub-Saharan Africa 26.0 11.0 54.0 17.0 5.0 42.0
World 78.2 63.0 93.0 53.0 21.0 76.0
Source: Patil 2011.
Notes: Asia-Pacifi c data in this table refer to all developing countries of the region. See WHO 2010b; UNDP and WHO 2009; for data on modern fuel access; see
UNDP and WHO 2009; IEA et al. 2010; UNESCAP 2010d; and NationMaster 2011; for data on electricity access.
Data on electricity access for the year 2009 are available for some but not all of these countries. Therefore, 2007 data are presented in the table, including data on regional aggregates.

2 PRODUCING FOR THE FUTURE 53
access to electricity is 99 per cent, but access to modern fuels for cooking is only 52 per cent (Table 2.6). There are significant variations both across and within countries: in the urban areas of the region, the proportion of the population with access to modern fuels for cooking is 74 per cent, but in rural areas it is only 19 per cent.
The most common traditional cooking fuel is wood. In addition to being inefficient and damaging the environment, burning fuelwood can also be hazardous to health. These risks can be offset by using improved cook stoves, which are now common in a number of coun-tries. Among the population relying on solid fuels, almost all of them use improved cook stoves in Mongolia and Thailand, and 73 per cent in China. But such stoves are much less com-mon across South Asia — only 8 per cent of those relying on solid fuels in India, for example, use cook stoves.96
Energy is vital not just for economic develop-ment but also for alleviating poverty, improving human welfare and raising living standards. Poor households need energy for boosting, diversifying and stabilising incomes — running small businesses, transporting raw material, pumping water, packaging, trade and so on. As they gradually experience increased incomes, they demand more and better energy services; as a country’s human development index rises, so does its per capita use of electricity (Figure 2.8). Inevitably there will be trade-offs, since expand-ing energy use through prevailing technologies increases carbon emissions. But by progres-sively moving towards renewable energy generation, including better-quality off-grid initiatives, countries could expand energy sup-plies, particularly to the poor, without much increase in emissions.
Increasing Carbon Intensity of Energy
Carbon intensity is the number of tonnes of carbon or CO2e per unit of energy. Country averages depend on the composition of their energy sources: carbon intensity is highest in countries that depend largely on fossil fuels, and lowest in countries with access to hydro or other renewables. In the 1980s and 1990s, a fall in the share of oil in total energy demand was offset by a rise in that of gas. But since 2000, the share
of gas has remained constant, and the share of coal has increased.97 In 2005, coal provided only 17 per cent of the rest of the world’s energy, but 63 per cent of China’s and 39 per cent of India’s, with implications for carbon intensity.98
In the developed world, carbon intensity declined till the mid-1990s and then stabilised at around 85 per cent of its 1971 level. In the developing world, it was stable through most of the period, but has been rising more recently.99 As indicated in Figure 2.9, over the period 1990–2009, carbon intensity fell in some Asia-Pacific countries, notably the Islamic Republic of Iran, Japan, the Republic of Korea and Singapore, but rose significantly in many of the region’s developing countries. Figure 2.10 indicates that carbon intensity specifically in electricity pro-duction is highest in countries that generate electricity from coal or oil, but lower in coun-tries such as Nepal and New Zealand, which have geothermal or hydro resources.100
Access to Low-Carbon Energy Technologies
Although carbon intensity depends primarily on the sources of energy, it is also a function
FIGUREENERGY USE RISES WITH PROGRESS IN HUMAN DEVELOPMENT2.8
Human Development Index (HDI) and Per Capita Electricity Use: A Positive Association
Sources: Based on UNDP 2011d; World Bank 2011b.Note: Correlation coeffi cient between HDI 2011 and electricity consumption per capita
2008 is 0.93, which indicates a strong positive association.
By progressively moving towards
renewable energy generation
including better-quality off-grid
initiatives, countries could expand energy
supplies, particularly to
the poor, without much increase in
emissions

ASIA-PACIFIC HUMAN DEVELOPMENT REPORT54
of efficiency. According to one estimate, if all countries produced electricity at current best practice levels of efficiency, then fossil fuel con-sumption for electricity generation could go down by between 23 and 32 per cent, thus sub-stantially reducing CO2 emissions.101 The largest savings potential for both energy and CO2 emissions arise from improving the efficiency of coal-fired plants. Governments need to sup-port efforts to drive down the CO2 intensity of
energy production by moving towards a cleaner technology mix.
Countries that wish to deploy more low-carbon technologies will need to invest more, not just in R&D, but also in demonstration, deploy-ment, spreading knowledge and ultimately diffusing the technology. Most emerging low-carbon energy technologies are expensive and demand significant initial investment and learning. Unfortunately, since its peak in the early 1980s, public investment in energy-related R&D expenditure across the developed coun-tries declined dramatically due to falling oil prices and privatisation — only to recover from 2000 onwards in response to global warming.
Energy-related R&D expenditure at present is still well below that of the 1970s and early 1980s, even though overall R&D budgets have doubled since the 1980s.102 Countries will need to do more to mobilise resources from multiple sources, including domestically, for example, through carbon pricing. China is already considering levying a carbon tax to cut green-house gas emissions and support low-carbon technology development.103
The Australian government has instituted a plan to progressively manage emissions. It will implement carbon pricing from July 2012. About 500 of Australia’s biggest polluters will have to start paying a tax of A$23 (US$24) a tonne on their own carbon emissions. From July 2015, a market-based emissions trading scheme will replace a fixed tax.104 This measure emerged despite serious opposition from government counterparts and from various interest groups. Once implemented, this tax should help reduce carbon emissions and should create incentives for businesses to invest in clean technology.
Recent global trends in investment in renew-able energy show that from 2002 to mid-2009, total investment in renewable energies exhi-bited a compound annual growth rate of 33 per cent. There was a slight reduction between 2008 and 2009, but investment is expected to grow again from 2010 onwards. The growth is driven increasingly by non-OECD countries, whose share rose from 29 per cent in 2007 to 40 per cent in 2008. Among Asia-Pacific countries, China, and India accounted for a major portion of this increase.105
Further business investment in renewable energy would benefit from a future carbon market.
FIGUREDEVELOPING COUNTRIES ARE BECOMING MORE CARBON-INTENSIVE2.9
Carbon Intensity of Energy, Tonnes of CO2 per Terajoule of TPES, for Selected Countries (1990, 2009)
Source: Based on IEA 2011a.
FIGURECOUNTRIES VARY CONSIDERABLY IN CO2 FROM ELECTRICITY PRODUCTION2.10
CO2 Intensity in Electricity Production, Selected Countries, 2010
Source: IAEA 2011, based on data from IEA 2010b.

2 PRODUCING FOR THE FUTURE 55
But this would require international agreements on carbon pricing, not only among all countries, but also across political and administrative units within countries. Market-based mechanisms should extend extra support to the least developed countries and take into account the interests of more disadvantaged communities.
Now is the time to consider opportunities for cleaner energy generation and use. Large-scale industrialisation and urbanisation in Asia-Pacific are likely to result in a massive increase in the construction of power plants. Most countries have been using obsolete technology and, if they do not apply low-carbon technologies now, they will be locked into systems that generate high GHG emissions for many more decades.106
According to a recent estimate, energy-related CO2 emissions from the power sector will contribute 80 per cent of the projected 2020 emissions. These emissions will come from power plants that are currently in place or under construction.107
PUSH FOR CLEANER ENERGY SOURCES
In the case of power, using cleaner energy sources and improving energy use efficiency will mean switching from coal to natural gas, and turning to more renewable energy resources, including biomass, solar, wind, hydro and geothermal. This would need to happen very soon, since most investments in the new energy infrastructure are normally locked in for 40 to 50 years.108 For countries with large coal reserves, however, coal-fired power generation is important from a domestic energy security point of view, at least in the short and medium run. Reducing emissions for those countries would require progressively improving energy efficiency through technology innovations such as carbon capture and storage, until alternative, cleaner infrastructure is put in place. Some of these innovations are already available in the region, for instance in selected countries in Asia (Table 2.7), but many are not.
Diversify Energy Sources
A number of countries in the region have achieved high use of renewable energy resources. Nepal and New Zealand, for example, generate
more than 60 per cent of their electricity from hydropower and other renewable sources, largely due to locational advantages (Figure 2.11). As living standards improve and energy require-ments grow, it is imperative that countries encourage diversification of sources and move towards renewable options. In some areas, solar, wind or biomass energy can be improved to near-grid quality.
TABLE AVAILABILITY OF LOW-EMISSIONS TECHNOLOGY IN SELECTED ASEAN COUNTRIES2.7
Available Technology Stage of Availability
Clean coal technologies Less available (in some countries)
Carbon capture and storage Only at demonstration stage (in some countries)
Integrated gasifi cation combined cycle
Not available
Waste to energy Available
Biomass gasifi cation Available
Biodiesel Available
Bio-ethanol (1st generation) Available
Bio-ethanol (2nd generation) Available as model demonstration in Thailand
Photovoltaic (PV) Available (mostly 1st generation)
Solar thermal Less available (in some countries)
Wind energy Less available (in some countries)
Nuclear Planned to be adopted in Thailand and Viet Nam
Source: TERI 2011.Note: Information is based on a survey in selected countries including Bangladesh,
Cambodia, China, India, Indonesia, Lao People’s Democratic Republic, Malaysia, Myanmar, Philippines, Thailand and Viet Nam.
FIGUREONLY A FEW COUNTRIES ARE HIGH USERS OF RENEWABLE ENERGY2.11
Fossil and Non-Fossil Sources in Electricity Generation, Selected Countries, 2010–11
Sources: IAEA 2011, based on data from IEA 2010b; REN 21 2011.Note: China’s installed wind capacity reached 44.7 GW in 2010, which is 4.4 per cent
of China’s total power generation capacity (REN 21 2011).
Governments need to support efforts to drive
down the CO2 intensity of energy
production by moving towards a cleaner technology
mix
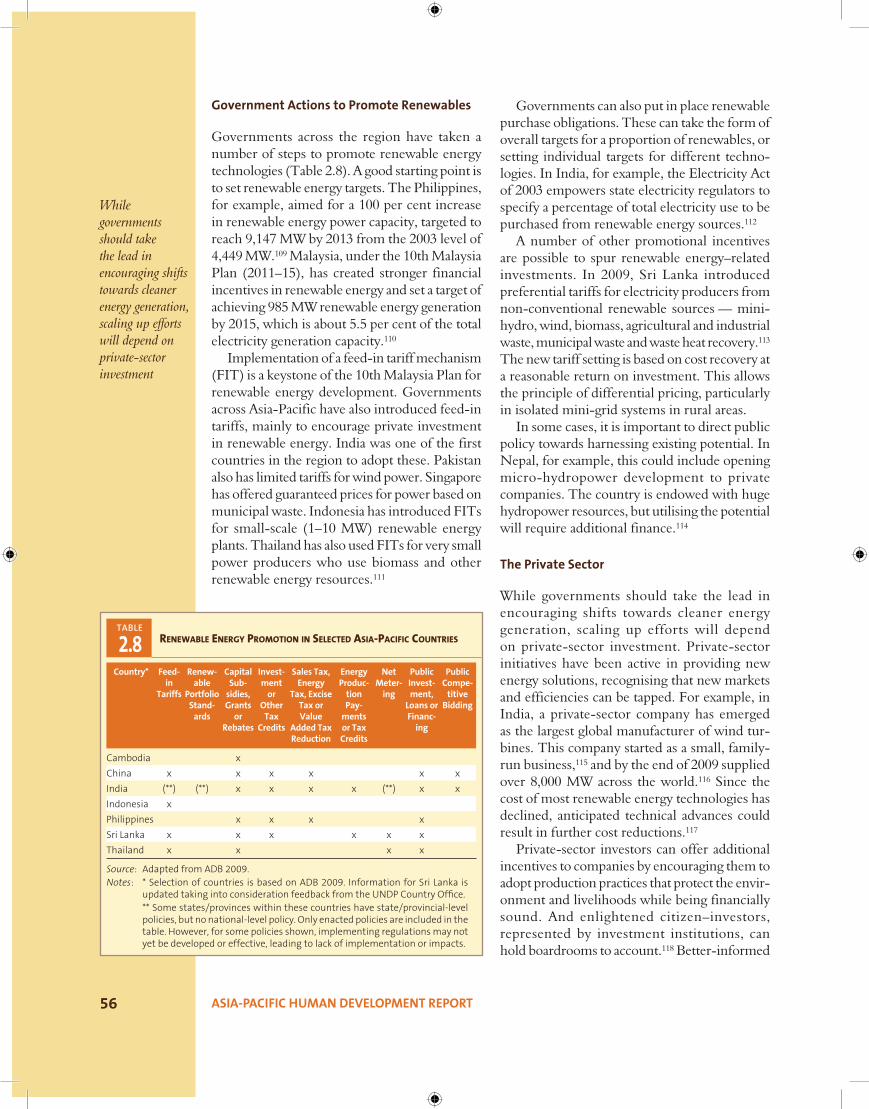
ASIA-PACIFIC HUMAN DEVELOPMENT REPORT56
Government Actions to Promote Renewables
Governments across the region have taken a number of steps to promote renewable energy technologies (Table 2.8). A good starting point is to set renewable energy targets. The Philippines, for example, aimed for a 100 per cent increase in renewable energy power capacity, targeted to reach 9,147 MW by 2013 from the 2003 level of 4,449 MW.109 Malaysia, under the 10th Malaysia Plan (2011–15), has created stronger financial incentives in renewable energy and set a target of achieving 985 MW renewable energy generation by 2015, which is about 5.5 per cent of the total electricity generation capacity.110
Implementation of a feed-in tariff mechanism (FIT) is a keystone of the 10th Malaysia Plan for renewable energy development. Governments across Asia-Pacific have also introduced feed-in tariffs, mainly to encourage private investment in renewable energy. India was one of the first countries in the region to adopt these. Pakistan also has limited tariffs for wind power. Singapore has offered guaranteed prices for power based on municipal waste. Indonesia has introduced FITs for small-scale (1–10 MW) renewable energy plants. Thailand has also used FITs for very small power producers who use biomass and other renewable energy resources.111
Governments can also put in place renewable purchase obligations. These can take the form of overall targets for a proportion of renewables, or setting individual targets for different techno-logies. In India, for example, the Electricity Act of 2003 empowers state electricity regulators to specify a percentage of total electricity use to be purchased from renewable energy sources.112
A number of other promotional incentives are possible to spur renewable energy–related investments. In 2009, Sri Lanka introduced preferential tariffs for electricity producers from non-conventional renewable sources — mini-hydro, wind, biomass, agricultural and industrial waste, municipal waste and waste heat recovery.113 The new tariff setting is based on cost recovery at a reasonable return on investment. This allows the principle of differential pricing, particularly in isolated mini-grid systems in rural areas.
In some cases, it is important to direct public policy towards harnessing existing potential. In Nepal, for example, this could include opening micro-hydropower development to private companies. The country is endowed with huge hydropower resources, but utilising the potential will require additional finance.114
The Private Sector
While governments should take the lead in encouraging shifts towards cleaner energy generation, scaling up efforts will depend on private-sector investment. Private-sector initiatives have been active in providing new energy solutions, recognising that new markets and efficiencies can be tapped. For example, in India, a private-sector company has emerged as the largest global manufacturer of wind tur-bines. This company started as a small, family-run business,115 and by the end of 2009 supplied over 8,000 MW across the world.116 Since the cost of most renewable energy technologies has declined, anticipated technical advances could result in further cost reductions.117
Private-sector investors can offer additional incentives to companies by encouraging them to adopt production practices that protect the envir-onment and livelihoods while being financially sound. And enlightened citizen–investors, represented by investment institutions, can hold boardrooms to account.118 Better-informed
TABLERENEWABLE ENERGY PROMOTION IN SELECTED ASIA-PACIFIC COUNTRIES2.8
Country* Feed-in
Tariffs
Renew-able
Portfolio Stand-
ards
Capital Sub-
sidies, Grants
or Rebates
Invest-ment
or Other
Tax Credits
Sales Tax, Energy
Tax, Excise Tax or Value
Added Tax Reduction
Energy Produc-
tion Pay-
ments or Tax Credits
Net Meter-
ing
Public Invest-ment,
Loans or Financ-
ing
Public Compe-
titive Bidding
Cambodia x
China x x x x x x
India (**) (**) x x x x (**) x x
Indonesia x
Philippines x x x x
Sri Lanka x x x x x x
Thailand x x x x
Source: Adapted from ADB 2009.Notes: * Selection of countries is based on ADB 2009. Information for Sri Lanka is
updated taking into consideration feedback from the UNDP Country Offi ce. ** Some states/provinces within these countries have state/provincial-level
policies, but no national-level policy. Only enacted policies are included in the table. However, for some policies shown, implementing regulations may not yet be developed or effective, leading to lack of implementation or impacts.
While governments should take the lead in encouraging shifts towards cleaner energy generation, scaling up efforts will depend on private-sector investment

2 PRODUCING FOR THE FUTURE 57
citizens and the media can serve a watchdog role in exposing environmental offences, helping develop a culture where businesses proactively seek compliance with environmental standards, in part to avoid the costs of public exposure for damaging practices. Consumer awareness and demand can push the producer to go green in the face of competition as well.
Cross-Border and Regional Cooperation
Cross-border cooperation, both North–South and South–South, can speed up the deployment of new clean energy technologies. For example, a number of countries in the region are joining with the United States in the FutureGen project — a public–private collaborative venture to construct a zero-emissions coal-fired power plant, based on carbon capture and storage technology.119 Many Asia-Pacific countries have expertise and experience that could be of value to others, such as providing remote villages or isolated islands with off-grid electricity. For example, under the renewable energy action plan of the govern-ment of Viet Nam, scientists developed three new types of micro-hydroelectricity generators suitable for remote areas with excellent water flow. These have become popular in other Asian countries, such as Nepal, Papua New Guinea and the Philippines.120
Building both North–South and South–South knowledge exchange networks could pro-vide opportunities for sharing and learning existing best practices towards better-informed choices by public and private organisations. For example, a civil society group, the China Carbon Forum, established in 2007, engages foreign and local businesses, NGOs, leading practitioners and government decision makers to share know-ledge and expertise in China’s carbon and energy sectors.121
SciDev.Net is another example of knowledge networks. SciDev.Net is a not-for-profit organ-isation that provides authoritative information about science and technology for sustainable development through its website. Its main office is located in London, but its activities and vision are driven by a worldwide network of registered users, advisors, consultants and freelance jour-nalists, predominantly from developing coun-tries. Regional networks were launched in
Sub-Saharan Africa (2002), in Latin America (2003), in South Asia (2004) and in China (2005). There are plans for future networks in the Middle East and North Africa, West Africa and South-East Asia.122
Regional and sub-regional cooperation in capacity development, technology transfer and trade in energy can effectively enhance energy security. In 2008, heads of state at the 15th SAARC summit recognised the potential for developing regional and sub-regional energy resources, noting that the escalation of oil prices threatens both energy security and economic growth. The summit urged the development and conservation of conventional energy sources while building up renewable energy options.123 The Association of Southeast Asian Nations (ASEAN) power grid is another example of cooperation.
Technology Transfer and Finance
Technology development and diffusion are critical in harnessing opportunities for cleaner energy and energy efficiency. In 2010, the Conference of Parties to the UNFCCC at its 16th session in Cancun agreed to establish a Climate Technology Centre and Network to support technology transfer and local techno-logy innovation capacity. Though the centre has yet to begin operating, it serves as an example of international initiatives in the right direction.
Existing intellectual property rights (IPR) regimes, however, have tools such as patents that can be restrictive and result in high costs for technology access. The last two decades have seen an increase in patenting in most technology areas, contributed by international agreements such as the WTO Trade-Related Aspects of Intellectual Property Rights (TRIPs) agreement and the World Intellectual Property Organisa-tion (WIPO) patent cooperation treaty (PCT). Patenting relating to clean energy technologies (CETs) is significantly higher than in trad-itional energy fields such as fossil fuels and nuclear energy. And only five countries account for almost 80 per cent of all claimed priority patents in CETs worldwide; among them two are from the region — Japan and the Republic of Korea.124 International mechanisms governing IPRs and technology transfer will need to take
Intellectual property rights
regimes can result in high costs for
technology access; only five countries account for almost 80 per cent of all claimed priority
patents in CETs worldwide

ASIA-PACIFIC HUMAN DEVELOPMENT REPORT58
into account the public good, as against solely commercial gains, in order to provide broader access to CETs.
New international finance mechanisms such as the Clean Development Mechanism (CDM) under the Kyoto Protocol aim to benefit developing countries in the region by transferring cleaner technology from developed countries. The CDM allows entities in industrialised coun-tries to gain certified emission reductions (CERs) by investing in emission reduction projects in developing countries. Viet Nam, for example, has had 34 registered CDM projects, generating total GHG emission reductions of 17.5 million tonnes CO2e as of October 2010.125 Clean devel-opment mechanism projects have tended to focus mainly on promoting renewable energy in Asia-Pacific — more than 90 per cent of the projects are energy-related, with an emphasis on hydropower, wind power and biomass energy generation.126 Only about 12 per cent belong to the energy efficiency improvement category.127 With respect to the objective of technology transfer, the performance of CDM has been perceived to be far less than satisfactory.
As the CDM involves a future market for carbon, it will be important to ensure strict and neutral assessments of benefits, along with effective implementation and monitoring. The assessments should not unduly prolong the time needed for project design and approvals, which currently can take up to two years. Clean development mechanism projects so far have been concentrated in a handful of large, emerging economies in the region.128 Greater efforts are required for the least developed coun-tries (LDCs) to take advantage of such finance mechanisms. In order to genuinely share the benefits, it will be important to engage around local development priorities, including poverty reduction and creating jobs, rather than just emissions per se.
Other financing options include the Global Environment Facility (GEF), which allocates funds for specific project-led mitigation activ-ities. The World Bank’s Climate Investment Fund is another collaborative effort. Its Clean Technology Fund finances the scaling up of demonstrations, deployment and transfer of clean technologies, highlighting countries with significant mitigation potential.129
Despite these finance mechanisms, action on the ground has progressed slowly.130 There is a growing recognition of the need to better cali-brate tools for funding that addresses climate change more effectively.131 Different options should be complementary, with a longer-term perspective that fits within a broader develop-ment framework. They should support the creation of public infrastructure and strengthen the resilience of the poor, especially those who depend on nature for their livelihoods.
Moving beyond the marginal changes requires a more fundamental change in attitudes in addition to effective policies. A growing body of experience on cleaner energy generation and better energy security from across the region can contribute in this respect.
Renewable energy legislation — The Philippines: The Renewable Energy Act of 2008 seeks to accelerate the development and use of renewable energy resources such as biomass, solar, wind, hydro, geothermal and ocean energy sources, among others, to achieve energy self-reliance and reduce the country’s dependence on fossil fuels.132
Photovoltaic technology — Malaysia: The Malaysia Building Integrated Photovoltaic Project, launched in 2005, was included in the 9th Malaysia Plan and is a national initiative by the Malaysian government in collaboration with the Global Environment Facility (GEF) and UNDP.133 It aims to reduce greenhouse gas emissions in the construction sector and bring down the long-term cost of photovoltaic technology. The project has catalysed the PV local market. By the middle of 2011, it had directly reduced 1,553 tonnes of CO2 emissions while the cost of systems had fallen by 39 per cent.134 In addition, the National SURIA 1000 Programme, launched in 2006, promotes the education of the wider public on the use of solar power, especially grid-connected PV systems. It provides energy star rating for some electrical goods like refrigerators and has established a Green Building Index (GBI).
Feed-in tariffs — Thailand: In 2006, the Thai government announced important changes in the Very Small Power Producer (VSPP) pro-gramme regulations that allow each generator to sell up to 10 MW to the grid, and offer feed-in
Moving beyond the marginal changes requires a more fundamental change in attitudes in addition to effective policies

2 PRODUCING FOR THE FUTURE 59
tariff subsidies for renewable electricity production.135 The final feed-in tariff includes not just the equivalent wholesale cost of generation, but also several bonuses, or ‘adders’. There are, for example, adders for electricity from renewable energy sources replacing diesel oil, and for electricity from renewable energy in the three southern provinces.136 Since it started, the programme has resulted in 4,300 MW of renewable generation, nearly half of which is from solar energy.137
Sewage for power — Hong Kong, China (SAR): The city began using biogas from its sewage treatment
process as combustion fuel to generate electricity and thermal energy. In 2007, based on a 330 kW Combined Heat and Power Generation System at the city’s Shek Wu Hui Sewage Treatment Works, the system generated about 3 million kWh equivalent of electrical power. This resulted in savings of HK$2.4 million ($307,000)138 in recurrent costs for electricity and prevented about 2,100 tonnes of CO2 emissions.139
Fuel from coconuts — Samoa: Faced with rising oil import prices, Samoa has been reviving a defunct industry by taking advantage of disused coconut plantations to produce coconut oil as
BOX 2.4
NATIONALLY APPROPRIATE MITIGATION ACTIONS (NAMA) OF DEVELOPING COUNTRY PARTIES
Nationally appropriate mitigation actions by developing country parties are on a voluntary basis. These actions are based on national circumstances, national strategies of sustainable development and the priorities of the developing countries. Asia-Pacific countries that wish to be associated
with UNFCCC’s Copenhagen Accord, dated 18 December 2009, have submitted NAMAs to UNFCCC (see the table). Some of them have sought international support when describing their mitigation actions.
Nationally Appropriate Mitigation Actions (NAMA) of Asia-Pacifi c Developing Country Parties (Submitted to UNFCCC)
Afghanistan Preparation of the initial national communication, which will include specifi c mitigation strategies and activities appropriate for the national context. And completion of the national greenhouse gas inventory.
Bhutan Bhutan already sequesters more carbon than is emitted. Ensure that emissions do not exceed sequestration capacity. Effort to remain carbon-neutral and also to adapt to the adverse effects of climate change. Bhutan requires the support of the international community.
China China will endeavour to lower its carbon intensity (carbon dioxide emissions per unit of GDP) by 40–45 per cent by 2020 compared to the 2005 level, increase the share of non-fossil fuels in primary energy consumption to around 15 per cent by 2020 (including nuclear power), and increase forest coverage by 40 million hectares and forest stock volume by 1.3 billion cubic metres by 2020 from the 2005 levels.
India India will endeavour to reduce the emissions intensity of its GDP by 20–25 per cent by 2020 in comparison to the 2005 level. The emissions from the agriculture sector will not form part of the assessment of emissions intensity.
Indonesia Emission reduction of 26 per cent by 2020 through unilateral actions including: sustainable peatland management, reduction in rate of deforestation and land degradation, development of carbon sequestration projects in forestry and agriculture, promotion of energy effi ciency, development of alternative and renewable energy sources, reduction in solid and liquid waste, shifting to low-emission transportation mode.
Maldives Achieve carbon-neutrality as a country by 2020; requires the support of the international community.
Marshall Islands 40 per cent reduction of CO2 emissions below 2009 levels by 2020, pursuant to the 2009 national energy policy and energy action plan, and subject to the provision of adequate international support.
Mongolia Increase renewable options of energy supply, improve coal quality, improve effi ciency of heating boilers, improve household stoves and furnaces, improve combined heat and power (CHP) plants, increase use of electricity for local heating in cities, build energy effi ciency improvements, industry energy effi ciency improvements, fuel-effi cient transport, and actions in agriculture and forestry to reduce emissions.
Republic of Korea To reduce national greenhouse gas emissions by 30 per cent from the business-as-usual emissions by 2020.
Papua New Guinea Actions include reducing emissions from forestry, agriculture, oil and gas, transportation, power generation, mining and fi re.Aims at: (a) increasing GDP per capita more than three times by 2030; (b) decreasing GHG emissions at least 50 per cent
before 2030 while becoming carbon-neutral before 2050; (c) increasing adaptation investments per annum by US$80–US$90 million to reduce expected losses by US$230–US$250 million.
Singapore Mitigation measures leading to a reduction of greenhouse gas emissions by 16 per cent below business-as-usual levels in 2020, contingent on a legally binding global agreement in which all countries implement their commitments in good faith.
Source: UNFCCC n.d.-a.

ASIA-PACIFIC HUMAN DEVELOPMENT REPORT60
a substitute for diesel in electricity generators. Local producers are supplying up to 5 per cent of the national electricity utility’s fuel requirements. The aim is to supply a quarter of its needs by 2020. In this case, there are no concerns about biofuel displacing food production, since the plantations already exist and most nuts just fall to the ground as organic waste. The issue is more one of price: in 2009 it was difficult to produce coconut oil at a price competitive with that of diesel, leaving farmers with very small margins. Locally produced coconut oil can also be relevant for other Pacific countries including Vanuatu, Fiji, Solomon Islands, Papua New Guinea and the Marshall Islands.140
Cooperation between local, national and multilateral development partners to support low-carbon development initiatives — Indonesia: The country has established the Indonesia Climate Change Trust Fund (ICCTF) and the Indonesia Green Investment Fund (IGIF) to support Indonesia’s goals of low-carbon emis-sions and climate-resilient development.141 The funding initiatives coordinate climate change–related financing, raise contributions from bilat-eral and multilateral development partners, and at a later stage will attract private funding for large-scale capital investment in low-carbon development. Such a fund could also serve as a model for other countries in the region.142
PRODUCING FOR THE FUTURE
The Asia-Pacific region is starting to dem-onstrate its potential for less carbon-intense
production in industry and agriculture, and for producing and using energy more efficiently. Countries across this diverse region are charting ways of moving to lower-carbon production, dealing with the trade-offs while considering how to sustain development that reaches the poor and vulnerable.
Many countries have started greening pro-duction, and they have committed to nationally appropriate mitigation actions in the Copenhagen Accord of the UNFCCC (Box 2.4).143 Most coun-tries in the region have prepared initial national greenhouse gas emissions inventories and about a quarter have prepared a second national commu-nication, as part of their obligation as a signatory party of the UNFCCC.144
Countries need to enshrine climate change priorities in national legislation and move their industries and farmers towards cleaner and more sustainable production. Governments at the national and local levels can provide the necessary policy and regulatory frameworks and incentives. Greater regional and international cooperation for technology transfer should be combined with local capacity development for better absorption, faster diffusion and effective utilisation of technology. Long-term finance accounting for the concerns of the disadvantaged can help scale up progressive transformation and strengthen resilience to climate change. A policy push for greening production will, however, also need to be complemented by buyer pull, as consumers start to prefer, and demand, greener products and services. That is the subject of the next chapter.
A policy push for greening production will also need to be complemented by buyer pull, as consumers start to prefer and demand greener products and services
2 PRODUCING FOR THE FUTURE 61
Producing for the future without depleting natural resources requires changes in the way production processes manufacture goods, grow crops and raise livestock, and generate energy. Specific measures include:
Industrial emissions: Legislate for low-carbon growth through incentives and regulations for reuse and recycling in industrial production and for conserving energy Undertake energy audits and identify emission reduction measures Use more renewable and cleaner energy sources Use the best technology available through regular assessments, increasing end-use efficiency of high energy-intensive goods Discourage exports of high-emissions goods Set energy use efficiency improvements as job performance criteria Provide technology and finance support to green small businesses.
Greener agriculture: Reduce methane in rice production by more efficient use of water Combine ‘zero-tillage’ cultivation with residue management and proper fertiliser use Support carbon sequestering with options like ‘biochar’ Reforest and renew forest cover to sequester carbon
Increase use of indigenous crops and support organic agriculture through changing the attitudes of farmers and consumers.
Cleaner energy generation: Accelerate the development and use of renewable resources Install photovoltaic technology in homes Add feed-in tariffs that promote renewable energy generation
Use combined heat and power generation systems Diversify energy generation sources Build and promote networks on energy and emissions with leading practitioners and government decision makers Strengthen cooperation between local, national and multilateral development partners to support low-carbon development initiatives.
ACTIONS AT A GLANCE


FAIR AND BALANCED CONSUMPTION
3

Where there is water, there is fish.
Khmer proverb

3 FAIR AND BALANCED CONSUMPTION 65
FAIR AND BALANCED CONSUMPTION
The Asia-Pacific region is confronted not just by rising consumption and waste but also by chronic under-consumption: almost one quarter of the region’s people live in extreme poverty, on PPP $1.25 or less a day.1 Seventeen countries for which data are available still have 10 per cent or more of their populations living at the minimum level of dietary consumption (Table 3.1), de-spite improvements over time. Countries thus have to strike a balance between cutting back on the over-exploitation of their resources and simultaneously increasing consumption of energy services, better food, water and sanitation services that would enable poor communities to become more resilient.
The region must also look ahead. Human development involves expanding choices for all, including the generations to come. This chapter focuses on equitable consumption and the ways in which Asia-Pacific societies can move towards lower-carbon pathways. In aiming to reduce poverty, countries can both fulfil the rights of their poorest citizens and enable them to adapt to climate change.
In most cases, satisfying the needs of con-sumers, rich and poor, will mean increasing output. But this will have to be done within the limits of scarce resources and fragile ecosystems. Otherwise, continuing with resource-intensive and polluting technologies will eventually make everyone poorer in important ways. Even people with much higher incomes may become increasingly vulnerable due to polluted air, growing waste, less freshwater, questionable nutrition and the attrition of other amenities of life that are ultimately all dependent upon natural resources.2
The Asia-Pacific region is
confronted not just by rising consumption
but also chronic under-consumption:
almost one quarter of the
region’s people live in extreme
poverty
The Asia-Pacific region is
confronted not just by rising consumption
but also chronic under-consumption:
almost one quarter of the
region’s people live in extreme
poverty
The communities most exposed to climate change suffer from disappearing livelihoods, damaged forests, poorer fuel and water stress as sources dry up or become contaminated by saltwater intrusion.3 In this, the poor will be more vulnerable, not just because they have fewer assets, but also because they are less able to manage risk.4 Many will sink into deeper poverty (Box 3.1).5 Later, they might be able to regain some of the lost ground, but recovery may be slow and incomplete.6
Rural areas are still home to a majority of Asia-Pacific’s poorest people,7 but many are leaving. As a result, many countries with growing popu-lations have rapid rates of urbanisation — 5 per cent annually in some urban centres of the Pacific,
The Asia-Pacific region has become a vast consumer market, but a very unequal one. On the one hand, hundreds of millions of people still live in poverty, without access to many basic resources. They are not consuming enough. On the other, there has been a rapid expansion of the wealthy and middle classes. Some aspire to lifestyles and patterns of high consumption that will likely prove unsustainable in the face of climate change. In pursuing a better quality of life for all, societies will need to provide space for the poor to develop, while the middle class and the rich will need to move towards lower-carbon consumption.
TABLEMANY PEOPLE ARE NOT GETTING ENOUGH CALORIES3.1
Percentage of Population Estimated below Minimum Level of Dietary Energy Consumption, Selected Countries, 1990–92 and 2006–08
1990–92 2006–08
Bangladesh 38 26Cambodia 38 25China 18 10Korea, Democratic People’s Republic of 21 35India 20 19Indonesia 16 13Lao People’s Democratic Republic 31 22Maldives 9 10Mongolia 28 27Nepal 21 17Pakistan 25 25Philippines 24 13Sri Lanka 28 20Solomon Islands 21 11Thailand 26 16Timor-Leste 39 31Viet Nam 31 11
Source: United Nations 2011a (last updated on 31 October).
3

ASIA-PACIFIC HUMAN DEVELOPMENT REPORT66
for example.8 People who move to cities do not necessarily find better conditions of life, since many are forced to seek shelter in urban slums.9
Here, many live in the more low-lying areas where floods or storms can ruin their livelihoods and create additional hazards to health. Both rural and urban communities face the prospect of rising food prices. Many of these threats are related to climate shocks. Some are readily visible in dramatic news reports about sudden disasters. Others will creep up on communities over time, steadily undermining their quality of life.
Persistent gaps between rural and urban areas translate into disparities in consumption and living standards. Rural progress has been mixed. On the one hand, between 1998 and 2008, remarkable advances were recorded in the rural areas of East Asia: the total number of people living in extreme poverty declined from 529 million to 195 million. In South Asia, on the other hand, rural poverty rates dropped only slightly; about 500 million people still live on less than US$1.25 a day.10
PRESSURE ON FOOD SUPPLIES
People across the region will suffer if climate change further depresses agricultural produc-tivity and pushes up prices.11 Many more poor households are net buyers of staple foods rather than net sellers; moreover, a large share of their
spending is already on food.12 In parallel, as traditional food production systems deteriorate, communities are becoming more dependent on food purchases.13 In these circumstances, poor households may spend more on cheaper, high-calorie staples, reducing the quality of their diet and undermining their health.
Climate change could reduce per capita calorie availability and make it more difficult to address malnutrition. It has been estimated, for example, that between 2000 and 2050, in the absence of climate change, the number of malnourished children in South Asia would decline from 76 million to 52 million, but with climate change the number would decline only to 59 million.14
Climate shocks could, in effect, trigger power-ful downward spirals in human development. One estimate suggests that globally offsetting the negative impacts of climate change on the health and wellbeing of children would require investing around seven billion dollars per year — in agricultural research, irrigation and rural roads. This would mean around US$1.5 billion per year in South Asia and around one billion dollars per year in East Asia and Pacific.15
LACK OF ACCESS TO ENERGY SERVICES
The poor are low consumers of energy. In 2007, Asia-Pacific accounted for a major share of the
Climate change could reduce per capita calorie availability and make it more difficult to address malnutrition
Climate change could reduce per capita calorie availability and make it more difficult to address malnutrition
BOX 3.1
HOW CLIMATE SHOCKS HIT THE CONSUMPTION OF RURAL HOUSEHOLDS
Poor households across Asia and the Pacific are directly or indirectly vulnerable to climatic shocks. The implications for consumption differ considerably by local circumstances — they can entail cutting back, compromising non-food expenses, working longer, selling assets, etc., all practices that add to vulnerability.
In rural India, for example, an estimated increase in mean surface temperature by 2040 could lead to a 13 per cent reduction in agricultural productivity and cut average per capita household consumption by 6 per cent. For landowning households, the reduction is likely to be smaller, around 5 per cent, because the fall in productivity could be offset by higher prices for crops.
In Indonesia, the greatest weather variations are in patterns of rainfall, which can differ greatly across years and
regions. One study observed that a decrease in the amount of rainfall in the 90-day post-monsoon period is associated with a 14 per cent reduction in the per capita expenditures of rice farmers. Rice farm households do manage to protect their food expenditures, but typically by reducing non-food expenditures.
In Mongolia, during the 2010 dzud (harsh winter drought), nearly a fifth of the nation’s livestock was lost. Almost 9,000 herders lost all their animals while several thousand lost the majority of their herds.
Sources: Government of Mongolia et al. 2011; Jacoby and Skoufias 1998, cited in Korkeala et al. 2009; Jacoby et al. 2011, cited in Skoufias et al. 2011; Kochar 1997, cited in Korkeala et al. 2009; Korkeala et al. 2009; Paxson 1992, cited in Korkeala et al. 2009; Skoufias et al. 2011; Townsend 1994, cited in Korkeala et al. 2009.

3 FAIR AND BALANCED CONSUMPTION 67
world’s population lacking electricity and modern fuels for cooking. Of the total rural population in the world deprived of modern fuels for cooking, 63 per cent were from the region (Figure 3.1).
The most energy-deprived communities, par-ticularly in rural areas, are generally constrained by using poorer-quality fuels — biomass such as fuelwood, agricultural residues and animal waste.16 Across the region, in 2007, 56 per cent of the population used solid fuels for cooking and heating, such as coal, charcoal, wood, dung and agricultural residues, to meet their daily heating and cooking needs,17 even though these fuels are polluting and hazardous to health. Indoor air pollution through using solid fuels and conven-tional stoves poses higher risks for women’s and children’s health in rural areas, as these groups are traditionally responsible for household chores.18 In urban areas, a higher proportion of households have access to cleaner modern fuels such as LPG and natural gas (Table 3.2).
FIGURE HOUSEHOLDS IN ASIA AND THE PACIFIC ARE LESS LIKELY TO USE MODERN ENERGY3.1
Population Deprived of Access to Modern Fuels 2007, Share of Asia-Pacifi c in Comparison to the Rest of the World
Source: Patil 2011.Note: Based on data from WHO 2010b; UNESCAP 2010d.
TABLEASIA-PACIFIC HOUSEHOLDS CONTINUE TO RELY ON TRADITIONAL FUELS3.2
Cooking Fuel Used, Selected Countries
Electricity LPG, natural gas
Biogas Kerosene Coal, lignite
Charcoal∗ Firewood, straw∗
Dung No cooking in household
Other
Bangladesh (2007)Urban 0.2 37.8 0.0 0.4 0.0 0.3 57.5 3.6 · · 0.1Rural 0.0 0.5 0.0 0.0 0.0 0.0 89.9 9.4 · · 0.1Total 0.0 8.6 0.0 0.1 0.0 0.1 82.9 8.1 · · 0.1
Cambodia (2005)Urban 0.6 30.1 0.1 0.0 0 25.4 43.6 · · · · 0.2Rural 0.1 3.4 0.0 0.0 0 4.9 91.3 0.2 · · 0.1Total 0.2 7.3 0.0 0.0 0 7.9 84.4 · · · · 0.1
India (2005–06)Urban 0.9 58.7 0.5 8.2 4.3 0.5 23.3 2.8 · · 0.8Rural 0.1 8.2 0.4 0.0 0.0 0.3 74.7 14.4 · · 0.2Total 0.4 24.7 0.5 3.2 1.9 0.4 57.9 10.6 · · 0.4
Indonesia (2007)Urban 0.5 20.2 0.2 54.6 0.0 0.3 21.7 · · 2.5 0.0Rural 0.1 3.8 0.0 18.7 0.0 0.5 76.3 · · 0.4 0.1Total 0.3 10.6 0.1 33.6 0.0 0.4 53.7 · · 1.3 0.0
Nepal (2006)Urban 0.4 40.3 3.3 15.8 0.0 0.1 36.4 2.5 0.5 0.6Rural 0.0 3.9 2.4 1.0 0.0 0.1 83.2 9.1 0.3 0.1Total 0.1 10.0 2.6 3.5 0.0 0.1 75.2 8.0 0.3 0.2
Philippines (2008)Urban 1.7 51.5 0.0 3.0 0.1 16.7 26.3 0.0 0.7 0.0Rural 0.4 13.4 0.0 0.4 0.0 14.5 71.1 0.0 0.2 0.0Total 1.0 32.6 0.0 1.7 0.1 15.6 48.5 0.0 0.5 0.0
Sources: Measure DHS 2010; UNDP and WHO 2009.Note: ∗ Data for Cambodia is from UNDP and WHO 2009. · · Not available.

ASIA-PACIFIC HUMAN DEVELOPMENT REPORT68
TABLEHOUSEHOLDS REQUIRE CLEANER ENERGY SERVICES3.3
Range of Household Emissions by Fuel Source, Selected Countries, 2005, Tonnes CO2e ’000s
Country Coal Charcoal Sustainable wood
Un-sustainable
wood
Dung Electricity LPG Kerosene Natural gas
Other biomass
& wastes
Total with sustainable
wood
Share (%)
Total with un-
sustainable wood
Share (%)
Bangladesh · · · · 2,565 27,579 507 7,828 61 2,146 4,218 942 18,270 1.61 43,280 2.34
Cambodia · · · · 855 9,193 2 514 · · 128 · · · · 1,500 0.13 9,840 0.53
China 157,302 · · 19,218 206,632 · · 297,636 40,774 774 16,603 · · 532,310 46.89 719,720 38.84
India 630 · · 28,328 304,572 10,202 96,741 30,230 28,577 1,481 10,335 206,520 18.19 482,770 26.05
Indonesia · · 1,852 7,622 81,948 · · 39,372 2,289 24,634 41 · · 75,810 6.68 150,140 8.10
Malaysia · · · · 284 3,059 · · 15,370 2,064 153 12 · · 17,880 1.58 20,660 1.11
Mongolia 146 · · 58 619 78 514 · · · · · · · · 800 0.07 1,360 0.07
Nepal · · · · 1,177 12,654 246 697 107 792 · · 189 3,210 0.28 14,690 0.79
Papua New Guinea
· · · · 70 752 · · 994 · · 67 · · · · 1,130 0.10 1,810 0.10
Philippines · · · · 1,201 12,911 · · 13,573 2,038 677 · · · · 17,490 1.54 29,200 1.58
Solomon Islands · · · · 11 122 · · 9 3 6 · · · · 30 0.003 140 0.01
Sri Lanka · · · · 518 5,567 · · 2,648 347 619 · · · · 4,130 0.36 9,180 0.50
Thailand · · 13,616 1,842 19,807 · · 23,209 5,079 21 · · · · 43,770 3.86 61,730 3.33
Tonga · · · · · · 2 · · · · 3 9 · · · · 10 0.001 10 0.001
Vanuatu · · · · 4 42 · · 40 · · 3 · · · · 50 0.004 80 0.005
Viet Nam 2,767 2,177 2,443 26,271 · · 19,226 1,608 427 · · · · 28,650 2.52 52,470 2.83
Asia-Pacifi c 160,844 17,978 73,607 791,404 11,702 588,263 92,670 77,090 101,507 11,616 1,135,300 100 1,853,100 100
Share if sustainable wood (%)
14.17 1.58 6.48 · · 1.03 51.82 8.16 6.79 8.94 1.02 100 · · · · · ·
Share if unsustainable wood (%)
8.68 0.97 · · 42.71 0.63 31.75 5.00 4.16 5.48 0.63 · · · · 100 · ·
Source: Patil 2011.Note: Calculations based on data from NationMaster 2011; FAO 2010k. · · Not available.
The already limited access to energy will be diminished by climate change. Biomass production is particularly vulnerable to seasonal water variability and the changing runoff pat-tern of rivers. Modern energy supplies can be disrupted by cyclones and floods, while also coming under pressure from the rising demand for amenities such as airconditioning.19 Assured energy access and switching to modern energy services are obvious development goals anyway; they are no less important than integral strategies to build resilience to climate change.
Effects on Household Emissions
When households in the region have to rely on traditional fuels, they often use inefficient technology resulting in incomplete combus-tion that is polluting. Assuring access to cleaner options, while crucial for combating deprivation
and building resilience, will also be better for the environment and help in addressing climate change.
Relatively little attention has been paid to household CO2 emissions in Asia and the Pacific. These have simply been assumed to be relatively small. If household emissions are based largely on burning renewable resources replaced with new growth that in turn absorbs an equivalent amount of carbon from the atmosphere, then the net effect on emissions can be neutral. Unfortunately, this is not always the case. In a number of countries, a significant proportion of the wood burned for fuel comes from non-renewable resources. As the proportion is often unknown, there is con-siderable uncertainty about total emissions.
Sustainable wood gathering involves harvest-ing less than annual regeneration. To illustrate, Table 3.3 presents two extremes of possible household emissions depending upon how wood
Assuring access to cleaner options, while crucial for building resilience, will be better for the environment and help in addressing climate change
Assuring access to cleaner options, while crucial for building resilience, will be better for the environment and help in addressing climate change

3 FAIR AND BALANCED CONSUMPTION 69
is obtained; actual emissions can be expected to vary within this range. If all the wood burned in the Asia-Pacific were collected sustainably, then total annual emissions from households would be 1,135 million tonnes CO2e. With unsustainable practices the total would rise to 1,852 million tonnes CO2e.
Even assuming the wood is largely from sustainable resources, a high proportion of household emissions still arise from the use of electricity: on average, the amount of emissions from electricity is 588 million tonnes. Increasing emissions from electricity are inevitable as more households get access to it. As sources of electricity generation affect emissions, it is important to both increase the efficiency of household use and switch to a higher share of cleaner sources of electricity generation.
A further concern around emissions from households is the dispersal into the atmosphere of soot and other particulates, which pollute the air and have strong global warming effects. An estimated 25 to 35 per cent of this ‘black carbon’ in the global atmosphere comes from China and India, as a result of households burning wood and cow dung and using coal to heat homes.20 If China and India expanded access to modern fuels,21 black carbon emissions could be almost eliminated.22 But this would be expensive.
CHANGING CONSUMPTION PATTERNS
Despite being home to millions of poor people, Asia-Pacific has become the world’s dynamo of economic growth.23 This has enabled the region to boost average incomes and reduce poverty. The region’s developing economies grew at an average annual rate of 5.3 per cent between 1970 and 2008, a rate that largely exceeds the growth rates of other developing and developed regions.24 Between 1990 and 2010, per capita GDP (constant 2005 PPP$) more than doubled across Asia-Pacific sub-regions in comparison to the world on average, although in the Pacific, increases were small. The sharpest increase was in China, where per capita GDP increased by more than five times, followed by Viet Nam, where it increased by three times.25 The growth of per capita GDP (PPP$) in East Asia and the Pacific as well as in South Asia sub-regions, on average, was faster during 2000–10 than during 1990–2000.
Economic growth has translated into higher overall household expenditure. Between the decades 1990–99 and 2000–09, global per capita household expenditure increased by 18 per cent, while in a number of Asian countries it in-creased far more rapidly — by 48 per cent in Cambodia, for example, and 92 per cent in China (Table 3.4).
These average increases are impressive, but disguise considerable disparities — about two-thirds of the world’s poor still live in Asia-Pacific.26 In many countries, economic growth has been accompanied by rising inequality and has been less inclusive than in other regions.27 By the mid-2000s in South Asia, Nepal, followed by Sri Lanka and India, had the highest in-come inequality. In East Asia during the same time, inequality increased in Cambodia, China, Indonesia, Lao People’s Democratic Republic, Mongolia and Viet Nam.28
This has further skewed the patterns of consumption in these countries. In Nepal, for example, while the per capita expenditure of the poorest 20 per cent rose by less than 2 per cent, that of the richest 20 per cent rose by more than 7 per cent (Figure 3.2). The increase in in-equality thus does not mean that the rich are getting richer and the poor are getting poorer,
Economic growth has
translated into higher household
expenditure; these average increases
are impressive but disguise considerable
disparities
Economic growth has
translated into higher household
expenditure; these average increases
are impressive but disguise considerable
disparities
TABLEASIA-PACIFIC FAMILIES ARE SPENDING MORE THAN BEFORE3.4
Per Capita Household Expenditure, 1990–99 and 2000–09
Mean Levels
1990–99 2000–09 % Change
Bangladesh 251 293 17
Cambodia 224 333 48
China 308 592 92
Hong Kong, China (SAR) 13,986 16,442 18
India 248 358 45
Indonesia 423 561 33
Iran, Islamic Republic of 665 920 38
Korea, Republic of 5,164 7,236 40
Macao, China (SAR) 5,364 6,538 22
Malaysia 1,568 2,179 39
Pakistan 368 428 16
Thailand 1,023 1,297 27
Timor-Leste 336 433 29
Viet Nam 239 349 46
World 2,928 3,469 18
Source: Based on World Bank 2011b.Note: Calculations based on data for household fi nal consumption expenditure per
capita between 1990–99 and 2000–09 at constant 2000 PPP$.

ASIA-PACIFIC HUMAN DEVELOPMENT REPORT70
FIGURE GENERALLY, THE LARGEST EXPENDITURE INCREASES ARE IN THE RICHEST HOUSEHOLDS3.2
Changes in Per Capita Expenditure, 1990–2000s, Bottom 20% and Top 20%
Source: Adapted from ADB 2007b.Note: Calculations refl ect changes in growth rates of per capita expenditure, 1990–
2000s, bottom 20 per cent and top 20 per cent, at constant 1993 PPP$.
even a similar percentage increase gives them relatively little.30
Rising disparities in income are also reflected in disparities in nutrition standards and health services. These have been receiving greater policy attention as countries struggle to adapt to climate change while bridging develop-ment deficits. In some cases, it is proving easier to distribute private goods than to provide collective infrastructure, especially for remote, sparsely populated areas. Thus, while there are more than 2.5 billion mobile phone subscriptions in Asia and the Pacific,31 nearly half the population of the region lacks basic services such as access to flush toilets.32 Progress on improved sanitation has been slow in southern Asia, and has dispro-portionately benefited the wealthy.33
Asia’s New Consumers
Traditionally, Asians have been savers rather than spenders, but this is changing. Even dur-ing the global recession, consumer spending in developing Asia remained remarkably robust. In 2008, it reached an estimated US$4.3 trillion annually, equivalent to nearly one-third of pri-vate consumption in the OECD countries.34 If their appetite for goods and services continues to grow at this pace, by 2030, Asian consum-ers could account for 43 per cent of worldwide consumption.35
Another shift has been the emergence of a sizeable middle class. Defining a middle-class income as $2 to $20 per capita per day, between
FIGUREASIA-PACIFIC MIDDLE CLASSES ARE EXPANDING RAPIDLY3.3
Change in Percentage of the Middle Class by Global Region, 1990–2008
Sources: ADB 2010; Chun 2010.Note: The expansion of the middle class is in large part due to changes in India and China.
but rather that the rich are getting richer faster, while the poor are missing out on most of this rising prosperity.29 In India, wages and expenditures have increased across the board, but since the poor started with low incomes,

3 FAIR AND BALANCED CONSUMPTION 71
FIGUREDEMAND FOR MOTORCYCLES IS INCREASING AMONG BOTH RURAL AND URBAN CONSUMERS3.4
Ownership of Motorcycles, Selected Countries, Percentage of Households
Source: Based on Measure DHS 2010.
1990 and 2008 the middle class rose from 21 to 56 per cent of the region’s population — or to nearly 1.9 billion people — a bigger rise than in other regions of the world (Figure 3.3).36
The rise of the middle class in the world’s most populous region has driven up global demand for processed food, water, transport, energy, housing and a wide range of consumer goods. China and India are now the world’s largest markets for mobile phones.37
Demand for consumer durables is rising in both urban and rural areas. While a greater percentage of urban households own motorcycles in some countries, rural consumers are fast catching up. In some cases, the increased percentage of rural household owners outstrips that in urban areas (Figure 3.4). Consumption of certain items like refrigerators increased to a greater extent mostly in urban areas (Table 3.5). In China and the Philippines, more than 70 per cent of the population earning between US$4 and US$10 a day now have refrigerators (Table 3.6).
There are still many more urban than rural purchasers of cars, though demand is increas-ing in both areas. Between 1999 and 2009, the production of cars in India increased on an average by 15 per cent annually and in China by 36 per cent.38 By 2020, China is expected to have nearly 225 million automobiles plying its roads; by 2050, India could have 811 million,39 increases that will have implications for emissions. Many of these cars will have been designed espe-cially for lower-income consumers. In India,
TABLEMANY MORE HOUSEHOLDS CAN NOW AFFORD CONSUMER DURABLES3.5
Ownership of Consumer Goods, Selected Countries, Percentage of Households
Television Refrigerator Motorcycle Private Car
Bangladesh 2007
Urban 59.3 24.8 4.7 1.5 Rural 21.9 2.5 2.4 0.2Bangladesh 2004 Urban 49.1 · · 4 · · Rural 15.5 · · 1.3 · ·Cambodia 2005 Urban 72.2 15.9 55.4 15.2 Rural 52.3 0.7 31.1 2Cambodia 2000 Urban 57.9 10.3 49.8 10.2 Rural 28.2 0.4 18.6 1India 2005–06 Urban 73.2 33.5 30.5 6.1 Rural 30.1 6.6 10.8 1India 1998–99 Urban 69.2 28.8 25 4.4 Rural 20.2 3.7 6 0.6Indonesia 2007 Urban 84.9 43.1 55.7 10.8 Rural 57.2 12.6 37.3 3.4Indonesia 2002–03 Urban 79.3 31.9 38.7 9.7 Rural 47.8 6.2 21.9 2.3Viet Nam 2002 Urban 91.1 49.4 74.7 2.4 Rural 64.9 5.8 36.9 0.7Viet Nam 1997 Urban 82.6 32.8 53.3 2.2 Rural 42 2.5 16.5 0.5
Source: Measure DHS 2010.Note: · · Not available.

ASIA-PACIFIC HUMAN DEVELOPMENT REPORT72
TABLEIN CHINA, MANY POOR HOUSEHOLDS HAVE TVS AND SCOOTERS3.6
Distribution of Households by Class and by Ownership of Selected Durables
Per capita expenditure/income class (2005 PPP$)
Percentage of household with. . .
Radio TV Refrigerator Motorcycle/Scooter Automobile
Chinaa India Philippines Chinab India Philippines China India Philippines China India Philippines China India Philippines
<$1.25 21.9 19.0 44.9 43.7 17.0 26.1 8.3 1.0 3.3 13.2 2.0 1.9 0.1 0.2 0.2
$1.25–$2 24.2 27.0 56.6 55.3 30.0 54.6 14.5 3.0 13.6 18.7 5.0 5.6 0.1 0.7 0.5
$2–$4 28.7 31.0 62.7 74.5 43.0 80.7 37.5 10.0 41.1 24.6 13.0 13.1 0.2 1.0 2.6
$4–$10 39.4 36.0 67.9 92.6 61.0 93.7 74.3 29.0 76.2 24.3 29.0 22.1 1.1 2.0 14.8
$10–$20 49.1 42.0 72.3 95.9 67.0 96.1 91.3 46.0 88.9 26.5 41.0 18.8 2.5 8.0 39.9
>$20 63.2 48.0 76.1 98.3 74.0 98.4 91.5 59.0 94.5 44.1 46.0 18.0 10.2 22.0 59.7
Source: Based on ADB 2010.Notes: (a) stereo, rural; (b) colour TV. Estimates based on household consumer expenditure survey of India 2004–05, the Philippines family income and
expenditure survey 2006, and Chinese household income project survey 2002.
per person in Singapore,46 and about the same in Shanghai.47
Communities such as indigenous peoples, nomads and forest dwellers are rarely seen as con-sumers. But even these groups are starting to assimilate into market economies, and growing numbers among the younger generation do not want to struggle at minimal levels of consumption. In Mongolia, for example, many more nomadic communities are now settling, and some are moving to urban Ulaan Baatar. Growing urbanisation both increases the demand for products and services and adds to issues of land use change and degradation, emissions and pollution.48
Changing Diets
As middle-class incomes rise, diets also change, for better and for worse, and with implications for climate change. Responding to wider choices and to advertising, households in developing Asia-Pacific countries, particularly those with young people, are eating more, especially meat and dairy products as well as processed food and drinks. Asia’s urban middle-class diets are thus converging with western diets based on wheat, temperate fruit and high-protein and energy-dense food.49 The dietary transition includes a strong preference for meat. This has implica-tions for climate change, as livestock is a sig-nificant contributor to global emissions.
Sizeable rises in meat consumption are evident in both developing and developed countries, though consumption in Mongolia has declined
for example, the Nano from Tata Motors costs only US$2,200.40 When public transport is weak and receives relatively little investment, many families and individuals are tempted to buy cheap cars, which are, for the time being at least, likely to be powered by gasoline rather than electricity. Even when cars do use electricity, it has likely been produced by burning coal, which is polluting. The rise in the number of private vehicles has been accompanied by a significant expansion in road networks in many countries, while rail networks in contrast have seen only marginal increases (Table 3.7).
As middle-class families in developing coun-tries move up the income ladder, they become part of a ‘global consumer class’.41 Generally younger, and living in urban areas, their tastes and pat-terns of consumption are increasingly becom-ing similar to those in western industrialised countries. As a result, even in countries where average per capita emissions remain low overall, the environmental impact of the region’s better-off city dwellers is rising steadily, especially in the use of energy.42 In China, urban per capita energy consumption is around seven times that in rural areas.43 Between 1999 and 2009 in Singapore, which is often seen as setting the pace for other Asian cities, household consumption of electricity increased by 64 per cent and that of water by 21 per cent, while solid waste pro-duction increased by 21 per cent.44 This has given rise to a larger ‘ecological footprint’, which is the amount of land and water required to support each individual.45 That figure is now 7 hectares
The rise in private vehicles has been accompanied by a significant expansion in road networks, while rail networks have seen only marginal increases
The rise in private vehicles has been accompanied by a significant expansion in road networks, while rail networks have seen only marginal increases

3 FAIR AND BALANCED CONSUMPTION 73
significantly, and in New Zealand and Malaysia to a lesser extent (Figure 3.5). Meat consumption per person in South Asia — Bangladesh, India, Nepal, Pakistan and Sri Lanka — is much lower.
Increase in the intake of fats and protein is steeper in East and South-East Asia than in South Asia, though the consumption of these foods is on the rise in all these regions (Figure 3.6). This is in contrast to traditional Asian diets that emphasise carbohydrates. A rise in protein intake due to meat consumption is particularly evident in East Asia,50 while across Asia, people are eating more edible oils.51
Changes in diet are occurring both in urban and in rural areas. India, for example, has seen
a steep increase in fat consumption in urban areas, though the same effects are also evident in rural areas, if at a lower level (Figure 3.7). While under-nutrition is going down and nutrition is improving overall, the dietary transition to increased fat and meats, combined with poor nutri-tional choices and sedentary lifestyles, can also lead to ill-health, being underweight or overweight, hypertension, diabetes and heart disease.52
The dietary transition is expected to have an impact on GHG emissions, since carbon dioxide is released by the use of fossil fuels in agriculture. Methane is released by cattle and other ruminants, and fertiliser causes emissions of nitrous oxide.53 Although the measurement of
Intake of fats and proteins is on the
rise; the dietary transition is
expected to have an impact on
GHG emissions
Intake of fats and proteins is on the
rise; the dietary transition is
expected to have an impact on
GHG emissions
TABLEROAD TRANSPORT IS EXPANDING FASTER THAN RAILWAYS3.7
Extent of Road and Rail Transport, Selected Countries
Total motor vehicles per
1,000 people∗(1990)
Total motor vehicles per
1,000 people∗(2007)
Road density(km of road per 1,000 sq. km of
land) (1990)
Road density(km of road per 1,000 sq. km of
land) (Latest year)
Paved roads(Per cent of total road)
(Latest year)
Rail network, length per land area (km per 1,000 sq. km) (1990)
Rail network, length per land
area (km per 1,000 sq. km) (2008)
Australia 530 653 105.5 106.1 (2007)
38.7 (1998)
0.9 1.3
Bangladesh 1 (1993)
2 1,444.3 1,837.8 (2003)
9.5(2003)
21.1 21.8
Cambodia 0 36 (2001)
202.8 216.7 (2004)
6.3 (2004)
3.4 3.7
China 10 (1998)
32 126.6 384.2 (2007)
70.7 (2007)
5.7 6.5
Fiji 173 166.9 188.3 (2000)
49.2 (2001)
· · · ·
India 5 (1993)
12 672.7 1,115.5 (2007)
47.4 (2002)
21.0 21.3
Indonesia 16 76 159.4 215.8 (2005)
55.4 (2005)
2.8 (1995)
1.9
Japan 467 595 3,057.3 3,283.9 (2007)
79.3 (2007)
55.6 55
Lao People’s Democratic Republic
9 21 60.5 129.2 (2006)
13.4 (2006)
· · · ·
Mongolia 29 (1998)
61 27.3 31.7 (2002)
3.5 (2002)
1.2 1.2
Philippines 9 32 538.5 670.9 (2003)
9.9 (2003)
1.6 1.6
Papua New Guinea 9 40.9 43.3 (2000)
3.5 (2001)
· · · ·
New Zealand 527 729 346.2 350.2 (2007)
65.4 (2007)
15.0 14.6
Singapore 147 149 4,176.1 4,730.3 (2007)
100.0 (2007)
· · · ·
Sri Lanka 20 58 1,439.0 1,505.3 (2003)
81.0 (2003)
22.5 22.6
Source: Adapted from ADB 2010.Note: Motor vehicles include passenger cars, taxis, trucks and buses, but exclude motorcycles and scooters. ∗ To enable comparison with 1990, data for 2007 is taken from ADB 2010. The same indicator is in Table 13 of the Indicators section, but has no
data for 1990 (World Bank 2011b). · · Not available.

ASIA-PACIFIC HUMAN DEVELOPMENT REPORT74
FIGUREFAMILIES ARE MORE LIKELY TO BE EATING MEAT THAN BEFORE3.5
Meat Consumption, Grammes per Person, 1995–97 and 2005–07
Source: FAO 2010g.
FIGUREASIANS ARE EATING MORE HIGH-FAT, HIGH-PROTEIN FOOD3.6
Dietary Protein and Fat Consumption, Grammes per Day per Person, 1990–92 and 2005–07
Source: FAO 2010g.
emissions in agriculture is complex, it is clear that an increasing proportion is attributable to meat production.54
Counting Consumption-Linked Emissions
What does rising consumption as a whole imply for GHG emissions? Global experience indicates that, on average, as per capita incomes increase, per capita carbon emissions also tend to rise (Table 3.8). Patterns of human activity can, of course, make a difference to the extent of emissions. Going up the income scale of country groupings, the sharpest rise is between the middle- and high-income categories. The association is similar across countries in Asia and the Pacific (Figure 3.8).
It would be useful to collect systematic emis-sions data by end-use consumption, covering the value chains and life-cycle of products and services, and thereby shedding light on how consumption patterns have been driving emis-sions. Unfortunately, such information is not available globally or for Asia-Pacific. One attempt in this direction has been made by the Global Trade Analysis project database, which analyses the carbon footprint of nations. The picture that emerges (Figure 3.9) shows per capita emis-sions from consumption in certain sectors such as mobility and manufactured products rising steeply with per capita expenditure. Emissions from food start at a higher initial level and increase more gradually with expenditure. Revealing links like these could inform policies that aim to direct consumer choices towards low-carbon pathways.
Partial Reckoning of Costs
Greenhouse gas emissions are just one of the by-products of increasing consumerism, the pressure to use resources and energy-intensive industrialisation. Beyond climate change, other serious social and environmental costs also accrue. Environmental tolls include increasing degradation of forests, pressures on ecosystems, land, air and water pollution and large-scale waste.55 Both environmental damage and cli-mate change can reduce the amount of resources available, which may exacerbate conflicts over these resources. This threat has particular significance in Asia and the Pacific, since the region has far fewer natural resources per capita than many other areas of the world.

3 FAIR AND BALANCED CONSUMPTION 75
Freshwater Stress
In many parts of the region, climate change will affect water supplies.56 Already, per capita freshwater availability in Asia and the Pacific is the second lowest in the world.57 A growing number of places in the region are already under severe water stress, not just in arid and semi-arid areas but also elsewhere, as demand steadily outstrips supply. In India, for example, increased consumption is decreasing per capita fresh-water availability: it has been estimated that by 2030, while freshwater withdrawal might in-crease by 40 per cent from 2008–09 levels, indus-trial and domestic consumption will increase three times beyond the levels in 2008–09.58 Small islands in the Pacific, which had limited freshwater supplies to begin with, are also at risk. One threat comes from salt intrusion, which is likely to rise with climate change. In south-west Bangladesh, where sources of drinking water are already affected by salinisation, many women now have to walk up to 6 kilometres per day to fetch drinking water.59
Loss of Forest Cover
Another major concern is forest cover. On a per capita basis, the Asia-Pacific is one of the world’s least forested regions, with around 0.2 hectares of forest per person compared to a global average of 0.6 hectares.60 Though forest cover increased on a regional level overall, South-East Asia continued to register losses in this regard during 2000–10, albeit at a lower level than in the previous decade.61 The loss of forests not only releases stored carbon into the atmosphere but also reduces carbon sequestration, thus con-tributing further to global warming. Several drivers are behind deforestation. Forests have been converted to pastureland for livestock or for use by subsistence farmers. Some have suffered from invasive species, pests and pol-lution. The main impetus, however, has been over-exploitation, primarily for commercial and industrial purposes, notably to supply the timber and pulpwood trades and to clear areas for palm-oil plantations. High global prices for palm oil as a biofuel are spurring the growth of plantations in Indonesia and Malaysia,62 which are also among the region’s biggest net exporters of forest products.63
FIGUREDIETARY INTAKE OF FAT IS INCREASING IN BOTH RURAL AND URBAN INDIA3.7
Average Fat Intake in India, Grammes per Person per Day, by Residence, 1972–73 to 2004–05
Source: National Sample Survey Organisation 2007, cited in ADB 2010.
TABLETHE MOVE TO HIGH-INCOME STATUS ACCELERATES CO2 EMISSIONS3.8
Per Capita CO2 Emissions by Country Income Category
GDP per capita, (Current US$), 2010
GDP per capita, (Constant 2005
PPP$), 2010
CO2 Emissions, per capita
(Tonnes), 2007
High income 38,208 33,160 12.16Upper middle income 6,246 8,724 5.18Middle income 3,992 5,992 3.36Lower middle income 1,750 3,273 1.50Low income 523 1,146 0.28World 9,228 9,817 4.74
Source: World Bank 2011b.Note: Analysis based on Chandrasekhar 2011.
FIGUREA RISE IN CONSUMPTION IS ASSOCIATED WITH HIGHER EMISSIONS3.8
Per Capita Consumption and Per Capita CO2 Emissions in Asia and the Pacifi c, 2007
Source: Based on World Bank 2011b.Note: GDP per capita 2007 at constant 2000 dollars in select Asia-Pacifi c countries.

ASIA-PACIFIC HUMAN DEVELOPMENT REPORT76
Among the Pacific countries struggling with deforestation is the Solomon Islands, where many hills have been effectively stripped of their forest cover for exports.64 Concerns about forests are growing. Small gains in forest cover were observed in East Asia and the Pacific as well as in South Asia between 1990 and 2010.65 Globally, seven developing countries have moved from deforestation to reforestation, of which four are in Asia — Bhutan, China, India and Viet Nam.66
While much timber is cut from virgin forests, some, especially for paper and paperboard, is now being produced on plantations — though much of the Asia-Pacific demand is met from outside the region.67 Rapid growth in paper and paperboard production and consumption has
Loss of forests not only releases stored carbon in the atmosphere but also reduces carbon sequestration, contributing to global warming
Loss of forests not only releases stored carbon in the atmosphere but also reduces carbon sequestration, contributing to global warming
also increased the pressure to convert natural forests into plantations.
The largest importers globally of forest products remain developed countries, though the demand from China is catching up.68 Led by increasing demand, the region has become a net importer of most wood products.69 China, for example, increased its imports of logs and wood products by more than 50 per cent between 1995 and 2005.70
Confl icts over Resources
Social costs from shrinking resources include the displacement of communities, loss of ecosystem-based livelihoods and competition over more scarce resources. Costs are exacerbated in many
FIGUREHIGHER CONSUMPTION MEANS LARGER CARBON FOOTPRINTS, BUT LEVELS VARY DEPENDING ON SECTOR3.9
Per Capita Consumption and Per Capita CO2 Consumption Emissions by Sector, 2001
Sources: Adapted from Hertwich and Peters 2009; World Bank 2011b.Note: Adapted from Hertwich and Peters 2009; for consumption expenditure 2001 at constant 2000 US$ data from
World Bank 2011b were used.

3 FAIR AND BALANCED CONSUMPTION 77
ways, for instance, when industrial zones provide jobs and boost manufacturing but at the same time privatise natural resources such as water and acquire land from local communities.
A tradition of protest exists in Asia over the effects of mining and heavy infrastructure such as coal-fired power plants. Electricity generated from these plants benefits many populations, often living at great distances from the plants, but it affects common resources such as the air, water and land of those who live closest to the plants. For instance, villagers of Lampang province in Thailand have been protesting against the health impact of sulphur dioxide emissions from the EGAT coal-fired power plant for nearly a decade. In 2009, a local court awarded compensation to them for bad health caused by pollution from the plant, and ordered the company to relocate affected families to new land.71
Citizen activism can also arise when issues such as air pollution reach a tipping point. Hong Kong residents protested in 2006 with a ‘lights out day’ after visibility fell to less than 1 kilometre on more than 50 days in the pre-vious year.72 Unhealthy levels were recorded again in 2010, despite some abatement from China’s Pearl River delta area factories due to emission reduction measures there.73
Measuring Ecological Footprints
Estimates of ecological footprints are one method of looking at the accelerated carbon cycle and global warming. Globally, the world’s ecological footprint significantly exceeds its biocapacity; the same phenomenon is now occurring in the developing countries of Asia (Table 3.9). Some still retain a positive ecological reserve, including Indonesia, Lao People’s Democratic Republic, Mongolia, Myanmar, Papua New Guinea and Timor-Leste. But most countries have low ecological reserves, and some are exceeding their biocapacity to a significant extent.
The notion of an ecological footprint — of which the carbon footprint is a part74 — may be biased against densely populated countries. For instance, those with fewer natural resources will have limited biocapacity relative to their domestic consumption and will need to trade across borders. Countries with larger endow-ments relative to their consumption will have
The world’s ecological footprint
significantly exceeds its bio-
capacity; the same phenomenon is now occurring in developing
countries of Asia
The world’s ecological footprint
significantly exceeds its bio-
capacity; the same phenomenon is now occurring in developing
countries of Asia
lower footprints. But what the ecological footprint data do point to is inequality in the exploitation of natural resources and the inter-dependence of geographical areas beyond national boundaries.75 Looking at the footprint in global terms provides an insight into the planet’s overall limit.76
It has been suggested that countries should aim to achieve a human development index greater than 0.8 while keeping their per capita ecological footprint below the per capita global biocapacity, estimated in 2007 at 1.8 global hectares.77 While this approach and the accuracy of such figures may be debated, it is clear that the world has to live within the limits of its ecological resources, and that, from a human development
TABLEDEVELOPING ASIA STILL HAS THE CHANCE TO KEEP ITS FOOTPRINT SMALL3.9
Ecological Footprints, Biocapacity and Ecological Defi cits, 2007
Population (Millions)
Ecological footprint (Global
hectares per capita)
Total biocapacity
(Global hectares
per capita)
Ecological (Defi cit)
or reserve
World 6,672 2.7 1.8 (0.9)
High-income countries 1,031 6.1 3.1 (3.0)
Middle-income countries 4,323 2.0 1.7 (0.2)
Low-income countries 1,303 1.2 1.1 (0.1)
Developing Asia 3,576 1.9 1.8 (0.1)
Afghanistan 26 0.6 0.5 (0.1)
Bangladesh 158 0.6 0.4 (0.2)
Cambodia 14 1.0 0.9 (0.1)
China 1,337 2.2 1.0 (1.2)
India 1,165 0.9 0.5 (0.4)
Indonesia 225 1.2 1.4 0.1
Iran, Islamic Republic of 72 2.7 0.8 (1.9)
Korea, Democratic People’s Republic of
24 1.3 0.6 (0.7)
Lao People’s Democratic Republic 6 1.3 1.6 0.3
Malaysia 27 4.9 2.6 (2.3)
Mongolia 3 5.5 15.1 9.6
Myanmar 49 1.8 2.0 0.3
Nepal 28 3.6 0.5 (3.0)
Pakistan 173 0.8 0.4 (0.3)
Papua New Guinea 6 2.1 3.8 1.6
Philippines 89 1.3 0.6 (0.7)
Sri Lanka 20 1.2 0.4 (0.8)
Thailand 67 2.4 1.2 (1.2)
Timor-Leste 1 0.4 1.2 0.8
Viet Nam 86 1.4 0.9 (0.5)
Total 3,576
Sources: Bashir 2011; based on Ewing et al. 2010.Note: Excludes Bhutan, Maldives and 14 Pacifi c Island countries for which data were
not available.

ASIA-PACIFIC HUMAN DEVELOPMENT REPORT78
SPECIAL CONTRIBUTION
CLIMATE CHANGE AND BHUTAN’S SUSTAINABLE DEVELOPMENT PHILOSOPHY
H. E. LYONCHHEN JIGMI YOESER THINLEY
Even as the world reaches the highest level of wealth at any time in human history, the numbers of the poor and their vulnerability to all kinds of threats are also at new peaks. Meanwhile, natural calamities are accelerating, accompanied by degraded ecosystems and a changing climate, and many man-made disasters are being caused by systemic failures of our macroeconomic structure in this globalised world.
In the past century, environmental problems were at the local and regional levels. Today, much like globalisation, climate change affects every person and species on this planet. Development, particularly in the past century, has not advanced human civilisation or refined human behaviour.
Why is this happening?Development has been interpreted
purely as economic development, the GDP model that promotes unlimited economic growth as the means to human wellbeing and satisfaction. This has resulted in a raging greed and an excessive desire to consume. Air, water and soil, that are the sources of sustenance for all life forms, are being poisoned.
The present generation has con-sumed its share of the planet’s resources and capacity and has already begun depriving future generations of their share of resources and chances of survival. It has been predicted that, with business as usual, two planets will be required by the early 2030s to keep up with humanity’s demand for goods and services.
We need to change and mend our ways, acknowledge that life as we live it is propelling us toward self-destruction. We need to realise that high GDP targets are achieved at the
high price of social dislocation and environmental devastation and dispel the notion that unlimited economic growth is equated with wellbeing. A more holistic model is needed to set human society on a sustainable path.
Recognising this, Bhutan has adopted the profound ideals of Gross National Happiness (GNH) that, I believe, represents a higher goal for human development. This pursuit of a holistic development, guided by GNH, has enabled us to demonstrate tremendous progress as measured against the Millennium Development Goals.
Bhutan’s Constitution holds the state, as an arbiter of public policies and plans, responsible for promoting GNH. Gross National Happiness requires that, since the single most important desire of all citizens is happiness, the endeavour of government must be to create conditions that will enable its citizens to pursue happiness. The Bhutanese government has undertaken this responsibility through a four-pronged strategy popularly referred to as the four pillars of GNH: equitable and sustainable socio-economic development; conservation of the environment; preservation and promotion of culture; and promotion of good governance. These pillars have been expanded into nine domains and 72 variables to translate GNH into action.
Gross National Happiness relates development to contentment and happiness, based on the belief that happiness can be best achieved through development that balances the needs of the body with those of the mind within a stable and sustainable environment. It stresses that material enrichment must not lead to spiritual impoverishment and that it must address the emotional
and psychological needs of the individual.
Bhutan has negat ive carbon emissions and is one of the few places on earth that continues to clean the carbon emissions of others. Yet it is one of the countries most vulnerable to climate change. Our fragile mountainous landscape with rapidly melting glaciers, drying water sources, predominantly subsistence modes of farming and an economy heavily dependent on hydropower, which is climate-sensitive, threatens the wellbeing and survival of our people.
However, we will continue to be guided by the holistic development paradigm of GNH, to promote a green and sustainable economy and strive to mitigate and adapt to the effects of climate change through limited resources and by making the best use of the token assistance received thus far to address climate change.
Our forest cover has expanded to 72 per cent, natural mineral resource use is being pursued by enforcing mining and environmental laws based on sustainable development and pre-cautionary principles, and more than 50 per cent of our total land area has been designated as national parks and protected areas. Bhutan’s Constitu-tion mandates that 60 per cent of the land be covered under forests for all time to come. Reflecting the royal government’s deep commitment to combating climate change, Bhutan has pledged to maintain its status as a net absorber of greenhouse gases. These are compulsions prompted by the need to protect our future generations and ourselves as part of a larger human race. Small as we may be, we are doing our best in fulfilling

3 FAIR AND BALANCED CONSUMPTION 79
mankind’s common responsibility to tackle climate change.
Climate change affects everyone, but it is the most vulnerable communities and countries with the lowest carbon footprints that are suffering the most. A GNH approach to development promotes balanced and equitable de-velopment to enhance the wellbeing of not just a few but of the many by including those most vulnerable indi-viduals and communities.
In the past five decades, since Bhutan embarked on planned develop-ment, we have consciously sacrificed faster economic growth through ex-ploitation of our natural resources such as forests and minerals. A GNH approach to development not only
requires balanced and equitable socio-economic development, but also calls for recognition of the limits of the physical environment within which the economic system functions.
Bhutan is carbon-negative. And we have committed to remaining carbon-neutral. This commitment is in line with our philosophy of Gross National Happiness and our role as a responsible member of the global community. We believe that the path we have taken is not only ecologically correct, but also morally responsible.
I urge all members of our global community to engage in serious reflection on how a more holistic, sustainable and, indeed, happy life can be achieved without pushing nature
beyond her productive and absorptive capacity.
— Jigmi Y. Thinley
Lyonchhen Jigmi Yoeser Thinley is cur-rently Prime Minister of Bhutan. Prior to the establishment of democracy in 2008, he served as prime minister twice. His previous political appointments include Minister of Foreign Affairs, Minister of Home and Cultural Affairs and Bhutan’s Permanent Representative to the United Nations. He received his Master’s in Public Administration from Pennsylvania State University in 1976. In his free time, he enjoys gardening, archery and golf.
perspective, these will need to be shared more equitably.
ENERGY FOR BUILDING THE RESILIENCE OF THE POOR
Countries in Asia and the Pacific need to build the resilience of their poorest and most vul-nerable people today, while dealing with the impacts of climate change and protecting the choices available to future generations. The immediate human development aim remains that of reducing poverty and raising the stand-ards of health and education. The present levels of under-consumption of basics, such as adequate food, water, shelter, transport and energy services, need to be prioritised so that communities not only improve their human development but are also prepared to withstand the additional challenges that climate change brings.
An important part of this agenda is to increase access to modern energy services that are not only affordable but now need to be cleaner too.78 Even without factoring in climate change, energy services constitute a significant development gap in the region. In the face of climate change, it is even more urgent to recognise important co-benefits: energy services improve not only
In the face of climate change it is even more
urgent to recognise important
co-benefits: energy services improve resilience to risks
and shocks
In the face of climate change it is even more
urgent to recognise important
co-benefits: energy services improve resilience to risks
and shocks
human development but also resilience to risks and shocks.
Assured access to electricity facilitates cold storage, enabling fishing communities, for instance, to store catches for longer stretches without spoiling. Women can experience better health due to reduced indoor air pollution and spend much less time collecting firewood with improved cooking stoves that use modern fuel. Health services in remote areas can be strengthened through uninterrupted or more regular power. Transportation services enable mobility in times of crisis and facilitate day-to-day access to markets, connecting communities and making them less vulnerable. Vital infor-mation such as weather forecasts and storm warnings can be transmitted instantly through televisions, radios, mobile phones and the inter-net. Climate-proofing energy infrastructure will thus be important.
At present, much of the debate on energy remains entangled with the issue of rising con-sumption and associated emissions. Discus-sions tackle likely trade-offs between emissions and growth, with less recognition of the levels of ‘under-consumption’ and the centrality of access to energy services in boosting human development, building resilience and helping communities adapt. One estimate suggests that

ASIA-PACIFIC HUMAN DEVELOPMENT REPORT80
providing basic modern energy services glob-ally would increase CO2 emissions to a tune of 0.8 per cent by 2030.79 Moreover, measures to increase access can both improve development and reduce emissions. Improved cooking stoves using less biomass or fossil fuels produce better air quality and health in homes, for example, and cut CO2 and black carbon emissions.80
Extending Energy Access
The developing countries of Asia and the Pacific are still far from achieving the levels of electri-city use common in the developed world. Of the world’s people without access to electricity, 37.4 per cent live in South Asia, mostly in rural areas.81 Poor communities need better access and affordable, good-quality services. Many are off-grid consumers who should be able to have near-grid quality through decentralised ser-vices. Much remains to be done, but a number of countries have demonstrated what is possible.
Electrifying rural households — India: In 2005, the Indian government launched the Rajiv Gandhi Grameen Vidyutikaran Yojana, a scheme to provide electricity to all rural households. This includes a 90 per cent capital subsidy from the centre and 10 per cent from the states for developing rural grid infrastructure, comple-mented by off-grid systems for renewable or non-conventional energy. For households below the poverty line, connections are 100 per cent free and fully subsidised by the scheme, while other households pay for the connection. By April 2011, over 16 million connections had been provided to poor households.82 But if India is to achieve its goal of 100 per cent rural household access to electricity by 2015, the yearly electrification rates will need to more than double, reaching 10 million households per year.83
Extending the grid — Viet Nam: Between 1986 and 2009, access to electricity in Viet Nam grew from about 10 to 97 per cent,84 with almost all households now connected to the grid.85 The most intensive growth period was from 1995 to 2008, when a massive programme tripled the national installed capacity and provided an average of 3.4 million people each year with electricity.86 Because the power supply utility had limited additional capacity, it also relied on
Poor communities need better access and affordable, good-quality services; many are off-grid consumers who should be able to have near-grid quality through decentralised services
Poor communities need better access and affordable, good-quality services; many are off-grid consumers who should be able to have near-grid quality through decentralised services
local distribution utilities, community coop-eratives and service agents to install, operate and maintain low-voltage lines as well as to manage invoicing and revenue collection.87 Funding came from multiple sources, including government subsidies, provincial government funds, international loans and grants and cross-subsidies.88
From firewood to biogas — Nepal: Between 1992 and 2009, over 200,000 biogas plants, benefit-ing more than a million people, were installed by the Biogas Support Programme.89 In 2005, the government’s Alternative Energy Promotion Centre developed the programme under the Clean Development Mechanism. The centre sells biogas plants primarily to rural households so that they can replace firewood for cooking. The unit consists of a manure digester and a gas-fired cooking stove. From the manure of around two cows, a small digester can produce enough gas for cooking and lighting for a household.90 Digesters can reduce emissions per household by around 4.6 tonnes of CO2e per year.91 Added benefits include fuelwood and kerosene savings for households.92
Demystifying solar energy — Rajasthan, India: The Barefoot College, an NGO, believes that rural development of all kinds should be managed and owned by those whom it serves. Since 1989, the college has been pioneering solar electrification in remote, rural villages, and demystifying the technology so that it can be controlled by local people. Fabrication, installation, usage, repair and maintenance of sophisticated solar lighting units are in the hands of rural, illiterate and semi-literate men and women. This approach has now been replicated across 751 villages in 16 states of India and in 17 countries. By the end of 2009, 461 people had been trained as barefoot solar engineers, of whom 211 are women. They have fabricated, installed, repaired and maintained more than 14,800 fixed solar units and 8,585 solar lanterns. Their collective efforts have benefited at least 896,000 men, women and children.93
Promoting solar home systems — Bangladesh: Grameen Shakti is a rural-based renewable energy company. It promotes a Small Solar Home System (SHS) to reach low-income rural households. By 2009, it had installed 315,000

3 FAIR AND BALANCED CONSUMPTION 81
solar energy units that can be used, for example, to light homes, shops and fishing boats, charging cellular phones, and powering televisions, radios and video players.94 Solar home systems are easy to install, involve no monthly bills and are cheap to repair and maintain. In addition, in order to reach poorer people who cannot individually afford an SHS, Grameen Shakti has introduced a micro-utility model that allows households to share systems.95 Grameen Shakti won the 2008 Green Energy Prize for rural electrification through solar PV technology.96
Improving domestic cook stoves — Sri Lanka: Trad-itional cooking stoves using biomass, dung or coal are extremely energy-inefficient and polluting, resulting each year in 1.6 million deaths globally — mostly of rural women and children — as well as creating GHG emissions.97 The alternative is to use improved cook stoves that can also reduce health hazards for women from smoke in the kitchen. These can be made from local materials by trained, self-employed workers, and can provide a stable business supplying replacement grates and chimneys. Sri Lanka, for example, has developed a two-pot-hole improved cook stove called Anagi.98
The Asia Regional Cook-Stove Programme has identified Anagi as a proven design for mass production and commercialisation.99
Cooking up ready cash — Indonesia: In the villages of Kulon Progo district, Yogyakarta province, women and girls are responsible for cooking and for coconut sugar production. In the past, they used very inefficient stoves without chimneys; as a result, heat would escape around the edges of the pan. Now an NGO, Yayasan Dian Desa, has introduced improved stoves with structural modifications including a chimney and improved internal heat distribution.100 The stoves reduce cooking time, use less firewood and bring down costs, helping women produce coconut sugar as a secondary occupation that provides them with ready cash.101
REORIENTING LIFESTYLES
Asia-Pacific presents a wide diversity in life-styles. While the poor need to improve their consumption levels, the middle classes and the rich need to orient their lifestyles towards
lower-carbon pathways. All countries, rich and poor, will need to consider managing emissions better as part of adapting to climate change and supporting disadvantaged groups in accelerat-ing their human development.
For the developing countries, this will involve producing and consuming more — but differ-ently, recognising the limits of scarce resources and fragile ecosystems. Fortunately, they do not need to follow automatically the path taken by the rich economies. Instead, they can choose directions that take finite natural resources into account. States will have to concentrate on longer-term development and encourage in-vestment in goods and services that pose less of a burden to natural resources.102 Energy strategies will need to safeguard the interests of the poor while balancing the needs of present and future generations.
In addition to using more efficient tech-nologies, it will also be important to help con-sumers make more informed and greener choices. Local governments, civil society and consumer organisations can help in this by providing information about the carbon emis-sions of products and services and the oppor-tunities for sustainable lifestyles. A starting point for useful debate could be the Millennium Consumption Goals — a set of benchmarks to be achieved through a combination of voluntary actions by consumers and producers.103 Another suggested target is an emissions cap equivalent to primary energy consumption of 70 gigajoules per capita per year. The World Economic and Social Survey 2011 estimates that this could be a fair amount towards achieving balanced global consumption.104 Ideas about sustainable lifestyles are not new to Asia. In fact, a long tradition of pre-existing ‘green ideas’ provides a wealth of experience to tap into (Box 3.2).
Governments can help reorient lifestyles by facilitating access to cleaner technology through international partnerships and provid-ing regulatory frameworks along with fiscal measures and incentives that influence private-sector and consumer behaviour.
Switching to Energy-Effi cient Technologies
Compact fluorescent lights — China: In 1996, to address energy consumption in buildings, China started a Green Lighting Programme based
While the poor need to improve
their consumption levels, the middle
classes and the rich need to orient
their lifestyles towards lower-
carbon pathways
While the poor need to improve
their consumption levels, the middle
classes and the rich need to orient
their lifestyles towards lower-
carbon pathways

ASIA-PACIFIC HUMAN DEVELOPMENT REPORT82
BOX 3.2
VALUES OF SUSTAINABILITY PROVIDE OPPORTUNITIES FOR CHANGE
Ideas valuing the symbiotic relationship between human beings and nature have strong cultural roots in many parts of the Asia-Pacific. Many such strands of thinking — both new and older traditions — jostle with present-day rising consumerism. In Cambodia, for instance, the monks of Sorng Rukavorn, in cooperation with local villagers, have been able to fend off illegal logging, as the forest area is a prayer ground. Starting in the 1970s, the village-driven Chipko (meaning embrace) movement in India protested collectively against the destruction of Himalayan forests. Besides a number of forest safeguards that resulted from this movement, the Chipko initiative caught the popular imagination and spread environmental awareness.
Both traditional concepts like the ‘middle path’ and newer ideas like the ‘sufficiency economy’ of Thailand’s King Bhumibol Adulyadej emphasise practising moderation in all aspects of daily life. The latter example states an approach ‘to life and conduct which is applicable from the individual
through the family and community to the management and development of the nation’.
In other contexts there are evident preferences for food grown through traditional methods that is free from pesticides. In Timor-Leste, some farmers are reluctant to use synthetic fertilisers. In the words of one farmer, they ‘are sometimes smelly and they make [our] kids cough and sick’. In South Asia, there are consumers who will choose desi tamatar (Hindi for local tomato) grown through traditional methods, prizing them for their better taste, or nattu kozhi (Tamil for local chicken) that is bought directly from the farm with little or no processing.
Springing from local realities, much before terms like ‘green’ entered development discourse, these ideas and practices carry within them seeds that can grow to shape consumer choices. Selectively, they can provide avenues through which scientific knowledge can spur an array of climate-friendly options in daily lives.
Sources: Brady and Rukavorn 2011; Chipko Information Centre n.d.; Sarmento 2011; UNDP 2007b.
on compact fluorescent lamps (CFLs). The programme includes components on pricing, product quality standards, market promotion and consumer awareness. So far, energy-saving lamps in China have been used mainly by richer urban consumers, so in 2008 the government started to subsidise CFLs to make them more affordable.105 Compact fluorescent lamps are highly energy-efficient and can bring down the cost of electricity bills, but they contain mercury, which is hazardous for human beings and needs appropriate recycling facilities.
Encouraging hybrids — India: In 2011, the govern-ment announced a concessional excise duty of 10 per cent for fuel cell or hydrogen cell tech-nology. It also exempted imports of parts for hybrid vehicles from customs duty and offered a concessional excise rate of 5 per cent. In addition, the Indian government has reduced to 5 per cent the excise duty on a kit for converting a fossil fuel vehicle into a hybrid capable of running on compressed natural gas.106
Cleaner IT clouds — Japan: Japan is aiming to make information technology services more energy-efficient. Projects include ‘nanobit’
technology to reduce energy consumption per unit of information content as well as plans to build cloud computing infrastructure that will support the entire government IT system. This massive ‘Kasumigaseki Cloud’ will consolidate existing data centres and enable separate minis-tries to share computing resources.107
Seeking Different Entry Points
While many people may change their behaviour just to play a part in reducing emissions, most people are more likely to act if there are ‘co-benefits’. One is better health. This could come from measures that reduce air and water pollu-tion, or that discourage meat consumption and encourage a switch among high-end consum-ers to diets lower in fat and protein. Another co-benefit is cost savings — for example, more CFL lighting can save costs while lowering emis-sions. Measures to switch from private to public transport will cut emissions and reduce traffic congestion.
But there may not always be co-benefits. In some cases, there will have to be trade-offs, requir-ing some groups to give up privileges for the common good. This could occur, for example, by
Most people are more likely to act if there are co-benefits; in some cases there will be trade-offs requiring some groups to give up privileges for the common good
Most people are more likely to act if there are co-benefits; in some cases there will be trade-offs requiring some groups to give up privileges for the common good

3 FAIR AND BALANCED CONSUMPTION 83
taxing high-energy consumer durables such as large cars or putting limits on the consumption of energy. Countries across the region already have some experiences that can usefully be shared.
Controlling congestion — Singapore: Since 1990, Singapore has had a vehicle quota system that fixes the number of new vehicles registered each year. This system was introduced to control con-gestion, but it also mitigates GHG emissions. Anyone who wants a new vehicle has to bid for a certificate of entitlement for ownership for 10 years. The quota is released twice a month and bidding is through an electronic online auction system. The successful bid price for the certificate thus reflects what people are willing to pay for owning a car. This has restrained vehicle growth to around 3 per cent per year. In 2009, it was decided to reduce this to 1.5 per cent for three years.108
The city has also been controlling congestion through electronic road pricing, and a park-and-ride scheme, which allows drivers to park their cars near public transport hubs and continue the journey through the city’s efficient public transport system. There are also car-sharing schemes. Since 2003, in a voluntary fuel econ-omy labelling scheme, car showrooms have displayed vehicle fuel efficiency.109 These meas-ures form part of a larger urban planning and traffic control system.
Cash power — Samoa: Around 44 per cent of Samoa’s electricity comes from hydropower, and the rest from imported diesel. To encour-age customers to be aware of how much power they are using, the Electric Power Corporation has switched from monthly billing to a system called CashPower, which requires customers to recharge their meters by purchasing a top-up card from a local store. A number of customers report that this has enabled them to budget better for electricity while avoiding falling into debt. By June 2010, meters had been installed for 58 per cent of customers.110
Reducing carbon mileage — Changwon, Republic of Korea: Carbon mileage, an initiative that began in 2009, offers homes and businesses incentives for reducing their consumption of electricity and water. Participants implement tips for cutting
greenhouse gas emissions in their daily routines. Carbon mileage is calculated based on the decrease in monthly electricity and water con-sumption compared to the average for the previous two years. This is used to calculate the value of a voucher or cashback award that will be given once a year.111
Say no to packaged food — Bhutan: Children at the Early Learning Centre School in Thimphu who visited a nearby waste dump felt guilty and disgusted — and responsible. Seeing the quantity of garbage that came from packaging and plastics, the children took a pledge to be zero contributors to landfill. They agreed to eat packaged foods only on Wednesdays, send food waste to the waste pit, recycle paper waste, and recycle Wednesday’s plastic for creative purposes. This idea was shared with other schools through conferences and the media. Now 80 other schools have made the pledge to ‘Say No to Packaged Food’.112
Encouraging Behaviour Change
Fuel economy standards — China: China began implementing passenger car fuel economy standards in two phases beginning in 2005. Phase 1 fuel consumption limits resulted in an average fuel consumption decrease of about 11 per cent from 2002 to 2006. This measure also encouraged overseas producers to bring more efficient vehicle technologies into the national market.113
Pricing cleaner fuel cheaper — Bangladesh: In Bangladesh, natural gas is substantially cheaper than dirtier fuels. In Dhaka, the majority of cars, mini-buses, three wheelers and buses run on compressed natural gas (CNG). The switch to CNG was boosted through a combination of expanding filling stations, banning gasoline-fuelled auto-rickshaws and converting all government diesel buses and official vehicles to CNG. This switch has resulted in multilay-ered benefits. It has the advantage of reducing pollution and improving health as well as saving costs for consumers.114 But cheaper fuel has been accompanied by rising consumption and travel demand.115 The unintended consequences of controlled fuel pricing for end-users need to be

ASIA-PACIFIC HUMAN DEVELOPMENT REPORT84
understood. In India, diesel is priced cheaper to support agriculture and freight and to control inflation, but it can also spur consumers to opt for luxury cars that are fuel-inefficient and polluting.116 This could be avoided by separate fuel economy targets and tax policies.
Measuring Emissions by Consumption
Progress in human development expands choices, enabling people to consume more. As incomes rise in developing countries, it will be important to track greenhouse gases not just through production but also through consumption. Independent researchers can develop norms for emissions over the entire life-cycle of products and services. This will contribute to carbon-labelling initiatives and help richer consumers make greener purchase decisions.
Improving Knowledge and Awareness
Changing attitudes around consumption de-pends in part on greater awareness. Extremes of consumption are often driven by commercial interests backed by attention-grabbing advertis-ing. Consumerism does not necessarily translate into wellbeing. Advocacy by celebrities can help, but change can be particularly powerful when spearheaded by youth and children. Children are looking for small solutions in which they themselves can take action, for example, by saving electricity and water.117
One set of opinion polls suggests that, glob-ally, around 48 per cent of people are aware of the contribution of both human and natural activities to climate change.118 Within Asia, the picture is mixed: the figure varies from 83 per cent in the developed countries to 39 per cent in the developing countries. A study in Asia found that 84 per cent of consumers were prepared to pay a considerable premium, on average more than 25 per cent, for products and services clearly certified as green — much higher percentages than the companies themselves estimated.119 The survey also found that while over 40 per cent of businesses produced or traded green products, fewer than one quarter had policies or guidelines to minimise their company’s impact on the environment, or had been clearly com-municating that they had such policies.
As incomes rise, it will be important to track greenhouse gases not just through production but also through consumption
As incomes rise, it will be important to track greenhouse gases not just through production but also through consumption
Most of the businesses believed that the public would in future become more concerned about green issues, but appeared unaware of the extent of current consumer interest. Over 40 per cent of businesses thought that the sus-tainability agenda should be driven by gov-ernment regulations to which businesses could respond.
One option is to indicate carbon footprints on product labels, for products intended for both domestic consumption and export. Carbon labelling is likely to increase costs, however. The Government of India, for example, has suggested that voluntary eco-labelling in the export footwear industry could raise costs by around one-third.120 Further, in cases of products exported from developing to developed countries, the lack of eco-labelling should not become an excuse for trade restrictions that could negatively impact livelihoods, especially of the poor. In some cases, Asian producers who anticipate potential requirements from inside or outside the region may gain some advantages. By pre-emptively and voluntarily introducing such regulations, policy has a role to play in determining what is affordable by local producers and could have a greater influence over the development of such initiatives.121
Some Asian countries are already moving in this direction. The Republic of Korea has announced CooL Label (Low CO2), now sported by over 220 products including furniture, rice and electronics.122 Japan has launched a cal-culation and labelling programme, signing up producers and retailers,123 while in Thailand the government is piloting labels on products such as ceramic tiles and T-shirts.124 In order to ensure that labelling does not crowd out poorer producers, support for upgrading and the provision of training backed by finance to bridge capacity gaps is important to safeguard livelihoods and promote greater inclusion.
Another option is for companies to publish their corporate carbon footprints. This is starting to happen in Asia, though the region has some way to go to catch up with the OECD countries in this respect. One resource for assessing climate change risks is the Carbon Disclosure Project, a collaboration of 551 institutional investors through which organisations can now measure and disclose their greenhouse gas emissions and

3 FAIR AND BALANCED CONSUMPTION 85
climate change strategies.125 Institutional investors should be able to persuade more Asian companies to be responsive to climate change.126
Monitoring power consumption: Conscientious con-sumers may be aware of the emissions created during the manufacture of products, but be unaware that the bulk of emissions stem from their use. In the case of computers, for example, three times more emissions are generated in use than in manufacture.127 And for private passenger vehicles, more than 80 per cent of GHG emissions result from driving.128 Yet few consumers in the region know the climate change
implications of consumption, partly because this is a relatively new issue, but also because it is far less evident than, say, pollution.
Individuals and firms who know how much energy they are consuming are more likely to use it efficiently. New technologies now permit real-time electricity metering that provides customers with sophisticated energy price and cost information. Customers can thus respond to flexible energy pricing, making greater use of off-peak energy and consequently reducing base load capacity needs.
Building awareness of climate change and the potential for responding to it is often most
Individuals and firms who
know how much energy they are consuming are
more likely to use it efficiently
Individuals and firms who
know how much energy they are consuming are
more likely to use it efficiently
SPECIAL CONTRIBUTION
PRACTISE A GREEN LIFE, STARTING TODAY
ZHOU XUN
Like so many others around the world, global efforts to tackle climate change have had a profound impact on the way I conduct myself in my everyday life. From planting trees to pioneering green technologies, I have come to realise that the consequences of climate change affect us all, and that overcoming this global phenomenon is a responsibility that we all share. Whether through increased vulnerability to extreme climate-related weather events or some other manifestation of our planet’s changing environment, I believe that we all have an equally important role to play in restoring environmental sustainability.
Since my appointment as the National Goodwill Ambassador for the United Nations Development Programme in China in 2008, I have been able to combine my own work with that of the United Nations, en-couraging Chinese youth to become more conscious of their impact on the environment and responding to their concerns. Through an initiative called ‘Our Part’, we have formed strong working partnerships with Chinese media groups and members of the private sector in order to enhance
our ability to reach out to China’s vast youth population. In this regard, setting up an official environment website, advocating green issues published by magazines, broadcast-ing green concepts during public radio programmes, making a movie for environmental protection and supporting the launch of China’s first bilingual comic book on low-carbon lifestyles are just some of the things that we have been able to achieve with the help of our media partners. Thus, by approaching the general public through these innovative channels, ‘Our Part’ has successfully conveyed our messages of environmental living to millions.
In seeking to lead by example, I have continued to introduce low-carbon practices into my own life, carrying tableware and cups with me, using double-sided print script and wearing multi-purpose clothing, for example. Together with private-sector partners, I have also advocated for changes in attitudes towards business ethics and corporate social responsibility through the ‘Green China’ initiative, while promoting simple lifestyle changes that we can all make in order to contribute
to improving our environment. By making small modifications to the way we live, conserving water and energy, especially in cities, reducing the use of disposable tableware, using public transport, recycling waste and turning off computers after work, incredible achievements can be made.
Of course, Rome was not built in a day, but it would not have been built at all if dedicated individuals had not combined their vision, one brick at a time. Therefore, while making progress in building a greener world may take time, adopting an environmentally sustainable mindset is something that we can do today. I would therefore appeal to all of you who are reading this message to start practising green living and to start today.
Zhou Xun is a well-known Chinese actress and has acted in films such as The Message (Feng Sheng) and Perhaps Love (Ru Guo Ai). An advocate of adopting greener choices in everyday life, she is also UNDP National Goodwill Ambassador for environmental awareness.

ASIA-PACIFIC HUMAN DEVELOPMENT REPORT86
effective when it starts with everyday issues such as minimising waste, pollution or low-quality fuel — since no one likes unclean water or polluted air. Governments, civil society and businesses can all be involved. The following are some examples.
Promoting the 3Rs — Viet Nam: A green youth movement is showing how youth can be catalysts for change. The youth volunteer group ‘3R’ promotes the principles of ‘Reduce, Reuse and Recycle’. The group encourages young people to come, have fun and learn about the environ-ment, and at the same time exchange materials to reuse or recycle.129
Superhero to the rescue — Singapore: Using the slogan ‘Everyday Superhero’, the Climate Change Awareness Programme explains to house-holds and motorists the basic principles of responding to climate change, and shows how they can all become superheroes through pain-less habits that save energy and money and reduce GHG emissions. Launched in 2006, the programme is spearheaded by the Singapore Environment Council and supported by the National Environment Agency, Climate Change Organisation and the Shell Oil Company.130
Aiming for a cooler city — Bangkok, Thailand: Since 2007, the Bangkok Metropolitan Authority has organised events on the ninth day of each month to raise awareness and find ways of reducing the
city’s greenhouse gas emissions. There is also a campaign to encourage the use of energy-saving compact fluorescent bulbs: a pilot action in one marketplace replaced 1,100 light bulbs. This is to be repeated in 192 other marketplaces and is expected to save 8,000 tonnes of CO2 emissions annually. Another campaign is ‘Stopping Engines While Parked’ — to encourage drivers to turn off their engines when stopped at traffic lights or elsewhere. If 5.5 million drivers in Bangkok turned off their engines for five minutes each day, CO2 emissions would be reduced by 260,975 tonnes annually.131
TAKING A DIFFERENT PATH
If they are to accelerate human development, developing countries across Asia-Pacific will need to ensure that their poorest citizens can access more and better goods and services, especially reliable access to modern and cleaner energy services. They will thus inevitably in-crease emissions of CO2. But the region does not have automatically to follow the same path as the developed countries. Many countries are already extending services to the poor while pioneering a new age of lower-carbon production and consumption to meet the needs of the growing number of middle-class and wealthy consumers. With national policies and international cooperation, these trends can be strengthened. The next chapter looks in greater detail at the region’s neglected rural areas.
The region does not have to follow the same path as developed countries; many countries are already pioneering a new age of lower-carbon production and consumption
The region does not have to follow the same path as developed countries; many countries are already pioneering a new age of lower-carbon production and consumption

3 FAIR AND BALANCED CONSUMPTION 87
The Asia-Pacific region is a production hub for the world, and is poised to become a region of major consumers with an expanding middle class. While millions have been lifted out of poverty, the remaining poor and the pockets of emerging deprivation need urgent policy attention. Action is needed on a number of fronts:
Improve the prospects of the poor: Choose carefully between grid extension or off-grid access, and expand renewable and clean energy options to ensure reliable energy access, focusing on deprived households Promote efficient technologies such as improved cooking stoves for domestic use and home-based production to minimise household emissions Identify and scale up successful community-driven models of solar and biogas energy use Establish a participatory system of ‘poverty checks’ on each GHG-reducing action in any sector to avoid negative impacts on energy access for the poor.
Increase consumer awareness: Increase the visibility of the health benefits of resource-efficient lifestyles Survey and regularly assess consumer awareness internationally, nationally and locally Craft and implement standardised protocols for carbon labelling and for measuring emissions across the entire life-cycle of products and services from conception to final consumption Encourage the private sector to voluntarily disclose emissions Organise fora to allow greater voice for youth and children
Promote energy-efficient lifestyles: Maximise the use of energy-efficient products and services in households Minimise waste generation by using less packaging and processing, and reusing materials Increase awareness of energy hot-spots in using utilities and transportation Invest in energy-efficient mass rapid transport systems Put into place fiscal incentives encouraging energy-efficient behaviour Provide a mix of incentives and taxes to regulate demand for high-consumption consumer durables Encourage public–private partnerships for energy generation from waste.
ACTIONS AT A GLANCE


RAISING RURAL RESILIENCE
4

Dragonfly flies high, sunny sky,flies low, rain.Flies neither high nor low, cloudy sky.
Lyrics of a Vietnamese folk song used intraditional weather forecasting

4 RAISING RURAL RESILIENCE 91
RAISING RURAL RESILIENCE
In Asia and the Pacific, around 60 per cent of people,1 and three-quarters of the extreme poor, live in rural areas (Figure 4.1). Some countries have made greater progress in reduc-ing rural poverty, but, overall, the urban–rural development gap remains wide.2 Rural poverty rates are often twice as high as in urban areas,3 and poor standards of social services leave households highly sensitive to shocks. As a result, more and more people feel they have no choice but to move from rural to urban areas seeking better economic opportunities and security.
Rural people are exposed to a wide range of climate change impacts — from flash floods in mountain areas, to droughts across vast Asian drylands, to sea-level rises in the delta regions and the Pacific Islands. These changes will have far-reaching consequences. The increased rate of glacial melting, for example, not only threatens mountain dwellers in Nepal, but raises the prospect of water scarcity for millions living along South Asian rivers and the threat of sea-level rise for communities in the delta basin of Bangladesh.4 Climatic stress could under-mine development and food security — most food emergencies in Asia are already sparked by droughts or floods.5
Many governments have yet to build climate resilience into rural development and poverty reduction programmes.6 This represents an opportunity. Initiatives that build resilience can help refocus attention on rural poverty while introducing new thinking, technologies and finance options that can increase productivity and employment-rich growth, fostering better management of natural resources.
RURAL VULNERABILITY TO CLIMATE CHANGE
Rural communities are often at the periphery of society, geographically, politically and economically. Geographically, they often live in remote and isolated areas on ecologically fragile land — mountains, coastal areas, small islands and drylands — which increases their exposure and vulnerability to climatic events. Politically, they may be isolated from the national centres of decision-making power, thus losing out on investments in basic public and social services that could help them deal with these problems. Socially, rural communities, like those in cities, are seldom homogeneous or egalitarian. Despite the
‘When the chickens come down from the trees to roost on the ground, we know that a big storm is coming.’
— Proverb, Micronesia
Climate change will have enduring effects in rural areas, where people have some of the most climate-sensitive livelihoods. Rural communities, home to the majority of Asia-Pacific’s poor and vulnerable people, have long experience of coping with climate variability. But future disruptions are likely to be less predictable and more severe, requiring planned climate adaptation as an essential component of rural development.
FIGURE ALMOST THREE QUARTERS OF THE EXTREME POOR IN ASIA AND THE PACIFIC LIVE IN RURAL AREAS4.1
Rural People as a Percentage of Total Poor (Living on Less than US$1.25 per Day)
Source: IFAD 2010.Note: Figures based on data available closest to the indicated year.
4
Rural poverty rates are often
twice as high as in urban areas

ASIA-PACIFIC HUMAN DEVELOPMENT REPORT92
high importance of natural resources for the poorest, the more powerful and richer house-holds draw disproportionately more benefits while the costs from the destruction of natural resources are borne mainly by the poor.7 All these factors contribute to pervasive poverty in rural areas and the reliance of the poorest on climate-sensitive and fragile ecosystems for their livelihoods.
Reliance on Natural Resources
The majority of rural people depend upon liveli-hoods that are climate-sensitive — agriculture and other natural resource–based activities — where even a slight change in temperature or precipitation can have devastating effects. Subsistence farming, fishing, rearing animals and gathering forest produce, for example, are all activities directly susceptible to climate impacts. More than half the region’s economically active population and their dependents — amounting to 2.2 billion people — work in agriculture, fishery or forestry.8 Surrounding ecosystems provide fuel, fodder, food, fibre, water, medicines and cultural services for millions of the poor.9 Forest resources, for example, contribute almost one-fifth of the income of poor rural households and serve as safety nets in periods of shortfall and crisis.10 Rural communities especially at risk from climate change live in fragile ecosystems such as the Himalayas, arid and semi-arid areas in South-West Asia or small, low-lying Pacific Islands.11
Asia-Pacific’s agriculture already faces many problems relating to sustainability. Land use changes, decreased access to natural resources, the conversion of natural ecosystems into crop-lands, shrinking grazing lands and the long-term use of extractive farming practices have degraded ecosystems and depleted the organic carbon in the soil.12 In Mongolia, for example, the increased number of cashmere goats has degraded graz-ing pasture.13 In India, farmers have pumped more water out of the ground than nature can recharge.14 Fisheries are under pressure too — as in the Lower Mekong Basin — from overfish-ing, habitat change and deterioration in water quality, quantity and flow.15 While most farm-ers in Asia and the Pacific are small-holder subsistence farmers, many now work alongside
large-scale commercial monocropping (for example, rubber in Cambodia or palm oil in Indonesia), as investors respond to the demand for food and other cash crops.16 In some cases, this has reduced the land available to small farmers and diminished the long-term viability of land for agriculture. Intensive agriculture is also destroying certain species such as weeds that do not provide immediate cash value, but contribute to biodiversity. In peri-urban areas, land and other resources are also being diverted to construction or industry. In Mongolia, rural consumers pay 84 times more for clean water than industries and mining companies.17 These and other changes are weakening rural ecosystems and poor people’s opportunities to adapt to climate change.
Some farmers have benefited from diversify-ing their sources of income through non-farm activities or remittances.18 While this may make some more resilient, other local farming and fishing communities have lost out as a result of the expansion of commercial agriculture or the extension of industrial zones into rural areas.19
Wealthier individuals in rural communities such as landlords or local business leaders might be able to cope by selling off assets, drawing on their savings or private insurance or accessing government support more easily. The disadvantaged, however, may have no alter-native but to eat less or poorer food, take children out of school, sell their livelihood assets, work longer hours or migrate in distress — all of which increase their vulnerability and reduce their capacity to escape from poverty.20
Little Help
Rural communities get relatively little support in terms of public funds or services for climate-resilient development. In larger archipelagic countries, for example, national governments are seldom able to reach out to the poorest rural communities and remote islands. In the Pacific, peripheral communities on outer islands rarely receive visits from official personnel and are generally unaware of government policies on climate change.21
The neglect of rural populations curtails options for pursuing more climate-resilient livelihood opportunities. Due to lack of access
The majority of rural people depend upon livelihoods that are climate-sensitive

4 RAISING RURAL RESILIENCE 93
to finance and technical support, many small-holders, for example, consider it risky or even downright unprofitable to participate in high-value agricultural markets and rural enterprises.22 Remoter localities are more likely to have im-perfect or missing markets than those closer to urban centres, often due to a lack of connectivity such as all-weather roads, bridges and ferries.23 In some South Asian countries, a majority of the rural population — 63 per cent in Bangladesh and 83 per cent in Nepal — do not have easy access to such roads.24
Rural people are likely to be deprived of other basic services, such as quality health care and education, reducing their ability to cope with additional shocks from climate change. Rural
access to improved water and basic sanitation still lags behind urban areas (Figure 4.2), increasing the risk of water- and food-borne diseases that can be aggravated by climate-induced floods and droughts. Water scarcity may also result in increasing the cost of water and sanitation provisions. Under-five mortality rates in rural areas can be up to 50 per cent higher than in urban areas,25 a clear sign of the inability of rural health systems to deal with current health risks, let alone increased stresses.26
Another problem is poor electricity supplies. In developing Asia, 73 per cent of the rural popu-lation has access to electricity.27 However, poor-quality electricity or no electricity at all makes it difficult to engage in even simple, off-farm
FIGURELACK OF ACCESS TO BASIC SERVICES IN RURAL AREAS INCREASES PEOPLE’S VULNERABILITY4.2
Access to Water and Sanitation in Rural vs Urban Areas, Percentage of Population, 2008
Source: Based on United Nations 2011a.

ASIA-PACIFIC HUMAN DEVELOPMENT REPORT94
work like grinding mills, packaging services, handicrafts, petty shops and repair services that can help people diversify their livelihoods. It also hampers communication and the ability to get timely information or access to technologies for risk reduction and adaptation.28
Poorer rural areas, particularly in remote regions, often have inadequate housing, weak or non-existent emergency services and infra-structure, and little social protection.29 They are also less likely to be informed of impending risks and disasters, and are mostly left to cope on their own as best they can. This is partly because local governments lack the technical, financial and human resources for mapping and monitoring local risks and developing appropriate plans for rescue, recovery or reconstruction.30 Although rural areas are exposed regularly to climatic dis-asters, such events tend to go unreported and unsupported when effects are localised. Ultim-ately, these thousands of smaller or dispersed events can cumulatively affect much larger numbers of people than the ‘headline’ disasters in urban areas.31 One study across 12 countries found that 34 per cent of the economic cost of disasters in the housing sector was associated with such low-intensity loss reports, as well as 57 per cent of the damage to schools, 65 per cent of the damage to hospitals and 89 per cent of the damage to roads.32
The fact that people who face multiple inequal-ities, particularly the poor in rural communities, are likely to be the most vulnerable to climate change, highlights the need to address multiple underlying human development challenges. This will be an important path towards local resilience.33
Linking Autonomous with Planned Adaptation
Adaptation is not new. Rural communities and indigenous peoples and tribes have long adapted their lifestyles and livelihoods to the local envir-onment, and have modified these as circum-stances evolved. They may have little access to information on climate science, and tend to react to immediate problems rather than anticipating future changes. Nevertheless, they have a broad array of strategies for coping with climate vari-ability; some have evolved over generations and centuries, others have been developed only recently in response to new climatic stresses.34
Insights into such responses to historical cli-matic variability can be gleaned from indigenous peoples and tribes across Asia and the Pacific. For example, the Tingguians in Abra province in the northern Philippines practise a custom called lapat, which regulates the cutting of trees, hunting of animals and even fishing in rivers to preserve biodiversity and conserve forests.35
The diversity defence — India: In north-west India, farmers use the mandua mixed cropping sys-tem, which comprises 12 complementary crops, some of which are climbers and some ground plants. This approach helps farmers diversify risk and cover themselves against storm or insect damage. Mandua cultivation used to be seen as producing ‘poor man’s food’, and declined somewhat following the green revolution and the introduction of hybrid seeds for wheat and rice. But some of these new crops were not sufficiently hardy to cope with erratic rainfall, and farmers started to return to the traditional system. Some mandua crops are now in high demand in urban areas, and farmers can receive premium prices for traditional, organically grown mountain produce.36
Protecting livestock pasture — Mongolia: Faced with a difficult and variable climate, the nomadic herders of Mongolia developed ways of combating pasture degradation and desertification. These included seasonal migration, long-distance migration, herding different kinds of livestock and observ-ing communal practices for the sustainable use of common pasture grounds.37 Over the last two decades, some of these traditional practices deteriorated, but they are now being re-examined as part of the country’s adaptation strategy.38
Dealing with runoff — Nepal: Hill farmers have devised a systematic way of managing runoff from the ridge to the valley, with drainage channels and ponds built at strategic points to hold, divert and delay the flow of runoff. Such techniques help to reduce rainwater-induced damage during the monsoon, such as erosion and landslides, and to build water reserves for the dry season.39
Coping with floods — Bangladesh: Delta farmers adjust the timing and the varieties of rice that
Rural communities and indigenous peoples and tribes have long adapted their lifestyles and livelihoods to the local environment

4 RAISING RURAL RESILIENCE 95
they plant according to the water cycle. Integrated agriculture–aquaculture systems balance agri-culture and fisheries through sluice gates in floodplains. This can increase the availability of food and harvests and promote community cooperation in the management of the sluice gates. Another method of cultivation, particularly in waterlogged areas, is hydroponics — growing vegetables in floating gardens.40
Increasingly, local communities are having to make larger adjustments to their livelihoods in the face of growing climate risks. In response to changing weather patterns in Malaysia, the Jagoi of Sarawak are diversifying their food sources; they are planting several varieties of rice, fruit trees and other climate-resilient crops such as tapioca.41 The Kenyahs of Borneo are planting crops like maize in drying riverbeds in response to prolonged drought.42
The knowledge and practices of indigenous peoples, tribes and local communities can serve as the starting point for longer-term planned adaptation — an approach that can be more effective than introducing completely new prac-tices that might force poor people into high-risk transitions.43 This is also very important for the ownership of sustainable development. In some countries, indigenous forest and land man-agement skills have already been integrated into agroforestry extension programmes, among, for instance, the Karen and Lua in Thailand, the Tai Lue in Lao People’s Democratic Republic and the Hani in China.44 Indigenous peoples and tribal communities continue to build their resilience by sharing skills, documenting practices and increas-ing their understanding of climate change.45 In Malaysia, since younger generations might move away or lose interest, indigenous groups are taking steps to record their knowledge of forest management practices before it is lost.46
Nevertheless, modern climate change impacts may be more extreme, rapid or different, and beyond the coping capacity of local communities. Asia-Pacific countries may need to engage in more proactive, planned adaptation to reduce people’s exposure and build their capacity to adapt by being able to diversify their sources of livelihood, obtain improved access to social services and protection, and effectively manage disasters.47 Where the risks are extreme, people
may have to relocate out of harm’s way. This can be actively supported by building the capabilities of vulnerable groups to seek new opportunities as well as by facilitating open dialogues between sending and receiving administrations.
Most adaptation measures can yield broader development benefits, and can be looked at in terms of both present and future gains. Better water management can aid the livelihoods of farmers and the wellbeing of rural households. Providing better off-grid electricity through solar power would improve the resilience of rural house-holds and set them on a cleaner development path. Other potential benefits could come from rewarding rural communities for sequestering carbon and providing other ecosystem services.
In some countries, planned adaptation is already under way, based on national processes like the National Adaptation Programmes of Action (NAPAs), regional disaster management and adaptation roadmaps, as well as countries’ national strategies, policies and action plans.48 These have concentrated largely on assessing the potential impacts and risks of climate change at a national level and on mapping out priority projects.49 Projects address the additional costs associated with climate change affecting key development concerns such as food security, water management and poverty reduction. While some aim to improve the understanding of the social and institutional context of climate adaptation, most high-priority recommendations focus on improving physical infrastructure.50 There has been little attention to supporting local institutions and addressing local govern-ance issues in the NAPAs, despite the critical importance of rural institutions in shaping adaptive responses to climate change.51
RESILIENT LIVELIHOODS
In the face of climate change, national attention needs to refocus on rural areas. While some rural residents will want to migrate to cities, others should be able to realise their aspirations in their home communities. Raising rural resilience is of wide importance: as part of national poverty reduction and equality goals, and in managing urbanisation pressures, securing national food and energy security, and maintaining ecosys-tem services that are crucial for the region and
In the face of climate change,
national attention needs to refocus on
rural areas

ASIA-PACIFIC HUMAN DEVELOPMENT REPORT96
beyond. For this, rural communities will need better markets and economic opportunities that are climate-resilient as well as social ser-vices and infrastructure that meet local needs.52 This is likely to require not a sudden revolu-tion, but ongoing changes that empower rural communities to make better decisions by themselves, and that facilitate private initiatives and individual gain while rewarding social cooperation. A broader process of change will be required to move from subsistence to more modern farm practices and to more diversified livelihoods so that people are better able to absorb shocks.
Climate-Robust Farm Practices
Given the importance of agriculture for rural livelihoods and food security in the region, special emphasis will need to be placed on making agriculture more productive and sustainable, and increasing its ability to absorb risks and shocks. Climate change is expected to affect agriculture and natural resources through its impact on water availability, land and crop productivity, pests and disease, and the distri-bution and productivity of rangelands, fisheries and other ecosystems.53 Water, land, forests, fisheries and biodiversity will need to be man-aged more efficiently while avoiding damage to already-stressed ecosystems through overuse, pollution or encroachment.54 In some cases land tenure issues underpin the question of efficient management of natural resources, because if tenure is in doubt, there is little incentive to invest in the land. Some agricultural adaptation strategies include the following.
Changing Cropping Patterns and Land Use
Changing crop rotations and variation, or mix-ing crops with livestock and fish breeding, can diversify the risk that changes in climate might entail for one crop but not for others. Much can also be done in the way land is used and crops are planted, for example, by developing agroforestry systems or using vegetative buffer strips.55 Many of these techniques benefit both adaptation and mitigation. For example, zero-tillage can help preserve soil moisture, maximise water infiltration and minimise nutrient runoff, while increasing carbon storage.56
Planting Resilient Crops
This will require planting crops that can better withstand drought, cold or salinity. If these crops are based on biotechnology, however, they need to be introduced carefully and in close cooperation with local farmers so as to pro-tect ecosystems and the safety of food. A better alternative might be to preserve traditional varieties that are suitable for different soil types, topographies, temperatures and water avail-ability. In Jharkhand in India, for example, community-run seed banks preserve around 2,000 traditional rice lines.57
Improving Water Management
In areas with too little water, farmers can intro-duce more efficient drip irrigation, water har-vesting, soil moisture conservation techniques and other water capture and storage practices, including better management of surrounding ecosystems, forests and wetlands.58 In East Asia, expected rise in surface air temperature would increase water demand for agricultural irriga-tion by 6–10 per cent.59 There is still potential to expand and improve irrigation systems, especially in South-East Asia (Figure 4.3). For rice paddies, intermittent drying of the rice fields instead of continuous flooding — a method referred to as ‘alternate wet/dry irrigation’ — could be an effective adaptation measure.60 Where there is too much water, flooding can be addressed through embankments, dykes and dams as well as through forest afforestation, coastal mangrove reforesta-tion and better watershed and land use planning. In river deltas, water management often entails a fine balance, as the sediment from flooding can be very beneficial for agriculture. This will require a more integrated and regional approach.
Managing Fisheries and Aquaculture
Adaptation can be based on current methods for sustainable fishing from natural systems, including fishery zoning, protection of natural spawning grounds, management and monitoring of fish stocks, restoring coral reefs and mangrove forests, and protecting marine areas and river basins.61 An alternative is aquaculture, which needs to be carefully planned to avoid damage to ecosystems, and will itself need to adapt to the potential of rising seas and more frequent
Rural communities will need better markets and economic opportunities that are climate-resilient

4 RAISING RURAL RESILIENCE 97
and violent storms.62 There is also considerable concern currently about the potential impacts on fisheries from proposed hydropower dams in the region, requiring improvements in the capacity to integrate environmental standards into planning at national and regional levels.63
Taking Care of Livestock Systems
Traditionally, some nomad herder commun-ities have been very effective in managing their pastures in sustainable ways. But population growth, land scarcities and larger herd sizes have led to overgrazing. Along with climate change, this has resulted in the degradation of drylands. When this happens, pasture loses its carrying capacity and its ability to sequester and store carbon.64 Pastoral communities need to return to more sustainable grassland management such as rotational grazing, regulating the utilisation of common pastoral areas, planting forage plants and pasture production improvements. This should be supported by providing better services to pastoralists, measures to control the numbers of livestock, or modernising animal husbandry.65 In the desertified rangelands of Hosseinabad in the Islamic Republic of Iran, community development groups have successfully rehabili-tated 12,160 hectares of degraded grazing land by planting drought-resistant grasses and shrubs, improving participatory land and water man-agement techniques, starting micro-enterprises and introducing alternative energy sources that have greatly reduced the demand for fuelwood.66
Diversifying Opportunities
Diversification of on- and off-farm income sources is necessary for increasing resilience and reducing poverty in rural areas. Agricul-ture in Asia is characterised by small-holder cultivation practised mainly for subsistence; these communities are highly vulnerable to climate change. About 81 per cent of farms in India have landholdings of less than 2 hectares; in China, Nepal and Bangladesh, such small-holdings constitute over 90 per cent of the farms. Due to the fact that Pakistan has a relatively high concentration of large landholdings, 58 per cent of farms are smaller than 2 hectares.67 In addition, millions of landless rural households depend on agricultural wage employment — 82 million in
India alone.68 These poor farmers and labourers usually do not have the resources to take the risk of diversifying to higher-value crops or investing in new livelihoods that are less dependent on climate and natural resources.
Small-holder farmers trying to diversify their production to higher-value commodities might require greater capital inputs or mechanisation, for which they will need better access to services, credit and marketing facilities and insurance.69 Increased productivity of secondary crops, such as millet, cassava and other root crops, would require technology development, which has so far been limited in Asian countries.70 Government research and extension services can introduce technologies and cropping systems that in-crease productivity, mitigate emissions and are more adaptable to climate pressures.
Diversifying sources of income from rural non-farm economies — both wage employment and self-employment — is increasingly import-ant for large numbers of rural households.71 Traditionally, they have diversified their in-comes by cultivating household vegetable gardens, rearing a few livestock, setting up small businesses and migrating seasonally to urban centres. Income from remittances sent by migrants often increases the land, livestock and human capital base of rural household members who stay behind.72 Several countries
FIGURE THERE IS POTENTIAL TO EXPAND IRRIGATION TO INCREASE AGRICULTURAL RESILIENCE TO CLIMATE CHANGE4.3
Share of Irrigated Land in Arable Land and Permanent Crops in South-East Asia, Per Cent
Source: FAO 2010f.Note: For consistency, all fi gures are from FAO 2010f, which might differ from the
government fi gures of some countries. For example, the share of irrigated land in arable land in Cambodia in 2005 has been estimated to be substantially higher, at 18 per cent, by the Government of Cambodia (MAFF and MOWRAM 2009).
Agriculture in Asia is
characterised by small-holder
cultivation; these communities are
highly vulnerable to climate change

ASIA-PACIFIC HUMAN DEVELOPMENT REPORT98
now have substantial shares of non-agricultural income in rural areas. Non-agricultural income accounts for 57 per cent of rural income in Indonesia and Viet Nam.73 Further stimulation of the rural non-farm economy can come from the growing integration of rural and urban economies, investment in decentralisation and the growth of small- or medium-sized centres, new employment and service opportunities from the global economy, and improved energy, communication and information systems (particularly mobile phone coverage). Rural communities may look to opportunities in rural industries, handicrafts or, in some areas, eco-tourism, provided that these protect climate-sensitive ecosystems. Island communities might want to scale up ‘diving ecotourism’, for example, but this should go hand in hand with the improved protection of coral reef resources that will be affected by climate change.74
Improved education and skills development are particularly important for strengthening the capabilities of rural people to take advantage of these and other opportunities.75 Special atten-tion should be focused on gender equity, with evidence suggesting that climate change affects women and men differently, and that the needed adaptation skills also differ among genders.76 Women continue to be more dependent on agriculture than men, who have shifted in larger proportions to non-farm jobs.77 While gender gaps in primary education are beginning to close, women tend to receive less further education and vocational skills training, especially in South Asia, which prevents them from pursuing livelihoods less dependent on natural resources.78 Women are also less likely than men to be reached by extension services that increase the resilience of agricultural livelihoods. In Cambodia, for example, women make up only 10 per cent of the beneficiaries of extension services, even though rural women are responsible for 80 per cent of food production, and more than 65 per cent of women are farmers.79 In Viet Nam, less than one-fourth of the participants in agricultural training programmes were women.80 These discrepancies can be due to distance and poor transport facilities, the need for an overnight stay in order to participate in these programmes, the competing demands of unpaid domestic work, or patriarchal social norms.
Governments will need to take specific actions to include women in climate change adaptation programmes for more resilient livelihoods. This could include providing stipends, safe transport and accommodation, and arranging schedules that take into account women’s responsibil-ities in household work or seasonal agricultural labour. It is also important to have more women as trainers and extension workers. Men and community leaders will need to be trained in gender issues to support the active engagement of women.81
In general, the latest climate science and adap-tation technology needs to be linked with exten-sion services, which can transfer knowledge and technology to bolster adaptive capacities.82 Developing the collective capabilities of farm-ers’ cooperatives, rural labourers and small entrepreneurs, can facilitate their organisation and access to services, and also promote decent work standards.83
Farmer field schools — Indonesia and Bangladesh: In Indonesia, Climate Field Schools have been set up to help farmers make use of better climate information, such as seasonal weather forecasts, when designing crop management strategies. Learning materials are developed together with the farmers based on their experience.84 Similarly, in Bangladesh, a pilot project in drought-prone areas aims to link the scientific community with farmers’ associations to provide ‘long-lead climate forecasts’ and a menu of different adap-tation options that fit the specific locations and social settings of vulnerable groups. Farmers’ associations work with local technical working groups to test these options and disseminate the learning through their networks.85
Training for economic empowerment: Community-based training programmes, such as those for rural economic empowerment, help identify local opportunities and provide training and credit for self-employment. In Bangladesh, a project encouraged women to enter non-traditional trades such as the repair of appliances and computers. In rural Pakistan, where social norms restricted women’s participation in training outside their homes, female trainers visited rural women at home. This has increased the income of trainees by more than 90 per cent
Special attention should be focused on gender equity, with evidence suggesting that climate change affects women and men differently, and adaptation skills also differ among genders

4 RAISING RURAL RESILIENCE 99
and has bolstered socio-economic empowerment and resilience.86
Expanding Enabling Services
Strategies for rural livelihood resilience need to be supported by appropriate institutions, climate-proofed infrastructure and more effective social services. Access to better education, for example, enables rural workers to find more climate-resilient and higher-paying non-farm employ-ment.87 Some remote areas can make greater use of information and communication technology; the community centres for e-learning in Thailand are an example.88 Advances in telemedicine can help address projected higher health risks from malaria in mountain areas or from dengue fever in the Pacific.89
Many communities lack decent infrastruc-ture. For example, traders in Nepal prefer to import apples from India at three times the price of local apples, because roads to the local farmers are regularly inaccessible due to rainfall damages.90 In Viet Nam, it has been estimated that improvements in rural infrastructure and education could increase agricultural produc-tivity and compensate for lower rice yields expected from rising temperatures.91 Better local processing and storage facilities for agricultural produce will be important as well.92
Most governments have appropriate legis-lation and administrative systems in place to ensure that infrastructure can resist typical weather-related events.93 In rural and remote areas, however, such standards are often deemed less important or too expensive.94 Yet, many adaptation options qualify as ‘no regrets’ initi-atives. Making small climate-proofing invest-ments at the infrastructure design stage can reduce long-term maintenance costs. Invest-ments that already pay off under current con-ditions will bring even higher returns in the event of climate change.95
Sometimes it is less about applying high-tech systems, and more about finding innovative, locally specific solutions. For example, high in the Himalayan mountains, Nepali communities are obtaining drinking water by catching the moisture of the morning fog,96 and in northern India a local engineer is helping farmers build small artificial glaciers in the shadows of the
Ladakh mountains to improve water availability for planting.97
A road more travelled — Lao People’s Democratic Republic: Improved all-weather roads have enabled local people to access newly built mar-kets on the Thai–Lao border, where traders buy produce in bulk. Farmers have not only explored new opportunities, but have also acquired new skills in basic market economics and techniques to negotiate with faraway buyers using mobile text messaging.98
Adaptation capacity for sub-national institutions — Cambodia: An estimated 81 per cent of culti-vated land in Cambodia is not irrigated.99 As part of the National Adaptation Programme of Action to Climate Change, the Ministry of Agriculture, Forestry and Fisheries (MAFF) and the Ministry of Water Resources and Meteorology (MOWRAM) have started a pro-ject to increase the capacity of key sub-national institutions and local communities in two provinces to consider climate change in their planning, improve water-harvesting techniques and adaptation mechanisms, and capture les-sons learned for scaling up at the policy level. By diversifying the sources of water used in agriculture, sanitation and consumption, the project seeks to improve overall access to and quality of rural water supply.100
Maintaining basic water services — India: In the Godavari river basin in India, lack of governance of water systems and unequal access has led to increased water stress for the poorest households. A pilot project is restoring 1,200-year-old village water tanks — modest earthen dams. At a cost of US$103,000 in cash and kind, the project has revived 12 tanks serving 42,000 people in the river basin of the Maner, a tributary of the Godavari, increasing agricultural production and profitability. Village committees were estab-lished to maintain the tanks and manage water use. Following the success of this project, the state government has taken it over and started a tank de-silting programme. It has been estimated that de-silting all village water tanks in the Maner river catchment, at a cost of US$635 million, would increase water storage capacity by an amount similar to that achieved by the proposed
Sometimes it is less about
applying high-tech systems, and more
about finding innovative, locally
specific solutions

ASIA-PACIFIC HUMAN DEVELOPMENT REPORT100
construction of the four-billion-dollar Polavaram dam on the Godavari.101
Engaging the Private Sector in Rural Markets
It is not just government that provides a sup-portive environment for people to lead climate-resilient rural lives. Innovation for change can come from many non-state actors, including businesses and civil society. Private enterprises have responded to climate change primarily through mitigation — improving the use and efficiency of energy and adopting low-carbon technologies. But private enterprises can also help increase the resilience of rural livelihoods. Food companies with supply chains across the region could, for example, help cooperatives of small-holders get the irrigation and other technologies they need for adapting to less reliable rainfall.102 They could also devise finance and climate adap-tation insurance products for the poor and help develop tools for risk management, scenario planning and disaster preparedness.
Financial institutions can provide more appro-priate credit, savings and insurance products for rural customers. Some insurance companies, for example, have been offering inexpensive housing insurance linked with risk reduction measures, such as retrofitting housing for flood management. In Bangladesh, a major micro-finance institute has been giving out credit for building houses in combination with funding for flood prevention measures.103
Mobile communications for small farmers — India: A fertiliser company in India is using mobile communications technology to disseminate expert agricultural knowledge to small-scale farmers. The new business, launched in 2007, is a joint venture between one of India’s largest retailers of agricultural inputs and a private telecom provider. Farmers get access to five daily messages in their local languages on a wide range of subjects, including agricultural market prices, the availability of fertilisers, electricity timings, weather forecasts and disaster warn-ings, as well as information on financial services and government schemes. The information is provided by a large network of partners, including agricultural extension workers, state and national research institutes and universities.104 This has
helped the telecom provider to expand into the rural market, accounting for one-sixth of its new subscriptions every month and reaching 10 million users by April 2011.105
New fishery techniques — The Philippines: In Saravia in the Philippines, the local crab population was falling, partly because of warming waters resulting from climate change. A local blue crab processing company has responded by requiring suppliers to use a sustainable method for catching crabs in baskets, as opposed to gill nets that damage crabs, wasting part of the catch. This new method, which has increased local incomes along the supply chain, also allows crab fishermen to make catches in the rougher weather envisaged in the future.106
Index insurance — India and Mongolia: Traditional crop insurance is typically expensive to admin-ister due to the cost of assessing crop damages, and therefore not commercially viable in most rural settings. By contrast, ‘index-based’ insurance uses the strong correlation between crop yields and weather parameters like rainfall levels to trigger automatic payments to policy holders. In India, a major insurance company and a local micro-finance institution formed a partnership in 2003 to pilot the first rainfall index insurance scheme for small farmers in Andhra Pradesh. Starting with a pilot of 230 participants, it quickly graduated to 3.5 million policies sold across India in 2007–08, and has sparked much broader interest in index-based insurance elsewhere.107 In Mongolia, a commercial insurance scheme for herders helps them manage the risk arising from severe cold episodes (dzuds) that periodically result in widespread livestock deaths. To make the provision of insurance viable, catastrophic events that would overwhelm the commercial insurer are addressed through a public–private partnership.108
PREPARING FOR GREATER RISKS
Climate change will exacerbate existing risks, and create new ones such as sea-level rise or floods from glacier lake outburst.109 Climate change can even increase the threat of non-climatic disasters: for example, greater sea-level erosion induced by climate change can increase the
Innovation for change can come from many non-state actors, including business and civil society

4 RAISING RURAL RESILIENCE 101
exposure of coastal communities to tsunamis.110 Community-based disaster risk management programmes are thus an important entry point for climate change adaptation, bringing a broad spectrum of immediate benefits to disaster-prone communities.
First Response
Rural communities usually have to be the first responders to disasters, as external support can be slow to arrive. To be able to respond more effectively, they will need better community-based vulnerability and risk assessment and planning.111 Many countries have started early-warning systems, but have often failed to com-municate warnings effectively to the local level. Bangladesh has shown what can be achieved through an extensive cyclone early-warning system that links national warning centres with village volunteers who organise evacuation to cyclone shelters.112 Over time, the country’s ability to manage disaster risks, in particular floods and cyclones, has evolved and proven very effective, especially since the 1991 cyclone that claimed nearly 140,000 lives.113
Better disaster risk reduction is needed to protect lives and assets. The rural poor often live in sub-standard housing built without proper engineering in dangerous locations — on floodplains, river banks or steep slopes.114 Some traditional houses with earth walls and thatched roofs might be especially vulnerable to damage from flooding and high winds, but traditional wood houses built on stilts might have advantages over ground-level concrete houses. In rural areas, where structures are smaller and meagre, better construction standards can often be achieved through simple and cost-effective changes in design or retrofitting. Training and guidelines for house owners and local masons on simple structural and non-structural risk reduction practices have been developed in the region, but need to be promoted more effectively for wider application by rural households.115 Secure landownership rights and micro-finance can provide incentives to poor households to invest in risk reduction.116 Better risk assessments and land use planning can minimise new settlements in high-risk locations.
Addressing New Risks
As temperatures rise, new risks may emerge and escalate. For example, as glaciers melt more quickly and lead to the formation of supra-glacial lakes, they can overflow, inundating surround-ing lands. Communities in the Himalayas now face the threat of these floods.117 Other com-munities may face threats from sea-level rise, floods or desertification. Small-scale structures, better long-term land use planning and disaster preparedness will be needed.
Taking charge of new high risks — Bhutan: Physical works to lower the water level of one glacier lake was undertaken to reduce pressure on the moraine dam. This was accompanied by the establishment of high-risk zones and early warning systems using automatic sensors, sirens and mobile phone alerts, along with disaster management training for local committees. Eventually, all these activities will be integrated into local development plans and programmes. A government circular already restricts new construction in high-risk zones.118
Safety Nets
Many countries in Asia-Pacific have social protection initiatives, though these vary in coverage; 43 per cent of the poor do not come under any form of social protection.119 As part of broader risk management policies, vulner-able rural households must have easy access to options like emergency cash grants, paid work, small savings products and micro insurance that can provide assured relief in emergencies.120 Current social protection programmes can be designed not only to provide a buffer in times of crisis but also to contribute to risk reduction and planned adaptation.
Linking employment guarantees with adaptation — India: The Mahatma Gandhi National Rural Employment Guarantee Scheme is aimed pri-marily at reducing rural poverty, but the public works undertaken through the scheme can be directed towards climate change adaptation needs such as water conservation, drought-proofing, afforestation, minor irrigation works
Better risk assessments
and land use planning can
minimise new settlements
in high-risk locations

ASIA-PACIFIC HUMAN DEVELOPMENT REPORT102
and flood control. Of the 2.7 million works being undertaken in 615 districts in 2008–09, 80 per cent related to water harvesting, afforestation and land development.121
Poverty reduction in hazard-prone areas — The Philippines: The National Anti-Poverty Com-mission has designed a poverty reduction strategy in hazard-prone areas that includes cheap food, micro-finance and insurance instruments, as well as support for household recovery costs.122 As part of the implementation of this strategy, the 2010 Micro Insurance Regulatory Framework promotes insurance and other similar products and services that meet the needs of the poor for risk protection and relief against climate-induced disasters, services that will also support ongoing poverty reduction objectives.123
The Relocation Option
For rural communities located in areas where risks may become too great, the best option could be migration — temporary or permanent. People migrate for many reasons, but already in some cases migration is occurring as a result of changing weather patterns and disasters. In the Solomon Islands, for example, popula-tion exchange between islands is an accepted response to climate stress.124 In the Hindu Kush–Himalayan region, people from communities affected by floods, flash floods, droughts and water shortages migrate for work as a liveli-hood recovery strategy.125 Pastoralists regularly move across the land in order to sustain their livelihoods in times of drought.126 Many other communities migrate seasonally, and this is likely to become even more common.127 Increasingly, people will move to cities, where, however, they can face new vulnerabilities. In Kiribati, for example, falling food production as a result of climate change may have encouraged migration from the outer islands to the Bonriki–Betio urban complex.128 In Bangladesh, numerous people affected by Cyclone Aila in 2009 migrated from villages to urban areas, though many had difficulty in finding employment and coping with the higher costs of living.129
If planned and managed well, migration can be an important adaptation strategy.130 Prepar-ing now for a staggered retreat would allow
time to deal with complex legal and invest-ment issues. Communities, especially those only partly integrated within the cash economy, cannot easily move to land that they do not own, and many cities in Asia and the Pacific lack the capacity to absorb significant migration streams.131 Governments will need to plan ahead and provide viable options for people who have to relocate, perhaps by purchasing tracts of land currently in private hands or by providing housing and alternative livelihood training.132 Where migrants have been able to take charge of their own lives, by relocating both in advance of and following disasters, they have often suc-cessfully protected livelihoods.
Migration with dignity — Kiribati: Ongoing pro-grammes, such as the Kiribati-Australia Nurs-ing Initiative or the Australia Pacific Technical College, support the vision of the president of Kiribati of ‘migration with dignity’.133 These programmes offer skills that I-Kiribati can use at home, or if they have to relocate and migrate. The government is looking to resettle about 10,000 people or almost one-tenth of its population over the next 20 years.134
Moving to higher ground — Viet Nam: The pro-gramme ‘Living with Floods’ helps households living in areas at risk of flooding, landslides or river bank erosion to resettle in nearby resi-dential clusters. It provides interest-free loans for purchasing housing plots and basic housing frames. The new settlement clusters, however, provide few infrastructure services, such as sanitation, water or health, and poor and landless families have had little participation in decision making for the programme. Many are at risk of isolation from social networks linked to their livelihoods.135
Safer Island Strategy — The Maldives: People in the Maldives often move from one island to another and frequently to the capital, Malé, due to limited employment opportunities and an imbalance in access to good education and health care services.136 The government now has a ‘Safer Island Strategy’, which offers voluntary relocation to people on smaller, less populated and potentially more vulnerable islands. They are able to move to larger islands with better natural
People migrate for many reasons, but already in some cases migration is occurring as a result of changing weather patterns and disasters

4 RAISING RURAL RESILIENCE 103
protection and coastal defences, and that provide safe zones in the form of elevated buildings.137
Not everyone can or wants to move. Migration and resettlement can carry high costs, includ-ing cultural degradation, loss of livelihoods and employment networks, and reduced access to social services. Rural women and female-headed households can find it difficult to migrate because of cultural prescriptions and prohibitions.138 Nevertheless, women, especially single women, are migrating in higher numbers. While this can be empowering, it may also expose them to economic and sexual exploitation as well as discrimination in access to housing and services.139
Governments can do much more to protect the rights of internal and international migrants, and provide services to facilitate safe migration. They can make the process inclusive, transpar-ent and accountable, and ensure that migrants have access to social services and employment opportunities.140
VALUING ECOSYSTEM SERVICES
Ecosystems are vital for rural communities, providing basic subsistence, food, fuel and income, and for the region’s cities as sources of food and water (Figure 4.4).141 Managing the fragile balance in supporting, provisioning and regulating the services of ecosystems is key to adaptation. Ecosystems also have a wider significance in regulating global climate through the carbon stocks and sinks of tropical forests, wetlands and even drylands.142 Rural communities have an important part to play in safeguarding and managing these ecosystem services, for which they should receive adequate recognition in climate change strategies.
Natural Solutions
Well-managed ecosystems can protect water-sheds and provide buffers against landslides, storm surges and other natural disasters.143
FIGUREECOSYSTEMS PROVIDE MANY SERVICES THAT UNDERPIN HUMAN WELLBEING4.4
Linkages between Ecosystem Services and Human Wellbeing
Source: Millennium Ecosystem Assessment 2005.
Ecosystems are vital for rural communities,
providing basic subsistence, food, fuel and income

ASIA-PACIFIC HUMAN DEVELOPMENT REPORT104
In rural areas, ecosystem-based adaptation is generally more effective and affordable than engineered solutions (Box 4.1).144 For example, a common response to coastal erosion in the Pacific is to construct seawalls. But many rural communities lack the resources and skills for properly designing seawalls, which may then fail.145 A better strategy would be to im-prove natural coastal protection, for instance by planting mangrove forests within the intertidal zone.146 In Malaysia and Viet Nam, mangrove restorations have reduced the cost of sea dyke maintenance along with providing protection against damages from storm surges, coastal ero-sion and strong waves.147
An ecosystems approach can support agri-cultural livelihoods. Rural communities can, for example, benefit from the principles of eco-agriculture, which combines conserving or restoring ecosystem services and biodiversity with sustainable agricultural production and greater farmland productivity. This can involve planting bushes or trees between fields to control soil erosion and provide shade for protection against extreme temperatures and drought.148
Any approach to ecosystem management has to account for the needs of local commu-nities, who depend heavily on these systems. The region already has numerous examples of community engagement in the manage-ment of natural resources. India, Nepal and the Philippines as well as some Pacific states all have cases of community-based management of both
terrestrial and marine ecosystems (Box 4.2).149 Some of these have been in response to disaster risk, others to address environmental degrad-ation. They offer great potential for capturing synergies across community-based ecosystem management, climate change adaptation and poverty reduction.150
Progress has been made in increasing the area of forest land designated for community use by 45 per cent between 2002 and 2008. Such land now makes up 25 per cent of forest resources in the nine Asian countries that account for most of Asia’s tropical forests.151 Recognition of rights and secure access for management and use by local communities are also critical. This does not automatically imply private legal ownership, but usually means validating customary use rights.152
Community forest management — Thailand: In Trat province, the community of Pred Nai formed a community forestry group that mapped forest resources and introduced forest patrols to pre-vent illegal logging. The group started plant-ing trees in denuded mangrove areas and also developed a regulation programme that prevented harvesting of crabs during their reproductive period. As a result, biodiversity in the area has improved, while the livelihood security of crab collectors has been ensured. The forestry group had to manage a number of conflicts over the sustainable management of their mangrove forests, but built its success on support from various partnerships, including local religious
BOX 4.1
FROM ‘HARD’ ENGINEERING TO ‘SOFT’ ECOLOGICAL RESTORATION IN THE YANGTZE RIVER BASIN, CHINA
The Changjiang (Yangtze) is China’s longest river. Over 400 million people live in its basin, which produces around 40 per cent of China’s GDP. Following disastrous floods in 1998 that killed more than 4,000 people and resulted in over US$25 billion in damages, the government switched from an emphasis on ‘hard’ engineering structures such as dykes and polders to ‘soft’ eco-restoration measures and the resettlement of vulnerable populations away from high-risk zones. Nearly 3,000 square kilometres of floodplains have been restored, increasing floodwater retention capacity by 13 billion cubic metres and reducing the risks of flooding. Restoration has also generated a wide range of benefits in terms of ecosystem services, including improved water quality, increased fish populations, the return of species that
had become locally extinct and the greater use of floodplains by migratory water birds.
While 2.4 million people had to be relocated from the most flood-prone lands to adjacent higher ground, affected people benefited from targeted government programmes to provide housing, jobs and improved facilities as well as from reduced exposure to floods and health risks.
The floodplain restoration programme has become part of a wider strategy adopted in the 2007 National Climate Change Programme. China has a national target of restoring 14,000 square kilometres of natural wetlands by 2030.
Sources: Pittock and Xu 2010; WWF 2008b.
In rural areas, ecosystem-based adaptation is generally more effective and affordable than engineered solutions

4 RAISING RURAL RESILIENCE 105
institutions, village networks, fishery researchers, the national Department of Forestry and the Regional Community Forestry Training Center for Asia and the Pacific (RECOFTC).153
The value of protected areas — Bangladesh and Sri Lanka: Protected areas in Asia and the Paci-fic have a great value in both mitigation and adaptation. They store around 14 per cent of the region’s terrestrial carbon stocks, maintain critical eco-system services such as fish stocks, and can help protect people against climate-related risks.154 In 2007, the mangroves of the protected Sundarbans in Bangladesh buffered the impact of Cyclone Sidr by greatly reducing the intensity of both the wind and the storm surge. In Sri Lanka, the Muthurajawella Protected Area is estimated to have a flood protection value of over US$5 million a year.155 Many protected areas also provide the water supply to major cities in Asia and the Pacific.156 Greater efforts will be needed, however, to manage them so as to handle new stresses from climate change.
Rewarding Ecosystem Managers
Severe degradation has afflicted most of Asia-Pacific’s ecosystems over the last several decades, especially forests (Figure 4.5). This has occurred despite an increase in the forest areas of East
and South Asia between 2000 and 2010 due to large-scale afforestation measures by coun-tries such as Bhutan, China and India.157 Overall, carbon stocks in Asia-Pacific’s forest biomass declined between 2000 and 2010 by an estimated 159 million tonnes per year due to the conversion of primary forests to other uses.158
Damaged ecosystems can be rehabilitated, however. This can lead to improvements in the lives of local communities, especially if they are rewarded for managing and conserv-ing natural resources, reducing flood risks, improving water catchments or sequestering carbon. This is called payment for ecosystem services (PES). These initiatives are usually supported by governments, but private com-panies can also get involved. Hydroelectricity companies, for example, can pay for upstream watershed protection that reduces down-stream silting.159 ‘Payment’ can take many forms, monetary or otherwise. In Sumberjaya, Indonesia, a PES project rewarded the upland poor by offering secure land tenure in return for ecosystem improvements, particularly for maintaining watersheds. Downstream, these services boosted yields and the quality of coffee production.160
A green conversion — China: China has invested more than US$90 billion in existing or planned
BOX 4.2
THE BENEFITS OF LOCALLY MANAGED MARINE AREAS
In the Pacific, Melanesia and Polynesia have seen an impressive increase in the number of marine protected areas over the last decade, almost entirely due to the creation of community-conserved areas. One particular success story involves Locally Managed Marine Areas (LMMAs). Covering waters near the shore, the LMMAs are actively managed by local communities or resource-owning groups in cooperation with local government and partner organisations. In some areas, LMMAs revive or build on traditional practices of tenure and resource management, particularly temporary fishing closures, and complement these with modern methods and scientific knowledge.
Originally started in Fiji, LMMAs have been established in the Federated States of Micronesia, Indonesia, Palau, Papua New Guinea, the Philippines, the Solomon Islands and Vanuatu. Their benefits include increased fish
populations, improved habitat quality, increased income from marine resources and strengthened community capacity for environmental stewardship, as well as greater community cohesion.
In Ucunivanua, the site of the first locally managed marine area in Fiji, the results have been dramatic. Since local management began in the late 1990s, the local kaikoso clam has once again become abundant, and village incomes have risen significantly. Due to the establishment of a taboo area of just 24 hectares, the number of clams in the adjacent harvest areas increased over 50-fold between 1997 and 2004. Communities are getting involved in the LMMA because they want to manage their resources better for their own benefit.
Sources: Clarke and Jupiter 2010; Govan et al. 2009; WRI et al. 2005.
Severe degradation has afflicted most of
Asia-Pacific’s ecosystems over the last several
decades, especially forests

ASIA-PACIFIC HUMAN DEVELOPMENT REPORT106
forestry schemes, compensating farmers for converting cropland to tree plantations and other vegetation.161 All levels of government have been involved, designing programmes to suit local needs.162 One of the largest is the sloping land conversion programme. Initiated in 1999, this involves direct payments to rural landowners for planting trees and other vegetation on farmland in sloping and marginal areas. The programme has a budget of almost US$50 billion, and covers 2,000 counties in 25 provinces. Over 30 million households have participated, and some 13.6 million hectares of ‘wasteland’ have been afforested.163
Developing policies on natural resource manage-ment — Viet Nam: The country has been ex-perimenting with a national PES scheme to reward rural communities for reforestation and forest conservation. A number of pilot forestry projects were started in 2008 to feed into the process of formulating national policies.164 This has led to the circulation of Decree 99 on PES in 2010, which specifies the rights and obligations of providers and users of forest environmental services, the management and use of payment for these services, and the responsibilities of government agencies.165
Getting Ready for REDD+
One form of payment for ecosystem services discussed in international climate negotiations is REDD+, which stands for Reducing Emissions from Deforestation and Forest Degradation. It offers developing countries incentives to protect and sustainably manage their forest resources. With potential financial flows of up to US$30 billion a year globally,166 REDD+ could generate considerable financing for devel-oping countries in Asia and the Pacific, while supplementing the livelihoods of subsistence farmers and forest-dependent people.
Asia-Pacific has seen a rapid increase in REDD+ related activities. Some are private-sector initiatives; others publicly funded schemes involving both bilateral and multilateral donors.167 International negotiations on viable REDD+ mechanisms under the UNFCCC are progress-ing rapidly, and a number of countries are moving ahead with national preparation pro-cesses (Box 4.3).168 National REDD+ strategies must be integrated in overall national poverty reduction and human development strategies, which means identifying local drivers of defor-estation and forest degradation and analysing how these are linked to current and future
FIGUREDECADES OF DEFORESTATION HAVE DEGRADED ECOSYSTEMS ACROSS SOUTH-EAST ASIA4.5
Disappearing Forests in South-East Asia, 1970–90, and Extent of Deforestation in Borneo, 1950–2005, with Projections towards 2020
Sources: UNEP/GRID-Arendal 2002; UNEP/GRID-Arendal 2007.
National REDD+ strategies must be integrated in overall poverty reduction and human development strategies

4 RAISING RURAL RESILIENCE 107
consumption and production patterns at the national and even international levels. Since reducing deforestation pressures will require distributing the right incentives to poor farmers and forest communities while regulating large commercial farmers and preventing illegal activities,169 national REDD+ strategies also need to place local land use options within a national economic development framework, and to be backed by a critical review of forest governance issues.
National governments will probably deter-mine how REDD+ benefits are distributed among provinces, districts and communities, as well as the form they take — cash, credits, or services such as better schools or hospitals.170 Despite these potential benefits, there are still many questions. Fundamental ethical concerns have been raised about who owns the rights to carbon in forests, and whether or not ecosystem services should be commoditised.171 There is a risk that benefits will be captured by elites or that forest-dependent communities will not have their voices heard in decision-making processes, and could lose access to land and resources.172 Beneficiary rights may be questioned where land tenure is uncertain, informal or contested.173 In Papua New Guinea, for example, a 2010
amendment of the Environment Act gave the government unlimited power over natural resources. This means that owners cannot chal-lenge deals in court, which puts local commu-nities at a disadvantage.174
A critical issue in the sustainability of REDD+ projects and activities will be specific actions to ensure that local communities implementing them share the benefits fairly. This will depend largely on the extent to which land tenure is recognised and on whether forest carbon rights can be guaranteed.175 In the effort to establish forest carbon rights, one issue will be whether property law systems consider land, trees and the ecosystem services they provide as belonging fundamentally to the state, to communities or to private landowners. Another aspect concerns formal recognition of customary land tenure rights, given the legal frameworks of most Asia-Pacific countries.176
Unfortunately, many countries interested in participating in REDD+ have a poor track record on both environmental governance and human rights, particularly the rights of indigenous peoples and tribal communities.177 The REDD+ readiness process consists of a number of com-ponents that could address these concerns and significantly improve the involvement of
BOX 4.3
A COMMITMENT TO THE FOREST AND ITS PEOPLE — REDD+ IN INDONESIA
Deforestation and land use changes including peat fires accounted for more than 60 per cent of Indonesia’s GHG emissions in 2005. Under the business-as-usual scenario, the forestry sector is projected to continue as a net emitter.
The government of Indonesia is committed to reducing GHG emissions by 26 per cent by 2020 unilaterally, and by 41 per cent with the support of the international community, while maintaining 7 per cent targeted economic growth by 2014. This commitment was welcomed by the Government of Norway, which signed an agreement with Indonesia to reduce emissions from deforestation and forest degradation and pledged US$1 billion based on Indonesia’s performance. In May 2011, the president of Indonesia issued an instruction to suspend the issuance of primary forest and peat land licences for two years.
Around 38 per cent of the country’s population depends on forest areas for their livelihood. For many of these people, it will be important to achieve secure land tenure.
This would benefit from a nationally approved single source map as well as robust systems for monitoring, reporting and verification.
A REDD+ National Strategy being developed to this end focuses on sustainable landscape management, development of natural resource–based economic systems, and conservation and rehabilitation. The implementation of REDD+ is also factoring in mechanisms for active public consultations, especially with women and vulnerable groups, along with the right of free, prior and informed consent. Critical aspects include the development of socio-environmental safeguards, addressing corruption and an equitable mechanism for sharing revenues and benefits.
Sources: Dermawan et al. 2011; Government of the Kingdom of Norway and Government of the Republic of Indonesia 2010; Government of the Republic of Indonesia 2011; Poffenberger 2006; Republic of Indonesia 2010; The REDD+ Task Force Indonesia 2011; World Bank 2010g.
A critical issue in the sustainability
of REDD+ projects and
activities will be specific actions to ensure that local
communities implementing them share the benefits fairly

ASIA-PACIFIC HUMAN DEVELOPMENT REPORT108
forest-dependent communities. An important principle is the application of procedures for free prior informed consent (FPIC),178 in efforts to strengthen forest governance through, for example, developing community forests, address-ing land tenure rights and establishing partici-patory monitoring techniques.179 Before REDD+ becomes fully operational, care needs to be taken to design equitable mechanisms that strengthen accountability and reduce corruption.
Benefits to communities should be sufficient, and not based only on opportunities for highly visible industrial activities like logging. The small-scale, informal and currently under-paid forest activities of women or indigenous peoples and tribes should be valued and taken into account.180
Designing benefit distribution systems — Viet Nam: The government has undertaken an extensive study on the local distribution of future REDD+ revenues, which could be US$80 million to US$100 million per year.181 The study pro-posed a National REDD+ Fund overseen by a broad-based, multi-stakeholder governing body, along with provincial REDD+ funds to disburse rewards to local beneficiaries. Although a standardised formula for computing payments would be practical, variations in costs under different production systems and the ecological conditions of different groups and areas in Viet Nam need to be reflected in such payments.182
Transboundary Cooperation for Sustainable Ecosystems
Ecosystems rarely coincide with administrative or political boundaries, nor can their manage-ment be addressed purely by single actors or sectors. Coordination among countries, across government departments, line ministries and even local governments is essential. Within Asia-Pacific, there are already many examples of regional cooperation to protect and sustain ecosystems affected by climate change. Within countries, benefits could come from decentralis-ing appropriate powers, capacities and resources to the local level, and from setting up ad-hoc associations of sub-national authorities facing challenges that cross administrative boundaries. Until recently, communes in Cambodia, for
example, did not have the remit to manage forestry. National resource management has now been transferred to sub-national coun-cils, which is a step in the right direction even though adequate technical capacity remains to be built.183
Stronger transboundary outreach and tech-nical cooperation could address challenges related to climate change far more efficiently in some areas. Asia-Pacific has witnessed many protracted conflicts over transboundary water resources. However, in many instances, managing conflicts has led to cooperation through a number of bilateral and regional treaties and initiatives. For example, the Indus Water Treaty, the Indo-Bangladesh Joint Rivers Commission, the Mekong River Commission and the Hydro-meteorological and Flood Forecasting Network on rivers common to India and Bhutan are some specific cases.184 In the Hindu Kush–Himalayan region, rural mountain communities contribute significantly to the sustainable management of goods and services that benefit densely popu-lated lowland cities. Recognising these contri-butions and strengthening rural–urban links could produce new income opportunities and reduce disparities in remote communities, while ensuring the coordinated management of natural resources.185 Both China and India are already calling for collaboration and information exchange to improve the understanding of issues in mountainous areas such as impacts from the changes in glaciers. Engagement with other established regional mountain groups, like the European Alpine Convention, could enhance the sharing of ideas and activities while assisting in raising concerns related to mountainous areas in international fora.186
Other entry points for wider regional cooper-ation include the 2009 convention adopted by the South Pacific Regional Fisheries Management Organisation, which promotes the international conservation and management of non-highly-migratory fisheries and the protection of bio-diversity from the eastern-most part of the South Indian Ocean through the Pacific towards the Exclusive Economic Zones of South America.187 In the Pacific Ocean, Guam, the Federated States of Micronesia, the Marshall Islands, the Northern Mariana Islands and Palau issued the ‘Micronesian Challenge’ in 2005. This initiative
Stronger transboundary outreach and technical cooperation could address challenges related to climate change far more efficiently

4 RAISING RURAL RESILIENCE 109
calls on the region to conserve at least 30 per cent of its near-shore marine resources and 20 per cent of its land by 2020, as well as seeking international assistance for establishing new marine protected areas and strengthening exist-ing ones in the Pacific.188 Across the world, Caribbean states have picked up on this initiative and adopted a similar strategy. These countries have cooperated to jointly develop sustainable financing for marine protected areas through the establishment of the Caribbean Biodiversity Fund, which currently has financial commit-ments of over US$40 million.189
Mangroves for the Future (MFF) is a regional initiative promoting investment in coastal eco-systems for sustainable coastal development. The MFF initiative is co-chaired by the International Union for the Conservation of Nature (IUCN) and the UNDP, with representatives from member countries including India, Indonesia, Maldives, Pakistan, Seychelles, Sri Lanka, Thailand and Viet Nam. The initiative provides a collaborative platform to help countries, sec-tors and agencies in the Asia-Pacific region to tackle the growing challenges to coastal sustain-ability. It has adopted mangroves as its flagship ecosystem in recognition of the important role that these forests played in reducing the impact of the 2004 Indian Ocean tsunami, and the severe effect on coastal livelihoods caused by the loss and degradation of mangroves. The initiative is supporting the implementation of coastal climate change activities through relevant coastal climate change and disaster risk reduc-tion (DRR) tools and methodologies. The MFF also produces region-based research on the role of mangroves and other coastal ecosystems in the carbon cycle.190
Bangladesh is home to 60 per cent of the Sundarbans mangrove forest, the rest lying in India. The two countries have plans to set up an initiative to help sustain this ecosystem — the first ever Indo-Bangla Sundarbans Ecological Forum. The forum plans to take up joint man-agement programmes for better preservation of the Sundarbans mangrove forest, help promote livelihood opportunities for local communities and strengthen the forests’ biodiversity through tiger conservation efforts.191
In order to address desertification, land deg-radation and drought, parliamentarians from
Asia-Pacific countries and other regions met in Changwon in October 2011 at the Ninth Round Table of Members of Parliament. They recognised that ‘climate change including the negative effects of sea level rise and continuing loss of biodiversity threaten the processes that sustain life on earth and the global ecosphere.’ They encouraged greater coordination with relevant regional organisations in alignment with the Ten-Year Strategy and implementation of the United Nations Convention to Combat Desertification (UNCCD).192 In addition, the Green Asia Network was set up in 1998 in Seoul to promote regional cooperation, providing research, educational textbooks and multi-stakeholder training to address climate change, desertification and yellow dust challenges, particularly in Mongolia and the Republic of Korea.193
Some least developed countries (LDCs) in Asia and the Pacific already obtain most of their aid through regional cooperation with other coun-tries in the region.194 This provides an import-ant starting point for South–South cooperation on adaptation, especially where neighbouring countries have a mutual interest in sustaining common resources.
Failure to address climate change across boundaries will simply lead to the displace-ment of the consequences. For example, a ban on deforestation in one country can stimulate illegal logging elsewhere. Currently, 99 per cent of global production forests in the tropics are still not certified.195 Countries in Asia-Pacific need to establish a standard accounting system for the trade in wood along the lines of the Forest Law Enforcement, Governance and Trade Action Plan of the European Union (EU FLEGT) and the Indonesia Voluntary Partnership Agreement. Indonesia and the Philippines are already actively seeking regional cooperation on adaptation issues such as forest fires and pest management.196
STRENGTHENING INSTITUTIONS FOR LOCAL CLIMATE CHANGE PLANNING
Local institutions have a crucial role in planning adaptation and guiding the implementation of measures to foster resilience.197 They can link rural populations to national and regional interventions as well as international funds,
Failure to address climate change
across boundaries will simply lead to
the displacement of the consequences

ASIA-PACIFIC HUMAN DEVELOPMENT REPORT110
determine the flow of external support to dif-ferent population groups, and connect house-holds to resources and collective action.198 This will require effective cooperation across all levels of government.
Unfortunately, administrations in many rural areas lack the necessary human and financial resources for climate-proofing rural infra-structure.199 Even when national policy and planning frameworks successfully incorporate risk reduction and adaptation, for instance through regulations on land use planning and building codes, different stakeholders may lack the organisational and technical knowledge and power to implement and enforce them at the local level.
National institutions and provincial admin-istrations can offer support by helping rural governments and communities in carrying out vulnerability assessments and coordinating planning, and by providing technical assistance or establishing partnerships to get funding.200 National governments can also strengthen the capacity of local institutions, for instance by pro-viding incentives to innovative and motivated civil servants and professionals to work in rural areas.
More importantly, rural local governments will need to be better integrated into central policy development on climate change. Ad-hoc or isolated local projects might yield some short-term local improvements, but, without the links to national supporting programmes and investments, they are unlikely to achieve the necessary level of change. Experience shows that it is also counterproductive to create new, stand-alone institutions, or to rely only on NGOs for adaptation projects. And while certain policies and regulations might need to be designed at the national level, local governments need to be able to make their own long-term plans and mobilise support from relevant line ministries at the sub-national or national levels,201 for instance to devise adaptation measures specific to local conditions and vulnerabilities.202
Planning and Decision Making through Real Participation
Since climate change opens up many uncertain-ties, it will likely demand difficult decisions.
Policy makers designing adaptation policies have to assess the consequences of their proposals carefully, looking at the potential trade-offs and the impacts on different groups, always bearing in mind the alternatives. They have to be aware, for example, that some adaptation strategies could create other problems — for example, by increasing emissions of greenhouse gases, disproportionately burdening the most vulnerable, or limiting the choices available to future generations.203 In Viet Nam, there is a conflict between adaptation and mitigation. The National Target Plan for Climate Change Adaptation envisages relocating vulnerable rural communities from low-lying coastal zones in the Mekong delta to forested areas. Occupying forest land, however, could clash with the govern-ment’s mitigation policy of reducing emissions from deforestation and forest degradation.204 Other situations involve one group benefiting from a particular measure while others lose out. Many governments in Asia, aiming to in-crease energy supply and reduce dependency on fossil fuels, have planned hydropower dams. These large-scale projects may not only dis-place millions of rural people but also alter the natural ecosystems of rivers, thus reducing the livelihoods of people living downstream and their resilience to climate change.205
Local governments can effectively address community doubts and fears about climate change through extensive public consultations and participatory decision making.206 Decisions should favour those who have been left behind and face the greatest vulnerabilities. Community ownership can counter weak implementation or corruption in climate-proofing infrastructure, and support proper monitoring of the imple-mentation of climate change plans and main-tenance of risk reduction structures.207
Strong and inclusive local institutions will be needed in both government and civil soci-ety.208 In the Haor Basin in Bangladesh, elected officials are, for the first time, engaged in the construction and maintenance of government-funded embankments. To improve public accountability, local NGOs are working with national authorities to develop a citizen-based monitoring system.209
A locally rooted approach can employ proven techniques such as ‘participatory community
Rural local governments will need to be better integrated into central policy development on climate change

4 RAISING RURAL RESILIENCE 111
risk assessment’ and ‘participatory learning and action’,210 which build on networks based on kinship or membership-based organisations such as women’s savings clubs, farmers’ groups or water users’ associations.211 Full community ownership is essential to ensure proper monitor-ing of the implementation of climate change plans and the maintenance of risk reduction structures.212 Community cooperatives and local management committees can be an effective way to manage local adaptation projects.213 In Chitral, Pakistan, traditional institutions like the gram (village) help rural people manage scarce water resources in an equitable way.214 In Pacific Island societies, it is sensible to inform ‘persons of influence’ about proposed initiatives.215 Community-based and ecosystem-based solu-tions should be considered prior to proceeding with any high-capital, high-technology and engineering solutions.216
In some cases, community ‘institutions’ can reflect inequitable power relations.217 The rural poor in many countries in Asia and the Pacific suffer from social exclusion, typically based on geography, gender, age, caste, ethnicity or class. This discrimination further heightens vulnerability to climate risks, as these groups and individuals are likely to lose out in conflicts over increasingly scarce resources. Ensuring their inclusion may take time. Some cases might require fairly simple courtesies such as hold-ing meetings at times convenient for women, arranging for child care support or exclusively consulting women for sensitive issues. Other cases may require additional interventions such as leadership training or special temporary measures in local institutions such as quotas to increase the participation of women and mar-ginalised groups.218
Managing conflicts — Bangladesh and the Solomon Islands: Some circumstances may require medi-ation to avoid or manage potential conflict over resources. Bangladesh’s 2005 NAPA, for example, recognised that diverse claims over water would require conflict management.219 The Solomon Islands 2008 NAPA identified the potential for disputes over customary ownership and resources. The government is taking steps to reduce conflict through formal recording of ownership and by mapping land boundaries.220
Linking participatory risk assessments with local development planning — Bangladesh: The Com-prehensive Disaster Management Programme aims to increase community resilience and strengthen local government capacities to manage risk reduction. The programme has developed a standardised community risk assessment process that combines community perceptions with historical data and scientific knowledge, and involves high levels of stake-holder participation. Based on the assessments, the community can jointly identify possible interventions and prioritise projects. Plans are then put together at the district level to mobilise funding from line ministries and donors. Seed funding for implementing priority projects is provided through the Local Disaster Risk Reduction Fund. To ensure transparency and accountability, overseeing is carried out by a Project Implementation Committee, composed of the Union Disaster Management Committee and diverse community representatives including school teachers, civic leaders and priority groups such as women, the elderly and people with disabilities. Some 550 community risk reduction projects identified through this process have been implemented in 16 pilot districts since 2006. The programme has now been up-scaled from a pilot to a nationwide strategy in 40 districts.221
Sharing Knowledge and Awareness for Local Action
A common barrier to planned adaptation is a lack of awareness about the scope of the problem and about possible opportunities to address it. Even if national institutions have a high level of knowledge, they often do not communicate this to local governments and rural communities. Many local governments in turn fail to appreciate the specific implications of climate change for their residents and jurisdictions.222 Often they treat climate change primarily as an environ-mental issue, and largely address disasters as humanitarian emergencies rather than as core development concerns.
Climate change knowledge and imperatives need to be communicated effectively. A recent survey of outer-island communities in Fiji, Kiribati and Vanuatu found that most partici-pants did not understand the term ‘climate
Community ‘institutions’ can reflect inequitable power relations; the rural poor in many countries in Asia and the
Pacific suffer from social exclusion

ASIA-PACIFIC HUMAN DEVELOPMENT REPORT112
change’, although many reported having wit-nessed unprecedented environmental changes.223 This underscores the importance of not just translating information into vernacular languages but also explaining ideas in ways that make sense locally. And communication should not be just a one-way process. National scientific research can benefit from local observations regarding climate variability. Local knowledge and capacity can help shape possible adaptation and mitigation action around local needs.
Ideally, communicators and trainers should have the same culture, speak the same language and understand local customs.224 Knowledge dissemination can benefit from training village-level change agents. Similar to the rural develop-ment campaigns of the Republic of Korea, these change agents should be supported by continued education and resources on climate change.225 Local government officials, village leaders and local self-help groups can draw on study trips to scale up climate-smart practices within a country or as part of South–South cooperation.
Awareness raising and advocacy for climate change adaptation can also factor in social and cultural beliefs that guide people’s attitudes and behaviours. These can lead to denial or fatalism. For example, people living in dangerous environments may just accept this as normal. They need to be encouraged to realise that they could reduce their risks. It is also possible to capitalise on positive values, such as concern for environ-mental resources rooted in religious beliefs.
Recognise local knowledge and capacity — Fiji: The Fiji Climate Change Adaptation Project worked with communities to raise awareness on climate change by gathering local knowledge on coastal management practices, rainfall and land use patterns. Additional technical assessments were translated into the local vernacular to help with adaptation plans. All these activities benefited from having the project implemented by local com-munity members aware of traditional village governance structures and social protocols. This enabled sensitive responses to local concerns and favoured solutions that involved lower environmental and financial risks deemed man-ageable and sustainable by the community.226
A higher call to action — Faith-based organisations: Religious organisations can inspire their followers
to take action on climate change through their ethical teachings, their traditional and unique function in society and their reach and influence.227 In the Indian state of Odisha, for example, Hindu groups and the state gov-ernment, in collaboration with community-run forest protection committees, have agreed to re-establish the state’s sacred forests to provide sustainably managed wood for the annual festival of Lord Jagannath.228 Similarly, in Thailand, Buddhist monks have adapted traditional ceremonies such as tree ordination rituals (buat ton mai) to draw attention to environmental problems, raise awareness about the value of nature and inspire people to take part in conservation efforts.229 In Indonesia, faith-based organisations are enhancing the knowledge of Muslim clergies and teachers of religious schools on environmental conservation and disaster management issues.230
No-Regret Investments
Adaptation often requires long-term invest-ment, particularly for making rural infrastructure such as roads more climate-resilient. In LDCs and developing countries where resources are especially scarce, governments find it difficult to mobilise the necessary funds.231 The problem is even more acute for poor households and individuals who would struggle to spend today on what may be a distant benefit.
While adaptation is often costly, studies have shown that the lack of investment in adapta-tion will be even more expensive and result in huge human costs.232 It is already part of the mandate of local governments to build local resilience by investing in and maintaining basic infrastructure and providing public goods and services. An important step forward is to seek no-regret investments linked to adaptation, such as investment in better management of dis-aster risks.233 In Samoa, for example, strengthen-ing buildings and infrastructure to resist current extreme storms would reduce potential losses due to climate change by more than an estimated 80 per cent without any additional adaptation investment needed.234
Cost–benefit analyses often show clear long-term economic benefits from investing in adaptation. For example, the Chars Livelihood Programme in Bangladesh’s Northern Jamuna
An important step forward is to seek no-regret investments linked to adaptation, such as investment in better management of disaster risks

4 RAISING RURAL RESILIENCE 113
River islands aims at ‘flood-proofing’ homesteads. Houses are constructed on earth platforms with trees and grass planted as a protection against soil erosion. Creating the 125,000 raised platforms needed to protect all 2.5 million Char people from 20-year floods would cost US$117 million, but each dollar spent would save two to three dollars in assets and production that would otherwise be lost during floods.235
Cost-effective climate change measures are invariably those that deliver both mitigation and adaptation.236 Rural governments are more likely to invest in adaptation, as it is related directly to ensuring the immediate wellbeing of their constituents, while returns from mitigation might seem to be too diffuse or large-scale with-out outside funding.237 But, as seen earlier, there are often synergies between measures for mitigation and adaptation and poverty reduc-tion in rural areas. Likewise, investing in one without considering possible trade-offs for the other could have long-term negative conse-quences. Governments should therefore offer incentives that encourage investment in win–win opportunities.238 For example, REDD+ type mechanisms need not be based on international funding alone. Large and diverse countries could well institute similar instruments internally — as seen in some PES schemes — with the added
advantage that the same government is respon-sible both for large-scale emitters and for com-munities vulnerable to climate change, and can make fiscal transfers.
Priority investment should go to high-risk areas and the most vulnerable populations, augmenting adaptation efforts.239 In the Central Highlands of Viet Nam, helping poor communes to enhance rice productivity could boost rice yields by 31 per cent. Rice yields among ethnic minority farming households could increase by an additional 10 per cent if policies improved market access, labour quality and education for ethnic minorities.240
Funds can come from a variety of sources. One option is to earmark climate change fund-ing, which, in countries with considerable de-centralisation, should also be made available to local government agencies. Ministers in the Asia-Pacific region have already recommended that 5 per cent of local government budgets be allocated for climate-sensitive disaster risk management activities at the local authority and community level.241 Adequate climate change adaptation expenditures will need to be allocated through regular development budgets (Box 4.4).
Local governments can also obtain fiscal incentives in the form of top-up grants or performance-based grants, though this might
BOX 4.4
BUDGETING FOR CLIMATE-RESILIENT DEVELOPMENT IN INDIA
A recent analysis of adaptation expenditures by the gov-ernment of India assessed a collection of programmes and schemes across sectors such as poverty alleviation, crop improvement, drought-proofing, flood control, health, risk financing, disaster management and forest conservation. According to the National Action Plan on Climate Change, adaptation-related expenditures were 2.6 per cent of GDP in 2006–07. Rising steadily, they are expected to be 15.7 per cent of budgetary expenditures in 2010–11.
In 2010–11, more than 85 per cent of total expenditure on adaptation was for enhancing human capabilities. For example, 72 per cent was related to poverty alleviation, livelihoods and food security. But the budget is far smaller for improving ecosystem services and natural resources management and conservation — 0.32 per cent of GDP. Agriculture is a mere 1.43 per cent, and expenditure to
address land degradation, drought-proofing and irrigation is an additional 1 per cent.
Moreover, the ministries likely to be most closely involved in addressing climate change have not been given appropriate priority. In the Union Budget 2010–11, the total allocation for the Ministry of Environment and Forest is 0.21 per cent; the Ministry of Water Resources has been allocated 0.09 per cent; and the departmental budget for the Department of Land Resources is 0.24 per cent.
Adaptation needs financing of a much higher order, for climate-proofing infrastructure, improving services and rural connectivity, and upgrading poor rural habitats. Greater support is also needed for local governance institutions, which need knowledge, technology, and capacity building for participatory risk planning in rural areas.
Source: Panda 2011.
Priority investments
should go to high-risk areas and the
most vulnerable populations, augmenting
adaptation efforts

ASIA-PACIFIC HUMAN DEVELOPMENT REPORT114
SPECIAL CONTRIBUTION
FACING UP TO CLIMATE CHANGE: THE ALBAY EXPERIENCE
GOVERNOR JOEY SARTE SALCEDA
The Challenges of Climate Change
Climate change poses a significant threat to human development and the wellbeing of the current and future generations of Albay, a province on the eastern seaboard of Luzon, which is exposed to both climate-induced and other natural disasters. Facing the western Pacific Ocean where most tropical cyclones are born, Albay is almost always the first or second area of landfall for super-typhoons like Milenyo (Xangsane) and Reming (Durian) in late 2006.
Mayon Volcano, Albay’s main land-mark, is the world’s most perfectly formed volcano and the Philippines’ most active with a record of over 49 eruptions in the past 400 years. From July to October 2006, Mayon erupted with no apparent loss of life during the eruption period. The most dam-age came later that year when 466 millimetres of rainfall, the highest in 40 years, created mudslides of volcanic ash and boulders off Mayon, covered villages in Legazpi City and Daraga in mud up to houses’ roofs, and claimed at least 1,260 lives. NEDA Region V recorded damages at P7.8 billion led by the agriculture sector at 43 per cent of total costs.
Albay presents a classic case of the impacts of geophysical disaster and meteorological variabilities aggra-vated by climate change. Agriculture and its related resources are the most at risk, and the destruction of the nerve of the economy and the natural ecosystems, river basins, coastal and marine, and biodiversity, places the population in a dysfunctional situation requiring massive response from the government for financial and material resources for humanitarian action.
Recurring disasters compromise human development as they eventu-ally result in the failure of govern-ment response, due mainly to limited resources for food, water, shelter and livelihood.
Albay’s experience affirms the need for a shift in the governance para-digm. The ‘Millennium Develop-ment Goals (MDG) as the road map to human development and adapta-tion as the means!’ is a radical and rational manoeuvre that avoids the very high cost of unsustainable emer-gency response to disaster prevention and risk and promotes disaster man-agement, recovery and MDG-locked adaptation.
Climate change increases the vul-nerability of the human population through continuous disintegration of physical, natural, financial, human and social capital with more frequent and extreme weather events, thus reducing the chances of sustained pov-erty reduction and building human development.
The strategy for disaster manage-ment and recovery must be locked into the MDGs and poverty reduction, disaster risk reduction and climate change adaptation. For the best results, the strategy must permeate local government policies, development plans, programmes and decision-making processes. Adaptation needs to be anchored in people’s capacity to formulate and carry out disaster/climate-sensitive local development plans and programmes that are also MDG-responsive.
Albay built institutions to main-stream its three-fold strategy: the Albay Public Safety and Emergency Office (APSEMO); the Centre for Initiatives and Research for Climate
Adaptation (CIRCA); and the Albay Millennium Development Goals Office (AMDGO)
Albay Public Safety and Emergency Offi ce (APSEMO)
Created in 1995 as a permanent disaster risk management office, APSEMO upholds the ‘Zero Casualty’ objective. The APSEMO, secretariat of the Provincial Disaster Risk Reduc-tion Management Council, prepares communities and families to face hazards as a way of life. For emergency preparedness, APSEMO manages hazards data and early-warning sys-tems, implements communication protocol and develops community evacuation procedures and manuals for drills. It facilitates the integration of climate and disaster risk reduction in the comprehensive land use plan-ning process of cities and municipal-ities. It promotes hazard awareness through community-based disaster risk reduction management (CBDRRM) training.
Centre for Initiatives and Research for Climate Adaptation (CIRCA)
The CIRCA was established in Albay for focus on research and studies, policy formulation and information management on climate change, its impacts and adaptation measures. Its role in development may be summed up thus: ‘Greening an economy has an intrinsic bias in intergenerational equity that can only be embodied by conscious investments in adapta-tion, health, and education. Albay is investing 9 per cent of its budget in climate change adaptation (CCA); 21 per cent in health and 24 per cent in education.’

4 RAISING RURAL RESILIENCE 115
Albay Millennium Development Goals (AMDGO)
Institutionalised in 2009, AMDGO addresses human development issues in places where poverty is most affected by climate change. Albay is primarily an agricultural economy vulnerable to decline in productivity, livelihood and food supply, and, eventually, to lower income for agricultural workers, producers and decreased capacity to meet basic needs.
Created by Executive Order No. 2009-11, AMDGO supports speedy and focused humanitarian recovery within the framework of DRR management, the Contingency Plan and the MDGs. The AMDGO manages the social assets programmes of the province and ensures that recovery efforts are centred on the attainment of MDG targets. The AMDGO has completed its first progress report on the localised MDG, which revealed more good news than not in the achievement of the development goals.
The review of progress with MDG targets shows high and medium probability that all, except for MDGs 2 and 7, will be achieved before 2015 by Albay. Participation in elementary education and household access to sanitary toilets remain challenges to the achievement of the MDGs and the consequent enhancement of the resilience of poor communities to climate and disaster impacts.
Capacity Development Opportunities
As early as 1995, Albay was the torch-bearer in DRR. Its disaster work is now geared towards building the
capacity of vulnerable communities and Albay’s people through climate and disaster risk reduction. For the long-term resilience of communities, the integration of DRR and CCA into the educational curriculum is ready for implementation in elementary and secondary levels.
Today, CIRCA continuously holds trainings and seminars in the cities and municipalities of Albay with its partners. To promote the primacy of local government units (LGU) in local DRR and CCA issues among other LGUs, CIRCA, in partnership with the League of Provinces, cities and municipalities, and the National Economic Development Authority, convened the LGU Summits in the Luzon, Visayas and Mindanao island groups.
The Climate Change Academy of CIRCA has opened up opportunities for local capacity development at sub-national levels. Officials can be trained to integrate CCA/DRR in development and planning processes, to use local tools for scenario building, vulnerability assessment, impact management, and land use and development planning.
Research on progressive sustainable development benefits and other co-benefits from mitigation measures like renewable energy implementation and enhancement of carbon sinks as adaptation options will be conducted to support the capacity development efforts. The adoption of new technologies through demonstration and testing can be facilitated by the Academy to promote new jobs, skills, investments, and the protection of ecosystems for increased family income as well as better provision of services to the communities.
Advocacy for International, National and Local DRR and CCA Policies and Programmes
Albay paved the way for the timely enactment of Republic Act 9729 (Climate Change Act 2009) and Republic Act 10121 (Philippine Disaster Risk Reduction and Management Act of 2010) through the conduct of various fora on CCA and DRR. Adhering to the dictum ‘Think global, act local,’ Albay hosted and co-convened the first and second National Conference on Climate Change Adaptation (NCCCA) that brought about the Albay 2007 Declarations and the Manila 2009 Declarations. In both conferences, representatives of Congress, national and international agencies and the private sector called for legislation to manage, with the preventive approach, the impacts of disasters on people, the community and the economy.
The battle cry: ‘Disaster risk re-duction is no longer an option, it is a must!’ was brought to Congress and to former President Gloria Macapagal-Arroyo, with the governor presenting the final bicameral versions of the measures. The rest is history!
For its demonstrated successes, Albay is hailed as a model and Governor Joey Salceda as the first Senior Global Champion for DRR appointed by the UN International Strategy on Disaster Risk Reduction (UNISDR). Albay is represented in the Philippine Delegation to the United Nations Framework Convention on Climate Change (UNFCCC).
require additional support for smaller institutions to enable them to meet the required standards. Rewards could be given for performance in assessing risk and implementing local climate change action plans based on evaluations by the
community members. Local governments can also regulate or provide incentives to households or businesses for responsible, climate-smart investments — for climate-proofing infrastruc-ture, for example — providing microcredits or

ASIA-PACIFIC HUMAN DEVELOPMENT REPORT116
insurance that is conditional on household risk reduction.242
Large-scale external funding should also come from developed countries, under the new Green Climate Fund, future REDD+ schemes and other initiatives.243 But these funds are becom-ing increasingly complex, making it difficult for local government units to gain access.244 Local governments and institutions will need stronger capacities to obtain, manage, deliver and track these funds.245 Since international finance can also be slow to arrive at the local level, national governments will need to create ways for local government units to access climate change finance.246
Funding local climate plans — The Philippines: The Philippines is considering a People’s Sur-vival Fund to assist local government units with implementing their local climate change action plans. The fund would have a number of sources, including: 10 per cent from cash dividends declared by all government-owned and government-controlled corporations; 5 per cent from the proceeds from the sale of certified and verified emission reduction carbon credits generated from domestic activities; and 10 per cent from user charge on motor vehicles.247 The fund has already won support from international donors.248 Similar funds are being set up by Bangladesh, Cambodia, China, India, Indonesia, Maldives and Thailand.249
Small grant funds for local adaptation: A number of funding mechanisms provide small grants for adaptation directly to communities or non-profit organisations. These have usually been pilot demonstration projects to feed local experiences into national policy processes. For example, the Small Grants Programme of the Global Environment Facility offers local commu-nities funds for climate change mitigation and adaptation.250 Other donors have followed suit,
financing field-based testing of risk management measures and knowledge products by local stakeholders, and identifying and disseminating best practices.251
TOWARDS RURAL RESILIENCE
Rural communities across Asia and the Pacific will face significant disruption as a consequence of climate change. The effects will vary from place to place. Agricultural productivity in some areas may gain from higher temperatures or concentrations of CO2. But overall, there is likely to be considerable dislocation and stress, given the current vulnerability of many rural communities.
Governments in the region recognise the risks, but have yet to build new climate scenarios and risks into programmes for reducing rural poverty. They do not, however, need to start from zero. Rural communities have long histories of coping with and adapting to changes in weather and climate variability. As risks become increasingly difficult to manage, governments can reinforce past experience with a growing body of scientific information and greater global understanding of the need to protect our common ecosystems, in order to proactively adapt to potential risks and changes.
Ultimately, the best way to make rural women and men more resilient to climate change is to achieve more sustainable and inclusive rural development. Communities that are well edu-cated, have reliable sources of income and equal rights will be in a much stronger position to adjust to new demands. They can work effectively with local authorities to achieve strategic and planned adaptation, and facilitate greater coordination to manage demands for scarce resources between rural and urban areas. Recognising the value of sustainable rural ecosystem management will provide an opportunity to adjust the balance in favour of rural development.
The best way to make rural women and men more resilient to climate change is to achieve more sustainable and inclusive rural development

4 RAISING RURAL RESILIENCE 117
The majority of poor and vulnerable people in Asia-Pacific live in rural areas where their livelihoods are acutely sensitive to climate change. But rural communities also have long experience of coping with variability in climatic patterns. Their expertise in autonomous adaptation can be leveraged to help deliver more deliberate and planned adaptation. Priorities for rural climate change transformation should focus on ensuring more resilient and diversified rural livelihoods, providing enabling and protective social services and preserving ecosystem services.
Bolster rural resilience: Manage water, land, forests, fisheries and biodiversity more efficiently, cooperating both within and across borders Focus on training and techniques for more resilient agriculture and diversified rural livelihoods Invest in climate-proofing rural infrastructure and ensuring better access to markets and services Improve outreach to remote areas through information and communication technology (ICT) Apply risk management approaches such as index-based weather insurance Explore innovations and niche businesses to provide services and technologies for rural adaptation and mitigation.
Prepare for greater risks: Establish community-based disaster management Promote household-level risk reduction Design adaptive social protection and safety nets Prepare for retreat from high-risk locations, and support migrants.
Enhance ecosystem services: Support ecosystem-based solutions to adaptation Engage local communities in the management of their local ecosystems Distribute benefits from sustainable ecosystem management to those most in need Address land rights issues and corruption in forest management.
Strengthen local institutions: Encourage local, inclusive and well-informed participatory planning to manage trade-offs and conflicts Communicate climate change information and tools effectively, while recognising local knowledge and capacity Improve coordination so that rural communities can benefit from integrated, climate-smart development assistance from the national level Increase regional cooperation on cross-border forests, rivers, oceans and other shared ecosystems Prioritise no-regret investments Increase local access to climate funding.
ACTIONS AT A GLANCE


BUILDING GREENER CITIES
5

Do we have cars? Do we clog up the drains with our garbage? Do we build multi-storeyed apartments and throw the debris of our construction material into storm water drains? Tell me, do we cause pollution?
A Mumbai slum dweller speaks

5 BUILDING GREENER CITIES 121
Building Greener Cities
Asia and the Pacific are home to some of the world’s largest urban areas. Indeed, of the world’s top 20 megacities — those with populations of 10 million or more — half are located in Asia (Table 5.1). Of these, the fastest-growing in Asia is Dhaka: between 2005 and 2010 its population increased by over 16 per cent. In terms of total population, however, the largest city by 2020 is likely to be Tokyo (37 million), followed by New Delhi (26 million), and then Mumbai (24 million), with Shanghai (19 million) and Karachi (17 million) not far behind.1 Around 40 per cent of Asia-Pacific’s population resides in urban settlements.2 By 2026, Asia’s popu-lation is likely to reach a tipping point: by then, over half its population will be urban,3 and by 2050 the proportion could reach two-thirds.4 Within Asia-Pacific developing countries, the fastest rate of urbanisation is to be found in East Asia, followed by South Asia and the Pacific (Figure 5.1). The much smaller Pacific Island countries are also becoming far more urbanised. Some have around 40 per cent of their populations living in urban areas.5 Larger urban populations, whether these have come about as a result of natural growth or the arrival of new settlers or short-term residents, are straining existing resources, including those linked to climate change such as energy, water and land. Growing numbers of urban residents also stretch the capacity of institutions to provide social services.
Asian cities also tend to be densely populated, with 6,500 people per square kilometre, com-pared to 4,500 in Latin America and 4,000 in Europe.6 A high proportion of these people live in slums7 and shantytowns where they are more
‘What is the city but the people?’— William Shakespeare, Coriolanus, Act III, Scene I
The Asia-Pacific region has some of the world’s fastest-growing cities, which must deal with both the causes and the consequences of climate change. The most vulnerable are the urban poor, who occupy marginal areas exposed to climate and environmental hazards. Yet cities are also centres of dynamism and can learn to navigate newer carbon-efficient pathways while adapting to a warmer world.
TABLE ASIA HAS HALF OF THE WORLD’S 20 MOST POPULOUS URBAN AGGLOMERATIONS5.1
The World’s 20 Most Populous Urban Agglomerations
Urban Agglomeration
Country Population 2010,
Millions
Increase in Population, Per Cent (2000–05)a
Increase in Population, Per Cent (2005–10)a
1 Tokyo Japan 36.7 3.4 2.9
2 New Delhi India 22.2 23.9 13.7
3 São Paulo Brazil 20.3 9.1 8.7
4 Mumbai India 20.0 13.2 10.1
5 Mexico City Mexico 19.5 4.0 3.9
6 New York–Newark USA 19.4 4.9 3.7
7 Shanghai China 16.6 14.8 9.2
8 Kolkata India 15.6 9.4 8.9
9 Dhaka Bangladesh 14.7 22.1 16.7
10 Karachi Pakistan 13.1 15.9 13.0
11 Buenos Aires Argentina 13.1 5.9 4.2
12 Los Angeles–Long Beach–Santa Ana
USA 12.8 4.2 3.7
13 Beijing China 12.4 17.4 8.1
14 Rio de Janeiro Brazil 12.0 5.2 5.1
15 Manila Philippines 11.6 8.1 8.1
16 Osaka–Kobe Japan 11.3 0.8 0.7
17 Cairo Egypt 11.0 3.9 4.1
18 Lagos Nigeria 10.6 21.2 20.7
19 Moscow Russian Federation
10.6 4.1 1.3
20 Istanbul Turkey 10.5 11.1 8.4
Sources: Based on UNDESA 2010a, 2010b.Notes: (a) Increase in population rates have been calculated based on data from
UNDESA 2010b; (b) Asian cities are in bold and are based on the UNDP country classifi cation for the Asia-Pacifi c.
5
vulnerable and have the least capacity to cope and adapt to climate change.8 Proportions of urban populations residing in such areas are, on an average, 35 per cent in South Asia, 28 per cent in East Asia, 25 per cent in West Asia, 31 per cent in South-East Asia and 24 per cent in the Pacific.9
The most vulnerable are the urban poor, who occupy marginal areas exposed to climate hazards
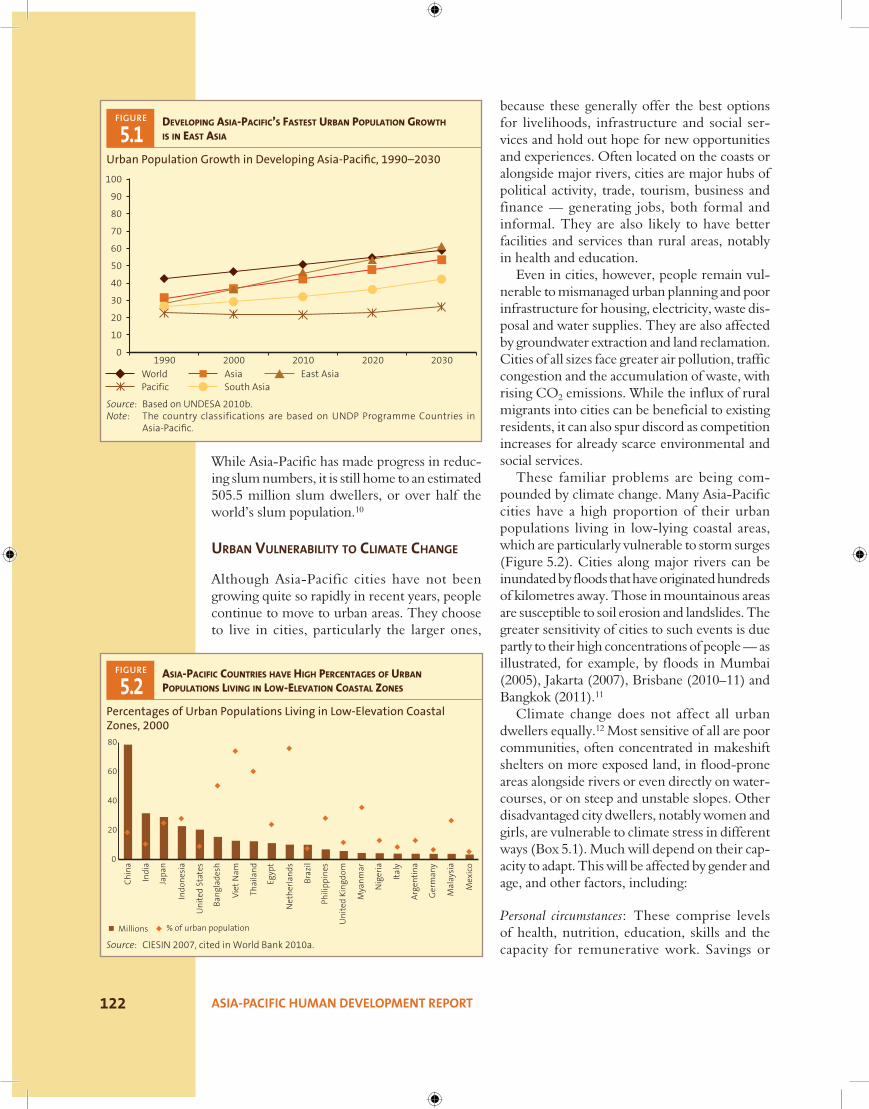
ASIA-PACIFIC HUMAN DEVELOPMENT REPORT122
FIGURE ASIA-PACIFIC COUNTRIES HAVE HIGH PERCENTAGES OF URBAN POPULATIONS LIVING IN LOW-ELEVATION COASTAL ZONES5.2
Percentages of Urban Populations Living in Low-Elevation Coastal Zones, 2000
Source: CIESIN 2007, cited in World Bank 2010a.
While Asia-Pacific has made progress in reduc-ing slum numbers, it is still home to an estimated 505.5 million slum dwellers, or over half the world’s slum population.10
URBAN VULNERABILITY TO CLIMATE CHANGE
Although Asia-Pacific cities have not been growing quite so rapidly in recent years, people continue to move to urban areas. They choose to live in cities, particularly the larger ones,
because these generally offer the best options for livelihoods, infrastructure and social ser-vices and hold out hope for new opportunities and experiences. Often located on the coasts or alongside major rivers, cities are major hubs of political activity, trade, tourism, business and finance — generating jobs, both formal and informal. They are also likely to have better facilities and services than rural areas, notably in health and education.
Even in cities, however, people remain vul-nerable to mismanaged urban planning and poor infrastructure for housing, electricity, waste dis-posal and water supplies. They are also affected by groundwater extraction and land reclamation. Cities of all sizes face greater air pollution, traffic congestion and the accumulation of waste, with rising CO2 emissions. While the influx of rural migrants into cities can be beneficial to existing residents, it can also spur discord as competition increases for already scarce environmental and social services.
These familiar problems are being com-pounded by climate change. Many Asia-Pacific cities have a high proportion of their urban populations living in low-lying coastal areas, which are particularly vulnerable to storm surges (Figure 5.2). Cities along major rivers can be inundated by floods that have originated hundreds of kilometres away. Those in mountainous areas are susceptible to soil erosion and landslides. The greater sensitivity of cities to such events is due partly to their high concentrations of people — as illustrated, for example, by floods in Mumbai (2005), Jakarta (2007), Brisbane (2010–11) and Bangkok (2011).11
Climate change does not affect all urban dwellers equally.12 Most sensitive of all are poor communities, often concentrated in makeshift shelters on more exposed land, in flood-prone areas alongside rivers or even directly on water-courses, or on steep and unstable slopes. Other disadvantaged city dwellers, notably women and girls, are vulnerable to climate stress in different ways (Box 5.1). Much will depend on their cap-acity to adapt. This will be affected by gender and age, and other factors, including:
Personal circumstances: These comprise levels of health, nutrition, education, skills and the capacity for remunerative work. Savings or
FIGURE DEVELOPING ASIA-PACIFIC’S FASTEST URBAN POPULATION GROWTH IS IN EAST ASIA5.1
Urban Population Growth in Developing Asia-Pacifi c, 1990–2030
Source: Based on UNDESA 2010b.Note: The country classifications are based on UNDP Programme Countries in
Asia-Pacifi c.

5 BUILDING GREENER CITIES 123
BOX 5.1
URBAN WOMEN AND CLIMATE CHANGE
Women and men in cities are affected differently by climate change. Some of the issues that require a gender-sensitive response are:
Domestic Energy Use
Dwellings are, in most cases, formally owned by men, but women traditionally do most of the work in the home that involves energy use, such as cooking and heating. This often involves the use of inefficient technologies and burning of traditional fuels, which results in women suffering disproportional negative health effects from indoor air pollution. These can include respiratory infections and reproductive health issues. Women have also not had much say in measures that might reduce energy consumption or help switch to less emissions-intensive energy sources. To ensure that women’s needs in the household are met, they need to be included in decision making on the development, design and distribution of cleaner energy technologies. In addition to enabling women to have greater influence in public policy, greener energy choices should also be made affordable for women.
Mobility
In many cities, a male bias in decision making leads to investment policies that give higher priority to infrastructure for motorised transport than for public transport. Men tend to have larger, more fuel-consuming private vehicles. In addition, since women in many societies are more likely than men to work in or near the home, they are less likely to commute. For their more frequent, local trips, women tend to rely on public transport, if it exists and is affordable. As a result of such gender differences being ignored, women’s needs may get crowded out in the design of new transport systems. Therefore, when policy makers design greener, less emissions-intensive systems, they need to make them more gender-friendly at the same time. To do so, they can replicate good practices already being implemented by some municipal authorities in the region. Some of these bodies have, for example, responded to frequent sexual harassment
and other threats to personal security by introducing ‘women only’ buses and special compartments in trains.
Waste
In many Asia-Pacific countries, household waste management is generally considered the responsibility of women and girls. Because they tend to have lower levels of education, women often have less knowledge of how to protect themselves from health risks related to waste management and can consequently suffer negative health effects. When cities make sewage and waste management systems more climate-friendly and encourage waste separation and recycling, specific attention should be paid to such gender differences. Importantly, measures should be taken to ensure that the extra burden from more labour-intensive waste management systems does not fall mainly on women. Instead, green waste management systems should be designed so as to reduce women’s time burden and to enable them to engage in more income-generating or leisure activities.
Awareness and Resources
Women in the cities of developing Asia-Pacific still have lower levels of literacy and education than men, and earn less on an average. Climate adaptation policies and programmes need to take into account the fact that women and girls have fewer financial and technological resources than men to access climate-related information. City authorities can promote responsive communication formats that are accessible to illiterate women, for example by using radio programmes at times that women are likely to tune in. They can also partner with women’s networks in the city to focus on content and examples that are more likely to appeal to urban women. In addition to making information reach both women and men, capacity development initiatives on climate change should incorporate urban women’s specific vulnerabilities, needs and opportunities.
Source: Based on Alber 2010.
access to credit may enable people to install solar panels or relocate to temporary housing following a flood.
Infrastructure and social services: Slum areas tend to have housing that is less climate-resilient and sub-standard social services for energy, water and sanitation.
Environmental assets: The urban poor generally live on the most exposed land, suffering from poor air and water quality that undermines options for safe shelter and health, making them more vulnerable to climate disasters.
Institutional governance: Many people are not supported by and cannot always access safety nets

ASIA-PACIFIC HUMAN DEVELOPMENT REPORT124
and other short- and longer-term mechanisms for protection against climate events.
Cities concentrate people and their homes, along with physical capital, industry and waste. This proximity can be dangerous, exposing tightly packed households not only to pollution and disease but also to extreme weather events in very constricted spaces that are difficult to evacuate. The problem is exacerbated by the fact that Asia-Pacific cities have some of the largest population densities in the world, as noted earlier. This risk is not, however, an inherent characteristic of cities but rather a consequence of poor planning that takes little account of the everyday needs of people, particularly the poor. Asia-Pacific already has many positive examples of how simple precautions and planning can reduce risk (Box 5.2).
Cities are also vulnerable to climate change by virtue of their complex systems. Dense, inter-acting networks of communications, transport and trade make cities prone to sudden disrup-tions. A failure in one system is likely to affect many others. For example, a breakdown in the power supply may interrupt transport, com-munications and water pumping, with further implications for sanitation, health and access to schools. The Dhaka floods of 1988, which inundated 85 per cent of the city, curtailed livelihoods, travel and communications for several weeks.13 Severe climate events can also damage key infrastructure vital for tourism, including airports, ports and roads, with cor-responding losses of income and jobs.14
City dwellers are particularly affected if climate change raises air temperatures or leads to more frequent heat waves. In urban areas, con-struction materials such as concrete and asphalt retain heat, creating a heat storage effect. A wide range of urban activities also consume energy and release heat. As a result, cities are often warmer than the surrounding areas; this is known as the ‘urban heat island’ effect.15 All city dwellers experience this to some extent, but the working poor are particularly vulnerable since they often spend their days out of doors, or work indoors without fans or airconditioning.
Threats to Services
Climate change will further strain urban social services, particularly water and food supplies, sanitation and electricity, in the face of floods, droughts, heat waves and sea-level rise. While cities often have greater resources and human and administrative capacities to deal with both sudden, climate-induced shocks and longer-term stresses, whether or not they actually take advantage of this potential is another matter.
City infrastructure for services has generally evolved organically as populations have grown and cities have absorbed migrants from rural areas. But this growth has been uneven. The richer districts have more climate-resilient buildings and resources. The poorer areas have flimsier structures. Even now, many infrastruc-ture planning decisions are made without ser-ious consideration of future climate variability. City planners who have considered the risks
BOX 5.2
POOR COMMUNITIES IN INDORE, INDIA, ADAPT TO FLOODING
In Indore, many poor communities live close to jobs or markets and public services, on land that is relatively cheap but also vulnerable — alongside small rivers, for example, that also serve as storm-water drains. To compensate, local people have taken a number of adaptation measures. For example, they use landfills to raise plinths and courtyards, select furniture that is less likely to be washed away, and locate shelves and electrical wiring high up on their walls. In some cases, the roof may be fixed in such a way that it can be detached rapidly if the house is in peril.
Residents also have contingency plans for evacuation. In the settlement of Shekha Nagar, for example, the first
response is to move children, the elderly and animals to higher ground. The next priority is consumer durables such as TVs and radios. Then they pack lighter valuables and cooking utensils. Finally they take their clothes, since these are the least likely to be damaged by water and in any case are easily replaced.
In the longer term, however, the priority must be to ensure better housing for the poor in less flood-prone locations where they can work and have access to services.
Source: Stephens et al. 1996, cited in Satterthwaite et al. 2007.
Climate change will further strain urban social services, in the face of floods, droughts, heat waves and sea-level rise

5 BUILDING GREENER CITIES 125
may lack the technical know-how or finance to develop solutions. Others may simply be un-willing to respond if long-term benefits conflict with immediate economic interests.
Water
Water for cities comes largely from rural areas, through pumping groundwater or piping sur-face water, often bypassing rural habitations. Climate change could reduce these flows while also affecting the production of food and hydro-power. Water flows within cities are also altered by land use changes and the extension of con-crete, which hinders groundwater recharge, blocks waterways and reduces green spaces while also making it more difficult to control flooding. Dense housing can lead to an increase in con-crete and asphalt, reducing the potential for flood mitigation. Even the richest cities struggle to cope if drainage systems are poorly maintained or if their capacity has not expanded to keep pace with increasing populations.
Asian cities have managed to increase the supplies of safe drinking water — currently available to more than 90 per cent of the urban population — even though there is some way to go in terms of quantity and regularity.16 Yet services are constantly under strain as a result of population increase and rising demand. As incomes rise, so does the per capita consump-tion of water, though per capita use is lower in some of the richest cities, which are able to use water more efficiently (Figure 5.3).
As a result largely of rising population, between 1990 and 2008, a number of countries saw a decline in the proportion of city dwellers with access to improved water supplies. These countries include Bangladesh, Indonesia, Lao People’s Democratic Republic, Myanmar, Nepal and Pakistan.17 Access is often sporadic: even cities like Chennai and Mumbai may have water for only five hours a day.18 Some of these shortages are due to leakages. Karachi, for example, loses more than a quarter of supplies due to old pipes and systems, and many other cities suffer similar losses.19 These leakages lead to contamination and raise the costs of water for the poor.20
Even at the best of times, water supplies to the poor in cities are typically very fragmented, unreliable and expensive. Households in slum
FIGUREA TIPPING POINT IN WATER CONSUMPTION5.3
Water Consumption and the Per Capita Income of Select Asian Cities
Source: Economist Intelligence Unit 2011.Note: Years differ from city to city from 2005 to 2009. Annual GDP per person in US$
is based on current prices.
settlements without piped water often have to get their water delivered in tankers, and for this they generally pay much more than the rich.21
If cities become more susceptible to droughts through climate change, this will further reduce water availability and increase the necessary daily intake of potable water, especially during extended heat waves. Extremely low surface flows during droughts can lead to increased chemical and micro-biological loads in watercourses.22 Water prices will rise as supplies shrink and so will food costs if production declines in rural areas (Figure 5.4).
Sanitation
Droughts, floods and other extreme events will put already over-stretched sanitation systems under further stress, compromising hygiene and increasing the risk of water-borne diseases. Currently, few cities in the region have large-scale wastewater treatment facilities. This is partly because they lack the necessary resources. But they also suffer from a legacy of poor urban planning as well as disputes over landownership and compensation. These factors have made it difficult to build new infrastructure.23 Asia-Pacific has some of the world’s worst urban sani-tation coverage, ranked higher than that of only

ASIA-PACIFIC HUMAN DEVELOPMENT REPORT126
FIGURELOWER RAINFALL AFFECTS BOTH URBAN AND RURAL LIVES5.4
Source: ICLEI 2011.
FIGURE ACCESS TO IMPROVED SANITATION IS LOW IN URBAN AREAS OF SOUTH ASIA5.5
Access to Improved Sanitation by Global Region, 2006
Source: World Bank 2011b.
Sub-Saharan Africa (Figure 5.5). Steady rates of urbanisation have not translated into equal progress in providing critical city infrastruc-ture such as sanitation services. For planners, this is becoming an increasingly urgent issue. Municipal authorities need to plan now for future demand, which will mean acquiring the necessary land, since it will become steadily more expensive to do so in the future.24
Food
The production and consumption of food and its transport to cities contribute to emissions. At
the same time, climate change can reduce food production, for instance, through natural dis-asters that disrupt supplies to urban areas. Sup-plies are also affected when cities encroach on surrounding natural ecosystems and agricul-tural lands. Those who suffer most from this disruption are the urban poor, who spend up to 60 per cent of their incomes on food globally.25 Governments will therefore need to consider the future of food distribution systems.
Most food supplies to cities will continue to come from rural agriculture. But this can be sup-plemented by urban and peri-urban gardening, especially for perishable items.26 In Hanoi, up to 80 per cent of fresh vegetables come from urban and peri-urban areas, and are often produced by women.27 Globally, in developing countries, about 70 per cent of urban households are involved in some form of agricultural activity, in community gardens, private backyards, schools, rooftops, window boxes and vacant public lands, as well as along roadsides and rail tracks. Such production can provide up to 60 per cent of an urban household’s food needs, while surplus produce can bring in additional income. Pro-duction in this manner also helps green the city, improving air quality, cutting emissions from reduced transport, absorbing carbon and lowering temperatures. Nevertheless, urban food production faces major obstacles, especially with regard to suitable land and access to water. There are also concerns for the safety of food grown using wastewater and organic material, and the risk of diseases and contamination by toxic pollutants. Such challenges require close cooperation between household producers, public authorities and planners.28
Electricity
Cities face rising demands for electricity as a result of growing populations, commercial demand, variable local weather conditions, urban heat island impacts and economic growth.29 While milder winter temperatures can reduce the use of heating, colder winters require more energy for heating, while hotter summer temperatures can lead to greater use of airconditioning, which can increase the urban heat island effect.
Most electricity is produced in rural or peri-urban areas and transmitted to cities. How-ever, central governments tend to decide on

5 BUILDING GREENER CITIES 127
power projects with only limited consultation with the local populations, who can face severe environmental and economic consequences. Typically, urban homes have much better electricity supplies. In developing Asia, the elec-trification rate in 2009 was 94 per cent in urban areas compared with 73 per cent in rural areas. The rates are higher in East Asia — the urban rate here is 96 per cent and the rural rate 86 per cent. But they are far lower in South Asia: 90 per cent in urban areas and 60 per cent in rural areas. Only Sub-Saharan Africa has a much lower share of people connected to electricity, at 60 per cent urban rate of electrification and 14 per cent rural electrification.30
Climate change can threaten urban supplies by raising demand during heat waves. But it can also disrupt production, through reducing water for hydropower production or for cooling thermal and nuclear power plants.31 Such interrup-tions can hurt urban areas disproportionately, immobilising many vital services such as health care, education, transport and communications, and threatening livelihoods and a city’s whole economy.
PROTECTING THE POOREST RESIDENTS
Some of the advantages of concentrating people, industries and economic activities in cities result from economies of scale. This can benefit the poorest residents, the main task from a human development perspective. For instance, reducing flooding by improving drainage in small, low-lying areas can benefit less advantaged city dwell-ers concentrated in flood-prone settlements.
In many respects, city administrations should already be focused on poorer residents by pro-viding basic services, helping people gain better incomes and housing, providing sufficient social protection, and fully incorporating their voices in decision making. With this foundation, poor communities can play their part in shaping insti-tutions and directing funds so that municipal resources are equitably distributed (Box 5.3).
In the face of climate change, most poor com-munities need a far greater say in how best to manage their own environments — by engaging, for example, with city management on local planning issues and devising early-warning systems that combine rapid dissemination of
public information with effective local responses. Poor communities can protect themselves better in the short term with even small improve-ments in their living conditions. They can raise the floor levels of their homes or add higher floors, and select ‘climate-proof’ durables such as plastic furniture that is more impervious to floods.32
Defence against Disasters
Across the region, a number of cities are pro-actively integrating defences against climate change in ongoing urban development strat-egies — upgrading physical infrastructure, accessing technology and bolstering finance. In these measures, it will be important to provide sufficient incentives and boost the capacity of public institutions to protect the most vulner-able residents.
Maintaining dykes — Hanoi, Viet Nam: Hanoi lies on both sides of the Red River and its tributaries. Fortunately, even during peak flood years, the city’s dykes have never been breached. But sea-level rise could put them under much greater pressure. The city has therefore developed a comprehensive water adaptation programme. This includes strengthening dykes to protect the right bank of the Red River, while improving dyke management teams and their capacities to monitor and respond to emergencies. The programme will clear riverbeds and unlock river flows to ensure prompt flood discharge, while also building upstream water reservoirs to reduce pressures on Hanoi.33
BOX 5.3
UPGRADING SLUMS IN THAILAND
The best way to protect poor urban communities from the threat of climate change is to improve housing conditions, infrastructure and services in slum areas. Thailand has had 40 years of experience in upgrading slums and squatter settlements. This includes the Baan Mankong (secure tenure) programme, which is supported by the government’s Community Organisations Development Institute. Many other city governments also support slum and squatter upgrading. Although the experience has been varied, in many places poor communities are now much less vulnerable to flooding and extreme weather events.
Source: Boonyabancha 2005, cited in Satterthwaite et al. 2007.
In the face of climate change,
most poor communities need
a far greater say in how best to
manage their own environments

ASIA-PACIFIC HUMAN DEVELOPMENT REPORT128
Protection for some — Bangkok, Thailand: Large-scale engineering measures in the Thai capital include floodgates and embankments around the city and pumped drainage systems. During peak flooding events, as in 2006, 2010 and 2011, these measures reduced the impact on Bangkok’s city centre, but only by flooding peri-urban and agricultural lands outside the embankment and north of the city. The city still needs a solution that considers the wellbeing of less advantaged residents inside and outside Bangkok.34
Climate-linked insurance — Bangladesh: The NGO Proshika has a group-based insurance scheme that covers over 2,000 slums. Since 1997, as part of its micro-finance offerings, Proshika has transferred 2 per cent of the savings balance of its clients to an insurance fund. In the event of disaster damage to property, this fund will pay the equivalent of twice the client’s savings, while keeping his or her savings intact. In addition, Proshika offers life insurance that pays a minimum of twice a deceased client’s sav-ings. The scheme operates without re-insurance or donor support. By 2004 it covered 10 per cent of the population for property insurance, paying around US$280,000 for property losses due to cyclones, river erosion or tornadoes. It also covered 25 per cent for life insurance and had paid around US$273,000 to families of 4,448 deceased group members.35 Stand-alone schemes that rely on mutuality, however, cannot fully cover at reasonable rates risks that affect
everyone in a community. Affordable insurance for covariate climate risks will require public support.
CITY EMISSIONS OF GREENHOUSE GASES
Beyond suffering from the effects of climate change, cities are themselves adding to global warming as major emitters of greenhouse gases. Globally, cities occupy only 2 per cent of land and yet contribute more than two-thirds of greenhouse gases.36 Urbanisation changes the uses of land. By creating concrete surfaces, filling wetlands and damaging ecosystems, it reduces the planet’s ability to sequester carbon. Built-up environments are also sources of heat and undermine the capacity for water storage and recharge.37
Emissions vary from city to city, but generally the most important sources are transportation and electricity consumption. Data are unavail-able for most cities, but those for Bangkok are shown in Figure 5.6.
Power and Transport
Cities are the source of around two-thirds of the world’s energy use. Urban areas deploy energy for heating and cooling of buildings, for cooking, as well as for transport and industrial production.38 They are responsible for approximately 67 per cent of the global energy demand, mainly from coal, oil and natural gas, the main contributors to greenhouse gas emissions (Figure 5.7). By 2030 that proportion should rise to more than 73 per cent.39
Significant urban emissions come from resi-dential and commercial buildings, as a result of the power used for heating and cooling and for running appliances and office machinery. Another distinctive feature of many modern cities is the availability of electric power, and, in turn, lighting, which can keep them running practically 24 hours a day.
A high proportion of emissions — around one-third — comes from transport.40 This includes private cars, motorcycles, road freight and public transport. As incomes rise and bring ownership of private vehicles within the reach of more people, the problem is likely to get worse. In New Delhi, for example, between 1991 and
FIGURE TRANSPORTATION AND ELECTRICITY EACH ACCOUNT FOR MORE THAN ONE-THIRD OF GREENHOUSE GAS EMISSIONS IN BANGKOK5.6
Sources of Greenhouse Gas Emissions in Bangkok, 2007
Source: Bangkok Metropolitan Administration et al. 2009.
Beyond suffering from the effects of climate change, cities are themselves adding to global warming

5 BUILDING GREENER CITIES 129
2001 vehicle registrations increased around 7 per cent annually. In Chiang Mai, between 1970 and 2000, the population doubled, but the number of registered passenger vehicles increased 20-fold.41 Many of these vehicles are poorly maintained. Motorcycles, particularly the old ‘two-strokes’, are persistent sources of air pollution. The urban poor, who do not generate ambient air pollu-tion caused by privately owned vehicles (which are often owned by middle- and high-income groups), suffer more from such pollution.
A number of Asian cities now have well-functioning metro train and other public trans-port systems, although these are not affordable for everyone. Many city dwellers have to rely on buses, which operate both on CNG and diesel. These vehicles too are often badly maintained, lacking emissions regulation and inspections. Those vehicles that use diesel engines contribute significantly to both greenhouse gas emissions and ambient air pollution. In some cases, newer forms of transportation are displacing older, more environmentally friendly alternatives. In Ho Chi Minh City, for example, cycle lanes are giving way to car lanes. Some cities in Indonesia do not even have footpaths, and existing ones are often so poorly maintained that they pose a serious pedestrian risk.42
Emissions from Waste
Waste contributes around 3 per cent of global emissions.43 In Asia-Pacific cities, with rising affluence, the middle and upper classes are gen-erating increasing volumes of solid waste that are burned, producing CO2, or dumped in land-fill sites that are significant sources of methane. Poor communities also produce waste, but on a smaller scale, and they reuse and recycle a higher proportion. Since slum areas seldom have effective waste collection services, rubbish is often left to gather in areas where the poor have little voice and means to resist — along canals, for instance, or roadways, dwellings or in open ditches — which can impact the health of local residents.
The general pattern shows that the highest waste production per person per year44 occurs in select cities in the mid-income range (between US$10,000 and US$25,000 per person), fol-lowed by high-income cities (above US$29,000
per person), with low-income cities (below US$10,000 per person) producing the least amount of waste. Mid-income Asian cities such as Kuala Lumpur and Seoul report 816 and 996 kilogrammes of waste per person per year, respectively. Waste production in high-income cities in Asia shows a lower range in comparison to the mid-income cities, with Singapore reporting 307 kilogrammes per person per year and Tokyo 375 kilogrammes. Osaka is an exception, as it is in the high-income range and produces a significant amount of waste at 573 kilogrammes per person per year. Among cities in the lower-income range, Manila produces 248 kilogrammes per person per year and Karachi 229 kilogrammes.45
Links between Urban Emissions and Human Development
It might be expected that richer cities with higher levels of consumption would produce the most emissions. In the earlier stages of development, that seems to be true. Average per capita CO2 emissions in Bengaluru, for example, with a per capita GDP of US$2,066, are only 0.5 tonnes, while in Shanghai with a per capita GDP of US$11,464 they are 9.7 tonnes (Table 5.2). But once average incomes rise above a certain level — around US$20,000 — per capita emissions start to stabilise on an average. Tokyo, for example, with a per capita income of US$70,760, has per capita emissions of only 4.8 tonnes. This
FIGURE GLOBALLY, URBAN AREAS SHARE A HIGH PROPORTION OF ENERGY DEMAND AND RELATED CO2 EMISSIONS5.7
Sources of Related CO2 Emissions from Energy Demand by Source in Urban Areas as a Percentage of Total Energy Demand, 2005
Sources: IPCC 2007a, cited in World Bank 2009b; IEA 2008a, cited in World Bank 2009b.
The middle and upper classes
are generating increasing
volumes of solid waste that are
burned, producing CO2, or dumped
in landfill sites that are significant sources of methane

ASIA-PACIFIC HUMAN DEVELOPMENT REPORT130
SPECIAL CONTRIBUTION
HOW CITIES CAN LEAD EFFORTS TO TACKLE CLIMATE CHANGE
PROFESSOR TOMMY KOH
Climate change, along with the accelerated loss of biodiversity and the precarious state of the oceans, is one of the three most important environmental threats to humanity, including to its urban settlements. Yet cities are also part of the solution. At the global level, a historic milestone was reached recently. For the first time in human history, the majority of the 6.5 billion people on earth now live in urban settlements.46 In the Asia-Pacific, 42.2 per cent of our population resides in urban areas.47 By 2026, a majority of Asians will do so.48 The implication is that the future of our planet will increas-ingly be determined by what our cities do or fail to do.
In this contribution, I would like to discuss what Singapore is doing to reduce GHG emissions and to tackle climate change. I will also refer to some of the innovative policies and prac-tices that have been incorporated into the plans for a new city, the Tianjin Eco-City, which is being built by the governments of China and Singapore.
From Garden City to City in a Garden
Singapore’s ambition to be a green city goes back to the early days of its independence. In order to differentiate itself from other regional cities, the first prime minister of Singapore, Mr Lee Kuan Yew, decided to make Singapore a garden city. The anti-pollution unit, which could veto investments by pol-luting industries, was located in his office. The CEO of the National Parks Board was accountable to him. Mr Lee’s successors have raised the bar and envi-sioned Singapore as a city in a garden. It is also the ambition of the current government to make Singapore a
sustainable city and a city friendly to nature and biodiversity.
Singapore’s Commitment in Copenhagen
At the Copenhagen Climate Con-ference in 2009, the Singapore prime minister pledged to reduce our green-house gas emissions by 16 per cent below business-as-usual levels by 2020, contingent on a legally binding agreement in which all countries implemented their commitments in good faith.49 What is Singapore doing in order to achieve this target?
Reducing Vehicular Emission
One of the largest sources of GHG emissions and air pollution in cities is from motor vehicles. Singapore has some of the toughest laws in the world concerning the ownership and operation of motor vehicles. The objective is not to raise revenue, but to reduce air pollution and to keep our roads and highways free of congestion. It is also to encourage the use of public transportation. First, there is a ‘birth control policy’ on vehicles. Every month, the government fixes the number of new vehicles allowed on our roads and holds an auction for certi-ficates of entitlement (COEs). Before a person is allowed to buy a new vehicle, he or she has to bid successfully for a COE. Second, the import tax on vehicles is about 100 per cent of the value of the vehicle. Third, practically all the roads and highways of Singapore have gantries located at strategic points. When a vehicle passes under a gantry, a variable sum of money is deducted from the vehicle’s cash card. The pur-pose of this system of electronic road pricing (ERP) is to discourage the use
of private vehicles in general, and at peak hours in particular.
Green Buildings
Another initiative is to encourage green buildings. In January 2005, the Building and Construction Authority (BCA) introduced the Green Mark to recognise new buildings with envir-onmentally friendly features, such as energy efficiency. The BCA has pro-vided incentives to encourage building owners to aim for higher Green Mark standards, for both new and old buildings. The BCA has set a target for 80 per cent of all existing buildings in Singapore to achieve the Green Mark certified rating by 2030.50 Real-estate developers, architects and engineers have responded positively. As a result, almost all of the new buildings in Singapore are green buildings or have green features.
Energy Effi ciency and Renewable Energy
Apart from Japan, which is a global leader in energy efficiency, the rest of the Asia-Pacific has much room for improvement. Energy efficiency is, therefore, a low-hanging fruit that should be the number one priority for all our regional cities. One criterion of energy efficiency is energy intensity, which means the amount of energy consumed per dollar GDP. The Singapore government has announced the target of improving its energy intensity by 35 per cent between 2005 and 2030.51 In addition to energy efficiency, the Singapore government is supporting the development and use of solar energy and sustainable biodiesel. It is also encouraging the greening of the rooftops of buildings.

5 BUILDING GREENER CITIES 131
could be due to the nature of the city’s economic activities or higher population density, increasing the potential for mass rapid transport systems. Many of the richest cities have more resources to invest in greater energy efficiency and pollu-tion control. No less importantly, they also have aware citizens who can encourage the political leadership to ensure that resources are used to improve the quality of life.
Among the selected cities listed in Table 5.2, those in the mid-income range generally have high average CO2 emissions per person per year and high-energy consumption, compared to high-income and low-income cities. For example, mid-income cities like Shanghai and Guangzhou produce 9.7 and 9.2 tonnes of CO2
per person, respectively. Mid-income cities also have high energy consumption: 12.3 megajoules per US$ of GDP in Beijing and 10.5 in Nanjing. Among high-income cities, Hong Kong (SAR) produces 5.4 tonnes and Yokohama 5.2 tonnes. Many high-income cities also tend to be more efficient in their energy consumption. Singapore uses an average of 2.9 megajoules per US$ of GDP, and Tokyo 1.2. Lower-income cities gener-ally emit the lowest relative amount of CO2 per person per year: Jakarta produces 1.2 tonnes and Manila 1.6 tonnes. But they tend to be less effi-cient in their energy use. Cities like Mumbai and Karachi have an energy consumption of 6.5 and 7.8 megajoules per US$ of GDP respectively. Some cities in the low-income group consume energy at levels similar to those in some mid-income cities, however. Hanoi consumes about 9.5 mega-joules per US$ of GDP, and New Delhi 7.7.54
The Tianjin Eco-City
In 2007, the governments of China and Singapore concluded an agree-ment to build an Eco-City in Tianjin. The new town is to be built on a piece of sterile land, which is about 30 square kilometres in size and will house a planned population of 350,000.52 The vision is to build a model sustainable city of the future, which can be rep-licated and is scalable.
What are some of the special features of the Tianjin Eco-City? They include:
Adopting a green master plan from the start
Reducing carbon emission in construction, transportation and industry
Mandating green buildings Tapping renewable energy Developing an eco-conscious way
of life
When completed in 10 to 15 years, the Tianjin Eco-City will be a model sustainable city, not just for China but for the whole Asia-Pacific region.
Singapore is a city of only five million people.53 It is, however, a living labora-tory of what a city can do to reconcile economic growth with care for the environment.
Professor Koh is Singapore’s Ambassador-at-Large and Chairman of the Centre for International Law at the National University of Singapore. From 1990 to 1992, he chaired the Preparatory Committee for the Earth Summit. He chaired the negotiations at the Summit in June 1992.
TABLEPER CAPITA EMISSIONS FROM SELECTED ASIAN CITIES5.2
Asian City Country CO2 Per Capita (Tonnes), 2006–09
GDP per Person (US$),
2008–09
Energy Consumption
(MJ/US$), 2006–09
Shanghai China 9.7 11,464 14.8Guangzhou China 9.2 16,834 11.7Beijing China 8.2 10,137 12.3Osaka Japan 7.6 70,927 1.6Singapore Singapore 7.4 36,520 2.9Kuala Lumpur Malaysia 7.2 12,365 5.0Bangkok Thailand 6.7 9,095 6.1Nanjing China 5.7 7,285 10.5Hong Kong SAR China 5.4 29,991 1.5Yokohama Japan 5.2 30,212 2.4Wuhan China 5.1 8,094 10.0Tokyo Japan 4.8 70,760 1.2Taipei Taiwan, Province
of China4.2 48,400 1.4
Seoul Republic of Korea 3.7 19,597 3.2Karachi Pakistan 3.1 5,379 7.8Hanoi Viet Nam 1.9 1,740 9.5Manila Philippines 1.6 5,365 4.0Kolkata India 1.5 1,414 4.0Jakarta Indonesia 1.2 7,636 2.4New Delhi India 1.1 2,004 7.7Mumbai India 1.0 2,184 6.5Bengaluru India 0.5 2,066 4.6
Source: Based on Economist Intelligence Unit 2011.Note: Years differ from city to city from 2006 to 2009 due to data availability. Annual
GDP per person in US$ is based on current prices.
In the future, cities across Asia and the Pacific will have to be better informed about climate change and offer residents sufficient support to adapt to its effects. In the process, they will also have to take greater responsibility for reducing greenhouse gas emissions. Most city

ASIA-PACIFIC HUMAN DEVELOPMENT REPORT132
governments do recognise their environmental responsibilities for protecting human health and wellbeing — dealing with waste, for example, or air pollution or traffic congestion. They have little understanding of climate change, however. As yet, relatively few city administrators appreciate its full implications, particularly for their most vulnerable residents. And even if they do, they may not possess the institutional framework, technical capacity or governance arrangements to respond adequately.
Then there is the question of cost. Many cities lack the necessary financial resources. Not all have strong local revenue bases, and national decentralisation systems typically devolve re-sponsibilities to city administrations without giving them commensurate fiscal resources or authority.55 This skews budgeting towards immediate needs, so cities, like countries, suffer from short-term political and planning hori-zons. Further, cities may not have the autonomy to use finances based on their climate adaptation and mitigation needs, or the ability to raise local revenue to address climate-linked development challenges.
At the same time, many cities do have con-siderable autonomy and can respond to local needs and demands. Municipal leaders across the region have taken action to reduce air pollu-tion, traffic congestion and waste. While it can be difficult to reach a consensus on measures like these, they can take advantage of a number of city strengths, including the concentration of human and financial capital, well-functioning communication networks and effective media
and political pressure groups. Residents can also nudge policies in the right direction by putting city governments under pressure to provide trees, parks and clean air, and reduce congestion.
Municipal efforts are reflected in the ranking of cities on the Asian Green Cities Index. In addition to CO2 emissions, the index factors in a range of other green concerns. For 22 Asian cities, it covers eight categories: energy and CO2, trans-port, water, air quality, land use and buildings, waste, sanitation, as well as environmental gov-ernance.56 The results are not sufficiently precise to produce a detailed ranking, but they do allow these cities to be classified into three broad bands (Table 5.3).
Richer cities such as Singapore and Tokyo generally perform better than poorer cities such as Kolkata or Karachi. In the case of Singapore, the stronger performance is partly a reflec-tion of the city-state’s wealth, which it can invest in environmental protection. But it is also a con-sequence of leadership that has consistently emphasised the importance of sustainable devel-opment.57 Other important factors in Singapore have been environmentally aware residents, an integrated planning system and effective policy implementation.
TACKLING URBAN EMISSIONS
Across Asia and the Pacific, governments are starting to work with citizens on reducing green-house gases. Doing this on a large scale will involve a longer-term change in attitudes. Until then, the strategy should be to focus on initiatives that bring immediate benefits by improving the quality of urban life — through less pollution, for example, a reduction in traffic congestion, or the creation of more pleasant urban spaces. City governments can also encourage climate-friendly energy use, more efficient transport options, greener buildings and better waste manage-ment. Supported by access to technology, finance and knowledge, integrated solutions can help cities move towards a lower-carbon, climate-resilient future.
Energy Options
A high proportion of carbon emissions in cities in developing countries results from generating
TABLE THE ASIAN GREEN CITIES INDEX INDICATES THAT RESOURCES ARE IMPORTANT BUT SO IS GOVERNANCE5.3
Asian Green Cities Ranking
Below Average Average Above Average
Bengaluru Bangkok Hong Kong SAR
Hanoi Beijing Osaka
Karachi New Delhi Seoul
Kolkata Guangzhou Singapore
Manila Jakarta Taipei
Mumbai Kuala Lumpur Tokyo
Nanjing Yokohama
Shanghai
Wuhan
Source: Based on Economist Intelligence Unit 2011.
City governments can encourage climate-friendly energy use, more efficient transport options, greener buildings and better waste management

5 BUILDING GREENER CITIES 133
energy from fossil fuels and using it inefficiently. Estimates for cities are by no means precise, however, and there is no globally regulated accounting framework for urban emissions. In growing urban areas, emissions assessments that use traditional point-of-production accounting methods point primarily to the burning of fossil fuels like brown coal for electricity generation, heating, cooling, cooking, transportation and industrial production. This often occurs out-side municipal boundaries in large, centralised electricity plants, but also at local levels through burning kerosene and diesel. As urbanisation increases, energy production is likely to shift from burning biomass and waste to using emissions-intensive fossil fuels. Many cities are starting to use technologies that will cut energy use, while also exploring solar and wind sources.
A solar city — Nagpur, India: Nagpur, a city of 2.6 million people58 in Maharashtra state, as a member of Local Governments for Sustainabil-ity (ICLEI) and a signatory to the carBonn Cities Climate Registry, is committed to reporting its efforts on climate change. For this purpose, the city has prepared a report to identify the main uses of energy, developed a Renewable Energy and Energy Efficiency Policy, and presented a five-year action plan.59
In 2007, for example, the city installed solar water heating in a public hospital, and in 2008 it installed solar-powered lights in the premises of the Nagpur Municipal Council. In the same year, the city amended the bylaws mandating the use of solar water heaters in residential and commercial construction, offering a 10 per cent property tax rebate as an incentive for installing them.60
In 2008, India launched its Solar Cities pro-gramme and announced that Nagpur was to be developed as a ‘model solar city’. The aim is a 10 per cent reduction in conventional energy con-sumption from business-as-usual projections by 2013, through increasing efficiency and making greater use of renewable energy.61
Turning to methane — Rizhao, China: China’s 11th five-year plan envisaged a 20 per cent reduction in energy intensity by 2010.62 It assigned different energy targets to provinces, and in some cases subsequently to cities.63 To help meet the targets,
cities encouraged commercial and household sectors to replace energy from coal with that from lower-emission natural gas.64 Some cities have gone further. Rizhao in Shandong province has also focused on renewable energy, including electricity generation from methane gas from wastewater treatment, livestock dung and straw. It also has some solar-powered streetlights and solar water heating and cooking devices.65
Farming the wind — Hepburn Shire, Australia: Over the years, wind power has contributed sig-nificantly to electricity production in Europe and, increasingly, America. Australia is now witnessing a similar trend. In Hepburn Shire, Victoria, the local government is working with a community to develop a local wind farm. The project started in 2005 when the Hepburn Renewable Energy Association got in touch with a private company with the aim of using wind to supply a percentage of its energy needs. Now the farm has secured all the necessary planning permits. Two 2-megawatt wind turbines will be located at Leonards Hill, which will produce enough electricity for 2,300 homes, equivalent to the populations of nearby Daylesford and Hepburn Springs.66
Breezy shores — Shanghai, China: Shanghai built its first wind-power station in 2003, and by 2007 had three sites with a total of 24 mega-watts of capacity — enough electricity to power 24,000 households. Future plans are even more ambitious. By 2020, officials expect to have 13 wind farms producing a total of 2.1 gigawatts of total installed capacity, providing electricity for more than four million households. One of the largest of these is the Donghai Bridge Wind Farm. Five miles offshore in the East China Sea, it is the first major offshore wind farm out-side Europe. This US$340 million project with 34 turbines began feeding electricity into the grid in 2010. It can provide about 1 per cent of the city’s total power and, by cutting coal use, is expected to reduce carbon emissions by 246,000 tonnes annually.67
Time for a retrofit — Viet Nam: In 2000, the government initiated the Viet Nam Energy Efficiency Public Lighting Project, an ambitious and comprehensive US$15 million plan to
There is no globally regulated
accounting framework for
urban emissions

ASIA-PACIFIC HUMAN DEVELOPMENT REPORT134
install and promote the use of energy-efficient lighting in streets, schools and hospitals across the country. With support from UNDP and the Global Environment Facility, the investment succeeded in reducing CO2 emissions by 8,300 tonnes annually in three regions: Hanoi in the North Region, Quy Nhon in the Central Region and Ho Chi Minh City in the South Region. This figure will grow to 100,000 tonnes as the programme rolls out nationally. In parallel, the project is setting up a sustainable long-term lighting industry generating local manufacturing, services, jobs and expertise.68
Moving with the sun — Melbourne, Australia: Council House 2 (CH2) is a multi-award-winning and inspirational building that has reduced CO2 emissions by 87 per cent, the consumption of electricity by 82 per cent, gas by 87 per cent and water by 72 per cent. The building purges stale air at night and pulls in 100 per cent fresh air during the day. The building exterior moves with the sun to reflect and collect heat, and turns sewage into usable water. The building will pay for its sustainable features in a little over a decade.69
Reducing lighting emissions and costs — Makati City, Philippines: The city is now replacing street-lights with more energy-efficient systems that have programmable controls. Further, it is introducing more energy-efficient lighting in public buildings and modifying the duration of airconditioning.70 All of this has significantly reduced electricity consumption and GHG emissions.
Energy-efficient traffic lights — Hong Kong, China (SAR): Since 2008, the municipal government has been replacing incandescent lamps in traffic signals with light-emitting diode modules, which consume around one-third less energy and have a longer life. By 2012 it aims to replace the lamps in all 1,900 junctions. Each year this will save 7.6 million kWh of electrical energy, with a cost reduction of about US$977,000 and a reduction in CO2 emissions of 5,300 tonnes.71
More Effi cient Transport
City dwellers are heavy users of local trans-port, much of which is emissions-intensive and
contributes to urban air pollution. Emissions stem from road freight and public transport sys-tems as well as the rapidly increasing numbers of private cars. Inefficient transport systems, such as congested roads, waste time and human resources and hamper economic activity. Since wealthier people are more likely to use private vehicles, while the poor depend on public trans-port or bicycles, these problems are likely to worsen as the middle class expands.
Most city dwellers are already aware of the impact of motorised transport on the quality of the air they breathe. Now, with the prospect of climate change, they have added incentives to reduce both pollution and carbon emissions. Governments can help get more efficient vehicles on the market by setting efficiency standards, improving labelling for buyers or making public vehicles ‘greener’.72
But technological transformation can go only so far. According to the World Business Council for Sustainable Development, the best-case scenario for reducing emissions by 2050 with improved technologies would only bring the levels back to those of 2000. The issue is thus less a matter of technology than of urban lifestyles. The aim should be to reduce the kilometres driven per vehicle by building effective public transport systems and encouraging people to use public transport, cycle or walk instead of driving a car.73
E-jeepneys — Makati City, Philippines: The government-owned public transportation sys-tem is being made environmentally friendly by using low-pollution fuels and biofuels. One common form of public transport is the jeepney, a type of minibus. These are being refitted to use electricity, and are now called e-jeepneys. The city aims to reduce total GHG emissions by 20 per cent in 2010 compared to their 2003 levels.74
Award-winning buses — Ahmedabad, India: Ahmedabad’s Janmarg bus rapid transit system has received the Sustainable Transport Award from the US-based Institution for Transport and Development Policy. Stations are in the centre of the road, away from junctions, and have a passive solar design that uses the sun’s energy to keep them naturally cool. The bus system has proved very popular; it is used by around 90,000
Governments can help get more efficient vehicles on the market by setting efficiency standards, improving labelling for buyers or making public vehicles ‘greener’

5 BUILDING GREENER CITIES 135
passengers daily.75 The city has also introduced a number of sustainable transport measures, including high-quality pedestrian facilities, bicycle lanes and car-free days.76
Electric three-wheelers — Kathmandu, Nepal: Kathmandu experienced a surge of diesel-powered three-wheelers from 1989 to 1992. These vehicles produced thick black smoke and considerable amounts of noise pollution. To respond to the problem, the government banned them in 1992. This move proved somewhat ineffective, due to political differences and because the owners had little incentive not to use their vehicles.77 Strong pressure from civil society in 1999 resulted in the government offering a 75 per cent customs holiday on the import of electric three-wheelers.78 This also spurred a new local industry. By 2002, over 600 electric three-wheelers had been converted or manufactured and were running 16 routes, employing over 70 women drivers.79 Batteries are exchanged at designated charging stations — a fully charged battery runs approximately 60 kilometres.80
Recycling train energy for carbon credits — New Delhi, India: The New Delhi Metro is the first transport project in the world to be registered under the United Nations programme for dealing in the carbon market. Since 2009, it has earned INR 30,000,00081 annually in carbon credits.82 One element of this is a regenerative braking system. Whenever the trains apply their brakes, three-phase traction motors produce electrical energy that goes back into the overhead electricity lines. The regenerated power is used by accelerating trains on the same service line, saving overall energy. Officials say the braking system saved 90,000 tonnes of CO2 between 2004 and 2007. The Metro has also used flash bricks in con-struction which will save an estimated 3.9 million tonnes of CO2 in 10 years.83
Car-free days — Seoul, Republic of Korea: Seoul has a voluntary no-driving day programme through which people choose one weekday, Monday to Friday, as a day when they use alternative modes of transport. Participants are given incentives, such as a 5 per cent reduction in auto tax and a 50 per cent discount on the congestion charge. Private companies can also contribute up to
6 cents per litre discount on gasoline as well as discounts on parking and car washing. This programme has helped improve air quality, reduced congestion and saved energy. Every year, two million cars stay off the road, decreasing traffic volume by 3.7 per cent and CO2 emissions by 10 per cent — a total of 2 million tonnes of CO2.84
Reducing vehicle emissions for cleaner air — Guiyang, China: Located in a central province of Guizhou, Guiyang is an inland city that has established an Ecological Economy City Master Plan to promote urban sustainable development. The assessment for the plan found that, since the city is located in a semi-closed mountain basin, Guiyang suffers from large trapped concentrations of air pollution derived mainly from motorised transportation. The city sought not only to reduce the cost of energy consumption but also to significantly improve its air quality and reduce transport emissions. The Guiyang Public Transporta-tion Corporation undertook the reduction of 80 per cent of CO2 and 30 per cent of nitrogen oxide emissions by adapting fossil-fuel-operated vehicles that use natural gas.85
Building Green
Cities concentrate energy-intensive residential and commercial buildings while eating into green space and surrounding rural land, reducing carbon sinks and ecosystem services. This happens when the private sector responds to conventional incentives. But construction com-panies can also be steered in new directions, prompted by regulations, pressures from civil society and shifts in consumer demand for more sustainable buildings that may even increase property values. Efforts to expand green spaces in cities could be no-regret initiatives that sup-port not only carbon sinks but also healthier lifestyles and greener surroundings, as well as boosting productivity. Municipalities can reduce emissions from buildings by mandating min-imum energy efficiency standards as part of building codes and standards. They can also demonstrate leadership by ensuring that all municipal buildings achieve high levels of energy efficiency, which will also encourage private developers to take similar initiatives.
Efforts to expand green spaces in
cities could be no-regret initiatives
that support not only carbon
sinks but also healthier lifestyles
and greener surroundings

ASIA-PACIFIC HUMAN DEVELOPMENT REPORT136
Constructing green homes — Pune, India: Real-estate developers in Pune are building more eco-friendly green homes and commercial buildings. This can involve, for example, using fly-ash bricks, solar energy, light-emitting diode (LED) lights, external paints that reflect heat and reduce the need for cooling, recycled water, and minimal timber. Many also plant trees at the site at the beginning of the project so that by the time it is ready, there is green cover in place. When the buildings are certified as green by the Ministry of the Environment, owners get reduced property taxes.
According to builders, people do not specif-ically ask for green buildings but, if the benefits are explained, they do appreciate them. These include, for example, using up to 30 per cent less energy than conventional buildings, and up to 50 per cent less water. While this increases the building costs by up to 8 per cent, this can be paid back in less than five years. They also point out that making greater use of natural daylight and offering better outside views is not only more pleasant but also boosts productivity.86
Labelling condos — Tokyo, Japan: All newly con-structed large buildings in Tokyo are subject to the Tokyo Green Building Programme. Requiring ratings of environmental perform-ance and disclosure of environmental plans for buildings, the programme aims to create a greener real-estate market.87 Since 2002, more than 1,300 buildings have been covered. Add-itionally, from October 2010, the Tokyo Green Labelling System of Condominiums requires all new residential buildings with a floor space of more than 5,000 square metres to display a record of environmental performance when renting or selling apartments.88
The world’s greenest skyscraper — Guangzhou, China: The 71-storey Pearl River Tower in Guangzhou is positioned to be the world’s largest zero-emission building.89 Around 4 per cent of the building’s energy will come from wind power, taking advantage of the building’s curved design, which funnels wind towards turbines. On the roof, solar panels power automated window blinds that reduce the impact of the sun. The building also has a skin with an air gap that traps heat; the warm air then rises and is harvested in
heat exchangers. This allows for a much smaller airconditioning system that makes the whole building more efficient. In addition there is a rainwater collection system, combined with solar panels, to provide warm water.90
Green buildings — Singapore: An Inter-ministerial Committee on Sustainable Development was set up in 2008 to formulate a national strategy for sustainable development. This included Green Mark Certification to evaluate the environ-mental impact and performance of buildings. According to their improvements in energy usage, buildings may be awarded gold, gold-plus or platinum ratings. One of the aims is to have 80 per cent of existing buildings achieve at least a Green Mark Certification rating by 2030. The government will also introduce minimum energy performance standards for household airconditioners and refrigerators.91 With the growing population density in the city, however, there is support for putting more urban-quality physical infrastructure and social services into less populated areas, and correspondingly bring-ing many more rural characteristics, such as green public spaces, into the city-state, promoting the idea of ‘ruralisation’.92
Better Waste Management
City dwellers confront the consequences of con-sumption most directly in the form of piles of waste. These are growing rapidly in Asia and the Pacific with the expansion of the middle classes and the greater use of consumer packaging.
Resulting greenhouse emissions depend not just on the volume of waste, but also on the sys-tem of waste management. Municipal authorities are responsible for waste collection and man-agement, even if they contract this out to private agents. Unfortunately, the predominant disposal method is still open dumping; in cities such as Jakarta, there is often open burning of domestic and industrial waste.93 Waste management tends to improve when cities possess and allocate more robust financial resources, and develop more responsive and efficient waste management insti-tutions. Cooperation from residents, for instance, through recycling, is an important contribution.
Urban waste management programmes should also take responsibility for changing
Waste management tends to improve when cities possess and allocate more robust financial resources, and develop efficient waste management institutions
5 BUILDING GREENER CITIES 137
public attitudes and behaviour, asking commu-nities to reduce, reuse and recycle, while making sure that facilities exist to deal appropriately with different types of waste. Across the region, many cities are now tackling the problem through more efficient disposal.
Much greater attention also needs to be paid to the slum areas of cities, which are poorly sup-plied with waste collection services. Even though the poor generate less rubbish, waste may be left to accumulate in canals, along roadways and in open ditches, which leads to significant health issues for surrounding residents. Some cities generate income from payments for waste col-lection and recycling, though there is a risk that this may penalise the poor and deter them from using these services.
Following the flow — Bangkok, Thailand: To com-bat illegal waste dumping, Bangkok’s Industrial Works Department is using a global position-ing system (GPS) to track garbage shipments. Costing US$650 per truck, this allows both the department and the companies that produced the waste to confirm whether it has been disposed of properly.94 Such monitoring has also raised the awareness of waste producers and prompted them to consider what portions they might recycle. And it has also allowed scientists to better understand waste flow.
Pay as you throw — Taiwan, Province of China: Taipei city has a long-standing ‘pay-as-you-throw’ waste charge. Through the Extended Producer Responsibility scheme, manufactur-ers or importers of certain goods pay fees that the government uses to subsidise collection and recycling. These goods include containers, batteries, cars, motorcycles, tyres, oil, televi-sions, refrigerators, airconditioners, washing machines, computers and printers. Designated retailers must take back from consumers items that have reached the end of their life. Residents pay waste collection and treatment fees through the purchase of special trash bags approved by the Taipei city government. If they separate out recyclables, the city collects these free of charge. Taichung city and Kaohsiung city, on the other hand, fine residents who do not separate recyclables from their trash. These programmes have resulted in a significant reduction in
municipal waste.95 Per capita waste collected per day dropped from 1.14 kilogrammes in 1997 to 0.58 kilogrammes in 2007.96
Converting waste to energy — Quezon City, Philippines: Quezon City occupies around a quarter of Metro Manila and has a population of 2.7 million. In 2008, the city started capturing methane from a landfill site and converting this to electricity. The Controlled Disposal Facility Biogas Emission Reduction Project was financed by an Italian company and has been registered with the Clean Development Mechanism. Thanks to this project, CO2 emissions have been reduced by 116,000 tonnes per year while generating 42 MW of clean energy. This scheme has also created local employment for both construction and operation.97
Waste as a concern and a solution — Dhaka, Bangladesh: Waste Concern, an NGO, is helping reduce emissions in several cities by composting solid waste instead of burning it and selling it to fertiliser companies. Waste Concern engages local residents to collect solid waste from house-holds in rickshaws and deliver it to one of five processing plants located on land donated by the Dhaka municipal authorities. At the plant, workers separate out organic waste, which is then composted to produce enriched bio-fertiliser that is sold to fertiliser companies for national distribution. So far, Waste Concern’s model of managing waste in Bangladesh has reduced more than 18,000 tonnes of CO2 emissions each year and generated 414 new jobs for the urban poor, especially women. This programme has also been extended to other countries, including Sri Lanka and Viet Nam.98
READYING URBAN INSTITUTIONS
Urban institutions are not usually designed to address climate change. Nevertheless, a number of Asia-Pacific cities have been aiming to improve urban living conditions by promoting sustained economic wellbeing and social development for their residents. They thus have the potential for drawing together a number of interconnected threads that can help build climate resilience based on local circumstances. Focusing on climate change offers institutions useful entry points
A number of Asia-Pacific cities have been aiming to improve urban living conditions
by promoting sustained economic
wellbeing and social development for their residents

ASIA-PACIFIC HUMAN DEVELOPMENT REPORT138
SPECIAL CONTRIBUTION
THINKING GLOBAL, ACTING LOCAL: MAKASSAR CITY’S QUEST FOR CLEAN AIR AND GREENING URBAN DEVELOPMENT
ILHAM ARIEF SIRAJUDDIN, MAYOR OF MAKASSAR
Dubbed as the ‘pearl of the East’, also known as Ujung Pandang, Makassar is Indonesia’s bustling port city located on the southern tip of Sulawesi Island. With a rich culture and heritage dating back to the 16th century, a population of over 1.3 million and approximately 175 km2 in area, it is the largest city in central and east Indonesia and arguably one of the most important commercial hubs in the country. While Makassar’s rapidly growing economic activities and coastal location are making valuable contributions to the country’s economy and providing employment opportunities, they are also exposing its residents to a large array of pressing environmental problems which threaten to undermine further human development and the quality of life for the city’s residents.
Expansion of economic activities, growing waste and inadequacy of green spaces are major factors contributing to air and other pollution. At the same time, the city’s coastal location and low-land areas expose it to climate variations, such as flooding and storm surges, making the city vulnerable to climate-induced shocks. The growing human footprint and Makassar’s geography together make the city a very significant site for environmental concerns, which also impact people’s livelihoods and wellbeing.
Since 2006, however, things started to change as environmental concerns became progressively integrated into the very heart of urban and com-mercial development of Makassar’s development planning. As a result, Makassar has built a reputation as a green city that promotes cleaner air and greener lifestyles. In 2007, the city received the Blue Sky Award from the Ministry of Environment, and in 2011, the Association of Southeast Asian
Nations (ASEAN) Environmentally Sustainable Cities Working Group awarded Makassar a Certificate of Recognition for its efforts in combating air pollution. How did these changes take place?
GREENING THE CITY FOR CLEANER AIR
Clean air is more directly understood and valued by city residents, and can be a practical entry-point for addressing climate change, a more remote and abstract concept to the general public. Makassar realised that as the city grew, reliance on on-shore winds alone to improve air quality would not suffice. Air quality is greatly aided by trees, which play an important role in air purification. In 2006, Makassar enacted a spatial planning regulation which established 13 integrated economic zones and aimed to increase the size of public green spaces. The ‘one house, one tree’ programme launched in the same year encouraged households to plant at least one tree per house. Combined with improved town planning, these measures have helped to increase green spaces in Makassar. In 2011, the city planned to set aside five urban areas to be converted into ‘urban forests’ or green spaces for the benefit of local communities and to act as the ‘lungs’ of the city. By early 2012 Makassar had almost 10 per cent of urban green space compared to just about 3 per cent in 2004. While still below the official target of 30 per cent (documented in the Ministerial Regulation of Public Works No. 5/2008), it is an important step in the right direction.
As part of Makassar’s town planning, the Karebosi sports centre, a common space for city residents, was revitalised by developing a commercial district
below it. This helped promote eco-nomic activities as well as maintain sufficient green spaces and water catchment areas, while reducing air pollution. The city’s environmental agency has also been successful in reducing vehicular emissions by conducting annual exhaust emission checks for private and commercial vehicles. These sets of city policies show how commercial development could be pursued in tandem with environmental considerations.
ADDRESSING CLIMATE CHANGE
As a waterfront city, Makassar is highly susceptible to seawater inundation, especially in the old quarters where rows of historical buildings and shop houses dot the coastline. In 2004 the city introduced a project to overhaul the waterfront area, called the Losari coast. This not only proved to be popular, but also increased the city’s resilience to climate change. In addition to a cleaner waterfront, with wide pedestrian side-walks and shady trees, Losari has been equipped with stronger walls and wave barriers to guard the area from high waves and sea-level rise, especially important during the stormy season. Losari is now referred to by other coastal cities in Indonesia as a prime example of how to mainstream climate change adaptation into urban planning and prepare for future climate-induced disasters. The area has now become a popular shopping area for tourists and locals alike, bringing much needed economic benefits to the local community, in addition to increased resilience against flooding and other climate change risks.
Even though constrained with limited budgets, Makassar carried out several mangrove-planting schemes

5 BUILDING GREENER CITIES 139
for addressing a variety of urban development issues in a synergistic fashion, such as traffic congestion, deteriorating air quality, deficient water and sanitation, mounting waste, repeated flooding, variable electricity supplies and the expansion of slum areas. One of the principal tasks will be to combat vehicle-induced urban sprawl as developers move to outer urban areas. Pervasive corruption is a challenge that can undermine projects designed to climate-proof infrastructure.
Urban governance structures can adapt to address the intertwined challenges of climate change and the quality of urban life. New sources of finance need to be accessed wherever costs constitute a barrier. Knowledge cannot be taken for granted, given the many interest groups with a stake in the status quo. Building awareness based on access to accurate information is important. Many positive examples can emerge from city-to-city exchanges of ideas and experiences.
Strengthening Urban Governance Structures
Governance systems are typically multi-level, starting with central government autonomous
municipal corporations and ranging across a wide array of local bodies such as districts, regencies, prefectures, cantonments and neighbourhood councils. Municipal authorities are usually governed by charters that specify their objec-tives, territorial scope, structure and functions, including, more recently, those related to climate action.99 As urban environmental challenges related to climate change often originate from outside the city, it is vital to work in coordin-ation with international, national and provincial institutions. Improving urban governance and deepening democratic processes will also be essential. This requires a number of reforms, including the following.
Decentralising Environmental Management
Local authorities for environmental manage-ment should go beyond services for water and sanitation. This will mean not just transferring administrative responsibility to local authorities, but also devolving more power so that they have the financial resources to act decisively on urban planning and climate disaster management.100 This will enable city governments to raise much needed funds and set policy agendas on
along the city’s rivers and coast-lines. Amounting to approximately a third of the 32 km coastline in the north, and substantial stretches on the Tallo — the main river running through Makassar — the mangrove-planting project was initiated in 2006 through a city regulation on spatial planning and provided with an annual budget. Mangroves are extremely important for healthy ecosystems and socio-economic development, while protecting the coast from floods, sea-level rise and coastal erosion. Through this project, specifically in the north coast, mangroves were planted in the Untia fishing village which was suffering from serious coastal erosion.
On climate change mitigation, Makassar is contributing to the abatement of greenhouse gas emissions by hosting a UNFCCC-endorsed
Clean Development Mechanism (CDM) project at Tamangapa, one of the city’s major industrial landfill sites. Industrial landfills frequently pro-duce methane emissions contributing significantly to climate change, given methane’s large global warming po-tential compared to carbon dioxide. The CDM project, in partnership with the project developer, installed a methane gas collection system and flaring facility which destroys the methane gas and utilises some of the collected gas to generate electricity. The initiative provides an alternative source of energy, and helps to reduce greenhouse gas emissions.
In the 16th century Makassar was Sulawesi’s major port and was known as a global centre for spice trading. The Makassar government now envisions bringing the city back to its golden era as a global trading hub, while addressing
environmental concerns and climate change challenges. Traditionally, the local people of Makassar, the Bugis, have had a great affinity with nature. Hence, respecting the environment has always been an integral part of the local culture and wisdom, even before scientists coined the terms ‘sustainability’ or ‘climate change’. With strong political will and local wisdom, Makassar can become a truly sustainable city.
Ilham Arief Sirajuddin was member of the Provincial Parliament from 1999 to 2004 before being elected as the Mayor of Makassar city in 2004. He was re-elected for a second period from 2009 to 2014. Born in Makassar, he has himself been a city resident for most of his life. He has a master’s degree in Management.
Urban governance structures can
adapt to address the intertwined
challenges of climate change
and the quality of urban life

ASIA-PACIFIC HUMAN DEVELOPMENT REPORT140
climate change.101 In Bangkok, for example, being designated as a special local administrative organisation, the Department of Drainage and Sewerage (DDS) is directly responsible for flood control and has established a flood control centre and an operational centre for solving flood problems. Officials of the department have clear responsibilities and the authority to make and implement decisions. This level of decentral-isation aided by new technology is improving the quality of work and the department’s ability to respond to citizens’ needs.102
Building Accountable and Transparent Systems
When dealing with waste disposal, disaster risk reduction, urban planning, social and other services, citizens should be supported by legis-lation and administrative systems that uphold their right to information and ensure access to grievance procedures. Local media and jour-nalists interested in climate change should be free to hold local authorities to account and high-light issues for communities.103 It is important to agree upon ethical standards of behaviour and performance for holders of public office, so as to reduce corruption and ensure that they make industries comply with environmental standards.104
Enduring and Inclusive Stakeholder Participation
Given the uncertainties about the precise impacts of climate change and the need to ensure proper coordination, city and central governments need to ensure sustained local participation, particularly from excluded vulnerable groups such as the urban poor. Communities need to have sufficient information and be involved in the formulation, implementation and evalu-ation of policies and strategies — when it comes to moving households living in dangerous locations, for example, or choosing the site for waste treatment plants. Such discussions need to take into account divergent concerns and address vested political and economic interests, while challenging the view that climate change is too large and remote and beyond local means and influence. Surat city in Gujarat, India, for example, has an urban development plan founded upon broad-based consultations that incorporate the views of vulnerable residents. As part of
devising the City Development Strategy, which involved municipal councillors, civil society organisations and the poor, 12,000 forms were circulated to capture public inputs. The Indian Centre for Social Studies generated a report dealing with slum issues like infrastructure, social service provision and quality of life. Under Gujarat’s town planning law, a copy of the draft development plan must be available for public inspection, and suggestions and objections must be appropriately reflected.105
Responding to Emerging Developments
Climate change can bring surprises. Govern-ance systems thus need to be sufficiently flexible to respond to unanticipated events, including keeping enough fiscal space in reserve to deal with unexpected future risks. This could also involve establishing a cross-government body dedicated to tackling the potential and actual impacts of climate change. Da Nang city in Viet Nam offers a good example of this. The country’s third largest city, it is located on the South China Sea coast, mid-way between Hanoi and Ho Chi Minh City. Its Integrated Coastal Management Plan was begun due to conflicts arising between rapid urbanisation and industrialisation and the conservation of coastal resources. Involving extensive stakeholder consultations, the plan has successfully demonstrated the potential of inter-agency cooperation and of raising awareness about the need to ensure effective coastal management.106
Access Innovations in Urban Finance
Who will bear the costs? Climate change strat-egies will require significant national sources of finance — both public and private — including revenue raised through budgetary and user-pay means. External donor agencies can also make funds available to complement national and local sources of funding.
Allocating these resources in an equitable fashion will require the active involvement of individuals, communities, interest groups, civic institutions and non-government organisations. Some of the costs will also have to be borne by urban dwellers, especially those who contribute most to greenhouse gas emissions through more energy-intensive lifestyles.
Who will bear the costs? Climate change strategies will require significant national sources of finance — both public and private

5 BUILDING GREENER CITIES 141
Cities can also consider innovative market-based mechanisms. One option is a local cap-and-trade system — issuing capped emission allowances to enterprises and then allowing them to trade these permits. Internationally, cap-and-trade schemes have faced some controversy and have yet to take off at the national level in Asia-Pacific, often meeting with stiff opposition from businesses who feel it may harm their ability to compete effectively in the global marketplace. Cap-and-trade initiatives can also be questioned for exploiting unbalanced bargaining cond-itions, by allowing the emitters to continue to emit by trading with those who are often at a lower level of development. Local schemes in urban areas may be more feasible when both sides of the transaction come under the same political and fiscal unit.
In April 2010, Tokyo, Japan, introduced its own cap-and-trade system, the first in Asia and the Pacific. Buildings that consume more than the crude oil equivalent of 1,500 kilolitres of energy annually will have to cut CO2 emissions by 6 to 8 per cent.107 The aim is to slash emis-sions overall by 25 per cent from 2000 levels by 2020.108 Businesses can fulfil their obligation by buying credits from other businesses that have met reduction targets.
Cities can also tap into the Clean Develop-ment Mechanism of the Kyoto Protocol. The CDM supports projects in developing countries that reduce carbon emissions, which can then be awarded carbon credits that can be sold to developed countries.
Sharing Knowledge to Raise Awareness
Cities around the world are gaining more experience with climate change and can share this with those who are starting later, such as ideas on overcoming barriers and bottlenecks. Public officials can draw on South–South and triangular exchanges with other cities, network across government departments, learn from the disaster management community and better integrate the work of climate scientists.
Civil society can act as a two-way channel, offering feedback about the performance of climate policies and the need for any changes. This can involve individual citizens, interest groups and communities, together with civic
institutions, the academic community and non-governmental organisations. All can work to identify community needs and guide govern-ment climate policies and strategies, while also becoming involved in monitoring and evalu-ation. Through advocacy and involvement in local climate campaigns, elected mayors, influ-ential members of communities and youth can also lead by example and inspire people to adopt sustainable lifestyles.
Eco-clubs — New Delhi, India: New Delhi’s envir-onment department has been engaging youth and schoolchildren through eco-clubs. Children take part in a variety of projects, including water conservation, tree planting and creating nature trails, as well as schemes to cut waste. A further benefit of these clubs is that they inform fu-ture generations about the city’s environmental campaigns, which include attempts to reduce pollution from firecrackers during the annual celebrations for Diwali.109
Raising awareness on water scarcity — Tuvalu: Tuvalu is a member of the 13-country Pacific Adapta-tion to Climate Change (PACC) Project, with a focus on water resource management. Each year around World Water Day, the government organises a week-long awareness-building pro-gramme. This has included taking children on field trips to see adaptation measures, such as a desalination plant for use at times of prolonged drought. Measures for water conservation in-clude large storage tanks and composting toilets known as ‘Falivatie’, which means ‘house that doesn’t use water and is good for the envir-onment’. The Composting Toilets measure is jointly coordinated by the PACC project of the Secretariat of the Pacific Regional Environment Programme (SPREP) and the Integrated Water Resources Management Project of the Pacific Islands Geosciences Commission.110
Engaging citizens — Makati City, Philippines: Makati City has two strong institutions for action on flood management — the Makati City Disaster Coordination Council and the Makati City Environmental Protection Council.111 The city also has several programmes to improve public awareness and encourage people’s participation in climate change management. Public awareness
Public officials can draw on
South-South and triangular
exchanges with other cities

ASIA-PACIFIC HUMAN DEVELOPMENT REPORT142
programmes target different groups, including youth, schoolchildren, families, shop owners and open-air vendors. Other public awareness programmes include Environment Month, Earth Day and Earth Hour.
Cities Working Together
While many cities have made impressive strides on their own, climate change presents a trans-boundary challenge to urban stakeholders. Cities can benefit from sharing knowledge and cooperating more widely across borders. Since the early 1990s, cities around the world have been working across borders to address climate issues through a number of groups including ICLEI, the Asian Cities Climate Change Resilience Network (ACCCRN), the Cities and Climate Change Initiative (CCCI), Citynet and the C40 climate leadership group. These initiatives enable South–South collaboration along with city twinning programmes aimed at knowledge, advocacy and technological exchange.
In 2009, during the climate change negoti-ations in Copenhagen, these groups organised a Climate Summit for Mayors, which was attended by representatives from 79 cities — a total of 500 people. At this summit, the mayors of Dar es Salaam, Jakarta, Mexico City and São Paulo became founding members of a new Mayors’ Task Force on Climate Change and the Urban Poor, chaired by the Mayor of Mexico City. The task force prepared a study on climate change, disaster risk and urban poverty in Dar es Salaam, Jakarta, Mexico City and São Paulo, which it
presented at the C40 biannual conference in Sao Paulo, Brazil, in May 2011.112 The study high-lighted the fact that the urban poor in all four cities were particularly vulnerable to climate change, with their heightened exposure to risk exacer-bated by their living conditions, lack of adequate infrastructure and social services. While signifi-cant financial support to address these risks is still needed, municipal governments were seen as critical to ensuring basic social services and building resilience in cities, for instance, by incorporating climate risk reduction actions into overall urban management.113
ALTERING THE COURSE OF URBAN PROGRESS
The Asia-Pacific region has every reason to be proud of its cities as centres of economic, pol-itical and social leadership. But in the future, they are also likely to be among the world’s largest emitters of greenhouse gases. At the same time, urbanisation and the continued growth of cities, especially in developing countries, have led to the emergence of highly vulnerable urban communities, particularly those living in informal settlements.114 In order to adapt to cli-mate impacts, these communities will require concerted support from both public and private institutions.
Asia-Pacific cities now have an opportunity to alter the course of urban development. They should be able to capitalise on the latest techno-logies, improve their systems for governance and finance and work cooperatively to move in lower-carbon, greener directions.
Asia-Pacific cities now have an opportunity to alter the course of urban development

5 BUILDING GREENER CITIES 143
In addressing climate change, cities should protect and improve conditions and opportunities for their poor and vulnerable communities. They should also work with their partners and residents to make their habitations more liveable and help people to adapt through addressing emissions of greenhouse gases.
Specific measures include:
Support the urban poor and vulnerable: Invest in initiatives to climate-proof city infrastructure, making residents safer and helping them to adapt, especially in slums and vulnerable areas. This can include improving drainage, water and sanitation systems, food and electricity supplies and other social services Cities should also develop warning systems and help people to ‘build back better’ from climate disasters by supporting disaster insurance and other mechanisms that promote resilience.
Explore renewable energy sources: Shift from fossil fuels to more efficient green energy sources Utilise technologies that will cut energy use, while also exploring solar and wind sources.
Promote green buildings: Steer companies in new directions through regulations, pressure from civil society and shifts in consumer demand Municipal governments should mandate minimum energy-efficiency standards for buildings.
Invest in public transport and improve vehicle efficiency: Set efficiency standards for vehicles, improve labelling for buyers, change public vehicles towards ‘greener’ cars and monitor the implementation of these measures Encourage people to use public transport, cycle or walk instead of driving cars through incentives such as building bicycle ways and establishing reliable and accessible public transportation systems. Taking advantage of renewable energy sources and better public transport can reduce the need for private cars.
Address waste management: Tackle waste through more efficient disposal, which reduces the production of CO2 and methane Encourage recycling, which can cut emissions associated with manufacturing.
Promote effective city institutions: Give municipal governments commensurate fiscal resources and authority, capacity and autonomy to use financial resources and raise local revenues Enable poor communities to manage their own environments — by engaging city management in local planning issues and devising early-warning systems that combine rapid dissemination of public information with effective local responses.
Tap into innovative financing mechanisms: Explore financing projects that reduce carbon emissions in cities Enterprising cities can investigate the feasibility of cap-and-trade programmes, award carbon credits from city businesses that have reduced their emissions, and identify ways of raising local revenue.
Enable city residents to make changes in their daily lives: Help city residents make more informed choices through greater knowledge of energy use, transport, buildings and waste, and in the process take greater responsibility for reducing greenhouse gas emissions Heighten awareness about climate change through, for instance, the use of influential climate champions and citizen involvement, and offer residents, especially the poor and the vulnerable, sufficient protection and support.
Encourage cities to work together: Support forums, experience sharing and South–South exchanges of knowledge and experiences of urban climate change issues Enable cities to collaborate on issues that would benefit from regional cooperation.
ACTIONS AT A GLANCE


PLANNING FOR THE PLANET
6

Each bay, its own wind.
Fijian saying

6 PLANNING FOR THE PLANET 147
PLANNING FOR THE PLANET
The Asia-Pacific region has taken long strides in boosting economic growth and reducing poverty. Several countries in the region have graduated from low- to middle-income country status. But the region continues to be home to about two-thirds of the world’s poor, constituting nearly 900 million people who still live on less than PPP $1.25 per day.1 Many disadvantaged groups have been left behind in the face of growing inequality.
At the same time, it is clear that much of the world’s growth has been at the cost of environ-mental degradation. Now there is the issue of climate change, which is threatening biodiversity, ecosystems and natural resources in Asia-Pacific, with negative impacts on people’s livelihoods and wellbeing. Although climate change affects everybody, it will have the most serious effects on the poor and more vulnerable groups. Climate change does not result in just another weather disturbance — current scientific knowledge may be inadequate to anticipate fully its most damaging implications, many of them poten-tially irreversible. Managing some threats may prove particularly challenging because they cross borders, both within and between countries.
How can the emerging economies of Asia and the Pacific tackle poverty and inequality in a time of climate change? Many countries are already starting to respond. Instead of simply putting profits before people, they have begun to address the environmental and social impacts of economic growth, backed by demands from their citizens. Now countries have to factor in the concentration of greenhouse gases (GHGs) in the atmosphere, as not doing so could have national, regional and global repercussions. Shifting emissions across borders, which cross-border trade enables, only changes the location of the emissions — as when manufacturing
produces emissions in one location, but products are consumed in another.
‘Unfinished’ development agendas can make climate dilemmas more complex, suggesting a choice between growing or cutting emissions. But they provide opportunities too — unlike the developed world, countries of the developing Asia-Pacific are much less locked into the old, carbon-intensive ways of production and consumption. Asia-Pacific not only has the imperative, it also has the opportunity to manage development differ-ently, including through reduction of carbon intensity and promoting inclusive growth. With industrial economies such as Australia, Japan, Republic of Korea and Singapore, large and rapidly growing ones such as China and India, as well as the least developed countries such as Bangladesh, Lao People’s Democratic Republic or Kiribati, there is enough diversity and scope to join forces and bene-fit from complementarities within the region.
The cross-border nature of many environ-mental challenges associated with climate change also calls for regional and international cooperation. As recognised in the 1992 Rio Declaration from the UN Conference on the Environment and Development, ‘environ-mental measures addressing transboundary or global environmental problems should, as far as possible, be based on an international consensus’. This will mean a fuller account of the interplay between material prosperity and climate change within and across countries. It will not be easy. Inevitably, there will be trade-offs, winners and losers, making consensus harder.
For all countries, managing development differently will require open and honest debate. This requires acknowledging and grappling with the wide gaps — geographic, social, eco-nomic and political — between the highest emit-ters and the most vulnerable people. It needs to
While they continue their efforts to reduce poverty, countries across Asia and the Pacific also have to plan for climate change. This will involve making vulnerable people far more climate-resilient, while simultaneously stabilising overall greenhouse gas emissions. Specific measures can be taken by governments, the private sector and civil society, and also by people in their daily lives.
6
Current scientific knowledge may be inadequate to
anticipate fully its most damaging
implications, many of them
potentially irreversible

ASIA-PACIFIC HUMAN DEVELOPMENT REPORT148
be recognised that, with inadequate accounting for emissions, emitters do not always bear the full costs of their actions, a situation complicated by inadequate means to cover costs or ensure compensation. Some of the bottlenecks are as follows.
Institutional Mismatch
The basic unit of governance remains the nation-state, while climate change is borderless. Domes-tic control over climate change is also limited by globally interlinked economic and ecological value chains. Moreover, democratically elected governments tend to have limited time horizons, which reduce their incentives to focus on long-term issues. International mechanisms can get locked into a ‘rich country’ vs ‘poor country’ dichotomy.
Slow Changes in Attitudes
People will have to rapidly re-examine and modify old ways, which is harder than adjust-ing more slowly. There can be understandable reluctance to change familiar ways of doing things. Some people may consider climate change to be an issue far removed from their lives. Or they may see global warming as inevitable and do nothing. Public opinion can also be deceived by corporate ‘greenwashing’ — intensifying green rhetoric rather than adopting environmentally sound practices.
Inadequate Assessment Tools
National data systems are unsuitable for tracking a cross-border phenomenon in which producers and consumers are geographically dispersed. Official data systems have yet to consider alter-native tools like tracking emissions by con-sumption groups, or by rich and poor people, rather than by countries.
The world cannot turn back the clock or aim unrealistically for zero emissions. It should not assume that merely shifting the location of the problem will make it go away. Emissions will be inevitable from many essential human activ-ities. In particular, it is not reasonable to deny poor people the opportunity to improve their living standards and consumption levels. But consumption as a whole, within nations and
across the world, needs to be more balanced and sustainable, taking into account environmental concerns. Societies need to focus less on emis-sions per se, and more on managing them for humanity to survive and thrive over generations through inevitable change. This requires not just clean energy but equitable access to energy, not just conserving trees but securing livelihoods, not restricting mobility but enabling transport for all.
The time for tinkering at the margins is over. A fundamental rethink needs to take place, based on a shared recognition that the planet’s natural resources are not free or inexhaustible. This may involve voluntarily conceding some aspects of sovereignty while also strengthening participa-tion in decisions affecting the shared good of humanity. Change has to be based on principles of fairness and equal access, and must not be at the expense of the planet we all share. The world needs human development that is sustainable, equitable and efficient as well as participatory and empowering. Policies, projects and programmes should be analysed from a human development and poverty perspective to ensure that the con-cerns of the poor are central, and that any actions taken do not make them more vulnerable.
Institutions of Governance
Changes can start by candidly assessing the suit-ability of existing institutions to address climate change challenges in the process of development.
Reviewing International Mechanisms
International governance mechanisms covering intellectual property rights (IPRs) that influence technology transfer will need to take into account the public good, as against solely commercial gains, in order to provide broader access to clean energy technologies (CETs). International cooperation is needed to ensure that protections of IPRs are balanced with measures to prevent abuses of rights to access. The World Health Organization, in its 64th World Health Assembly, proposed a new mechanism based on international coop-eration and transfer of technology on equitable terms for pandemic influenza preparedness, sharing of influenza viruses, and access to vac-cines and other benefits.2 This demonstrates the
With inadequate accounting for emissions, emitters do not always bear the full costs of their actions; domestic control over climate change is limited by globally interlinked economic and ecological value chains

6 PLANNING FOR THE PLANET 149
potential and possibility of cooperative inter-national action; similar approaches can be extended to other areas of public good, including environmentally sound technologies.
Within the World Trade Organization (WTO), the agreement on Trade-Related Aspects of Intellectual Property Rights (TRIPs) needs to be revised to enhance the diffusion and transfer of technology. The TRIPS context has changed dramatically, and requires a comprehensive review to facilitate development. Similarly, the World Intellectual Property Organization (WIPO) could act in ways that further promote IPRs for sustainable development — which is also a part of its mandate.
Enhancing Policy Coherence
In most countries, ministries of energy and environment are separate and have distinct agendas, and often face divergent demands and pressures. It may be time to have the same min-ister responsible for both energy security and environmental management to improve policy and administrative coherence. The ministry could then ensure stronger adaptation to climate change, addressing issues such as energy access, carbon sequestration and cleaner fuels in a more coordinated fashion.
Improving Policy Coordination
Policies on the management of ‘free’ ecosystem services, energy use charges and subsidies, and other fiscal policies that influence incentives for the use of energy are generally set by ministries of planning, finance or energy. In future, they will need to coordinate their activities better with ministries of the environment as well as with local governments, while also institutionalising the links between poverty reduction and adap-tation. For shared ecosystems that are spread across national boundaries, it will be important to ensure coordination between neighbouring countries.
Empowering Local Authorities
If they are to respond better to climate change, local institutions will need stronger capacities, both financial and managerial. More effective planning and decision making should enable local administrations to articulate priorities for
adaptation and infrastructure. They can also manage emissions: in cities, for example, muni-cipal authorities may be able to take far more pro-gressive positions than national governments and also draw ideas from other cities through regional cooperation.
Strengthening Social Protection
Some of the most serious impacts of climate change will fall on the poor. They should there-fore be able to rely on stronger systems of social protection that can provide a buffer against climate impacts and help them smooth produc-tion and consumption fluctuations in the pro-cess of finding better ways to adapt. Governments should ensure that existing schemes of social pro-tection, which include insurance, are genuinely sensitive to climate vulnerability. They should institute new instruments where none exist or where available provisions are inadequate. Simul-taneously, fiscal space needs to be identified, sup-plemented by external funds, for rapid scaling up of support in times of need. This should go hand in hand with programmes for reducing poverty and supporting quality employment as part of building resilience.
Deepening Democracy
Going beyond electoral politics, deeper and wider participation is needed that extends bey-ond parliaments to the larger civil society, where climate change issues can also be debated by competitive media, for example, and social networks. Since populist politicians following short-term electoral cycles often resist the tougher regulatory policies needed to tackle longer-term climate change, some opinion leaders have proposed more authoritarian forms of govern-ment or even decision making by ‘experts’. But what is needed is more democracy, not less. Far more inclusive participation can expand polit-ical voice and have direct operational benefits, for example by accurately revealing who is bearing the costs of climate change. Actions by user groups can influence the management of land and water resources as well as trigger the use of technologies that respond better to local complexities.3 Civil society can raise aware-ness, empowering local stakeholders and com-munities, and share expertise and intervention
Far more inclusive
participation can expand political voice and have
direct operational benefits, for example by
accurately revealing who is bearing the costs
of climate change

ASIA-PACIFIC HUMAN DEVELOPMENT REPORT150
strategies through national and international dialogues.
Enforcing Laws and Regulation
Existing laws and regulations on pollution, health and water that simultaneously influence climate change need to be better enforced. Gov-ernments could also consider overarching legis-lation that refers specifically to climate change from a development perspective. In order to jointly address historical and climate-linked vulnerabilities, there is a need for an explicit gendered recognition of the high dependence of women on sectors expected to experience the most intense impacts. Regulatory institutions and enforcement mechanisms will need to work alongside incentive structures that encourage energy efficiency, cleaner energy and the diver-sification of energy sources, among other goals, so that voluntary adjustments are encouraged. When regulations and incentives are aligned rather than fragmented, efforts to oblige and encourage behaviour will work consistently. With this aim, dialogue with industry and busi-ness associations needs to be promoted to work out practical regulations that ensure a level playing field.
Attitudes of People
The broader public, whether as citizens or as consumers, can have a strong positive influence on political and business leadership. Public atti-tudes can make it worthwhile for political and business leadership to take a longer-term view. Older ‘brown’ habits and mindsets can work as barriers, but experience has shown the value of consistent science-based campaigns. And while changing attitudes and habits takes time, it can be achieved. In many countries, smoking, for example, has been reduced dramatically within a generation.
Individuals
Keeping individuals informed and involved will be important in changing attitudes. As citizens, they can exert pressure for better regulation and accountability from public institutions. As consumers, they can influence private firms and choose to reduce the use of energy-intensive or energy-inefficient products and services, and
control waste. As voters, citizens not only make it worthwhile for political leadership to become far more responsive, they can also contribute to sustaining political will over time. Women, in particular, can be effective agents in changing attitudes, through taking advantage of their traditional knowledge in interacting with the environment under new circumstances.
Civil Society and Media
Coalitions of environmental groups can help shape public opinion with the help of media. At the same time, civil society organisations should put pressure on governments to take stronger action, including forms of emissions trading that protect the interests of the poor. The media can build public awareness by spotlighting not only immediate climate-related disasters but the longer-term creeping effects of climate change on communities, as well as the best ways to respond. Old and new media provide avenues to share the best responses.
Private Sector
Some of the impetus can also come from work-ing in partnership with and changing attitudes among private firms. In the past, most enter-prises have been free-riders, taking advantage of nature’s free and seemingly limitless capacity as an environmental sink. But many companies recognise that this is unsustainable, both tech-nologically and politically, and are coming under increasing pressure from their custom-ers and their own staff to be environmentally responsible. Unlike democratically elected gov-ernments, which typically have limited time horizons, the leadership of companies in many cases is focused on a longer-term investment time frame. And a new generation of leaders is open to business models that are more responsive to social and environmental concerns. As attitudes change, the staff of private companies may not want to be associated with pollution and environmental degradation, providing additional entry points for change. Some of the larger companies, in-cluding those with international operations, are even considering partial compensation to affected communities. Others are exploring low-carbon options, financial investments in climate-friendly technologies and more resilient service delivery supply chains.
Public attitudes can make it worthwhile for political and business leadership to take a longer-term view

6 PLANNING FOR THE PLANET 151
Youth
Young people can be strong advocates for the environment by sharing information and help-ing their homes, schools and communities to adapt. Awareness can start in schools; in some respects, children are ahead of their parents (Box 6.1). Educational institutions, responding to a growing demand among students, can offer courses related to environmental sciences and share scientific knowledge across borders.
Assessment of Climate Impacts
More enlightened attitudes and habits will need to be based on accurate data that is timely, compar-able and regularly available. Information, attitudes and action go hand in hand, each reinforcing the other. Equipping consumers with credible assess-ments enables them to demand more climate-friendly products, for instance. Some elements of climate change are easier to measure, however; others raise a number of unsettled questions.
Assess Co-benefi ts
People respond much more easily to recognis-able and immediate gains. Climate change, by contrast, can seem somewhat remote. Climate change impact assessments should therefore in-clude accurate data on tangible factors such as cost savings, pollution including air quality, traffic congestion, health impacts and ecosystems — indicators that are directly valued while being linked to climate change.
Improve Impact Assessments
Data systems need to improve not just at the national but also at the local level, since the effects vary according to location. Most existing assess-ments do not take detailed account of the vulner-abilities in specific locations, such as mountains, coastal areas, small islands and urban slums. Better city-level emissions data could help both national and municipal governments arrive at more pre-cise and informed climate change strategies. Data disaggregated by population groups will be needed for defining varying impacts. Poverty- and climate-linked vulnerabilities overlap, but are nevertheless distinct — assessing them separately will improve understanding of their links and help inform people and policies better.
BOX 6.1
CHILDREN TEACH THEIR PARENTS
School systems in many countries have introduced environmental understanding and awareness into their curricula. In Thailand, for example, public schools teach topics such as life and the environment; energy; and human processes that shape the earth. Most schools in India have also introduced environmental awareness into the syllabus. Parents are reporting how schools are producing a new generation of children who can give their parents a full-blown tutorial ranging from the ill-effects of nicotine to global warming. They are endearingly protective about the earth, and view it as an extension of their homes.
Says a mother of her seven-year-old daughter: ‘While we are still into . . . armchair views on these kinds of issues, children today have gone a step further. They are actually willing to endure the discomfort. . . . That’s because awareness is being drilled into them right from the day they enter school. . . . It is all around them.’
Children are actually looking for small solutions they can themselves contribute to, like saving electricity and water. Parents have been reported to take notice when their young child goes about the house switching off redundant lights or admonishes them when they leave an appliance on by mistake.
Sources: Devidayal 2011; IPST 2008.
Count Emissions More Completely
It is essential to have accurate data on emissions from production, distribution, consumption, final use and waste management. This will require monitoring and publishing emissions levels across different industries and sectors, taking stock of ecosystems and carbon sinks. It will also need agreement on national and international standards. Sensing the changing mood, some industries have already taken steps that could serve as the basis for more systematic collaboration.
Track Carbon in Consumption
National statistical offices and independent research need to play closer attention to emis-sions related to final consumption to help inform consumers. Many voluntary labelling systems are already in operation, for buildings, for ex-ample. But governments should require eco- and carbon labelling for a wide range of goods, while dispelling fears that such carbon tracking will give rise to trade barriers.
Equipping consumers
with credible assessments
enables them to demand more
climate-friendly products

ASIA-PACIFIC HUMAN DEVELOPMENT REPORT152
Establish a Wide Measure of Human Progress
A number of initiatives are already under way to measure progress taking better account of eco-logical scarcity, social exclusion and human happiness. Using the model of the MDGs, official statistical systems and multilateral organisations could promote sustainable development goals embedded in inclusion, with corresponding targets and indicators. The human development paradigm is already well suited for this — it can go well beyond the basic HDI to encompass ideas like a green development index.
AN AGENDA FOR ACTION
While continuing to push against the larger structural barriers of institutions, attitudes and assessments, developing countries in Asia-Pacific can also identify priority actions that meet local needs. As seen in the earlier chapters of this report, the motivators can be some of the imme-diate benefits — a healthier environment, cleaner air and water, less traffic congestion, pleasanter surroundings. These benefits speak to the poor and the rich. The more advantaged, who are better placed to influence decisions, have to use the same roads and inhabit the same natural world.
There is no need to wait for change to happen in the normal course of development. Govern-ments do not wait for poverty to come down on its own. Similarly, action can be taken for societies to adapt in a planned rather than forced manner, as lower-carbon options are progres-sively adopted to prevent the adaptation balloon from bloating. Four areas are key here: technology, finance, knowledge and cooperation.
Encourage the Transition to Green Technologies
Governments, international agencies and re-gional bodies can promote green technologies for more efficient and cleaner processes in energy, agriculture and transport. Through a combination of regulations and fiscal incentives, governments can lead strategically. Developing country governments are unlikely to compro-mise growth, but can encourage and support the private sector and individuals to switch to green technologies without selectively undermining
competitiveness or causing overall revenue and job losses. Fiscal reform could consider shifting the tax burden away from incomes, savings and capital gains, towards fossil fuel use and waste generation, while redirecting subsidies away from fossil fuels and other environmentally per-verse options. Local authorities can encourage greater energy efficiency in local infrastructure while exploring the use of solar, wind and other renewable energy sources, while continuously improving off-grid supplies.
Transfer
Some cleaner technology is already available, and can be transferred through North–South and South–South cooperation to enable disad-vantaged countries to leap-frog over older tech-nologies. This has clear global benefits, and if necessary could be achieved through compulsory licensing, as has already happened with some pharmaceutical patents where public health is at stake. The WIPO should be able to assist in the process.
Diffusion and Absorption
Governments and the private sector need to invest in improving local capacities to ensure that green technologies can be used widely. Local capacity cannot be taken for granted. Nurturing it requires further education and the retraining of workers, while minimising job losses. Both public and private initiatives need to back continued innova-tion for affordable green technologies, factoring in affordability, which is as critical as efficiency. The use of electricity generated from renewable sources should be encouraged not just through incentives, but also increased awareness of environmental implications.
Combining Old and New
Unlike the technologies for lowering emis-sions, techniques for adaptation are often fairly familiar. They should be systematically used and disseminated. Many of those for agricul-ture, disaster risk reduction, and management of water and ecosystems have been tried — often by women — and tested over generations. Other forms are more recent, involving advanced sci-ence, or technologies such as remote satellite sensing. In harnessing new and old together,
The motivators can be some of the immediate benefits — a healthier environment, cleaner air and water, less traffic congestion, pleasanter surroundings; action can be taken for societies to adapt in a planned rather than forced manner

6 PLANNING FOR THE PLANET 153
national and local governments should cooperate to ensure that the most vulnerable groups have priority access.
Green Technologies in Daily Life
Supported by feed-in tariffs, householders can consider photovoltaic technology, which con-verts solar light directly into electricity. They can also use efficient stoves made from local materials, which generate added health benefits and business opportunities. Both household and business consumers can take advantage of new meters that display energy cost information to keep users constantly aware of how much they are consuming. Cities can adopt combined heat and power generation and promote more efficient lighting. In all of this, it will be important to take into account gender relations and the ways in which burdens are shared in households.
Expand Sources of Finance
Governments and private actors should har-ness all potential sources of finance — domestic and international, public and private. Although public sources — through taxes, fees, efficiency gains and lower subsidies — may be limited, they can be leveraged to garner growing and varied private sources.
Addressing the many facets of climate change in the process of development will require the use of domestic public finance to the fullest extent possible and the redirection of revenues from fossil fuel subsidies and fossil fuel taxes, fees or royalties. Instruments such as taxes on energy-intensive exports to developed country markets and cross-border coordination in carbon pricing can act as a brake on carbon leakage — the shifting of emission-intensive operations to areas that are poor, remote or have weaker regu-lations, thus eluding the goal of lower overall emissions. Measures such as increasing taxes or lowering subsidies require strong political commitment, as they may not be welcomed by prevailing beneficiaries. With greater awareness and improved governance that delivers much more inclusive development, citizen support will bolster political will.
As domestic resources alone will be insuffici-ent in the face of the global problem of climate
change, developing countries can access globally available public and private funds channelled through multilateral and bilateral agencies, the UNFCCC, and a multitude of private financial intermediaries. Internationally, over 90 per cent of climate change finance is sourced from private markets.4 Public funds can be used to catalyse larger private resources. New market-based instruments and innovative finance mechan-isms are emerging to attract and direct private investment towards green technologies and practices.5
The global public financial architecture is complex and is evolving fast. Some 24 special climate change funds already exist. Despite this, climate finance falls short of requirements, with a huge funding gap in the area of clean energy. Adaptation funds are seen as distinct from miti-gation. Innovative measures need to be adopted for mobilising resources in a limited time — a currency transaction tax is one proposal.6
New and growing sources of finance bring complexity and challenges. Only a limited number of developing countries are currently benefiting from these sources. Additional meas-ures should foster greater equity and voice in access. Developing countries also need domestic reforms in policies and incentives that would facilitate the public sector’s ability to leverage private finance, since most funding will come from private sources.
Monetary Incentives and Disincentives
Carbon taxes and levies can encourage more efficient use of energy. The additional revenue generated from such incentives and disincen-tives can be used to improve infrastructure and social services, including energy for poor and vulnerable groups to help them diversify into more productive livelihoods and build resilience to shocks.
Clean Development Mechanism
The CDM, one of the main project-based mech-anisms under the Kyoto Protocol, was designed with the dual objectives of promoting sustainable development through technology transfer and foreign investment, and providing industrial countries with additional cost-effective options to meet their Kyoto targets for emissions reduction.
Encourage the transition to green
technologies; harness all
potential sources of finance — domestic and international,
public and private

ASIA-PACIFIC HUMAN DEVELOPMENT REPORT154
Under the CDM, industrial countries can invest in emissions reduction projects in developing countries. These projects generate certified emission reductions (CERs) or carbon credits, which can be used by industrial nations to offset carbon emissions at home. As most projects have tended to be in the larger developing countries, CDM coverage should be expanded to smaller and least developed countries, which will require that they build the necessary domestic capacity not just to propose and manage CDM projects, but importantly to ensure that they serve domestic development priorities. Gaps in legal, technical and financial capacities that put some countries at a disadvantage in negotiating through the CDM need to be addressed.
REDD+
If managed well, REDD+ could contribute to rural resilience while controlling emissions. However, measures to reduce emissions from deforestation and degradation of forests, and to include the ‘plus’ of conservation, sustainable management and enhancing forest carbon stocks, would need to be carefully managed, ensuring that the rights and tenures of indigenous peoples and local communities are not compromised. Forests are not merely stores of carbon, they are ecosystems too. Countries need to ensure that projects under this mechanism are designed in ways that reduce poverty and are easy to monitor, and that safeguards to protect traditional rights are put in place.
International Emissions Trading
Asia-Pacific countries should join in international schemes for emissions trading. Trading should also be feasible among countries in the region, given their diversity in levels of development. This would require fixing specific quotas and better defining property rights for carbon emis-sions, along with ensuring that carbon prices are similar across the world so as to avoid carbon leak-age. Technology and financial support should be provided to encourage the participation of small enterprises. Few of these enterprises are present in current trading schemes, but, as Viet Nam has shown, they can do much to adapt energy-efficient technologies that boost profits while reducing CO2 emissions. Informed citizens and NGOs need to monitor trading and advocate for
maintaining a consistent connection between such trading and legitimate emissions reduction goals, including appropriate carbon prices.
National Trading
Global and regional initiatives can be com-plemented by sub-national market-based mechanisms. These could include city-level cap-and-trade schemes that aim at lowering the majority of emissions coming from cities. Emission trading can also occur within a coun-try, building upon municipal cap-and-trade initiatives. Such options may work better where a common national or local government can regulate the trading partners and is responsible for the residents — this is harder to accomplish across country boundaries.
Strengthen Knowledge to Shape Low-Carbon Preferences
Action on climate change should build on a com-mon knowledge base derived from independent and credible sources that people can use to shape their preferences and actions. Governments can also use this knowledge as the basis for national and international commitments. In an atmos-phere where interest groups express themselves loudly and sceptically, accurate knowledge dis-semination helps ensure that serious action by governments and people is not jeopardised.
Research
Public institutions should continue to contribute to knowledge for development of and access to better technology. This can be based on North–South as well as South–South exchanges between universities and other institutions of research. Such collaborations can support adaptation that promotes rather than interferes with poverty reduction and inclusive development agendas. They can generate new understanding to influ-ence and coordinate national and international political commitments and actions.
Dissemination
Governments and media can disseminate the latest information on environmental issues and climate change as a high priority. For farmers, for example, this would include seasonal weather forecasts to help them plan planting, management
Build on a common knowledge base derived from independent and credible sources that people can use to shape their preferences and actions

6 PLANNING FOR THE PLANET 155
and harvesting. Consumer organisations can pro-vide non-partisan information about options to help buyers make greener and safer choices, for example, choices regarding energy efficiency and waste reduction.
Access to Information
Countries can enact regulations supporting people’s easy access to information. Greater trans-parency will contribute to more participatory and informed debate on challenges and opportunities in relation to climate change, taking into account the perspectives of the poor and the vulnerable. There are some examples across the region, such as the Right to Information (RTI) Act in India. In addition to legislation, public campaigns on TV, radio, the Internet and newspapers can foster access to information, explaining what is avail-able, and the ways and means of accessing it.
Join Forces across Borders
Concerted action to address climate change requires cooperation and coordination on trans-boundary issues. Effective partnerships can sig-nificantly reduce the global cost of addressing climate change, as compared to the costs that each country would need to sustain if it were to act alone. Even as countries cooperate inter-nationally, however, they need to take domestic action for fairer impacts on the ground, recog-nising that regional and global institutions are not designed to make change happen without national action. Many international responses to climate change have been inadequately connected to the concerns of the disadvantaged.
Transboundary Cooperation — Regional and Global
Cooperative rather than reciprocity stances should guide decision making on climate matters. Gov-ernments and regional organisations can sign up to international agreements on climate change as well as contribute knowledgeably to their objectives, design, monitoring mechanisms and legal status.
Regional cooperation can be an effective beginning in working together, given the geo-graphical contiguity of mountain ranges, forests, coastal areas or watercourses that form ecosys-tems. The conservation and management of
most ecosystems and their services in fact requires working together. Combining endeavours can eliminate duplication of efforts, enhance fund-ing directed at adapting to climate change, and foster sustainable and more creative problem solving. Early efforts can already be seen within the Asia-Pacific region.
A number of intergovernmental organisa-tions have been cooperating on climate-linked environmental areas. They have made policies and institutional arrangements for disaster risk reduction that can minimise risks and speed up recovery from climate impacts. These include the Association of Southeast Asian Nations (ASEAN), the Pacific Islands Forum Secretariat (PIFS) and the South Asian Association for Regional Cooperation (SAARC) (Box 6.2).
Regional cooperation can be extended to cross-regional cooperation, as when countries in the Hindu Kush–Himalayan mountains col-laborate with established regional bodies such as the European Alpine Convention to promote coordination of activities and raise concerns about mountainous areas in climate change and development fora. A focus on ecosystems in some cases can offer alternative means of debate and action, not always available through exist-ing intergovernmental bodies. By participating fully in global conventions, backed by scientific and civil society involvement, countries can ensure that Asia-Pacific concerns are factored in. Cooperation should cover priorities such as tech-nology transfer, water policies, forest management and disaster management.
Internal Coordination
Cooperation includes coordination both within and across national boundaries. Some deci-sions on local development that embed climate resilience should focus on ecosystems, which may call for working across conventional political or administrative structures. Local governments can take progressive steps to cooperate by learn-ing from each other’s experiences on the ground, the specific pitfalls faced, innovative financing strategies to support adaptation, and practical entry points that work. National governments should strengthen institutions at the national and local levels to enable them to better under-stand and deal with climate change. Equipping national and local tiers of governance with
As compared to acting
alone, effective partnerships
can significantly reduce the global cost of addressing
climate change

ASIA-PACIFIC HUMAN DEVELOPMENT REPORT156
BOX 6.2
DEVELOPING SOLUTIONS TOGETHER: INTERGOVERNMENTAL ORGANISATIONS IN ASIA-PACIFIC RESPOND TO THE CLIMATE CHALLENGE
Coordinated efforts in climate-linked environmental areas are visible at the sub-regional level. Here is a snapshot of efforts by intergovernmental organisations in Asia-Pacific.
South-East Asia
The Association of Southeast Asian Nations (ASEAN) has ensured its commitment to effective bilateral, regional and global partnerships to promote the development and transfer of low-carbon technologies, including cleaner and climate-friendly technologies. The Roadmap for an ASEAN Community 2009–15, adopted by national leaders, situates the ASEAN climate change agenda in the context of sustainable development, and outlines strategies and actions. The roadmap calls upon member states to strengthen effective mechanisms and capabilities to prevent and reduce disaster losses, including those related to climate, and to respond jointly to disasters through concerted national efforts and intensified regional and international cooperation. In addition, the ASEAN Plan of Action for Energy Cooperation (2010–15) covers the energy component of the ASEAN Economic Community Blueprint, and seeks to enhance energy security and sustainability for the ASEAN region, including measures related to health, safety and the environment, through accelerated implementation of action plans.
South Asia
The SAARC Action Plan on Climate Change (2009–11) has articulated specific aims: to identify and create opportunities for activities achievable through regional cooperation and South–South support in terms of technology and knowledge transfer; to provide the impetus for a regional-level action plan on climate change through national-level activities; and to support global negotiation processes of the UNFCCC, such as the Bali Action Plan, through a common understanding or elaboration of various nego-tiating issues that effectively reflect the concerns of SAARC member states. The 15th SAARC summit in 2008 noted that increased access to energy is critical for fulfilling the legitimate expectations of growth and development in South Asia. It also recognised the potential for developing regional and sub-regional energy resources in an integrated manner,
and noted the efforts being made to strengthen regional cooperation in capacity development, technology transfer and trade in energy towards improved energy security in the region. The Thimphu Statement emphasised the need to address the adverse effects of climate change, and agreed to establish an Intergovernmental Expert Group on Climate Change to develop clear policy direction and guidance for regional cooperation as envisaged in the SAARC Plan of Action on Climate Change. The commitment to ensuring timely implementation of the Thimphu Statement on Cli-mate Change was re-emphasised in the Addu Declaration, issued during the 17th SAARC Summit in 2011.
The Pacifi c
The Pacific Islands Forum Secretariat’s Pacific Plan pro-poses a regional response to the challenges that Pacific Island countries face. One of the strategic visions of the plan is to ‘strengthen support for current programmes, develop new initiatives and advocate for the needs of the Smaller Island States, particularly given their limited capacity and fragile and vulnerable environment, including to climate change’. The plan, which is linked to the Pacific Islands Framework for Action on Climate Change (2006–15) and the Pacific Disaster Risk Reduction and Disaster Management Frame-work for Action (2006–15), also calls for expanding the knowledge base on climate change. Recognising the need for resources, it also aims to identify sustainable financing options at national, sub-regional and/or regional levels to support climate change adaptation and mitigation by member countries.
The implementation of declarations and strategies by Asia-Pacific intergovernmental organisations can help to enhance cooperation across boundaries in the fight against climate change. This requires strong political will by the country leaders of such organisations as well as international support for resources and capacity building. Strong monitoring and follow-up from the secretariats of the regional bodies could further accelerate implementation.
Sources: Addu Declaration 2011; ASEAN 2010; ASEAN 2009; ASEAN Declaration 2007; Pacific Islands Forum Secretariat 2007; SAARC Declaration 2008; Thimphu Statement 2010.
knowledge and capacities will make them more responsive and effective, contributing to deeper democracy over the longer term.
Think-tanks, NGOs and dynamic, informed media should continuously induce citizens and businesses to nudge governments in the direc-

6 PLANNING FOR THE PLANET 157
tion of the social good, while also highlighting the more visible immediate benefits.
A FAINTER FOOTPRINT
Human beings can no longer continue to think of themselves as distinct from the environment. They have been transforming nature for too long, as if they were separate from it — notably by releasing huge quantities of fossil carbon that the planet took hundreds of millions of years to accumulate. Human activity in this era of the anthropocene — the age of man — is starting to
dominate the planet’s carbon cycle. The conse-quence is a warmer earth, with melting glaciers, higher sea levels and intensified cycles of precipi-tation and evaporation. Everyone in Asia and the Pacific is facing the impacts; the poor, who have contributed negligibly, much more so. The only alternative is to steer a more sustainable course that fulfils the urgent human development needs of today while preserving a habitable planet. The world’s common future is going to be impacted largely by the choices this large and growing region can make today. The goal is clear: reduce poverty, but leave a fainter footprint.
Human beings can no longer
continue to think of themselves as distinct from the
environment

TOOLS
FinanceKnowledge
Cooperation
ENABLINGFACTORS
InstitutionsAttitudes
Assessments
HU
MA
N D
EVEL
OP
MEN
T
No tax or too low a tax can spur demand for luxury cars andother consumer durables that increase consumption and pollution, affecting common resources such as air and water
-
Urban climate adaptation through flood-proofing infrastructure and basic services increases resilience of women and men living in vulnerable conditions
Urban flood-proofing that prioritisesareas where the better-off live can inundate vulnerable communities by re-routing flood waters to slum areas, peri-urban and rural communities, affecting housing, livelihoods, and health
–
+
–
+
Safeguards livelihoods, generatesincome and in-kind benefits (e.g., land rights), protects natural resource base for rural women and men, sustains benefits for the future
Do the poor benefit adequately in the short and long term? Elite capture, lack of transparency, token local participation in designing and allocating benefits can exclude the poor and have an adverse impact on women’s time-use
–
+
Greener, Inclusive
Cities
Greater Rural
Resilience
Provides incentives for industries for low-carbon technology development, cleaner and renewable energy use and natural resource use efficiency, which contribute to sustained livelihoods of poor men and women, such as employment opportunities and better health
–
+
Pros and Cons of Climate Policy Interventions for Human Development: An illustration to Assess Impacts on the Poor
Time and cost savings plus health benefits from improved cooking methods, more affordable mass public transport that is cleaner, bothbenefit poorer men and women while reducing emissions
Higher priced cleaner fuels discourage their use among the poor; not prioritising mass public transport in the use of lower priced cleaner fuels could accelerate use of private vehicles
Fairer, Wiser Consumption
FLOOD PROOFING PRICING CLEANER FUEL CHEAPER
CARBON TAXPAYMENT FOR ECOSYSTEM SERVICES
Lower Carbon
Production

TECHNICAL TERMS 159
TECHNICAL TERMS
Adaptation: autonomous and planned In the context of climate change, adaptation is adjustment in natural or human systems in response to actual or expected climatic stimuli or their effects, which moderates harm or exploits beneficial opportunities. It can be of different types including autonomous (spontaneous) and planned adaptation.
Autonomous adaptation does not constitute a conscious response to climatic stimuli but is triggered by ecological changes in natural systems and by market or welfare changes in human systems.
Planned adaptation is the result of a deliberate policy decision, based on an awareness that conditions have changed or are about to change and that action is required to return to, maintain, or achieve a desired state.
Adaptive capacity Adaptive capacity implies the ability of a system to adjust to climate change (including climate variability and extremes) to moderate potential damages, to take advantage of opportunities, or to cope with the consequences.
It is also defined as the whole of capabilities, resources and institutions of a country or region to implement effective adaptation measures.
Afforestation Direct, human-induced con-version of land that has not been forested for a period of at least 50 years to forested land through planting, seeding and/or the human-induced promotion of natural seed sources.
Anthropocene A new geological epoch, attributed to Paul Crutzen and Eugene Stoermer, which is characterised by human dominance of biological, chemical and geological processes on the earth.
Anthropogenic emissions Emissions of green-house gases, greenhouse gas precursors and aerosols resulting from or produced by human activities, including the burning of fossil fuels, deforestation, land use changes, livestock, fertil-isation, etc.
Aquaculture The farming of aquatic organisms in inland and coastal areas, involving intervention in the rearing process to enhance production.
Biochar A form of charcoal made from animal wastes and plant residues (such as wood chips, leaves and husks) that undergo pyrolysis, a pro-cess that rapidly decomposes organic material through anaerobic heating. It is also useful for sequestering carbon by circumventing the nor-mal decomposition process or acting as a fertiliser to enhance the sequestration rate of growing biomass.
Biological capacity (biocapacity) The cap-acity of ecosystems to produce an ongoing supply of biological resources and to absorb waste (including carbon dioxide) generated by humans, using current management schemes and extraction technologies.
Biological diversity (biodiversity) Variability among living organisms from all sources including terrestrial, marine and other aquatic ecosystems, and the ecological complexes of which they are part; this includes diversity within species, between species and of ecosystems.
Biofuel A fuel produced from dry organic matter or combustible oils produced by plants such as alcohol (from fermented sugar), black liquor (from paper manufacturing process), wood and soybean oil.
Biomass The total mass of living organisms in a given area or volume; recently dead plant material is often included as dead biomass. The quantity of biomass is expressed as a dry weight or as the energy, carbon or nitrogen content. When used in place of fossil fuel, biomass fuel cuts greenhouse gas emissions because the plants that are the fuel sources capture carbon dioxide from the atmosphere.
Biome A grouping of similar plant and animal communities into broad landscape units that occur under similar environmental conditions.

ASIA-PACIFIC HUMAN DEVELOPMENT REPORT160
Biotechnology Any technological application that uses biological systems, living organisms or derivatives thereof to make or modify products or processes for specific uses. Biological mani-pulation of living organisms helps produce foods, drugs and other products for humans.
Black carbon Particle matter in the atmosphere that consists of soot, charcoal and/or possible light-absorbing refractory organic material.
Cap and trade/emissions trading Cap is a regulation-mandated restraint as an upper limit on emissions. The Kyoto Protocol mandates emissions caps in a scheduled timeframe on the anthropogenic GHG emissions released by Annex B countries.
Cap and trade is also known as emissions trading, which is a market-based approach to achieving environmental objectives. It allows those reducing GHG emissions below their emission cap to use or trade the excess reductions to offset emissions at another source inside or outside the country. In general, trading can occur at the intra-company, domestic and international levels.
Carbon capture and storage A process consisting of separation of CO2 from industrial and energy-related sources, transport to a storage location and long-term isolation from the atmosphere.
Carbon cycle The flow of carbon (in various forms, such as carbon dioxide) through the atmosphere, ocean, terrestrial biosphere and lithosphere.
Carbon dioxide (CO2) CO2 is a naturally occur-ring gas, and a by-product of burning fossil fuels or biomass, of land use changes and of indus-trial processes. It is the principal anthropogenic greenhouse gas that affects the earth’s radiative balance. It is the reference gas against which other greenhouse gases are measured, and therefore it has a global warming potential (GWP) of 1.
Carbon dioxide equivalent (CO2e) A way of expressing the quantity of a mixture of different greenhouse gases. CO2e is a measurement unit to indicate to what extent a greenhouse gas contributes to global warming — its GWP —
and to weigh the climate effects of all greenhouse gases against each other. Using carbon dioxide as a reference gas, CO2e is calculated by multiplying the quantity of a greenhouse gas by its GWP.
Carbon fertilisation The enhancement of the growth of plants because of increased atmos-pheric CO2 concentration. Depending on their mechanism of photosynthesis, certain types of plants are more sensitive to changes in atmos-pheric CO2 concentration than others.
Carbon footprint The total amount of carbon emissions associated with a particular activity or all the activities of a person or organisation. Carbon footprint can be measured in many ways, and may include indirect emissions generated in the whole chain of production of inputs into an activity. This is usually expressed in tonnes of carbon or tonnes of carbon per unit of dollar.
Carbon intensity The amount of emission of carbon or CO2e generated per unit of output (gross domestic product).
Carbon intensity of energy The amount of emission of carbon or CO2e generated per unit of energy.
Carbon labelling An attempt to show a prod-uct or service with a visible representation of the quantity of carbon emissions generated by its creation, and delivering the information to consumers and others. It consists of two com-ponents: measuring carbon emissions from production, and conveying that information.
Carbon leakage In general, carbon leakage corresponds to the ratio of carbon emission increase from a specific sector outside the country (as a result of a policy affecting that sector in the country) over the carbon emission reduction in that sector (again as a result of the environmental policy).
In relation to the Kyoto Protocol of the UNFCCC, carbon leakage corresponds to the part of emissions reductions in Annex B countries that may be offset by an increase of the emissions in the non-constrained countries above their baseline levels. This can occur through: (a) relocation of energy-intensive production in non-constrained regions; (b) increased consumption

TECHNICAL TERMS 161
of fossil fuels in these regions through decline in the international price of oil and gas triggered by lower demand for these energies; and (c) changes in incomes (thus in energy demand) because of better terms of trade.
Carbon sequestration A biochemical process by which atmospheric carbon is absorbed by living organisms, including trees, soil micro-organisms and crops, and involving the storage of carbon in soils and oceans with the potential to reduce atmospheric carbon dioxide levels.
Clean Development Mechanism (CDM) The CDM is one of the project-based mechan-isms under the Kyoto Protocol. It was designed with the dual objective of promoting sustainable development through technology transfer and foreign investment and providing industrial countries with additional cost-effective miti-gation options to meet their Kyoto targets. Under the CDM, industrial countries can invest in emission reduction projects in developing countries. These projects generate certified emission reductions (CERs) or carbon credits, which can be used by industrial nations to offset carbon emissions at home and meet their Kyoto reduction targets.
Climate Climate in a narrow sense is usually defined as the average weather, or more rigor-ously, as the statistical description in terms of the mean and variability of relevant quantities over a period of time ranging from months to thousands or millions of years.
Climate change A change in the state of the climate that can be identified by changes in the mean and/or the variability of its properties, and that persists for an extended period, typically decades or longer. Climate change may be due to natural internal processes or external forcings, or to persistent anthropogenic changes in the composition of the atmosphere or in land use. The UNFCCC makes a distinction between climate change attributable to human activities altering the atmospheric composition, and climate variability attributable to natural causes.
Climate proofing Identifying risks to a devel-opment project, or any other specified natural or human asset, as a consequence of climate
variability and change, and ensuring that those risks are reduced to acceptable levels through long-lasting and environmentally sound, econom-ically viable and socially acceptable changes implemented at one or more of the following stages in the project cycle: planning, design, con-struction, operation and decommissioning.
Climate variability Variations in the mean state and other statistics (such as standard devi-ations, the occurrence of extremes, etc.) of the climate on all spatial and temporal scales beyond that of individual weather events, possibly due to natural internal processes within the climate system (internal variability), or to variations in natural or anthropogenic external forcing (external variability).
Ecological footprint A measure (in global hectares) of how much biologically productive land and water an individual, population or activity requires to produce all the resources it consumes and to absorb the waste (including carbon dioxide emissions) it generates using prevailing technology and resource management practices. The Ecological footprint is usually measured in global hectares (gha).
Ecosystem A system of living organisms inter-acting with each other and with their physical environment, whose boundary could range from very small spatial scales to, ultimately, the entire earth.
Ecosystem services Ecological processes or functions that have value for individuals or society. These include four major categories: provisioning (e.g., production of clean water and food), regulating (e.g., control of climate and extreme weather events), supporting (e.g., nutrient cycles for agriculture, crop pollination and decomposition of wastes) and cultural (e.g., spiritual, religious and recreational value).
El Niño–Southern Oscillation A complex interaction of the tropical Pacific Ocean and the global atmosphere that results in irregularly occurring episodes of changed ocean and weather patterns in many parts of the world, often with significant impacts over many months, such as altered marine habitats, rainfall changes, floods, droughts and changes in storm patterns.

ASIA-PACIFIC HUMAN DEVELOPMENT REPORT162
Energy efficiency Energy efficiency is com-puted as the ratio of energy output of a system, con-version process or activity to its energy input.
Energy intensity The ratio of energy use to total output (GDP). Industrial energy intensity is energy use expressed in tonnes of oil equiva-lent (toe) per one million dollars of industrial output.
Environmental degradation The reduction of the capacity of the environment to meet social and ecological objectives and needs. It is caused directly or indirectly by human activities.
Exposure The nature and degree to which a system is exposed to significant climatic vari-ations. Exposure to climatic risks is site-specific. For example, people in small islands are more exposed to sea-level rise, people in deltas or low-lying areas and those living on river banks are more exposed to floods related to climatic extreme events, and so on.
Feed-in tariff The price per unit of electricity that a utility or supplier has to pay for renew-able electricity from private generators. The government regulates the price or the tariff rate.
Fossil fuel Coal, oil, natural gas and other hydrocarbons are called fossil fuels because they are made of fossilised, carbon-rich plant and animal remains. These remains were buried in sediments and compressed over geologic time, slowly being converted to fuel.
Global warming The increase in the earth’s temperature, in part due to emissions of green-house gases associated with human activities such as burning fossil fuels, biomass burning, cement manufacture, cow and sheep rearing, deforestation and other land use changes.
Greenhouse gases The atmospheric gases responsible for causing global warming and climate change. The major GHGs are carbon dioxide (CO2), methane (CH4) and nitrous oxide (N2O). Less prevalent — but very powerful — greenhouse gases are hydrofluorocarbons (HFCs), perfluorocarbons (PFCs) and sulphur hexafluoride (SF6).
Grid In the context of electricity, a grid is a sup-ply network that usually consists of some form of electricity generator, with electricity taken along a transmission line at high voltage, then stepped down to lower voltage on a distribution system that delivers electricity to end-users (households, industries, etc.).
Land use The whole set of arrangements, activ-ities and inputs undertaken in a certain land cover type (a set of human actions); also used in the sense of the social and economic purposes for which land is managed (e.g., grazing, timber extraction and conservation).
Land use change A change in the use or man-agement of land by humans, which may lead to a change in land cover. Land use change occurs when, for example, forest is converted to agri-cultural land or to urban areas. Land cover and land use change may have an impact on the surface albedo, evapotranspiration, sources and sinks of greenhouse gases or other properties of the climate system, and may thus have a radiative forcing and/or other impacts on climate, locally or globally.
Maladaptation Any changes in natural or human systems that inadvertently increase vul-nerability to climatic stimuli, thereby succeed-ing only in increasing vulnerability instead of reducing it.
Methane A hydrocarbon — one of the six greenhouse gases to be mitigated under the Kyoto Protocol — produced through anaerobic (without oxygen) decomposition of waste in landfills, animal digestion, decomposition of animal wastes, production and distribution of natural gas and oil, coal production and incom-plete fossil fuel combustion.
Megacity A metropolitan area with a population of 10 million people or more.
Mitigation In the context of climate change, mitigation refers to a human intervention to reduce the sources or enhance the sinks of green-house gases. Examples include using fossil fuels more efficiently for industrial processes or electri-city generation, switching to solar energy or wind power, improving the insulation of buildings and

TECHNICAL TERMS 163
expanding forests and other ‘sinks’ to remove greater amounts of carbon dioxide from the atmosphere.
Modern energy services Services provided through modern energy carriers (liquefied petro-leum gas, petroleum, electricity, etc.) or modern appliances. They often use electricity, whether from the grid or from decentralised generation at any scale, but also include clean cooking fuels such as LPG or biogas or motive power.
National Communication A document submitted in accordance with the UNFCCC (and the Kyoto Protocol) by which a party in-forms other parties of activities undertaken to address climate change. Most developed coun-tries have now submitted their fourth national communications; most developing countries have completed their first national communication and some of them have submitted their second as well.
Nationally Appropriate Mitigation Action (NAMA) A set of policies and actions that developing country parties (Non-Annex I) undertake voluntarily as part of a commit-ment to reduce greenhouse gas emissions, as agreed in UNFCCC’s Copenhagen Accord of 18 December 2009. NAMAs by developing country parties will be subject to their domestic measurement, reporting and verification, the result of which will be reported through their national communications every two years. NAMAs seeking international support, if supported, will be subject to international measurement, reporting and verification in accordance with guidelines adopted by the Conference of Parties.
National Adaptation Plan of Action (NAPA) In 2001, the Conference of Parties (COP-7) estab-lished the NAPAs to provide a process for least developed countries (LDCs) to identify and prioritise their adaptation needs. NAPAs include ranked priority adaptation activities and pro-jects, as well as short profiles of each activity or project, among others.
Nitrous oxide One of the six greenhouse gases to be reduced under the Kyoto Protocol. The main anthropogenic source of nitrous oxide is agri-culture (soil and animal manure management),
but important contributions also come from sewage treatment, combustion of fossil fuel and chemical industrial processes. Nitrous oxide is also produced naturally from a wide variety of biological sources in soil and water, particularly microbial action in wet tropical forests.
No-regret adaptation Adaptation options (or measures) that would be justified under all plausible future scenarios, including the absence of man-made climate change.
Primary energy Energy embodied in natural resources (e.g., coal, crude oil, sunlight, uranium) that has not undergone any anthropogenic conversion or transformation.
Reducing Emissions from Deforestation and Forest Degradation (REDD+) REDD is an effort to create a financial value for the carbon stored in forests, offering incentives for developing countries to reduce emissions from forested lands and invest in low-carbon paths to sustainable development, encompassing the role of conservation, sustainable management of forests and enhancement of forest carbon stocks. ‘REDD+’ goes beyond deforestation and forest degradation, and includes the role of con-servation, sustainable management of forests and enhancement of forest carbon stocks.
Reforestation Planting of forests on lands that have previously contained forests but that have been converted to some other use.
Resilience The ability of a system, community or society exposed to hazards to resist, absorb, accommodate to and recover from the effects of a hazard in a timely and efficient manner, including through the preservation and restoration of its essential basic structures and functions.
Saltwater intrusion Displacement of fresh surface water or groundwater by the advance of denser saltwater common in coastal and estuarine areas with reducing land-based influence (e.g., either from reduced runoff and associated groundwater recharge, or from excessive water withdrawals from aquifers) or increasing marine influence (e.g., relative sea-level rise).
Sea-level rise An increase in the mean level of the ocean. Eustatic sea-level rise is a change

ASIA-PACIFIC HUMAN DEVELOPMENT REPORT164
in global average sea level brought about by an alteration to the volume of the world ocean. Relative sea-level rise occurs where there is a net increase in the level of the ocean relative to local land movements.
Slum While the definition varies, a slum house-hold can consist of one or a group of individ-uals living under the same roof in an urban area, lacking one or more of the following five amenities: (a) durable housing (a permanent structure providing protection from extreme climatic conditions); (b) sufficient living area (no more than three people sharing a room); (c) access to improved water (water that is sufficient, affordable and can be obtained without ex-treme effort); (d) access to improved sanitation (a private toilet, or a public one shared with a
reasonable number of people); and (e) secure tenure (de facto or de jure secure tenure status and protection against forced eviction).
Urbanisation The conversion of land from a natural state or managed natural state (such as agriculture) to urban settlements or cities; a process driven by net rural-to-urban migration through which an increasing proportion of the population in any nation or region come to live in settlements that are defined as ‘urban centres’. Because of national differences in the characteristics that distinguish urban from rural areas, the distinction between urban and rural populations is not yet amenable to a single definition that would be applicable to all coun-tries or, for the most part, even to the countries within a region.

NOTES 165
CHAPTER 1
1. A number of developing countries in Asia-Pacific have large populations, despite declining fertil-ity rates (UNDESA 2011b). See Table 3 of the Indicators section. Definitions of Asia-Pacific and its sub-regions have been provided in the Readers’ Guide and Note to Tables section of this report. The definitions hold for the statistics that have been computed by the HDRU itself, such as those presented in Table 3 of the Indicators section. In the case of statistics drawn directly from other sources, the definitions used by that particular source hold.
2. The estimated number of poor was 871 million in 2009, covering the whole Asia and Pacific region (UNESCAP et al. 2012). See also World Bank 2011b.
3. UNEP 2010. 4. UNDP 2011d. 5. Sumner 2011. 6. IPCC 2011. 7. El Niño, in its original sense, is a warm-water
current that flows periodically along the coast of Ecuador and Peru, disrupting the local fishery. This oceanic event is associated with a fluctuation of the inter-tropical surface pressure pattern and circulation in the Indian and Pacific Oceans, called the Southern Oscillation. This coupled atmosphere–ocean phenomenon is known as El Niño–Southern Oscillation (ENSO). For further details see IPCC 2007a.
8. IPCC 2011. 9. IPCC 2007b. The IPCC Report provides
estimates of the sea-level rise for six emission scenarios which are used as a basis for some of the climate projections.
10. UNDP 2011d, based on Wheeler 2011.11. Attributed to P. J. Crutzen and E. F. Stoermer,
the term ‘anthropocene’ captures a major reversal in the natural sciences, giving humans a central rather than a minor part in the way the natural world functions. In the past, science progressed by making humans less and less significant in the universe — a small part of its varied, evolving life forms. An official recognition of the term by the International Commission on Statigraphy would formally establish this reversal, distinguishing it from the holocene.
12. Hooijer et al. 2010.13. Hassan et al. 2005.14. Corcoran et al. 2010.15. IPCC 2007b.16. IPCC 2007b.17. The Hindu 2011.18. IPCC 2007b.19. IEA 2011e.20. APEC and ADB 2009a.21. ADB et al. 2006. In the study, the reference is
to ‘emerging’ Asia, which includes Bangladesh, Bhutan, Cambodia, China, India, Indonesia, Lao People’s Democratic Republic, Malaysia, Nepal, Pakistan, the Philippines, Sri Lanka, Thailand and Viet Nam. See also ADB 2009.
22. The increase has been estimated to be from 1 billion tonnes of CO2 in 2006 to 2.3 billion tonnes by 2030. There is now a growing international consensus that to achieve targets for CO2 reduc-tion, the CO2 contribution from the transport sector in developing countries needs to be appro-priately addressed. See Schipper et al. 2009.
23. Cruz et al. 2007.24. Eriksson et al. 2009.25. Eriksson et al. 2009.26. IPCC 2007c.27. Scherler et al. 2011.28. Bajracharya et al. 2007.29. FAO 2007c; Bakosurtanal 2009.30. FAO 2007c.31. Giri et al. 2011.32. Donato et al. 2011.33. A biochemical process involving the storage of
carbon in soils and oceans with the potential to reduce atmospheric carbon dioxide levels. Refer to the list of Technical Terms in this Report for more information.
34. Giri et al. 2011.35. Burke et al. 2011.36. See Wilkinson 2008.37. Burke et al. 2011.38. ADB n.d.39. UNCCD 2009.40. UNCCD 2008.41. Heltberg et al. 2009.42. Johnson and Krishnamurthy 2010.43. Dercon 2005, cited in Tandon and Hasan 2005.44. Assessment of vulnerabilities has been done in a
number of ways. Efforts include: the vulnerability
NOTES

ASIA-PACIFIC HUMAN DEVELOPMENT REPORT166
index for the natural environment (EVI) devel-oped by the South Pacific Applied Geoscience Commission (SOPAC), the United Nations Environment Programme (UNEP) and their partners; and the Climate Change Vulnerability Index (CCVI) developed by Maplecroft, which evaluates economic, social and environment factors to assess national vulnerabilities. Efforts have also been made at the sub-national level: Yusuf and Francisco (2009) introduced an index of climate change vulnerability of sub-national administrative areas in some countries in South-East Asia. In the context of agriculture, which is the most stretched sector in terms of adaptive capacity, ADB and IFPRI (2009) assess vulnerabilities in the region based on a combination of indicators of exposure, sensitivity and adaptive capacity to climate impacts. See also Kundu 2011.
45. Calculations based on EM-DAT database. UNESCAP and UNISDR 2010. See also Table 17 of the Indicators section.
46. UNESCAP and UNISDR 2010.47. UNISDR 2011.48. World Bank 2011a.49. AMCDRR 2010a.50. See FAO 2002.51. Huddleston et al. 2003; Kollmair et al. 2011.52. Hassan et al. 2005, cited in ICIMOD 2010. See
also Huddleston et al. 2003.53. ICIMOD 2008.54. Hassan et al. 2005, cited in Bashir 2011.55. Hunzai et al. 2011.56. ICIMOD 2010.57. Eriksson et al. 2009, cited in ICIMOD 2010.58. Kumar et al. 2006, cited in Eriksson et al. 2009.59. Zhao et al. 2004, cited in Eriksson et al. 2009.60. Xu et al. 2007, cited in Eriksson et al. 2009.61. Farooq and Khan 2004, cited in Eriksson et al.
2009.62. ICIMOD 2010.63. ICIMOD 2010.64. ICIMOD 2010.65. ICIMOD 2010.66. Arnell et al. 2002, cited in ADB and IFPRI 2009;
Parry et al. 2005, cited in ADB and IFPRI 2009; Preston et al. 2006, cited in ADB and IFPRI 2009.
67. World Bank 2000.68. EACH-FOR 2009.69. Ahmed 2009, cited in Blitz 2011.70. EACH-FOR 2009.71. EACH-FOR 2009.72. World Bank 2000.
73. See Government of the People’s Republic of Bangladesh 2009.
74. Royal Government of Cambodia 2006. 75. Lin et al. 2007, cited in Lewis 2009. 76. Fan and Li 2006, cited in Lewis 2009; Li et al.
2000, cited in Lewis 2009. 77. Economy 2007. 78. Bates et al. 2008, cited in ADB and IFPRI
2009. 79. UNDP 2007a. 80. IMHEN 2010. 81. IMHEN 2010. 82. UNDP 2007a. 83. Thanh Phuong and Oanh 2010. 84. Based on UNDESA 2011c. 85. Arnell et al. 2002, cited in ADB and IFPRI 2009;
Parry et al. 2005, cited in ADB and IFPRI 2009; Preston et al. 2006, cited in ADB and IFPRI 2009.
86. Term coined by the Pacific Desk of the World Council of Churches to define the Pacific region as the equivalent of continents.
87. This index is not calculated for Timor-Leste. For more details see SOPAC and UNEP 2005.
88. Mimura et al. 2007. 89. Mimura et al. 2007. 90. Nasheed 2009. 91. Wragg 2008. 92. Carling 2011. Author’s calculations based on
AIPP 2010a; AIPP and IWGIA 2010b; AMAN 2010; Erni 2008; Oanh 2010; Wagha 2010.
93. AIPP 2010b. 94. Carling 2011. 95. Abayao et al. 2009, cited in Carling 2011. 96. Tebtebba Foundation 2009, cited in Carling
2011. 97. This resin is produced by an insect that is
cultured on the shoots of some species of trees. See Kelkar 2009.
98. Cao Phan 2009, cited in Carling 2011. 99. Baker 2008. It should be noted, however, that
there are numerous debates regarding the measurement of poverty and the definition of ‘urban’ for the estimates of poverty.
100. UN-HABITAT and UNESCAP 2010.101. UN-HABITAT and UNESCAP 2010.102. See World Bank 2010c.103. See Dasgupta et al. 2009.104. Millennium Development Goal 7, Target 11, is
aimed at significantly improving the lives of at least 100 million slum dwellers by 2020.
105. FAO 2010f.106. In contrast, per capita agricultural production
in Latin America increased by only 28 per cent.

NOTES 167
Africa has fared even worse, with food produc-tion at 10 per cent less per person today than in 1960. DFID 2004.
107. Nelson et al. 2009.108. ADB and IFPRI 2009.109. Easterling et al. 2007.110. Easterling et al. 2007.111. Lymer et al. 2008.112. FAO 2010j.113. Lymer et al. 2008.114. Allison et al. 2009.115. Republic of Maldives 2007a.116. Gillett 2011.117. Lymer et al. 2008.118. East Asia and South Asia discharge 85 per cent
and 89 per cent, respectively, of their untreated wastewater into the sea. UNEP 2007.
119. SWITCH-Asia Network Facility et al. 2009.120. FAO 2008b.121. IPCC 1997.122. UNDP 2009d.123. Ratha et al. 2011.124. United Nations Office for the Coordination of
Humanitarian Affairs and IDMC 2009.125. The four upazilas are: Koyra (40,000 people),
Paikgacha (30,000 people), Dacope (18,000) and Batiaghata (12,000 people). For further details see ActionAid et al. 2009.
126. Walsham 2010.127. Nicholls et al. 2011.128. Blitz 2011.129. Crowell n.d.130. IOM 2009.131. See Tulele Peisa n.d.132. Warner et al. 2009.133. Statistics New Zealand 2007.134. See Loughry and McAdam 2008.135. Confalonieri et al. 2007.136. Bartlett 2008.137. UNISDR 2011.138. Bartlett 2008.139. Senior 2008, cited in UNDP 2011e.140. WHO 2011a.141. WHO 2006.142. WHO 2008b.143. Hales et al. 1996, cited in WHO et al. 2003.144. Calculations made by aggregating the data for
the South-East Asia and Western Pacific regions, as defined by WHO. WHO 2010c.
145. WHO 2008a146. WHO 2008b.147. Dhimal and Bhusal 2009.148. Kovats et al. 2003, cited in Haines et al. 2006.149. UNDP 2009d.150. UNICEF and WHO 2009.
151. Cruz et al. 2007.152. See WHO 2010a.153. Rahman 2008.154. Kovats et al. 2003, cited in Haines et al. 2006.155. WHO 2008a.156. WHO 2008a.157. This is in addition to the 65 million children
who are projected to remain undernourished under current climate conditions. ADB and IFPRI 2009.
158. UNESCAP et al. 2012.159. FAO 2010i.160. Behrman and Deolalikar 1990, cited in UNDP
2007a; Rose 1999, cited in UNDP 2007a.161. ADB and IFPRI 2009.162. NGI 2009.163. Möller et al. 2007.164. Lee 2009, cited in Blondel 2011.165. United Nations Security Council 2011.166. Sudarshan 2010.167. FAO 2010c.168. UNEP 2011; WRI 2011.169. UNEP 2011.170. World Bank 2011b.171. World Bank 2011b.172. World Bank 2011b.173. The countries from Asia-Pacific are: Afghanistan,
Australia, Bangladesh, Bhutan, Fiji, India, Japan, Maldives, Nauru, Pakistan, Palau, Papua New Guinea, Republic of Korea, Singapore, Sri Lanka, Thailand, Timor-Leste and Vanuatu.
174. General Assembly of the United Nations 2011.175. See Hsu and Seligsohn 2011.176. The aim of the Commission on the Measurement
of Economic Performance and Social Progress (CMEPSP) has been to: identify the limits of GDP as an indicator of economic performance and social progress; consider what additional information might be required for the production of more relevant indicators of social progress; assess the feasibility of alternative measurement tools; and discuss how to present the statistical information in an appropriate way. See Stiglitz et al. 2009.
177. UNEP 2011.178. Ocampo 2011. See also G77 and China 2010.179. According to Nielsen’s 2011 Global Environment
and Sustainability Survey, concerns about climate change among consumers globally are not as prominent as other environmental issues, such as air and water pollution, water scarcity, waste and use of pesticides. According to the survey’s findings, in 2011, 69 per cent of global online consumers have been concerned about climate change (up from 66 per cent in 2009, but

ASIA-PACIFIC HUMAN DEVELOPMENT REPORT168
down from 72 per cent in 2007). Yet, concerns for other environmental issues are assuming a higher priority in the minds of consumers, and are growing with greater intensity. Three out of four global consumers rated air pollution (77 per cent) and water pollution (75 per cent) as top concerns, both increasing 6 percentage points compared to 2009. But the areas where concern is mounting fastest among 73 per cent of respondents is worry over the use of pesticides, packaging waste and water shortages, with reported concern increasing 16, 14 and 13 percentage points, respectively. From 2009 to 2011 in Asia-Pacific, climate change concerns fell 3 points to 72 per cent. Asia-Pacific respondents were provided multiple choices for why they were not concerned about climate change. The most common responses were that ‘there are many other serious and urgent problems in the world’ (52 per cent of the respondents thought this), and that ‘technologies will take care of the problem for us’ (40 per cent). However, technologies will not be able to accomplish the change on their own. See Nielsen 2011.
180. UNESCAP n.d.
CHAPTER 2
1. Global scenario analysis also suggests the centrality of energy, industry and agriculture sectors for a lower-carbon future. See Riahi et al. 2007.
2. Based on data from WRI 2011. 3. Based on data from IEA 2010a. 4. Based on data from WRI 2011. 5. Manufacturing and construction account for
16.4, fugitive emissions account for 2.8 and industrial processes account for 6.3 percentage points.
6. Based on data from WRI 2011. 7. Based on data from United Nations 2010, cited
in Patil 2011. 8. Based on data from United Nations 2010, cited
in Patil 2011. 9. ADB 2009. 10. Greenhouse gas emissions from industrial
energy use are estimated using energy use in industries by source and emissions factors for industrial energy carriers. See Patil 2011.
11. CO2 emissions data for the year 2007 do not include those from land use change and forestry and international bunkers. See WRI 2011.
12. Based on data from United Nations 2010, cited in Patil 2011.
13. Based on APEC and ADB 2009b.
14. UNIDO 2010.15. ADB 2009.16. The country groupings belong to UNIDO’s
regional classification (UNIDO 2011).17. UNIDO 2011.18. EIA 2010; UNIDO 2011.19. UNIDO 2010.20. ADB 2009.21. Young et al. 2010.22. ADB 2009.23. Cai 2009.24. Herring 1998.25. USAID et al. 2009.26. USAID et al. 2006.27. USAID and AECEN 2004.28. USAID et al. 2005.29. UNDP 2011b.30. Palanivel 2006, cited in UNDP 2006.31. Based on data from ILO 2009. The working poor
earn below US$1.25 a day.32. ‘Vulnerable employment’ comprises unpaid
family workers and own-account workers. See ILO 2009.
33. Jarvis 2011.34. A social cost perspective includes the value of
externalities: for example, emissions that influ-ence the utility of other individuals, but which are not taken into consideration by the individuals causing them. See Halsnæs et al. 2007.
35. Williams 2011.36. Sanhati 2007.37. Peters et al. 2011.38. Helm 2008.39. IEA 2008b.40. ADB 2009.41. ADB 2009.42. UNEP 2011.43. UNDESA 2011a.44. IEA 2010c.45. UNFCCC n.d.-b.46. NDRC n.d.; Information Office of the State
Council of the People’s Republic of China 2008.
47. NDRC 2011.48. NDRC 2011.49. China Daily 2011a.50. Republic of the Philippines 1977.51. Republic of the Philippines 1999.52. C40 Cities n.d.-e.53. ADB 2009.54. Zhang 2010.55. Zhang 2010.56. Kathari et al. 2010.57. UNDP 2010h.58. WRI 2011.

NOTES 169
59. Rosegrant et al. 2010.60. Wassmann et al. 2009.61. Lal 2009.62. Pretty and Ball 2001.63. Based on data from WRI 2011.64. Wertz-Kanounnikoff and Kongphan-Apirak
2008, cited in FAO 2010c.65. FAO 2010c.66. See Gorte and Sheikh 2010.67. See Chapter 4 of this Report.68. Herrero and Thornton 2009.69. FAO 2008c.70. FAO 2008c.71. Adapted from FAO 2010b.72. Adapted from World Bank 2010d.73. APN 2009.74. UNDP 2010b.75. Acharya 2009.76. WRI 2011.77. Patil 2011.78. OPEC n.d.; BBC 2008.79. ‘Asia-Pacific’ in Figure 2.6 refers to the country
groups in APEC and ADB 2009b. These include: Central and West Asia sub-region comprising Afghanistan, Armenia, Azerbaijan, Georgia, Kazakhstan, Kyrgyzstan, Pakistan, Tajikistan, Turkmenistan and Uzbekistan; East Asia sub-region comprising Hong Kong, China (SAR), Republic of Korea, Mongolia, China and Taiwan, Province of China; the Pacific sub-region comprising Cook Islands, Fiji, Kiribati, Marshall Islands, Federated States of Micronesia, Nauru, Palau, Papua New Guinea, Samoa, Solomon Islands, Timor-Leste, Tonga, Tuvalu and Vanuatu; South Asia sub-region comprising Bangladesh, Bhutan, India, Maldives, Nepal and Sri Lanka; South-East Asia sub-region comprising Brunei Darussalam, Cambodia, Indonesia, Lao People’s Democratic Republic, Malaysia, Myanmar, the Philippines, Singapore, Thailand and Viet Nam; and the developed group including Australia, Japan and New Zealand.
80. ADB 2009.81. BP 2011.82. ADB 2009.83. BP 2011.84. IAEA 2011.85. Kalam and Singh 2011.86. APEC and ADB 2009a.87. See APEC and ADB 2009b.88. Calculations are based on data from APEC and
ADB 2009b.89. IEA 2011e.90. Patil 2011.
91. UNDP and WHO 2009; Patil 2011. Access, in the present context, considers two residential end-uses — cooking and lighting. Modern energy carriers considered for cooking are liquefied petroleum gas, kerosene, biomass-based biogas and electricity, and for lighting, electricity. In general, energy access not only means physical access to the energy carrier, but also considers qualitative aspects such as acceptable quality, affordable cost and adequate availability.
92. UNDP and WHO 2009. 93. ADB 2009. 94. IEA et al. 2010, cited in UNDP 2011f. 95. WHO 2010b. 96. UNDP and WHO 2009. 97. On an average, oil emits 40 per cent more CO2
than gas, and coal 27 per cent more than oil per unit of energy input. See EIA 1999, cited in Garnaut et al. 2008.
98. IEA 2007, cited in Garnaut et al. 2008. 99. Garnaut et al. 2008.100. IAEA 2011, based on data from IEA 2010b.101. IEA 2008b.102. Nemet and Kammen 2007, cited in UNDESA
2011a; Tavoni 2011.103. China Daily 2011b. 104. Australian Government 2011; The Economist
2011a.105. UNEP 2011.106. UNESCAP 2010c.107. IEA 2011c.108. ADB 2009.109. DOE n.d.110. The Economic Planning Unit Malaysia 2010.111. ADB 2009.112. ADB 2009.113. Mini-hydro, wind, biomass (dendro): here,
sustainably grown firewood, agricultural and industrial waste, municipal waste and waste heat recovery are identified as non-conventional renewable energy sources. See Senanayake 2009.
114. IPPAN n.d.; IDA 2009.115. Vietor and Seminerio 2008.116. Suzlon n.d.117. Edenhofer et al. 2011.118. Sudarshan 2011.119. See UNESCAP 2008.120. See UNESCAP 2008.121. China Carbon Forum n.d.122. See TERI 2011.123. SAARC Declaration 2008.124. UNEP et al. 2010.125. Ministry of Natural Resources and Environ-
ment Viet Nam 2010.

ASIA-PACIFIC HUMAN DEVELOPMENT REPORT170
126. ADB 2009.127. ADB 2009.128. UNDESA 2011a.129. UNDESA 2011a.130. UNDESA 2011a.131. UNFCCC n.d.-c.132. Republic of the Philippines 2008.133. Ministry of Natural Resources and Environ-
ment Malaysia. n.d.134. GEF 2011.135. Palang Thai n.d.136. Ministry of Energy 2009.137. Gipe 2010.138. The average exchange rate for 2007 was HK$7.8
per US dollar.139. C40 Cities n.d.-d.140. TERI 2011.141. Presiden Republik Indonesia 2011.142. PEACE n.d.; ICCTF n.d.143. UNFCCC n.d.-a.144. UNFCCC n.d.-e; see Table 19 of the Indicators
section.
CHAPTER 3
1. World Bank 2011b. 2. Victor 2008. 3. Reid et al. 2007. 4. Heltberg et al. 2009. 5. Johnson and Krishnamurthy 2010. 6. Heltberg and Lund 2009. 7. IFAD 2010. 8. Duncan 2008. 9. UNDP 2007a. 10. IFAD 2010. 11. Nelson et al. 2009. 12. Dev 2011. 13. Thaman 1982, cited in Nunn 2011; Murray
2001, cited in Nunn 2011. 14. Nelson et al. 2009. These figures do not account
for the carbon fertilisation effect. Accounting for this would result in a projected drop of 3 per cent from the figures cited.
15. Nelson et al. 2009. 16. UNDP and WHO 2009. More than 70 per cent
of the populations of Afghanistan, Bangladesh, Cambodia, India, Lao People’s Democratic Republic, Mongolia, Myanmar, Nepal, Pakistan, Papua New Guinea, Samoa, Solomon Islands, Sri Lanka, Timor-Leste and Vanuatu rely on solid fuels, while less than 70 per cent of these populations have electricity access, except for Samoa and Sri Lanka, which have higher electricity access.
17. Patil 2011. Calculations based on WHO 2010b; NationMaster 2011; UNDP and WHO 2009; UNESCAP 2010d; IEA et al. 2010.
18. Patil 2011.19. Williamson et al. 2009, cited in UNDP 2011c.20. Ramanathan and Carmichael 2008.21. Modern fuels: These refer to clean and conveni-
ent cooking fuels with minimum pollution and using modern end-use devices like LPG, kerosene, electricity and biogas.
22. Patil 2011.23. See UNESCAP 2011; ADB 2011a.24. UNESCAP 2010a.25. World Bank 2011b.26. Based on World Bank 2011b.27. See Palanivel and Gul Unal 2011 on the less
inclusive nature of growth in Asia.28. Palanivel and Gul Unal 2011.29. ADB 2007b.30. ADB 2007b. It is nevertheless well recognised
that an additional dollar to a poor person can have a proportionlately higher utility value than an additional dollar to a rich person.
31. ITU 2010. Countries in this grouping include Afghanistan, Australia, Bangladesh, Bhutan, Brunei Darussalam, Cambodia, China, Demo-cratic People’s Republic of Korea, Fiji, India, Indonesia, Iran, Japan, Kiribati, Republic of Korea, Lao People’s Democratic Republic, Malaysia, Maldives, Marshall Islands, Micronesia, Mongolia, Myanmar, Nauru, Nepal, New Zealand, Pakistan, Papua New Guinea, the Philippines, Samoa, Singapore, Solomon Islands, Sri Lanka, Thailand, Timor-Leste, Tonga, Tuvalu, Vanuatu and Viet Nam.
32. UNESCAP et al. 2010b.33. United Nations 2011b.34. ADB 2010.35. ADB 2010.36. ADB 2010.37. ADB 2010.38. OICA n.d.39. O’Neill and Stupnytska 2009.40. The Economist 2009.41. Zhao and Schroeder 2010.42. Zhao and Schroeder 2010.43. Dhakal 2009.44. Singapore Government 2009.45. The ecological footprint is a measure (in global
hectares) of how much biologically productive land and water an individual, population or activity requires to produce all the resources it consumes and to absorb the carbon dioxide emis-sions it generates using prevailing technology and

NOTES 171
resource management practices. Because trade is global, an individual’s or country’s footprint includes land or sea from all over the world.
46. Zhao and Schroeder 2010.47. ADB 2008.48. Government of Mongolia et al. 2011.49. Pingali 2007.50. FAO 2008c.51. Popkin 2001.52. See Popkin 2001 on the prevalence of overweight
and underweight individuals in the same house-holds in China; see Shetty 2002 on dietary transi-tion associated with diabetes and obesity in India.
53. Carlsson-Kanayama 1998.54. Kim and Neff 2009.55. UNESCAP 2006.56. Bates et al. 2008.57. UNESCAP 2010d.58. Bhushan 2010.59. Reid et al. 2007.60. FAO 2010a.61. FAO 2011.62. UNEP et al. 2009.63. FAO 2010a.64. Hviding and Bayliss-Smith 2000, cited in Nunn
2011.65. UNDP 2011d.66. UNDP 2011d.67. FAO 2010a.68. UNEP et al. 2009.69. FAO 2010a.70. Hassan et al. 2005.71. Bangkok Post 2009.72. BBC 2006.73. Reuters 2010.74. See Ewing et al. 2010. The carbon footprint is a
component of the ecological footprint (EF) that tracks carbon dioxide waste using ‘uptake land’ as an indicator. Uptake land means forests: carbon
uptake on land occurs in forests. The carbon footprint in the EF translates into the amount of anthropogenic carbon dioxide into the amount of productive land and sea required to sequester carbon dioxide emissions.
75. Stiglitz et al. 2009.76. Stiglitz et al. 2009.77. Ewing et al. 2010.78. AGECC 2010.79. UNDP 2011d.80. UNDP 2011c.81. IEA 2011e.82. Government of India n.d.-b.83. Patil 2011.84. Tuan 2010.85. AGECC 2010.86. Tuan 2010.
87. Patil 2011. 88. Tuan 2010. 89. Biogas Sector Partnership Nepal n.d. 90. Bajgain and Shakya 2005. 91. Bajgain and Shakya 2005. 92. Bajgain and Shakya 2005. 93. Barefoot College n.d. 94. Kamal 2010. 95. Grameen Shakti n.d. 96. The Ashden Awards for Sustainable Energy
2008. 97. ADB 2006. 98. Myles 2008. 99. ARECOP 2002.100. Tumiwa and Rambitan 2010.101. Tumiwa and Rambitan 2010.102. Nair 2011.103. Munasinghe 2011.104. United Nations 2011c.105. Zhao and Schroeder 2010.106. Hindustan Times 2011.107. Business Advantage 2009.108. Singapore Government 2011d.109. World Bank et al. 2008.110. ADB 2011b.111. C40 Cities n.d.-c.112. Yeshi 2010.113. Wagner and Cheng Wang 2009.114. Ipiv and Reinhardt 2010.115. Begum et al. 2010.116. Roychowdhury 2011.117. See, for example, Devidayal 2011.118. Ray and Pugliese 2011.119. TÜV SÜD 2011. Countries in the study in-
cluded China, India and Singapore.120. Government of India 2000.121. Nanda and Ratna 2010.122. MacGregor 2009; The Economist 2011b.123. Environmental Leader 2008; The Economist
2011b.124. Poonuchaphai 2010; The Economist 2011b.125. Carbon Disclosure Project n.d.126. Sudarshan 2011.127. Kirby 2008.128. WWF 2008a.129. Hiep 2010.130. World Bank et al. 2008.131. Bangkok Metropolitan Administration et al.
2009.
CHAPTER 4
1. The precise percentage is 60.73 per cent (cal-culated from UNDESA 2011b and UNDESA 2010b). Together, China and India account for 46 per cent of the world rural population.

ASIA-PACIFIC HUMAN DEVELOPMENT REPORT172
In the Pacific, the situation varies greatly with some countries having a large rural population
such as in Papua New Guinea (87.5 per cent), while others such as the Cook Islands have a rural population of just 25.5 per cent. See UNDESA 2010b.
2. For example, Viet Nam has made great progress in reducing rural poverty in the last decade, but, in 2008, 18.7 per cent of the rural population was still living below the poverty line, compared to 3 per cent of the urban population. See Table 2 of the Indicators section for urban and rural poverty headcount ratios.
3. See Table 2 of the Indicators section for poverty headcount ratio in urban and rural areas.
4. See Cruz et al. 2007. 5. In Asia, during the 1994–2000 period, the major-
ity (53 per cent) of the emergencies requiring international food aid were due to crop failures and drought, and an additional 29 per cent were due to sudden natural disasters (mostly floods). FAO 2001.
6. UNDP 2007a. 7. Steele et al. 2006. 8. FAO 2010f. Calculation based on percentage
of agricultural population (including those in fishery and forestry) in total population.
9. Steele et al. 2006. 10. An analysis of 14 studies across Asia indicated
that forest environmental income represents a significant income source, contributing on average 18 per cent of the household income in cash or consumption in the populations sam-pled. Vedeld et al. 2004.
11. Dev 2011.12. Lal 2009.13. ADB and IFPRI 2009; Government of Mongolia
et al. 2011.14. ADB and IFPRI 2009.15. Lymer et al. 2008.16. Thapa and Gaiha 2011.17. WWAP et al. 2006.18. In Bangladesh, the share of remittances in rural
incomes was 29 per cent in 2000. The share is also high in Nepal, Pakistan and Indonesia, at around 15 per cent of rural incomes. World Bank 2007.
19. ADB 2007a; Koontanakulvong et al. n.d.; Mirza 2011.
20. UNDP 2007a.21. Kumar 2007, cited in Nunn 2011; Nunn 2008.22. IFAD 2010.23. UNISDR 2009.24. ADB 2010.25. In Viet Nam, under-five mortality in rural areas
was twice as high as in urban areas in 2002. In the
Philippines, while the under-five mortality rate came down in both rural and urban areas between 1998 and 2003, it did so by a greater proportion in the urban areas. As a result, the rural–urban mortality ratio increased from 1.36 to 1.73 and remained high at 1.64 in 2008. In Nepal, India and Indonesia, the rural–urban ratios of under-five mortality were 1.79, 1.59 and 1.58, respectively, according to the latest figures. UNESCAP et al. 2010a.
26. WHO 2008a.27. IEA 2011e.28. World Bank 2010e.29. UNISDR 2009.30. UNESCAP and UNISDR 2010.31. UNDP 2009a.32. UNISDR 2009.33. World Bank 2010e.34. ICIMOD 2010.35. AIPP and IWGIA 2010a.36. ICIMOD 2010.37. Climate Frontlines 2010.38. Government of Mongolia et al. 2011.39. Upadhya 2009.40. ADB and IFPRI 2009.41. Rubis 2009, cited in Carling 2011.42. Salick and Byg 2007.43. Khan and Grunbuhel 2011.44. Rerkasem et al. 2009, cited in FAO 2010c.45. Carling 2011.46. European Commission et al. n.d., cited in FAO
2010c.47. USAID Asia 2010.48. See Table 19 of the Indicators section for a list of na-
tional climate change reports, strategies and plans.49. The 12 Asia-Pacific countries that have sub-
mitted a National Adaptation Programme of Action (NAPA) to the UNFCCC Secretariat as of November 2010 are: Afghanistan, Bangladesh, Bhutan, Cambodia, Kiribati, Lao People’s Democratic Republic, Maldives, Nepal, Samoa, Solomon Islands, Tuvalu and Vanuatu (UNFCCC 2010). Each NAPA identified 10 to 18 priority projects, though only a fraction of the 116 priority projects had been funded under the Least Developed Country Fund (LDCF) by mid-2011. See UNFCCC 2011b.
50. UNDESA 2009b; UNESCAP and UNISDR 2010.
51. Agrawal et al. 2008.52. Khan and Grunbuhel 2011.53. Dev 2011.54. World Bank 2010d.55. FAO 2007a.56. World Bank 2010d.

NOTES 173
57. Devraj 2010. 58. ADB and IFPRI 2009. 59. Cruz et al. 2007. 60. van der Hoek et al. 2001. 61. FAO 2010h. 62. World Bank 2010d; FAO 2010h. 63. King et al. 2007. See also Bosshard 2011; Hoanh
et al. 2010; Lymer et al. 2008. 64. Neely et al. 2009. 65. MNET 2010; Neely et al. 2009. 66. UNDP Iran n.d. 67. Thapa and Gaiha 2011. 68. World Bank 2007. 69. Thapa and Gaiha 2011. 70. Sugino 2006. 71. IFAD 2010. 72. Dev 2011. 73. World Bank 2007. 74. World Bank 2010e. 75. IFAD 2010. 76. Aguilar et al. 2007. 77. World Bank 2007. In fact, Asia is witnessing a
growing feminisation of agriculture. See UNDP 2010d.
78. Hartl 2009; Jütting and Morrisson 2009; UNDP 2010d.
79. UNIFEM et al. 2004. 80. Kabeer 2008, cited in FAO et al. 2010a. 81. FAO et al. 2010b. 82. Dev 2011. 83. IFAD 2010. 84. Winarto et al. 2008; Adaptation Knowledge
Platform 2011. 85. Baas and Ramasamy 2008. 86. Africa Commission 2010; FAO et al. 2010b. 87. FAO et al. 2010b. 88. See Mekpaiboonwattana 2011; UNESCAP and
ADBI 2005. 89. See Marcelo 2009; World Bank 2010d. 90. The Himalayan 2010. 91. Yu et al. 2010. 92. See ADB and IFPRI 2009. 93. UNDP 2010a. 94. UNISDR 2009. 95. ADB 2005. 96. NEWAH 2005. 97. Bagla 2001. 98. Winn 2010. 99. MAFF and MOWRAM 2009, cited in Yu and
Diao 2011.100. UNDP 2010e.101. WWF 2008b; UNDESA 2009b.102. Oxfam 2008.103. UNFCCC n.d.-d.
104. Narula et al. 2010.105. Thomas 2011a; Thomas 2011b.106. WRI et al. 2009.107. WRI et al. 2009.108. World Bank 2010d.109. World Bank 2010f; UNISDR 2009.110. Cruz et al. 2007.111. UNESCAP and UNISDR 2010.112. UNESCAP and UNISDR 2010.113. Government of Bangladesh 2008.114. UNESCAP and UNISDR 2010.115. See Ahmed 2005; UNDP and UNISDR
2007.116. UNESCAP and UNISDR 2010.117. Mahbub ul Haq Human Development Centre
2011.118. UNDP 2010f.119. Baulch et al. 2008.120. Khan and Grunbuhel 2011.121. Government of India 2009. See also Nath and
Behera 2011.122. UNISDR 2009.123. National Disaster Risk Reduction and Man-
agement Council 2011.124. Rasmussen et al. 2009.125. Banerjee et al. 2011.126. Barnett and O’Neill 2010.127. Warner et al. 2009.128. White et al. 2008, cited in Nunn 2011.129. Kartiki 2011.130. Banerjee et al. 2011.131. Warner et al. 2009.132. Duncan 2008, cited in Nunn 2011.133. Tong 2009.134. Republic of Kiribati 2005.135. Warner et al. 2009.136. Republic of Maldives 2007b.137. Republic of Maldives 2007a; Republic of
Maldives 2007b. Studies conducted by the Maldives government found that people were less socially vulnerable on the more populous islands (with the exception of the two overcrowded islands). A composite Human Vulnerability Index calculation, consisting of 12 living standard dimensions, indicated that the vulnerability index clearly rose for smaller populations on the Atoll. See Republic of Maldives 2007b.
138. Warner et al. 2009.139. UNDESA 2009a; SAAPE 2007.140. Warner et al. 2009.141. Dudley et al. 2010.142. Dudley et al. 2010; FAO 2010c.143. FAO 2010c.

ASIA-PACIFIC HUMAN DEVELOPMENT REPORT174
144. SCBD 2009.145. Mimura and Nunn 1998.146. Nunn 2009; Tebtebba Foundation 2009.147. World Bank 2009a.148. Mcneely 2008; World Bank 2010d.149. See Govan et al. 2009; Roe and Jack 2001.150. Reid and Swiderska 2008.151. RRI 2009.152. FAO 2010c.153. Fisher et al. 2005.154. Dudley et al. 2010.155. Dudley et al. 2010.156. For example, Jakarta draws water from Gunung
Gede Pangrango and Gunung Halimun pro-tected areas; Mumbai from the Sanjay Gandhi National Park; Singapore from Bukit Timah and the Central Catchment Area; and Sydney from the Blue Mountains and Kanangra-Boyd National Parks plus two other protected areas (Dudley et al. 2010).
157. FAO 2011.158. FAO 2010d.159. Reis et al. 2007.160. IFAD n.d.161. Bennett 2009.162. Pauli et al. 2010.163. Bennett 2009.164. Ha et al. 2008. For an analysis of the pilot project
in Lam Dong province, see Quang Tan 2011.165. Decree 99/2010/ND-CP dated 24 September
2010 on the policy on payment for forest environment services in Viet Nam. Government of Viet Nam 2010.
166. FAO 2010e.167. FAO 2010c.168. Major programmes supporting the REDD+
‘readiness process of countries’ are the World Bank Forest Carbon Partnership Facility (FCPF), Forest Investment Programme (FIP) and the UN-REDD Programme. The UN-REDD Programme is the United Nations’ collaborative initiative on Reducing Emissions from Deforestation and Forest Degradation in developing countries. It supports nationally led REDD+ processes and promotes the informed and meaningful involvement of all stakeholders, including indigenous peoples and other forest-dependent communities, in national and international REDD+ implementation. As of July 2011, Bangladesh, Bhutan, Cambodia, Indonesia, Mongolia, Nepal, Papua New Guinea, Pakistan, the Philippines, the Solomon Islands, Sri Lanka and Viet Nam were partners of the UN-REDD Programme. See UN-REDD Programme 2010.
169. UNDP 2007a.170. UNDP 2010g.171. Anderson 2011.172. Peskett et al. 2008.173. Bond et al. 2009; Wunder 2005.174. IRIN 2010, cited in Transparency International
2011.175. When referring to forest carbon rights, laws and
contracts may distinguish between sequestered carbon, carbon sinks, carbon stocks and carbon credits.
176. FAO 2011.177. Anderson 2011; Peskett et al. 2008.178. The FPIC is an instrument under the United
Nations Declaration on the Rights of Indigenous Peoples (UNRIP). Respect for UNRIP and the knowledge and rights of indigenous peoples and members of local communities have been noted in Annex I of the Cancun decision CP.16. See UNFCCC 2011a.
179. UN-REDD Programme 2009. See also Cancun decision CP.16/CPM 6 (UNFCCC 2011a).
180. Peskett et al. 2008.181. FAO 2010e; UN-REDD Programme and
Viet Nam Department of Forestry 2010.182. UN-REDD Programme and Viet Nam Depart-
ment of Forestry 2010.183. UNCDF 2010.184. Mirza 2011.185. ICIMOD 2010.186. ICIMOD 2011.187. FAO 2010j. Other regional fisheries or-
ganisations include: Pacific Islands Forum Fisheries Agency, Western and Central Pacific Fisheries Commission and Parties of the Nauru Agreement.
188. Based on Wilkinson 2008.189. The Nature Conservancy n.d.190. Mangroves for the Future n.d.191. The Times of India 2011.192. UNCCD 2011.193. Green Asia Network n.d.194. UNESCAP et al. 2010a.195. Griscom et al. 2009.196. FAO 2010c.197. UNCDF 2010.198. Agrawal et al. 2008.199. Bond et al. 2009; UNDP et al. 2010.200. UNCDF 2010.201. UNDP 2010c.202. UNCDF 2010.203. Barnett and O’Neill 2010.204. FAO 2010c.205. Preston et al. 2006; King et al. 2007.206. Nunn 2011.

NOTES 175
207. UNISDR 2009.208. UNDP et al. 2010.209. ADB and IFPRI 2009.210. See UNDP 2010c; van Aalst et al. 2008;
Veitayaki et al. 2003.211. IFAD 2010.212. UNISDR 2009.213. UNDP 2010g.214. ICIMOD 2009.215. Nunn 2011.216. UNDP 2010g.217. Dumaru 2010; IFAD 2010.218. Based on FAO et al. 2010b.219. Government of the People’s Republic of
Bangladesh 2005. It should be noted that this issue was also re-emphasised in the country’s 2009 update of its NAPA.
220. Solomon Islands Government 2008.221. UNISDR et al. 2010.222. UNDP et al. 2010.223. Nunn 2008, cited in Nunn 2011.224. Dumaru 2010.225. Reed 2010.226. Dumaru 2011.227. Posas 2007.228. ARC n.d.229. Darlington 1998.230. Pribadi and Mariany n.d.231. UNDP et al. 2010.232. World Bank 2010f.233. UNESCAP and UNISDR 2010.234. World Bank 2010f.235. UNDP 2007a.236. Glemarec 2011.237. UNDP et al. 2010.238. Glemarec 2011.239. World Bank 2010e.240. Yu et al. 2010.241. AMCDRR 2010b.242. UNDP et al. 2010.243. AGF 2010.244. Solomon 2007, cited in IFAD 2008.245. Oxfam 2011.246. UNFCCC 2009.247. Senate of the Philippines 2011b; Senate of the
Philippines 2010.248. Senate of the Philippines 2011a.249. These are: Bangladesh Climate Change Resili-
ence Fund, Cambodia Climate Change Alliance Fund, China Funds for the Environment, China CDM Fund, India Clean Energy Fund, Indonesian Climate Change Trust Fund, Maldives Climate Change Trust Fund and Thailand Energy Efficiency Revolving Fund.
250. UNDP GEF Small Grants Programme 2003.251. ADB 2007c; AusAID 2010.
CHAPTER 5
1. UNDESA 2010b. 2. Calculated from UNDESA 2011b and UNDESA
2010b 3. UN-HABITAT and UNESCAP 2010. 4. UN-HABITAT 2008. 5. SPC 2004, cited in FAO 2008a. 6. Economist Intelligence Unit 2011. 7. Refer to Table 4 of the Indicators section for
further data on slums from UN-HABITAT and UNESCAP 2010.
8. IPCC 2011. 9. UN-HABITAT 2008.10. UN-HABITAT and UNESCAP 2010.11. Based on ICLEI 2011.12. UN-HABITAT 2011.13. Alam and Rabbani 2009, cited in ICLEI 2011.14. UN-HABITAT 2011.15. Yamamoto 2006.16. UN-HABITAT and UNESCAP 2010.17. UN-HABITAT and UNESCAP 2010.18. Imura et al. 2005, cited in UN-HABITAT and
UNESCAP 2010.19. Chatterjee 2010, cited in UN-HABITAT and
UNESCAP 2010.20. Agrawal 2008.21. McIntosh 2003.22. Kovats and Akhtar 2009, cited in ICLEI 2011.23. UN-HABITAT and UNESCAP 2010.24. UN-HABITAT and UNESCAP 2010.25. FAO 2010b.26. FAO 2010b.27. Based on FAO 2007b.28. FAO 2010b.29. UN-HABITAT 2011.30. IEA 2011e.31. UN-HABITAT 2011.32. ICLEI 2011.33. World Bank et al. 2008.34. Based on World Bank 2010c.35. CRED 2006, cited in Mechler et al. 2006; ILO
2003; Nagarajan 1998; Pantoja 2002; Proshika 2005, cited in Mechler et al. 2006.
36. UN-HABITAT 2011.37. UN-HABITAT 2011.38. IEA 2008a.39. IEA 2008a.40. World Bank 2006.41. Lebel et al. 2007.42. ICLEI 2011.43. UN-HABITAT 2011.

ASIA-PACIFIC HUMAN DEVELOPMENT REPORT176
44. Years differ from city to city from 2005 to 2009. Annual GDP per person in US$ is based on current prices.
45. Economist Intelligence Unit 2011.46. UNDESA 2005.47. UN-HABITAT and UNESCAP 2010.48. UN-HABITAT and UNESCAP 2010.49. National Environment Agency 2010.50. Singapore Government 2011a.51. Singapore Government 2011b.52. Chye 2008.53. Singapore Government 2011c.54. Economist Intelligence Unit 2011.55. ADB 2008.56. Twenty-nine individual indicators are used
within these eight categories. For further details see Economist Intelligence Unit 2011.
57. Economist Intelligence Unit 2011.58. Figure refers to Nagpur’s 2010 population from
UNDESA 2010b.59. ICLEI South Asia Secretariat 2010.60. ICLEI South Asia Secretariat 2010.61. ICLEI South Asia Secretariat 2010.62. IEA 2008a.63. UNDP 2010b.64. IEA 2008a.65. Bai 2007, cited in UN-HABITAT and UNESCAP
2010.66. Hepburnwind n.d.67. Economist Intelligence Unit 2011.68. C40 Cities n.d.-f.69. C40 Cities n.d.-a.70. World Bank et al. 2008.71. C40 Cities n.d.-g.72. Zhao and Schroeder 2010.73. WBCSD 2004, cited in Zhao and Schroeder 2010.74. World Bank et al. 2008.75. National Institute of Urban Affairs 2011.76. PR Newswire 2010.77. Amin 2009.78. Amin 2009.79. Amin 2009.80. APEIS and RISPO 2003.81. Approximately US$610,000 as per the 1 November
2011 exchange rate.82. Lalchandani 2011.83. Lalchandani 2011.84. C40 Cities n.d.-h.85. De Angelis 2011.
86. Barde 2011. 87. C40 Cities n.d.-b. 88. Economist Intelligence Unit 2011. 89. Economist Intelligence Unit 2011. 90. Economist Intelligence Unit 2011. 91. Singapore Government 2009, cited in Zhao and
Schroeder 2010. 92. See for example BBC 2011. 93. UNESCAP 2010b. 94. Economist Intelligence Unit 2011. 95. APEIS and RISPO 2004. 96. Environmental Protection Administration n.d. 97. ESMAP and FEU 2008. 98. C40 Cities n.d.-i. 99. UN-HABITAT and UNESCAP 2010.100. Tanner et al. 2009.101. UN-HABITAT and UNESCAP 2010.102. Tanner et al. 2009.103. Tanner et al. 2009.104. UN-HABITAT and UNESCAP 2010.105. Tanner et al. 2009.106. Tanner et al. 2009.107. Economist Intelligence Unit 2011.108. World Bank 2010b.109. Economist Intelligence Unit 2011.110. Pacific Adaptation to Climate Change 2011.111. World Bank et al. 2008.112. World Bank 2010a.113. World Bank 2011a.114. IPCC 2011.
CHAPTER 6
1. Based on World Bank 2011b. 2. WHO 2011b. 3. Sudarshan 2010. 4. UNDP 2011a. 5. The Secretary’s-General High-Level Advisory
Group on Climate Change Financing (AGF 2010) identified various potential sources of finance and grouped them into four categories: (a) public sources; (b) development bank instruments; (c) carbon market finance; and (d) private capital. These different sources of funding need to be combined into an overall package of funding to achieve a low-carbon growth strategy in developing countries.
6. UNDP 2011d.

BIBLIOGRAPHY 177
Abayao, Leah Enkiwe, Jo Ann Guillao, Mikara Jubay and Helen Magata. 2009. ‘Climate change and indigenous peoples in the Philippines: The Calamian Tagbanua and the Ikalahan views and actions on climate change’. Paper presented during the Asia Summit on Climate Change and Indigenous Peoples. 24–27 February. Bali, Indonesia. Unpublished.
Acharya, Keya. 2009. ‘Women farmers ready to beat climate change’. IPS. 17 March. [http://ipsnews.net/news.asp?idnews=46131]. Last accessed on 30 April 2011.
ActionAid, Concern WorldWide, DanChurchAid, MuslimAid, Islamic Relief, Oxfam-GB and Save the Children-UK. 2009. ‘In-depth recovery needs assessment of Cyclone Aila affected areas’. 25–31 October. [http://reliefweb.int/sites/reliefweb.int/files/resources/F6603B7EF22A16B4C125768D004B1190-Full_Report.pdf]. Last accessed on 8 May 2011.
Adaptation Knowledge Platform. 2011. Practitioners and policy-makers exchange on climate change adaptation in agriculture: Frequently asked questions booklet. Regional climate change adaptation knowledge platform for Asia. AIT-UNEP Regional Resource Centre for Asia and the Pacific.
ADB (Asian Development Bank). 2011a. Asia 2050: Realizing the Asian century. Manila: ADB.
———. 2011b. Samoa: Building a more resilient econ-omy. Development Effectiveness Brief. Manila: ADB.
———. 2010. Key indicators for Asia and the Pacific 2010. Special chapter: ‘The rise of Asia’s middle class’. Manila: ADB.
———. 2009. Improving energy security and reducing carbon intensity in Asia and the Pacific. Manila: ADB.
———. 2008. Managing Asian cities: Sustainable and inclusive urban solutions. Manila: ADB.
———. 2007a. Asian water development outlook 2007: Achieving water security for Asia. Manila: ADB.
———. 2007b. Key indicators 2007. Manila: ADB.———. 2007c. Promoting climate change adaptation in
Asia and the Pacific. Technical Assistance Report. Project No. 39343. Manila: ADB.
———. 2006. Clean energy applications in Asia and the Pacific. Manila: ADB.
———. 2005. Climate proofing: A risk based approach to adaptation. Pacific studies Series. Manila: ADB.
———. n.d. ‘Combating desertification in Asia’. [http://www.adb.org/environment/desertification.asp]. Last accessed on 3 November 2011.
ADB (Asian Development Bank) and IFPRI (International Food Policy Research Insti-tute). 2009. Building climate resilience in the agri-culture sector of Asia and the Pacific. Mandaluyong City, Philippines: ADB.
ADB (Asian Development Bank), DFID (Depart-ment for International Development) and Clean Air Initiative for Asian Cities. 2006. Energy efficiency and climate change considerations for on-road transport in Asia. Manila: ADB.
ADB (Asian Development Bank), Government of Pakistan and World Bank. 2010. Pakistan floods 2010: Preliminary damage and needs assessment. [http://www.gfdrr.org/gfdrr/sites/gfdrr.org/files/publication/Pakistan_DNA.pdf]. Last accessed on 28 July 2011.
Addu Declaration. 2011. ‘Building bridges’. 17th SAARC Summit. 14 November. [http://www.saarc-sec.org/2011/11/14/news/ADDU-DECLARATION/79/]. Last accessed on 19 November 2011.
Africa Commission. 2010. Growth and employment: Visions at work. Progress report of the Africa Commission. Copenhagen: Secretariat of the Africa Commission, Ministry of Foreign Affairs of Denmark.
AGECC (The Secretary-General’s Advisory Group on Energy and Climate Change). 2010. Energy for a sustainable future: Summary report and recommendations. New York: AGECC, United Nations.
AGF (The Secretary-General’s Advisory Group on Climate Change Financing). 2010. Report of the Secretary-General’s high-level advisory group on climate change financing. 5 November. New York: United Nations.
Agrawal, Arun, Catherine McSweeney and Nicolas Perrin. 2008. ‘Local institutions and climate change adaptation’. Social Development Notes No. 113. [http://go.worldbank.org/SD8MH5HLU0]. Last accessed on 15 August 2011.
Agrawal, Pronita Chakrabarti. 2008. Designing an effective leakage reduction and management program. WSP Field Note. New Delhi: Water and Sanita-tion Program, South Asia.
BIBLIOGRAPHY

ASIA-PACIFIC HUMAN DEVELOPMENT REPORT178
Aguilar, Lorena, Ariana Araujo and Andrea Quesada-Aguilar. 2007. Gender and climate change fact sheet. Gland: IUCN.
Ahmed, Imtiaz. 2009. ‘Environmental refugees and environmental distress migration as a security challenge for India and Bangladesh’. In: Hans Günter Brauch, Ursula Oswald Spring, John Grin, Czeslaw Mesjasz, Patricia Kameri-Mbote, Navnita Chadha Behera, Béchir Chourou and Heinz Krummenacher, eds. Facing global environmental change: Environmental, human, energy, food, health and water security concepts. Hexagon Series on Human and Environmental Security and Peace. Vol. 4. Berlin and Heidelberg: Springer.
Ahmed, K. Iftekhar. 2005. Handbook on design and construction of housing for flood-prone rural areas of Bangladesh. Dhaka: ADPC, Bangladesh Disaster Preparedness Centre, CARE-Bangladesh, Bangladesh Ministry of Food and Disaster Management/Comprehensive Disaster Management Programme and BRAC University.
AIPP (Asia Indigenous Peoples’ Pact). 2010a. REDD+ implementation in Asia and the concerns of indigenous peoples. Chiang Mai: AIPP.
———. 2010b. Report of the Asia regional seminar on indigenous peoples and traditional livelihoods. Event co-organised by UNDP Regional Indigenous Peoples Programme and AIPP. 16–18 August. Siem Reap Province.
AIPP (Asia Indigenous Peoples’ Pact) and IWGIA (International Work Group for Indigenous Affairs). 2010a. REDD+ and indigenous peoples: A briefing paper for policy makers. Chiang Mai: AIPP and IWGIA.
———. 2010b. Who we are — Indigenous peoples in Asia. Chiang Mai and Copenhagen: AIPP and IWGIA.
Alam, Mozaharul and M. D. Golam Rabbani. 2009. ‘Vulnerabilities and responses to climate change for Dhaka’. In: Jane Bicknell, David Dodman and David Satterthwaite, eds. Adapting cities to climate change: Understanding and addressing the development challenges. London: Earthscan.
Alber, Gotelind. 2010. Gender, cities and climate change. Thematic report prepared for cities and climate change report on human settlements 2011. [http://www.unhabitat.org/downloads/docs/GRHS2011/GRHS2011ThematicStudyGender.pdf]. Last accessed on 9 June 2011.
Allison, Edward H., Allison L. Perry, Marie-Caroline Badjeck, W. Neil Adger, Katrina Brown, Declan Conway, Ashley S. Halls,
Graham M. Pilling, John D. Reynolds, Neil L. Andrew and Nicholas K. Dulvy. 2009. ‘Vulnerability of national economies to the impacts of climate change on fisheries’. Fish and Fisheries 10 (2): 173–96.
AMAN (Aliansi Masyarakat Adat Nusantara). 2010. Country technical note on indigenous peoples’ issues — Indonesia. IFAD and AIPP. Draft. [http://www.ifad.org/english/indigenous/pub/documents/tnotes/indonesia.pdf]. Last accessed on 27 June 2011.
AMCDRR (Asian Ministerial Conference on Disaster Risk Reduction). 2010a. ‘Incheon declaration on disaster reduction in Asia and the Pacific 2010’. 4th Asian Ministerial Conference on ‘Disaster risk reduction’. 25–28 October. Incheon, Republic of Korea.
———. 2010b. ‘Incheon Regional Roadmap and Action Plan on DRR through CCA in Asia and the Pacific (Incheon REMAP)’. Adopted at the 4th Asia Ministerial Conference on DRR. 28 October. Incheon, Republic of Korea. [http://www.unisdr.org/files/16172_roadmapfinalversion08272350.pdf]. Last accessed on 15 August 2011.
Amin, A. T. M. Nurul. 2009. Reducing emissions from private cars: Incentive measures for behavioural change. UNEP. [http://www.unep.ch/etb/publications/Green%20Economy/Reducing%20emissions/UNEP%20Reducing%20emissions%20from%20private%20cars.pdf]. Last accessed on 9 June 2011.
Anand, P. B. 2011. ‘Climate change and water: Impacts to human health and consumption’. Technical background paper for the Asia-Pacific Human Development Report, One planet to share: Sus-taining human progress in a changing climate.
Anderson, Patrick. 2011. Free, prior, and informed con-sent in REDD+: Principles and approaches for policy and project development. Bangkok: RECOFTC and GIZ.
APEC (Asia-Pacific Economic Cooperation) and ADB (Asian Development Bank). 2009a. Energy outlook for Asia and the Pacific. Manila: ADB.
———. 2009b. Energy statistics in Asia and the Pacific (1990–2006). Manila: ADB.
APEIS (Asia-Pacific Environmental Innovation Strategies) and RISPO (Research on Innova-tive and Strategic Policy Options). 2004. ‘Deposit-refund systems for PET bottles in Taiwan’. Good practices inventory. [http://enviroscope.iges.or.jp/contents/APEIS/RISPO/inventory/db/pdf/0133.pdf]. Last accessed on 9 June 2011.
———. 2003. ‘Introduction of electric three-wheelers in Kathmandu, Nepal’. Good practices inventory.

BIBLIOGRAPHY 179
[http://enviroscope.iges.or.jp/contents/APEIS/RISPO/inventory/db/pdf/0018.pdf]. Last accessed on 9 June 2011.
APN (Asia-Pacific Network for Global Change Research). 2009. Biochar for carbon reduc-tion, sustainable agriculture and soil management (BIOCHARM). Chuo-ku, Kobe, Japan: Asia-Pacific Network for Global Change Research.
ARC (Alliance of Religions and Conservation). n.d. ‘India: Hindus restore sacred forests in Orissa’. [http://www.arcworld.org/projects.asp?projectID=172]. Last accessed on 28 June 2011.
ARECOP (Asia Regional Cookstove Program). 2002. The Anagi stove manual. Yogakarta: ARECOP.
Arnell, N. W., M. G. R. Cannell, M. Hulme, R. S. Kovats, J. F. B. Mitchell, R. J. Nicholls, M. L. Parry, M. T. J. Livermore and A. White. 2002. ‘The consequences of CO2 stabilisation for the impacts of climate change’. Climatic Change 53 (4): 413–46.
ASEAN (Association of Southeast Asian Nations). 2010. ASEAN Plan of Action for energy cooperation 2010–2015. Jakarta: ASEAN Secretariat. [http://www.asean.org/22675.pdf]. Last accessed on 19 November 2011.
———. 2009. Roadmap for an Asian Community 2009–2015. Jakarta: ASEAN Secretariat.
ASEAN Declaration. 2007. ASEAN Declaration on the 13th Session of the Conference of Parties (COP) to the UN Framework Convention on Climate Change (UNFCCC) and the 3rd Session of the Conference of the Parties Serving as the Meeting of the Parties (CMP) to the Kyoto Protocol. [http://www.asean.org/21079.htm]. Last accessed on 19 November 2011.
AusAID (Australian Agency for International Development). 2010. ‘International climate change adaptation initiative’. Last updated in July 2010. [http://www.ausaid.gov.au/keyaid/adaptation_initiative.cfm]. Last accessed on 17 June 2011.
Australian Government. 2011. Securing a clean energy future: The Australian Government’s climate change plan. Canberra: Commonwealth of Australia.
Baas, Stephan and Selvaraju Ramasamy. 2008. Community based adaptation in action: A case study from Bangladesh. Project Summary Report (Phase I). Improved Adaptive Capacity to Climate Change for Sustainable Livelihoods in the Agriculture Sector. FAO Environment and Natural Resources Management Series No. 14. FAO and Department of Agricultural Extension, Bangladesh. Rome: FAO.
Bagla, Pallava. 2001. ‘“Artificial glaciers” aid farmers in Himalayas’. National Geographic News. 4 September.
Bai, Xuemei M. 2007. ‘Integrating global environ-mental concerns into urban management: The scale and the readiness arguments’. Journal of Industrial Ecology 11 (2): 15–29.
Bajgain, Sundar and Indira Shakya. 2005. The Nepal biogas support program: A successful model of public private partnership for rural household energy supply. Kathmandu: Ministry of Foreign Affairs, the Netherlands, SNV-Netherlands Development Organisation and Biogas Sector Partnership — Nepal.
Bajracharya, Samjwal Ratna, Pradeep Kumar Mool and Basanta Raj Shrestha. 2007. Impact of climate change on Himalayan glaciers and glacial lakes: Case studies on GLOF and associated hazards in Nepal and Bhutan. International Centre for Integrated Mountain Development (ICIMOD), in cooperation with United Nations Environ-ment Programme Regional Office Asia and the Pacific (UNEP/ROAP). Kathmandu: ICIMOD.
Baker, Judy L. 2008. Urban poverty: A global view. Urban Papers. Washington, D.C.: World Bank.
Bakosurtanal (Coordinating Agency for National Survey and Mapping). 2009. Peta mangroves Indonesia (Indonesia mangroves map). Bogor, Indonesia: Bakosurtnal.
Banerjee, Soumyadeep, Jean Yves Gerlitz and Brigitte Hoermann. 2011. Labour migration as a response strategy to the water hazards in the Hindu Kush-Himalayas. Kathmandu: ICIMOD.
Bangkok Metropolitan Administration, Green Leaf Foundation and UNEP (United Nations Environment Programme). 2009. Bangkok assessment report on climate change 2009. Bangkok: BMA, GLF and UNEP.
Bangkok Post. 2009. ‘Mae Mo villagers win case against Egat’. 4 March.
Barde, Sameer. 2011. ‘Rebuilding nature’. The Times of India. 22 April.
Barefoot College. n.d. ‘Solar energy: Work done’. [http://www.barefootcollege.org/sol_work.asp]. Last accessed on 12 June 2011.
Barnett, Jon and Saffron O’Neill. 2010. ‘Maladaptation’. Editorial. Global Environmental Change 20: 211–13.
Bartlett, Sheridan. 2008. Climate change and urban children: Impacts and implication for adaptation in low- and middle-income countries. Human Settlements Discussion Paper Series. London: International Institute for Environment and Development.
ASIA-PACIFIC HUMAN DEVELOPMENT REPORT180
Bashir, Sultana. 2011. ‘Climate change and eco-system services in Asia-Pacific’. Technical background paper for the Asia-Pacific Human Development Report, One planet to share: Sustaining human progress in a changing climate.
Bates, B., Z. W. Kundzewick, S. Wu and J. Palutikof, eds. 2008. Climate change and water. IPCC Technical Paper No. VI. Geneva: Intergovernmental Panel on Climate Change Secretariat.
Baulch, Bob, Alex Weber and Joe Wood. 2008. Social protection index for committed poverty reduction. Vol. 2: Asia. Manila: ADB.
BBC. 2011. ‘Megacity Singapore under spotlight’. BBC News Asia-Pacific. 21 June.
———. 2008. ‘Indonesia to withdraw from OPEC’. BBC News. 28 May.
———. 2006. ‘HK pollution protest dims lights’. BBC News. 8 August.
Begum, Jasmin Ara, Rumana Rashid and Md. Mahfil Ali. 2010. ‘Contextual mitigation measures of air pollution by reducing travel demand in Dhaka city’. Paper presented at the Annual Asian Business Research Conference. 1–2 January. Dhaka.
Behrman, Jere R. and Anil Deolalikar. 1990. ‘The intra-household demand for nutrients in rural south India: Individual estimates, fixed effects and permanent income’. Journal of Human Resources 24 (4): 655–96.
Bennett, Michael T. 2009. Markets for ecosystem services in China: An exploration of China’s ‘eco-compensation’ and other market-based environmental policies. A Report from Phase I Work on an Inventory of Initiatives for Payments and Markets for Ecosystem Services in China. Washington, D.C.: Forest Trends.
Bhushan, Chandra. 2010. Challenge of the new balance. New Delhi: Centre for Science and Environment.
Billett, Simon. 2011. ‘Regional and international climate change negotiations: Status, debates and dilemma’. Technical note for the Asia-Pacific Human Development Report, One planet to share: Sustaining human progress in a changing climate.
Biogas Sector Partnership Nepal. n.d. ‘Introduc-tion of BSP-Nepal’. [http://www.bspnepal.org.np/about-us]. Last accessed on 20 June 2011.
Blitz, Brad K. 2011. ‘Climate change, location security and migration’. Technical background paper for the Asia-Pacific Human Development Report, One planet to share: Sustaining human progress in a changing climate.
Blondel, Alice. 2011. ‘Climate change fuelling resource-based conflicts in Asia-Pacific’. Tech-nical background paper for the Asia-Pacific Human Development Report, One planet to share: Sustaining human progress in a changing climate.
Bond, Ivan, Maryanne Grieg-Gran, Sheila Wertz-Kanounnikoff, Peter Hazlewood, Sven Wunder and Arild Angelsen. 2009. Incentives to sustain forest ecosystem services: A review and lessons for REDD. Natural Resource Issues No. 16. London, Bogor and Washington, D.C.: International Institute for Environment and Development, CIFOR and World Resources Institute.
Boonyabancha, Somsook. 2005. ‘Baan Mankong: Going to scale with “slum” and squatter upgrading in Thailand’. Environment and Urbanization 17 (1): 21–46.
Bosshard, Peter. 2011. ‘Mighty Mekong to be dammed?’ Huffpost Green. 1 April.
BP (British Petroleum). 2011. BP statistical review of world energy June 2011. London: BP.
Brady, Brendan and Sorng Rukavorn. 2011. ‘Battle of the jungle’. Time Magazine. 20 June.
Burke, Lauretta, Kathleen Reytar, Mark Spalding and Allison Perry. 2011. Reefs at risk. Revisited. Washington, D.C.: World Resources Institute.
Business Advantage. 2009. ‘Going green in the Asia-Pacific region’. October. [http://www.business-advantage.com/iCT_Archive/Going%20Green%20in%20APAC.pdf]. Last accessed on 12 June 2011.
C40 Cities. n.d.-a. ‘Buildings — Melbourne, Australia’. [http://www.c40cities.org/bestpractices/buildings/melbourne_eco.jsp]. Last accessed on 9 June 2011.
———. n.d.-b. ‘Buildings — Tokyo, Japan’. [http://www.c40cities.org/bestpractices/buildings/tokyo_green_building.jsp]. Last accessed on 9 June 2011.
———. n.d.-c. ‘Energy: Changwon, Republic of Korea — Carbon mileage’. [http://www.c40cities.org/bestpractices/energy/changwon_korea_carbon_mileage.jsp]. Last accessed on 12 June 2011.
———. n.d.-d. ‘Energy: Hong Kong — Combined heat and power generation system’. [http://www.c40cities.org/bestpractices/energy/hongkong_chp.jsp]. Last accessed on 14 June 2011.
———. n.d.-e. ‘Energy: Melbourne, Australia — Melbourne has reduced CO2 emissions by 1.1 million by making energy audits mandatory’. [http://www.c40cities.org/bestpractices/energy/melbourne_greenhouse.jsp]. Last accessed on 14 June 2011.

BIBLIOGRAPHY 181
———. n.d.-f. ‘Lighting — Citywide, Viet Nam’. [http://www.c40cities.org/bestpractices/lighting/vietnam_lighting.jsp]. Last accessed on 9 June 2011.
———. n.d.-g. ‘Lighting — Hong Kong: LED traffic light retrofit’. [http://www.c40cities.org/bestpractices/lighting/hongkong_led.jsp]. Last accessed on 9 June 2011.
———. n.d.-h. ‘Transport — Seoul, South Korea’. [http://www.c40cities.org/bestpractices/transport/seoul_driving.jsp]. Last accessed on 7 June 2011.
———. n.d.-i. ‘Waste — Dhaka, Bangladesh’. [http://www.c40cities.org/bestpractices/waste/dhaka_organic.jsp]. Last accessed on 9 June 2011.
Cai, Wenjia. 2009. ‘GHG reduction opportunities in China’s iron and steel sector’. Tsinghua Uni-versity. [http://www.ccap.org/docs/resources/903/GHG_Reduction_opportunities_Chinas_cement,iron,steel_and_electricity_sectors.pdf]. Last accessed on 2 September 2011.
Cao Phan, Viet. 2009. ‘Indigenous peoples’ local mitigation and adaptation measures to address climate change: A case from Kep a village, Minh Son Commune, Bac Me District, Ha Gian Province’. Paper presented during the Asia Summit on Climate Change and Indigenous Peoples. 24–27 February. Bali, Indonesia. Unpublished.
Carbon Disclosure Project. n.d. ‘Overview’. [https://www.cdproject.net/en-US/WhatWeDo/Pages/overview.aspx]. Last accessed on 12 June 2011.
Carling, Joan. 2011. ‘Indigenous peoples, vulner-ability and climate change’. Technical note for the Asia-Pacific Human Development Report, One planet to share: Sustaining human progress in a changing climate.
Carlsson-Kanayama, Annika. 1998. ‘Climate change and dietary choices: How can emissions of greenhouse gases from food consumption be reduced?’ Food Policy 23 (3/4): 277–93.
Chandrasekhar, C. P. 2011. ‘Climate change, growth and human development’. Technical background paper for the Asia-Pacific Human Development Report, One planet to share: Sustain-ing human progress in a changing climate.
Chatterjee, Patralekha. 2010. ‘South Asia’s thirsty cities search for solutions’. The Lancet 359 (9322): 2010.
China Carbon Forum. n.d. ‘About’. [http://www.chinacarbon.info/?page_id=2]. Last accessed on 11 June 2011.
China Daily. 2011a. ‘16 pct cut in energy consumption per unit of GDP’. 5 March. [http://www.chinadaily.com.cn/china/2011npc/2011-03/05/content_12121180.htm]. Last accessed on 22 August 2011.
———. 2011b. ‘Carbon tax likely, expert forecasts’. 10 May. [http://www.chinadaily.com.cn/china/2010-05/10/content_9826546.htm]. Last accessed on 28 June 2011.
Chipko Information Centre. n.d. ‘Chipko movement, India’. [http://www.iisd.org/50comm/commdb/desc/d07.htm]. Last accessed on 5 September 2011.
Choudhary, Biplove. 2011. ‘“Interlinked geo-graphies”: Select aspects of ecological footprints associated with trade and global supply chains’. Technical note for the Asia-Pacific Human Development Report, One planet to share: Sus-taining human progress in a changing climate.
Chun, Natalie. 2010. Middle class size in the past, present, and future: A description of trends in Asia. ADB Economics Working Paper Series. No. 217. Manila: Asian Development Bank.
Chye, Hui Sze. 2008. ‘Tianjin eco-city breaks new ground’. Skyline. Newsletter September–October. [http://www.ura.gov.sg/skyline/skyline08/skyline08-05/text/03.htm]. Last accessed on 24 August 2011.
CIESIN (Center for International Earth Science Information Network). 2007. ‘Low Elevation Coastal Zone (LECZ) urban-rural estimates’. Global Rural–Urban Mapping Project, Alpha Version. Palisades, NY: Columbia University, SEDAC (Socioeconomic Data and Applications Center).
Clarke, Pepe and Stacy Jupiter. 2010. Principles and practice of ecosystem-based management: A guide for conservation practitioners in the tropical western Pacific. Suva: Wildlife Conservation Society.
Climate Frontlines. 2010. ‘Climate change impacts on nomadic herders’. 29 September. [http://www.climatefrontlines.org/?q=en-GB/node/577]. Last accessed on 17 June 2011.
Confalonieri, U., B. Menne, R. Akhtar, K. L. Ebi, M. Hauengue, R. S. Kovats, B. Revich and A. Woodward. 2007. ‘Human health’. In: IPCC. Climate change 2007: Impacts, adaptation and vulnerability. Contribution of Working Group II to the Fourth Assessment Report of the Intergovernmental Panel on Climate Change (M. L. Parry, O. F. Canziani, J. P. Palutikof, P. J. van der Linden and C. E. Hanson, eds). Cambridge, UK: Cambridge University Press.

ASIA-PACIFIC HUMAN DEVELOPMENT REPORT182
Corcoran, Emily, Christian Nellemann, Elaine Baker, Robert Bos, David Osborn and Heidi Savelli, eds. 2010. Sick water? The central role of wastewater management in sustainable development. A rapid response assessment. United Nations Environment Programme and UN-HABITAT. Arendal: UNEP GRID-Arendal.
CRED (Centre for Research on the Epidemiology of Disasters). 2006. EM-DAT: International disaster database. Brussels: Centre for Research on the Epidemiology of Disasters, Université Catholique de Louvain.
Crowell, Piper. n.d. ‘Seas threaten Bernard’s island home in Papua New Guinea’. Climate change. [http://www.un.org/works/sub3.asp?lang=en&id=26]. Last accessed on 26 September 2011.
Cruz, R. V., H. Harasawa, M. Lal, S. Wu, Y. Anokhin, B. Punsalmaa, Y. Honda, M. Jafari, C. Li and N. Huu Ninh. 2007. ‘Asia’. In: IPCC. Climate change 2007: Impacts, adaptation and vulnerability. Contribution of Working Group II to the Fourth Assessment Report of the Intergovernmental Panel on Climate Change (M. L. Parry, O. F. Canziani, J. P. Palutikof, P. J. van der Linden and C. E. Hanson, eds). Cambridge, UK: Cambridge University Press.
Darlington, Susan M. 1998. ‘The ordination of a tree: The Buddhist ecology movement in Thailand’. Ethnology 37 (1): 1–15.
Dasgupta, Susmita, Benoit Laplante, Siobhan Murray and David Wheeler. 2009. Climate change and the future impacts of storm-surge disasters in developing countries. Working Paper No. 182. Washington, D.C.: Centre for Global Development.
De Angelis, Andrea. 2011. ‘Human development and capacity response (from analytical framework of the China NHDR 2010) and the Guiyang case study’. Technical note for the Asia-Pacific Human Development Report, One planet to share: Sustaining human progress in a changing climate. Policy Support Team, UNDP China.
Dercon, S. 2005. Risk and poverty: A selective review. Department of Economics, Oxford University.
Dermawan, Ahmad, Elena Petkova, Anna Sinaga, Mumu Muhajir and Yayan Indriatmoko. 2011. Preventing the risk of corruption in REDD+ in Indonesia. Working Paper No. 80. Jakarta and Bogor: United Nations Office on Drugs and Crime and Centre for International Forestry Research.
Dev, Mahendra S. 2011. ‘Climate change, rural livelihoods and agriculture (focus on food
security) in Asia-Pacific’. Technical background paper for the Asia-Pacific Human Development Report, One planet to share: Sustaining human progress in a changing climate.
Devidayal, Namita. 2011. ‘Don’t kid me, daddy!’ The Times of India. 23 January.
Devraj, Ranjit. 2010. ‘Staying afloat with submarine rice’. IPS. 26 September.
DFID (Department for International Devel-opment, UK). 2004. Agricultural sustainability. Paper prepared by the Agriculture and Natural Resources Team of the UK Department for International Development in collaboration with Jules Pretty of the Department of Biological Sciences, University of Essex. Working Paper No. 12. DFID.
Dhakal, Shobhakar. 2009. ‘Urban energy use and carbon emissions from cities in China and policy implications’. Energy Policy 37 (11): 4208–19.
Dhimal, Meghnath and C. L. Bhusal. 2009. ‘Impacts of climate change on human health and adaptation strategies for Nepal’. Journal of Nepal Health Research Council 7 (15): 140–41.
DOE (Department of Energy). n.d. ‘Energy resources: Renewable energy’. DOE portal, official website of the Philippine Department of Energy. [http://www.doe.gov.ph/er/renenergy.htm]. Last accessed on 14 June 2011.
Donato, Daniel C., J. Boone Kauffman, Daniel Murdiyarso, Sofyan Kurnianto, Melanie Stidham and Markku Kanninen. 2011. ‘Mangroves among the most carbon-rich forests in the tropics’. Nature Geoscience 4: 293–97.
Dudley, Nigel, Sue Stolton, Alexander Belokurov, Linda Krueger, Nik Lopoukhine, Kathy MacKinnon, Trevor Sandwith and Nik Sekhran, eds. 2010. Natural solutions: Protected areas helping people cope with climate change. A report funded and commissioned by IUCN-WCPA, TNC, UNDP, WCS, the World Bank and WWF. Gland, Washington, D.C., and New York: IUCN-WCPA, TNC, UNDP, WCS, World Bank and WWF.
Dumaru, Patrina. 2011. ‘Enhancing the capacity of local communities to adapt to climate change’. In: UNDP (United Nations Development Programme). E-discussion on climate change and human development. Asia-Pacific Human Development Network. Bangkok: UNDP Asia-Pacific Regional Centre.
———. 2010. ‘Community-based adaptation: Enhancing community adaptive capacity in Druadrua Island, Fiji’. Wiley Interdisciplinary Reviews: Climate Change 1 (5): 751–63.

BIBLIOGRAPHY 183
Duncan, Ron. 2008. ‘Cultural and economic tensions in Pacific Islands’ futures’. International Journal of Social Economics 35 (12): 919–29.
EACH-FOR (Environmental Change and Forced Migration Scenarios). 2009. ‘Bangladesh case study report’. Prepared by Alice Poncelet. [http://www.each-for.eu/documents/CSR_Bangladesh_090126.pdf]. Last accessed on 25 June 2011.
Easterling, W. E., P. K. Aggarwal, P. Batima, K. M. Brander, L. Erda, S. M. Howden, A. Kirilenko, J. Morton, J.-F. Soussana, J. Schmidhuber and F. N. Tubiello. 2007. ‘Food, fibre and forest products’. In: IPCC. Climate change 2007: Impacts, adaptation and vulnerability. Contribution of Working Group II to the Fourth Assessment Report of the Intergovernmental Panel on Climate Change (M. L. Parry, O. F. Canziani, J. P. Palutikof, P. J. van der Linden and C. E. Hanson, eds). Cambridge, UK: Cambridge University Press.
Economist Intelligence Unit. 2011. Asian green cities index: Assessing the environmental performance of Asia’s major cities. Munich: Siemens AG.
Economy, Elizabeth. 2007. ‘China vs earth’. The Nation. 19 April.
Edenhofer, O., R. Pichs-Madruga, Y. Sokona, K. Seyboth, D. Arvizu, T. Bruckner, J. Christensen, J.-M. Devernay, A. Faaij, M. Fischedick, B. Goldstein, G. Hansen, J. Huckerby, A. Jäger-Waldau, S. Kadner, D. Kammen, V. Krey, A. Kumar, A. Lewis, O. Lucon, P. Matschoss, L. Maurice, C. Mitchell, W. Moomaw, J. Moreira, A. Nadai, L. J. Nilsson, J. Nyboer, A. Rahman, J. Sathaye, J. Sawin, R. Schaeffer, T. Schei, S. Schlömer, R. Sims, A. Verbruggen, C. von Stechow, K. Urama, R. Wiser, F. Yamba and T. Zwickel. 2011. ‘Summary for policy makers’.In: IPCC. Special report on renewable energy sources and climate change mitigation (O. Edenhofer, R. Pichs-Madruga, Y. Sokona, K. Seyboth, P. Matschoss, S. Kadner, T. Zwickel, P. Eickemeier, G. Hansen, S. Schlömer and C. V. Stechow, eds). Cambridge, UK, and New York: Cambridge University Press.
EIA (Energy Information Administration). 2010. International energy outlook 2010. US Department of Energy. Washington, D.C.: EIA.
———. 1999. Natural gas 1998: Issues and trends. US Department of Energy. Washington, D.C.: EIA.
EM-DAT. n.d. The OFDA/CRED international disaster database. Brussels, Belgium: Université
Catholique de Louvain. [www.emdat.be]. Last accessed on 5 September 2011.
Environmental Leader. 2008. ‘Japanese Govt launching carbon label program’. 21 August. [http://www.environmentalleader.com/2008/08/21/japanese-govt-launching-carbon-labeling-program/]. Last accessed on 12 June 2011.
Environmental Protection Administration. n.d. Mitigating climate change: What Taiwan is doing. [http://unfccc.epa.gov.tw/unfccc/english/_uploads/downloads/03_Mitigating_Climate_Change-What_Taiwan_is_Doing.pdf]. Last accessed on 7 June 2011.
Eriksson, Mats, Xu Jianchu, Arun Bhakta Shrestha, Ramesh Ananda Vaidya, Santosh Nepal and Klas Sandström. 2009. The changing Himalayas: Impact of climate change on water resources and livelihoods in the greater Himalayas. Kathmandu: ICIMOD.
Erni, Christian, ed. 2008. The concept of indigenous peoples in Asia: A resource book. International Work Group for Indigenous Affairs (IWGIA) Document No. 123. Copenhagen and Chiang Mai: IWGIA and AIPP.
ESMAP (Energy Sector Management Assistance Program) and FEU (Finance Economics and Urban Department). 2008. ‘The energy efficient cities initiative: Practitioners’ roundtable’. Workshop Proceeding Series No. 008/08. Washington, D.C.: ESMAP.
European Commission, UNDP (United Nations Development Programme) and SEARCA (Southeast Asian Regional Center for Graduate Study and Research in Agriculture). n.d. Malaysia — Forest management through local level action: Small Grants Programme for Operations to Promote Tropical Forests (SGPPTF) (Ritchelle Escobin, Julian Gonsalves and Eduardo Queblatin, eds). [http://www.searca.org/ptf/temp/docs/Malaysia_CH.pdf]. Last accessed on 17 June 2011.
Ewing, Brad, David Moore, Steven Goldfinger, Anna Oursler, Anders Reed and Mathis Wackernagel. 2010. The ecological footprint atlas 2010. Oakland: Global Footprint Network.
Fan, Daidu and Congxian Li. 2006. ‘Complexities of China’s coast in response to climate change’. Advances in Climate Change Research 2 (Suppl. 1): 54–58.
FAO (Food and Agriculture Organization of the United Nations). 2011. State of the world’s forests 2011. Rome: FAO.

ASIA-PACIFIC HUMAN DEVELOPMENT REPORT184
———. 2010a. Asia-Pacific forests and forestry to 2020. Asia-Pacific Forestry Sector Outlook Study II. FAO Regional Office for Asia and the Pacific. Bangkok: FAO.
———. 2010b. ‘Climate-smart’ agriculture: Policies, practices and financing for food security, adaptation and mitigation. Rome: FAO.
———. 2010c. Forests and climate change in the Asia-Pacific region. Forests and climate change Working Paper No. 7. Rome: FAO.
———. 2010d. Global forest resources assessment 2010 — Main report. FAO Forestry Paper No. 163. Rome: FAO.
———. 2010e. ‘Implementation of REDD and what it means for forestry and agriculture in the region’. Agenda item No. 10. APRC/10/INF/8. 30th FAO regional conference for Asia and the Pacific. 27 September–1 October. Gyeongju, Republic of Korea.
———. 2010f. Statistical yearbook 2010. Rome: FAO.———. 2010g. ‘Statistics: Food security data and
definitions’. [http://www.fao.org/economic/ess/ess-fs/fs-data/ess-fadata/en/]. Last accessed on 4 August 2011.
———. 2010h. Status and potential of fisheries and aquaculture in Asia and the Pacific 2010. RAP Publication No. 2010/17. Asia-Pacific Fishery Commission, FAO Regional Office for Asia and the Pacific. Bangkok: FAO.
———. 2010i. The state of food insecurity in the world — Addressing food insecurity in protracted crises. Rome: FAO.
———. 2010j. The state of world fisheries and aquaculture 2010 . FAO Fisheries and Aquaculture Department. Rome: FAO.
———. 2010k. What woodfuels can do to mitigate climate change. FAO Forestry Paper No. 162. Rome: FAO.
———. 2008a. Climate change and food security in Pacific Island countries. Rome: FAO.
———. 2008b. ‘Climate change will have strong impact on fisheries’. FAO Newsroom. 10 July. [http://www.fao.org/newsroom/en/news/2008/1000876/index.html]. Last accessed on 26 June 2011.
———. 2008c. The state of food and agriculture in Asia and the Pacific region. Regional Office for Asia and the Pacific. Bangkok: FAO.
———. 2007a. Adaptation to climate change in agriculture, forestry and fishery: Perspectives, framework and priorities. Rome: FAO.
———. 2007b. The urban producer’s resource book — A practical guide for working with low income urban and peri-urban producers organizations. Rome: FAO.
———. 2007c. The world’s mangroves 1980–2005. FAO Forestry Paper No. 153. Rome: FAO.
———. 2002. Law and sustainable development since Rio — Legal trends in agriculture and natural resource management. Rome: FAO.
———. 2001. Report of the FAO Asia-Pacific conference on early warning, prevention, preparedness and management of disasters in food and agriculture — Chiangmai, Thailand, 12–15 June. APDC/01/REP. FAO Regional Office for Asia and the Pacific. Bangkok: FAO.
FAO (Food and Agriculture Organization of the United Nations), IFAD (International Fund for Agricultural Development) and ILO (International Labour Office). 2010a. Gender dimensions of agricultural and rural employment: Differentiated pathways out of poverty. Status, trends and gaps. Rome: FAO, IFAD and ILO.
———. 2010b. Investing in skills for socio-economic empowerment of rural women. Gender and Rural Employment Policy Brief No. 2. Prepared by Tiina Eskola and Lavinia Gasperini. [http://www.fao.org/docrep/013/i2008e/i2008e02.pdf]. Last accessed on 2 September 2011.
Farooq, A. B. and A. H. Khan. 2004. ‘Climate change perspective in Pakistan’. Proceedings of Capacity Building APN Workshop on Global Change Research, Islamabad.
Fisher, R. J., Stewart Maginnis, W. J. Jackson, Edmund Barrow and Sally Jeanrenaud. 2005. Poverty and conservation: Landscapes, people and power. Landscapes and Livelihoods Series No. 2. Gland and Cambridge: IUCN.
G77 and China. 2010. ‘Statement on behalf of the Group of 77 and China by H.E. Ambassador Abdullah M. Alsaidi, Permanent Representa-tive of the Republic of Yemen to the United Nations, Chairman of the Group of 77, at the first preparatory committee meeting of the UN conference on sustainable development, on a green economy in the context of sustainable development and poverty eradication’. 18 May. New York.
Garnaut, Ross, Stephen Howes, Frank Jotzo and Peter Sheehan. 2008. ‘Emissions in the platinum age: The implications of rapid development for climate-change mitigation’. Oxford Review of Economic Policy 24 (2): 377–401.
GEF (Global Environment Facility). 2011. ‘Building integrated photovoltaic technology (BIPV) application project — Malaysia’. 2011 Annual Project Review and Project Implemen-tation Report.

BIBLIOGRAPHY 185
General Assembly of the United Nations. 2011. ‘Happiness: Towards a holistic approach to development’. A/RES/65/309 Resolution Adopted by the General Assembly during its 65th Session. A/65/L.86. New York: UN.
Gillett, Robert. 2011. Fisheries of the Pacific Islands: Regional and national information. RAP Publication 2011/03. FAO Regional Office for Asia and the Pacific. Bangkok: FAO.
Gipe, Paul. 2010. ‘Thailand: 4,300 MW of renewables with feed-in tariffs’. 7 December. Renewable Energy World.com. [http://www.renewableenergyworld.com/rea/news/article/2010/12/thailand-4300-mw-of-renewables-with-feed-in-tariffs]. Last accessed on 14 June 2011.
Giri, C., E. Ochieng, L. L. Tieszen, Z. Zhu, A. Singh, T. Loveland, J. Masek and N. Duke. 2011. ‘Status and distribution of mangrove forests of the world using earth observation satellite data’. Global Ecology and Biogeography 20: 154–59.
Glemarec, Yannick. 2011. Catalysing climate finance: A guidebook on policy and financing options to support green, low-emission and climate-resilient development. New York: UNDP.
Gorte, Ross W. and Pervaze A. Sheikh. 2010. Deforestation and climate change. CRS Report for Congress. R41144. Congressional Research Service. [http://ncseonline.org/NLE/CRS/abstract.cfm?NLEid=2293]. Last accessed on 14 June 2011.
Govan, Hugh, Alifereti Tawake, Kesaia Tabunakawai, Aaron Jenkins, Antoine Lasgorceix, Erika Techera, Hugo Tafea, Jeff Kinch, Jess Feehely, Pulea Ifopo, Roy Hills, Semese Alefaio, Semisi Meo, Shauna Troniak, Siola’a Malimali, Sylvia George, Talavou Tauaefa and Tevi Obed. 2009. Community conserved areas: A review of status and needs in Melanesia and Polynesia. ICCA regional review for CENESTA/TILCEPA/TGER/IUCN/GEF-SGP. [http://www.sprep.org/att/IRC/eCOPIES/Pacific_Region/422.pdf]. Last accessed on 17 June 2011.
Government of Bangladesh. 2008. Cyclone Sidr in Bangladesh: Damage, loss and needs assessment for disaster recovery and reconstruction. A report prepared by the Government of Bangladesh assisted by the international development community with financial support from the European Commission. Dhaka: Government of Bangladesh.
Government of India. 2009. The National Rural Employment Guarantee Act 2005 (NREGA):
Annual report. April 2008–March 2009. Ministry of Rural Development, Department of Rural Development. New Delhi: Government of India.
———. 2002. Towards sustainability: Learning from the past, innovating for the future — Stories from India. Ministry of Environment and Forests. New Delhi: Government of India. [http://envfor.nic.in/divisions/ic/wssd/doc3/main1.htm]. Last accessed on 14 June 2011.
———. 2001. Energy Conservation Act. 2001. No. 52. [http://www.powermin.nic.in/acts_notification/energy_conservation_act/index.htm]. Last accessed on 14 June 2011.
———. 2000. ‘The study of the effects of environ-mental measures on market access’. Submitted to the Committee on Trade and Environment. WT/CTE/W/177. 27 October. [http://commerce.nic.in/trade/international_trade_papers_nextDetail.asp?id=45]. Last accessed on 12 June 2011.
———. n.d.-a. ‘About us’. Ministry of Micro, Small and Medium Enterprises. [http://www.msme.gov.in/msme_aboutus.htm]. Last accessed on 2 September 2011.
———. n.d.-b. ‘Rajiv Gandhi Grameen Vidyutikaran Yojana — Scheme for rural electricity infra-structure and household electrification’. Ministry of Power, Government of India. [http://rggvy.gov.in/rggvy/rggvyportal/index.html]. Last accessed on 2 June 2011.
Government of Mongolia, UNDP (United Nations Development Programme) Mongolia and Sida (Swedish International Development Cooperation Agency). 2011. From vulnerability to sustainability: Environment and human development. Mongolia Human Development Report 2011. Ulaanbaatar: United Nations Development Programme.
Government of the Kingdom of Norway and Government of the Republic of Indonesia. 2010. Cooperation on reducing greenhouse gas emissions from deforestation and forest degradation. Letter of Intent between the Government of the Kingdom of Norway and the Government of the Republic of Indonesia. 26 May. Oslo. [http://www.norway.or.id/PageFiles/404362/Letter_of_Intent_Norway_Indonesia_26_May_2010.pdf]. Last accessed on 15 August 2011.
Government of the People’s Republic of Bangladesh. 2009. National adaptation programme of action (NAPA). Updated version of 2005 — August 2009. Ministry of Environment and Forest. Dhaka: Ministry of Environment and

ASIA-PACIFIC HUMAN DEVELOPMENT REPORT186
Forest, Government of the People’s Republic of Bangladesh.
———. 2005. National Adaptation Programme of Action (NAPA). Ministry of Environment and Forest. Dhaka: Ministry of Environment and Forest, Government of the People’s Republic of Bangladesh. [http://unfccc.int/resource/docs/napa/ban01.pdf]. Last accessed on 24 June 2011.
Government of the Republic of Indonesia. 2011. ‘Instruksi Presiden Republic Indonesia nomor 10 tahun 2011 tentang penundaan pemberian izin baru dan penyempurnaan tata kelola hutan alam primer dan lahan gambut’ (The President of the Republic of Indonesia instruction No. 10 of 2011 about the suspension of new permits and improvement on governance of primary forest and peat land). Jakarta: Secretariat of the Cabinet, Republic of Indonesia.
Government of the Union of Myanmar, Association of Southeast Asian Nations and United Nations. 2008. Post-Nargis joint assessment. A report prepared with the support of the humanitarian and development community. [http://reliefweb.int/sites/reliefweb.int/files/resources/C675C571D9F845A7C125748D0046C5A3-Full_Report.pdf]. Last accessed on 9 August 2011.
Government of Viet Nam. 2010. ‘Decree No. 99/2010/ND-CP of September 24, 2010, on the Policy on payment for forest environment services’. Official Gazette No. 03–04/October 2010. Vietnam Law & Legal Forum. [http://faolex.fao.org/docs/pdf/vie100744.pdf]. Last accessed on 18 August 2011.
Grameen Shakti. n.d. ‘Solar home system’. [http://www.gshakti.org/index.php?option=com_content&view=article&id=58&Itemid=62]. Last accessed on 14 June 2011.
Green Asia Network. n.d. ‘Fighting climate change: Our work’. [http://www.greenasia.kr/eng/ourwork/01_06.htm]. Last accessed on 9 November 2011.
Griscom, Bronson, David Ganz, Nicole Virgilio, Fran Price, Jeff Hayward, Rane Cortez, Gary Dodge, Jack Hurd, Frank L. Lowenstein and Bill Stanley. 2009. The hidden frontier of forest degradation: A review of the science, policy and practice of reducing degradation emissions. Arlington, VA: The Nature Conservancy.
Ha, Hoang Minh, Meine van Noordwijk and Pham Thu Thuy, eds. 2008. Payment for environmental services: Experiences and lessons in Vietnam. Hanoi: VNA Publishing House.
Haines, A., R. S. Kovats, D. Campbell-Lendrum and C. Corvalan. 2006. ‘Climate change and health: Impacts, vulnerability and public health’. Public Health 120: 585–96.
Hales, S., P. Weinstein and A. Woodward. 1996. ‘Dengue fever epidemics in the South Pacific region: Driven by El Niño southern oscillation?’ The Lancet 348 (9042): 1664–65.
Halsnæs, K., P. Shukla, D. Ahuja, G. Akumu, R. Beale, J. Edmonds, C. Gollier, A. Grübler, M. Ha Duong, A. Markandya, M. McFarland, E. Nikitina, T. Sugiyama, A. Villavicencio and J. Zou. 2007. ‘Framing issues’. In: IPCC. Climate change 2007: Mitigation. Contribution of Working Group III to the Fourth Assessment Report of the Intergovernmental Panel on Climate Change (B. Metz, O. R. Davidson, P. R. Bosch, R. Dave, and L. A. Meyer, eds). Cambridge, UK, and New York: Cambridge University Press.
Hartl, Maria. 2009. ‘Technical and vocational education and training (TVET) and skills development for poverty reduction — Do rural women benefit?’ Paper presented at the FAO-IFAD-ILO Workshop on ‘Gaps, trends and current research in gender dimensions of agricultural and rural employment: Differentiated pathways out of poverty’. 31 March–2 April. Rome.
Hassan, Rashid, Robert Scholes and Neville Ash, eds. 2005. Ecosystems and human well-being: Current state and trends. Vol. 1. Millennium Ecosystem Assessment. Washington, D.C.: Island Press.
Helm, Dieter. 2008. ‘Climate-change policy: Why has so little been achieved?’ Oxford Review of Economic Policy 24 (2): 211–38.
Heltberg, Rasmus and Niels Lund. 2009. ‘Shocks, coping, and outcomes for Pakistan’s poor: Health risks predominate’. Journal of Development Studies 45 (6): 889–910.
Heltberg, Rasmus, Paul Bennett Siegel and Steen Lau Jorgensen. 2009. ‘Addressing human vulnerability to climate change: Towards a “no-regrets” approach’. Global Environmental Change 19 (1): 89–99.
Hepburnwind. n.d. ‘The Hepburn community wind farm’. [http://hepburnwind.com.au/the-project/]. Last accessed on 9 June 2011.
Herrero, M. and P. K. Thornton. 2009. ‘Mitigating greenhouse gas emissions from livestock systems’. Brief No. 6. In: Gerald C. Nelson, ed. Agriculture and climate change: An agenda for negotiation in Copenhagen. Focus 16. Washington, D.C.: International Food Policy Research Institute.

BIBLIOGRAPHY 187
Herring, Horace. 1998. Does energy efficiency save energy: The economists debate. EERU Report No. 074. [http://web.mit.edu/2.813/www/readings/HorraceHerring.pdf]. Last accessed on 30 May 2011.
Hertwich, Edgarg and Glen P. Peters. 2009. ‘Carbon footprint of nations: A global, trade-linked analysis’. Environmental Science and Technology 43 (16): 6414–20.
Hiep, Luu Duc. 2010. ‘Role of Vietnamese youth in mitigating and/or adapting to the impacts of climate change’. Asia-Pacific Mountain Courier 11 (2): 13.
Hindustan Times. 2011. ‘Mukherjee unveils green rebates’. 28 February.
Hoanh, Chu Thai, Kittipong Jirayoot, Guillaume Lacombe and Vithet Srinetr. 2010. Impacts of climate change and development on Mekong flow regime. First assessment — 2009. MRC Technical Paper No. 29. Vientiane: Mekong River Commission.
Hooijer, A., S. Page, J. G. Canadell, M. Silvius, J. Kwadijk, H. Wösten and J. Jauhiainen. 2010. ‘Current and future CO2 emissions from drained peatlands in Southeast Asia’. Biogeosciences 7: 1505–14.
Hsu, Angel and Deborah Seligsohn. 2011. ‘What to look for in China’s 12th five year plan’. 2 March. [http://www.wri.org/stories/2011/03/what-look-chinas-12th-five-year-plan]. Last accessed on 20 September 2011.
Huddleston, Barbara, Ergin Ataman and Luca Fè d’Ostiani. 2003. Towards a GIS-based analysis of mountain environments and populations. Environment and Natural Resources. Working Paper No. 10. Rome: Food and Agriculture Organization of the United Nations.
Hunzai, Kiran, Jean-Yves Gerlitz and Brigitte Hoermann. 2011. Understanding mountain poverty in the Hindu Kush-Himalayas: Regional report for Afghanistan, Bangladesh, Bhutan, India, Myanmar, Nepal, and Pakistan. Kathmandu: ICIMOD.
Hviding, Edvard and Tim Bayliss-Smith. 2000. Islands of rainforest: Agroforestry, logging and eco-tourism in Solomon Islands. Aldershot: Ashgate.
IAEA (International Atomic Energy Agency). 2011. ‘Nuclear energy in combating climate change in the Asia-Pacific region’. Technical note prepared by Ferenc L. Toth for the Asia-Pacific Human Development Report, One planet to share: Sustaining human progress in a changing climate.
ICCTF (Indonesia Climate Change Trust Fund). n.d. ‘Concept mechanism’. [http://www.icctf.or.id/node/22]. Last accessed on 11 June 2011.
ICIMOD (International Centre for Integrated Mountain Development). 2011. Green economy for sustainable mountain development: A concept paper for Rio+20 and beyond. Kathmandu: ICIMOD.
———. 2010. ‘The human dimension of climate change in the Hindu Kush-Himalayan region’. Technical background paper prepared by Brigitte Hoermann, Mirjam Macchi and Michael Kollmair for the Asia-Pacific Human Development Report, One planet to share: Sustaining human progress in a changing climate.
———. 2009. Local responses to too much and too little water in the greater Himalayan region. Kathmandu: ICIMOD.
———. 2008. Food security in the Hindu Kush-Himalayan region. ICIMOD Position Paper. Kathmandu: ICIMOD.
ICLEI (Local Governments for Sustainability). 2011. ‘Climate change and vulnerability of people in cities of Asia’. Technical background paper prepared by Helen Scott for the Asia-Pacific Human Development Report, One planet to share: Sustaining human progress in a changing climate.
ICLEI South Asia Secretariat. 2010. City completion report: Nagpur, India — Local Renewables Model Community Network. New Delhi: ICLEI.
IDA (International Development Association). 2009. ‘Micro-hydro lights the way for villages’. IDA at work: Nepal. [http://go.worldbank.org/WAGCQC0H22]. Last accessed on 14 June 2011.
IEA (International Energy Agency). 2011a. CO2 emissions from fuel combustion — 2011 edition. Paris: OECD/IEA.
———. 2011b. Key world energy statistics 2011. Paris: OECD/IEA.
———. 2011c. ‘Prospect of limiting the global increase in temperature to 2°C is getting bleaker’. 30 May. [http://www.iea.org/index_info.asp?id=1959]. Last accessed on 14 June 2011.
———. 2011d. Renewables information 2011. Paris: OECD/IEA.
———. 2011e. World energy outlook 2011. Paris: OECD/IEA.
———. 2010a. CO2 emissions from fuel combustion — 2010 edition. IEA Statistics. Paris: OECD/IEA.
———. 2010b. CO2 emissions from fuel combustion. Data online. [http://masetto.sourceoecd.org/vl=2367203/cl=14/nw=1/rpsv/ij/oecdstats/16834291/v335n1/s4/p1]. Last accessed on 6 October 2010.
———. 2010c. Energy technology perspectives. Paris: OECD/IEA.
———. 2008a. World energy outlook 2008. Paris: OECD/IEA.

ASIA-PACIFIC HUMAN DEVELOPMENT REPORT188
———. 2008b. Worldwide trends in energy use and efficiency: Key insights from IEA indicator analysis. Paris: OECD/IEA.
———. 2007. World energy outlook 2007: China and India insights. Paris: OECD/IEA.
IEA (International Energy Agency), UNDP (United Nations Development Programme) and UNIDO (United Nations Industrial Development Organization). 2010. Energy poverty: How to make modern energy access universal? Special early excerpt of the World Energy Outlook 2010 for the UN General Assembly on the Millennium Development Goals. Paris: OECD/IEA.
IFAD (International Fund for Agricultural Development). 2010. New realities, new challenges: New opportunities for tomorrow’s generation. Rural poverty report 2011. Rome: IFAD.
———. 2008. ‘Climate change and the future of smallholder agriculture: How can rural poor people be a part of the solution to climate change?’ Policy Reference Group on Climate Change. Discussion paper prepared for the Round Table on Climate Change at the 31st session of IFAD’s Governing Council. 14 February.
———. n.d. Climate change: Building the resilience of poor rural communities. Factsheet. [http://www.ifad.org/climate/factsheet/e.pdf]. Last accessed on 12 June 2011.
ILO (International Labour Organization). 2009. Global employment trends for women. Geneva: ILO.
———. 2003. Micro-insurers: Inventory of micro-insurance schemes in Bangladesh. ILO, STEP and GENPROM. Geneva: ILO.
IMHEN (Vietnam Institute of Meteorology, Hydrology and Environment). 2010. Sea level rise scenarios and possible disaster risk reduction in Vietnam — Summary. Hanoi: IMHEN.
Imura, Hidefumi, Sudhakar Yedla, Hiroaki Shirakawa and Mushtaq Ahmed Memon. 2005. ‘Urban environmental issues and trends in Asia: An overview’. International Review for Environmental Strategies 5 (2): 357–81.
Information Office of the State Council of the People’s Republic of China. 2008. China’s policies and actions for addressing climate change. White paper. 29 October. [http://english.gov.cn/2008-10/29/content_1134544.htm]. Last accessed on 14 June 2011.
IOM (International Organization for Migration). 2009. Migration, climate change and the environment. IOM Policy Brief. Geneva: IOM.
IPCC (Intergovernmental Panel on Climate Change). 2011. ‘Managing the risks of extreme events and disasters to advance climate
change adaptation (SREX) — Summary for policymakers’. Version dated 18 November. [http://ipcc-wg2.gov/SREX/images/uploads/SREX-SPM_Approved-HiRes_opt.pdf]. Last accessed on 19 November 2011.
———. 2007a. Climate change 2007: The physical science basis. Contribution of Working Group I to the Fourth Assessment Report of the Intergovernmental Panel on Climate Change (S. Solomon, D. Qin, M. Manning, Z. Chen, M. Marquis, K. B. Averyt, M. Tignor and H. L. Miller, eds). Cambridge, UK, and New York: Cambridge University Press.
———. 2007b. ‘Summary for policymakers’. In: IPCC. Climate change 2007: The physical science basis. Contribution of Working Group I to the Fourth Assessment Report of the Intergovernmental Panel on Climate Change (S. Solomon, D. Qin, M. Manning, Z. Chen, M. Marquis, K. B. Averyt, M. Tignor and H. L. Miller, eds). Cambridge and New York: Cambridge University Press.
———. 2007c. Synthesis report. Climate Change 2007: Synthesis Report. An Assessment of the Intergovernmental Panel on Climate Change. [http://www.ipcc.ch/pdf/assessment-report/ar4/syr/ar4_syr.pdf]. Last accessed on 1 December 2011.
———. 1997. The regional impacts of climate change: An assessment of vulnerability. Summary for policymakers. IPCC Special report. (Robert T. Watson, Marufu C. Zinyowera, Richard H. Moss and David J. Dokken, eds). [http://www.ipcc.ch/pdf/special-reports/spm/region-en.pdf]. Last accessed on 15 December 2011.
Ipiv, Özlem and Dieter Reinhardt. 2010. ‘Sustainable green investments and policies in Bangladesh: Two problems — One solution?’ In: Anja Senz and Dieter Reinhardt, eds. Green governance — One solution for two problems? Climate change and economic shocks: Risk perceptions and coping strategies in China, India and Bangladesh. Duisburg Working Papers on East Asian Studies No. 86/2010. Duisburg: Institute of East Asian Studies.
IPPAN (Independent Power Producers’ Asso-ciation, Nepal). n.d. ‘Hydropower in Nepal’. IPPAN. [http://www.ippan.org.np/HPinNepal.html]. Last accessed on 14 June 2011.
IPST (Institute for the Promotion of Teaching Science and Technology). 2008. ‘The basic education core curriculum — B.E. 2551 (A.D. 2008): Science’. Bangkok: IPST. [http://www3.ipst.ac.th/files_eng/SciCur_2008_EngVersion.pdf]. Last accessed on 15 August 2011.

BIBLIOGRAPHY 189
IRIN. 2010. ‘Papua New Guinea: Indigenous people lose out on land rights’. 1 June. [http://ww.irinnews.org/Report.aspx?ReportId=89322]. Last accessed on 17 June 2011.
ITU (International Telecommunication Union). 2010. World telecommunication/ICT indicators database. [http://www.itu.int/ITU-D/ict/statistics/]. Last accessed on 12 June 2011.
Jacoby, Hanan G. and Emmanuel Skoufias. 1998. ‘Testing theories of consumption behavior using information on aggregate shocks: Income seasonality and rainfall in rural India’. American Journal of Agricultural Economics 80 (1): 1–14.
Jacoby, Hanan, Mariano Rabassa and Emmanuel Skoufias. 2011. Distributional implications of climate change: The case of India. Policy Research Working Paper No. 5623. Washington, D.C.: World Bank.
Jarvis, Darryl S. L. 2011. ‘Overview: Welcome to the trade game’. Asian Trends Monitor Bulletin. Bulletin No. 9. Singapore: National University of Singapore.
Johnson, Craig A. and Krishna Krishnamurthy. 2010. ‘Dealing with displacement: Can “social protection” facilitate long term adaptation to climate change?’ Global Environmental Change 20 (4): 648–55.
Jütting, Johannes and Christian Morrisson. 2009. ‘Women, bad jobs, rural areas: What can “SIGI” tell us?’ Paper presented at the FAO-IFAD-ILO Workshop on ‘Gaps, trends and current research in gender dimensions of agricultural and rural employment: Differentiated pathways out of poverty’. 31 March–2 April. Rome.
Kabeer, Naila. 2008. Mainstreaming gender in social protection for the informal economy. London: Commonwealth Secretariat.
Kalam, Abdul A. P. J. and Srijan Pal Singh. 2011. ‘Nuclear power is our gateway to a prosperous future’. The Hindu. 6 November.
Kamal, Abser. 2010. ‘Grameen Shakti’s renewable energy role’. Daily Star News. 24 February.
Kartiki, Katha. 2011. ‘Climate change and migration: A case study from rural Bangladesh’. Gender and Development 19 (1): 23–38.
Kathari, Vijaykumar P., B. G. Patil and Subrata Das. 2010. ‘A new energy efficient process with solar water heating system for multiend silk reeling unit’. Indian Journal of Fibre and Textile Research 35 (3): 277–80.
Kelkar, Govind. 2009. Adivasi women: Engaging with climate change. UNIFEM, IFAD and the Christensen Fund. UNIFEM South Asia Office: New Delhi.
Khan, Iqbal Alam and Clemens M. Grunbuhel. 2011. ‘Climate change and farming communities in Deltas: Coping with climate variability while adapting to change’. Technical background paper for the Asia-Pacific Human Development Report, One planet to share: Sustaining human progress in a changing climate.
Kim, Brent and Roni Neff. 2009. ‘Measurement and communication of greenhouse gas emissions from U.S. food consumption via carbon calculators’. Ecological Economics 69 (1): 186–96.
King, Peter, Jeremy Bird and Lawrence Haas. 2007. The current status of environmental criteria for hydropower development in the Mekong region: A literature compilation. [http://www.mrcmekong.org/download/free_download/ECHD_Technical_Document.pdf]. Last accessed on 16 August 2011.
Kirby, Alex. 2008. CCCC kick the habit: A UN guide to carbon neutrality. Nairobi: UNEP.
Kochar, Anjini. 1997. ‘An empirical investigation of rationing constraints in rural credit mar-kets in India’. Journal of Development Economics 53 (2): 339–71.
Kollmair, Michael, Brigitte Hoermann and Mirjam Macchi. 2011. ‘Climate change, vulnerability and people in the Hindu Kush-Himalayan region’. Presentation at the APHDR Stakeholder Consultation. 27 April. New Delhi.
Koontanakulvong, Sucharit, Chaiyuth Suksri and Sak Sakulthai. n.d. ‘Enhancing community capacity in water management via web-based decision support system’. [http://management.kochi-tech.ac.jp/PDF/ssms2009/sms09_160.pdf ]. Last accessed on 3 June 2011.
Korkeala, Outi, David Newhouse and Mafalda Duarte. 2009. Distributional impact analysis of past climate variability in rural Indonesia. Policy Research Working Paper No. 5070. Washington, D.C.: World Bank.
Kovats, R. Sari, Menno J. Bouma, Shakoor Hajat, Eve Worrall and Andy Haines. 2003. ‘El Niño and health’. The Lancet 362 (9394): 1481–89.
Kovats, Sari and Rais Akhtar. 2009. ‘Climate, climate change and human health in Asian cities’. In: Jane Bicknell, David Dodman and David Satterthwaite, eds. .Adapting cities to climate change: Understanding and addressing the development challenges. London: Earthscan.
Kumar, K. Rupa, A. K. Sahai, K. Krishna Kumar, S. K. Patwardhan, P. K. Mishra, J. V. Revadekar, K. Kamala and G. B. Pant. 2006. ‘High resolution climate change scenario
ASIA-PACIFIC HUMAN DEVELOPMENT REPORT190
for India for the 21st Century’. Current Science 90 (3): 334–45.
Kumar, Roselyn. 2007. ‘Problems and prospects for islands at the margins: A case study of Moturiki Island, central Fiji’. In: Hiroshi Moriwaki and Kei Kawai, eds. Global warming and Pacific Islands. Occa-sional Paper No. 47. Kagoshima: Kagoshima Uni-versity Research Center for the Pacific Islands.
Kundu, Amitabh. 2011. ‘Measuring impact of climate change in human development framework with specific reference to Asia-Pacific countries’. Technical background paper for the Asia-Pacific Human Development Report, One planet to share: Sustaining human progress in a changing climate.
Lal, Rattan. 2009. ‘The potential for soil carbon sequestration’. Brief No. 5. In: Gerald C. Nelson, ed. Agriculture and climate change: An agenda for nego-tiation in Copenhagen. Focus 16. Washington, D.C.: International Food Policy Research Institute.
Lalchandani, Neha. 2011. ‘Delhi Metro scores a world first with carbon credits’. The Times of India. 19 January.
Lebel, Louis, Po Garden, Ma. Regina N. Banaticla, Rodel D. Lasco, Antonio Contreras, A. P. Mitra, Chhemendra Sharma, Hoang Tri Nguyen, Giok Ling Ooi and Agus Sari. 2007. ‘Integrating carbon management into the development strategies of urbanizing regions in Asia: Implications of urban function, form, and role’. Journal of Industrial Ecology 11 (2): 61–81.
Lee, James R. 2009. Climate change and armed conflict: Hot and cold wars. New York: Routledge.
Lewis, Joanna I. 2009. ‘Climate change and security: Examining China’s challenges in a warming world’. International Affairs 85 (6): 1195–213.
Li, C. X., D. D. Fan, B. Deng and D. J. Wang. 2000. ‘Some problems of vulnerability assessment in the coastal zone of China’. In: N. Mimura and H. Yokoki, eds. Global change and Asian Pacific coasts. Proceedings of APN/SURVAS/LOICZ joint conference on ‘Coastal impacts of climate change and adaptation in the Asia-Pacific region’. 14–16 November. Kobe, Japan.
Lin, Erda, Yinlong Xu, Shaohong Wu, Hui Ju and Ma Shiming. 2007. ‘China National Climate Change Assessment Report (II): Climate change impacts and adaptation’. Advances in Climate Change Research 3 (Suppl.): 6–11.
Loughry, Maryanne and Jane McAdam. 2008. ‘Kiribati: Relocation and adaptation’. Forced Migration Review 31: 51–52.
Lymer, David, Simon Funge-Smith, Jesper Clausen and Weimin Miao. 2008. Status and potential of fisheries and aquaculture in Asia and the
Pacific 2008. RAP Publication No. 2008/15. Asia-Pacific Fishery Commission, FAO Regional Office for Asia and the Pacific. Bangkok: FAO.
MacGregor, James. 2009. ‘Challenging free trade: Embodied carbon and the development agenda’. Presentation made at ‘Trade and climate regimes: A course for co-existence’, World Meteorological Organisation. 2 December. Geneva. [http://pubs.iied.org/pdfs/G02635.pdf]. Last accessed on 12 June 2011.
MAFF (Ministry of Agriculture, Forestry and Fisheries) and MOWRAM (Ministry of Water Resources and Meteorology). 2009. Strategy for agriculture and water: Cambodian agricultural and water resources research, education and extension program. Phnom Penh: MAFF and MOWRAM.
Mahbub ul Haq Human Development Centre. 2011. Food security in South Asia. Human Development in South Asia 2010/2011. Karachi: Oxford University Press.
Mangroves for the Future. n.d. ‘About MFF’. [http://www.mangrovesforthefuture.org/About/About.html]. Last accessed on 9 November 2011.
Marcelo, Alvin B. 2009. ‘Telemedicine in developing countries: Perspectives from the Philippines’. In: Richard Wootton, Nivritti G. Patil, Richard E. Scott and Kendall Ho, eds. Telehealth in the developing world. London and Ottawa: Royal Society of Medicine Press and International Development Research Centre.
McCurry, Justin. 2011. ‘Japan nuclear power expansion plans abandoned’. 11 May. Guardian News and Media Ltd. [http://www.guardian.co.uk/world/2011/may/11/japan-nuclear-power-expansion-plans-abandoned]. Last accessed on 14 June 2011.
McIntosh, Arthur C. 2003. Asian water supplies: Reaching the urban poor. Manila: Asian Development Bank.
Mcneely, Jeffrey A. 2008. ‘Ecoagriculture: Sustaining world food resources while addressing climate change challenges’. [http://www.ecoagriculture.org/documents/files/doc_169.pdf]. Last accessed on 17 June 2011.
Measure DHS. 2010. ‘Demographic and health surveys’. [www.measuredhs.com]. Last accessed on 4 August 2011.
Mechler, Reinhard, Joanne Linnerooth-Bayer and David Peppiatt. 2006. Disaster insurance for the poor? A review of microinsurance for natural disaster risks in developing countries. Geneva and Laxenburg: ProVention Consortium and IIASA.

BIBLIOGRAPHY 191
Mekpaiboonwattana, Somboon. 2011. ‘ICT applications via ThaiTelecentre to all marginal groups in Thailand’. ICT Promotion and Development ICT Usage Bureau, Ministry of Information Communication Technology, Thailand. Presentation made at the Asia-Pacific Regional Forum on ICT Applications. 18–21 May. Bangkok.
Millennium Ecosystem Assessment. 2005. Ecosystems and human well-being: Synthesis.Washington, D.C.: Island Press.
Mimura, N., L. Nurse, R. F. McLean, J. Agard, L. Briguglio, P. Lefale, R. Payet and G. Sem. 2007. ‘Small islands’. In: IPCC. Climate change 2007: Impacts, adaptation and vulnerability. Contribution of Working Group II to the Fourth Assessment Report of the Intergovernmental Panel on Climate Change (M. L. Parry, O. F. Canziani, J. P. Palutikof, P. J. van der Linden and C. E. Hanson, eds). Cambridge, UK: Cambridge University Press.
Mimura, Nobuo and Patrick D. Nunn. 1998. ‘Trends of beach erosion and shoreline pro-tection in rural Fiji’. Journal of Coastal Research 14 (1): 37–46.
Ministry of Energy. 2009. ‘Thailand’s renewable energy and its energy future: Opportunities and challenges’. Ministry of Energy, Thailand. [http://www.dede.go.th/dede/fileadmin/upload/pictures_eng/pdffile/Section_1.pdf]. Last accessed on 29 August 2011.
Ministry of Natural Resources and Environment Malaysia. n.d. Malaysia: Second national communication to the United Nations Framework Convention on Climate Change (UNFCCC). Putrajaya: Ministry of Natural Resources and Environment Malaysia.
Ministry of Natural Resources and Environment Viet Nam. 2010. Viet Nam’s second national communication to the United Nations Framework Convention on Climate Change (UNFCCC). Hanoi: Ministry of Natural Resources and Environment, Socialist Republic of Viet Nam.
Mirza, Monirul. 2011. ‘Climate change, water productivity and management’. Technical back-ground paper for the Asia-Pacific Human Devel-opment Report, One planet to share: Sustaining human progress in a changing climate.
MNET (Ministry of Nature, Environment and Tourism). 2010. Mongolia second national communication under the United Nations Framework Convention on Climate Change. Published by the Ministry of Nature, Environment and Tourism, Mongolia, with technical and financial
support from the United Nations Environment Programme and Global Environmental Facility. Ulaanbaatar: MNET.
Möller, Frida, Karl DeRouen Jr., Jacob Bercovitch and Peter Wallensteen. 2007. ‘The limits of peace: Third parties in civil wars in Southeast Asia, 1993–2004’. Negotiation Journal 23 (4): 373–91.
Munasinghe, Mohan. 2011. ‘How the rich can make the planet more sustainable’. Sunday Observer. 20 February.
Murray, Warwick E. 2001. ‘The second wave of globalisation and agrarian change in the Pacific Islands’. Journal of Rural Studies 17 (2): 135–48.
Myles, Raymond. 2008. ‘Poverty reduction experiences in South Asia’. Presentation made at the side event jointly organised by INFORSE & WECF, UNFCC COP-14. 6 December. Poznan, Poland.
Nagarajan, Geetha. 1998. Microfinance in the wake of disasters: Challenges and opportunities. Micro-enterprise Best Practices. Bethesda, Maryland: Development Alternatives Inc.
Nair, Chandran. 2011. Consumptionomics: Asia’s role in reshaping capitalism and saving the planet. Oxford: Infinite Ideas Ltd.
Nanda, Nitya and Rajan Sudesh Ratna. 2010. Carbon standards and carbon labelling: An emerging trade concern. ARTNet Policy Brief No. 29. Bangkok: Asia-Pacific Research and Training Network on Trade.
Narula, Saphna A., B. K. Sikka, S. P. Singh and K. L. Chawla. 2010. ‘Empowering farmers through mobile telephony in India: A case of IFFCO Kisan Sanchar Ltd.’. Paper presented at the 20th Annual World Food and Agribusiness Forum and Symposium. 19–22 June. Boston.
Nasheed, Mohamed. 2009. ‘Clear and present danger’. Our Planet, the magazine of the United Nations Environment Programme (UNEP). December. [http://www.unep.org/pdf/OP_Dec/EN/OP-2009-12-en-FULLVERSION.pdf]. Last accessed on 17 May 2011.
Nath, Pradosh K. and Bhagirath Behera. 2011. ‘A critical review of impact of and adaptation to climate change in developed and develop-ing economies’. Environment, Development and Sustainability 13 (1): 141–62.
National Disaster Risk Reduction and Manage-ment Council. 2011. Philippines: National progress report on the implementation of the Hyogo Framework for Action (2009–2011) — Interim. Quezon City: National Disaster Risk Reduction and Management Council.

ASIA-PACIFIC HUMAN DEVELOPMENT REPORT192
National Environment Agency. 2010. Singapore’s second national communication — Under the United Nations Framework Convention on Climate Change. Singapore: National Environment Agency.
National Institute of Urban Affairs. 2011. Urban transport initiatives in India: Best practices in ppp. Report submitted to the Ministry of Urban Development, Government of India, in March 2011. [http://www.niua.org/urb_tpt.asp]. Last accessed on 9 June 2011.
National Sample Survey Organisation. 2007. Nutritional intake in India 2004–2005. NSS 61st round. Report No. 513(61/1.0/6). Ministry of Statistics and Programme Implementation, Government of India. New Delhi: Government of India.
NationMaster. 2011. Energy statistics by country. [http://www.nationmaster.com/cat/ene-energy]. Last accessed on 14 June 2011.
NDRC (National Development and Reform Commission). 2011. Report on the implementation of the 2010 plan for national economic and social development and on the 2011 draft plan for national economic and social development. 5 March. Fourth Session of the Eleventh National People’s Congress. [http:/ /news.xinhuanet.com/english2010/china/2011-03/17/c_13783842.htm]. Last accessed on 22 August 2011.
———. n.d. The outline of the eleventh five year plan: For national economic and social development of the People’s Republic of China. Beijing: NDRC. [http://en.ndrc.gov.cn/hot/t20060529_71334.htm]. Last accessed on 30 May 2011.
Neely, Constance, Sally Bunning and Andreas Wilkes, eds. 2009. Review of evidence on drylands pastoral systems and climate change: Implications and opportunities for mitigation and adaptation. Land and Water Discussion Paper No. 8. Rome: FAO.
Nelson, Gerald C., Mark W. Rosegrant, Jawoo Koo, Richard Robertson, Timothy Sulser, Tingju Zhu, Claudia Ringler, Siwa Msangi, Amanda Palazzo, Miroslav Batka, Marilia Magalhaes, Rowena Valmonte-Santos, Mandy Ewing and David Lee. 2009. Climate change: Impact on agriculture and costs of adaptation. IFPRI Food Policy Report. Washington, D.C.: International Food Policy Research Institute.
Nemet, Gregory F. and Daniel M. Kammen. 2007. ‘U.S. energy research and development: Declining investment, increasing need, and the feasibility of expansion’. Energy Policy 35 (1): 746–55.
NEWAH (Nepal Water for Health). 2005. ‘Fog water collection in Nepal: An innovative new
approach to rural water supply’. Kathmandu: NEWAH.
Nicholls, Robert J., Natasha Marinova, Jason A. Lowe, Sally Brown, Pier Vellinga, Diogo de Gusmão, Jochen Hinkel and Richard S. J. Tol. 2011. ‘Sea-level rise and its possible impacts given a “beyond 4°C world” in the twenty-first century’. Philosophical Transactions of the Royal Society A 369 (1934): 161–81.
Nielsen. 2011. Sustainable efforts & environmental concerns around the world — A Nielsen Report. New York: Nielsen.
NGI (Norwegian Geotechnical Institute). 2009. Natural and conflict related hazards in Asia-Pacific: Risk assessment and mitigation measures for natural and conflict related hazards in Asia-Pacific. NGI Report No. 20071600-1. Study commissioned by United Nations Office for Coordination of Humanitarian Affairs, OCHA Regional Office for Asia and the Pacific, Bangkok. Bangkok and Oslo: OCHA and NGI.
Nunn, Patrick D. 2011. ‘Climate change and Pacific Island countries’. Technical background paper for the Asia-Pacific Human Development Report, One planet to share: Sustaining human progress in a changing climate.
———. 2009. ‘Responding to the challenges of climate change in the Pacific Islands: Management and technological imperatives’. Climate Research 40 (2/3): 211–31.
———. 2008. Understanding environmental decision-making in the rural Pacific Islands. Final Report for APN CAPaBLE Project CBA2007-03NSY. [http://www.apn-gcr.org/newAPN/resources/projectBullet inOutputs/f inalProjectReports/2007/CBA2007-03NSY-Nunn_Final%20Report.pdf]. Last accessed on 17 June 2011.
Oanh, Luong Thu. 2010. Country technical note on indigenous peoples’ issues — Viet Nam. IFAD and AIPP. Draft. [http://www.ifad.org/english/indigenous/pub/documents/tnotes/vietnam.pdf]. Last accessed on 27 June 2011.
Ocampo, José Antonio. 2011. ‘The transition to a green economy: Benefits, challenges and risks from a sustainable development perspective — Summary of background papers’. [http://www.uncsd2012.org/rio20/content/documents/Green%20Economy_full%20report.pdf]. Last accessed on 27 August 2011.
OICA (Organisation Internationale des Con-structeurs d’Automobiles). n.d. ‘Production statistics’. Paris: OICA. [http://oica.net/category/

BIBLIOGRAPHY 193
production-statistics/2009-statistics/]. Last accessed on 23 June 2011.
O’Neill, Jim and Anna Stupnytska. 2009. The long-term outlook for the BRICs and N-11 post crisis. Global Economics Paper No. 192. Goldman Sachs Global Economics, Commodities and Strategy Research. [http://www2.goldmansachs.com/ideas/brics/brics-at-8/BRICS-doc.pdf]. Last accessed on 13 June 2011.
OPEC (Organization of the Petroleum Export-ing Countries). n.d. ‘Member countries’. [http://www.opec.org/opec_web/en/about_us/25.htm]. Last accessed on 25 August 2011.
Oxfam. 2011. Owning adaptation: Country-level governance of climate adaptation finance. Briefing Paper No 146. Oxford: Oxfam International.
———. 2008. Climate wrongs and human rights: Putting people at the heart of climate-change policy. Briefing Paper No. 117. Oxford: Oxfam International.
Pacific Adaptation to Climate Change. 2011. ‘Tuvalu responds to the urban challenge’. 23 March. [http://lyris.sprep.org/climate_change/PACC/pacc_news_country.asp?id=906]. Last accessed on 5 September 2011.
Pacific Islands Forum Secretariat. 2007. The Pacific Plan: For strengthening regional cooperation and integration. Suva, Fiji: Pacific Islands Forum Secretariat. [http://www.forumsec.org.fj/resources/uploads/attachments/documents/Pacific_Plan_Nov_2007_version.pdf]. Last accessed on 1 December 2011.
Palang Thai. n.d. ‘Very small power producer’. [http://www.palangthai.org/en/vspp]. Last accessed on 29 August 2011.
Palanivel, T. 2006. ‘Linkages between inter-national trade and employment’. Technical back-ground paper prepared for the Asia-Pacific Human Development Report, Trade on human terms.
Palanivel, Thangavel and Fatma Gul Unal. 2011. ‘Inclusive growth and policies: The Asian experience’. Unpublished paper. Draft dated 22 June.
Panda, Gyana Ranjan. 2011. ‘Budgeting for adaptation to climate change’. The India Economy Review 8: 46–54.
Pantoja, Enrique. 2002. Microfinance and disaster risk management. Experiences and lessons learned. ProVention Consortium. [http://www.gdrc.org/icm/disasters/microfinance_drm.pdf]. Last accessed on 5 September 2011.
Parry, Martin, Cynthia Rosenzweig and Matthew Livermore. 2005. ‘Climate change, global
food supply and risk of hunger’. Philosophical Transactions of the Royal Society (B) Biological Sciences 360 (1463): 2125–38.
Patil, Balachandra. 2011. ‘Energy and poverty in the context of climate change’. Technical background paper for the Asia-Pacific Human Development Report, One planet to share: Sustaining human progress in a changing climate.
Pauli, Natasha, Chris Stephens, Alejandro Litovsky, Anisha Grover, Beth Gardiner-Smith, Elizabeth Clark and Stephanie Reading. 2010. Natural capital: The new political imperative. A case study report using examples supplied by GLOBE parliamentarians from around the world. London: GLOBE International.
Paxson, Christina. 1992. ‘Using weather variability to estimate the response of savings to transitory income in Thailand’. American Economic Review 82 (1): 15–33.
PCGG (Presidential Committee on Green Growth). 2010. Framework act on low carbon, green growth. Act No. 9931. Seoul: Republic of Korea. [http://www.greengrowth.go.kr/english/en_information/en_report/userBbs/bbsView.do#]. Last accessed on 26 May 2011.
PEACE (Pelangi Energi Abadi Citra Enviro). n.d. Low-carbon development fund. PEACE support. [http://www.peace.co.id/?page_id=44]. Last accessed on 30 May 2011.
Peskett, Leo, David Huberman, Evan Bowen-Jones, Guy Edwards and Jessica Brown. 2008. Making REDD work for the poor. A Poverty Environment Partnership Report. Prepared on behalf of the Poverty Environment Partnership (PEP). PEP. [http://cmsdata.iucn.org/downloads/making_redd_work_for_the_poor_final_draft_0110.pdf]. Last accessed on 17 June 2011.
Peters, Glen P., Jan C. Minx, Christopher L. Weber and Ottmar Edenhofer. 2011. ‘Growth in emission transfers via international trade from 1990 to 2008’. Proceedings of the National Academy of Sciences of the United States of America (PNAS) 108 (21): 8903–8.
Pingali, Prabhu. 2007. ‘Westernization of Asian diets and the transformation of food systems: Implications for research and policy’. Food Policy 32 (3): 281–98.
Pittock, Jamie and Ming Xu. 2010. ‘World resources report case study — Controlling Yangtze river floods: A new approach’. Washington, D.C.: World Resources Report.
Poffenberger, Marc. 2006. ‘People in the forest: Community forestry experiences from Southeast Asia’. International Journal Environment and Sustainable Development 5 (1): 57–69.

ASIA-PACIFIC HUMAN DEVELOPMENT REPORT194
Poonuchaphai, Wilasinee. 2010. ‘Country experi-ence: Sustainable consumption and production of Thailand’. Presentation made at the seminar ‘Green growth: A path of good governance’. 29 March–1 April. Seoul.
Popkin, Barry M. 2001. ‘The nutrition transition and obesity in the developing world’. Journal of Nutrition 131 (3): 871S–873S.
Posas, Paula J. 2007. ‘Roles of religion and ethics in addressing climate change’. Ethics in Science and Environmental Politics 7: 31–49.
Presiden Republik Indonesia. 2011. ‘Keynote address at the Business for Environment Global Summit 2011’. Keynote address by H.E. Dr Susilo Bambang Yudhoyono. 28 April. [http://www.presidenri.go.id/index.php/pidato/2011/04/28/1615.html]. Last accessed on 11 June 2011.
Preston, Benjamin L., Ramasamy Suppiah, Ian Macadam and Janice Bathols. 2006. Climate change in the Asia/Pacific region: A con-sultancy report prepared for the climate change and development roundtable. Clayton, Victoria: CSIRO (Commonwealth Scientific and Industrial Research Organisation).
Pretty, Jules and Andrew Ball. 2001. Agricultural influences on carbon emissions and sequestration: A review of evidence and the emerging trading options. Centre for Environment and Society Occasional Paper No. 2001–03. Colchester, UK: University of Essex.
Pribadi, Krisna Suryanto and Aria Mariany. n.d. ‘Implementing community-based disaster risk reduction in Indonesia: The role of research institutions and religious-based organizations’. Bandung: Centre for Disaster Mitigation, Institute Technology Bandung (CDM-ITB). [http://drh.bosai.go.jp/Project/Phase2/1Documents/8_Proceeding/7_PT2_P.pdf]. Last accessed on 30 June 2011.
PR Newswire. 2010. ‘Ahmedabad, India wins 2010 sustainable transport award’. PR Newswire. 12 January.
Proshika. 2005. Activity report 2004–2005. Dhaka: Proshika.
Quang Tan, Nguyen. 2011. Payment for environmental services in Vietnam: An analysis of the pilot project in Lam Dong province. Forest Conservation Project. Occasional Paper No. 5. Kanagawa: IGES and RECOFTC.
Rahman, Atiq. 2008. ‘Climate change and its impact on health in Bangladesh’. Regional Health Forum 12 (1): 16–26.
Ramanathan, V. and G. Carmichael. 2008. ‘Global and regional climate changes due to black carbon’. Nature Geoscience 1: 221–27.
Rasmussen, Kjeld, Wilhelm May, Thomas Birk, Melchior Mataki, Ole Mertz and Douglas Yee. 2009. ‘Climate change on three Polynesian outliers in the Solomon Islands: Impacts, vulner-ability and adaptation’. Geografisk Tidsskrift — Danish Journal of Geography 109 (1): 1–13.
Ratha, Dilip, Sanket Mohapatra and Elina Scheja. 2011. Impact of migration on economic and social development: A review of evidence and emerging issues. Policy Research Working Paper No. 5558. Washington, D.C.: World Development Bank.
Ray, Julie and Anita Pugliese. 2011. ‘Worldwide, blame for climate change falls on humans’. 22 April. Gallup. [http://www.gallup.com/poll/147242/Worldwide-Blame-Climate-Change-Falls-Humans.aspx?utm_source=tagrss&utm_medium=rss&utm_campaign=syndication&utm_term=Environment]. Last accessed on 12 June 2011.
Reed, Edward P. 2010. ‘Is Saemaul Undong a model for developing countries today?’ Paper prepared for the International Symposium in Commemoration of the 40th Anniversary of Saemaul Undong. 30 September. Seoul.
Reid, Hannah and Krystyna Swiderska. 2008. Biodiversity, climate change and poverty: Exploring the links. An IIED Briefing. London: International Institute for Environment and Development.
Reid, Hannah, Andrew Simms and Victoria Johnson. 2007. Up in smoke? Asia and the Pacific: The threat from climate change to human development and the environment. The Fifth Report from the Working Group on Climate Change and Development. London: New Economics Foundation and International Institute for Environment and Development.
Reis, Nadine, Gudmund Synnevåg Sydness and David N. Barton. 2007. Feasibility of payments for watershed services –– Part I: A methodological review and survey of experiences in India and Asia. Report SNO 5393-2007. Oslo: Norwegian Institute for Water Research (NIVA).
REN 21 (Renewable Energy Policy Network for the 21st Century). 2011. Renewables 2011 global status report. Paris: REN 21 Secretariat.
Republic of Indonesia. 2010. Indonesia second national communication under the United Nations Framework Convention on Climate Change (UNFCCC). Jakarta: Ministry of Environment, Republic of Indonesia.
Republic of Kiribati. 2005. Climate Change Adaptation (CCA) strategy. June 2005. [www.environment.gov.ki/CC/KirCCA%20Strategy%202005.pdf]. Last accessed on 17 June 2011.
Republic of Maldives. 2007a. National adaptation program of action (NAPA) — Republic of Maldives.

BIBLIOGRAPHY 195
Ministry of Environment, Energy and Water. Malé: Ministry of Environment, Energy and Water, Republic of Maldives.
———. 2007b. Seventh national development plan (2006–2010): Creating new opportunities. Malé: Ministry of Planning and National Development, Republic of Maldives.
Republic of the Philippines. 2008. Republic Act No. 9513. [http://www.doe.gov.ph/popup/republic_act.asp]. Last accessed on 11 June 2011.
———. 1999. Republic Act No. 8749. [http://www.emb.gov.ph/mmairshed/Policies/ra8749-clean% 20air%20act.pdf]. Last accessed on 30 May 2011.
———. 1977. Presidential Decree No. 1151. [http://www.doe.gov.ph/PECR/Geothermal/pdf/PD1151.pdf]. Last accessed on 30 May 2011.
Rerkasem, Kanok, Narit Yimyam and Benjavan Rerkasem. 2009. ‘Land use transformation in the mountainous mainland Southeast Asian region and the role of indigenous knowledge and skills in forest management’. Forest Ecology and Management 257 (10): 2035–43.
Reuters. 2010. ‘Record Hong-Kong air pollution sparks protest’. 8 September. [http://www.reuters.com/article/2010/09/08/us-hongkong-pollution-idUSTRE68719M20100908]. Last accessed on 5 September 2011.
Riahi, Keywan, Arnulf Grübler and Nebojsa Nakicenovic. 2007. ‘Scenarios of long-term socio-economic and environmental development under climate stabilization’. Technological Forecasting and Social Change 74: 887–935.
Roe, Dilys and Margaret Jack. 2001. Stories from Eden: Case studies of community-based wildlife management. Evaluating Eden Series No. 9. London: IIED.
Rose, Elaina. 1999. ‘Consumption smoothing and excess female mortality in rural India’. Review of Economics and Statistics 81 (1): 41–49.
Rosegrant, Mark W., Gary Yohe, Mandy Ewing, Rowena Valmonte-Santos, Tingju Zhu, Ian Burton and Saleemul Huq. 2010. ‘Climate change and Asian agriculture’. Asian Journal of Agriculture and Development 7 (1): 1–42.
Royal Government of Cambodia. 2006. National adaptation programme of action to climate change (NAPA). Phnom Penh: Ministry of Environment, Royal Government of Cambodia. [http://unfccc.int/resource/docs/napa/khm01.pdf]. Last accessed on 25 June 2011.
Roychowdhury, Anumita. 2011. ‘Dhaka–Delhi: Greasy tale of fuel pricing’. 21 February. [http://www.cseindia.org/content/dhaka-%E2%80%93-
delhi-greasy-tale-fuel-pricing]. Last accessed on 25 August 2011.
RRI (Rights and Resources Initiative). 2009. Who owns the forests of Asia? An introduction to the forest tenure transition in Asia 2002–2008. Washington, D.C.: Rights and Resources Initiative.
Rubis, Jennifer. 2009. ‘Understanding the interac-tions between global climate change and traditional lifestyle initiatives of the indigenous peoples of Malaysia: A Bidayuh-Jagoi case study’. Presented during the Asia Summit on Climate Change and Indigenous Peoples. 24–27 February. Bali.
SAAPE (South Asia Alliance for Poverty Eradication). 2007. ‘Labour in South Asia’. In: Poverty in South Asia 2006: Civil society concerns. Kathmandu: SAAPE.
SAARC Declaration 2008. ‘Partnership for growth for our people’. 15th SAARC Summit. 2–3 August. Colombo. [http://www.saarc-sec.org/userfiles/Summit%20Declarations/15%20-%20Colombo,%2015th%20Summit%202-3%20August%202008%20-%20for%20printing.pdf]. Last accessed on 19 November 2011.
Salick, Jan and Anja Byg, eds. 2007. Indigenous peoples and climate change. Oxford: Tyndall Centre for Climate Change Research.
Sanhati. 2007. National convention against displacement and SEZs (A convention of mass movements fighting dis-placement, land grabbing and SEZs). [http://sanhati.com/news/273/]. Last accessed on 13 July 2011.
Sarmento, Alexandre. 2011. ‘An example of organic farming in Laclubar, Timor-Leste’. Note prepared for the Asia-Pacific Human Development Report, One planet to share: Sustaining human progress in a changing climate.
Satterthwaite, David, Saleemul Huq, Mark Pelling, Hannah Reid and Patricia Romero Lankao. 2007. Adapting to climate change in urban areas: The possibilities and constraints in low- and middle-income nations. Human settlements dis-cussion paper series. London: IIED (International Institute for Environment and Development).
SCBD (Secretariat of the Convention on Biological Diversity). 2009. Connecting biodiversity and climate change mitigation and adaptation: Report of the second ad hoc technical expert group on biodiversity and climate change. Technical Series No. 41. Montreal: Secretariat of the Con-vention on Biodiversity.
Scherler, Dirk, Bodo Bookhagen and Manfred R. Strecker. 2011. ‘Spatially variable response of Himalayan glaciers to climate change affected by debris cover’. Nature Geoscience 4: 156–59.

ASIA-PACIFIC HUMAN DEVELOPMENT REPORT196
Schipper, Lee, Herbert Fabian and James Leather. 2009. Transport and carbon dioxide emissions: Forecasts, options analysis, and evaluation. ADB Sustainable Development Working Paper Series No. 9. Manila: ADB.
Senanayake, Gamini. 2009. Sri Lanka: Renewable energy report. Report prepared for Asian and Pacific Centre for Transfer of Technology of the United Nations — Economic and Social Commission for Asia and the Pacific (ESCAP). [http://recap.apctt.org/Countries/PDF/Sri%20Lanka%20Country%20Report%20Final.pdf]. Last accessed on 22 August 2011.
Senate of the Philippines. 2011a. ‘Enrile gets World Bank support for People’s Survival Fund’. Press release. 29 April. [http://www.senate.gov.ph/press_release/2011/0429_enrile1.asp]. Last accessed on 16 August 2011.
———. 2011b. ‘Legarda bats for more funds for climate adaptation efforts’. Press release. 10 May. [http://www.senate.gov.ph/press_release/2011/0510_legarda1.asp]. Last accessed on 30 May 2011.
———. 2010. ‘Enrile moves to rescue Climate Change Act from funding woes’. Press release. 11 November. [http://www.senate.gov.ph/press_release/2010/1111_enrile1.asp]. Last accessed on 30 May 2011.
Senior, Kathryn. 2008. ‘Climate change and infectious diseases: A dangerous liaison?’ The Lancet Infectious Diseases 8 (2): 92–93.
Shetty, Prakash. 2002. ‘Nutrition transition in India’. Public Health Nutrition 5(1A): 175–82.
Singapore Government. 2011a. ‘About BCA Green Mark Scheme’. Building and Construction Authority. Last updated on 27 July. [http://www.bca.gov.sg/greenmark/green_mark_buildings.html]. Last accessed on 31 August 2011.
———. 2011b. ‘Mitigation measures’. National Climate Change Secretariat (NCCS), Prime Minister’s Office, Singapore. Last updated on 24 February 2011. [http://app.nccs.gov.sg/page.aspx?pageid=83]. Last accessed on 24 August 2011.
———. 2011c. ‘Statistics: Key annual indicators’. [http://www.singstat.gov.sg/stats/keyind.html#popnarea]. Last accessed on 23 August 2011.
———. 2011d. ‘Vehicle ownership’. Ministry of Transport. Last updated on 16 May. [http://app.mot.gov.sg/Land_Transport/Managing_Road_Use/Vehicle_Ownership.aspx]. Last accessed on 14 November 2011.
———. 2009. A lively and liveable Singapore: Strategies for sustainable growth. Ministry of Environment
and Water Resources and Ministry of National Development. Singapore: Singapore Ministry of the Environment and Water Resources and Ministry of National Development.
Skoufias, Emmanuel, Mariano Rabassa, Sergio Olivieri and Milan Brahmbhatt. 2011. The poverty impacts of climate change. Economic Premise No. 51. [http://siteresources.worldbank.org/EXTPREMNET/Resources/EP51_v4.pdf]. Last accessed on 15 April 2011.
Solomon, Ilana. 2007. Compensating for climate change: Principles and lessons for equitable adaptation funding. Washington, D.C.: ActionAid USA.
Solomon Islands Government. 2008. National adaptation programmes of action. Ministry of Environment, Conservation and Meteorology, Solomon Islands Government. [http://unfccc.int/resource/docs/napa/slb01.pdf]. Last accessed on 24 June 2011.
Soni, Preeti. 2009. ‘Small scale industries: Small yet significant’. In: Sunita Narain, Prodipto Ghosh, N. C. Saxena, Jyoti Parikh and Preeti Soni. Climate change: Perspectives from India. New Delhi: UNDP India.
SOPAC (South Pacific Applied Geoscience Commission) and UNEP (United Nations Environment Programme). 2005. ‘EVI country profiles’. [http://www.vulnerabilityindex.net/EVI_Country_Profiles.htm]. Last accessed on 26 June 2011.
SPC (Secretariat of the Pacific Community). 2004. Pacific Islands regional millennium development goals report. Report prepared by the Secretariat of the Pacific Community in cooperation with the United Nations and the UN/CROP MDG Working Group, Noumea.
Statistics New Zealand. 2007. Tuvaluan people in New Zealand: 2006. Wellington: Statistics New Zealand.
Steele, Paul, Gonzalo Oviedo and David McCauley, eds. 2006. Poverty, health, and eco-systems: Experience from Asia. Gland and Manila: IUCN and ADB.
Stephens, Carolyn, Rajesh Patnaik and Simon Lewin. 1996. This is my beautiful home: Risk perceptions towards flooding and environment in low-income urban communities: A case study in Indore, India. London: London School of Hygiene and Tropical Medicine.
Stiglitz, Joseph E., Amartya Sen and Jean-Paul Fitoussi. 2009. Report by the Commission on the measurement of economic performance and social progress. Paris: CMEPSP.
Sudarshan, R. 2011. ‘Corporate governance impacting people’s choices, consumption and
BIBLIOGRAPHY 197
climate change’. Technical note for the Asia-Pacific Human Development Report, One planet to share: Sustaining human progress in a changing climate.
———. 2010. ‘Adapting governance to climate change’. Technical note prepared for the Asia-Pacific Human Development Report, One planet to share: Sustaining human progress in a changing climate.
Sugino, Tomohide. 2006. ‘Prioritization of technological development goals for poverty alleviation through sustainable and diversified agriculture’. Asia-Pacific Development Journal 13 (2): 25–55.
Sumner, Andy. 2011. Poverty in middle-income countries. Commissioned paper. Brighton: The Bellagio Initiative.
Suzlon. n.d. ‘Genesis & growth’. [http://www.suzlon.com/about_suzlon/l3.aspx?l1=1&l2=1&l3=11]. Last accessed on 16 June 2011.
SWITCH-Asia Network Facility, Martin Herrndorf and Burcu Tunçer. 2009. Satisfying basic needs respecting the earth’s limits — Part 1: The challenge: Understanding poverty challenges through sustainable consumption and production thinking. Wuppertal: SwitchAsia-Network Facility.
Tandon, Ajay and Rana Hasan. 2005. Conceptualising and measuring poverty as vulnerability: Does it make a difference? ERD Policy Brief No 41. Manila: Asian Development Bank. [http://www.adb.org/Documents/EDRC/Policy_Briefs/PB041.pdf]. Last accessed on 18 August 2011.
Tanner, Thomas, Tom Mitchell, Emily Polack and Bruce Guenther. 2009. Urban governance for adaptation: Assessing climate change resilience in ten Asian cities. IDS Working Paper No. 315. Brighton: IDS.
Tavoni, Massimo. 2011. ‘The role of technology innovation in achieving climate stabilization’. In: UNDP (United Nations Development Programme). E-discussion on climate change and human development. Asia-Pacific Human Development Network. Bangkok: UNDP Asia-Pacific Regional Centre.
Tebtebba Foundation. 2009. Asia summit on climate change and indigenous peoples: Report of the summit. 24–27 February. Bali. Report prepared by Victoria Tauli-Corpuz, Leah Enkiwe-Abayao, Helen Magata and Helen Tugendhat. Baguio City: Tebtebba Foundation.
TERI (The Energy and Resources Institute). 2011. ‘Climate change and technology: Innovation, transfer, trade, diffusion and cooperation’. Technical background paper for the Asia-Pacific
Human Development Report, One planet to share: Sustaining human progress in a changing climate.
Thaman, Randy. 1982. ‘Deterioration of traditional food systems, increasing malnutrition and food dependency in the Pacific Islands’. Journal of Food and Nutrition 39 (3): 109–21.
Thanh Phuong, Nguyen and Dang Thi Hoang Oanh. 2010. ‘Striped catfish aquaculture in Vietnam: A decade of unprecedented devel-opment’. In: Sena S. De Silva and F. Brian Davy, eds. Success stories in Asian aquaculture. Dordrecht, Heidelberg, London and New York: Springer.
Thapa, Ganesh and Raghav Gaiha. 2011. ‘Small-holder farming in Asia and the Pacific: Challenges and opportunities’. Paper presented at the IFAD Conference on ‘New directions for smallholder agriculture’. 24–25 January. Rome.
The Ashden Awards for Sustainable Energy. 2008. ‘Grameen Shakti, Bangladesh: Rapidly grow-ing solar installer also provides clean cooking’. [http://www.ashdenawards.org/winners/grameen08]. Last accessed on 12 June 2011.
The Economic Planning Unit Malaysia. 2010. Tenth Malaysia Plan 2011–2015. Prime Minister’s Department. Putrajaya, Malaysia: The Economic Planning Unit.
The Economist. 2011a. ‘Australia’s carbon tax: Breaching the brick wall’. 11 July.
———. 2011b. ‘Following the footprints’. 2 June.———. 2009. ‘The new people’s car: Why the Nano
alone cannot solve the mounting problems of its maker’. 26 March.
The Himalayan. 2010. ‘Nepali apple faces market problems’. 24 October. [http://www.thehimalayantimes.com/fullNews.php?headline=Nepali+apple+faces+market+problems&NewsID=262848]. Last accessed on 28 June 2011.
The Hindu. 2011. ‘2010 tied for the warmest year on record’. 20 January. [http://www.thehindu.com/sci-tech/energy-and-environment/article1106051.ece]. Last accessed on 17 August 2011.
The Nation. 2011. ‘Thais oppose nuclear power: Poll’. 23 March. [http://www.nationmultimedia.com/home/Thais-oppose-nuclear-power-Poll-30151517.html]. Last accessed on 2 September 2011.
The Nature Conservancy. n.d. ‘Caribbean’. [http://www.nature.org/ourinitiatives/regions/caribbean/index.htm]. Last accessed on 9 November 2011.
The REDD+ Task Force Indonesia. 2011. ‘Draft final strategi nasional REDD+’. (Final draft national REDD+ strategy). Final draft for online public disclosure. Jakarta: The Indonesia President

ASIA-PACIFIC HUMAN DEVELOPMENT REPORT198
Delivery Unit for Development Monitoring and Oversight. [http://ukp.go.id/informasi-publik/doc_details/12-draft-final-strategi-nasional-redd]. Last accessed on 29 August 2011.
The Times of India. 2011. ‘Indo-Bangla forum to save Sunderbans’. 20 February.
Thimphu Statement. 2010. 16th SAARC Summit. 28–29 April. [http://www.saarc-sec.org/userfiles/ThimphuStatementonClimateChange-29April2010.pdf]. Last accessed on 19 November 2011.
Thomas, Prince Mathews. 2011a. ‘A look back: How Ranjan Sharma brings information to farmers’. Forbes India Magazine. 3 June.
———. 2011b. ‘A rich harvest: The win-win initi-ative to help farmers’. Forbes India Magazine. 25 February.
Tong, Anote. 2009. ‘Statement by His Excellency Anote Tong President of the Republic of Kiribati’. The General Debate of the 64th General Assembly. 25 September. [http://www.un.org/en/ga/64/generaldebate/pdf/KI_en.pdf]. Last accessed on 16 June 2011.
Townsend, Robert M. 1994. ‘Risk and insurance in village India’. Econometrica 62 (3): 539–91.
Transparency International. 2011. Global corruption report: Climate change. Edited by Gareth Sweeney, Rebecca Dobson, Krina Despota and Dieter Zinnbauer. London and Washington, D.C.: Earthscan.
Tuan, Nguyen Anh. 2010. ‘Electricity access in Vietnam: Success story and challenges’. GMS 9th meeting of RPTCC-9: PWG and FG. 26–27 October. Shenzhen, China.
Tulele Peisa. n.d. ‘Carteret Islands’. [http://tuelepeisa.org/carteret-islands/]. Last accessed on 9 May 2011.
Tumiwa, Fabby and Imelda Rambitan. 2010. Scaling up renewable energy investments: Lessons from best practice models in Indonesia. Jakarta: Institute for Essential Services Reform.
TÜV SÜD. 2011. ‘Soaring demand for green products and services in China, India and Singapore provides untapped opportunities for businesses’. 12 January. [http://www.tuev-sued.com/news_media/news/soaring_demand_for_green_products_and_services_in_china_india_and_singapore_provides_untapped_opportunities_for_businesses#]. Last accessed on 12 June 2011.
UNCCD (United Nations Convention to Combat Desertification). 2011. ‘Declaration by members of Parliament’. Ninth Round Table of Members of Parliament. 13–14 October. Changwon.
———. 2009. Benefits of sustainable land manage-ment. Berne: WOCAT and CDE, University of Berne.
———. 2008. ‘Combating desertification in Asia’. Factsheet No. 12. Updated on 24 January. [http://www.unccd.int/publicinfo/factsheets/showFS.php?number=12]. Last accessed on 11 November 2011.
UNCDF (United Nations Capital Development Fund). 2010. Local development outlook Cambodia. New York: United Nations Capital Development Fund.
UNDESA (United Nations Department of Economic and Social Affairs). 2011a. The great green technological transformation. World Economic and Social Survey 2011. Department of Economic and Social Affair. New York: United Nations.
———. 2011b. World population prospects: The 2010 revision. Population Division. United Nations Department of Economic and Social Affairs. [http://esa.un.org/unpd/wpp/unpp/panel_population.htm]. Last accessed on 10 May 2011.
———. 2011c. World statistics pocketbook 2010. Series V, No. 35. New York: United Nations.
———. 2010a. ‘Urban agglomerations 2009’. Wall chart. [http://esa.un.org/unpd/wup/wall-chart_1.htm]. Last accessed on 9 June 2011.
———. 2010b. World urbanization prospects: The 2009 revision. [http://esa.un.org/unpd/wup/index.htm]. Last accessed on 2 May 2011.
———. 2009a. ‘International migration 2009’. Wall chart. New York: United Nations. [http://www.un.org/esa/population/publications/2009Migration_Chart/ittmig_wallchart09.pdf]. Last accessed on 4 August 2011.
———. 2009b. Promoting development, saving the planet. World economic and social survey 2009. New York: United Nations.
———. 2005. Population challenges and development goals. ST/ESA/SER.A/248. New York: United Nations.
UNDP (United Nations Development Programme). 2011a. Catalyzing climate finance: A guidebook on policy and financing options to support green, low-emission and climate resilient development. New York: UNDP.
———. 2011b. ‘Doing good is good for business, and everyone else too’. What’s New. UNDP Asia-Pacific Regional Centre. 27 June. [http://asia-pacific.undp.org/whatsnew/news_20110627.html]. Last accessed on 2 September 2011.
———. 2011c. ‘Regional road-map for energy security: 2012–2021’. UNDP Asia-Pacific Regional Centre. Unpublished draft.

BIBLIOGRAPHY 199
———. 2011d. Sustainability and equity: A better future for all. Human Development Report 2011. New York: Palgrave Macmillan.
———. 2011e. ‘The health impacts of climate change in the Asia-Pacific region’. Technical note prepared by the HIV, Health and Development Team, UNDP Asia-Pacific Regional Centre, for the Asia-Pacific Human Development Report, One planet to share: Sustaining human progress in a changing climate.
———. 2011f. Towards an ‘energy plus’ approach for the poor: A review of good practices and lessons learned from Asia and the Pacific. Bangkok: UNDP Asia-Pacific Regional Centre.
———. 2010a. A ‘no-regrets’ risk-based approach to climate proofing of public infrastructure: Improved national and sub-national planning for resilience and sustainable growth. UNDP Environmental Finance Discussion Paper Series. New York: UNDP.
———. 2010b. China and a sustainable future: Towards a low carbon economy and society. China Human Development Report 2009/10. Beijing: China Translation and Publishing Corporation.
———. 2010c. Designing climate change adaptation initiatives: A UNDP toolkit for practitioners. Bureau of Development Policy. New York: UNDP.
———. 2010d. Power, voice and rights: A turning point in gender equality in Asia and the Pacific. Asia-Pacific Human Development Report. UNDP Regional Centre for Asia-Pacific. New Delhi: Macmillan.
———. 2010e. Promoting climate resilient water management and agricultural practices in rural Cambodia. Cambodia case study. Case study produced by the Adaptation Learning Mechanism (ALM). [http://www.adaptationlearning.net/sites/default/files/ALM_Cambodia_Case_Study_(v4)_10.11.2010[2].pdf]. Last accessed on 17 June 2011.
———. 2010f. Reducing climate change-induced risks and vulnerabilities from glacial lake outburst floods in the Punakha-Wangdi and Chamkhar valleys. Bhutan case study. Case study produced by the Adaptation Learning Mechanism (ALM). [http://www.adaptationlearning.net/sites/default/files/ALM%20Case%20Study%20-%20Bhutan%20-%20Sep%202010%20(v9)%20-%20UNDP-EEG%20Format.doc]. Last accessed on 2 June 2011.
———. 2010g. Staying on track: Tackling corruption risks in climate change. New York: UNDP.
———. 2010h. ‘Viet Nam: Small businesses become greener and more efficient’. Asia and the Pacific. Newsroom. 3 June. [http://content.undp.org/
go/newsroom/2010/june/viet-nam-las-pequeas-empresas-se-vuelven-ms-ecolgicas-y-ms-eficientes.en?categoryID=349433&lang=en]. Last accessed on 30 May 2011.
———. 2009a. Assessing the relationship between natural hazards and poverty. Asia country and state case study report. Regional Programme on Capacity Building for Sustainable Recovery and Risk Reduction. UNDP Regional Centre. Bangkok: UNDP.
———. 2009b. ‘Literature review’. Technical back-ground paper prepared by the Environment and Energy Team, UNDP Asia-Pacific Regional Centre, for the Asia-Pacific Human Development Report, One planet to share: Sustaining human progress in a changing climate.
———. 2009c. ‘Methods for selection and analysis of vulnerable groups’. Technical note prepared by the Environment and Energy Team, UNDP Asia-Pacific Regional Centre, for the Asia-Pacific Human Development Report, One planet to share: Sustaining human progress in a changing climate.
———. 2009d. Resource guide on gender and climate change. New York: UNDP.
———. 2007a. Fighting climate change: Human solidarity in a divided world. Human Development Report 2007/2008. New York: Palgrave Macmillan.
———. 2007b. Sufficiency economy and human development. Thailand Human Development Report 2007. Bangkok: UNDP.
———. 2006. Trade on human terms: Transforming trade for human development in Asia and the Pacific. Asia-Pacific Human Development Report. Delhi: Macmillan.
UNDP (United Nations Development Pro-gramme) and UNISDR (United Nations Secretariat of the International Strategy for Disaster Reduction). 2007. Handbook on good building design and construction Aceh and Nias Islands. Bangkok: UNDP.
UNDP (United Nations Development Pro-gramme) and WHO (World Health Organization). 2009. The energy access situation in developing countries: A review focusing on Least Developed Countries and sub-Saharan Africa. New York and Geneva: UNDP and WHO.
UNDP (United Nations Development Pro-gramme), UNCDF (United Nations Capital Development Fund) and UNEP (United Nations Environment Programme). 2010. Local governance and climate change: A discussion note. Bangkok: UNDP Asia-Pacific Regional Centre,
ASIA-PACIFIC HUMAN DEVELOPMENT REPORT200
UNCDF Asia and Pacific and UNEP Regional Office for Asia and the Pacific.
UNDP GEF Small Grants Programme. 2003. Responding to climate change, generating community benefits. A review of community initiatives supported by the Global Environment Facility’s Small Grants Programme 1992–2003. New York: UNDP.
UNDP (United Nations Development Pro-gramme) Iran. n.d. ‘Carbon sequestering in desertified rangelands of Hosseinabad project, phase 2’. [http://www.undp.org.ir/index.php/component/content/article/402]. Last accessed on 29 August 2011.
UNEP (United Nations Environment Pro-gramme). 2011. Towards a green economy: Pathways to sustainable development and poverty eradication — A synthesis for policy makers. [www.unep.org/greeneconomy]. Last accessed on 22 July 2011.
———. 2010. State of biodiversity in Asia and the Pacific. Bangkok: UNEP Regional Office for Asia and the Pacific.
———. 2007. Global environment outlook: GEO4 environment for development. Nairobi: UNEP.
UNEP (United Nations Environment Pro-gramme), EPO (European Patent Office) and ICTSD (International Centre for Trade and Sustainable Development). 2010. Patents and clean energy: Bridging the gap between evidence and policy. Geneva and Munich: UNEP, EPO and ICTSD.
UNEP (United Nations Environment Pro-gramme), FAO (Food and Agriculture Organization of the United Nations) and UNFF (United Nations Forum on Forests). 2009. Vital forest graphics. Nairobi, Rome, and New York: UNEP, FAO and UNFF.
UNEP/GRID-Arendal. 2007. ‘Extent of deforestation in Borneo 1950–2005, and projection towards 2020’. UNEP/GRID-Arendal Maps and Graphics Library. [http://maps.grida.no/go/graphic/extent-of-deforestation-in-borneo-1950-2005-and-projection-towards-2020]. Last accessed on 9 August 2011.
———. 2002. ‘Disappearing forests’. Adapted from Géographie universelle, Asie du Sud-Est, Hachette, 1995. UNEP/GRID-Arendal Maps and Graphics Library. [http://maps.grida.no/go/graphic/disappearing-forests]. Last accessed on 9 August 2011.
UNESCAP (United Nations Economic and Social Commission for Asia and the Pacific). 2011. Economic and social survey of Asia and the
Pacific 2011 — Sustaining dynamism and inclusive development: Connectivity in the region and pro-ductive capacity in least developed countries. Bangkok: United Nations.
———. 2010a. Economic and social survey of Asia and the Pacific 2010 — Sustaining recovery and dynamism for inclusive development. Bangkok: UNESCAP.
———. 2010b. Emerging challenges in inclusive and sustainable urban development in Asia and the Pacific. Note by the Secretariat. E/ESCAP/MCED(6)/7. Ministerial Conference on Envir-onment and Development in Asia and the Pacific. 27 September–2 October. Astana.
———. 2010c. Low carbon development path for Asia and the Pacific: Challenges and opportunities to the energy sector. ESCAP Energy Resources Development Series, ST/ESCAP/2589. Bangkok: UNESCAP.
———. 2010d. Statistical yearbook for Asia and the Pacific 2009. Bangkok: UNESCAP.
———. 2008. Energy security and sustainable development in Asia and the Pacific. Bangkok: UNESCAP.
———. 2006. State of the environment in Asia and the Pacific 2005: Economic growth and sustainability. Bangkok: UNESCAP.
——— . n.d. ‘Green growth’. [http://www.greengrowth.org/index.asp]. Last accessed on 27 August 2011.
UNESCAP (United Nations Economic and Social Commission for Asia and the Pacific), ADB (Asian Development Bank) and UNDP (United Nations Development Programme). 2012. Accelerating equitable achievement of the MDGs: Closing gaps in health and nutrition outcomes. Asia-Pacific Regional MDG Report 2011/12. Bangkok: UNESCAP, ADB and UNDP.
———. 2010a. Achieving the Millennium Development Goals in an era of global uncertainty. Asia-Pacific Regional Report 2009/10. Bangkok: UNESCAP, ADB and UNDP.
———. 2010b. Paths to 2015: MDG priorities in Asia and the Pacific. Asia-Pacific MDG Report 2010/11. Bangkok: United Nations.
UNESCAP (United Nations Economic and Social Commission for Asia and the Pacific) and ADBI (Asian Development Bank Institute). 2005. Building e-community centres for rural development: Report of the regional workshop, Bali Indonesia 8–14 December 2004. Thailand: United Nations.
UNESCAP (United Nations Economic and Social Commission for Asia and the Pacific) and UNISDR (United Nations International Strategy for Disaster Reduction). 2010.

BIBLIOGRAPHY 201
Protecting development gains: Reducing disaster vulnerability and building resilience in Asia and the Pacific. The Asia-Pacific Disaster Report 2010. Bangkok: UNESCAP and UNISDR.
UNFCCC (United Nations Framework Convention on Climate Change). 2011a. Report of the Conference of the Parties on its sixteenth session, held in Cancun from 29 November to 10 December 2010. FCCC/CP/2010/7/Add.1. 15 March. [http://unfccc.int/resource/docs/2010/cop16/eng/07a01.pdf]. Last accessed on 18 August 2011.
———. 2011b. ‘Status of NAPA implementation under the LDCF’. Status as of 13 May. [http://unfccc.int/cooperation_support/least_developed_countries_portal_/ldcf_napa_projects/items/5632.php]. Last accessed on 17 June 2011.
———. 2010. ‘NAPAs received by the Secretariat’. Last update in November. [http://unfccc.int/cooperation_support/least_developed_countries_portal/submitted_napas/items/4585.php]. Last accessed on 17 June 2011.
———. 2009. National economic, environment and development study for climate change: Initial summary report. Bonn: UNFCCC.
———. n.d-a. ‘Appendix II — Nationally appropriate mitigation actions of developing countries Parties’. [http://unfccc.int/meetings/cop_15/copenhagen_accord/items/5265.php]. Last accessed on 20 May 2011.
———. n.d.-b. ‘Development and transfer of technologies’. [http://unfccc.int/cooperation_and_support/technology/items/1126.php]. Last accessed on 25 August 2011.
———. n.d.-c. ‘Financial mechanism’. [http://unfccc.int/cooperation_and_support/financial_mechanism/items/2807.php]. Last accessed on 25 August 2011.
———. n.d.-d. ‘Flood-resistant housing through micro-loans in Bangladesh’. UNFCCC local coping strategies database. [http://maindb.unfccc.int/public/adaptation/adaptation_casestudy.pl?id_project=38]. Last accessed on 16 August 2011.
———. n.d.-e. ‘Non-Annex I national commu-nications’. [http://unfccc.int/national_reports/non-annex_i_natcom/items/2979.php]. Last accessed on 25 August 2011.
UN-HABITAT (United Nations Human Settlements Programme). 2011. Cities and climate change: Global report on human settlements 2011. London and Washington, D.C.: Earthscan.
———. 2008. State of the world’s cities 2010/2011 — Bridging the urban divide. London: Earthscan.
UN-HABITAT (United Nations Human Settlements Programme) and UNESCAP (United Nations Economic and Social Commission for Asia and the Pacific). 2010. The state of Asian cities 2010/11. Fukuoka: UN-Habitat.
UNICEF (United Nations Children’s Fund). 2008. The state of the world’s children 2009: Maternal and newborn health. New York: UNICEF.
UNICEF (United Nations Children’s Fund) and WHO (World Health Organization). 2009. Diarrhoea: Why children are still dying and what can be done. New York and Geneva: UNICEF and WHO.
UNIDO (United Nations Industrial Develop-ment Organization). 2011. Industrial energy efficiency for sustainable wealth creation: Capturing environment, economic and social dividends. Industrial Development Report 2011. Vienna: UNIDO.
———. 2010. Global industrial energy efficiency bench-marking: An energy policy tool. Working Paper. Vienna: UNIDO.
UNIFEM (United Nations Development Fund for Women), World Bank, ADB (Asian Devel-opment Bank), UNDP (United Nations Development Programme) and DFID/UK (Department for International Development of the United Kingdom). 2004. A fair share for women: Cambodia gender assessment. A collaboration between UNIFEM, the World Bank, ADB, UNDP and DFID/UK, in cooperation with the Ministry of Women’s and Veterans’ Affairs. Phnom Penh: UNIFEM, WB, ADB, UNDP and DFID/UK.
UNISDR (United Nations International Strat-egy for Disaster Reduction). 2011. Global assessment report on disaster risk reduction. Geneva: UNISDR.
———. 2009. Global assessment report on disaster risk reduction: Risk and poverty in a changing climate. Geneva: United Nations.
UNISDR (United Nations Secretariat of the International Strategy for Disaster Reduc-tion), ITC (International Training Centre of ILO) and UNDP (United Nations Devel-opment Programme). 2010. Local governments and disaster risk reduction: Good practices and lessons learnt. Geneva: UNISDR.
United Nations. 2011a. ‘Millennium Development Goals indicators’. The official United Nations site for the MDG indicators. [http://mdgs.un.org/unsd/mdg/Default.aspx]. Last accessed on 2 February 2012.
———. 2011b. The Millennium Development Goals report 2011. New York: United Nations.
ASIA-PACIFIC HUMAN DEVELOPMENT REPORT202
——— . 2011c. World economic and social survey 2011: The great green technological transformation. New York: United Nations.
———. 2010. UN data: Energy statistics database. United Nations Statistics Division. [http://data.un.org/Explorer.aspx?d=EDATA]. Last accessed on 11 April 2011.
United Nations Office for the Coordination of Humanitarian Affairs and IDMC (Internal Displacement Monitoring Centre). 2009. Monitoring disaster displacement in the context of climate change. Geneva: OCHA and IDMC.
United Nations Security Council. 2011. ‘Statement by the President of the Security Council’. S/PRST/2011/15*. 20 July. [http://www.un.org/ga/search/view_doc.asp?symbol=S/PRST/2011/15]. Last accessed on 6 August 2011.
UN-REDD Programme. 2010. 2010 year in review. Geneva: UN-REDD Programme Secretariat.
———. 2009. Harmonization of readiness components. Note by the Secretariat. UN-REDD/PB3/7. Geneva: UN-REDD.
UN-REDD Programme and Viet Nam Depart-ment of Forestry. 2010. Design of a REDD-compliant benefit distribution system for Viet Nam. UN-REDD Programme 2010. UN-REDD Programme and GTZ. [http://www.un-redd.org/Newsletter6_Viet_Nam_BDS/tabid/3280/language/en-US/Default.aspx]. Last accessed on 17 June 2011.
Upadhya, Madhukar. 2009. ‘Traditional techniques for water harvesting’. Sustainable Mountain Development 56: 24–26.
USAID (United States Agency for Inter-national Development), AECEN (Asian Environmental Compliance and Enforce-ment Network) and UNEP (United Nations Environment Programme). 2009. Strengthening legal and policy frameworks for addressing climate change in Asia: Identifying opportunities for sharing best practices. Bangkok: AECEN Secretariat.
USAID (United States Agency for Inter-national Development), AECEN (Asian Environmental Compliance and Enforce-ment Network), Government of India and OECD (Organisation for Economic Cooperation and Development). 2006. Environmental compliance and enforcement in India: Rapid assessment. Final draft, November. [http://www.aecen.org/sites/default/files/IN_Assessment.pdf]. Last accessed on 13 May 2011.
USAID (United States Agency for Inter-national Development) and AECEN (Asian Environmental Compliance and Enforcement Network). 2004. Environmental
compliance and enforcement in the Philippines: Rapid assessment. [http://www.aecen.org/rapid-country-program-assessments]. Last accessed on 26 May 2011.
USAID (United States Agency for International Development), PADCO (Planning and Development Collaborative International) and AECEN (Asian Environmental Com-pliance and Enforcement Network). 2005. Environmental compliance and enforcement in Vietnam: Rapid assessment. [http://www.aecen.org/rapid-country-program-assessments]. Last accessed on 30 May 2011.
USAID (United States Agency for International Development) Asia. 2010. Asia-Pacific regional climate change and adaptation assessment — Final report: Findings and recommendations. International Resources Group. Washington, D.C.: USAID.
van Aalst, Maarten K., Terry Cannon and Ian Burton. 2008. ‘Community level adaptation to climate change: The potential role of participatory community risk assessment’. Global Environmental Change 18: 165–79.
van der Hoek, Wim, R. Sakhivadivel, Melanie Renshaw, John B. Silver, Martin H. Birley and Flemming Konradsen. 2001. Alternate wet/dry irrigation in rice cultivation: A practical way to save water and control malaria and Japanese encephalitis? Research Report No. 47. Colombo: International Water Management Institute.
Vedeld, Paul, Arild Angelsen, Espen Sjaastad and Gertrude Kobugabe Berg. 2004. Counting on the environment: Forest incomes and the rural poor. Paper No. 98. Environmental Economics Series. World Bank Environment Department. Washington, D.C.: World Bank.
Veitayaki, Joeli, Bill Aalbersberg, Alifereti Tawake, Etika Rupeni and Kesaia Tabunakawai. 2003. Mainstreaming resource conservation: The Fiji locally-managed marine area network and national policy development. RMAP Working Paper No. 42. Canberra: Resource Management in Asia-Pacific Program, Research School of Pacific and Asian Studies.
Victor, Peter A. 2008. Managing with growth. Cheltenham: Edward Elgar Publishing Ltd.
Vietor, Richard H. K. and Juliana Seminerio. 2008. ‘The Suzlon edge’. The Harvard Business Review.
Wagha, Wasim. 2010. Country technical note on indigenous peoples’ issues — Pakistan. Draft. IFAD and AIPP. [http://www.ifad.org/english/indigenous/pub/documents/tnotes/pakistan.pdf]. Last accessed on 27 June 2011.
Wagner, David V., Feng An and Cheng Wang. 2009. ‘Structure and impacts of fuel economy

BIBLIOGRAPHY 203
standards for passenger cars in China’. Energy Policy 37: 3803–11.
Walsham, Matthew. 2010. Assessing the evidence: Environment, climate change and migration in Bangladesh. IOM Regional Office for South Asia. Dhaka: IOM.
Warner, Koko, Charles Ehrhart, Alex de Sherbinin, Susana Adamo and Tricia Chai-Onn. 2009. In search of shelter: Mapping the effects of climate change on human migration and displace-ment. CARE, CIESIN-Columbia University, UNHCR, United Nations University and Social Dimensions of Climate Change, World Bank.
Wassmann, Reiner, Yasukazu Hosen and Kay Sumfleth. 2009. ‘Reducing methane emissions from irrigated rice’. Brief No. 3. In: Gerald C. Nelson, ed. Agriculture and climate change: An agenda for negotiation in Copenhagen. Focus 16. Washington, D.C.: International Food Policy Research Institute.
WBCSD (World Business Council for Sustainable Development). 2009. Towards a low-carbon economy. Geneva: WBCSD.
———. 2004. Meeting the challenges of sustainability: The sustainable mobility project. Geneva: WBCSD.
Wertz-Kanounnikoff, Sheila and Metta Kongphan-Apirak. 2008. Reducing forest emissions in Southeast Asia: A review of drivers of land-use change and how payments for environmental services (PES) schemes can affect them. Working Paper No. 41. Bogor, Indonesia: CIFOR.
Wheeler, David. 2011. Quantifying vulnerability to climate change: Implications for adaptation assistance. Working Paper No. 240. Washington, D.C.: Center for Global Development.
White, Ian, Tony Falkland, Taboia Metutera, Mourongo Katatia, Tererei Abete-Reema, Marc Overmars, Pascal Perez and Anne Dray. 2008. ‘Safe water for people in low, small island Pacific nations: The rural-urban dilemma’. Development 51 (2): 282–87.
WHO (World Health Organization). 2011a. ‘Dengue in the Western Pacific region’. Last updated on 1 September. WHO Regional Office for the Western Pacific region. [http://www.wpro.who.int/health_topics/dengue/]. Last accessed on 13 September 2011.
———. 2011b. ‘Pandemic influenza preparedness: Sharing of influenza viruses and access to vaccines and other benefits’. Agenda item 13.1. 64th World Health Assembly. WHA 64.5.
———. 2010a. Assessing the relationship between climatic factors and diarrhoeal and vector-borne disease: A retrospective study. Generic Research Protocol.
New Delhi: WHO Regional Office for South-East Asia.
———. 2010b. World health statistics 2010. Geneva: WHO.
———. 2010c. World malaria report 2010. Geneva: WHO.
———. 2008a. Climate change and human health in Asia and the Pacific: From evidence to action. Report of the Regional Workshop. 10–12 December 2007. Bali, Indonesia. New Delhi: WHO Regional Office for South-East Asia.
———. 2008b. ‘Climate change is bad for your health’. 7 April. Press releases. WHO Regional Office for the Western Pacific region. [http://www.wpro.who.int/media_centre/press_releases/pr20080704.htm]. Last accessed on 11 May 2011.
——— . 2006. ‘Situation of dengue: Dengue haemorrhagic fever in the South-East Asia region’. WHO Regional Office for South-East Asia. Last updated on 14 August. [http://www.searo.who.int/en/Section10/Section332_1103.htm]. Last accessed on 12 September 2011.
WHO (World Health Organization), WMO (World Meteorological Organization) and UNEP (United Nations Environment Programme). 2003. Climate change and human health — Risks and responses. Summary. Geneva: WHO.
Wilkinson, Clive, ed. 2008. Status of coral reefs of the world: 2008. Townsville, Australia: Global Coral Reef Monitoring Network and Reef and Rainforest Research Centre.
Williams, Mike. 2011. ‘Malaysia picks indus-trialization over natural treasures’. 7 July. BBC News. [http://www.bbc.co.uk/news/business-14062536?print=true]. Last accessed on 2 September 2011.
Williamson, Laura E., Hélène Connor and Mithra Moezzi. 2009. Climate-proofing energy systems. Paris: Helio International.
Winarto, Yunita T., Kees Stigter, Esti Anantasari and Siti Nur Hidayah. 2008. ‘Climate field schools in Indonesia: Improving “response farm-ing” to climate change’. Leisa India 10 (4): 16–17.
Winn, Patrick. 2010. ‘Farming smarter’. 17 November. Feature Stories. ADB. [http://www.adb.org/documents/feature-stories/2010/lao-farming-smarter.asp]. Last accessed on 2 June 2011.
World Bank. 2011a. Climate change, disaster risk, and the urban poor: Cities building resilience for a changing world — Summary. Washington, D.C.: World Bank.
———. 2011b. World development indicators online. Washington, D.C.: World Bank. [http://databank.

ASIA-PACIFIC HUMAN DEVELOPMENT REPORT204
worldbank.org/ddp/home.do]. Last accessed on 31 May 2011.
———. 2010a. Cities and climate change: An urgent agenda. Washington, D.C.: World Bank.
———. 2010b. Cities and climate change mitigation: Case study on Tokyo’s emissions trading system. [ h t t p : / / s i t e r e s o u r c e s . w o r l d b a n k . o r g /INTURBANDEVELOPMENT/Resources/336387-1226422021646/Tokyo_ETS_Padeco.pdf]. Last accessed on 9 June 2011.
———. 2010c. Climate risks and adaptation in Asian coastal megacities: A synthesis report. Washington, D.C.: World Bank.
———. 2010d. Development and climate change. World Development Report 2010. Washington, D.C.: World Bank.
———. 2010e. Economics of adaptation to climate change: Social synthesis report. Washington, D.C.: World Bank.
———. 2010f. Economics of adaptation to climate change: Synthesis report. Washington, D.C.: World Bank.
———. 2010g. Indonesia economic quarterly: Looking forward. September. Jakarta: World Bank/Bank Dunia.
———. 2009a. Convenient solutions to an inconvenient truth: Ecosystem-based approaches to climate change. Environment Department. Washington, D.C.: World Bank.
———. 2009b. The little green data book 2009. Washington, D.C.: World Bank.
———. 2007. Agriculture for development. World Development Report 2008. Washington, D.C.: World Bank.
———. 2006. Promoting global environmental priorities in the urban transport sector: Experience from World Bank Group — Global environment facility projects. Washington, D.C.: World Bank.
———. 2000. Bangladesh: Climate change and sustainable development. Report No. 21104-BD. Rural Development Unit, South Asia Region. Dhaka: World Bank.
World Bank, GFDRR (Global Facility for Disaster Reduction and Recovery) and ISDR (International Strategy for Disaster Reduction). 2008. Climate resilient cities: A primer on reducing vulnerabilities to climate change impacts and strengthening disaster risk management in East Asian cities. Washington, D.C.: World Bank.
Wragg, Ulamila Kurai. 2008. ‘Islanders’ right to exist outweighs any mitigation hardship, says Cook Islands’. 12 December. SPREP (Secretariat of the Pacific Regional Environment Programme). [http://www.sprep.org/climate_
change/PYCC/deta.asp?id=604]. Last accessed on 17 May 2011.
WRI (World Resources Institute). 2011. Climate analysis indicators tool (CAIT). Version 8.0. Washington, D.C.: WRI. [http://cait.wri.org/cait.php?page=sectors]. Last accessed on 10 May 2011.
WRI (World Resources Institute), CSR Asia and Sida (Swedish International Development Cooperation Agency). 2009. Making climate your business: Private sector adaptation in Southeast Asia. Prepared by Lauren Withey, Karin Borgerson, Kirk Herbertson, Heather McGray, Jacqui Dixon, Marie Morice, Richard Welford and Helen Roeth. Stockholm: Sida.
WRI (World Resources Institute), UNDP (United Nations Development Programme), UNEP (United Nations Environment Programme) and World Bank. 2005. World resources 2005: The wealth of the poor — Managing ecosystems to fight poverty. Washington, D.C.: WRI.
Wunder, Sven. 2005. Payments for environmental services: Some nuts and bolts. CIFOR Occasional Paper No. 42. Jakarta: CIFOR.
WWAP (World Water Assessment Programme), UNESCO (United Nations Educational, Scientific and Cultural Organization) and Berghahn Books. 2006. Water, a shared responsibility. The 2nd UN World Water Devel-opment Report. Barcelona: WWAP-UNESCO and Berghahn Books.
WWF (World Wildlife Fund). 2008a. One planet mobility: A journey towards a sustainable future. Surrey: WWF-UK.
———. 2008b. Water for life: Lessons for climate change adaptation from better management of rivers for people and nature. Gland: WWF International.
Xu, Zongxue, Tongliang Gong and Changming Liu. 2007. ‘Detection of decadal trends in precipitation across the Tibetan Plateau’. Methodology in Hydrology (Proceeding of the Second International Symposium on Methodology in Hydrology held in Nanjing, China, October–November 2005) 311: 271–76.
Yamamoto, Yoshika. 2006. ‘Measures to mitigate urban heat islands’. Science and Technology Trends Quarterly Review 18 (1): 65–83.
Yeshi, Dechen. 2010. ‘We are aware and we will fight’. Asia-Pacific Mountain Courier 11 (2): 6.
Young, William, Paul Costelloe and Lakshmi Kerr. 2010. ‘Sustainable procurement: Human rights and greenhouse gas emissions’. International Journal of Environment and Sustainable Development 9 (4): 364–77.

BIBLIOGRAPHY 205
Yu, Bingxin and Xinshen Diao. 2011. Cambodia’s agricultural strategy: Future development options for the rice sector — A policy discussion paper. Special Report No. 9. Phnom Penh: CDRI, CARD and IFPRI.
Yu, Bingxin, Tingju Zhu, Clemens Breisinger and Nguyen Manh Hai. 2010. Impacts of climate change on agriculture and policy options for adaptation: The case of Vietnam. IFPRI Discussion Paper No. 01015. Washington, D.C.: IFPRI.
Yusuf, Arief Anshory and Herminia Francisco. 2009. Climate change vulnerability mapping for Southeast Asia. Singapore: Economy and Environ-ment Programme for South-East Asia (EEPSEA).
Zhang, Zhong Xiang. 2010. Assessing China’s energy conservation and carbon intensity: How will the future differ from the past? Nota Di Lavoro No. 92.2010. Milano: Fondazione Eni Enrico Mattei.
Zhao, Lin, Chien-Lu Ping, Daqing Yang, Guodong Cheng, Yongjian Ding and Shiyin Liu. 2004. ‘Changes of climate and seasonally frozen ground over the past 30 years in Qinghai-Xizang (Tibetan) plateau, China’. Global and Planetary Change 43 (1/2): 19–31.
Zhao, Wei and Patrick Schroeder. 2010. ‘Sus-tainable consumption and production: Trends, challenges and options for the Asia-Pacific region’. Natural Resources Forum 34 (1): 4–15.


INDICATORS
The sea becomes the shore,the shore becomes the sea.
Indonesian proverb

INDICATORS 209
READERS’ GUIDE AND NOTES TO TABLES
The statistical tables that follow contain indica-tors of measures related to climate change and human development, covering the countries of Asia and the Pacific. The data are grouped into eight dimensions that capture different aspects of human development relating to climate change, with Millennium Development Goal (MDG) indicators distinctly marked.1 The dimensions are: human development, poverty and inequal-ity; population; production and employment; education and health; energy supply and use; greenhouse gas emissions; human vulnerability to natural disasters; and international environ-ment treaties, national strategies and plans. They consist of 19 tables with a number of indicators (Table 1).
The MDG indicators that are critical for Asia and the Pacific include incidence of poverty, proportion of underweight children, school enrolment rate, infant and child mortality rates, maternal mortality rate, proportion of popula-tion with drinking water, and sanitation. These are directly indicative of human wellbeing or deprivation.
DATA COVERAGE AND COUNTRY GROUPINGS
‘Asia-Pacific’ refers to UN member states, devel-oping and developed. These include 39 coun-tries, as presented in the statistical tables:
East Asia (16): Brunei Darussalam, Cambodia, China, Democratic People’s Republic of Korea, Indonesia, Japan, Lao People’s Democratic Republic, Malaysia, Mongolia, Myanmar, the Philippines, Republic of Korea, Singapore, Thailand, Timor-Leste and Viet Nam.
South and West Asia (9): Afghanistan, Bangladesh, Bhutan, India, Islamic Republic of Iran, Maldives, Nepal, Pakistan and Sri Lanka.
Pacific (14): Australia, Federated States of Micronesia, Fiji, Kiribati, Marshall Islands, Nauru, New Zealand, Palau, Papua New Guinea, Samoa, Solomon Islands, Tonga, Tuvalu and Vanuatu.
Within sub-regions, countries are arranged according to human development index (HDI) rank (2011) in descending order.2 Countries that do not have an HDI ranking are placed at the end of each sub-region in the tables. Irrespective of the availability of data, all the 39 countries are reported in the tables in order to maintain uniformity, as well as to alert readers to data limi-tations. Lack of data in itself is a finding that sug-gests the need for building statistical capacity.
Asia-Pacific developing countries refer to those based on the UNDP regional classification (UNDP 2011). These include 33 countries:
East Asia (12): Cambodia, China, Democratic People’s Republic of Korea, Indonesia, Lao People’s Democratic Republic, Malaysia, Mongolia, Myanmar, the Philippines, Thailand, Timor-Leste and Viet Nam.
South and West Asia (9): Afghanistan, Bangladesh, Bhutan, India, Islamic Republic of Iran, Maldives, Nepal, Pakistan and Sri Lanka.
TABLE
1Dimensions and Statistical Tables
Dimensions Tables
Human development, poverty and inequality
1. HDI and related indices 2. Poverty and inequality
Population 3. Growth and density of population 4. Location of population
Production and employment 5. Gross domestic product (per capita), growth and share by sectors
6. Labour force participation and employment rates
Education and health 7. School enrolment and literacy 8. Access to water and sanitation 9. Undernourished population and children, and life
expectancy10. Maternal, infant and child mortality
Energy supply and use 11. Energy supply12. Sources and use of electricity13. Number of vehicles, cars and carrier departures
Greenhouse gas emissions 14. Amount and share of major greenhouse gases15. Intensity of energy use and CO2 emissions
Human vulnerability to natural disasters
16. Existing stock of natural resources17. Impact of natural disasters
International environment treaties, national strategies and plans
18. Status of international environment treaties19. National reporting, strategies and plans on climate
change

ASIA-PACIFIC HUMAN DEVELOPMENT REPORT210
Pacific (12): Federated States of Micronesia, Fiji, Kiribati, Marshall Islands, Nauru, Palau, Papua New Guinea, Samoa, Solomon Islands, Tonga, Tuvalu and Vanuatu.
The Report uses the above categorisation. Where text of tables refers to a specific source, the categor-isation follows that of the source. Sub-regional groupings reported at the end of statistical tables generally follow the World Bank classification. The differences between the classifications by the UNDP and the World Bank are the following.
East Asia and the Pacific (Developing Countries): 23 out of 24 countries are common in both UNDP and World Bank classifications. The only difference is that the UNDP one includes Nauru, whereas that of the World Bank includes American Samoa.
South Asia: The World Bank classification in-cludes eight countries. The UNDP classification includes all those eight countries and the Islamic Republic of Iran. In order to recognise the dif-ference, the statistical tables of this report refer to the sub-region as South and West Asia. The detail of country groupings is provided in UNDP (2011) and World Bank (2011).
DATA SOURCES AND INCONSISTENCIES
In the process of preparing the Asia-Pacific Human Development Report, the Human Development Report Unit (HDRU) is a user, not a producer, of data. As such, it uses data produced by international institutions for cross-country comparison. There are some differences in regional and sub-regional groupings across the institutions, leading to inconsistencies in the direct comparison of data among sources. All data sources are given below each table, and full bibliographical details are presented in the Statistical References. Inconsistencies in regional and sub-regional groupings are also noted in the main report.
The data are compiled from the databases and reports of the United Nations and other inter-national agencies. Among UN agencies, the data-bases of the following organisations have been used: the Food and Agriculture Organization, the United Nations Collaborative Programme on Reducing Emissions from Deforestation and
Forest Degradation in Developing Countries, the United Nations Department of Economics and Social Affairs, the United Nations Framework Convention on Climate Change, the UNESCO Institute for Statistics and the World Bank. Other agencies whose databases have been used include: the Centre for International Earth Sci-ence Information Network, the Centre for Research on the Epidemiology of Disasters, the Global Footprint Network and the International Energy Agency.
In addition, data were extracted from the following publications: CO2 Emissions from Fuel Combustion — 2011 Edition, Key World Energy Statistics 2011, and Renewables Information 2011 of the International Energy Agency; UNDP’s Human Development Report 2011; WHO’s World Health Statistics 2011; The State of Asian Cities 2010/2011 by UN-HABITAT and UNESCAP; and The Millennium Development Goals Report 2011 (Statistical Annex) of the United Nations.
Although international sources rely on data supplied by national authorities, there can be differences between the data reported by these two sources. International agencies often apply international standards and harmonisation pro-cedures to improve data comparability across countries. Missing data points for a country may be produced by an estimate based on various methodologies, or sometimes by conducting a small sample survey. Because of the processes involved and difficulties of coordination be-tween national and international data agencies, international data series may not incorporate the most recent national data, which often results in a time lag in data from international sources. All these factors can lead to differences between national and international data and estimates.
A note of caution: Since international agencies continually improve their data series, some indicators may not be directly comparable across countries or points of time.
TIME PERIOD
This Report uses the most recent information available at the time of finalising the Report. Data are presented at different points in time in order to capture trends, starting from 1990. For most

INDICATORS 211
indicators, data are reported at 10-year intervals, i.e., 1990, 2000 and 2010; wherever data for 2010 are not available, they are reported for the latest year. For example, the latest CO2 emissions data are reported for 2007, while the latest year for most GHG emissions is 2005. In cases where data for all three reference points (1990, 2000 and 2010) are not available, data for the year nearest the reference points are presented.
As the HDRU collects data from the databases and reports of international organisations and not from the national statistical offices of govern-ments, it is likely that some statistics may not be updated. This is more likely for data gathered from household surveys. Data from the databases of the UNESCO, the UN (Statistics Division), the World Bank and the WRI were updated as of 1 November 2011, unless otherwise mentioned.
NOTES ON SELECTED INDICATORS
Definitions of selected indicators included in the Statistical Tables are presented here. Definitions of technical terms and indicators mentioned in the chapters of the Report are included in the section on Technical Terms.
Adult literacy rate (% of 15+ years). The percent-age of population aged 15 years and over who can both read and write, with understand-ing, a short simple statement on their everyday life. Generally, ‘literacy’ also encompasses ‘numeracy’, the ability to make simple arithmetic calculations (UNESCO Institute for Statistics 2011).
Air transport, registered carrier departures worldwide. Registered carrier departures worldwide are do-mestic takeoffs, and takeoffs abroad of air carriers registered in the country (World Bank 2011).
Arable land (% of land area). Arable land includes land defined by the FAO as land under temporary crops (double-cropped areas are counted once), temporary meadows for mowing or for pasture, land under market or kitchen gardens and land temporarily fallow. Land abandoned as a result of shifting cultivation is excluded. The percent-age of arable land is calculated as arable land divided by total land area multiplied by 100 (World Bank 2011).
Arable land (hectares per person). The definition of arable land is the same as above. Arable land per person is the total arable land divided by the total population of the same year (World Bank 2011).
Biological capacity or biocapacity. See Technical Terms.
Carbon dioxide emissions (kg per 2005 PPP$ of GDP/tonnes per capita/tonnes of terajoules of TPES). See Technical Terms.
Carbon dioxide equivalent (CO2e). See Technical Terms.
Carbon footprint. See Technical Terms.
Ecological footprint. See Technical Terms.
Electricity consumption per capita (kWh per person). Electric (power) consumption measures the production of power plants and combined heat and power plants less transmission, distribu-tion and transformation losses and own use by heat and power plants. Total electric power con-sumption (kWh) divided by the population using the electricity yields the per capita electricity con-sumption (World Bank 2011).
Electricity production sources: Coals/hydroelectric/natural gas/nuclear/oil (% of total). Sources of electricity refer to the inputs used to generate electricity. Coal refers to all coal and brown coal, both primary (including hard coal and lignite-brown coal) and derived fuels (including patent fuel, coke oven coke, gas coke, coke oven gas and blast furnace gas). Peat is also included in this category. Hydropower refers to electricity produced by hydroelectric power plants. Gas refers to natural gas but excludes natural gas liquids. Nuclear power refers to electricity pro-duced by nuclear power plants. Oil refers to crude oil and petroleum products. Each source is expressed in per cent of the total electricity production (World Bank 2011).
Electrification rate (%). Indicates the number of people with electricity access as a percentage of the total population (IEA 2011d).
Employment to population ratio (% of population ages 15+). Proportion of a country’s population that

ASIA-PACIFIC HUMAN DEVELOPMENT REPORT212
is employed. Ages 15 and older are generally considered as the working-age population (World Bank 2011).
Energy use (kg of oil equivalent) per US$1,000 GDP (constant 2005 PPP). Energy use per PPP GDP is the kilogramme of oil equivalent of energy use per constant PPP GDP. Energy use refers to use of primary energy before transformation to other end-use fuels, which is equal to indigenous production plus imports and stock changes, minus exports and fuels supplied to ships and aircraft engaged in international transport. PPP GDP is gross domestic product converted to 2005 constant international dollars using purchasing power parity rates. An international dollar has the same purchasing power over GDP as a US dollar has in the United States (World Bank 2011).
Forest area (% of total land area). Land under natural or planted stands of trees of at least five metres in situ, whether productive or not; excludes tree stands in agricultural production systems (for example, in fruit plantations and agroforestry systems) and trees in urban parks and gardens (World Bank 2011).
Fossil fuels energy consumption (% of total). Fossil fuel comprises coal, oil, petroleum and natural gas products. It is expressed in per cent of the total energy consumption (World Bank 2011).
GDP by economic activities (% of GDP constant 2005 prices). Generation of gross value added by industrial classification of economic activities according to the International Standard Indus-trial Classification (United Nations 2010). These activities are grouped here into four broader groups: agriculture, hunting, forestry and fish-ing; mining, manufacturing, construction and utilities; wholesale, retail trade, restaurants, hotel, transport and communication; other activities.
GDP growth (annual %). Annual percentage growth rate of GDP at market prices based on constant local currency. Aggregates are based on constant 2000 US dollars. GDP is the sum of gross value added by all resident producers in the economy plus any product taxes and minus any subsidies not included in the value of the products. It is calculated without making deduc-tions for depreciation of fabricated assets or for
depletion and degradation of natural resources (World Bank 2011).
GDP per capita (PPP constant 2005 international US$). GDP per head calculated as the aggregate of production (GDP) divided by the population size. GDP per capita is based on purchasing power parity (PPP). PPP GDP is gross domes-tic product converted to international dollars using purchasing power parity rates. An inter-national dollar has the same purchasing power over GDP as the US dollar has in the United States. Data are in constant 2005 international dollars (World Bank 2011).
Gini index. This index measures the extent to which the distribution of income (or, in some cases, consumption expenditure) among individuals or households within an economy deviates from a perfectly equal distribution. A Lorenz curve plots the cumulative percentages of total in-come received against the cumulative number of recipients, starting with the poorest individual or household. The Gini index measures the area between the Lorenz curve and a hypothetical line of absolute equality, expressed as a percent-age of the maximum area under the line. Thus, a Gini index of 0 represents perfect equality, while an index of 100 implies perfect inequality (World Bank 2011).
Greenhouse gas emissions (MtCO2e). Greenhouse gases refer to six gases: carbon dioxide, methane, nitrous oxide, hydrofluorocarbons, perfluoro-carbons and sulphur hexafluoride. See Technical Terms. CO2 is the main gas, and all other gases are converted to CO2 equivalent (CO2e) to derive the total amount of GHGs measured in million metric tonnes of CO2e.
CO2 emissions (Mt CO2). Carbon dioxide emis-sions are those stemming from the burning of fossil fuels and the manufacture of cement. They include carbon dioxide produced dur-ing consumption of solid, liquid and gas fuels and gas flaring (World Bank 2011).
Methane emission (Mt of CO2e). Emissions stem-ming from human activities such as agricul-ture and from industrial methane production (World Bank 2011).
Nitrous oxide emission (Mt of CO2e). Emissions from agricultural biomass burning, industrial

INDICATORS 213
activities and livestock management (World Bank 2011).
Other GHG emissions (HFC, PFC and SFC) (Mt of CO2e). Other greenhouse gas emissions are by-product emissions of hydrofluorocar-bons, perfluorocarbons and sulphur hexa-fluoride (World Bank 2011).
Income share held by the lowest 20 per cent. Percentage share of income or consumption is the share that accrues to subgroups of population indicated by deciles or quintiles. Percentage shares by quintile may not sum to 100 because of rounding (World Bank 2011).
Infant mortality rate (per 1,000 live births). The prob-ability of a child born in a specific year or period dying before reaching the age of one, if subject to age-specific mortality rates of the period (WHO 2011).
Labour force participation rate (% of population ages 15+). Proportion of the population aged 15 and older that is economically active: all people who supply labour for the production of goods and services during a specified period (World Bank 2011).
Life expectancy at birth. The average number of years that a newborn is expected to live if current mortality rates continue to apply (WHO 2011).
Marine protected area (% of territorial waters). Marine protected areas are the areas of intertidal or sub-tidal terrain — and overlying water and asso-ciated flora and fauna and historical and cultural features — that have been reserved by law or other effective means to protect part or all of the enclosed environment (World Bank 2011).
Maternal mortality ratio (per 100,000 live births). The number of maternal deaths per 100,000 live births during a specified time period, usually one year (WHO 2011).
Motor vehicles (per 1,000 people). Motor vehicles include cars, buses and freight vehicles but do not include two-wheelers. Population refers to mid-year population in the year for which data are available (World Bank 2011).
National Adaptation Plan/Programme of Action. See Technical Terms.
Natural disaster. Situation or event that over-whelms local capacity, necessitating a request to the national or international level for external assistance. An unforeseen and often sudden event that causes great damage, destruction and human suffering. Types of natural disaster include: drought, earthquake (seismic activity), epidemic, extreme temperature, flood, insect infestation, mass movement dry, mass movement wet, storm, volcano and wildfire (EM-DAT n.d.).
Net (primary) school enrolment (%). Enrolment of the official age group of primary level of edu-cation expressed as a percentage of the corre-sponding population. It is calculated by dividing the number of pupils enrolled who are of the primary age group for the primary level of edu-cation by the population for the same age group and multiplied by 100 (UNESCO Institute for Statistics 2011).
Passenger cars (per 1,000 people). Passenger cars refer to road motor vehicles, other than two-wheelers, intended for the carriage of passengers and designed to seat no more than nine people (including the driver) (World Bank 2011).
Population density. Population per square kilometre (UNDESA 2011a; FAO 2011).
Poverty headcount ratio at US$1.25 a day (PPP) (% of population). The percentage of the population living on less than $1.25 a day at 2005 inter-national prices (World Bank 2011).
Poverty headcount ratio at national poverty line (% of population). National poverty rate is the percent-age of the population living below the national poverty line. National estimates are based on population-weighted subgroup estimates from household surveys (World Bank 2011).
Poverty headcount ratio at urban/rural poverty line (% of urban/rural population). Percentage of the urban/rural population living below the urban/rural poverty line (World Bank 2011).
Population living in coastal zone. The proportion of populations (urban, rural and total) in low elevation coastal zones (LECZ). The zone is derived by selecting all land contiguous with the coast that is 10 metres or less in elevation (CIESIN n.d.).

ASIA-PACIFIC HUMAN DEVELOPMENT REPORT214
Population living in elevated areas (1,500–3,000 m) and (3,000–5,000 m). Per cent population, in area(s) where the elevation is 1,500–3,000 metres and 3,000–5,000 metres, respectively (CIESIN 2007).
Population living in slums. See Technical Terms.
Population in urban/rural areas. De facto population living in areas classified as urban/rural accord-ing to the criteria used by each area or country (UNDESA 2011a).
Proportion of population using improved drinking water sources. The percentage of the population who use any of the following types of water supply for drinking: piped water into dwelling, plot or yard; public tap/standpipe; borehole/tube well; protected dug well; protected spring; rain-water collection and bottled water (if a secondary available source is also improved). It does not include unprotected wells, unprotected springs, water provided by carts with small tanks/drums, tanker truck–provided water and bottled water (if secondary source is not an improved source) or surface water taken directly from rivers, ponds, streams, lakes, dams or irrigation channels (United Nations n.d.).
Proportion of population using improved sanitation facilities. The percentage of the population with access to facilities that hygienically separate human excreta from human contact. Improved facilities include flush/pour–flush toilets or latrines connected to a sewer, septic tank or pit; ventilated improved pit latrines; pit latrines with a slab or platform of any material that covers the pit entirely, except for the drop hole; and com-posting toilets/latrines. Unimproved facilities include public or shared facilities of an other-wise acceptable type, flush/pour–flush toilets or latrines that discharge directly into an open sewer or ditch, pit latrines without a slab, bucket latrines, hanging toilets or latrines that directly discharge in water bodies or in the open, and the practice of open defecation in the bush, field or bodies or water (United Nations n.d.).
Shares of renewables (% of TPES). Percentage of total primary energy supply (TPES) that is renewable energy. Renewable energy is derived from natural processes that are replenished
constantly. In its various forms, it derives dir-ectly or indirectly from the sun, or from heat generated deep within the earth. Included in the definition is energy generated from solar, wind, biomass, geothermal, hydropower and ocean resources, and biofuels and hydrogen derived from renewable resources. Renewable products are: hydro (large, medium and small), geothermal, solar photovoltaic, solar thermal, tide, wave, ocean, wind, solid biomass, gases from biomass, liquid biomass and renewable muni-cipal waste (IEA 2011c).
Total primary energy supply (Mtoe). TPES is made up of production + imports − exports − international marine bunkers − international aviation bunkers ± stock changes. For the world total, international marine and aviation bunkers are not subtracted from TPES (IEA 2011b).
Underweight children under 5 (%). The percentage of children aged 0–59 months whose weights for age are less than two standard deviations below the median weight for age of the international reference population (United Nations n.d.).
Under-five mortality rate (per 1,000 live births). The probability of a child born in a specific year or period dying before reaching the age of five, if subject to age-specific mortality rates of that period (WHO 2011).
Undernourished population (%). The proportion of the population below the minimum level of dietary energy consumption referred to as the prevalence of undernourishment, is the percentage of the population that is undernourished or food-deprived. The undernourished or food-deprived are those individuals whose food intake falls below the minimum level of dietary energy requirements (United Nations n.d.).
NEW INDICES INTRODUCED BY THE GLOBAL HDR 2010
The 2010 Human Development Report, The real wealth of nations: Pathways to human development, introduces an updated version of its signature HDI and presents three pioneering new indices of the HDI family: inequality-adjusted HDI (IHDI); gender inequality index (GII); and multidimensional poverty index (MPI).

INDICATORS 215
The earlier versions of the indices including the HDI, gender-related development index (GDI) and the gender empowerment measure (GEM), and the human poverty index (HPI) were discontinued from the year 2010. The four new indices, including the new HDI, are briefly explained here.3
Human Development Index (HDI)
The HDI is a summary measure of human devel-opment. It measures the average achievements in three dimensions of human development: a long and healthy life, access to knowledge, and a decent standard of living. Two changes have been made in the HDI in the process of its update:
1. Use of new indicators for measuring educa-tion and income dimensions. For the edu-cation dimension, the two indicators used in the past were gross enrolment and adult literacy rates. These have been substituted by two new indicators: mean year of schooling and expected year of schooling. The income dimension now includes real gross national income (GNI) per capita (PPP US$) as against the real gross domestic product (GDP) per capita (PPP US$) used earlier. With the inclusion of these new indicators, the four indicators that measure the three dimensions of HDI are: life expectancy at birth, mean year of schooling, expected year of schooling and GNI per capita.
2. Use of geometric mean to aggregate three dimensions, instead of the arithmetic mean used earlier.
Thus, the updated HDI is the geometric mean of the three normalised sub-indices of the three dimensions. The sub-indices are created by con-verting dimension indicators into unit-free values to facilitate aggregation. This requires identify-ing minimum and maximum goal posts for each indicator. HDI values range between 0 and 1; high values indicate high human development.
Inequality-Adjusted Human Development Index (IHDI)
The IHDI adjusts the human development index for inequality in distribution of each of the three dimensions of HDI, viz., long and healthy life,
knowledge, and decent standard of living. It accounts for inequalities in HDI dimensions by ‘discounting’ each dimension’s average value according to its level of inequality. The IHDI equals the HDI when there is no inequality across people, but is less than the HDI as inequality rises. In this sense, the IHDI is the actual level of human development (accounting for the inequality), while the HDI can be viewed as an index of ‘potential’ human development (or the maximum level of HDI) that could be achieved if there was no inequality (UNDP 2010). The ‘loss’ in potential human development due to inequal-ity is given by the difference between the HDI and IHDI, and can be expressed as a percentage.
The IHDI is computed using three steps: (a) measuring inequality in underlying distribu-tions; (b) adjusting the dimension indices for inequality; and (c) computing the IHDI. It is based on a distribution-sensitive class of com-posite indices proposed by Foster et al. (2005), which draws on the Atkinson (1970) family of in-equality measures. It is computed as a geometric mean of geometric means, calculated across the population for each dimension separately.
Gender Inequality Index (GII)
This index reflects women’s disadvantage in three dimensions: reproductive health, empower-ment and the labour market. Five indicators are used to measure the three dimensions — maternal mortality ratio and adolescent fertility rate to represent the health dimension; female and male population with at least secondary education, and female and male shares of parliamentary seats to measure the empowerment dimension; and female and male labour force participation rates to reflect the labour market dimension. The GII thus includes some of the indicators of the GDI and GEM, and adds new labour market indicators. The index shows the loss in human development due to inequality between female and male achievements in these dimensions. It ranges from 0, which indicates that women and men fare equally, to 1, indicating that women fare as poorly as possible in all measured dimensions.
The GII is computed using the association-sensitive inequality measure suggested by Seth (2009). The index is based on a general mean of general means of different orders — the first aggregation is by the geometric mean across

ASIA-PACIFIC HUMAN DEVELOPMENT REPORT216
dimensions; these means, calculated separately for women and men, are then aggregated using a harmonic mean across genders. The index is computed in the following five steps: (a) treating zero and extreme values; (b) aggregating across dimensions within each gender group, using geometric means; (c) aggregating across gender groups, using a harmonic mean; (d) calculating the geometric mean of the arithmetic means for each indicator; and, finally (e) calculating the GII. Details of the methodology are given in the global HDR 2010.
Multidimensional Poverty Index
The multidimensional poverty index (MPI) identifies multiple deprivations at the individ-ual level in health, education and standard of
living. The MPI has: (a) three dimensions — health, education and standards of living; and (b) 10 indicators — two each for health and education, and six for standard of living (Figure 1). Three of the six standard-of-living indictors are related to the environment.
Using the 10 indicators, the MPI provides a headcount rate (H) and the intensity of pov-erty (A), similar to the incidence and depth of the FGT (Foster-Greer-Thorbecke) measure of income poverty. The headcount rate shows the proportion of poor households, and the in-tensity of poverty implies the average number of dimensions in which a household is deprived. The MPI and/or its components aim to serve as measures for identifying poor households, communities or groups, sub-nations or countries, and thus help in targeting.
The MPI uses micro-data from household surveys. All the indicators needed to construct the MPI come from the same survey. Each person in a given household is classified as poor or non-poor, depending on the number of deprivations his or her household experi-ences. These data are then aggregated into the national measure of poverty. For a detailed methodology, see the global HDR 2010 (UNDP 2010), Alkire and Santos (2010) and Klugman et al. (2011).
USE OF SYMBOLS AND ACRONYMS
A dash between two years, such as in 2005–10, indicates that the data presented are for the most recent year available in the specified period. The following symbols are used across the tables:
.. Not available0 Nil or negligiblen/a Not applicablen.d. Undated references or sources of data
FIGURE
1MPI Dimensions and Indicators
Source: UNDP 2010.
1. Climate change can be approached from differ-ent angles. In narrowing down its scope for the statistical tables, the human development perspec-tive has been applied to select and categorise the indicators.
2. The HDI ranks for Asia-Pacific countries are derived from the global Human Development Report 2011 (UNDP 2011), which uses the refined method of calculating HDI values for countries. The number
of countries for which values are reported increased from 169 in the 2010 HDR to 187 countries in the 2011 HDR. The HDI values and ranks are, therefore, not comparable with those mentioned in any earlier report. For comparisons over time, readers may refer to the 2011 global HDR.
3. For further details, including the comprehensive methodology of computation of indices, please see UNDP 2010.
NOTES

INDICATORS 217
HUMAN DEVELOPMENT, POVERTY AND INEQUALITY
TABLEHDI and Related Indices1
By HDI Rank HDI Trends Inequality-Adjusted HDI
Gender Inequality Index
Multidimensional Poverty Index
Value Value Rank Value Yearb Valuec
2011 1990 2000 2011 2011 2011
EAST ASIA
12 Japan 0.827 0.868 0.901 · · 14 0.123 · · · ·15 Korea, Republic of 0.742 0.830 0.897 0.749 11 0.111 · · · ·26 Singapore · · 0.801 0.866 · · 8 0.086 · · · ·33 Brunei Darussalam 0.784 0.818 0.838 · · · · · · · · · ·61 Malaysia 0.631 0.705 0.761 · · 43 0.286 · · · ·
101 China 0.490 0.588 0.687 0.534 35 0.209 2003 (W) 0.056103 Thailand 0.566 0.626 0.682 0.537 69 0.382 2005 (M) 0.006110 Mongolia 0.540 0.555 0.653 0.563 70 0.410 2005 (M) 0.065112 Philippines 0.571 0.602 0.644 0.516 75 0.427 2008 (D) 0.064124 Indonesia 0.481 0.543 0.617 0.504 100 0.505 2007 (D) 0.095128 Viet Nam 0.435 0.528 0.593 0.510 48 0.305 2002 (D) 0.084138 Lao People’s Democratic Republic 0.376 0.448 0.524 0.405 107 0.513 2006 (M) 0.267139 Cambodia · · 0.438 0.523 0.380 99 0.500 2005 (D) 0.251147 Timor-Leste · · 0.404 0.495 0.332 · · · · 2009 (D) 0.360149 Myanmar 0.298 0.380 0.483 · · 96 0.492 2000 (M) 0.154
Korea, Democratic People’s Republic of · · · · · · · · · · · · · · · ·
SOUTH AND WEST ASIA
88 Iran, Islamic Republic of 0.534 0.636 0.707 · · 92 0.485 · · · ·97 Sri Lanka 0.583 0.633 0.691 0.579 74 0.419 2003 (W) 0.021
109 Maldives · · 0.576 0.661 0.495 52 0.320 2009 (D) 0.018134 India 0.410 0.461 0.547 0.392 129 0.617 2005 (D) 0.283141 Bhutan · · · · 0.522 · · 98 0.495 2010 (M) 0.119145 Pakistan 0.399 0.436 0.504 0.346 115 0.573 2007 (D) 0.264146 Bangladesh 0.352 0.422 0.500 0.363 112 0.550 2007 (D) 0.292157 Nepal 0.340 0.398 0.458 0.301 113 0.558 2006 (D) 0.350172 Afghanistan 0.246 0.230 0.398 · · 141 0.707 · · · ·
PACIFIC
2 Australia 0.873 0.906 0.929 0.856 18 0.136 · · · ·5 New Zealand 0.828 0.878 0.908 · · 32 0.195 · · · ·
49 Palau · · 0.774 0.782 · · · · · · · · · ·90 Tonga 0.649 0.681 0.704 · · · · · · · · · ·99 Samoa · · 0.657 0.688 · · · · · · · · · ·
100 Fiji 0.624 0.668 0.688 · · · · · · · · · ·116 Micronesia, Federated States of · · · · 0.636 0.390 · · · · · · · ·122 Kiribati · · · · 0.624 · · · · · · · · · ·125 Vanuatu · · · · 0.617 · · · · · · 2007 (M) 0.129142 Solomon Islands · · 0.479 0.510 · · · · · · · · · ·153 Papua New Guinea 0.368 0.423 0.466 · · 140 0.674 · · · ·
Marshall Islands · · · · · · · · · · · · · · · ·Nauru · · · · · · · · · · · · · · · ·Tuvalu · · · · · · · · · · · · · · · ·
REGION
Arab States 0.516 0.578 0.641 0.472a · · 0.563 · · · ·East Asia and the Pacifi c 0.498a 0.581 0.671 0.528a · · · · · · · ·Europe and Central Asia 0.680a 0.695 0.751 0.655 · · 0.311 · · · ·Latin America and the Caribbean 0.624 0.680 0.731 0.540 · · 0.445 · · · ·South Asia 0.418 0.468 0.548 0.393 · · 0.601 · · · ·Sub-Saharan Africa 0.383 0.401 0.463 0.303 · · 0.610 · · · ·
WORLD 0.594 0.634 0.682 0.525 · · 0.492 · · · ·
Source: UNDP 2011.Notes: Countries without HDI ranking in this statistical table do not have HDI values. These countries are placed at the end of each sub-region in the table.
All subsequent tables follow this arrangement of countries. (· ·) implies data not available (valid for all tables). a Based on less than half of the countries in the group or region. b (D) indicates data are from Demographic and Health Surveys, (M) indicates data are from Multiple Indicator Cluster Surveys, and (W) indicates
data are from World Health Surveys. c Not all indicators were available for all countries; caution should thus be used in cross-country comparisons. Where data are missing, indicator
weights are adjusted to total 100 per cent. For details on countries missing data, see Alkire et al. (2011).

ASIA-PACIFIC HUMAN DEVELOPMENT REPORT218
TABLEPoverty and Inequality2
By HDI Rank Poverty Headcount Ratio (% of Population)a
Poverty Headcount Ratio (National Poverty Line)a
Income Share Held by
Lowest 20% Populationa
Income Gini
Coeffi cienta
PPP $1.25 a Day
National Poverty Line
% of Urban Population
% of RuralPopulation
2011 2000–2009 2000–2009 1996–2000 2006–2009 1996–2000 2006–2009 2000–2009 2000–2010
EAST ASIA
12 Japan · · · · · · · · · · · · · · · ·
15 Korea, Republic of · · · · · · · · · · · · · · · ·
26 Singapore · · · · · · · · · · · · · · · ·
33 Brunei Darussalam · · · · · · · · · · · · · · · ·
61 Malaysia 0.5 3.8 · · 1.7 · · 8.2 4.5 46.2
101 China 15.9 2.8 2.0 · · 3.50 · · 5.7 41.5
103 Thailand 0.4 8.1 8.6 3.0 26.5 10.4 6.2 42.5
110 Mongolia 22.4 35.2 39.4 26.9 32.6 46.6 7.2 33.0
112 Philippines 22.6 26.5 21.5 · · 50.7 · · 5.6 44.0
124 Indonesia 18.7 14.2 19.4 10.7 26.0 17.4 7.7 36.8
128 Viet Nam 13.1 14.5 9.0 3.3 44.9 18.7 7.3 37.6
138 Lao People’s Democratic Republic 33.9 27.6 26.9 17.4 41.0 31.7 7.6 36.7
139 Cambodia 28.3 30.1 21.1 11.8 40.1 34.5 6.6 44.4
147 Timor-Leste 37.4 49.9 · · · · · · · · 9.0 31.9
149 Myanmar · · · · · · · · · · · · · · · ·
Korea, Democratic People’s Republic of · · · · · · · · · · · · · · · ·
SOUTH AND WEST ASIA
88 Iran, Islamic Republic of 1.5 · · · · · · · · · · 6.4 38.3
97 Sri Lanka 7.0 15.2 14.0 6.7 30.9 15.7 6.9 40.3
109 Maldives 1.5 · · · · · · · · · · 6.5 37.4
134 India 41.6 27.5 · · · · · · · · 8.1 36.8
141 Bhutan 26.2 23.2 · · 1.7 · · 30.9 5.4 46.8
145 Pakistan 22.6 22.3 20.9 13.1 34.7 27.0 9.0 32.7
146 Bangladesh 49.6 40.0 35.2 · · 52.3 · · 9.4 31.0
157 Nepal 55.1 30.9 21.6 · · 43.3 · · 5.9 47.3
172 Afghanistan · · 36.0 · · 29.0 · · 37.5 9.0 29.4
PACIFIC
2 Australia · · · · · · · · · · · · · · · ·
5 New Zealand · · · · · · · · · · · · · · · ·
49 Palau · · · · · · · · · · · · · · · ·
90 Tonga · · · · · · · · · · · · · · · ·
99 Samoa · · · · · · · · · · · · · · · ·
100 Fiji · · 31.0 · · 18.6 · · 43.3 · · · ·
116 Micronesia, Federated States of 31.2 · · · · · · · · · · 1.6 61.1
122 Kiribati · · · · · · · · · · · · · · · ·
125 Vanuatu · · · · · · · · · · · · · · · ·
142 Solomon Islands · · · · · · · · · · · · · · · ·
153 Papua New Guinea · · · · 16.1 · · 41.3 · · · · · ·
Marshall Islands · · · · · · · · · · · · · · · ·
Nauru · · · · · · · · · · · · · · · ·
Tuvalu · · · · · · · · · · · · · · · ·
REGION
East Asia and the Pacifi c (developing) 16.8b · · · · · · · · · · · · · ·
High income: OECD · · · · · · · · · · · · · · · ·
Latin America and the Caribbean (developing) 8.6b · · · · · · · · · · · · · ·
Middle East and North Africa (developing) 3.6b · · · · · · · · · · · · · ·
South Asia 40.3b · · · · · · · · · · · · · ·
Sub-Saharan Africa (developing) 52.1b · · · · · · · · · · · · · ·
WORLD 25.2b · · · · · · · · · · · · · ·
Sources: (a) World Bank 2011; (b) World Bank 2010.Note: Regional estimates of poverty refer to year 2005.

INDICATORS 219
POPU
LATI
ON
TAB
LEG
row
th a
nd
Den
sity
of
Popu
lati
on3
By
HD
I Ran
kPo
pula
tion
(in
Mill
ion
)aG
row
th R
ate
(Ave
rage
An
nu
al %
)Po
pula
tion
Den
sity
(Per
son
s pe
r km
2 )a
Tota
lU
rban
Rura
lTo
tal
Urb
anRu
ral
2011
1990
2000
2010
1990
2000
2010
1990
2000
2010
1990
–20
0020
00–
2010
1990
–20
0020
00–
2010
1990
–20
0020
00–
2010
1990
2000
2010
EAST
ASI
A
12Ja
pan
122.
2512
5.72
126.
5477
.13
81.9
984
.57
45.1
243
.73
41.9
70.
280.
060.
610.
31–0
.31
–0.4
132
433
333
515
Kor
ea, R
epu
blic
of
42.9
845
.99
48.1
831
.74
36.6
239
.97
11.2
49.
378.
210.
680.
471.
430.
88–1
.82
–1.3
243
246
248
426
Sin
gapo
re3.
023.
925.
093.
023.
925.
090.
000.
000.
002.
622.
612.
622.
610.
000.
0044
1757
3874
4733
Bru
nei
Dar
uss
alam
0.25
0.33
0.40
0.17
0.23
0.30
0.09
0.09
0.10
2.60
1.99
3.38
2.60
0.91
0.29
4457
6961
Mal
aysi
a18
.21
23.4
128
.40
9.07
14.5
120
.50
9.14
8.90
7.90
2.51
1.93
4.70
3.45
–0.2
6–1
.19
5571
8610
1C
hin
a11
45.2
012
69.1
213
41.3
430
2.81
453.
8062
9.82
842.
3881
5.32
711.
511.
030.
554.
053.
28–0
.33
–1.3
611
913
214
010
3Th
aila
nd
57.0
763
.16
69.1
216
.79
19.6
723
.48
40.2
843
.49
45.6
51.
010.
901.
581.
770.
770.
4811
112
313
511
0M
ongo
lia2.
192.
412.
761.
251.
371.
710.
941.
041.
050.
951.
340.
922.
210.
990.
061
22
112
Phili
ppin
es61
.63
77.3
193
.26
29.9
537
.10
45.6
131
.68
40.2
147
.65
2.27
1.88
2.14
2.06
2.38
1.70
205
258
311
124
Indo
nes
ia18
4.35
213.
4023
9.87
56.3
889
.63
106.
2212
7.97
123.
7713
3.65
1.46
1.17
4.64
1.70
–0.3
30.
7797
112
126
128
Vie
t N
am67
.10
78.7
687
.85
13.5
919
.29
26.6
953
.51
59.4
761
.16
1.60
1.09
3.50
3.25
1.06
0.28
202
237
265
138
Lao
Peop
le’s
Dem
ocra
tic
Repu
blic
4.19
5.32
6.20
0.65
1.17
2.06
3.55
4.15
4.14
2.38
1.54
5.91
5.66
1.57
–0.0
118
2226
139
Cam
bodi
a9.
5312
.45
14.1
41.
202.
102.
848.
3310
.34
11.3
02.
671.
275.
613.
012.
160.
8853
6978
147
Tim
or–L
este
0.74
0.83
1.12
0.15
0.20
0.32
0.59
0.63
0.81
1.11
3.03
2.63
4.51
0.66
2.51
5056
7614
9M
yan
mar
39.2
744
.96
47.9
69.
7012
.50
16.1
429
.57
32.4
631
.82
1.35
0.65
2.53
2.56
0.93
–0.2
058
6671
Kor
ea, D
emoc
rati
c Pe
ople
’s
Repu
blic
of
20.1
422
.89
24.3
511
.76
13.6
014
.66
8.38
9.29
9.69
1.28
0.61
1.45
0.75
1.03
0.42
167
190
202
SOU
TH A
ND
WES
T A
SIA
88Ir
an, I
slam
ic R
epu
blic
of
54.8
765
.34
73.9
730
.91
41.9
552
.34
23.9
623
.39
21.6
41.
751.
243.
052.
21–0
.24
–0.7
833
4045
97Sr
i Lan
ka17
.34
18.7
520
.86
3.23
2.97
2.99
14.1
115
.78
17.8
70.
781.
07–0
.84
0.06
1.12
1.25
264
286
318
109
Mal
dive
s0.
220.
270.
320.
060.
080.
130.
160.
200.
192.
191.
452.
895.
151.
94–0
.43
736
917
1060
134
Indi
a87
3.79
1053
.90
1224
.61
223.
2329
1.56
367.
5165
0.56
762.
3485
7.11
1.87
1.50
2.67
2.31
1.59
1.17
266
321
373
141
Bhu
tan
0.56
0.57
0.73
0.09
0.15
0.25
0.47
0.43
0.47
0.23
2.40
4.61
5.51
–0.9
21.
0712
1215
145
Paki
stan
111.
8414
4.52
173.
5934
.20
47.8
962
.31
77.6
596
.63
111.
282.
561.
833.
372.
632.
191.
4114
018
221
814
6Ba
ngl
ades
h10
5.26
129.
5914
8.69
20.8
530
.57
41.7
384
.40
99.0
210
6.96
2.08
1.37
3.83
3.11
1.60
0.77
731
900
1033
157
Nep
al19
.08
24.4
029
.96
1.69
3.28
5.58
17.3
921
.12
24.3
82.
462.
056.
635.
321.
941.
4313
016
620
417
2A
fgh
anis
tan
13.0
322
.86
31.4
12.
364.
627.
1010
.67
18.2
424
.31
5.62
3.18
6.72
4.30
5.36
2.87
2035
48
(Con
tinu
ed)

ASIA-PACIFIC HUMAN DEVELOPMENT REPORT220
By
HD
I Ran
kPo
pula
tion
(in
Mill
ion
)aG
row
th R
ate
(Ave
rage
An
nu
al %
)Po
pula
tion
Den
sity
(Per
son
s pe
r km
2 )a
Tota
lU
rban
Rura
lTo
tal
Urb
anRu
ral
2011
1990
2000
2010
1990
2000
2010
1990
2000
2010
1990
–20
0020
00–
2010
1990
–20
0020
00–
2010
1990
–20
0020
00–
2010
1990
2000
2010
PAC
IFIC
2A
ust
ralia
17.1
019
.16
22.2
714
.60
16.7
019
.84
2.50
2.46
2.43
1.14
1.50
1.35
1.72
–0.1
5–0
.14
22
35
New
Zea
lan
d3.
403.
864.
372.
883.
313.
770.
520.
550.
601.
271.
241.
381.
300.
640.
8713
1416
49Pa
lau
∗0.
020.
020.
02· ·
· ·· ·
· ·· ·
· ·· ·
· ·· ·
· ·· ·
· ·33
4245
90To
nga
0.10
0.10
0.10
0.02
0.02
0.02
0.07
0.08
0.08
0.29
0.61
0.42
0.79
0.25
0.55
146
151
160
99Sa
moa
0.16
0.18
0.18
0.03
0.04
0.04
0.13
0.14
0.15
0.90
0.36
1.26
–0.4
60.
800.
5857
6265
100
Fiji
0.73
0.81
0.86
0.30
0.39
0.45
0.43
0.42
0.41
1.08
0.59
2.49
1.38
–0.0
6–0
.20
4044
4711
6M
icro
nes
ia, F
eder
ated
Sta
tes
of0.
100.
110.
110.
020.
020.
030.
070.
080.
091.
060.
36–0
.39
0.51
1.52
0.32
137
153
158
122
Kir
ibat
i∗0.
070.
080.
10· ·
· ·· ·
· ·· ·
· ·· ·
· ·· ·
· ·· ·
· ·99
116
137
125
Van
uat
u0.
150.
190.
240.
030.
040.
060.
120.
140.
182.
332.
583.
814.
221.
952.
0812
1520
142
Solo
mon
Isla
nds
0.31
0.41
0.54
0.04
0.06
0.10
0.27
0.34
0.44
2.78
2.75
4.17
4.41
2.54
2.41
1114
1915
3Pa
pua
New
Gu
inea
4.16
5.38
6.86
0.62
0.71
0.86
3.53
4.67
6.00
2.58
2.43
1.30
1.90
2.78
2.51
912
15
Mar
shal
l Isl
ands
∗0.
050.
050.
05· ·
· ·· ·
· ·· ·
· ·· ·
· ·· ·
· ·· ·
· ·26
128
829
9
Nau
ru∗
0.01
0.01
0.01
· ·· ·
· ·· ·
· ·· ·
· ·· ·
· ·· ·
· ·· ·
436
478
488
Tu
valu
∗0.
010.
010.
01· ·
· ·· ·
· ·· ·
· · · ·
· ·· ·
· ·· ·
· ·34
636
237
8
REG
ION
East
Asi
a an
d th
e Pa
cifi
c (d
evel
opin
g)∗∗
16
15.3
518
21.4
019
65.5
145
4.38
666.
2289
1.58
1160
.97
1155
.18
773.
931.
20–0
.89
3.83
2.91
–0.0
5–4
.01
9911
212
1
Hig
h in
com
e: O
ECD
91
3.87
969.
8910
30.4
165
8.63
722.
9479
5.00
225.
8524
6.95
235.
410.
920.
610.
930.
950.
89–0
.48
2730
32La
tin
Am
eric
a an
d th
e C
arib
bean
(d
evel
opin
g)∗∗
43
6.48
514.
3058
2.72
307.
4838
8.16
463.
9012
9.00
126.
1411
8.82
1.64
1.25
2.33
1.78
–0.2
2–0
.60
2125
29
Mid
dle
East
an
d N
orth
Afr
ica
(dev
elop
ing)
∗∗22
2.92
273.
8832
6.79
114.
8115
1.20
190.
9510
8.11
122.
6813
5.84
2.06
1.77
2.75
2.33
1.26
1.02
2531
37
Sou
th A
sia
1141
.11
1394
.86
1630
.17
285.
7038
1.11
487.
5985
5.41
1013
.75
1142
.58
2.01
1.56
2.88
2.46
1.70
1.20
222
272
318
Sub-
Sah
aran
Afr
ica
(dev
elop
ing)
51
4.04
667.
1385
3.89
144.
7921
7.00
317.
3831
7.76
450.
1353
6.51
3.66
2.47
4.05
3.80
3.48
1.76
2028
35
WO
RLD
53
06.4
361
22.7
768
95.8
922
61.4
028
40.9
034
79.9
030
45.0
332
81.8
734
15.9
91.
431.
192.
282.
030.
750.
4039
4551
Sour
ces:
(a)
UN
DES
A 2
011a
; (b)
UN
DES
A 2
011b
; (c
) FA
O 2
011.
Not
es:
∗ U
ND
ESA
201
1b is
use
d fo
r to
tal p
opu
lati
on d
ue
to u
nav
aila
bilit
y of
cou
ntr
y da
ta in
UN
DES
A 2
011a
.
∗∗ R
egio
nal
agg
rega
tes
for
rura
l an
d u
rban
pop
ula
tion
incl
ude
cou
ntr
ies
th
at h
ave
data
on
bot
h r
ura
l an
d u
rban
are
as.
Ru
ral p
opu
lati
on is
cal
cula
ted
by s
ubt
ract
ing
urb
an p
opu
lati
on fr
om t
otal
pop
ula
tion
bas
ed o
n U
ND
ESA
201
1a a
nd
UN
DES
A 2
011b
.
Gro
wth
rate
of t
otal
, ru
ral a
nd
urb
an p
opu
lati
ons
was
cal
cula
ted
base
d on
UN
DES
A 2
011a
an
d U
ND
ESA
201
1b.
Re
gion
al a
ggre
gate
s fo
r pop
ula
tion
den
sity
wer
e ca
lcu
late
d ba
sed
on d
ata
from
UN
DES
A 2
011a
an
d FA
O 2
011.
Cou
ntr
y ar
ea d
ata
of 2
009
wer
e u
sed
for 2
010
from
FA
O 2
011.
(Con
tinu
ed)

INDICATORS 221
TABLELocation of Population4
By HDI Rank (2011) Population in Slums (% of Urban Population)a
Population Living in Coastal Zones
(% of Total)b
Population Living in Elevated Areas (% of Total)c
1,500–3,000 Metres 3,000–5,000 Metres
2011 1990 2000 2005–2007
1990 2000 1990 2000 1990 2000
EAST ASIA
12 Japan · · · · · · 24.1 24.1 0.46 0.44 0.00 0.00
15 Korea, Republic of 37.0 37.0 · · 6.4 6.2 0.02 0.02 0.00 0.00
26 Singapore · · · · · · 15.0 15.0 0.00 0.00 0.00 0.00
33 Brunei Darussalam 2.0 2.0 · · 9.3 9.5 0.00 0.00 0.00 0.00
61 Malaysia 2.0 2.0 · · 24.5 23.5 0.36 0.34 0.01 0.01101 China 43.6 37.3 31.0 10.5 11.4 6.54 6.67 0.81 0.83
103 Thailand · · · · 26.0 24.5 26.3 0.05 0.06 0.00 0.00
110 Mongolia 68.5 64.9 57.9 0.0 0.0 42.98 43.90 1.03 0.95
112 Philippines 54.3 47.2 42.3 18.3 17.7 0.62 0.62 0.00 0.00
124 Indonesia 50.8 34.4 23.0 19.8 19.6 0.95 0.98 0.03 0.04
128 Viet Nam 60.5 48.8 38.3 55.9 55.1 0.34 0.34 0.00 0.00
138 Lao People’s Democratic Republic 66.0 66.0 79.3 0.0 0.0 1.10 1.08 0.00 0.00
139 Cambodia · · · · 78.9 26.6 23.9 0.00 0.00 0.00 0.00
147 Timor-Leste 2.0 12.0 · · 3.5 3.5 3.89 3.89 0.00 0.00
149 Myanmar 31.1 26.4 45.6 25.9 25.8 1.34 1.32 0.04 0.04Korea, Democratic People’s Republic of
· · · · · · 10.0 10.2 2.15 2.15 0.00 0.00
SOUTH AND WEST ASIA
88 Iran, Islamic Republic of 51.9 44.2 30.5 1.9 2.1 46.08 45.49 1.45 1.47
97 Sri Lanka 24.8 13.6 12.0 13.3 11.8 1.82 1.70 0.00 0.00
109 Maldives · · · · · · 100.0 100.0 0.00 0.00 0.00 0.00
134 India 54.9 41.5 32.1 6.5 6.3 1.13 1.18 0.50 0.53
141 Bhutan 70.0 44.1 · · 0.0 0.0 36.89 36.97 22.71 22.76
145 Pakistan 51.0 48.7 47.0 2.9 2.9 4.58 4.51 1.56 1.55
146 Bangladesh 87.3 77.8 70.8 46.0 45.6 0.00 0.00 0.00 0.00157 Nepal 70.6 64.0 59.4 0.0 0.0 17.97 17.34 5.63 5.27172 Afghanistan 98.5 98.5 88.6 0.0 0.0 47.36 47.38 9.26 9.26
PACIFIC
2 Australia · · · · · · 11.9 12.1 0.03 0.03 0.00 0.00
5 New Zealand · · · · · · 14.7 14.7 0.20 0.20 0.00 0.00
49 Palau · · · · · · 52.3 51.5 0.00 0.00 0.00 0.00
90 Tonga · · · · · · 43.2 43.0 0.00 0.00 0.00 0.00
99 Samoa · · · · · · 23.6 23.6 1.16 1.16 0.00 0.00
100 Fiji · · · · · · 16.7 17.6 0.00 0.00 0.00 0.00
116 Micronesia, Federated States of · · · · · · 31.9 31.2 0.00 0.00 0.00 0.00
122 Kiribati · · · · · · 100.0 100.0 0.00 0.00 0.00 0.00
125 Vanuatu · · · · · · 4.6 4.5 0.00 0.00 0.00 0.00
142 Solomon Islands · · · · · · 18.3 19.5 0.26 0.22 0.00 0.00
153 Papua New Guinea · · · · · · 2.6 2.7 28.20 28.20 1.97 1.97Marshall Islands · · · · · · 99.8 99.8 0.00 0.00 0.00 0.00Nauru · · · · · · 42.0 42.0 0.00 0.00 0.00 0.00Tuvalu · · · · · · 99.6 99.5 0.00 0.00 0.00 0.00
WORLD · · · · · · 10.3 10.4 · · · · · · · ·
Sources: (a) UN-HABITAT and UNESCAP 2010; (b) CIESIN n.d.; (c) CIESIN 2007.

ASIA-PACIFIC HUMAN DEVELOPMENT REPORT222
PRO
DU
CTIO
N A
ND
EM
PLO
YM
ENT
TAB
LEG
ross
Dom
esti
c Pr
odu
ct (P
er C
apit
a), G
row
th a
nd
Shar
e by
Sec
tors
5B
y H
DI R
ank
GD
P Pe
r Ca
pita
PPP
(Con
stan
t 20
05
Inte
rnat
ion
al $
)a
GD
P G
row
th (A
nn
ual
%)a
GD
P by
Sec
tor
(% a
t Co
nst
ant
2005
Pri
ces)
b
Agr
icu
ltu
re, H
un
tin
g,
Fore
stry
, Fis
hin
g M
inin
g, M
anu
fact
uri
ng,
C
onst
ruct
ion
&
Uti
litie
s
Wh
oles
ale,
Ret
ail T
rade
, Re
stau
ran
ts, H
otel
s, T
ran
spor
t &
Com
mu
nic
atio
n
Oth
er
Act
ivit
ies
2011
1990
2000
2010
1990
2000
2010
1990
2000
2009
1990
2000
2009
1990
2000
2009
1990
2000
2009
EAST
ASI
A12
Japa
n26
129
2861
330
903
5.6
2.9
5.1
2.3
1.7
1.4
35.4
30.3
29.9
18.1
20.3
18.9
44.3
47.8
49.7
15K
orea
, Rep
ubl
ic o
f11
383
1873
027
027
9.2
8.5
6.2
5.9
4.0
3.3
35.7
36.7
39.2
16.6
18.7
17.4
41.5
40.5
40.1
26Si
nga
pore
2515
238
037
5196
910
.19.
114
.50.
20.
10.
034
.333
.530
.230
.429
.331
.135
.037
.138
.633
Bru
nei
Dar
uss
alam
5039
348
478
· ·1.
12.
8· ·
0.6
0.7
0.8
75.5
75.1
66.9
6.1
5.8
6.5
19.0
20.1
24.0
61M
alay
sia
6607
1020
913
186
9.0
8.9
7.2
16.6
8.8
7.9
46.1
50.2
42.9
16.6
18.6
21.6
21.3
22.6
26.8
101
Ch
ina
1101
2667
6810
3.8
8.4
10.3
29.4
15.8
10.6
35.9
45.4
48.6
16.5
16.9
15.5
21.3
22.5
25.0
103
Thai
lan
d39
3354
9776
7211
.24.
87.
815
.411
.710
.236
.741
.644
.030
.628
.926
.721
.218
.419
.111
0M
ongo
lia24
3522
0836
13-3
.21.
16.
132
.332
.024
.931
.929
.828
.722
.316
.726
.013
.521
.420
.411
2Ph
ilipp
ines
2552
2697
3560
3.0
4.4
7.6
16.7
14.8
13.6
34.6
34.6
31.3
19.3
21.3
24.3
28.8
29.1
31.4
124
Indo
nes
ia20
0826
2338
809.
04.
96.
117
.114
.112
.342
.248
.444
.119
.619
.924
.920
.517
.518
.912
8V
iet
Nam
905
1597
2875
5.1
6.8
6.8
34.3
25.0
18.2
25.2
36.2
42.5
23.7
21.3
22.7
16.9
17.7
16.3
138
Lao
Peop
le’s
Dem
ocra
tic
Repu
blic
944
1356
2298
6.7
5.8
8.4
49.7
42.3
31.5
12.4
18.9
26.4
17.9
24.8
27.2
20.6
14.2
19.1
139
Cam
bodi
a· ·
1035
1943
· ·8.
86.
751
.139
.530
.110
.921
.527
.923
.823
.421
.616
.116
.420
.014
7Ti
mor
-Les
te· ·
858
832
· ·13
.77.
426
.325
.730
.120
.518
.413
.716
.015
.014
.537
.241
.041
.714
9M
yan
mar
· ·· ·
· ·2.
813
.7· ·
60.7
54.3
46.1
10.3
13.8
17.7
32.4
33.7
33.8
2.3
2.3
2.5
K
orea
, Dem
ocra
tic
Peop
le’s
Re
publ
ic o
f· ·
· ·· ·
· ·· ·
· ·19
.322
.523
.756
.642
.242
.90.
00.
00.
024
.135
.333
.4
SOU
TH A
ND
WES
T A
SIA
88Ir
an, I
slam
ic R
epu
blic
of
6201
7503
· ·13
.75.
1· ·
10.6
9.6
8.9
42.8
41.9
44.7
14.2
16.9
19.1
33.5
32.2
27.4
97Sr
i Lan
ka19
9230
6345
556.
46.
08.
021
.315
.813
.127
.632
.832
.329
.330
.732
.721
.220
.521
.810
9M
aldi
ves
· ·34
5751
36· ·
4.8
4.8
14.3
8.4
4.9
12.3
14.5
16.8
46.7
50.1
48.5
26.7
27.0
29.8
134
Indi
a12
4417
6932
405.
54.
09.
731
.423
.015
.128
.127
.828
.717
.221
.126
.324
.028
.429
.714
1Bh
uta
n16
7927
0347
809.
17.
57.
442
.629
.019
.926
.135
.041
.011
.315
.416
.619
.820
.921
.214
5Pa
kist
an16
2018
4524
174.
54.
34.
424
.724
.920
.924
.824
.125
.130
.930
.128
.919
.720
.924
.814
6Ba
ngl
ades
h74
797
014
855.
95.
95.
827
.123
.118
.620
.124
.828
.623
.124
.026
.729
.528
.026
.215
7N
epal
709
903
1075
4.6
6.2
4.6
43.8
34.0
33.3
13.3
17.9
16.0
23.2
27.5
24.5
18.7
20.6
26.6
172
Afg
han
ista
n· ·
· ·· ·
· ·· ·
· ·37
.159
.138
.724
.724
.228
.036
.810
.819
.66.
87.
415
.8
(Con
tinu
ed)

INDICATORS 223
By
HD
I Ran
kG
DP
Per
Capi
ta P
PP (C
onst
ant
2005
In
tern
atio
nal
$)a
GD
P G
row
th (A
nn
ual
%)a
GD
P by
Sec
tor
(% a
t Co
nst
ant
2005
Pri
ces)
b
Agr
icu
ltu
re, H
un
tin
g,
Fore
stry
, Fis
hin
g M
inin
g, M
anu
fact
uri
ng,
C
onst
ruct
ion
&
Uti
litie
s
Wh
oles
ale,
Ret
ail T
rade
, Re
stau
ran
ts, H
otel
s, T
ran
spor
t &
Com
mu
nic
atio
n
Oth
er
Act
ivit
ies
2011
1990
2000
2010
1990
2000
2010
1990
2000
2009
1990
2000
2009
1990
2000
2009
1990
2000
2009
PAC
IFIC
2A
ust
ralia
2397
929
763
· ·2.
94.
0· ·
3.3
3.2
2.8
32.1
28.3
27.3
18.4
20.2
20.7
46.3
48.3
49.1
5N
ew Z
eala
nd
1890
322
491
2573
80.
02.
72.
56.
66.
25.
128
.325
.823
.518
.921
.622
.647
.946
.548
.949
Pala
u· ·
1255
412
414
· ·0.
31.
025
.93.
93.
215
.515
.320
.328
.139
.041
.030
.441
.835
.590
Ton
ga30
0038
6841
42-2
.03.
2-0
.326
.323
.021
.323
.020
.018
.815
.417
.619
.435
.639
.440
.699
Sam
oa26
2130
5939
47-4
.47.
01.
025
.518
.811
.329
.426
.927
.424
.830
.736
.121
.224
.025
.110
0Fi
ji34
3438
8640
605.
8-1
.70.
118
.715
.713
.217
.719
.217
.924
.829
.831
.038
.835
.337
.811
6M
icro
nes
ia, F
eder
ated
St
ates
of
2633
2973
2878
3.7
4.8
0.5
19.1
19.1
19.1
4.0
4.0
4.0
28.7
28.7
28.7
48.3
48.3
48.3
122
Kir
ibat
i19
4323
5522
142.
17.
21.
841
.226
.026
.610
.010
.88.
120
.621
.417
.229
.142
.048
.312
5V
anu
atu
1465
3916
4134
11.7
5.8
3.0
18.2
22.3
21.2
11.3
12.3
9.0
28.8
30.8
34.0
41.6
34.7
35.9
142
Solo
mon
Isla
nds
2340
2262
2430
· ·-1
4.3
7.0
36.3
21.1
34.5
6.5
34.2
8.0
20.1
14.9
23.2
36.8
27.4
34.3
153
Papu
a N
ew G
uin
ea16
8919
5122
17-3
.0-2
.58.
030
.335
.531
.438
.346
.241
.515
.45.
711
.615
.815
.012
.5
Mar
shal
l Isl
ands
· ·· ·
· ·7.
00.
90.
513
.910
.010
.012
.919
.219
.221
.622
.922
.851
.647
.947
.9
Nau
ru· ·
· ·· ·
· ·· ·
· ·7.
16.
06.
5-
--
36.1
31.5
30.6
50.8
42.8
52.1
Tu
valu
· ·· ·
· ·· ·
-1.0
0.2
29.9
18.3
17.5
12.1
12.9
13.5
19.5
22.4
23.5
40.8
46.7
45.5
REG
ION
East
Asi
a an
d th
e Pa
cifi
c (d
evel
opin
g)13
9427
3059
915.
57.
59.
6· ·
· ·· ·
· ·· ·
· ·· ·
· ·· ·
· ·· ·
· ·
Hig
h in
com
e: O
ECD
2487
130
440
3355
63.
14.
03.
0· ·
· ·· ·
· ·· ·
· ·· ·
· ·· ·
· ·· ·
· ·
Lati
n A
mer
ica
and
the
Car
ibbe
an
(dev
elop
ing)
6969
8126
9918
0.3
4.0
6.2
· ·· ·
· ·· ·
· ·· ·
· ·· ·
· ·· ·
· ·· ·
Mid
dle
East
an
d N
orth
Afr
ica
(dev
elop
ing)
4323
5155
· ·7.
43.
3· ·
· ·· ·
· ·· ·
· ·· ·
· ·· ·
· ·· ·
· ·· ·
Sou
th A
sia
1225
1682
2914
5.4
4.3
8.8
· ·· ·
· ·· ·
· ·· ·
· ·· ·
· ·· ·
· ·· ·
Sub-
Sah
aran
Afr
ica
(dev
elop
ing)
1617
1569
2017
1.1
3.7
4.8
· ·· ·
· ·· ·
· ·· ·
· ·· ·
· ·· ·
· ·· ·
WO
RLD
6806
7890
9889
3.0
4.3
4.2
3.9
3.6
3.7
30.9
29.4
28.4
19.0
20.7
21.4
46.3
46.4
46.4
Sour
ces:
(a)
Wor
ld B
ank
2011
; (b)
Un
ited
Nat
ion
s 20
10.
Not
es:
GD
P by
sec
tor
(% a
t co
nst
ant
2005
pri
ces)
was
cal
cula
ted
base
d on
dat
a fr
om U
nit
ed N
atio
ns
2010
. Th
e sh
are
of s
ecto
rs in
tot
al G
DP
for
a fe
w c
oun
trie
s do
es n
ot a
dd u
p to
100
per
cen
t du
e to
da
ta in
th
e da
taba
se (s
ourc
e).
Th
e sh
are
of m
inin
g, m
anu
fact
uri
ng,
con
stru
ctio
n &
uti
litie
s fo
r N
auru
was
not
cal
cula
ted
due
to n
egat
ive
valu
es.
(Con
tinu
ed)

ASIA-PACIFIC HUMAN DEVELOPMENT REPORT224
TABLELabour Force Participation and Employment Rates6
By HDI Rank Labour Participation Rate (Ages 15+) Employment to Population Ratio (Ages 15+)
% of Female % of Male % of Female % of Male
2011 1990 2000 2009 1990 2000 2009 1991 2000 2009 1991 2000 2009
EAST ASIA 12 Japan 50.1 49.2 47.9 77.4 76.3 71.8 49.5 47.0 45.7 76.1 72.5 68.015 Korea, Republic of 47.1 48.9 50.1 73.4 73.4 72.0 46.2 47.1 48.6 72.0 69.7 69.126 Singapore 50.7 52.3 53.7 79.3 78.7 75.6 50.2 49.8 50.1 78.7 74.7 71.533 Brunei Darussalam 45.1 55.2 59.7 82.5 78.8 74.8 44.1 52.4 56.8 78.6 75.4 71.561 Malaysia 43.0 44.3 44.4 80.4 80.9 79.2 41.5 42.9 42.6 78.2 78.5 76.1
101 China 73.0 70.9 67.4 85.0 83.6 79.7 70.1 69.4 65.4 80.2 80.0 76.4103 Thailand 75.1 66.1 65.5 87.0 81.3 80.7 70.9 64.6 64.8 83.8 79.3 79.7110 Mongolia 62.9 66.8 67.8 76.9 78.9 78.2 53.5 55.8 55.9 64.6 64.5 64.3112 Philippines 47.5 48.6 49.2 82.8 81.6 78.5 42.1 43.7 45.5 76.4 73.4 72.7124 Indonesia 50.3 50.6 52.0 81.4 85.2 86.0 47.6 47.3 47.6 79.1 80.2 79.5128 Viet Nam 73.7 69.5 68.0 81.8 77.3 76.0 71.7 68.0 66.2 79.6 75.5 74.4138 Lao People’s Democratic Republic 80.3 79.5 77.7 83.0 81.3 78.9 78.9 78.2 76.8 80.9 79.6 77.7139 Cambodia 78.0 75.4 73.6 84.2 84.5 85.6 76.9 73.4 71.9 83.5 82.5 83.9147 Timor-Leste 57.8 56.0 58.9 81.9 80.1 82.8 54.9 53.2 56.1 78.8 76.8 79.6149 Myanmar 70.8 67.2 63.1 89.3 87.8 85.1 67.5 64.7 61.0 85.7 84.8 82.4
Korea, Democratic People’s Republic of 55.4 53.8 55.1 80.2 77.7 77.5 53.6 51.5 52.4 76.8 73.1 72.0
SOUTH AND WEST ASIA88 Iran, Islamic Republic of 21.6 28.5 31.9 80.3 73.8 73.0 18.1 23.7 26.8 72.3 67.3 67.297 Sri Lanka 37.2 36.5 34.2 78.8 76.9 75.1 28.4 32.2 31.2 69.9 72.4 71.9
109 Maldives 29.8 37.5 57.1 74.1 71.4 77.0 23.7 30.6 45.3 69.5 67.1 72.7134 India 34.0 33.0 32.8 84.3 82.2 81.1 32.7 31.6 31.2 80.5 78.6 77.7141 Bhutan 45.1 36.9 53.4 67.1 72.0 70.6 42.5 35.9 51.7 66.1 70.3 68.6145 Pakistan 13.5 16.1 21.7 84.5 84.0 84.9 11.6 13.5 19.8 80.6 79.3 81.3146 Bangladesh 61.3 54.7 58.7 88.5 86.1 82.5 60.9 53.0 56.1 86.8 83.2 79.5157 Nepal 52.4 59.9 63.3 84.6 81.4 80.3 52.2 58.8 62.0 82.5 79.7 78.6172 Afghanistan 32.4 31.3 33.1 83.9 84.3 84.5 29.1 28.2 28.9 79.0 79.2 77.6
PACIFIC2 Australia 52.1 54.6 58.4 75.7 72.3 72.2 47.1 51.3 55.2 67.3 67.7 68.05 New Zealand 53.5 56.9 61.8 74.3 73.5 75.7 48.5 53.4 58.0 65.6 68.9 71.0
49 Palau · · · · · · · · · · · · · · · · · · · · · · · ·90 Tonga 42.4 47.2 54.6 76.1 73.5 74.7 · · · · · · · · · · · ·99 Samoa 39.8 40.8 37.9 76.4 79.3 75.4 · · · · · · · · · · · ·
100 Fiji 29.1 39.1 38.7 83.6 78.6 78.4 28.1 36.2 36.3 78.8 75.0 75.4116 Micronesia, Federated States of · · · · · · · · · · · · · · · · · · · · · · · ·122 Kiribati · · · · · · · · · · · · · · · · · · · · · · · ·125 Vanuatu 79.1 79.0 79.3 88.2 88.0 88.3 · · · · · · · · · · · ·142 Solomon Islands 23.6 24.0 24.2 46.6 48.6 50.0 22.3 22.6 22.9 44.7 46.4 48.0153 Papua New Guinea 71.4 71.3 71.6 74.1 73.7 74.2 68.6 68.8 69.3 72.1 72.0 72.5
Marshall Islands · · · · · · · · · · · · · · · · · · · · · · · · Nauru · · · · · · · · · · · · · · · · · · · · · · · · Tuvalu · · · · · · · · · · · · · · · · · · · · · · · ·
REGIONEast Asia and the Pacifi c (developing) 69.2 66.9 64.3 84.5 83.3 80.3 66.2 65.0 62.0 80.1 79.6 76.7High income: OECD 49.8 51.7 52.9 72.9 70.5 69.0 46.2 48.0 48.8 67.9 66.2 63.1Latin America and the Caribbean
(developing)40.5 46.9 51.7 82.1 80.6 79.9 37.0 41.9 46.9 76.7 74.8 74.8
Middle East and North Africa (developing) 21.9 24.6 26.1 76.8 75.2 75.1 17.6 19.5 21.6 68.7 66.3 68.4South Asia 34.9 33.9 34.7 84.6 82.7 81.6 33.5 32.3 32.9 80.9 79.0 78.2Sub-Saharan Africa (developing) 57.1 59.2 61.0 81.8 81.0 80.7 51.8 53.5 55.8 74.9 74.3 74.6
WORLD 52.3 51.7 51.7 80.7 79.1 77.7 48.8 48.5 48.4 75.6 74.3 73.0
Source: World Bank 2011.

INDICATORS 225
EDUCATION AND HEALTH
TABLESchool Enrolment and Literacy7
By HDI Rank Net Primary School Enrolment Adult Literacy Rate (Ages 15+)
% of Female % of Male % of Female % of Male
2011 2001–2009 2001–2009
EAST ASIA
12 Japan · · · · · · · ·
15 Korea, Republic of 99 100 · · · ·
26 Singapore · · · · 92 97
33 Brunei Darussalam · · · · 94 97
61 Malaysia 95 95 90 95
101 China · · · · 91 97
103 Thailand 89 90 92 96
110 Mongolia 94 96 98 97
112 Philippines 89 88 96 95
124 Indonesia 94 97 89 95
128 Viet Nam · · · · 91 95
138 Lao People’s Democratic Republic 87 91 63 82
139 Cambodia 95 96 71 85
147 Timor-Leste 85 86 43 59
149 Myanmar · · · · 90 95 Korea, Democratic People’s Republic of · · · · 100 100
SOUTH AND WEST ASIA
88 Iran, Islamic Republic of 100 99 81 89
97 Sri Lanka 94 93 89 92
109 Maldives 97 97 98 98
134 India 89 92 51 75141 Bhutan 89 87 39 65
145 Pakistan 67 72 40 69
146 Bangladesh 97 88 51 61
157 Nepal · · · · 47 72
172 Afghanistan · · · · · · · ·
PACIFIC
2 Australia 97 97 · · · ·
5 New Zealand 99 99 · · · ·49 Palau · · · · · · · ·
90 Tonga 95 97 99 9999 Samoa 98 95 99 99
100 Fiji 97 97 · · · ·116 Micronesia, Federated States of · · · · · · · ·122 Kiribati 97 97 · · · ·125 Vanuatu 97 100 80 84
142 Solomon Islands 81 83 · · · ·
153 Papua New Guinea · · · · 57 64 Marshall Islands 95 97 · · · · Nauru · · · · · · · · Tuvalu · · · · · · · ·
WORLD 87 89 · · · ·
Source: UNESCO Institute for Statistics 2011.

ASIA-PACIFIC HUMAN DEVELOPMENT REPORT226
TABLEAccess to Water and Sanitation8
By HDI Rank MDG MDG
Population Using Improved Drinking Water Sources (%)a
Population Using Improved Sanitation Facilities (%)a
2011 1990 2000 2008 1990 2000 2008
EAST ASIA
12 Japan 100 100 100 100 100 100
15 Korea, Republic of · · 93 98 100 100 100
26 Singapore 100 100 100 99 100 100
33 Brunei Darussalam · · · · · · · · · · · ·
61 Malaysia 88 97 100 84 92 96
101 China 67 80 89 41 49 55
103 Thailand 91 96 98 80 93 96
110 Mongolia 58 66 76 · · 49 50
112 Philippines 84 88 91 58 69 76
124 Indonesia 71 77 80 33 44 52
128 Viet Nam 58 79 94 35 57 75
138 Lao People’s Democratic Republic · · 48 57 · · 26 53
139 Cambodia 35 46 61 9 17 29
147 Timor-Leste · · 52 69 · · 32 50
149 Myanmar 57 66 71 · · 65 81
Korea, Democratic People’s Republic of 100 100 100 · · 59 · ·
SOUTH AND WEST ASIA
88 Iran, Islamic Republic of 91 93 · · 83 83 · ·
97 Sri Lanka 67 80 90 70 82 91
109 Maldives 90 91 91 69 81 98
134 India 72 81 88 18 25 31
141 Bhutan · · 91 92 · · 62 65
145 Pakistan 86 88 90 28 37 45
146 Bangladesh 78 79 80 34 44 53
157 Nepal 76 83 88 11 23 31
172 Afghanistan · · 21 48 · · 32 37
PACIFIC
2 Australia 100 100 100 100 100 100
5 New Zealand 100 100 100 · · · · · ·49 Palau 81 83 · · 69 80 · ·
90 Tonga · · 100 100 96 96 96
99 Samoa 91 89 · · 98 100 100
100 Fiji · · · · · · · · · · · ·
116 Micronesia, Federated States of 89 92 · · 29 26 · ·
122 Kiribati 48 62 · · 26 33 · ·
125 Vanuatu 57 72 83 · · 41 52
142 Solomon Islands · · 70 · · · · 31 · ·
153 Papua New Guinea 41 39 40 47 46 45
Marshall Islands 95 95 94 64 69 73 Nauru · · · · · · · · · · · ·
Tuvalu 90 94 97 80 83 84
WORLDb 77 · · 64 54 · · 61
Sources: (a) United Nations n.d.; (b) United Nations 2011b.

INDICATORS 227
TABLEUndernourished Population and Children, and Life Expectancy9
By HDI Rank MDG MDG
Population Undernourished
(%)a
Children under 5 Moderately or Severely
Underweight (%)a
Life Expectancy at Birth (Years)b
Female Male Both Sexes
2011 1991 2000 2007 1990–1999 2000–2009 1990 2000 2009 1990 2000 2009 1990 2000 2009
EAST ASIA
12 Japan 5 5 5 · · · · 82 85 86 76 78 80 79 81 83
15 Korea, Republic of 5 5 5 · · · · 76 80 83 68 72 77 72 76 8026 Singapore · · · · · · · · 3 77 81 84 73 76 79 75 78 8233 Brunei Darussalam 5 5 5 · · · · 76 79 77 71 75 76 73 77 7761 Malaysia 5 5 5 17 · · 73 74 76 68 69 71 71 72 73
101 China 18 10 10 15 7 69 73 76 68 70 72 68 71 74
103 Thailand 26 18 16 15 7 71 72 74 65 63 66 68 68 70110 Mongolia 28 27 27 11 5 66 67 74 59 60 65 62 64 69112 Philippines 24 18 13 28 21 68 73 73 62 66 67 65 69 70124 Indonesia 16 15 13 23 20 68 70 71 63 66 66 65 68 68128 Viet Nam 31 17 11 33 20 67 72 74 63 68 70 65 70 72
138 Lao People’s Democratic Republic
31 26 22 36 32 51 60 64 50 58 62 50 59 63
139 Cambodia 38 29 25 43 29 63 63 65 54 55 57 59 59 61147 Timor-Leste 39 28 31 · · 42 53 63 69 48 58 64 50 60 67149 Myanmar · · · · · · 25 30 61 65 67 56 59 61 58 62 64
Korea, Democratic People’s Republic
21 34 35 · · 21 70 68 72 66 64 67 68 66 70
SOUTH AND WEST ASIA
88 Iran, Islamic Republic of 5 5 5 10 · · 66 70 75 60 65 70 63 67 7397 Sri Lanka 28 20 20 · · 22 74 75 76 63 63 65 68 69 71
109 Maldives 9 8 10 39 26 55 67 76 58 67 74 57 67 75134 India 20 20 19 44 44 58 62 66 57 60 63 57 61 65141 Bhutan · · · · · · 14 12 56 62 65 53 58 62 55 60 63145 Pakistan 25 24 25 34 31 60 62 64 58 61 62 59 61 63146 Bangladesh 38 30 26 42 41 53 61 66 54 61 64 54 61 65157 Nepal 21 18 17 38 39 55 63 69 55 61 65 55 62 67172 Afghanistan · · · · · · 45 33 46 48 50 42 44 47 44 46 48
PACIFIC
2 Australia 5 5 5 · · · · 80 82 84 74 77 80 77 80 825 New Zealand 5 5 5 · · · · 78 81 83 72 76 79 75 79 81
49 Palau · · · · · · · · · · 75 74 77 64 67 68 69 70 7290 Tonga · · · · · · · · · · 73 71 70 64 68 72 68 69 7199 Samoa 9 5 5 2 · · 64 70 72 62 65 68 63 67 70
100 Fiji 8 5 5 7 · · 71 71 73 65 65 66 68 68 69116 Micronesia, Federated
States of· · · · · · · · · · 67 68 70 64 66 68 66 67 69
122 Kiribati 8 5 5 · · · · 64 68 70 62 64 65 63 66 68125 Vanuatu 10 8 5 11 12 66 70 72 64 68 69 65 69 71142 Solomon Islands 21 12 11 · · 12 69 71 72 65 67 69 67 69 71153 Papua New Guinea · · · · · · · · 18 60 63 65 57 60 62 58 61 63
Marshall Islands · · · · · · · · · · 65 60 60 59 58 58 62 59 59
Nauru · · · · · · · · · · 64 65 65 56 54 56 60 59 60 Tuvalu · · · · · · · · 2 63 63 63 61 63 64 62 63 64
WORLD · · · · · · · · · · 66 68 71 62 64 66 64 66 68
Sources: (a) United Nations n.d.; (b) WHO 2011.

ASIA-PACIFIC HUMAN DEVELOPMENT REPORT228
TABLEMaternal, Infant and Child Mortality10
By HDI Rank MDG MDG Under 5 Mortality Rate (per 1,000 Live Births)b
Maternal Mortality Ratio
(per 100,000 Live Births)a
Infant Mortality Rate (per 1,000 Live Births)b
Female Male Female Male
2011 1990 2000 2008 1990 2000 2009 1990 2000 2009 1990 2000 2009 1990 2000 2009
EAST ASIA
12 Japan 12 9 6 4 3 2 5 4 3 6 4 3 7 5 4
15 Korea, Republic of 18 19 18 8 6 4 8 6 5 8 6 5 9 7 5
26 Singapore 6 15 9 7 2 2 8 3 3 8 4 2 10 4 3
33 Brunei Darussalam 28 24 21 8 6 5 11 6 6 11 8 6 12 8 7
61 Malaysia 56 39 31 14 8 5 17 10 6 16 9 5 19 11 7
101 China 110 60 38 43 35 20 31 25 14 52 41 22 39 31 17
103 Thailand 50 63 48 22 15 10 30 19 13 27 18 12 36 22 15
110 Mongolia 130 93 65 59 40 20 86 58 29 85 53 24 117 73 33
112 Philippines 180 120 94 36 26 23 46 32 29 53 34 30 64 41 36
124 Indonesia 620 350 240 51 35 27 62 43 33 77 51 35 93 61 42
128 Viet Nam 170 91 56 40 24 20 39 23 19 53 28 23 58 31 25
138 Lao People’s Democratic Republic
1200 790 580 94 55 40 122 71 52 148 81 55 166 91 62
139 Cambodia 690 470 290 76 71 61 94 88 75 107 97 80 126 115 95
147 Timor-Leste 650 520 370 120 73 42 155 94 54 158 92 49 207 120 64
149 Myanmar 420 290 240 73 54 47 94 70 61 104 75 63 131 94 79 Korea, Democratic People’s
Republic of270 260 250 22 40 25 24 44 28 43 55 31 47 61 35
SOUTH AND WEST ASIA
88 Iran, Islamic Republic of 150 59 30 47 33 22 62 43 29 63 41 27 82 54 35
97 Sri Lanka 91 59 39 20 15 11 26 20 15 24 17 13 33 24 18
109 Maldives 510 110 37 78 42 10 83 43 12 111 51 11 114 55 14
134 India 570 390 230 85 68 51 83 67 50 126 99 70 111 87 62
141 Bhutan 940 420 200 84 62 48 99 73 57 137 98 73 158 113 84
145 Pakistan 490 340 260 96 81 67 105 89 74 130 108 87 130 108 87
146 Bangladesh 870 500 340 96 61 39 108 70 44 144 88 51 151 92 53
157 Nepal 870 550 380 99 63 39 98 63 38 140 84 48 144 86 49
172 Afghanistan 1700 1800 1400 154 136 123 179 159 144 237 210 189 262 232 208
PACIFIC
2 Australia 10 9 8 7 5 4 9 6 5 8 6 5 10 7 6
5 New Zealand 18 12 14 7 6 4 10 7 5 9 7 5 13 9 649 Palau · · · · · · 14 9 11 22 18 15 17 13 11 25 19 18
90 Tonga · · · · · · 16 16 15 23 19 18 20 19 18 24 22 2099 Samoa · · · · · · 38 10 8 42 43 33 49 18 14 51 47 36
100 Fiji 40 32 26 17 14 14 21 18 17 19 17 15 25 19 20116 Micronesia, Federated
States of· · · · · · 45 37 31 45 38 32 57 46 38 58 47 39
122 Kiribati · · · · · · 62 45 34 68 52 40 84 62 46 93 64 47125 Vanuatu · · · · · · 33 21 14 33 21 14 42 26 17 39 24 16
142 Solomon Islands 130 110 100 31 30 29 32 31 30 39 38 37 37 36 35
153 Papua New Guinea 340 290 250 65 56 51 68 59 53 87 73 65 95 80 71
Marshall Islands · · · · · · 38 31 28 40 33 30 48 38 35 49 39 36 Nauru · · · · · · 5 17 25 11 62 46 6 22 30 12 78 58 Tuvalu · · · · · · 41 32 29 43 37 29 52 43 35 54 42 35
WORLD 400 340 260 60 52 41 64 55 44 89 76 59 89 77 60
Sources: (a) United Nations n.d.; (b) WHO 2011.Note: Timor-Leste Demographic and Health Survey 2009–10 reports MMR at 557 deaths per 100,000 live births.

INDICATORS 229
ENERGY SUPPLY AND USE
TABLEEnergy Supply11
By HDI Rank Energy Produced (Mtoe)a
Net Imports(Mtoe)a
Total Primary Energy Supply
(Mtoe)a
Share of Renewables
(%)b
Fossil Fuel Energy Consumption (% of Total)c
2011 2009 2009 2009 2009 1990 2000 2009
EAST ASIA 12 Japan 93.8 384.5 472.0 3.3 84.5 80.5 81.0 15 Korea, Republic of 44.3 198.1 229.2 0.7 83.8 84.0 81.7 26 Singapore 0.0 58.9 18.5 0.1 100.0 99.9 99.8 33 Brunei Darussalam 18.9 –15.6 3.1 · · 99.9 100.0 100.0 61 Malaysia 89.7 –21.7 66.8 5.3 88.8 93.3 94.7101 China 2084.9 274.9 2257.1 11.9 75.5 79.2 87.4103 Thailand 61.7 47.4 103.3 20.5 63.8 78.8 79.4110 Mongolia 7.7 –4.2 3.2 3.2 96.9 95.2 96.4112 Philippines 23.5 16.3 38.8 43.0 43.4 53.6 57.0124 Indonesia 351.8 –153.6 202.0 34.6 54.7 62.5 65.6128 Viet Nam 76.6 –13.8 64.1 43.3 20.3 36.0 56.2138 Lao People’s Democratic Republic · · · · · · · · · · · · · ·139 Cambodia 3.7 1.6 5.2 70.8 · · 19.5 27.8147 Timor-Leste · · · · · · · · · · · · · ·149 Myanmar 22.4 –7.2 15.1 72.3 14.4 25.3 27.7 Korea, Democratic People’s Republic of 20.3 –1.0 19.3 11.0 93.1 90.5 89.0
SOUTH AND WEST ASIA 88 Iran, Islamic Republic of 349.8 –132.1 216.2 0.5 98.9 99.5 99.7 97 Sri Lanka 5.1 4.3 9.3 54.7 24.1 43.0 45.3109 Maldives · · · · · · · · 0.0 · · · ·134 India 502.5 182.0 675.8 26.1 55.4 65.0 73.0141 Bhutan · · · · · · · · 0.0 · · · ·145 Pakistan 64.9 19.8 85.5 37.4 52.6 59.0 61.8146 Bangladesh 24.8 5.0 29.6 30.2 45.5 58.7 69.8157 Nepal 8.8 1.2 10.0 88.5 5.1 12.0 11.1172 Afghanistan · · · · · · · · · · · · · ·
PACIFIC2 Australia 310.7 –173.0 131.1 5.6 93.9 94.0 94.45 New Zealand 15.2 3.5 17.4 36.1 67.0 70.1 63.7
49 Palau · · · · · · · · 0.0 · · · ·90 Tonga · · · · · · · · 0.0 · · · ·99 Samoa · · · · · · · · 0.0 · · · ·
100 Fiji · · · · · · · · 0.0 · · · ·116 Micronesia, Federated States of · · · · · · · · · · · · · ·122 Kiribati · · · · · · · · 0.0 · · · ·125 Vanuatu · · · · · · · · · · 0.0 · ·142 Solomon Islands · · · · · · · · 0.0 · · · ·153 Papua New Guinea · · · · · · · · · · · · · ·
Marshall Islands · · · · · · · · · · · · · · Nauru · · · · · · · · · · · · · · Tuvalu · · · · · · · · · · · · · ·
REGION
East Asia and the Pacifi c (developing) · · · · · · · · 71.4 75.6 84.1High income: OECD · · · · · · · · 83.8 82.4 80.5Latin America and the Caribbean (developing) · · · · · · · · 70.3 73.6 71.8Middle East and North Africa (developing) · · · · · · · · 97.4 98.0 98.3South Asia · · · · · · · · 53.5 63.0 70.7Sub-Saharan Africa (developing) · · · · · · · · 41.7 39.7 40.1
WORLD 12292.0 · · 12150.0 13.1 80.9 79.9 80.7
Sources: (a) IEA 2011b; (b) IEA 2011c; (c) World Bank 2011 (data accessed on 2 February 2012).Notes: Total Primary Energy Supply for world includes international aviation and international marine bunkers as well as electricity and heat trade. For net imports (Mtoe), negative value implies export is greater than import.

ASIA-PACIFIC HUMAN DEVELOPMENT REPORT230
TABLESources and Use of Electricity12
By HDI Rank Electricity Production Source (% of Total)a Electric Power Consumption Per Capita
(kWh/Per Capita)a
Electrifi cation Rate (%)b
Coal Oil Natural Gas
Hydro-electric
Nuclear
2011 2008 1990 2000 2008 2009
EAST ASIA
12 Japan 26.8 9.7 26.3 7.1 24.0 6486.2 7973.5 8071.0 · ·15 Korea, Republic of 43.2 3.5 18.3 0.7 34.0 2373.2 5907.0 8853.1 · ·26 Singapore 0.0 19.7 80.3 0.0 0.0 4983.3 7575.4 8184.9 100.0
33 Brunei Darussalam 0.0 1.0 99.0 0.0 0.0 4438.3 7687.2 8471.6 99.7
61 Malaysia 26.9 1.9 63.6 7.7 0.0 1171.0 2725.9 3428.0 99.4
101 China 79.1 0.7 0.9 16.9 2.0 511.1 993.2 2455.2 99.4
103 Thailand 21.4 1.1 69.4 4.8 0.0 703.2 1443.4 2051.9 99.3
110 Mongolia 96.1 3.9 0.0 0.0 0.0 1539.8 1069.9 1458.7 67.0
112 Philippines 25.9 8.0 32.2 16.2 0.0 380.8 503.7 589.3 89.7124 Indonesia 41.1 28.8 16.9 7.7 0.0 156.0 387.0 572.0 64.5
128 Viet Nam 20.8 2.1 41.5 35.6 0.0 98.1 295.0 809.5 97.6
138 Lao People’s Democratic Republic · · · · · · · · · · · · · · · · 55.0
139 Cambodia 0.0 96.5 0.0 3.1 0.0 · · 29.4 118.9 24.0147 Timor-Leste · · · · · · · · · · · · · · 123.2 22.0
149 Myanmar 0.0 3.5 35.7 60.8 0.0 46.4 78.2 102.1 13.0
Korea, Democratic People’s Republic of 36.0 3.4 0.0 60.6 0.0 1246.6 713.5 809.8 26.0
SOUTH AND WEST ASIA
88 Iran, Islamic Republic of 0.2 16.6 80.8 2.3 0.0 966.5 1552.4 2411.6 98.4
97 Sri Lanka 0.0 55.1 0.0 44.7 0.0 151.4 295.3 402.2 76.6
109 Maldives · · · · · · · · · · 95.7 333.0 812.7 · ·134 India 68.6 4.1 9.9 13.8 1.8 275.8 402.0 566.0 75.0
141 Bhutan · · · · · · · · · · 270.4 698.5 1713.8 · ·145 Pakistan 0.1 35.4 32.4 30.3 1.8 267.0 356.9 432.6 62.4
146 Bangladesh 1.8 5.0 89.0 4.2 0.0 48.8 103.0 228.7 41.0
157 Nepal 0.0 0.4 0.0 99.6 0.0 34.9 57.7 88.9 43.6
172 Afghanistan · · · · · · · · · · · · · · · · 15.5
PACIFIC
2 Australia 76.9 1.1 15.0 4.6 0.0 8527.2 10194.2 11182.1 · ·5 New Zealand 11.0 0.3 24.3 51.0 0.0 8301.0 9413.4 9492.1 · ·
49 Palau · · · · · · · · · · · · · · 6229.0 · ·90 Tonga · · · · · · · · · · · · · · 388.7 · ·99 Samoa · · · · · · · · · · · · 509.8 580.3 · ·
100 Fiji · · · · · · · · · · 580.7 714.5 920.8 · ·116 Micronesia, Federated States of · · · · · · · · · · · · 1643.3 1676.2 · ·122 Kiribati · · · · · · · · · · 110.0 170.2 220.7 · ·125 Vanuatu · · · · · · · · · · · · 223.9 241.7 · ·142 Solomon Islands · · · · · · · · · · 67.8 · · 112.5 · ·153 Papua New Guinea · · · · · · · · · · · · · · · · · ·
Marshall Islands · · · · · · · · · · · · · · 2069.4 · · Nauru · · · · · · · · · · · · · · · · · · Tuvalu · · · · · · · · · · · · 297.3 459.8 · ·
REGION
East Asia and the Pacifi c (developing) 71.6 2.0 6.7 16.4 1.7 461.2 875.4 1964.1 · ·
High income: OECD 37.3 2.8 20.9 12.1 22.0 7593.1 9092.7 9569.6 · ·Latin America and the Caribbean (developing) 4.5 13.5 20.7 55.3 2.4 1167.2 1561.9 1894.3 · ·Middle East and North Africa (developing) 2.1 29.4 62.5 4.4 0.0 732.1 1053.4 1514.4 · ·South Asia 58.3 7.5 14.6 15.4 1.7 247.1 360.4 507.7 · ·Sub-Saharan Africa (developing) 58.0 3.8 4.4 17.2 3.1 512.5 495.3 536.3 · ·
WORLD 40.8 5.1 21.3 15.8 13.5 2118.7 2388.5 2876.1 80.5
Sources: (a) World Bank 2011; (b) IEA 2011d.

INDICATORS 231
TABLENumber of Vehicles, Cars and Carrier Departures13
By HDI Rank Motor Vehicles (per 1,000 People)
Passenger Cars (per 1,000 People)
Air Transport, Registered Carrier Departures Worldwide
2011 2007–2008 2007–2008 1990 2000 2009
EAST ASIA
12 Japan 593 319 476000 645087 641913
15 Korea, Republic of 346 257 120100 226910 256160
26 Singapore 150 114 30500 71042 83772
33 Brunei Darussalam 696 649 4400 12739 12274
61 Malaysia 334 298 130500 169263 182002
101 China 37 27 196000 572921 2140124
103 Thailand · · · · 69500 101591 123541
110 Mongolia 72 48 · · 6200 4783
112 Philippines 33 11 70100 44547 87028
124 Indonesia 77 43 205400 159027 330112
128 Viet Nam 13 13 1800 28999 83720
138 Lao People’s Democratic Republic 21 2 3400 6411 9793
139 Cambodia · · · · · · · · 3304
147 Timor-Leste · · · · · · · · · ·
149 Myanmar 7 5 13800 10329 28499
Korea, Democratic People’s Republic of · · · · 5800 1332 1865
SOUTH AND WEST ASIA
88 Iran, Islamic Republic of 128 113 39900 82610 133932
97 Sri Lanka 61 19 7900 5206 16632
109 Maldives 23 11 800 5970 4971
134 India · · · · 125800 198426 601977
141 Bhutan 47 38 600 1138 2706
145 Pakistan 11 9 66100 63956 50939
146 Bangladesh 2 1 13000 6313 16399
157 Nepal 5 3 25800 12130 6804
172 Afghanistan 27 19 5300 3409 · ·
PACIFIC
2 Australia 687 551 255900 382514 403256
5 New Zealand 733 616 128300 240046 217178
49 Palau · · · · · · · · · ·
90 Tonga · · · · 4300 3814 · ·
99 Samoa · · · · · · 10877 12492
100 Fiji 175 115 23500 57776 45595
116 Micronesia, Federated States of 36 16 · · · · · ·
122 Kiribati 144 99 2900 · · · ·
125 Vanuatu · · · · 300 1402 1667
142 Solomon Islands · · · · 11100 11481 13529
153 Papua New Guinea 9 6 62400 27512 21450
Marshall Islands · · · · 3300 2324 3480
Nauru · · · · · · · · · ·
Tuvalu · · · · · · · · · ·
REGION
East Asia and the Pacifi c (developing) 47 33 804100 1215806 3092984
High income: OECD 638 441 11441500 16882523 18048287
Latin America and the Caribbean (developing) 169 · · 1190800 1781473 1793698
Middle East and North Africa (developing) 88 67 223400 296322 419054
South Asia · · · · 245300 296548 700428
Sub-Saharan Africa (developing) 34 25 316700 354035 373213
WORLD · · · · 14583900 22008658 26378711
Source: World Bank 2011.

ASIA-PACIFIC HUMAN DEVELOPMENT REPORT232
GREENHOUSE GAS EMISSIONS
TABLEAmount and Share of Major Greenhouse Gases14
By HDI Rank Total GHG Emissions (MtCO2e)
GHG Emissions Per Capita(Tonnes CO2e)
Share of GHG Emissions (%)
CO2 Methane Nitrous Oxide
PFC, HFC, SF6
2011 1990 2000 2005 1990 2000 2005 2005
EAST ASIA12 Japan 1218.4 1358.5 1387.4 9.9 10.7 10.9 93.2 1.5 2.6 2.715 Korea, Republic of 314.0 538.4 609.4 7.3 11.5 12.7 87.8 5.5 2.8 3.926 Singapore 70.6 108.6 136.8 23.2 27.0 32.1 96.2 1.2 0.7 1.933 Brunei Darussalam 8.9 11.2 12.5 34.5 33.5 33.8 44.0 46.4 10.4 · ·61 Malaysia 242.3 324.0 381.1 13.4 13.9 14.9 83.0 12.1 4.9 · ·
101 China 3822.5 4785.3 7216.2 3.4 3.8 5.5 77.2 11.8 9.5 1.4103 Thailand 193.0 294.7 366.5 3.4 4.7 5.6 67.8 25.0 6.6 0.6110 Mongolia 28.2 28.1 30.3 12.7 11.8 11.9 32.0 24.8 43.2 0.0112 Philippines 162.1 200.7 211.4 2.6 2.6 2.5 72.3 19.5 7.2 0.9124 Indonesia 1792.8 1960.1 2045.6 10.1 9.5 9.3 88.9 8.9 2.1 0.1128 Viet Nam 79.2 127.6 179.8 1.2 1.6 2.2 54.7 38.2 7.0 0.1138 Lao People’s Democratic Republic 10.4 16.1 17.4 2.5 3.0 3.0 8.0 73.6 18.4 0.0139 Cambodia 98.0 102.5 106.8 10.1 8.0 7.7 82.2 12.6 5.1 0.0147 Timor-Leste · · · · · · · · · · · · · · · · · · · ·149 Myanmar 222.7 252.5 265.2 5.5 5.4 5.5 64.9 28.2 6.8 0.0
Korea, Democratic People’s Republic of 166.4 112.6 118.4 8.3 4.9 5.0 65.1 28.5 5.9 0.5
SOUTH AND WEST ASIA88 Iran, Islamic Republic of 248.6 427.9 563.6 4.6 6.7 8.2 78.8 17.0 4.0 0.197 Sri Lanka 18.4 23.3 27.5 1.1 1.2 1.4 56.4 37.1 6.5 · ·
109 Maldives 0.2 0.5 0.7 0.8 2.0 2.5 100.0 0.0 0.0 · ·134 India 1111.9 1607.6 1869.5 1.3 1.6 1.7 66.2 29.3 3.8 0.7141 Bhutan 1.2 1.7 1.8 2.2 3.0 2.8 33.3 55.6 16.7 · ·145 Pakistan 145.6 208.0 242.7 1.3 1.5 1.6 53.4 40.3 6.1 0.3146 Bangladesh 90.4 122.0 143.2 0.8 0.9 0.9 27.9 37.4 34.6 0.1157 Nepal 30.7 37.6 40.6 1.6 1.5 1.5 8.4 63.1 28.6 0.0172 Afghanistan 12.8 12.7 14.0 0.7 0.5 0.5 5.0 76.4 19.3 · ·
PACIFIC2 Australia 409.8 513.4 568.5 24.0 26.8 27.9 70.6 22.7 5.6 1.15 New Zealand 61.1 74.6 82.5 17.7 19.3 20.0 49.0 33.1 17.0 1.1
49 Palau · · 0.1 0.2 · · 6.3 9.9 100.0 0.0 0.0 0.090 Tonga 0.2 0.2 0.3 1.6 2.0 2.5 66.7 33.3 0.0 · ·99 Samoa 0.3 0.3 0.3 1.7 1.6 1.8 66.7 33.3 0.0 0.0
100 Fiji 1.8 1.9 2.7 2.5 2.4 3.3 59.3 25.9 14.8 · ·116 Micronesia, Federated States of · · · · · · · · · · · · · · · · · · · ·122 Kiribati 0.0 0.0 0.0 0.5 0.6 0.5 0.0 0.0 0.0 0.0125 Vanuatu 0.4 0.5 0.5 2.5 2.5 2.1 20.0 60.0 20.0 0.0142 Solomon Islands 5.9 4.0 4.2 18.7 9.6 8.9 4.8 33.3 61.9 0.0153 Papua New Guinea 51.0 51.3 52.6 12.3 9.5 8.6 92.4 3.0 4.8 0.0
Marshall Islands · · · · · · · · · · · · · · · · · · · · Nauru 0.1 0.1 0.1 · · 11.7 11.2 100.0 0.0 0.0 0.0 Tuvalu · · · · · · · · · · · · · · · · · · · ·
REGIONEast Asia and the Pacifi c (developing) 6877.2 8262.5 10999.5 4.3 4.6 5.8 78.3 13.0 7.7 1.0High income: OECD 13926.0 15224.3 15667.9 15.3 15.7 15.6 83.8 8.0 6.1 2.1Latin America and the Caribbean (developing) 4600.5 5251.5 5483.4 10.6 10.2 10.0 71.7 18.0 9.9 0.4Middle East and North Africa (developing) 776.1 1105.0 1363.3 3.4 4.0 4.5 77.1 16.9 5.7 0.3South Asia 1579.8 2207.8 2539.1 1.4 1.6 1.7 62.2 30.7 6.6 0.5Sub-Saharan Africa (developing) 2035.8 2230.3 2399.6 4.0 3.4 3.2 49.8 30.1 19.8 0.3
WORLD 36669.4 39177.8 44126.7 6.9 6.4 6.8 76.8 14.5 7.4 1.2
Source: WRI 2011.Note: Methane, Nitrous Oxide, PFC, HFC and SF6 do not include land use change.

INDICATORS 233
TAB
LEIn
ten
sity
of
Ener
gy U
se a
nd
CO2 E
mis
sion
s15 By
HD
I Ran
kEn
ergy
Use
(k
g of
Oil
Equi
vale
nt)
per $
1,00
0 G
DP
(Con
stan
t 20
05 P
PP)a
CO2 E
mis
sion
sRa
nk
by C
O2
Emis
sion
s
kg p
er 2
005
PPP$
of
GD
Pa
Ave
rage
A
nn
ual
C
han
ge (%
)
Ton
nes
Pe
r C
apit
aa
Ave
rage
A
nn
ual
C
han
ge (%
)
Ton
nes
per
te
rajo
ule
of T
PESb
Ave
rage
A
nn
ual
C
han
ge (%
)
kg p
er 2
005
PPP$
of
GD
P
Ton
nes
Pe
r C
apit
a
Ton
nes
per
te
rajo
ule
of
TPES
2011
1990
2000
2008
1990
2000
2007
1990
–20
0020
00–
2007
1990
2000
2007
1990
–20
0020
00–
2007
1990
2000
2009
1990
–20
0020
00–
2009
2007
2007
2009
EAST
ASI
A
12Ja
pan
136.
114
3.0
124.
00.
360.
340.
31–0
.5–1
.39.
339.
699.
810.
40.
257
.954
.555
.3–0
.60.
214
3213
15K
orea
, Rep
ubl
ic o
f19
0.8
210.
918
3.0
0.49
0.50
0.41
0.1
–2.7
5.63
9.40
10.3
85.
21.
458
.855
.653
.7–0
.6–0
.415
3312
26Si
nga
pore
160.
512
1.9
79.7
0.66
0.35
0.24
–6.0
–5.6
15.3
912
.99
11.8
0–1
.7–1
.460
.049
.958
.0–1
.81.
710
3515
33Br
un
ei D
aru
ssal
am13
8.7
154.
820
1.5
0.50
0.41
0.41
–2.0
0.1
25.4
519
.94
20.1
3–2
.40.
145
.645
.362
.1–0
.13.
615
3718
61M
alay
sia
182.
819
7.8
204.
60.
470.
530.
571.
21.
13.
115.
407.
185.
74.
253
.156
.158
.70.
60.
521
3016
101
Ch
ina
690.
732
4.8
279.
71.
971.
010.
95–6
.5–0
.92.
172.
694.
962.
29.
161
.266
.372
.30.
81.
025
2820
103
Thai
lan
d18
7.2
208.
121
2.8
0.43
0.58
0.56
3.1
–0.4
1.68
3.19
4.09
6.6
3.6
45.6
53.4
52.7
1.6
–0.1
2027
1111
0M
ongo
lia63
9.9
443.
933
1.8
1.88
1.41
1.21
–2.8
–2.1
4.58
3.11
4.03
–3.8
3.8
88.5
89.0
88.4
0.1
–0.1
2626
2211
2Ph
ilipp
ines
174.
919
6.4
134.
60.
280.
380.
242.
9–6
.20.
721.
020.
803.
5–3
.431
.540
.143
.42.
40.
910
149
124
Indo
nes
ia28
0.7
277.
723
6.9
0.40
0.46
0.50
1.3
1.2
0.81
1.21
1.71
4.1
5.1
33.5
40.5
44.5
1.9
1.1
1720
1012
8V
iet
Nam
407.
229
8.9
267.
40.
360.
430.
531.
93.
00.
320.
691.
327.
89.
716
.928
.542
.55.
44.
519
187
138
Lao
Peop
le’s
Dem
ocra
tic
Repu
blic
· ·· ·
· ·0.
060.
150.
139.
5–1
.20.
060.
200.
2613
.53.
8· ·
· ·· ·
· ·· ·
34
· ·
139
Cam
bodi
a· ·
308.
619
9.0
· ·0.
170.
18· ·
0.5
0.05
0.18
0.32
14.4
8.7
· ·14
.519
.6· ·
3.4
67
314
7Ti
mor
-Les
te· ·
· ·· ·
· ·· ·
0.25
· ·· ·
· ·· ·
0.17
· ·· ·
· ·· ·
· ·· ·
· ·11
3· ·
149
Mya
nm
ar· ·
· ·· ·
· ·· ·
· ·· ·
· ·0.
110.
200.
286.
15.
28.
915
.516
.15.
70.
4 · ·
52
K
orea
, Dem
ocra
tic
Peop
le’s
Re
publ
ic o
f· ·
· ·· ·
· ·· ·
· ·· ·
· ·12
.14
3.36
2.94
–12.
1–1
.982
.083
.182
.10.
1–0
.1· ·
2421
SOU
TH A
ND
WES
T A
SIA
88Ir
an, I
slam
ic R
epu
blic
of
200.
824
2.7
268.
80.
670.
690.
670.
4–0
.44.
145.
196.
942.
34.
263
.258
.559
.0–0
.80.
123
2917
97Sr
i Lan
ka15
9.8
145.
010
5.2
0.11
0.18
0.15
4.9
–2.0
0.22
0.54
0.61
9.6
1.6
16.2
30.5
32.6
6.5
0.7
413
410
9M
aldi
ves
· ·· ·
· ·· ·
0.53
0.60
· ·1.
90.
701.
822.
9610
.07.
2· ·
· ·· ·
· ·· ·
2225
· ·13
4In
dia
301.
825
5.6
195.
90.
650.
660.
530.
1–3
.00.
811.
171.
433.
73.
043
.950
.856
.01.
51.
119
1914
141
Bhu
tan
59.7
· ·· ·
0.14
0.26
0.20
6.6
–3.6
0.23
0.70
0.84
11.8
2.7
· ·· ·
· ·· ·
· ·8
15· ·
145
Paki
stan
237.
123
8.8
213.
60.
380.
400.
410.
50.
40.
610.
740.
951.
93.
732
.736
.638
.21.
10.
515
175
146
Ban
glad
esh
161.
914
8.0
141.
60.
200.
220.
241.
20.
90.
150.
210.
303.
85.
125
.432
.540
.92.
52.
610
66
157
Nep
al42
7.8
368.
133
2.0
0.05
0.15
0.12
12.1
–2.5
0.03
0.13
0.12
14.8
–1.3
3.6
9.0
8.2
9.6
–1.0
22
117
2A
fgh
anis
tan
· ·· ·
· ·· ·
· ·0.
03· ·
· ·0.
140.
030.
02–1
4.3
–4.0
· ·· ·
· ·· ·
· ·1
1· ·
(Con
tinu
ed)

ASIA-PACIFIC HUMAN DEVELOPMENT REPORT234
By
HD
I Ran
kEn
ergy
Use
(k
g of
Oil
Equi
vale
nt)
per $
1,00
0 G
DP
(Con
stan
t 20
05 P
PP)a
CO2 E
mis
sion
sRa
nk
by C
O2
Emis
sion
s
kg p
er 2
005
PPP$
of
GD
Pa
Ave
rage
A
nn
ual
C
han
ge (%
)
Ton
nes
Pe
r C
apit
aa
Ave
rage
A
nn
ual
C
han
ge (%
)
Ton
nes
per
te
rajo
ule
of T
PESb
Ave
rage
A
nn
ual
C
han
ge (%
)
kg p
er 2
005
PPP$
of
GD
P
Ton
nes
Pe
r C
apit
a
Ton
nes
per
te
rajo
ule
of
TPES
2011
1990
2000
2008
1990
2000
2007
1990
–20
0020
00–
2007
1990
2000
2007
1990
–20
0020
00–
2007
1990
2000
2009
1990
–20
0020
00–
2009
2007
2007
2009
PAC
IFIC
2A
ust
ralia
210.
718
9.6
175.
90.
720.
580.
52–2
.1–1
.417
.16
17.1
717
.74
0.0
0.5
72.0
74.9
72.0
0.4
–0.4
1836
195
New
Zea
lan
d19
4.8
192.
315
5.6
0.37
0.38
0.30
0.3
–3.3
6.93
8.47
7.72
2.0
–1.3
43.4
43.4
43.0
0.0
–0.1
1331
849
Pala
u· ·
· ·· ·
· ·0.
490.
79· ·
7.1
· ·6.
1210
.56
· ·8.
1· ·
· ·· ·
· ·· ·
2434
· ·90
Ton
ga88
.8· ·
· ·0.
270.
320.
421.
74.
20.
811.
231.
724.
34.
9· ·
· ·· ·
· ·· ·
1621
· ·99
Sam
oa10
2.3
· ·· ·
0.29
0.26
0.22
–1.3
–2.0
0.77
0.79
0.89
0.2
1.7
· ·· ·
· ·· ·
· ·9
16· ·
100
Fiji
114.
3· ·
· ·0.
330.
270.
41–1
.85.
81.
121.
061.
75–0
.67.
4· ·
· ·· ·
· ·· ·
1522
· ·11
6M
icro
nes
ia, F
eder
ated
St
ates
of
· ·· ·
· ·· ·
0.17
0.19
· ·1.
5· ·
0.51
0.57
· ·1.
4· ·
· ·· ·
· ·· ·
712
· ·
122
Kir
ibat
i50
.9· ·
· ·0.
160.
170.
150.
6–1
.50.
310.
390.
352.
5–1
.7· ·
· ·· ·
· ·· ·
48
· ·12
5V
anu
atu
108.
5· ·
· ·0.
320.
110.
12–1
0.1
0.8
0.47
0.44
0.46
–0.9
0.8
· ·· ·
· ·· ·
· ·2
10· ·
142
Solo
mon
Isla
nds
73.6
· ·· ·
0.22
0.18
0.17
–2.2
–0.5
0.52
0.40
0.40
–2.5
–0.2
· ·· ·
· ·· ·
· ·5
9· ·
153
Papu
a N
ew G
uin
ea· ·
· ·· ·
0.30
0.26
0.27
–1.7
0.7
0.51
0.50
0.53
–0.3
0.7
· ·· ·
· ·· ·
· ·12
11· ·
M
arsh
all I
slan
ds· ·
· ·· ·
· ·· ·
· ·· ·
· ·1.
011.
481.
883.
93.
6· ·
· ·· ·
· ·· ·
· ·23
· ·
Nau
ru· ·
· ·· ·
· ·· ·
· ·· ·
· ·· ·
· ·· ·
· ·· ·
· ·· ·
· ·· ·
· ·· ·
· ·· ·
Tu
valu
· ·· ·
· ·· ·
· ·· ·
· ·· ·
· ·· ·
· ·· ·
· ·· ·
· ·· ·
· ·· ·
· ·· ·
· ·
REG
ION
East
Asi
a an
d th
e Pa
cifi
c (d
evel
opin
g)49
5.9
298.
726
5.0
1.38
0.85
0.84
–4.7
–0.3
1.93
2.33
4.01
1.9
8.1
· ·· ·
· ·· ·
· ·· ·
· ·· ·
Hig
h in
com
e: O
ECD
190.
617
0.1
148.
40.
480.
410.
36–1
.6–1
.912
.00
12.5
112
.30
0.4
–0.2
· ·· ·
· ·· ·
· ·· ·
· ·· ·
Lati
n A
mer
ica
and
the
Car
ibbe
an
(dev
elop
ing)
145.
213
8.6
130.
50.
330.
310.
29–0
.7–1
.02.
332.
532.
730.
81.
1· ·
· ·· ·
· ·· ·
· ·· ·
· ·
Mid
dle
East
an
d N
orth
Afr
ica
(dev
elop
ing)
176.
919
9.2
210.
40.
590.
620.
600.
4–0
.42.
573.
193.
742.
22.
3· ·
· ·· ·
· ·· ·
· ·· ·
· ·
Sou
th A
sia
282.
724
6.0
194.
00.
570.
580.
490.
3–2
.50.
700.
981.
213.
53.
0· ·
· ·· ·
· ·· ·
· ·· ·
· ·Su
b-Sa
har
an A
fric
a (d
evel
opin
g)35
7.6
368.
730
7.5
0.56
0.53
0.45
–0.6
–2.3
0.91
0.83
0.86
–0.9
0.4
· ·· ·
· ·· ·
· ·· ·
· ·· ·
WO
RLD
23
7.2
202.
418
3.2
0.63
0.51
0.49
–2.0
–0.8
4.27
4.06
4.64
–0.5
1.9
57.0
55.9
57.0
–0.2
0.2
· ·· ·
· ·
Sour
ces:
(a)
Wor
ld B
ank
2011
; (b)
IEA
201
1a.
Not
e: T
he
ran
kin
g of
cou
ntr
ies
wit
h t
he
low
est
leve
l of C
O2
em
issi
ons
is 1
, as
a lo
wer
ran
k im
plie
s lo
wer
em
issi
ons,
an
d a
hig
her
ran
k re
fers
to
hig
her
em
issi
ons.
(Con
tinu
ed)

INDICATORS 235
HUMAN VULNERABILITY TO NATURAL DISASTERS
TABLEExisting Stock of Natural Resources16
By HDI Rank Forest Area (% of Total Land
Area)a
Marine Protected Area (% of
Territorial Waters)a
Ecological Footprint of
Consumptionb
Carbon Foot-printb
Total Bio-
capacityb
Arable Landa
% of Land Area Hectares per Person
2011 1990 2000 2010 1990 2000 2009 2007 1990 2000 2008 1990 2000 2008
EAST ASIA
12 Japan 68.4 68.2 68.5 2.0 5.0 5.6 4.7 3.1 0.6 13.1 12.3 11.8 0.04 0.04 0.03
15 Korea, Republic of 64.5 63.7 64.2 5.0 5.1 5.3 4.9 3.2 0.3 19.8 17.4 16.0 0.05 0.04 0.03
26 Singapore 3.0 3.0 2.9 0.0 1.6 1.6 5.3 3.7 0.0 1.5 1.5 0.7 0.00 0.00 0.00
33 Brunei Darussalam 78.4 75.3 72.1 0.1 0.1 0.1 · · · · · · 0.4 0.4 0.6 0.01 0.01 0.01
61 Malaysia 68.1 65.7 62.3 1.1 1.6 1.6 4.9 3.1 2.6 5.2 5.5 5.5 0.09 0.08 0.07
101 China 16.8 19.0 22.2 0.4 1.2 1.4 2.2 1.2 1.0 13.3 13.0 11.6 0.11 0.10 0.08
103 Thailand 38.3 37.2 37.1 4.0 4.3 4.3 2.4 0.9 1.2 34.2 30.6 29.8 0.31 0.25 0.22
110 Mongolia 8.1 7.5 7.0 0.0 0.0 0.0 5.5 1.2 15.1 0.9 0.8 0.5 0.62 0.49 0.32
112 Philippines 22.0 23.9 25.7 0.2 1.5 1.5 1.3 0.3 0.6 18.4 16.9 17.8 0.09 0.07 0.06
124 Indonesia 65.4 54.9 52.1 0.5 1.0 1.9 1.2 0.3 1.4 11.2 11.3 12.1 0.11 0.10 0.09
128 Viet Nam 28.8 37.7 44.5 0.3 0.5 2.1 1.4 0.4 0.9 16.4 19.9 20.3 0.08 0.08 0.07
138 Lao People’s Democratic Republic 75.0 71.6 68.2 · · · · · · 1.3 0.1 1.6 3.5 3.8 5.4 0.19 0.16 0.21
139 Cambodia 73.3 65.4 57.2 0.0 0.9 0.9 1.0 0.1 0.9 20.9 21.0 22.1 0.39 0.30 0.28
147 Timor-Leste 65.0 57.4 49.9 0.0 1.1 6.7 0.4 0.1 1.2 7.4 8.1 10.8 0.15 0.14 0.15
149 Myanmar 60.0 53.4 48.6 0.3 0.3 0.3 1.8 0.1 2.0 14.6 15.2 16.2 0.24 0.22 0.22
Korea, Democratic People’s Republic of 68.1 57.6 47.1 0.1 0.1 0.1 1.3 0.7 0.6 19.0 21.6 22.4 0.11 0.11 0.11
SOUTH AND WEST ASIA
88 Iran, Islamic Republic of 6.8 6.8 6.8 1.3 1.3 1.9 2.7 1.7 0.8 9.3 9.2 10.5 0.28 0.23 0.24
97 Sri Lanka 37.5 33.2 29.7 0.1 1.1 1.1 1.2 0.3 0.4 14.4 14.6 19.9 0.05 0.05 0.06
109 Maldives 3.3 3.3 3.3 · · · · · · · · · · · · 13.3 13.3 13.3 0.02 0.01 0.01
134 India 21.5 22.0 23.0 1.5 1.7 1.7 0.9 0.3 0.5 54.8 54.7 53.2 0.19 0.16 0.14
141 Bhutan 64.6 78.4 84.6 · · · · · · · · · · · · 2.8 3.2 3.3 0.23 0.23 0.18
145 Pakistan 3.3 2.7 2.2 1.8 1.8 1.8 0.8 0.3 0.4 26.6 27.6 26.4 0.18 0.15 0.12
146 Bangladesh 11.5 11.3 11.1 0.4 0.5 0.8 0.6 0.1 0.4 70.0 61.9 60.7 0.09 0.06 0.05
157 Nepal 33.7 27.2 25.4 · · · · · · 3.6 2.9 0.5 16.0 16.4 16.4 0.12 0.10 0.08
172 Afghanistan 2.1 2.1 2.1 · · · · · · 0.6 0.0 0.5 12.1 11.8 11.9 0.42 0.30 0.24
PACIFIC
2 Australia 20.1 20.2 19.4 10.9 12.6 28.3 6.8 3.1 14.7 6.2 6.2 5.7 2.81 2.47 2.05
5 New Zealand 29.3 31.4 31.4 0.4 0.4 7.1 4.9 2.3 10.8 10.0 5.7 1.7 0.77 0.39 0.11
49 Palau 82.6 87.0 87.0 0.5 2.1 5.3 · · · · · · · · 2.2 2.2 · · 0.05 0.05
90 Tonga 12.5 12.5 12.5 0.0 2.5 2.5 · · · · · · 22.2 20.8 20.8 0.17 0.15 0.15
99 Samoa 45.9 60.4 60.4 0.5 0.5 0.5 · · · · · · 10.6 8.8 8.8 0.19 0.14 0.14
100 Fiji 52.2 53.6 55.5 0.1 0.1 0.1 · · · · · · 8.8 9.3 9.3 0.22 0.21 0.20
116 Micronesia, Federated States of 91.4 91.4 91.4 0.0 0.1 0.1 · · · · · · · · 3.6 3.6 · · 0.02 0.02
122 Kiribati 14.8 14.8 14.8 0.3 0.8 20.2 · · · · · · 2.5 2.5 2.5 0.03 0.02 0.02
125 Vanuatu 36.1 36.1 36.1 0.0 0.0 0.1 · · · · · · 1.6 1.6 1.6 0.14 0.11 0.09
142 Solomon Islands 83.0 81.0 79.1 0.0 0.1 0.1 · · · · · · 0.4 0.5 0.6 0.04 0.03 0.03
153 Papua New Guinea 69.6 66.5 63.4 0.3 0.3 0.3 2.1 0.6 3.8 0.4 0.5 0.6 0.05 0.04 0.04
Marshall Islands 72.2 72.2 72.2 0.0 0.6 0.6 · · · · · · 0.0 5.6 11.1 · · 0.02 0.04
Nauru · · · · · · · · · · · · · · · · · · · · · · · · · · · · · ·
Tuvalu 33.3 33.3 33.3 0.0 0.2 0.2 · · · · · · · · · · · · · · · · · ·
REGION
East Asia and the Pacifi c (developing) 29.0 28.5 29.6 0.5 1.2 1.5 · · · · · · 12.1 11.9 11.3 0.12 0.10 0.09
High income: OECD 30.5 30.9 31.0 9.1 11.5 15.8 · · · · · · 12.6 12.2 11.7 0.43 0.39 0.35
Latin America and the Caribbean (developing) 51.6 49.2 47.0 6.7 11.4 13.1 · · · · · · 6.6 7.1 7.4 0.30 0.28 0.26
Middle East and North Africa (developing) 2.4 2.4 2.4 0.9 1.4 2.0 · · · · · · 5.9 5.8 6.0 0.22 0.18 0.16
South Asia 16.6 16.6 17.1 1.5 1.7 1.7 · · · · · · 42.6 42.6 41.5 0.18 0.15 0.13
Sub-Saharan Africa (developing) 31.3 29.5 28.0 3.2 4.2 4.7 · · · · · · 6.5 7.3 8.5 0.28 0.26 0.24
WORLD 32.1 31.4 31.1 4.8 7.5 9.2 2.7 1.4 1.8 10.9 10.7 10.7 0.22 0.23 0.21
Sources: (a) World Bank 2011; (b) Global Footprint Network 2010.

ASIA-PACIFIC HUMAN DEVELOPMENT REPORT236
TAB
LEIm
pact
of
Nat
ura
l Dis
aste
rs17 By
HD
I Ran
kN
umbe
r of N
atur
al D
isas
ters
Tota
l Num
ber o
f Dea
ths
from
N
atur
al D
isas
ters
Tota
l Num
ber o
f Peo
ple
Aff
ecte
d by
Nat
ural
Dis
aste
rsEs
tim
ated
Dam
age
Cost
s (U
S$ T
hous
ands
)
2011
1980
–19
8919
90–
1999
2000
–20
0920
10–
2011
1980
–19
8919
90–
1999
2000
–20
0920
10–
2011
1980
–198
919
90–1
999
2000
–200
920
10–2
011
1980
–198
919
90–1
999
2000
–200
920
10–2
011
EAST
ASI
A
12Ja
pan
4247
666
1487
6161
800
2051
660
2532
1104
439
1639
608
4209
5130
0250
012
7930
300
7764
8000
2100
0000
015
Kore
a, R
epu
blic
of
1523
323
1452
1159
629
2568
6393
4447
5456
0884
4150
011
2462
031
2850
810
6163
950
26Si
nga
pore
· ·1
2· ·
01
35· ·
011
2227
· ·0
00
· ·33
Bru
nei
Dar
uss
alam
· ·1
· ·· ·
· ·0
· ·· ·
· ·0
· ·· ·
· ·20
00· ·
· ·61
Mal
aysi
a4
2034
151
921
267
010
2576
7549
546
1273
011
500
3550
0015
0100
00
101
Ch
ina
110
180
286
4020
928
2884
298
663
5388
2359
9514
212
5194
5126
1182
1023
4625
0979
736
1338
8255
1229
4181
918
5348
692
2928
3990
103
Thai
lan
d11
3754
713
8586
494
9028
538
0843
122
0553
0228
2237
8016
6541
5111
0964
628
1148
821
0161
333
2000
110
Mon
golia
28
13· ·
012
814
0· ·
010
5169
3153
923
· ·0
1832
800
1423
64· ·
112
Phili
ppin
es87
116
145
3684
5214
381
9418
1514
2605
1278
3824
6399
4787
3355
1259
4376
1640
830
3256
608
2208
031
8000
7612
4In
don
esia
7880
152
1836
2876
0217
9933
1304
2599
827
7096
757
1173
6048
2391
5943
2888
1059
5552
1257
3237
7800
012
8V
iet N
am22
4882
1141
2482
5735
3331
733
8789
7017
2654
2220
9139
2925
7823
221
000
2629
345
5055
205
7487
0013
8La
o Pe
ople
’s D
emoc
rati
c Re
publ
ic6
159
177
773
9514
7340
0028
6910
613
9576
237
000
032
8779
1010
000
139
Cam
bodi
a1
1316
20
1296
663
215
082
8594
983
9369
413
5000
00
2520
1021
4100
1650
0014
7Ti
mor
-Les
te· ·
· ·8
· ·· ·
· ·27
· ·· ·
· ·13
571
· ·· ·
· ·0
· ·14
9M
yan
mar
38
144
2918
613
8880
225
8538
864
9094
2752
587
2913
260
1449
5545
0068
862
300
Ko
rea,
Dem
ocra
tic
Peop
le’s
Rep
ubl
ic o
f2
913
531
528
212
8254
2007
195
5400
723
6360
211
8200
017
3120
1063
2990
00
SOU
TH A
ND
WES
T A
SIA
88Ir
an, I
slam
ic R
epu
blic
of
3255
546
5122
4422
528
640
1113
6301
238
9403
7639
3559
8447
8527
5300
017
4658
3044
5586
60
97Sr
i Lan
ka17
1924
453
620
736
212
8475
5448
533
3349
763
3049
322
9219
338
934
2838
8013
5155
010
5000
109
Mal
dive
s1
12
10
010
24
300
2384
928
863
1289
6000
3000
047
0100
013
4In
dia
113
116
186
2232
268
4988
959
462
1642
5931
1546
131
5093
784
6086
1092
455
5541
859
1716
318
4073
8223
7392
8521
4900
014
1Bh
uta
n1
44
141
3922
31
247
6609
410
1220
016
035
000
014
5Pa
kist
an20
4468
910
7466
5477
282
2594
1321
453
2111
6559
1971
9975
2616
8496
5000
1361
166
7783
648
9580
000
146
Ban
glad
esh
5491
848
3219
514
9960
9576
101
1663
7072
083
7217
5472
5004
0025
0271
934
1070
077
7780
058
8400
00
157
Nep
al22
2727
625
6756
6626
6532
046
6670
896
8121
3019
226
2259
710
4610
023
6400
6872
90
172
Afg
han
ista
n6
3683
758
310
709
8012
171
2635
3857
2457
5938
593
1799
070
2690
0084
010
2511
00
(Con
tinu
ed)

INDICATORS 237
By
HD
I Ran
kN
umbe
r of N
atur
al D
isas
ters
Tota
l Num
ber o
f Dea
ths
from
N
atur
al D
isas
ters
Tota
l Num
ber o
f Peo
ple
Aff
ecte
d by
Nat
ural
Dis
aste
rsEs
tim
ated
Dam
age
Cost
s (U
S$ T
hous
ands
)
2011
1980
–19
8919
90–
1999
2000
–20
0920
10–
2011
1980
–19
8919
90–
1999
2000
–20
0920
10–
2011
1980
–198
919
90–1
999
2000
–200
920
10–2
011
1980
–198
919
90–1
999
2000
–200
920
10–2
011
PACI
FIC
2A
ust
ralia
3853
6310
209
147
599
1794
267
1564
7686
9805
721
8517
8402
834
7154
693
1033
3454
7959
000
5N
ew Z
eala
nd
1813
123
134
618
124
162
3365
7651
6018
4724
9800
2265
0053
4500
1650
0000
49Pa
lau
· ·· ·
· ·· ·
· ·0
· ·· ·
· ·0
· ·· ·
· ·0
· ·· ·
90To
nga
24
31
71
90
1465
1496
7417
007
022
300
2500
6080
030
0099
Sam
oa3
24
· ·0
2115
3· ·
2000
2830
0055
85· ·
7875
047
8000
1515
00· ·
100
Fiji
128
151
9059
702
6254
6543
6730
5136
239
101
2195
0714
2100
1286
9939
427
116
Mic
ron
esia
, Fed
erat
ed
Stat
es o
f1
16
· ·5
067
· ·20
328
800
1206
2· ·
6000
050
0· ·
122
Kiri
bati
· ·1
1· ·
· ·0
0· ·
· ·84
000
85· ·
· ·0
0· ·
125
Van
uat
u8
1112
258
150
40
1752
0029
667
7866
20
1990
0060
000
014
2So
lom
on Is
lan
ds4
46
410
24
732
1811
5088
880
1091
917
733
2000
00
00
153
Papu
a N
ew G
uin
ea9
1729
114
327
0560
80
8400
092
6446
3361
990
1602
516
2228
00
M
arsh
all I
slan
ds· ·
12
· ·· ·
06
· ·· ·
6000
818
· ·· ·
00
· ·
Nau
ru· ·
· ·· ·
· ·· ·
· ·· ·
· ·· ·
· ·· ·
· ·· ·
· ·· ·
· ·
Tuva
lu2
20
10
00
00
850
00
00
00
WO
RLD
1831
2975
4500
640
7937
4652
5361
8397
1133
1243
1252
7597
6220
3582
2686
2354
7684
4538
7199
661
1909
7973
269
9514
731
8961
6328
237
8530
016
Sour
ce:
EM-D
AT
n.d
.N
otes
: N
atu
ral d
isas
ters
incl
ude
dro
ugh
t, e
arth
quak
e (s
eism
ic a
ctiv
ity)
; ep
idem
ic;
extr
eme
tem
pera
ture
; fl
ood;
inse
ct in
fest
atio
n;
mas
s m
ovem
ent
dry;
mas
s m
ovem
ent
wet
; st
orm
; vo
lcan
o; a
nd
wild
fi re
.
Tota
l nu
mbe
r of
peo
ple
affe
cted
by
nat
ura
l dis
aste
rs r
efer
s to
su
m o
f in
jure
d, h
omel
ess
and
affe
cted
peo
ple.
(Con
tinu
ed)
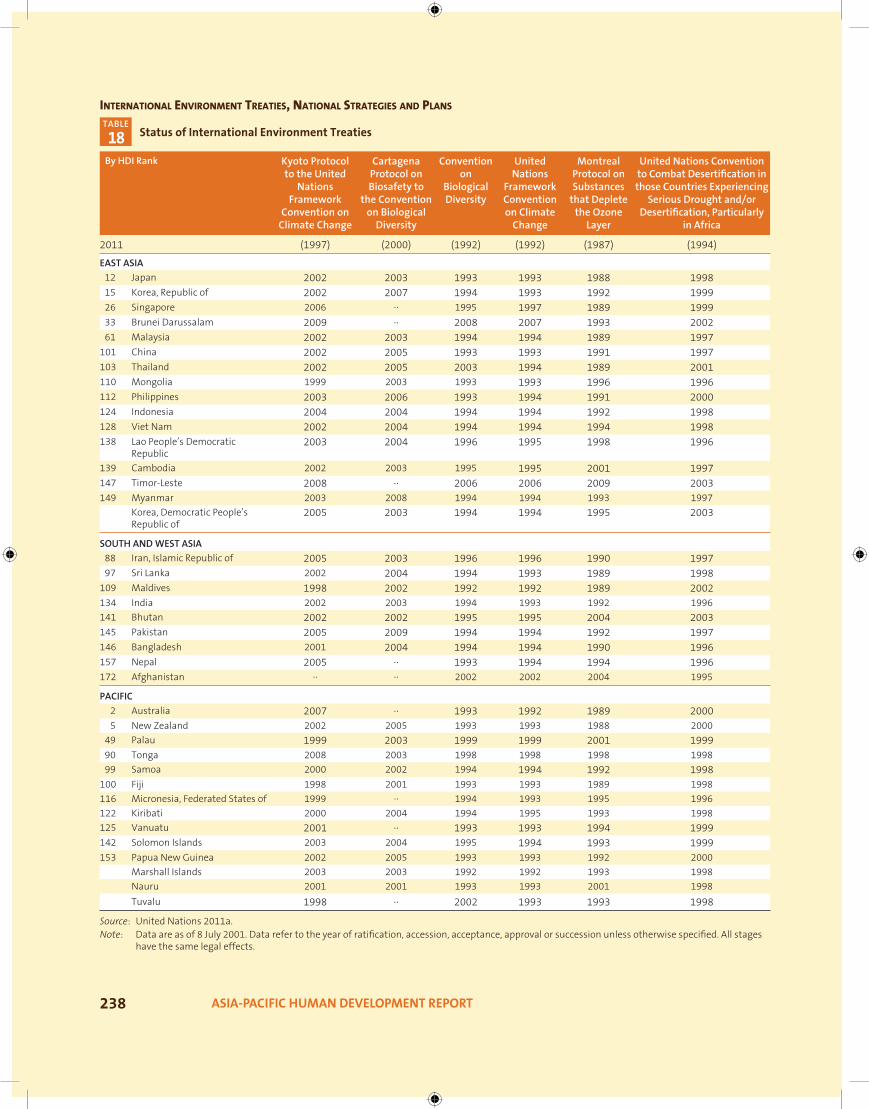
ASIA-PACIFIC HUMAN DEVELOPMENT REPORT238
INTERNATIONAL ENVIRONMENT TREATIES, NATIONAL STRATEGIES AND PLANS
TABLEStatus of International Environment Treaties18
By HDI Rank Kyoto Protocol to the United
Nations Framework
Convention on Climate Change
Cartagena Protocol on Biosafety to
the Convention on Biological
Diversity
Convention on
Biological Diversity
United Nations
Framework Convention on Climate
Change
Montreal Protocol on Substances
that Deplete the Ozone
Layer
United Nations Convention to Combat Desertifi cation in those Countries Experiencing
Serious Drought and/or Desertifi cation, Particularly
in Africa
2011 (1997) (2000) (1992) (1992) (1987) (1994)
EAST ASIA
12 Japan 2002 2003 1993 1993 1988 199815 Korea, Republic of 2002 2007 1994 1993 1992 199926 Singapore 2006 · · 1995 1997 1989 199933 Brunei Darussalam 2009 · · 2008 2007 1993 200261 Malaysia 2002 2003 1994 1994 1989 1997
101 China 2002 2005 1993 1993 1991 1997103 Thailand 2002 2005 2003 1994 1989 2001110 Mongolia 1999 2003 1993 1993 1996 1996112 Philippines 2003 2006 1993 1994 1991 2000124 Indonesia 2004 2004 1994 1994 1992 1998128 Viet Nam 2002 2004 1994 1994 1994 1998138 Lao People’s Democratic
Republic2003 2004 1996 1995 1998 1996
139 Cambodia 2002 2003 1995 1995 2001 1997147 Timor-Leste 2008 · · 2006 2006 2009 2003149 Myanmar 2003 2008 1994 1994 1993 1997
Korea, Democratic People’s Republic of
2005 2003 1994 1994 1995 2003
SOUTH AND WEST ASIA
88 Iran, Islamic Republic of 2005 2003 1996 1996 1990 199797 Sri Lanka 2002 2004 1994 1993 1989 1998
109 Maldives 1998 2002 1992 1992 1989 2002134 India 2002 2003 1994 1993 1992 1996
141 Bhutan 2002 2002 1995 1995 2004 2003145 Pakistan 2005 2009 1994 1994 1992 1997146 Bangladesh 2001 2004 1994 1994 1990 1996157 Nepal 2005 · · 1993 1994 1994 1996172 Afghanistan · · · · 2002 2002 2004 1995
PACIFIC
2 Australia 2007 · · 1993 1992 1989 20005 New Zealand 2002 2005 1993 1993 1988 2000
49 Palau 1999 2003 1999 1999 2001 199990 Tonga 2008 2003 1998 1998 1998 1998
99 Samoa 2000 2002 1994 1994 1992 1998100 Fiji 1998 2001 1993 1993 1989 1998
116 Micronesia, Federated States of 1999 · · 1994 1993 1995 1996
122 Kiribati 2000 2004 1994 1995 1993 1998
125 Vanuatu 2001 · · 1993 1993 1994 1999142 Solomon Islands 2003 2004 1995 1994 1993 1999153 Papua New Guinea 2002 2005 1993 1993 1992 2000
Marshall Islands 2003 2003 1992 1992 1993 1998
Nauru 2001 2001 1993 1993 2001 1998
Tuvalu 1998 · · 2002 1993 1993 1998
Source: United Nations 2011a.Note: Data are as of 8 July 2001. Data refer to the year of ratifi cation, accession, acceptance, approval or succession unless otherwise specifi ed. All stages
have the same legal effects.

INDICATORS 239
TAB
LEN
atio
nal
Rep
orti
ng,
Str
ateg
ies
and
Plan
s on
Clim
ate
Chan
ge19 By
HD
I Ran
kIn
itia
l Nat
iona
l Co
mm
unic
atio
na
Seco
nd N
atio
nal
Com
mun
icat
iona
Nat
iona
l Pol
icie
s, S
trat
egie
s an
d A
ctio
n Pl
ans
on C
limat
e Ch
ange
c
Nat
iona
l Ada
ptat
ion
Pl
an o
f Act
ion
(N
APA
)d
Firs
t N
APA
Im
plem
enta
tion
Pr
ojec
t un
der L
DCF
e
NA
MA
(C
open
hage
n
Acc
ord)
f
UN
-RED
D (U
) an
d FC
PF (F
)g
2011
(Su
bmis
sion
Ye
ar)
(Su
bmis
sion
Ye
ar)
(Su
bmis
sion
Ye
ar)
(En
dors
ed
Mon
th/Y
ear)
(Su
bmis
sion
M
onth
/Yea
r)
EAST
ASI
A12
Japa
n19
94b
1997
b20
09 In
itia
tive
n
/an
/a· ·
· ·15
Kore
a, R
epu
blic
of
1998
2003
2008
Pol
icy
and
Act
ion
Pla
n
n/a
n/a
Jan
201
0· ·
26Si
nga
pore
2000
2010
2008
Nat
ion
al S
trat
egy
n/a
n/a
Jan
201
0· ·
33Br
un
ei D
aru
ssal
am· ·
· ·· ·
n/a
n/a
· ·· ·
61M
alay
sia
2000
2011
2009
Nat
ion
al P
olic
y n
/an
/a· ·
· ·10
1C
hin
a20
04· ·
2007
Nat
ion
al P
rogr
amm
e n
/an
/aJa
n 2
010
· ·10
3Th
aila
nd
2000
2011
2008
Str
ateg
ic P
lan
an
d 20
09 D
raft
Mas
ter P
lan
n
/an
/a· ·
F11
0M
ongo
lia20
0120
1020
00 A
ctio
n P
lan
n/a
n/a
Feb
2010
u11
2Ph
ilipp
ines
2000
· ·20
09 C
limat
e C
han
ge A
ct a
nd
2010
-202
2 N
atio
nal
Fra
mew
ork
Stra
tegy
n
/an
/a· ·
U
124
Indo
nes
ia19
9920
1120
07 A
ctio
n P
lan
an
d 20
10 S
ecto
ral R
oadm
ap
n/a
n/a
Jan
201
0U
,F12
8V
iet N
am20
0320
1020
08 N
atio
nal
Tar
get P
rogr
amm
en
/an
/a· ·
U,F
138
Lao
Peop
le’s
Dem
ocra
tic
Repu
blic
2000
· ·20
10 N
atio
nal
Str
ateg
y20
09N
ov 2
010
· ·F
139
Cam
bodi
a20
02· ·
2001
Nat
ion
al A
ctio
n P
lan
20
06A
pr 2
009
· ·U
,F14
7Ti
mor
-Les
te· ·
· ·· ·
2010
· ·· ·
· ·14
9M
yan
mar
· ·· ·
· ·· ·
· ·· ·
u
Kore
a, D
emoc
rati
c Pe
ople
’s
Repu
blic
of
2004
· ·· ·
n/a
n/a
· ·· ·
SOU
TH A
ND
WES
T A
SIA
88Ir
an, I
slam
ic R
epu
blic
of
2003
2011
· ·n
/an
/a· ·
· ·97
Sri L
anka
2000
· ·20
11-2
016
Nat
ion
al A
dapt
atio
n S
trat
egy
n/a
n/a
· ·U
109
Mal
dive
s20
01· ·
2010
-202
0 St
rate
gic
Nat
ion
al A
ctio
n P
lan
for
DRR
an
d C
C A
dapt
atio
n20
06N
ov 2
009
Jan
201
0· ·
134
Indi
a20
04· ·
2008
Nat
ion
al A
ctio
n P
lan
n
/an
/aJa
n 2
010
· ·14
1Bh
uta
n20
0020
1120
09 C
once
pt P
aper
on
Nat
ion
al S
trat
egy
2006
Mar
200
8Fe
b 20
10u
145
Paki
stan
2003
· ·20
11 N
atio
nal
Pol
icy
n/a
n/a
· ·u
146
Ban
glad
esh
2002
· ·20
09 N
atio
nal
Str
ateg
y an
d A
ctio
n P
lan
20
05D
ec 2
008
· ·u
157
Nep
al20
04· ·
2011
Nat
ion
al P
olic
y20
10· ·
· ·u
, F17
2A
fgh
anis
tan
· ·· ·
· ·20
09· ·
Mar
201
0· ·
(Con
tinu
ed)

ASIA-PACIFIC HUMAN DEVELOPMENT REPORT240
By
HD
I Ran
kIn
itia
l Nat
iona
l Co
mm
unic
atio
na
Seco
nd N
atio
nal
Com
mun
icat
iona
Nat
iona
l Pol
icie
s, S
trat
egie
s an
d A
ctio
n Pl
ans
on C
limat
e Ch
ange
c
Nat
iona
l Ada
ptat
ion
Pl
an o
f Act
ion
(N
APA
)d
Firs
t N
APA
Im
plem
enta
tion
Pr
ojec
t un
der L
DCF
e
NA
MA
(C
open
hage
n
Acc
ord)
f
UN
-RED
D (U
) an
d FC
PF (F
)g
2011
(Su
bmis
sion
Ye
ar)
(Su
bmis
sion
Ye
ar)
(Su
bmis
sion
Ye
ar)
(En
dors
ed
Mon
th/Y
ear)
(Su
bmis
sion
M
onth
/Yea
r)
PACI
FIC
2A
ust
ralia
1994
b19
97b
2004
–200
7 N
atio
nal
Bio
dive
rsit
y an
d C
C A
ctio
n P
lan
; an
d 20
09 A
dapt
atio
n
Act
ion
Pla
n
n/a
n/a
· ·· ·
5N
ew Z
eala
nd
1994
b19
97b
· ·n
/an
/a· ·
· ·49
Pala
u20
03· ·
· ·n
/an
/a· ·
· ·90
Ton
ga20
05· ·
2010
–15
Join
t Nat
ion
al A
ctio
n P
lan
on
C
C A
dapt
atio
n a
nd
Dis
aste
r Ris
k M
anag
emen
t
n/a
n/a
· ·· ·
99Sa
moa
1999
2010
· ·20
04Fe
b 20
09· ·
· ·10
0Fi
ji20
06· ·
· ·n
/an
/a· ·
· ·11
6M
icro
nes
ia, F
eder
ated
Sta
tes
of19
97· ·
2009
Nat
ion
wid
e Po
licy
n/a
n/a
· ·· ·
122
Kiri
bati
1999
· ·20
05 A
dapt
atio
n S
trat
egy
2007
Au
g 20
11· ·
· ·12
5V
anu
atu
1999
· ·· ·
2007
· ·· ·
F14
2So
lom
on Is
lan
ds20
04· ·
· ·20
08· ·
· ·U
15
3Pa
pua
New
Gu
inea
2002
· ·· ·
n/a
n/a
Feb
2010
U,F
M
arsh
all I
slan
ds20
00· ·
· ·n
/an
/aJa
n 2
010
· ·
Nau
ru19
99· ·
· ·n
/an
/a· ·
· ·
Tuva
lu19
99· ·
· ·20
07N
ov 2
009
· ·· ·
Sour
ces:
(a)
UN
FCC
C 2
011b
; (b
) U
NFC
CC
n.d
. -a;
(c)
Var
iou
s n
atio
nal
sou
rces
; (d
) U
NFC
CC
201
1a;
(e)
UN
FCC
C 2
012;
(f)
UN
FCC
C n
.d. -
b; (
g)
UN
-RED
D P
rogr
amm
e 20
12;
UN
-RED
D P
rogr
amm
e n
.d.;
FCPF
201
1.N
ote:
‘U
’ im
plie
s co
un
trie
s re
ceiv
ing
dire
ct s
upp
ort
to N
atio
nal
Pro
gram
me;
‘u’ i
mpl
ies
part
icip
atin
g co
un
trie
s th
at d
o n
ot r
ecei
ve f
un
din
g; ‘F
’ im
plie
s co
un
trie
s of
For
est
Car
bon
Par
tner
ship
Fac
ility
(F
CPF
); n
/a im
plie
s n
ot a
pplic
able
to
the
cou
ntr
y.
(Con
tinu
ed)

STATISTICAL REFERENCES 241
STATISTICAL REFERENCES
Alkire, Sabina and Maria Emma Santos. 2010. Acute multidimensional poverty: A new index for devel-oping countries. Human Development Research Paper No. 2010/11. New York: UNDP.
Alkire, Sabina, José Manuel Roche, Maria Emma Santos and Suman Seth. 2011. Multi-dimensional poverty index: New results, time comparisons and group disparities. Human Development Research Paper. UNDP-HDRO. New York: UNDP.
Atkinson, Anthony B. 1970. ‘On the measurement of inequality’. Journal of Economic Theory 2 (3): 244–63.
CIESIN (Centre for International Earth Science Information Network). 2007. ‘National aggregates of geospatial data: Population, landscape and climate estimates, v. 2 (PLACE II)’. Palisades, NY: CIESIN, Columbia University. [http://sedac.ciesin.columbia.edu/place/datasets.jsp]. Last accessed on 30 October 2011.
———. n.d. ‘Low elevation coastal zone (LECZ): Urban-rural estimates’. Global Rural–Urban Mapping Project (GRUMP), Alpha Version. Palisades, NY: Socioeconomic Data and Appli-cations Centre (SEDAC), Columbia University. [http://sedac.ciesin.columbia.edu/gpw/lecz.jsp]. Last accessed on 30 October 2011.
EM-DAT. n.d. The OFDA/CRED international disaster database. Centre for Research on the Epidemiology of Disasters. Brussels, Belgium: Université Catholique de Louvain. [http://www.emdat.be]. Last accessed on 4 November 2011.
FAO (Food and Agriculture Organization of the United Nations). 2011. ‘FAOSTAT’. Last updated on 21 July. [http://faostat.fao.org/site/377/DesktopDefault.aspx?PageID=377#ancor]. Last accessed on 31 August 2011.
FCPF (Forest Carbon Partnership Facility). 2011. ‘Dashboard of country status’. FCPF Readiness Progress Dashboard. 15 June 2011. [http://www.forestcarbonpartnership.org/fcp/node/283]. Last accessed on 7 September 2011.
Foster, James E., Luis F. López-Calva and Miguel Székely. 2005. ‘Measuring the distribution of human development: Methodology and an application to Mexico’. Journal of Human Development 6 (1): 5–25.
Global Footprint Network. 2010. ‘Data and results’. [www.footprintnetwork.org/atlas]. Last accessed on 1 June 2011.
IEA (International Energy Agency). 2011a. CO2 emissions from fuel combustion — 2011 edition. Paris: OECD/IEA.
———. 2011b. Key world energy statistics 2011. Paris: OECD/IEA.
———. 2011c. Renewables information 2011. Paris: OECD/IEA.
———. 2011d. World energy outlook 2011: New electricity access database. [http://www.iea.org/weo/electricity.asp]. Last accessed on 21 November 2011.
Klugman, Jeni, Francisco Rodríguez and Hyung-Jin Choi. 2011. The HDI 2010: New controversies, old critiques. Human Development Research Paper No. 01. New York: UNDP.
Seth, Suman. 2009. Inequality, interactions, and human development. OPHI Working Paper No. 23. Oxford: OPHI.
UNDESA (United Nations Department of Economic and Social Affairs). 2011a. World population prospects: The 2010 revision. CD-ROM version.
———. 2011b. World population prospects: The 2010 revision. Population Division. United Nations Department of Economic and Social Affair. [http://esa.un.org/unpd/peps/EXCEL-Data_WPP2010/Interpolated-Data/peps_interpolated-data.htm]. Last accessed on 20 October 2011.
UNDP (United Nations Development Programme). 2011. Sustainability and equity: A better future for all. Human Development Report 2011. New York: Palgrave Macmillan.

ASIA-PACIFIC HUMAN DEVELOPMENT REPORT242
———. 2010. The real wealth of nations: Pathways to human development. Human Development Report 2010. New York: Palgrave Macmillan.
UNESCO Institute for Statistics. 2011. ‘Data centre’. [http://stats.uis.unesco.org/unesco/TableViewer/document.aspx?ReportId=143&IF_Language=eng]. Last accessed on 1 November 2011.
UNFCCC (United Nations Framework Convention on Climate Change). 2012. ‘Status of NAPA implementation under the LDCF’. Status as of 24 February 2012. [http://unfccc.int/cooperation_support/least_developed_countries_portal_/ldcf_napa_projects/items/5632.php]. Last accessed on 15 March 2012.
———. 2011a. ‘NAPAs received by the secretariat’. Last updated in December 2011. [http://unfccc.int/cooperation_support/least_developed_countries_portal/submitted_napas/items/4585.php]. Last accessed on 15 March 2012.
———. 2011b. ‘Non-Annex I national communi-cations’. [http://unfccc.int/national_reports/non-annex_i_natcom/items/2979.php]. Last accessed on 15 March 2012.
———. n.d. -a ‘Annex I national communications’. [http://unfccc.int/national_reports/annex_i_natcom/submitted_natcom/items/1395.php]. Last accessed on 15 March 2012.
———. n.d. -b ‘Appendix II — Nationally appropri-ate mitigation actions of developing country parties’. [http://unfccc.int/meeting/cop_15/copenhagen_accord/items/5265.php]. Last accessed on 15 March 2012.
UN-HABITAT (United Nations Human Settle-ments Programme) and UNESCAP (United Nations Economic and Social Commission for Asia and the Pacific). 2010. The state of Asian cities 2010/2011. Fukuoka, Japan: UN-HABITAT.
United Nations. 2011a. ‘Multilateral treaties deposited with the Secretary-General’. United
Nations treaty collection. [http://treaties.un.org/Pages/Treaties.aspx?id=27&subid=A&lang=en]. Last accessed on 8 July 2011.
———. 2011b. The Millennium Development Goals report. Statistical annex. New York: United Nations.
———. 2010. National accounts main aggregates database. Last updated in December. United Nations Statistics Division. [http://unstats.un.org/unsd/snaama/selbasicFast.asp]. Last accessed on 1 July 2011.
———. n.d. Millennium Development Goals indicators. Development Indicator Unit, Statistic Division. [http://mdgs.un.org/unsd/mdg/Data.aspx]. Last accessed on 1 November 2011.
UN-REDD Programme. 2012. ‘UN-REDD programme approves US$8 million in critical funding for REDD+ in Republic of Congo and Sri Lanka’. 28 March. [http://www.un-redd.org/PB8_Press_Release/tabid/78557/Default.aspx]. Last accessed on 2 April 2012.
———. n.d. ‘National programmes’. [http://www.un-redd.org/AboutUNREDD Programme/NationalProgrammes/tabid/584/language/en-US/Default.aspx]. Last accessed on 7 September 2011.
WHO (World Health Organization). 2011. World health statistics 2011. Geneva: WHO.
World Bank. 2011. World development indicators online. Washington, D.C.: World Bank. [http://databank.worldbank.org/ddp/home.do]. Last accessed on 1 November 2011.
———. 2010. ‘PovcalNet’. Last updated on 1 November 2011. [http://iresearch.worldbank.org/PovcalNet/povDuplic.html]. Last accessed on 5 September 2011].
WRI (World Resources Institute). 2011. ‘Climate analysis indicator tools’. [http://cait.wri.org/cait.php]. Last accessed on 1 November 2011.


-
From the Human Development Report UnitUNDP Asia-Pacific Regional Centre, Bangkok
UNDP Asia-Paci�c Human Development FellowshipsAcademic
Objective: To encourage and strengthen capacity among Ph.D. students from UNDP Asia-Pacific programme countries to analyse issues from a human development perspective, contributing to cutting-edge research on theory, applications and policies.
MediaObjective: To develop capacity amongst media professionals from UNDP Asia-Pacific programme countries for enhanced reporting, dissemination and outreach campaigns to bring people’s issues to the centre of advocacy efforts.
Other Publications• Asia-Pacific Human Development Report on Gender Background Papers Series (2011)• Enforcing Rights and Correcting Wrongs: Overcoming Gender Barriers in Legal Systems (2011)• E-Discussion on Climate Change and Human Development (2011)• Benchmarking National Legislation for Gender Equality: Findings from Five Asian Countries (2010)• Building Security for the Poor: Potential and Prospects for Microinsurance in India — Second Edition (2009)• Challenging Corruption: Prioritising Social Services for Human Development (2009)• Estimating Sub-national Human Development Indices in the Presence of Limited Information: The Case of Bhutan (2009)• E-Discussion: Gender — Overcoming Unequal Power , Unequal Voice (2009)• Perspectives on Corruption and Human Development — Volume 1 and Volume 2 (2009)• Targeted Interventions Against Hunger: A Case for Preschool and School Feeding (2008)• Two Background Papers for the Asia-Pacific Human Development Report 2006: Trade on Human Terms (2008)• E-Discussion on Transforming Corruption through Human Development (2008)
Tools• Cracking the HDI: Human Development Indexing Exercise (Updated 2009)• From Development to Human Development: Tool for Applying the Human Development Perspective (Updated 2009)• Getting the Most Out of Feedback: Peer Review Guidelines (2007)• Surviving the Publication Process: Prepkit for Publications (2005)• Tool for Credit Rating of Micro Credit Recipients (2005)
For more information please visit: http://asia-pacific.undp.org
The cover design plays upon a traditional sepak takraw ball as a metaphor for
the Earth. Hand-fashioned from rattan and unique to Asia-Pacific, the ball
symbolises interconnectedness, resilience and creativity — leveraging these
can help deal with climate change, while ignoring them will affect human
development negatively. Climate change is a threat on a planetary scale.
People everywhere, especially the poor, are increasingly exposed to the
consequences of global warming regardless of where the causes originate.
The woven rattan represents how collaborating for collective good can result
in a harmonious future. Equally, humanity could go the other way — if
climate change is not managed in a coordinated way, it will unravel human
progress now and in the days to come.

Empowered lives.Resilient nations.
Empowered lives.Resilient nations.
People in Asia-Pacific will be profoundly affected by climate change. Home to more than half of humanity, the region straddles some of the world's most geographically diverse and climate-exposedareas. Despite having contributed little to the steady upward climb in the greenhouse gas emissions that cause global warming, some of the region's most vulnerable communities — whether mountain dwellers, island communities or the urban poor — face the severest consequences.
Poverty continues to decline in this dynamic region, but climate change may undercut hard-won gains. Growing first and cleaning up later is no longer an option, as it once was for the developed countries. Developing nations need to grow and manage climate consequences at the same time. They must both support resilience, especially among vulnerable populations, and shift to lower-carbonpathways. Emerging threats, whether from melting glaciers or rising sea levels, cross borders and demand coordinated regional and global action.
There may be some uncomfortable trade-offs, but the way forward is clear — it lies in sustaining human development for the future we want. When people have equitable access to basics such as livelihoods, clean energy, health and pollution-free air, greater climate resilience and improved emissions management will follow. This report outlines where transformation can begin: in cleaner, more efficient production, in fair and balanced consumption, and in both rural and urban areas. Through better institutions, more accurate knowledge and changed attitudes, Asia-Pacific societies can find smarter strategies for adapting to a warmer world.
ONE PLANET TO SHARE
US$ 45