Climate Resilient Legazpi City
93
Climate Resilient Legazpi City Building Climate Resiliency through Urban plans and Designs Project City Learning and Exchange Series Tagum City September 11, 2019
-
Upload
khangminh22 -
Category
Documents
-
view
3 -
download
0
Transcript of Climate Resilient Legazpi City

Climate Resilient Legazpi City
Building Climate Resiliency throughUrban plans and Designs Project
City Learning and Exchange SeriesTagum CitySeptember 11, 2019

Context

1960 2018LEGAZPI CITY I Philippines

LEGAZPI CITYquick facts
16,165.43
LAND AREA (HECTARES)
PREDOMINATLYAGRICULTURE
LAND USE MIX
METROPOLITAN REGIONAL CENTER
REGIONAL ROLE - BICOL REGION
AGRI-ECOTOURISMCUM COMMERCIAL
DEVELOPMENT THRUST
45 URBAN - 25 RURAL
BARANGAYS

LEGAZPI CITYquick facts
205,378 237,412
POPULATION 2028
95.9%EMPLOYMENT RATE
99.48%LITERACY RATE
41.47%LIVING BELOW THE
POVERTY THRESHOLD
9.78%INFORMAL SETTLERS
APPROXIMATELY (19,663)

Upland Residential
Urban Structure
CBD
RC
OD
URUR
BT
BU
SC
SP
CBD
RC
OD
UR
CR
BT
BU
RR
SC
SP
Central Business District
Secondary Business District
Old Albay Government District
Regional Government District
Educational District
Upland Residential
Coastal Residential
Riverside ResidentialSeaport
Central Bus terminal
AP Domestic Airport
AP
RR Rural Residential
Urban Structure Legazpi City
RR
RR
RR
CR
CR
CR
RR
RR
RR

CLIMATE RESILIENT LEGAZPI CITYINTIAL PHASE
2019-2028COMPREHENSIVE LAND USE
PLAN(Long-term Spatial Framework Plan)
2019-2028COMPREHENSIVE DEVELOPMENT
PLAN(Sectoral Development Plan)
EXECUTIVE AND LEGISLATIVEAGENDA
PUBLIC INVESTMENT PLAN(Medium term and annual)
LOCAL CLIMATE CHANGE ACTION PLAN
CLIMATE AND DISATER RISK ASSESSMENTGREENHOUSE GAS INVENTORY

CLIMATE RESILIENT LEGAZPI CITYINTIAL PHASE
2019-2028 (UPDATING)COMPREHENSIVE LAND USE
PLAN(Long-term Spatial Framework Plan)
2019-2028COMPREHENSIVE DEVELOPMENT
PLAN(Sectoral Development Plan)
EXECUTIVE AND LEGISLATIVEAGENDA
PUBLIC INVESTMENT PLAN(Medium term and annual)
LOCAL CLIMATE CHANGE ACTION PLAN
CLIMATE AND DISATER RISK ASSESSMENTGREENHOUSE GAS INVENTORY
URBAN ADAPTATION STRATEGY
URBAN DESIGN GUIDEON CLIMATE RESILIENCY
PROJECT BRIEFS (INVESTMENT FORUM)
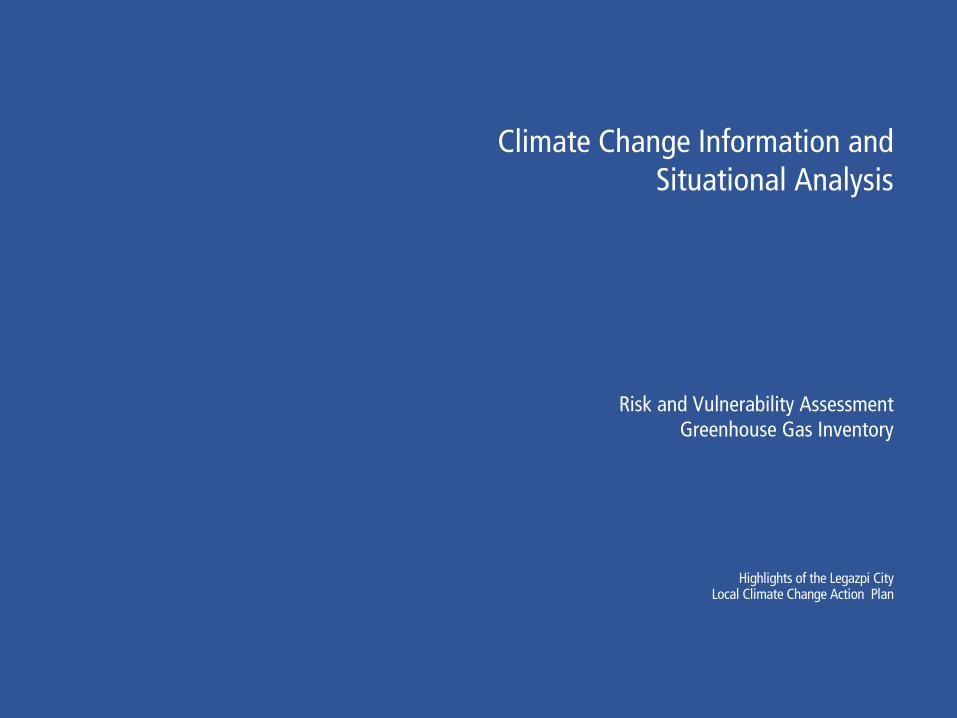
Climate Change Information and Situational Analysis
Risk and Vulnerability AssessmentGreenhouse Gas Inventory
Highlights of the Legazpi CityLocal Climate Change Action Plan

CDRA dashboardclimate and disaster risk assessment, planning and decision making tool

+ 297mm
+ 585mm
Seasonal Rainfall
Slight to significant Increase in seasonal rainfall during the DJF months (opportunities for rainwater harvesting) to address potential threats of slight to significant reduction during the JJA and SON months. Legazpi City will prepare for all plausible scenariops
- 177mm
- 103mm
- 254mm
- 177mm

0 50 100 150 200 250 300 350
Taysan
Estanza
Mariawa
Homapon
Banquerohan
Maslog
San Francisco
Exposure by type of Crop (Reduction in Seasonal Rainfall)Rice

0
1
2
3
4
0
0.2
0.4
0.6
0.8
1
Banquerohan Taysan San Francisco Estanza Mariawa Homapon Maslog
Rice
Sensisitivity Indicators and average vulnerability score
Average of Climate field school participationAverage of Percentage of farmers practicing sustainable production techniquesAverage of Famers with access to Hazard InformationAverage of Famers with Irrigation CoverageAverage of Famers with Water ImpoundmentAverage of Famers with Crop Insurance Coverage2Average of Sensitivity ScoreAverage of Vulnerabi lity Score
Sensitivity indicators and vulnerability score

0
1
2
3
4
0
0.2
0.4
0.6
0.8
1
Banquerohan Taysan San Francisco Estanza Mariawa Homapon Maslog
Rice
Adaptive Capacity Indicators and average vulnerability score
Average of Agriculture Extension service coverageAverage of Early warning System CoverageAverage of Alternative LivelihoodAverage of Adaptive CapacityAverage of Vulnerability Score

295.30
151.56
148.55
101.57
89.61
73.23
26.89
0 50 100 150 200 250 300 350
Taysan
Estanza
Mariawa
Homapon
Banquerohan
Maslog
San Francisco
Rice
Risk Natural Production Areas by type of Crop 3 h igh

566
547
320
234
60
34
5
0 100 200 300 400 500 600
Taysan
Estanza
Mariawa
Homapon
Maslog
Banquerohan
San Francisco
Rice
Farming Households at risk high

Decision AreasChanges in seasonal rainfall
And Temperature

Seasonal Temperature
Hotter conditions especially during the June, July and August months where the expected mean seasonal temperature will be 30.0OC and 31.8OC for 2065 and 2099 respectively
(Upper bound projection, RCP 8.5).
Obse
rved
2036
-206
5
2070
-209
9


0 200 400 600 800100
Meters
Built-up areas$Legend
Built-up Areas
Water BodiesMap sources:
NAMRIA, Aerial Photos, 2016Road Network, Open Street Map, 2017
Built-up areas
0 200 400 600 800100
Meters
Tree cover map$Legend
Tree Cover
Map sources:
NAMRIA, Aerial Photos, 2016Road Network, Open Street Map, 2017
0 200 400 600 800100
Meters
Available open spaces$Legend
Open spaces / Rice Paddies
Map sources:
NAMRIA, Aerial Photos, 2016Road Network, Open Street Map, 2017
Built up area Percentage(Exposure)
Tree cover Percentage(Sensitivity)
Remaining Open space Percentage(Adaptive Capacity)
0 200 400 600 800100
Meters
$Legend
Vulnerability
Very Low
Low
Moderate
High
Very High
Map sources:
NAMRIA, Aerial Photos, 2016Road Network, Open Street Map, 2017
vulnerability index map
Urban Heat Stress
Old Albay District Port Area CBD District


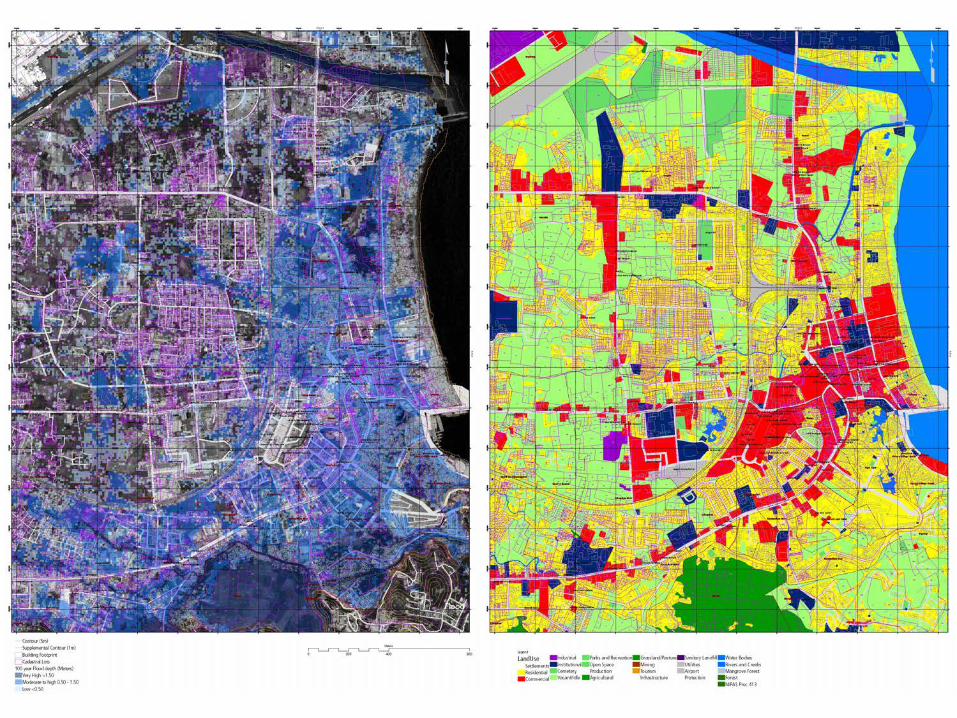
Flooding is a general and temporary condition of partial or complete inundation of normally dryland from the overflow of inland or tidal waters and the unusual and rapid accumulation or runoff of surface waters from any source (NSCP, 2015). In the case of Legazpi, riverine, coastal and urban flooding affects a significant area of the urban center. Riverine flooding occur along the Macabalo, Sagumayon, Tibu, and Yawa rivers affecting residential, commercial and institutional areas. Urban flooding is caused by the rapid flow and accumulation of storm waters in low lying areas which affects the commercial areas near the port. Coastal flooding occurs when strong onshore winds push the water inland, causing a rise in sea level and flooding the low-lying coastal areas. Coastal flooding can be observed in the low lying coastal areas of the urban center. With the potential increase in the frequency of extreme rainfall events due to climate change, the City should start implementing interventions to anticipate its impacts and minimize risks to people and property.
FLOODS
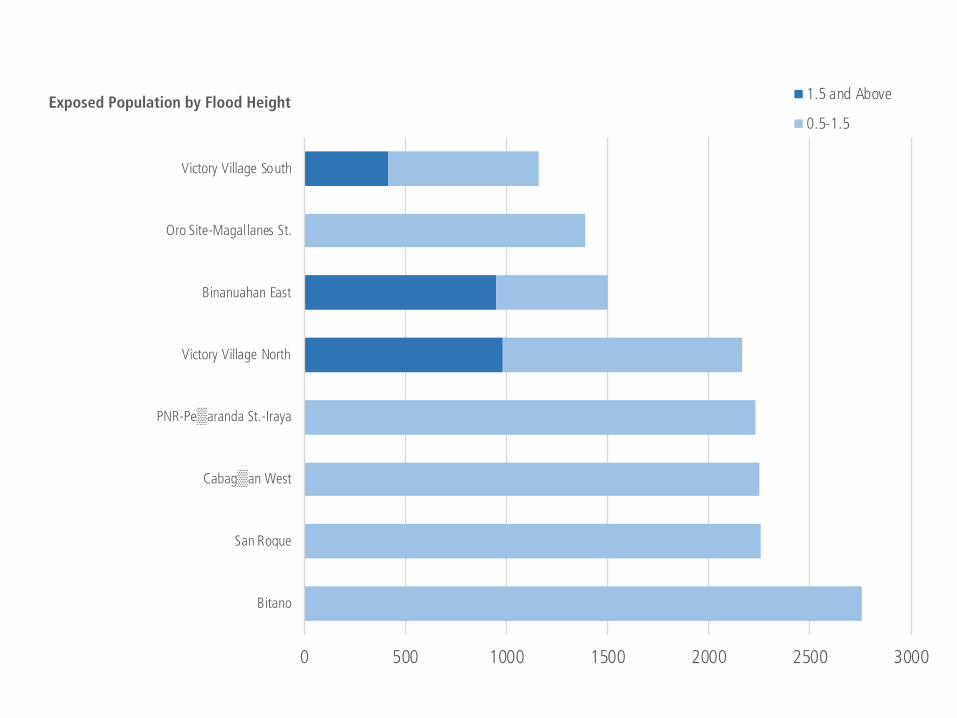
0 500 1000 1500 2000 2500 3000
Bitano
San Roque
Cabag▒an West
PNR-Pe▒aranda St.-Iraya
Victory Village North
Binanuahan East
Oro Site-Magallanes St.
Victory Village South
Exposed Population by Flood Height 1.5 and Above
0.5-1.5

2,755
2,253
2,249
2,226
2,165
1,502
1,388
1,155
0 500 1000 1500 2000 2500 3000
Bitano
San Roque
Cabag▒an West
PNR-Pe▒aranda St.-Iraya
Victory Village North
Binanuahan East
Oro Site-Magallanes St.
Victory Village South
Population Risk Flood high
15,692Population high risk to flooding

0
1
2
3
4
0
0.25
0.5
0.75
1
Oro
Site
-Mag
alla
nes
St.
PNR-
Pe▒
aran
da S
t.-Ira
ya
Bita
no
San
Roqu
e
Bina
nuah
an E
ast
Vict
ory
Villa
ge N
orth
Caba
g▒an
Wes
t
Vict
ory
Villa
ge S
outh
Sensitivity Indicators and Vulnerability Scores Average of Percentage of Informal Settlers ( IS)
Average of Percentage living in dwelling units made from light materials or salvageable materials
Average of Percentage of young and o ld dependents
Average of Percentage below the Poverty Threshold
Average of Vulnerability Score

0
1
2
3
4
0
1
2
3
4
Victo
ry V
illage
Sou
th
San
Roqu
e
PNR-
Pe▒
aran
da S
t.-Ira
ya
Bita
no
Victo
ry V
illage
Nor
th
Caba
g▒an
Wes
t
Bina
nuah
an E
ast
Oro
Site-
Mag
alla
nes
St.
Adaptive Capacity Scores per Indicator and Vulnerability Score Average of Economic Wealth (Score)
Average of Access to Technology (Score)
Average of Institutions and Governance (Score)
Average of Infrastructure (Score)
Average of Access to Information (Score)
Average of Social Capital and Human Resources (Score)
Average of Vulnerability Score
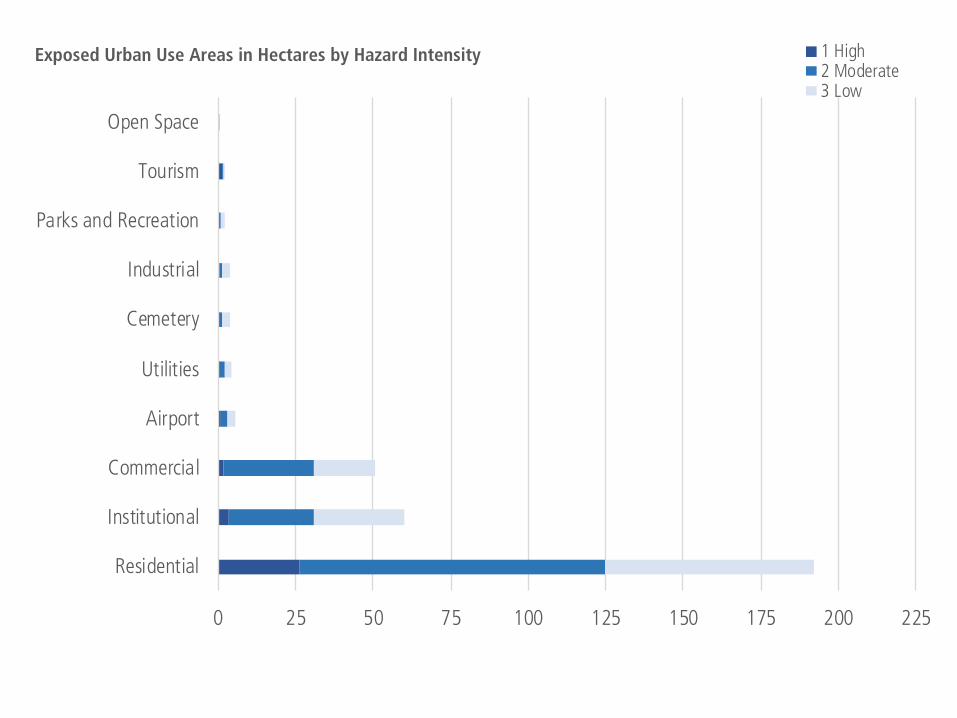
0 25 50 75 100 125 150 175 200 225
Residential
Institutional
Commercial
Airport
Utilities
Cemetery
Industrial
Parks and Recreation
Tourism
Open Space
Exposed Urban Use Areas in Hectares by Hazard Intensity 1 High2 Moderate3 Low

0 2 4 6 8 10 12 14 16
Bitano
Cabagªan West
Binanuahan East
San Roque
PNR Peªaranda
Oro Site Magallanes
Bonot
Victory Village South
Victory Village North
Sabang
Pigcale
Centro Baybay
Resid
entia
l
Urban Use Areas at Risk per Barangay 1 High

0
1
2
3
4
0
0.2
0.4
0.6
0.8
1
PNR Peªaranda Victory VillageSouth
San Roque Bitano Pigcale Bonot Sabang CabagªanWest
Victory VillageNorth
Centro Baybay BinanuahanEast
Oro SiteMagallanes
Res idential
Sensitivity indicators of Residential Areas and Average Sensitivity Scores Average of Percentage of building walls w ith light to salvageable mater ialsAverage of Percentage of buildings in dilapidated/condemened ConditionAverage of Percentatge of buidlings with no hazard mitigation designAverage of Percentatge of buidlings with access to hazard mit igation infrastructureAverage of Percentage of Informal Set tlersAverage of Average Sensitivity ScoreAverage of Vulnerabilit y Score
Sensitivity indicators and vulnerability score

0
1
2
3
4
0
1
2
3
4
PNRPeªarandaResidential
Victory Vil lageSouth
San Roque Bitano Pigcale Bonot Sabang CabagªanWest
Victory Vil lageNorth
Centro Baybay BinanuahanEast
Oro SiteMagallanes
Adaptive Capacity indicators of Residential Areas and Average Adaptive Capacity Scores Average of Economic Wealth ScoreAverage of Technology ScoreAverage of Institutions and Governance ScoreAverage of Infrastructure ScoreAverage of Information ScoreAverage of Social Capital and Human Resources ScoreAverage of Average Adaptive Capacity Score

Decision AreasFlood HazardsCoastal and River side Residential Areas

Decision AreasFlood HazardsCoastal and River side Commercial Areas
Decision AreasFlood HazardsRice production areas

153
0 400 800 1,200
Meters
Legend
Decision Areas LifelinesWater Distribution NetworkNational RoadsSecondary and Tertiary Roads
Decision AreasFlood HazardsLifelines
Central Business District
Inaccessible during peak flood
2
Highly Vulnerable and Marginal groups
Inaccessible during peak flood making it extremely difficult for emergency rescue and evacuation
1

0 300 600 900 1,200150
Meters
Storm surge hazard map$Legend
Wave height (m)
1.5 and above
0.5 - 1.5
< 0.5
Map sources: Flood Hazard Map, 100 year return period, DOST-NOAH, 2017Road Network, Open Street Map, 2017
Public Advisory 4, 5.00 meter wave height at the coast
Public Advisory 4
Five meter estimated wave height
at the coast


0 1000 2000 3000 4000 5000 6000 7000 8000
Bitano
San Roque
Rawis
Gogon
Bonot
PNR-Pe▒aranda St.-Iraya
Rizal Street
Cabag▒an West
Victory Village North
Pigcale
Sabang
Oro Site-Magallanes St.
Binanuahan East
Centro-Baybay
Lapu-lapu
Bigaa
Dap-dap
Cabag▒an
Puro
Binanuahan West
Top 10 Barangays based on Population Exposure and Risk highmoderate
30,628High risk population
Risk to population – Storm Surge

0 25 50 75 100 125 150 175 200
Residential
Commercial
Institutional
Industrial
Open Space
Cemetery
Utilities
Parks andRecreation
Mining
Tourism
Exposed Urban Use Areas in Hectares by Hazard Intensity 1.5 and above
0.5 - 1.5
< 0.5

0 2 4 6 8 10 12 14 16
Bagacay
Capantawan
Bonot
Centro Baybay
Cabagªan East
Rawis
Oro Site Magallanes
PNR Peªaranda
San Roque
Tinago
Rizal Street
Pigcale
Dinagaan
Com
mer
cial
Urban Use Areas at Risk per Barangay2 Moderate

Decision AreasStorm SurgeCoastal Commercial Areas
Decision AreasStorm SurgeResidential Areas

Decision AreasStorm SurgeInstitutional Areas
153
0 400 800 1,200
Meters
Legend
Decision Areas RoadsWater Distribution NetworkNational RoadsSecondary and Tertiary Roads


Sea level rise
Sea level rise is a slow creeping hazard associated with the thermal expansion of sea water andthe addition of meltwater from ice sheets and glaciers into the ocean (Church et al., 2013a ) due to the increase in global temperatures. Based on projections, sea levels in Legazpi City may rise from 0.46m to 1.11m by 2100 (RCP 8.5). This may affect portions of the Barangays Lapu-lapu, Victory Village North and South and potentially impact vulnerable coastal communities. Also, this may affect a portion of the Central Business district and permanently submerge rizal st near the coastal area. Also, low lying residential areas along the Macabalo river are potentially exposed affecting riverside communities.


0 500 1000 1500 2000 2500
Victory Village North
San Roque
Sabang
Binanuahan East
Oro Site-Magallanes St.
Pigcale
Dinagaan
PNR-Pe▒aranda St.-Iraya
Lapu-lapu
Imperial Court Subd.
Rizal Street
Binanuahan West
Capantawan
Buragwis
Dap-dap
Lamba
Exposed Population by Sea Level Rise Inundation Height 10.750.50.2
14,762Exposed population

12,792Individuals at risk
0 500 1000 1500 2000 2500
Victory Village North
San Roque
Sabang
Binanuahan East
Pigcale
PNR-Pe▒aranda St.-Iraya
Bitano
Victory Village South
Bonot
Puro
Gogon
Top 10 Barangays based on Population Exposure and Risk high
moderateRisk to population Sea Level Rise


0 0.2 0.4 0.6 0.8 1 1.2 1.4 1.6 1.8
Dinagaan
Oro Site Magallanes
Pigcale
Sabang
Lapu Lapu
Binanuahan West
Imperial Court Subd
Victory Village North
Binanuahan East
Com
mer
cial
Commercial Areas at Risk per Barangay1 High
6.15Hectares at risk

Decision AreasSea Level RiseCommercial Areas
Decision AreasSea Level RiseResidential Areas

153
0 400 800 1,200
Meters
Legend
Decsion AreasWater Distribution NetworkNational RoadsSecondary and Tertiary Roads
Decision AreasSea Level RiseRoad Network

0 300 600 900 1,200150
Meters
Lahar susceptibilty mapLegend
Areas highly prone to lahar
Areas moderately prone to lahar
Areas least prone to Lahar
Map sources: Lahar susceptibility map, PHIVOLCS, 2009Road Network, Open Street Map, 2017
0 300 600 900 1,200150
Meters
Lahar susceptibilty mapLegend
Areas highly prone to lahar
Areas moderately prone to lahar
Areas least prone to Lahar
Map sources: Lahar susceptibility map, PHIVOLCS, 2009Road Network, Open Street Map, 2017
20182009

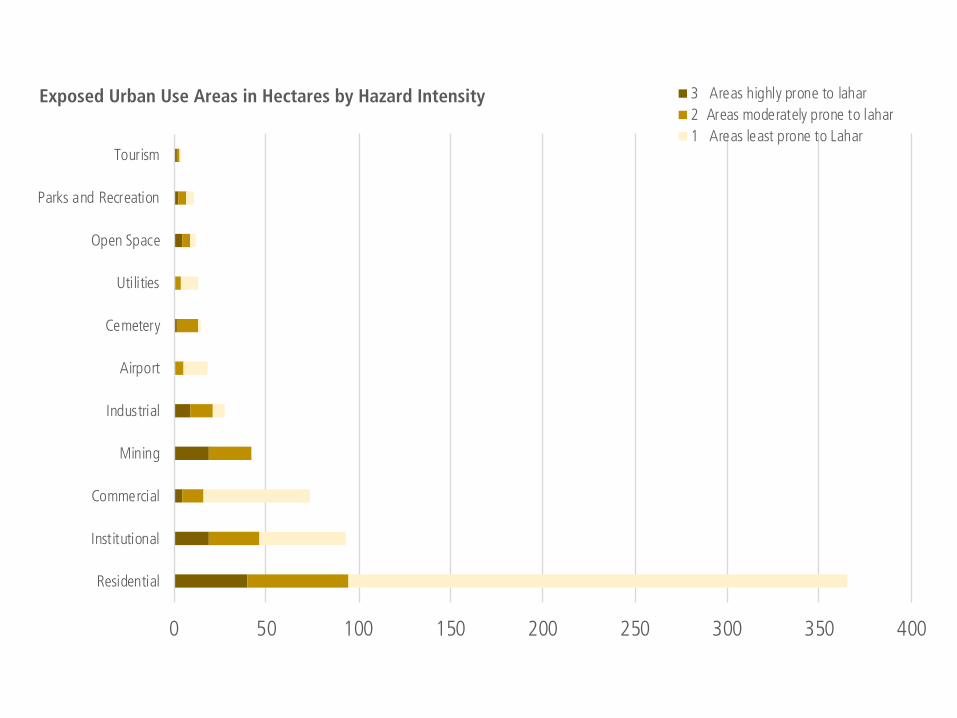
0 50 100 150 200 250 300 350 400
Residential
Institutional
Commercial
Mining
Industrial
Airport
Cemetery
Utilities
Open Space
Parks and Recreation
Tourism
Exposed Urban Use Areas in Hectares by Hazard Intensity 3 Areas highly prone to lahar2 Areas moderately prone to lahar1 Areas least prone to Lahar

0 1000 2000 3000 4000 5000 6000 7000 8000 9000 10000
RawisBitanoBigaa
GogonSan Roque
CruzadaBogtongBuyuan
ArimbayBonotBognaPawa
PNR-Pe▒aranda St.-IrayaVictory Vil lage North
San JoaquinMatanag
DitaPigcaleSabangPadang
TamaoyanMabinit
Oro Site-Magallanes St.Bagong Abre
Centro-BaybayVictory Vil lage South
DinagaanRizal StreetLapu-lapu
CapantawanTinago
Cabag▒an West
Exposed Population by Lahar Susceptibility 3 Areas highly prone to lahar2 Areas moderately prone to lahar1 Areas least prone to Lahar
91,271Exposed population

0 1000 2000 3000 4000 5000 6000
San Roque
Bonot
Bogtong
Bigaa
Padang
Arimbay
Mabinit
Pawa
Bogna
Rawis
Matanag
Buyuan
Bagong Abre
Gogon
Population Exposure and Risk high
21,912Population at risk

- 20.000 40.000 60.000 80.000 100.000 120.000
CruzadaRawis
PadangGogon
BogtongBigaa
ArimbayPawa
BitanoBonotBogna
BuyuanSan Roque
PNR PeªarandaBagong Abre
DitaOro Site Magallanes
MatanagCapantawan
TamaoyanMabinit
Centro BaybayLapu Lapu
San JoaquinVictory Village South
DinagaanPigcaleTinago
Victory Village NorthSabang
Rizal StreetCabagªan West
Dapdap
Exposed Areas by Type of Land Use Airport
Cemetery
Commercial
Industrial
Institutional
Open Space
Parks and Recreation
Residential
Tourism
Utilities
Mining
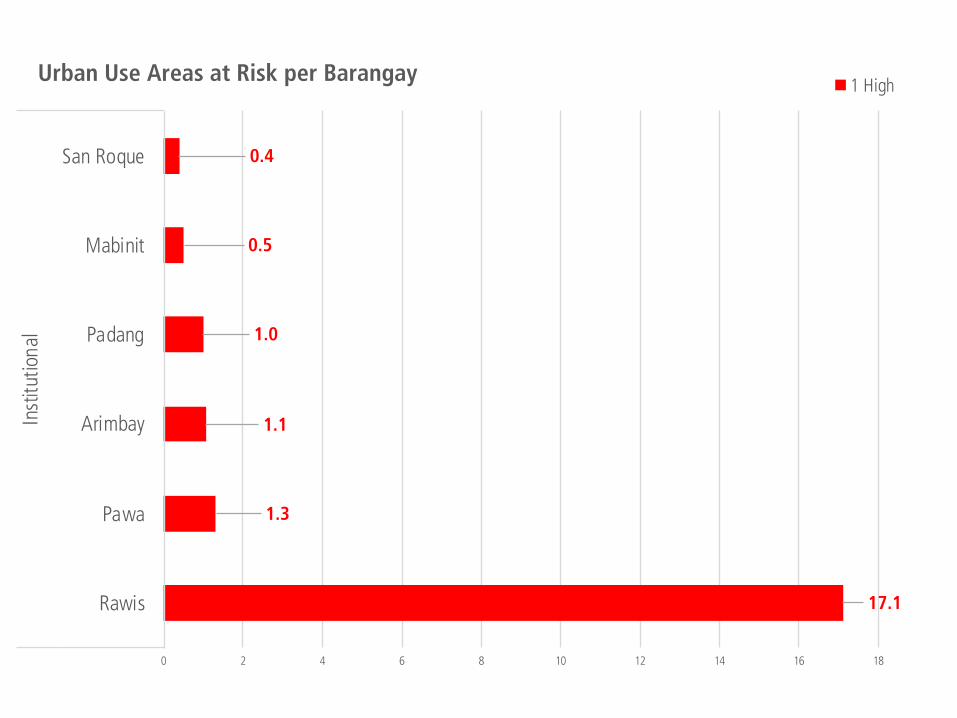
17.1
1.3
1.1
1.0
0.5
0.4
0 2 4 6 8 10 12 14 16 18
Rawis
Pawa
Arimbay
Padang
Mabinit
San Roque
Inst
itutio
nal
Urban Use Areas at Risk per Barangay 1 High

Decision AreasLahar Institutional Areas

0 50 100 150 200 250 300
Buyuan
Pawa
Bog▒a
Padang
Mabinit
Bigaa
Bagong Abre
Matanag
Rawis
Arimbay
San Joaquin
Dita
Tamaoyan
Cruzada
Bogtong
Gogon
Exposure by type of CropCoconut
Rice

0 50 100 150 200 250
Pawa
Buyuan
Bigaa
Bagong Abre
Padang
RawisBog▒a
Arimbay
San Joaquin
Matanag
Dita
Tamaoyan
Mabinit
Cruzada
Bogtong
GogonBog▒a
Buyuan
Padang
Mabinit
Matanag
Pawa
Bagong Abre
Dita
Tamaoyan
San Joaquin
Arimbay
Bigaa
Rawis
Rice
Coco
nut
Risk Natural Production Areas by type of Crop
3 h igh
2 moderate
1,445Hectares at risk

0 200 400 600 800 1000 1200
BuyuanBog▒a
Matanag
Padang
Mabinit
Pawa
Bagong Abre
Tamaoyan
Dita
Arimbay
Bigaa
San Joaquin
Rawis
Pawa
Rawis
Bagong Abre
BuyuanBog▒a
Padang
Arimbay
Bigaa
San Joaquin
Matanag
Tamaoyan
Dita
Mabinit
Bogtong
Cruzada
Gogon
Coco
nut
Rice
Farming Households at risk
high
moderate
2,785Farming Dependent Households at risk
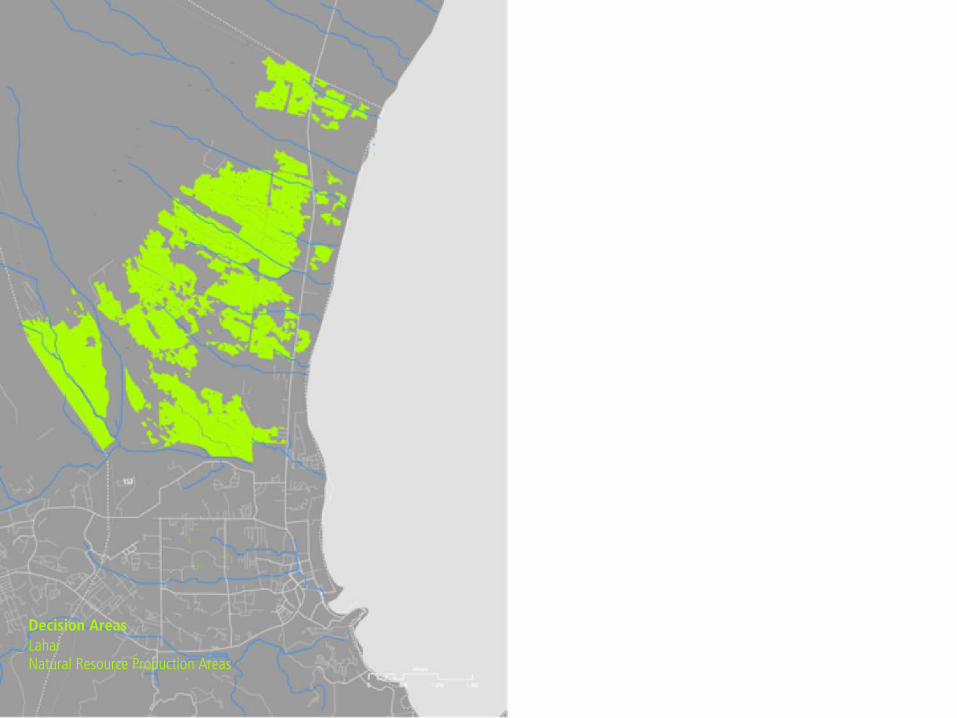
Decision AreasLahar Natural Resource Production Areas

153
2L
9L
5L
19 L
51 L
10 9 L
30 L
1L
59 L
7L
2H
77L
33L
11 0 L
118
L
3L
63L
5H
59 H
117
L
8L
32L
5M
9H
89L
54 L
2M
31L
26L
59 M
62 L
10 8 L
33M
38L
49L
41 L
61 H
19H
61L
90 L
61M
76L
82L
9M
25L
94M
109
M
20 M
109
H
57L
39L
3H
104
L
92L
6L
33H
10 1 L
93 M
91M
95 L
32H
3M
32M
49 M
19 M
56 L
96L
94 L
11 6 L
4H
34H
18L
10 6 L
11 2 L
36L
103
L
53 L
75L
10 7 L
35H
38M
102
L
38H
55 L
43 L
52 L
34L
37L
20 L
93 L
2M
0 400 800 1,200
Meters
Legend
Decision Areas RoadsWater Distribution NetworkNational RoadsSecondary and Tertiary Roads
Bridge

Climate Change Information and Situational Analysis
Greenhouse gas inventory

Waste water2%
Stationary Fuel Use1%
Mobile Combustion7%
Agriculture (Crops)9%
Solid Waste Treatment (ICLEI)*2%
Purchased Electricity -All Other Sources
13%
Purchased Electricity -Commercial
38%
Purchased Electricity -Residential
28%
104,010Tons
108,300.17 Tonnes
GROSS GHG EMISSIONS
Greenhouse gas inventory

Greenhouse gas inventory
Mangrove Forests9%
Grasslands53%
Secondary Growth Forests
38%
-4,997.04Tons-4,997.04
Tons
GHG SINKS

103,577.49Tonnes CO2e
GROSS GHG EMISSIONS
108,300.17 Tonnes CO2eGHG SINKS
4,706.06 Tonnes CO2e
NET GHG EMISSIONS
Greenhouse gas inventory

40,000
60,000
80,000
100,000
120,000
140,000
2017
2022
2025
2030
Tonn
es C
O 2e
Tonnes CO2e
PROJECTED BUSINESS AS USUAL GHG EMISSIONS
126,438.75 Tonnes CO2e
BASELINE GHG EMISSIONS
103,577.49 Tonnes CO2e
TARGET GHG EMISSIONS BY 2030
49,156.74 Tonnes CO2e
61.13% target GHG reduction by 2030 relative to business as usual 2030 projected GHG emissions

Urban Adaptation Strategy

1Increasing forest cover
Enhance forest cover in upland areas to reduce runoff f in rivers and creeks during extreme rainfall events
Increase sinks for greenhouse gas sequestration
5Diversification of agricultureProduction system
Establish diversified food forest permaculture production systems more resilient to potential changes in climate
Increase sinks for for greenhouse gas sequestration
3Alternative Livelihood
Providing alternative sustainable livelihoods to fisherfolks, farmers and forest resource dependent families such as those related to tourism
4Risk Transfer
Crop Insurance to rice and coconut Farmers to protect them from extreme and seasonal temperature and rainfall events.
2Mangrove and Wetland Restoration
Restoring mangrove and wetlands to increase ecosystem and economic benefits to fisherfolks
Help filter runoff and sedimentation during extreme rainfall events and help protect sea grasses and coral reefs
SOUTH
1
1
1
2
2
3
3
3
4
5
5
5
5
Southern Barangays

1Compact Mix-use Rural Barangay Nodes
Designing compact and self supporting and reliant rural barangay centers capable to surviving prolonged isolation due to lahar flows
5Uninterrupted Rural-Urban Legazpi Connectivity
Development of alternative and redundant roads, bridges to ensure connectivity of the northern rural barangays to the urban center especially during extreme rainfall events
Establish sea ports and wharfs for emergency evacuation
3Climate Resilient Agriculture Production
Water impoundment facilities to accommodate possible changes in seasonal changes in rainfall patterns
Alternative agriculture crop production techniques that with minimal soil dependence such as hydroponics or aeroponics.
2Hybrid lahar protection structuresalong Riverside Areas
Designing hybrid protection structures to manage lahar flows.
Renaturing riverside areas prone to high levels of lahar
Can be developed as GHG sinks of the City.
Northern Barangays
4Alternative Livelihood for Rural Communities
Utilizing lahar deposits for prefabricated construction materials such as permeable tiles to locally produce cheap and readily available construction materials requirements of the regio.
11
1
2
2
2
3
3
33
4
4
4
4
5
5
5
5
5
5
5
5

1Restore biodiversity along the coast
Restoration of wetlands and mangroves to accommodate excess flood, filter surface waters to enhance water quality along the coast.
Increase sinks for greenhouse gas sequestration.
Increase ecosystem services derived from wetlands and mangroves
1 1
2Safe and resilient housing sites for the most vulnerable groups
Combining nature and engineering based solutions in the design of coastal defenses against sea level rise and storm surges
3Risk Transfer
Promote risk transfer mechanisms to reduce risks of extreme hazard events to people, buildings and its contents
4Hybrid protection structures
Combining nature and engineering based solutions in the design of coastal defenses against sea level rise and storm surges
4
5Climate proofing transportation networks
Road and bridge design to ensure uninterrupted access to all functional areas of the City
Planning road network to facilitate emergency evacuation and response
5
55
5
6Resilient Riverside Development
Treating rivers as integral part of the urban landscape and developing the area that can wiuthstand extreme hazard events
6
2
2
2
2
Urban Coastal Areas
3
3
3

6Establishment of additionalpublic open parks and spaces
Enhance forest cover in upland areas to reduce runoff f in rivers and creeks during extreme rainfall events
Increase sinks for greenhouse gas sequestration
7Increase water absorption capacity of the urban landscape
Encourage the use of permeable surfaces to increase water absorption of the urban landscape to reduce surface run-off.
Establishment of water impoundment parks to temporary detain water during extreme rainfall events
9Mix-usedevelopment districts
Establishing mix-use development districts in areas towards the airport area and Barangay Taysan to accommodate future urban use area requirements
8Managing Rainwater and surface run-off
Harvesting rainwater to augment local water supply and reduce surface runoff during extreme rainfall events
Swales and water impoundment in agricultural areas to augment water needs for irrigation
10Hazard ResilientStructures
Develop regulations and incentive mechanisms to increase structural hazard resilience of buildings to awithsatnd storm surges, floods and sea level rise.
7
7
7
7
8
8
8
9
9
9
9
10
10
6
6
6
6

14Redirecting development in relatively safer areas
Mix-use development districts in the Legazpi City Domestic Airport area.
City extension in Barangay Tagas.
12Green and climate adaptive buildings
Implement regulations to promote resource efficient buildings through proper building orientation relative to sun path and wind patterns, Increasing solar reflectance of buildings and promote green and white roofing sty
13Low carbon mass transport systems
Upgrading the mass transit system of Legazpi-Daraga.
Recommission the PNR lines for mass transport.
11Promote pedestrian suitable sidewalks and non-motorized mobility
Redesigning sidewalks to enhance the pedestrian experience and promote non-motorized mobility within the city.
15Further research to build climate information for local decision making
Conducting flood modelling studies, storm surge modelling and sea level rise site downscaling to inform local decision making and statutory planning.
11
11
11
12
12
12
13
13
13
14
14
14
14
15

0 1,000 2,000500
Meters
Tibu River Basin
Macabalo River Basin
Yawa River Basin
ALBAY GULF
URBAN ADAPTATION STRATEGYFLOOD HAZARD

0 1,000 2,000500
Meters
ALBAY GULF
1 Increasing forest cover
Enhance forest cover in upland areas to reduce volume and delay surface runoff during extreme rainfall events
URBAN ADAPTATION STRATEGYFLOOD HAZARD (RIVER BASIN PERSPECTIVE)
2 Water impoundment/Earth dams
Swales and earth dams in agricultural areas to detain rainwater
3 Water impoundment Public Parks
Swales and earth dams in agricultural areas to detain rainwater
4 Rainwater harvesting at the building level
Harvesting rainwater for non-potable domestic uses. Can also reduce demand on potable piped water.
6 Flood Resilient Building and site design
Designing sites and buildings that promotes structural resilience, safety of people and facilitates evacuation and rescue.
7 Reclaiming Wetlands
Utilizing wetlands as catchment of excess surface runoff and also to avoid future exposure of built spaces.
8 Legazpi-Daraga Policy Interfacing
Inter-city/municipality harmonization of urban design policies/regulations
5 Permeable urban landscape
Use of permeable tiles in the development of sidewalks, and open parking lots1
1
1
1
1
13
3
3
3
4
4
44
4
5
5
5
5

0 1,000 2,000500
Meters
ALBAY GULF
1 Increasing forest cover
Enhance forest cover in upland areas to reduce volume and delay surface runoff during extreme rainfall events
URBAN ADAPTATION STRATEGYFLOOD HAZARD (RIVER BASIN PERSPECTIVE)
2 Water impoundment/Earth dams
Swales and earth dams in agricultural areas to detain rainwater
3 Water impoundment Public Parks
Swales and earth dams in agricultural areas to detain rainwater
4 Rainwater harvesting at the building level
Harvesting rainwater for non-potable domestic uses. Can also reduce demand on potable piped water.
6 Flood Resilient Building and site design
Designing sites and buildings that promotes structural resilience, safety of people and facilitates evacuation and rescue.
7 Reclaiming Wetlands
Utilizing wetlands as catchment of excess surface runoff and also to avoid future exposure of built spaces.
8 Legazpi-Daraga Policy Interfacing
Inter-city/municipality harmonization of urban design policies/regulations
5 Permeable urban landscape
Use of permeable tiles in the development of sidewalks, and open parking lots
6
6
6
6
6
6
7
7
7
8

Urban Design Guide on Climate Resiliency

Redirecting urban developmentin relatively safer areas
Domestic Airport Mix-use district
Medium density mix use zones as alternative sites for residential and commercial urban uses
1
Old Albay District Corridor
In-filling and densification to accommodate residential, commercial and institutional zones in the coastal CBD port.
2
Uptown Legazpi City
New City Center that will accommodate the City and Regional Government Centers with adjacent mix use zones in anticipation of the new Bicol International Airport
3

Existing GHG Sinks Planned GHG SINKS Greenhouse Gas Sinks (4,272 Hectares)

GREENHOUSE GAS SINKS
FOOD FOREST SYSTEMS

WINDROSE DATA: MONTHLY WIND PATTERNS WIND DIRECTION AND SPEED
June-Septem
ber
October-May
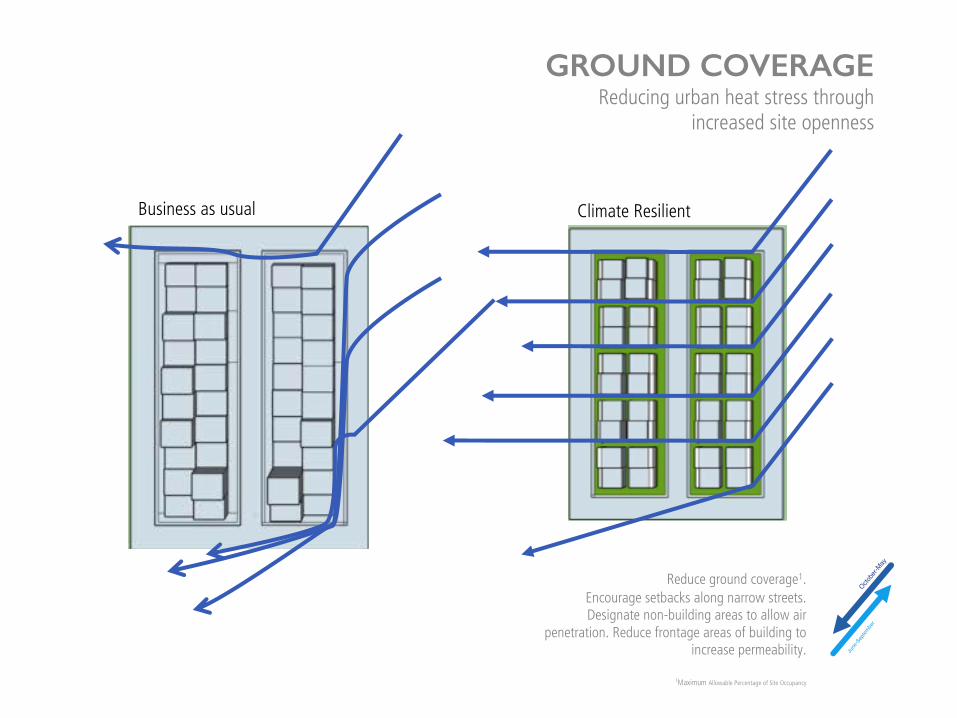
GROUND COVERAGEReducing urban heat stress through
increased site openness
Reduce ground coverage1.Encourage setbacks along narrow streets. Designate non-building areas to allow air
penetration. Reduce frontage areas of building to increase permeability.
1Maximum Allowable Percentage of Site Occupancy
Business as usual Climate Resilient

GREENHOUSE GAS SINKSBUILDING DESIGNReducing Heat gain of concrete facades
Increase Solar Reflectance of concrete facades
1
Green walls with passive rainwater irrigation system
2
Green roof4
White roof3

GREENHOUSE GAS SINKSURBAN GREENING
LANDSCAPES AND STREETSCAES
Emphasis on increasing tree shading along pedestrian walkways and property frontages
Promote suitable walkways to encourage non-motorized mobility
Reduce heat gain of buildings due to increased frontage natural tree shading
Added benefit of carbon sequestration, and reduced electricity consumption of buildings for cooling

URBAN GREENING
LANDSCAPES AND STREETSCAES
Use of permeable surfaces to reduce thermal mass of streetscapes
Increase water absorption of landscapes especially during extreme rainfall events
Recharges ground water aquifers
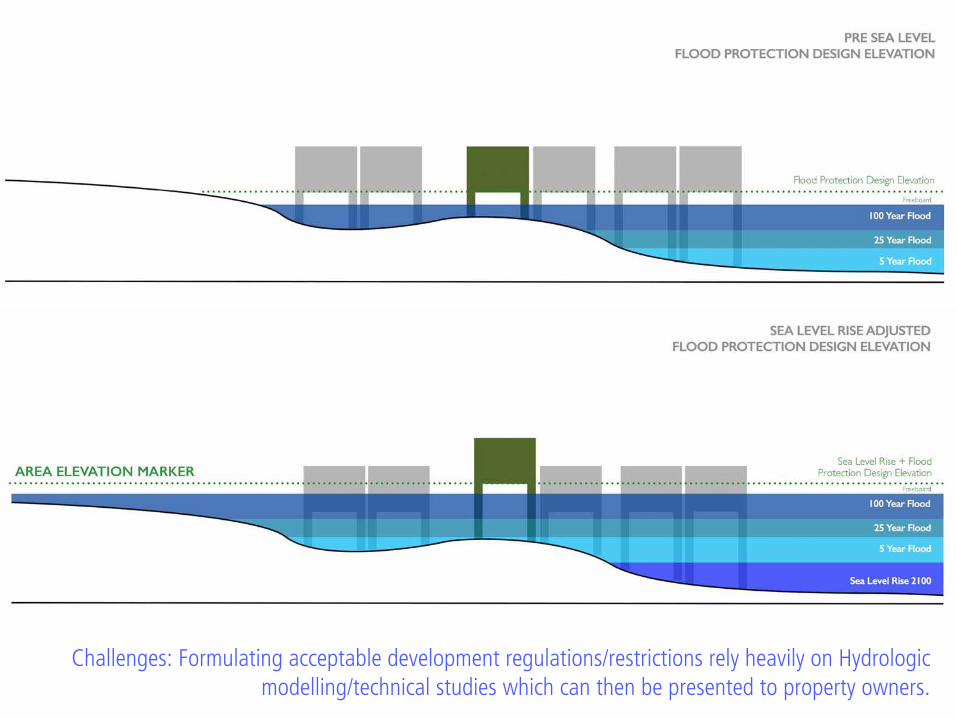
Challenges: Formulating acceptable development regulations/restrictions rely heavily on Hydrologic modelling/technical studies which can then be presented to property owners.

• Streets oriented parallel to coast• Coastal easements converted into
roads• People lose relationship with the
coast because of improperly designed coastal road infrastructure
• Buildings built without side setbacks restricts wind flow.
• Pedestrian access limited by the lack of side setbacks
• Streets oriented parallel to coast• Coastal easements converted into
roads• People lose relationship with the
coast because of improperly designed coastal road infrastructure
• Buildings built with side setbacks allowing wind flow
• Pedestrians can walk through setbacks during evacuation.
• frontages can be renatured for additional protection from storm surges
• Streets oriented perpendicular to coast
• Coastal easements remain at its natural state
• Buildings with frontages and rear setbacks allow wind to flow
• Roads facilitates evacuation away from the coastal easements and frontages can be renatured for additional protection from storm surges
ALBAY GULF

Business as usual (R-3 Basic)
• Treating rivers and creeks as property rear.• 3-Meter mandatory easements turned into engineered structures for riverbank protection• Limited to no access among non-residents• Lot sizes are small, the tendency is to maximize the building footprint (50 sq.m) • Limited perpendicular routes for evacuation
Rivers and creeks as property frontage (R-2 Basic)
• Frontage setbacks can be imposed on top of the 3-Meter mandatory easement, similar to property along roads.
• Frontages will be considered public open access spaces.
• Lot sizes are large enough to allow the imposition of front side and rear setbacks (192 sq.m).
• Perpendicular routes for evacuation using setbacks is possible.
• 3-meter mandatory setback can be renatured for erosion control and stabilization using appropriate landscaping.
Rivers and creeks as property frontage(R-3 Basic)
• Frontage setbacks can be imposed on top of the 3-Meter mandatory easement, similar to property along roads.
• Frontages will be considered public open access spaces.
• Lot sizes are small, the tendency is to maximize the building footprint (50 sq.m).
• Limited perpendicular routes for evacuation• 3-meter mandatory setback can be renatured
for erosion control and stabilization using appropriate landscaping.
1
1
2
23
3
Legazpi River/Creek Side

Legazpi River/Creek Side


City Government of LegazpiRepublic of the Philippines
https://legazpi.gov.ph
End of presentation