
Climate and behaviour in a Nordic city
13
Landscape and Urban Planning 82 (2007) 72–84 Climate and behaviour in a Nordic city Ingeg¨ ard Eliasson a,∗ , Igor Knez b , Ulla Westerberg b , Sofia Thorsson a,b , Fredrik Lindberg a a Urban Climate Group, Physical Geography, Department of Earth Sciences, G¨ oteborg University, Box 460, SE-405 30 G ¨ oteborg, Sweden b Department of Technology and Built Environment, University of G¨ avle, Box 88, SE-80176 G ¨ avle, Sweden Received 29 June 2006; received in revised form 25 January 2007; accepted 31 January 2007 Available online 13 March 2007 Abstract Four urban public spaces, representing various designs and microclimates, were investigated in Gothenburg, Sweden, in order to estimate how weather and microclimate affect people in urban outdoor environments. The research strategy was both multidisciplinary and interdisciplinary and included scientists from three disciplines: architecture, climatology and psychology. The project is based on common case studies carried out during four seasons, including measurements of meteorological variables, interviews and observations of human activity at each place. Multiple regression analysis of meteorological and behavioural data showed that air temperature, wind speed and clearness index (cloud cover) have a significant influence on people’s assessments of the weather, place perceptions and place-related attendance. The results support the arguments in favour of employing climate sensitive planning in future urban design and planning projects, as the physical component of a place can be designed to influence the site-specific microclimate and consequently people’s place-related attendance, perceptions and emotions. © 2007 Elsevier B.V. All rights reserved. Keywords: Public spaces; Urban climate; Climate planning; Environmental psychology; Environmental design 1. Introduction Scientists from a wide range of different disciplines includ- ing architecture, climatology, engineering and psychology have long been interested in how weather and climate affect people in the urban outdoor environment. Several factors have been shown to influence people’s perceptions and use of the outdoor envi- ronment, among them the design and function of the space, as well as the physiological and psychological parameters involved in human reactions to the physical environment. To date, most of the research has been carried out within the individual dis- ciplines. As a result, the different factors have been identified, but knowledge of their individual and combined influence is still lacking, since an integrated research approach is necessary for such analyses. ∗ Corresponding author. Tel.: +46 31 7732832; fax: +46 31 7731986. E-mail addresses: [email protected] (I. Eliasson), [email protected] (I. Knez), [email protected] (U. Westerberg), Sofi[email protected] (S. Thorsson), [email protected] (F. Lindberg). 1.1. Climate and urban design Two disciplines, architecture and urban design and urban cli- matology, dominate the published literature on how buildings and the urban environment affect climate (Mills, 1999). A key objective within architecture and urban design is the creation of a ‘comfortable’ living environment. Research on this topic often has a bioclimatic focus and an empirical and inferential approach and the results are normally presented as guidelines and real- world examples. In contrast, research in urban climatology, a special field within meteorology and climatology, focuses on measurements and the modelling of physical processes in order to interpret the changes in atmospheric properties that give rise to the “urban effect”. With some exceptions, research within urban climatology is not carried out for the purposes of design and the results obtained are often theoretical and not readily inter- pretable from a design perspective (Mills, 1999, 2006; Eliasson, 2000). Bioclimatic urban design is pointed out as a potential subject for research in which the combined skills of the climatologist and the designer can be beneficially employed. One of the classical 0169-2046/$ – see front matter © 2007 Elsevier B.V. All rights reserved. doi:10.1016/j.landurbplan.2007.01.020
Transcript of Climate and behaviour in a Nordic city
A
wadrsft©
K
1
ilttrwiocbls
((
0d
Landscape and Urban Planning 82 (2007) 72–84
Climate and behaviour in a Nordic city
Ingegard Eliasson a,∗, Igor Knez b, Ulla Westerberg b,Sofia Thorsson a,b, Fredrik Lindberg a
a Urban Climate Group, Physical Geography, Department of Earth Sciences, Goteborg University,Box 460, SE-405 30 Goteborg, Sweden
b Department of Technology and Built Environment, University of Gavle, Box 88, SE-80176 Gavle, Sweden
Received 29 June 2006; received in revised form 25 January 2007; accepted 31 January 2007Available online 13 March 2007
bstract
Four urban public spaces, representing various designs and microclimates, were investigated in Gothenburg, Sweden, in order to estimate howeather and microclimate affect people in urban outdoor environments. The research strategy was both multidisciplinary and interdisciplinary
nd included scientists from three disciplines: architecture, climatology and psychology. The project is based on common case studies carried outuring four seasons, including measurements of meteorological variables, interviews and observations of human activity at each place. Multipleegression analysis of meteorological and behavioural data showed that air temperature, wind speed and clearness index (cloud cover) have a
ignificant influence on people’s assessments of the weather, place perceptions and place-related attendance. The results support the arguments inavour of employing climate sensitive planning in future urban design and planning projects, as the physical component of a place can be designedo influence the site-specific microclimate and consequently people’s place-related attendance, perceptions and emotions.2007 Elsevier B.V. All rights reserved.
cholo
1
maoahawsmt
eywords: Public spaces; Urban climate; Climate planning; Environmental psy
. Introduction
Scientists from a wide range of different disciplines includ-ng architecture, climatology, engineering and psychology haveong been interested in how weather and climate affect people inhe urban outdoor environment. Several factors have been showno influence people’s perceptions and use of the outdoor envi-onment, among them the design and function of the space, asell as the physiological and psychological parameters involved
n human reactions to the physical environment. To date, mostf the research has been carried out within the individual dis-iplines. As a result, the different factors have been identified,ut knowledge of their individual and combined influence is still
acking, since an integrated research approach is necessary foruch analyses.∗ Corresponding author. Tel.: +46 31 7732832; fax: +46 31 7731986.E-mail addresses: [email protected] (I. Eliasson), [email protected]
I. Knez), [email protected] (U. Westerberg), [email protected]. Thorsson), [email protected] (F. Lindberg).
tctp2
ft
169-2046/$ – see front matter © 2007 Elsevier B.V. All rights reserved.oi:10.1016/j.landurbplan.2007.01.020
gy; Environmental design
.1. Climate and urban design
Two disciplines, architecture and urban design and urban cli-atology, dominate the published literature on how buildings
nd the urban environment affect climate (Mills, 1999). A keybjective within architecture and urban design is the creation of‘comfortable’ living environment. Research on this topic oftenas a bioclimatic focus and an empirical and inferential approachnd the results are normally presented as guidelines and real-orld examples. In contrast, research in urban climatology, a
pecial field within meteorology and climatology, focuses oneasurements and the modelling of physical processes in order
o interpret the changes in atmospheric properties that give rise tohe “urban effect”. With some exceptions, research within urbanlimatology is not carried out for the purposes of design andhe results obtained are often theoretical and not readily inter-retable from a design perspective (Mills, 1999, 2006; Eliasson,
000).Bioclimatic urban design is pointed out as a potential subjector research in which the combined skills of the climatologist andhe designer can be beneficially employed. One of the classical

d Ur
loirtitabesfcs
1
tTtW2wiiatCe1sr1lo2
naar(at(pmpPatYtebi
1
icbv(tutsr
2
2
pcabitca2
2
iprtimsAascdd1rs
2
g
I. Eliasson et al. / Landscape an
ines of research within human biometeorology is the devel-pment of comfort indices that model and predict the thermalnteraction between the human body and its surrounding envi-onment (e.g. Hoppe and Seidl, 1991). Over the years, outdoorhermal indices have been criticised mainly due to their inabil-ty to provide realistic assessment under transient exposure ando include psychological factors. As shown by Nikolopoulound Steemers (2003), only approximately 50% of the varianceetween objective and subjective comfort evaluations could bexplained by the physical and physiological conditions. Theyuggest other factors that could influence the tolerance intervalor thermal comfort, such as experience, expectations, sense ofontrol, the “naturalness” of the environment and the need fortimulation.
.2. Climate and human psychology
Research on how emotion, cognition and activity influencehe tolerance range for climate comfort is comparatively rare.he relation between functional use and microclimatic condi-
ions has been confirmed by several studies (e.g. Gehl, 1971;esterberg, 1994; Nikolopoulou et al., 2001; Zacharias et al.,
001; Thorsson et al., 2004, 2006) which show that comfortableeather conditions, i.e., high temperature and access to sunlight
ncreases the number of people present in an urban space. Stud-es also show that both too cold and too warm conditions havenegative influence on the emotional state, which in turn tends
o trigger aggressive behaviour (e.g. Cohn, 1993; Simister andooper, 2005). Emotional and cognitive research suggests thatmotional states can influence cognitive processes (e.g. Blaney,986; Kuiken, 1991). If climate is a moderator of emotionaltate, then it is likely that it also affects other aspects of the envi-onmental experience, such as the visual aesthetics (e.g. Gifford,980; Knez and Thorsson, 2006). There also appears to be aink between thermal comfort and some psychological aspectsf the environmental experience (see Knez and Thorsson,006).
The concept of space, comprising physical and spatial con-otations, has traditionally been used in geographical andrchitectural discourse. It does not include the psychologicalnd social aspects of spatial experiences and has therefore beenedefined in environmental psychology by the notion of placee.g. Graumann, 2002). Several authors have sketched similarccounts of the theory of a place (e.g. Canter, 1977) comprisinghree key components: physical (form and space), functionalactivities) and psychological (meanings people assign to alace) aspects. Canter (1997) has further developed his earlierodel into four “facets” of place: functional differentiation,
lace objectives, scale of interaction and aspects of design.lace objectives extend the previous psychological (individual)spects by including both social and cultural components, whilehe scale of interaction addresses the environmental aspects.et, as pointed out by Knez (2005), an insufficiency in these
heoretical accounts is the omission of climate, which influ-nces individual, social, economic (Parker, 1995), and criminalehaviour (Rotton and Cohn, 2002) and memories of, and mean-ngs we attribute to places (Knez, 2006).
amta
ban Planning 82 (2007) 72–84 73
.3. The purpose of this paper
This paper describes an investigation of urban public placesn relation to micrometeorological variations and human per-eptions of climate. The study combines meteorological andehavioural data in an analysis of the impact of three weatherariables (clearness index (CI), air temperature (Ta) and windw)) on participants’ perceptions of current weather and onheir behavioural, aesthetical and emotional assessments of fourrban public spaces. The main goal of the investigation waso test the hypothesis that the three weather variables have aignificant influence on peoples’ weather assessments and place-elated perceptions, emotions and attendance.
. Methods
.1. An integrative research approach
The present study is part of the “Urban Climate Spaces”roject, involving scientists from the fields of climatology, psy-hology and architecture. The project has an integrative researchpproach with a common goal: its aim is to traverse disciplinaryoundaries in order to develop integrated knowledge and theory,.e., to conduct interdisciplinary work (Tress et al., 2004) forhe purposes of analysing the complex relational links betweenlimate and human behaviour and its implications for sustain-ble urban design (Knez, 2005, 2006; Knez and Thorsson, 2006,007; Lindberg, 2005; Thorsson et al., 2006).
.2. Case studies
Case studies were conducted in the city of Gothenburg, whichs located at latitude 57◦N on the Swedish west coast. Four urbanublic spaces with different design and varying microclimatesanging from an exposed waterfront plaza and large open squareo a park with shading trees and a small sheltered courtyard werencluded in the study (Fig. 1). Micrometeorological measure-
ents, observations and structured interviews were conductedimultaneously during four case studies (October 2003, January,pril and June 2004). Each study period included five days overperiod of two weeks. The aim was to find 5 days in each sea-
on with different weather, with respect to air temperature, cloudover and wind speed. Rainy days were excluded. In total, 20ays of measurements, observations and interviews were con-ucted in Gothenburg. The case studies were performed between1 a.m. and 3 p.m. Solar radiation and temperature normallyeach their daily maxima during this period, and the places undertudy are frequently used by people.
.3. Micrometeorological measurements
The air temperature and relative humidity (Rotronic YA-100),lobe temperature (AMR Pt100 PK24) as well as incoming short
nd long wave radiation (Kipp and Zonen CM3 and CG1) wereeasured at a height of 1.1 m above the ground, correspondingo the average height of the centre of gravity for adults (Mayernd Hoppe, 1987). Wind speed and direction (Gill Ultransonic)

74 I. Eliasson et al. / Landscape and Urban Planning 82 (2007) 72–84
the ch
wsTabc1gatvl
2
espq
aqtru(aawdarp“w
5aTpt((2(ptgsowihM
2
g(obdqdivt
Fig. 1. Photographs of the four study areas and
ere measured at a height of 2 m and later recalculated to repre-ent a measurement height of 1.1 m using Sverdrup’s power law.he instruments were mounted on two carriers. One carrier waslways situated at the square, while the other was rotated dailyetween the three other study areas. The clearness index (CI) wasalculated from radiation measurements (Kipp and Zonen, CNR) at a reference station located above roof level (32 m aboveround). The clearness index is defined as the ratio betweenmeasured and a theoretical maximum incoming solar radia-
ion for a specific time and location on the earth’s surface. Highalues of CI (e.g. >0.75) represents clear sky conditions, whileower values represent more cloudy conditions.
.4. Observations and structured interviews
Observations of human activity and behaviour were madevery 20 min, at the same time as the meteorological mea-urements and interviews. Physical activity, i.e., the number ofeople lying, sitting, standing and walking as well as visibleualifications such as eating, talking and reading were observed.
The structured interview contained eight main questionsbout demographic variables, clothing, general and specificuestions about current weather, behaviour, feelings and atti-udes related to the site (Thorsson et al., 2006). People wereandomly approached and the questionnaire took about five min-tes to complete. A total of 1379 people participated in the study560 at the square, 351 at the courtyard, 266 in the park and 202t the waterfront plaza). There were similar numbers of womennd men visiting each place. About 80% of the participantsere between 21 and 65 years of age. Three main measures ofependency, that is, three questions from the questionnaire werenalysed in this study. These concerned the estimations of cur-
ent weather and the behavioural and perceptual dimensions of alace. The first question was related to the current weather, i.e.,What is your perception of the weather today?”. Participantsere asked to respond to three 5-point scales ranging from 1 toctos
aracteristics of the microclimate at each place.
: (1) calm–windy, (2) cold–warm and (3) good–bad for outdoorctivity (see Knez and Thorsson, 2006; Thorsson et al., 2006).he second question was related to the place, i.e., “What is yourerception of the place at this moment?”. Participants were askedo respond according to four 5-point scales ranging from 1 to 5:1) ugly–beautiful, (2) unpleasant–pleasant, (3) windy–calm and4) cold–warm (see Knez and Thorsson, 2006; Thorsson et al.,006). The third question was related to the emotional states ofde)activation and (dis)pleasure, i.e., “How do you feel in thislace at this moment?” Participants had to respond accordingo four 5-point scales ranging from 1 to 5: (1) elated–bored, (2)lad–gloomy, (3) calm–nervous, and (4) active–passive. Thesecales were derived from the Knez and Hygge (2001) measuref the current effect. In connection to this question participantsere also asked to estimate their thermal comfort by respond-
ng according to a 9-point scale ranging from very cold to veryot, with the score 5 indicating “comfortable” (Matzarakis andayer, 1996).
.5. Multiple regression analyses
Multiple regression analyses were performed to investi-ate the influence of the three independent physical variablesclearness index, CI; air temperature, Ta; wind speed, w)n the participants’ evaluations of current weather and theirehavioural and perceptual estimations of each place (the depen-ent variables i.e. the three above-mentioned questions from theuestionnaire). This statistical technique may be viewed as aescriptive and/or inferential instrument by which the (linear)nfluence of the three independent variables on each dependentariableis evaluated collectively and separately. In other words,he amount of variance in a dependent variable (criterion) that
ould be attributed to the three independent variables (predic-ors) jointly and separately was analysed. The analysis is basedn 1-min mean data for wind speed, the air temperature mea-ured at each site and 5-min mean data for the clearness index;
d Ur
twiIaamfciw1dvl
3
tsdha
3
maudeJ
Fmmc
damtttt
ncii
stdaFtmt((p
iwtohf
I. Eliasson et al. / Landscape an
he index was calculated from radiation measurements whichere taken at the roof of the reference station. The meteorolog-
cal data were synchronised to the start time of each interview.t must be noted that 5-min mean data for wind speed were alsonalysed, however there was no difference between these resultsnd those obtained using the 1-min mean data. In order to deter-ine whether the independent variables correlated, i.e., to check
or multicollinearity, the variance inflation factor (VIF) was cal-ulated. Multicollinearity would result in a greater error variancen the multiple regression model and is considered to be severehen VIF is greater than 10 (e.g. Pfaffenberger and Patterson,987). However, the results of the multiple regression analysesescribed below showed VIFs between 1.1 and 1.9, indicating aery low (and for the multiple regression models, satisfactory)evel of intercorrelation between the independent variables.
. Results
The results are reported and discussed with a focus on each ofhe four urban public spaces. Results from the multiple regres-ion analyses are presented in Tables 2–13 for each place andependent variable (question from the questionnaire). Due to theuge amount of statistical data involved, only significant resultsre discussed.
.1. Meteorological statistics
The city of Gothenburg is located on the outskirts of thearine west-coast climate region and has a mean air temper-
ture of 16.3 ◦C in July and −0.5 ◦C in January (Fig. 2). The
pper diagram in Fig. 2 also shows the range around the meanaytime maximum air temperature value, measured at the refer-nce station during the four case study periods in January, April,une and October. The mean daytime maximum air temperatureig. 2. Upper diagram: monthly mean air temperature and mean daily mini-um and maximum temperature in Gothenburg (1961–1990). The average dailyaximum air (Ta) during the measurement is also included. Lower diagram: the
learness index (CI) during the field measurements.
d
omepwwaHF
3
3t
tit
bYiiw
ban Planning 82 (2007) 72–84 75
uring the case studies in winter (January), summer (June) andutumn (October) were low in comparison to the 30-year dailyaximum value for Gothenburg. In fact, the coldest event in
he month of October since 1901 (−8.5 ◦C) occurred duringhe autumn measurements. On the other hand, the mean day-ime maximum air temperature during the spring measurementsaken in April were higher than the 30-year mean value (Fig. 2).
The lowest diagram in Fig. 2 shows the variation of the Clear-ess Index during the four case studies. The autumn case studyovers the widest range of CI, followed by the winter case studyn January. In comparison, the spring and summer case studiesncluded more days with clear skies (Fig. 2).
The air temperature variation within each study area for eacheason is showed in Fig. 3a. It is notable that the air tempera-ure during the summer case study is only slightly higher thanuring the spring case studies which is an effect of the unusu-lly warm April in 2004 as shown previously in Fig. 2. Fromig. 3a, it is evident that the air temperature variation between
he different study areas is very small for all seasons. However,easurements at the square show somewhat higher maximum
emperatures, especially during winter and spring case studiesFig. 3a). The variable weather during the autumn case studyFig. 2) is reflected in the range of the air temperature at the fourlaces (Fig. 3a).
The variation in wind speed within each place for each seasons shown in Fig. 3b. The mean wind speed was much higher at theaterfront in comparison to the other three places, especially in
he summer, due to one windy day. On this day – but also at mostther days – the wind speed at the waterfront plaza was almost asigh as at the reference station. This was probably due to largeetch distances from the western to northern to north-easterlyirections at the waterfront plaza.
The largest variation in wind speed between the four placesccurred during the winter case study (Fig. 3b). The highestean wind speed was recorded in the park; however, the high-
st maximum wind speed value was recorded at the waterfrontlaza. During the other three seasons, the wind speed variationas relatively small between the square, park and courtyard. Theind speed values shown in Fig. 3b are generally below 4 m/s
nd are often less than 2 m/s, which may appear to be low values.owever, it must be remembered that the wind speed values inig. 3b were measured at a height of 2.0 m above ground.
.2. Results from study area 1: the square
.2.1. Question 1: “What is your perception of the weatheroday?”
The results of the multiple regression analysis showed thathe number of people (attendance) in the square increased withncreasing clearness index (β = 0.18) and at higher air tempera-ures (β = 0.51), with R2 = 0.33 (see Table 1).
Technically, β shows the direction and strength of the slopeetween Y and X and R2 indicates how much of the variance in
is explained by X. Thus the results indicate that the clearnessndex and air temperature accounted for 33% of the variancen attendance at the square. The results also show that theind speed and the air temperature had a significant influence

76 I. Eliasson et al. / Landscape and Urban Planning 82 (2007) 72–84
Fig. 3. Upper diagram (a) shows box plots of air temperature (Ta) and lower diagram (b) shows box plots of wind speed (w) from the four study areas in Gothenburgduring the field measurements (N = number of days). The bottom and top edges of the boxes represent the 25th and 75th percentiles, respectively. The “whiskers”extend to the 5th and 95th percentiles. The “+” sign indicates the minimum and maximum values.
Table 1Results from multiple regression analyses (N = 560) on the influence of the clearness index (CI = 0.1–0.91), wind speed (w = 0.35–8.2 ms−1) and air temperature(Ta = −7.1 to 20.98 ◦C) on the total attendance and perceived “current weather” at the square
Dependent variable R2 Beta df MS F p
Total attendance .33 3,174 10,929.8 28.56 .000-CI .18 .009-Ta .51 .000
Calm–windy .17 3,559 62.11 39.09 .000-w .33 .000-Ta .15 .000
Cold–warm .39 3,559 116.66 120.62 .000-w −.19 .000-Ta .65 .000
Good–bad for outdoor activity .15 3,559 35.62 31.31 .000-CI −.23 .000-w .15 .001-Ta −.21 .000

I. Eliasson et al. / Landscape and Urban Planning 82 (2007) 72–84 77
Table 2Results from multiple regression analyses (N = 560) on the influence of the clearness index (CI = 0.1–0.91), wind speed (w = 0.35–8.2 ms−1) and air temperature(Ta = −7.1 to 20.98 ◦C) on the perceived “place right now” at the square
Dependent variable R2 Beta df MS F p
Ugly–beautiful .06 3,559 12.95 10.84 .000-w −.18 .000-Ta .15 .002
Unpleasant–pleasant .07 3,559 13.01 13.06 .000-CI .10 .030-Ta .22 .000
Windy–calm .11 3,559 34.34 21.68 .000-CI .15 .001-w −.22 .000-Ta −.10 .023
Cold–warm .14 3,557 45.05 29.55 .000-CI .19 .000-w −.11 .016
o“tsiawcew(
3t
bt
tf
mnmqmupvapel
3m
TR(
D
E
G
C
C
-Ta .27
n the participants’ assessments of the current weather on thecalm–windy” and “cold–warm” dimensions. More precisely,he current weather was estimated as warmer at lower windpeeds and higher air temperatures, and 39% of the variancen this type of weather estimation was due to the wind andir temperature. The current weather was estimated as calmerhen both the wind speed and air temperature decreased, indi-
ating a relatively low R2 value of 0.17. In addition, participantsstimated weather as being better for outdoor activity at timesith clear skies, high air temperature and decreasing wind speed
R2 = 0.15).
.2.2. Question 2: “What is your perception of the place athis moment?”
Results showed that the participants perceived the square toe more beautiful at times with low wind speed and high air
emperatures, indicating a low R2 value of 0.06 (see Table 2).Regarding the R2 values, it must be noted that results relatedo the aesthetical evaluations of the places and how participantselt at these places are generally low (see Tables 3 and 4). This
itws
able 3esults from multiple regression analyses (N = 560) on the influence of the clearnes
Ta = −7.1 to 20.98 ◦C) on the perceived “feelings right now” at the square
ependent variable R2 Beta
lated–bored .04-CI −.13-Ta −.14
lad–gloomy .04-Ta −.17
alm–nervous .03-Ta −.16
omfort scale .11-w −.17-Ta .27
.000
eans that although the weather parameters are shown to sig-ificantly influence the dependent variables, they do not explainuch of the variance in these measurements. Such a result is
uite common in behavioural sciences due to the: (a) measure-ent errors in subjective assessment and (b) the large body of
ncontrolled variables that may also have influenced the partici-ants’ aesthetical assessments and why they felt as they did whenisiting a place. As shown in Table 2, the square was also rateds being more pleasant when the clearness index and air tem-erature increased. The results also show that the participantsstimated this place as being more calm and warm at times withow wind speeds, clear skies and low air temperature.
.2.3. Question 3: “How do you feel in this place at thisoment?”As shown in Table 3, the participants felt more positive (that
s, more elated, happier, calmer) in the square at higher airemperatures. In addition, they felt more elated on occasionsith clear skies and more thermally comfortable at lower wind
peeds.
s index (CI = 0.1–0.91), wind speed (w = 0.35–8.2 ms−1) and air temperature
df MS F p
3,558 6.98 8.3 .000.005.004
3,558 6.23 7.29 .000.000
3,558 5.3 6.02 .000.001
3,270 11.17 10.75 .000.004.000

78 I. Eliasson et al. / Landscape and Urban Planning 82 (2007) 72–84
Table 4Results from multiple regression analyses (N = 351) on the influence of the clearness index (CI = 0.06–0.89), wind speed (w = 0.55–3.62 ms−1) and air temperature(Ta = −7.9 to 17.45 ◦C) on the total attendance and perceived “current weather” at the courtyard
Dependent variable R2 Beta df MS F p
Total attendance .49 365 2883.19 20.17 .000-CI .20 .043-w −.32 .001-Ta .63 .000
Calm–windy .20 3,350 37.3 28.21 .000-w .30 .000-Ta .25 .000
Cold–warm .37 3,350 59.99 67.27 .000-CI −.16 .000-w −.12 .008-Ta .65 .000
G
3
3t
ir(
cwhava“wof
3t
a
tbi
paa
3m
atc
3
3t
i
TR(
D
U
U
W
ood–bad for outdoor activity .13-CI −.22-Ta −.26
.3. Results from study area 2: the courtyard
.3.1. Question 1: “What is your perception of the weatheroday?”
The results showed that the total attendance at the courtyardncreased when the wind ceased and the air temperature and solaradiation increased, accounting for almost 50% of the variancesee Table 4).
The results also showed that the participants perceived theurrent weather to be warmer and better for outdoor activityhen the air temperature rose. The current weather, on the otherand, was perceived as being colder at higher wind speeds, lowerir temperature and with clearer skies, accounting for 37% of theariance. Participants assessed the weather as being more windyt higher wind speeds. However, the analysis also showed thatwindy weather” can be related to an increase in air temperature,hich is probably a local, place-related phenomenon. It was alsobserved that clear sky weather was perceived to be importantor outdoor activity.
.3.2. Question 2: “What is your perception of the place athis moment?”
The results showed that the participants rated the courtyards being more beautiful at higher wind speeds and lower air
TrIa
able 5esults from multiple regression analyses (N = 351) on the influence of the clearness
Ta = −7.9 to 17.45 ◦C) on the perceived “place right now” at the courtyard
ependent variable R2 Beta
gly–beautiful .04-w .20-Ta −.12
npleasant–pleasant .03-CI .14-w .14
indy–calm .07-w −.16-Ta −.16
3,350 15.79 17.89 .000.000.000
emperatures (see Table 5). The courtyard was also assessed aseing a more pleasant place when the wind speed and clearnessndex increased.
The participants assessed the courtyard as being a calmerlace when the wind speed decreased, but lower air temperatureslso turned out to have a significant influence on the participants’ssessment of this place’s “windiness”.
.3.3. Question 3: “How do you feel in this place at thisoment?”As shown in Table 6, the participants felt happier and calmer
t lower wind speeds at the courtyard. The results also showedhat they felt more active at the courtyard during conditions withlear skies and high temperatures.
.4. Results from study area 3: “the park”
.4.1. Question 1: “What is your perception of the weatheroday?”
The results showed that the total attendance in the parkncreased at times when the weather was warm (see Table 7).
he results also showed that the participants assessed the cur-ent weather as being more windy when wind speed increased.n addition, they perceived the current weather to be warmer asresult of higher air temperature.
index (CI = 0.06–0.89), wind speed (w = 0.55–3.62 ms−1) and air temperature
df MS F p
3,350 3.22 5.19 .002.000.044
3,350 1.52 4.07 .007.013.013
3,350 11.69 8.11 .000.003.005

I. Eliasson et al. / Landscape and Urban Planning 82 (2007) 72–84 79
Table 6Results from multiple regression analyses (N = 351) on the influence of the clearness index (CI = 0.06–0.89), wind speed (w = 0.55–3.62 ms−1) and air temperature(Ta = −7.9 to 17.45 ◦C) on the perceived “feelings right now” at the courtyard
Dependent variable R2 Beta df MS F p
Glad–gloomy .02 3,350 1.58 2.61 .051-w −.13 .017
Calm–nervous .02 3,350 1.76 2.79 .040-w −.16 .005
Active–passive .08 3,350 17.77 10.35 .000-CI .17 .001-Ta .19 .001
Table 7Results from multiple regression analyses (N = 266) on the influence of the clearness index (CI = 0.13–0.91), wind speed (w = 0.45–3.92 ms−1) and air temperature(Ta = −3.6 to 20.87 ◦C) on the total attendance and perceived “current weather” in the park
Dependent variable R2 Beta df MS F p
Total attendance .36 3,56 517.21 9.71 .000-w .27 .020-Ta .57 .000
Calm–windy .28 3,265 47.67 33.95 .000-w .53 .000
Cold–warm .66 3,265 98.98 167.35 .000-w .09 .026-Ta .82 .000
Good–bad for outdoor activity .13 3,265 10.66 12.57 .000-CI −.18 .005
“t
3t
baw
ttt
3m
TR(
D
U
W
C
-w .16-Ta −.14
The participants also assessed the current weather as beinggood for outdoor activity” at times with clear skies, high airemperatures and low wind speeds.
.4.2. Question 2: “What is your perception of the place athis moment?”
The results showed that the participants perceived the park toe a more beautiful place on occasions with clear skies and lowir temperatures (see Table 8). Low wind speeds and clear skiesere shown to have a significant influence on the perceptions of
gtt
able 8esults from multiple regression analyses (N = 266) on the influence of the clearness
Ta = −3.6 to 20.87 ◦C) on the perceived “place right now” in the park
ependent variable R2 Beta
gly–beautiful .05-CI .13-Ta −.16
indy–calm .26-CI .12-w −.45
old–warm .24-CI .26-w −.27-Ta .12
.014
.020
he park as a “calm” and “warm” place. The results also showedhat the park was evaluated as a “warm” place at higher airemperatures.
.4.3. Question 3: “How do you feel in this place at thisoment?”
As shown in Table 9, the participants felt more bored andloomy at times when the sky was cloudy in the park. In addition,he participants felt more passive on occasions with high airemperature.
index (CI = 0.13–0.91), wind speed (w = 0.45–3.92 ms−1) and air temperature
df MS F p
3,265 4.04 4.85 .003.051.021
3,263 42.69 31.10 .000.049.000
3,264 35.88 27.76 .000.000.000.033

80 I. Eliasson et al. / Landscape and Urban Planning 82 (2007) 72–84
Table 9Results from multiple regression analyses (N = 266) on the influence of the clearness index (CI = 0.13–0.91), wind speed (w = 0.45–3.92 ms−1) and air temperature(Ta = −3.6 to 20.87 ◦C) on the perceived “feelings right now” in the park
Dependent variable R2 Beta df MS F p
Elated–bored .03 3,263 2.51 2.78 .041-CI −.18 .007
Glad–gloomy .05 3,265 2.48 4.32 .005-w −.18 .008
Active–passive .19 3,264 33.41 19.88 .000-Ta .43 .000
Comfort scale .05 3,159 2.98 2.68 .049-w .17 .042
Table 10Results from multiple regression analyses (N = 202) on the influence of the clearness index (CI = 0.09–0.84), wind speed (w = 0.42–9.47 ms−1) and air temperature(Ta = −2.89 to 16.91 ◦C) on the total attendance and perceived “current weather” at the waterfront plaza
Dependent variable R2 Beta df MS F p
Total attendance .22 3,45 75.67 3.9 .015-w −.43 .028-Ta .56 .004
Calm–windy .36 3,201 45.51 36.73 .000-CI −.23 .000-w .58 .000
Cold–warm .23 3,201 16.71 19.80 .000-w −.26 .002-Ta .60 .000
G
3
3t
whpa
rwr
3t
pa“w
3
TR(
D
U
W
C
ood–bad for outdoor activity .19-CI −.41-w .30
.5. Results from study area 4: the waterfront plaza
.5.1. Question 1: “What is your perception of the weatheroday?”
The results showed that the number of participants at theaterfront plaza increased at times with lower wind speeds andigher temperatures (see Table 10). At this place, the partici-ants perceived the current weather to be more windy, coldernd worse for outdoor activity when the wind speed increased.
Clearer skies, however, led the participants to assess the cur-ent weather as being calmer and better for outdoor activity. Theeather was perceived to be warmer when the air temperature
ose.
m
dv
able 11esults from multiple regression analyses (N = 202) on the influence of the clearness
Ta = −2.89 to 16.91 ◦C) on the perceived “place right now” at the waterfront plaza
ependent variable R2 Beta
gly–beautiful .04-w .27-Ta −.21
indy–calm .21-CI .19-w −.43
old–warm .05-CI .19
3,201 14.80 15.89 .000.000.000
.5.2. Question 2: “What is your perception of the place athis moment?”
As shown in Table 11, the participants assessed the waterfrontlaza as being more beautiful at higher wind speeds and lowerir temperature. The waterfront plaza was also assessed as awarmer” and “calmer” place on occasions with clear skies andhen the wind speed increased.
.5.3. Question 3: “How do you feel in this place at this
oment?”The results showed that only the active–passive behaviouralimension was significantly influenced by the three weatherariables (see Table 12). More precisely, the participants at the
index (CI = 0.09–0.84), wind speed (w = 0.42–9.47 ms−1) and air temperature
df MS F p
3,201 2.82 2.98 .033.004.022
3,201 23.06 17.04 .000.005.000
3,201 3.81 3.23 .024.008
I. Eliasson et al. / Landscape and Urban Planning 82 (2007) 72–84 81
Table 12Results from multiple regression analyses (N = 202) on the influence of the clearness index (CI = 0.09–0.84), wind speed (w = 0.42–9.47 ms−1) and air temperature(Ta = −2.89 to 16.91 ◦C) on the perceived “feelings right now” at the waterfront plaza
Dependent variable R2 Beta df MS F p
Active–passive .10 3, 201 13.49 7.64 .000-CI .18-w −.20-Ta .38
Ft
wt
4
tcwama(
4
atgTwitvt(
pati
iTELwccdsaass
Fr
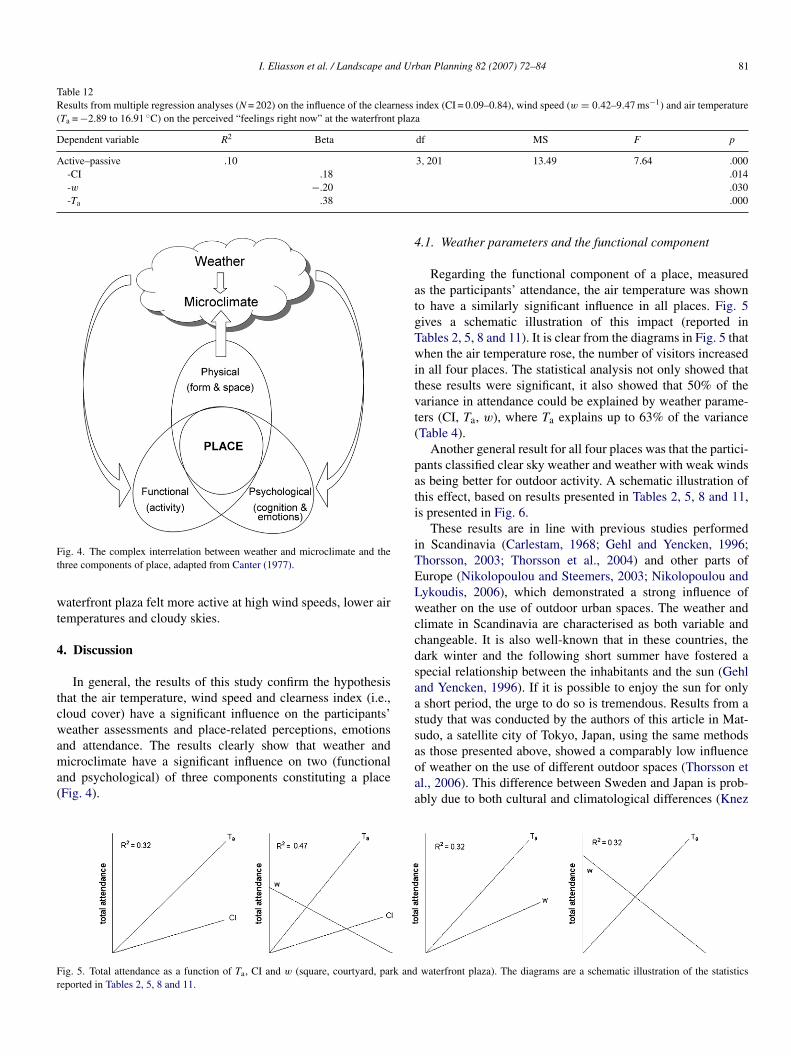
ig. 4. The complex interrelation between weather and microclimate and thehree components of place, adapted from Canter (1977).
aterfront plaza felt more active at high wind speeds, lower airemperatures and cloudy skies.
. Discussion
In general, the results of this study confirm the hypothesishat the air temperature, wind speed and clearness index (i.e.,loud cover) have a significant influence on the participants’eather assessments and place-related perceptions, emotions
nd attendance. The results clearly show that weather andicroclimate have a significant influence on two (functional
nd psychological) of three components constituting a placeFig. 4).
aoaa
ig. 5. Total attendance as a function of Ta, CI and w (square, courtyard, park andeported in Tables 2, 5, 8 and 11.
.014
.030
.000
.1. Weather parameters and the functional component
Regarding the functional component of a place, measureds the participants’ attendance, the air temperature was showno have a similarly significant influence in all places. Fig. 5ives a schematic illustration of this impact (reported inables 2, 5, 8 and 11). It is clear from the diagrams in Fig. 5 thathen the air temperature rose, the number of visitors increased
n all four places. The statistical analysis not only showed thathese results were significant, it also showed that 50% of theariance in attendance could be explained by weather parame-ers (CI, Ta, w), where Ta explains up to 63% of the varianceTable 4).
Another general result for all four places was that the partici-ants classified clear sky weather and weather with weak windss being better for outdoor activity. A schematic illustration ofhis effect, based on results presented in Tables 2, 5, 8 and 11,s presented in Fig. 6.
These results are in line with previous studies performedn Scandinavia (Carlestam, 1968; Gehl and Yencken, 1996;horsson, 2003; Thorsson et al., 2004) and other parts ofurope (Nikolopoulou and Steemers, 2003; Nikolopoulou andykoudis, 2006), which demonstrated a strong influence ofeather on the use of outdoor urban spaces. The weather and
limate in Scandinavia are characterised as both variable andhangeable. It is also well-known that in these countries, theark winter and the following short summer have fostered apecial relationship between the inhabitants and the sun (Gehlnd Yencken, 1996). If it is possible to enjoy the sun for onlyshort period, the urge to do so is tremendous. Results from a
tudy that was conducted by the authors of this article in Mat-udo, a satellite city of Tokyo, Japan, using the same methods
s those presented above, showed a comparably low influencef weather on the use of different outdoor spaces (Thorsson etl., 2006). This difference between Sweden and Japan is prob-bly due to both cultural and climatological differences (Knezwaterfront plaza). The diagrams are a schematic illustration of the statistics

82 I. Eliasson et al. / Landscape and Urban Planning 82 (2007) 72–84
F nd w
i
abR
4
hclooateiwbhm
plitboimat
i
Ffs
htTimtpbbubeaspros
wjoT
4
pw
ig. 6. Plots of good–bad settings for outdoor activity as a function of Ta, CI allustration of the statistics reported in Tables 2, 5, 8 and 11.
nd Thorsson, 2007). Large differences in comfort conditionsetween different cities in Europe were also reported from theUROS project (Nikolopoulou and Lykoudis, 2006).
.2. Weather parameters and the psychological component
It is known that architects, urban planners and climatologistsave long argued that climate-related issues are important fority life. But how do the people living in the city, i.e., “the pub-ic”, relate to climatic elements, and are weather and climatef any importance to an individual (Eliasson, 2000)? Basedn the results presented in this study, this question must benswered in the affirmative. It is very clear from the study thathe people visiting the four places do care about, and are influ-nced by, the weather and climate. Thus, weather parameters aremportant—not only did they influence the number of peopleho visited the spaces and whether they assessed the weather aseing good or bad for outdoor activity, but they also influencedow people assessed the places and how being in these placesade them feel, i.e., the psychological component of a place.Concerning the psychologically-related results, and as
ointed out in Section 3, it must be noted that only tentativeinks between participants’ behaviour, weather and place werendicated, due to the low R2 values. This type of result is relatedo measurement errors in subjective assessment and to the largeody of uncontrolled variables that may also have had an impactn participants’ psychological responses. An interesting results that the open, exposed waterfront plaza was estimated to be
ore beautiful as a result of high wind speed and low air temper-
tures, as shown in Fig. 7. Participants also felt more active whenhere was higher wind speed in the waterfront plaza (Table 2).In contrast, participants visiting the open square estimatedt to be more beautiful as a result of lower wind speeds and
ig. 7. Ugly–beautiful as a function of w at the square (left diagram) and water-ront plaza (right diagram). The diagrams are a schematic illustration of thetatistics reported in Tables 3, 6, 9 and 12.
modtalccshad
fspt
(square, courtyard, park and waterfront plaza). The diagrams are a schematic
igher air temperatures. A tentative explanation is that wind athe waterfront renders a positive aesthetic and symbolic value.his place gains life through the natural elements reflected
n the water and the activities at the adjacent marina becomeore interesting to look at on a windy day. The attraction of
he square, and to some extent even the park, are other peo-le. The typical park or square activities are merely reducedy the wind. This corresponds with the theory put forwardy Westerberg (1994), who illustrated that gustiness caused bynsuitable building geometry was disliked much more than thelustery winds on hilltops or natural maritime settings, whereven “bad” weather would become an attraction. Nikolopoulound Steemers (2003) arrive at the same conclusions: in urbanpaces with high amounts of natural characteristics such asarks, the tolerance to widespread changes in the physical envi-onment is high, provided they are produced naturally. Severalther studies show that the experience of nature in the city is aource of positive feelings (e.g., Chiesura, 2004).
The results also show that feelings of pleasantness increaseith higher clearness index. Clear skies also increased the sub-
ective weather-related assessments of warmth and calm in threef the four urban spaces (square, park and waterfront plaza,able 1).
.3. Weather parameters and the physical component
Weather and climate influence the physical component of alace. However, as illustrated in Fig. 4, the relationships alsoork in the opposite direction. A building’s shape, orientation,aterial, colour, etc., influence radiation, temperature, wind and
ther parameters, to produce a site-specific microclimate. Urbanesigners/planners are thus able to create urban environmentshat take advantage of the positive effects of the existing weathernd climate. Climate design has always been a natural part ofocal building tradition. However, when designing the modernity, the urban designer/planner has to consider many differentonflicting aspects. Thus climate-related issues have a relativelymall impact on the planning process (Eliasson, 2000). We hope,owever, that studies such as this one will serve to bolster therguments in favour of using climate-sensitive planning in futureesigns of cities. What are these arguments?
Usage and activity are often used as measures of success-
ul urban spaces. For example, Carmona et al. (2003, p. 99)tates that “successful public places are characterised by theresence of people”. The present study shows that in ordero create successful public places, weather parameters cannot
d Ur
biteieiassthcuipi
itcpmywtssre2
5
wadwp
cpip
A
RS
R
BC
C
C
C
C
C
E
GG
G
G
H
K
KK
K
K
K
L
M
M
M
M
N
N
N
P
P
R
I. Eliasson et al. / Landscape an
e neglected, since they account for over 50% of the variancen place-related attendance. Viewed together with results illus-rating the influence of weather parameters on perceptions andmotions, it is clear that climate-sensitive planning can be anmportant tool in the drive to increase sustainability in the urbannvironment. Attractive urban spaces influence the social lifen the city and will also indirectly influence the local economynd transportation infrastructure. In this perspective, climate-ensitive planning may influence all of the three dimensions ofustainability, i.e., environmental, social and economic quali-ies. More research on the human response to urban climate isowever needed before this theory can be proved. The compactity versus an urban sprawl is one of the key issues facing futurerban sustainable development, both in Sweden and abroad. It ismportant to remember that climate-sensitive planning of urbanublic places is important, regardless of which future directions chosen.
In practice, climate-sensitive planning is a matter of choos-ng between alternatives. It is difficult to apply one general ruleo all types of urban spaces. Regardless of whether it is a newonstruction or a re-design, a starting point for climate-sensitivelanning is to take advantage of the seasonal variations of theicroclimate. Urban spaces can be “climatically” attractive all
ear round. One way is to design a differentiated microclimateithin the place. As each urban space is unique, it is important
o first identify environmental characteristics such as openness,hadow pattern and wind conditions within the place and thenimulate the proposed changes. Several interesting projects haveecently developed GIS-based models as tools for analysingnvironmental diversity (e.g. Ratti and Richens, 2004; Steemers,006).
. Conclusion
Weather parameters (clearness index, air temperature andind) have a significant influence on participants’ weather
ssessments and place-related perceptions, emotions, atten-ance. It is thus clear that solar radiation, air temperature andind are vital aspects of the functional and psychological com-onents of a place.
The results support the arguments in favour of employinglimate-sensitive planning in future urban design and planningrojects, as the physical component of a place can be designed tonfluence the site-specific microclimate and consequently peo-le’s place-related attendance, perceptions and emotions.
cknowledgements
The project is financially supported by Formas, the Swedishesearch Council for Environment, Agricultural Sciences andpatial Planning in their key action area Urban Public Spaces.
eferences
laney, P.H., 1986. Affect and memory: a review. Psychol. Bull. 99, 229–246.anter, D., 1977. The Psychology of Place. The Architectural Press Ltd., Lon-
don.
R
S
ban Planning 82 (2007) 72–84 83
anter, D., 1997. The facets of place. In: Moore, G.T., Marams, R.W. (Eds.),Advances in Environment, Behavior, and Design. Plenum press, New York,pp. 109–147.
arlestam, G., 1968. Studier av utomhusaktiviteter med automatisk kamera.Rapport R16:68, Byggforskningsradet.
armona, M., Heat, T., Oc, T., Tiedsell, S., 2003. Public Places—Urban Spaces:The Dimensions of Urban Design. Archtectural Press, Elsevier.
hiesura, A., 2004. The role of urban parks for the sustainable city. Landsc.Urban Planning 68, 129–138.
ohn, E.G., 1993. The prediction of police calls for service: the influence ofweather and temporal variables on rape and domestic violence. J. Environ.Psychol. 13, 71–83.
liasson, I., 2000. The use of climate knowledge in urban planning. Landsc.Urban Planning 48, 31–44.
ehl, J., 1971. Livet mellem husene. Kopenhamn.ehl, J., Yencken, D., 1996. Byens rum—byens liv. Arkitektens forlag. Kun-
stakademiets forlag.ifford, R., 1980. Environmental dispositions and the evaluation of architectural
interiors. J. Res. Pers. 14, 386–399.raumann, C.F., 2002. The phenomenological approach to people-environment
studies. In: Bechtel, R.B., Churchman, A. (Eds.), Handbook of Environmen-tal Psychology. John Wiley & Sons, Inc., New York, pp. 95–113.
oppe, P., Seidl, H.A.J., 1991. Problems in assessment of the bioclimate forvacationists at the seaside. Int. J. Biometeorol 35, 107–110.
nez, I., 2005. Attachment and identity as related to a place and its perceivedclimate. J. Environ. Psychol. 25, 207–218.
nez, I., 2006. Autobiographical memories for places. Memory 14, 359–377.nez, I., Hygge, S., 2001. The circumplex structure of affect: a Swedish version.
Scand. J. Psychol. 42, 389–398.nez, I., Thorsson, S., 2006. Influence of culture and environmental attitude on
thermal, emotional and perceptual evaluations of a square. Int. J. Biometeorol50 (5), 258–268.
nez, I., Thorsson, S., 2007. Thermal, emotional and perceptual evaluationsof a park: cross-cultural and environmental attitude comparisons. Environ.Behav., submitted for publication.
uiken, D., 1991. Mood and Memory: Theory, Research and Applications. Sage,London.
indberg, F., 2005. Towards the use of local governmental 3-D data within urbanclimatology studies. Mapping Image Sci. 2005 (2), 4–9.
atzarakis, A., Mayer, H., 1996. Another kind of environmental stress. WHONews 18, 7–10.
ayer, H., Hoppe, P., 1987. Thermal comfort of man in different urban envi-ronments. Theor. Appl. Clim. 38, 43–49.
ills, G., 1999. Urban Climatology and Urban Design. ICUC, InternationalConference on Urban Climatology in Sydney, Australia, 8–12 November.Extended abstracts.
ills, G., 2006. Progress toward sustainable settlements: a role for urban clima-tology. Theor. Appl. Climatol. 84, 69–76.
ikolopoulou, M., Baker, N., Steemers, K., 2001. Thermal comfort in outdoorurban spaces: understanding the human parameter. Solar Energy 70 (3),227–235.
ikolopoulou, M., Steemers, K., 2003. Thermal comfort and psychologicaladaptation as a guide for designing urban spaces. Energy Buildings 35,95–101.
ikolopoulou, M., Lykoudis, S., 2006. Thermal comfort in outdoor urbanspaces: analysis across different European countries. Building Environ. 41,1455–1470.
arker, P.M., 1995. Climatic Effects on Individual, Social and Economic Behav-ior. Greenwood Press, Westport, CT.
faffenberger, R.C., Patterson, J.H., 1987. Statistical Methods. Irwin, Home-wood, IL.
atti, C., Richens, P., 2004. Raster analysis of urban form. Environ. Planning BPlanning Des. 31 (2), 297–306.
otton, J., Cohn, E., 2002. Climate, weather and crime. In: Bechtel, R.B.,Churchman, A. (Eds.), Handbook of Environmental Psychology. John Wiley& Sons, Inc., New York, pp. 481–498.
imister, J., Cooper, C., 2005. Thermal stress in the U.S.A. effects on violenceand on employee behaviour. Stress Health 21, 3–15.

8 d Ur
S
T
T
T
T
W
Z
IsHbsc
Ivara
UdhrU
SS2Ra
Fredrik Lindberg Born on 1974, received his MA at Goteborg University
4 I. Eliasson et al. / Landscape an
teemers, K., 2006. Human comfort in urban spaces. In: The 6th InternationalConference on Urban Climate (ICUC6).
horsson, S., 2003. Climate, air-quality and thermal comfort in the urban envi-ronment. Doctoral Thesis A87. Goteborg University, Sweden.
horsson, S., Lindqvist, M., Lindqvist, S., 2004. Thermal bioclimatic conditionsand patterns of behaviour in an urban park in Sweden. Int. J. Biometeorol.48, 149–156.
horsson, S., Honjo, T., Lindberg, F., Eliasson, I., Eun-Mi, L., 2006. Ther-mal comfort and outdoor activity in Japanese urban public spaces. Environ.Behav., in press.
ress, G., Tress, B., Fry, G., 2004. Clarifying integrative research concepts inlandscape ecology. Landsc. Ecol. 20, 479–493.
esterberg, U., 1994. Climatic planning—physics or symbolism. ArchitectureBehav. 19, 49–72.
acharias, J., Stathopoulos, T., Wu, H., 2001. Microclimate and downtown openspace activity. Environ. Behav. 33, 296–315.
ngegard Eliasson Born on 1961, presented her PhD thesis in 1993 and is
ince 2000 associate professor in physical geography at Goteborg University.er current research focus on studies of wind and turbulence field and energyalance in urban street canyons, human biometeorology and thermal comfort,tudies of urban climate and air pollution in African cities and integration oflimate knowledge in urban planning.iUt
ban Planning 82 (2007) 72–84
gor Knez Born on 1959, has, since 1992, a PhD in psychology from the Uni-ersity of Uppsala, Sweden. Since 1998, he is associate professor in psychologyt Centre for Built Environment, University of Gavle, Sweden. His current envi-onmental psychology research focuses on place-related identity and memorynd place-related psychological assessment.
lla Westerberg Born on 1946, received her PhD in 1993 on climaticesign in architecture. She has been the project leader of urban climate andousing surveys and has cooperated in projects on energy efficiency and envi-onmental assessment of buildings at Centre for Built Environment, Gavleniversity.
ofia Thorsson Born on 1972, received her PhD in 2003 in physical geography.he went on post-doc at Chiba University, Japan and University of Gavle, in004 and 2005. Since 2005 she is post-doctoral Fellow at Goteborg University.esearch focus is on urban climate, human biometeorology, thermal comfortnd air pollution in urban areas.
n 2002 and is currently a PhD-candidate in physical geography at Goteborgniversity, Sweden. His main expertises are urban climatology, human biome-
eorology and geographical information science.