Metalloprotein Active Site Structure Determination: Synergy between X-ray Absorption Spectroscopy...
11
Metalloprotein active site structure determination: Synergy between X-ray absorption spectroscopy and X-ray crystallography Julien J.H. Cotelesage a, b , M. Jake Pushie a , Pawel Grochulski b , Ingrid J. Pickering a , Graham N. George a, ⁎ a Molecular and Environmental Sciences Research Group, Department of Geological Sciences, University of Saskatchewan, Saskatoon, SK, Canada S7N 5E2 b Canadian Light Source, 101 Perimeter Road, Saskatoon, SK, Canada S7N 0X4 abstract article info Article history: Received 10 April 2012 Received in revised form 21 June 2012 Accepted 22 June 2012 Available online 6 July 2012 Keywords: X-ray absorption spectroscopy EXAFS Metalloproteins Macromolecular crystallography Structures of metalloprotein active sites derived from X-ray crystallography frequently contain chemical anomalies such as unexpected atomic geometries or elongated bond-lengths. Such anomalies are expected from the known errors inherent in macromolecular crystallography (ca. 0.1–0.2 Å) and from the lack of ap- propriate restraints for metal sites which are often without precedent in the small molecule structure litera- ture. Here we review the potential of X-ray absorption spectroscopy to provide information and perspective which could aid in improving the accuracy of metalloprotein crystal structure solutions. We also review the potential problem areas in analysis of the extended X-ray absorption fine structure (EXAFS) and discuss the use of density functional theory as another possible source of geometrical restraints for crystal structure anal- ysis of metalloprotein active sites. © 2012 Elsevier Inc. All rights reserved. 1. Introduction In recent decades advances in experimental and analysis tech- niques have caused macromolecular X-ray crystallography to mature from a highly specialized method practiced by a few experts to being widely used and the premier structural technique in biochemistry. For large molecules at lower resolution the method is under-determined, so that restraints, and to a lesser extent constraints, are required for solving structures [1]. Thus, interatomic distances in the amino acids are restrained to values taken from small molecule crystal struc- tures [2]. In the case of metal-containing active sites the structures present are often totally unknown, and restraints are thus unavailable [3]. Moreover, because of the limited resolution, and as discussed by Rees and co-workers [4,5], Fourier series termination artifacts can cause problems in determining the positions of light atoms in the vicin- ity of a heavy atom such as a metal ion. Fortunately, other methods can be used to provide supplemental information on the active site struc- tures. The purpose of this paper is to review the contributions that X-ray absorption spectroscopy (XAS) can make to structure determina- tion of metalloprotein active sites. XAS can contribute in three different ways: (i) XAS has greater accuracy of metal to ligand bond-length de- termination; (ii) XAS has a lower tendency for X-ray photo-reduction; and (iii) XAS can be measured on solutions, thereby avoiding artifacts of crystallization. This review will discuss the advantages and limita- tions of XAS relative to crystallography in general, predominantly in the first area. Hans Freeman was well known for his pioneering work on protein crystallography and blue copper proteins [6]. Since the use of XAS in conjunction with crystallography was one of his long-standing interests [7,8], we have therefore selected this topic for our contribution to this volume. 2. Materials and Methods 2.1. X-ray absorption spectroscopy experiments X-ray absorption spectra were collected at the Stanford Synchrotron Radiation Lightsource using the structural molecular biology beamline 7–3, as previously described [9]. 2.2. Density functional theory calculations Density functional theory (DFT) calculations employed the pro- grams Dmol 3 Materials Studio Version 5.5 [10,11]. Geometry optimiza- tion calculations used the Perdew–Burke–Ernzerhof functional [12,13] for both the potential during the self-consistent field procedure, and the energy. Dmol 3 uses numerically derived basis sets [10,11] and these included polarization functions for all atoms. Calculations were spin-unrestricted and all-electron relativistic core potentials were used. Solvation effects were modeled using the Conductor-like Screen- ing Model (COSMO) [14] with a dielectric value representing water (ε =78.39). Convergence was assumed to be achieved when energies differed by less than 2×10 −5 E h , the maximum force was less than 0.004 E h /Å and the maximum displacement was less than 0.005 Å. A maximum step size of 0.3 Å was used. Journal of Inorganic Biochemistry 115 (2012) 127–137 ⁎ Corresponding author at: Molecular and Environmental Sciences Research Group, Department of Geological Sciences, University of Saskatchewan, 114 Science Place, Saskatoon, SK, Canada S7N 5E2. Tel.: +1 306 966 5722, +1 306 966 8593. E-mail address: [email protected] (G.N. George). 0162-0134/$ – see front matter © 2012 Elsevier Inc. All rights reserved. doi:10.1016/j.jinorgbio.2012.06.019 Contents lists available at SciVerse ScienceDirect Journal of Inorganic Biochemistry journal homepage: www.elsevier.com/locate/jinorgbio
Transcript of Metalloprotein Active Site Structure Determination: Synergy between X-ray Absorption Spectroscopy...

Journal of Inorganic Biochemistry 115 (2012) 127–137
Contents lists available at SciVerse ScienceDirect
Journal of Inorganic Biochemistry
j ourna l homepage: www.e lsev ie r .com/ locate / j inorgb io
Metalloprotein active site structure determination: Synergy between X-rayabsorption spectroscopy and X-ray crystallography
Julien J.H. Cotelesage a,b, M. Jake Pushie a, Pawel Grochulski b, Ingrid J. Pickering a, Graham N. George a,⁎a Molecular and Environmental Sciences Research Group, Department of Geological Sciences, University of Saskatchewan, Saskatoon, SK, Canada S7N 5E2b Canadian Light Source, 101 Perimeter Road, Saskatoon, SK, Canada S7N 0X4
⁎ Corresponding author at: Molecular and EnvirGroup, Department of Geological Sciences, UniversityPlace, Saskatoon, SK, Canada S7N 5E2. Tel.: +1 306 96
E-mail address: [email protected] (G.N. George).
0162-0134/$ – see front matter © 2012 Elsevier Inc. Alldoi:10.1016/j.jinorgbio.2012.06.019
a b s t r a c t
a r t i c l e i n f oArticle history:Received 10 April 2012Received in revised form 21 June 2012Accepted 22 June 2012Available online 6 July 2012
Keywords:X-ray absorption spectroscopyEXAFSMetalloproteinsMacromolecular crystallography
Structures of metalloprotein active sites derived from X-ray crystallography frequently contain chemicalanomalies such as unexpected atomic geometries or elongated bond-lengths. Such anomalies are expectedfrom the known errors inherent in macromolecular crystallography (ca. 0.1–0.2 Å) and from the lack of ap-propriate restraints for metal sites which are often without precedent in the small molecule structure litera-ture. Here we review the potential of X-ray absorption spectroscopy to provide information and perspectivewhich could aid in improving the accuracy of metalloprotein crystal structure solutions. We also review thepotential problem areas in analysis of the extended X-ray absorption fine structure (EXAFS) and discuss theuse of density functional theory as another possible source of geometrical restraints for crystal structure anal-ysis of metalloprotein active sites.
© 2012 Elsevier Inc. All rights reserved.
1. Introduction
In recent decades advances in experimental and analysis tech-niques have caused macromolecular X-ray crystallography to maturefrom a highly specialized method practiced by a few experts to beingwidely used and the premier structural technique in biochemistry. Forlarge molecules at lower resolution the method is under-determined,so that restraints, and to a lesser extent constraints, are required forsolving structures [1]. Thus, interatomic distances in the amino acidsare restrained to values taken from small molecule crystal struc-tures [2]. In the case of metal-containing active sites the structurespresent are often totally unknown, and restraints are thus unavailable[3]. Moreover, because of the limited resolution, and as discussed byRees and co-workers [4,5], Fourier series termination artifacts cancause problems in determining the positions of light atoms in the vicin-ity of a heavy atom such as a metal ion. Fortunately, other methods canbe used to provide supplemental information on the active site struc-tures. The purpose of this paper is to review the contributions thatX-ray absorption spectroscopy (XAS) canmake to structure determina-tion of metalloprotein active sites. XAS can contribute in three differentways: (i) XAS has greater accuracy of metal to ligand bond-length de-termination; (ii) XAS has a lower tendency for X-ray photo-reduction;and (iii) XAS can be measured on solutions, thereby avoiding artifactsof crystallization. This review will discuss the advantages and limita-tions of XAS relative to crystallography in general, predominantly in
onmental Sciences Researchof Saskatchewan, 114 Science6 5722, +1 306 966 8593.
rights reserved.
the first area. Hans Freeman was well known for his pioneeringwork on protein crystallography and blue copper proteins [6]. Sincethe use of XAS in conjunction with crystallography was one of hislong-standing interests [7,8], we have therefore selected this topicfor our contribution to this volume.
2. Materials and Methods
2.1. X-ray absorption spectroscopy experiments
X-ray absorption spectrawere collected at the Stanford SynchrotronRadiation Lightsource using the structural molecular biology beamline7–3, as previously described [9].
2.2. Density functional theory calculations
Density functional theory (DFT) calculations employed the pro-grams Dmol3 Materials Studio Version 5.5 [10,11]. Geometry optimiza-tion calculations used the Perdew–Burke–Ernzerhof functional [12,13]for both the potential during the self-consistent field procedure, andthe energy. Dmol3 uses numerically derived basis sets [10,11] andthese included polarization functions for all atoms. Calculations werespin-unrestricted and all-electron relativistic core potentials wereused. Solvation effects were modeled using the Conductor-like Screen-ing Model (COSMO) [14] with a dielectric value representing water(ε=78.39). Convergence was assumed to be achieved when energiesdiffered by less than 2×10⁻⁵Eh, the maximum force was less than0.004Eh/Å and the maximum displacement was less than 0.005 Å. Amaximum step size of 0.3 Å was used.

Fig. 1. Typical X-ray absorption spectrum showing the different regions of the spec-trum. a shows the raw X-ray absorption spectroscopic data of a ferric imidazolatecomplex [tetrakis(1-methylimidazole)iron(iii)bis-ethanesulfonate] with the extractedEXAFS oscillations as an inset, b shows the EXAFS oscillations as a function ofphoto-electron wave vector k, and weighted by k3, and c shows the EXAFS Fouriertransform phase-corrected for Fe\N backscattering. The inset in c shows the corestructure of the complex.
128 J.J.H. Cotelesage et al. / Journal of Inorganic Biochemistry 115 (2012) 127–137
3. X-ray absorption spectroscopy
XAS provides a tool by which both local physical and electronicstructures can be investigated. Spectra arise from core-level electronexcitation by absorption of X-rays, and are thus associated with anabsorption edge (Fig. 1A). XAS is usually divided into two different re-gions: the extended X-ray absorption fine structure or EXAFS (Fig. 1B),which occurs at energies higher than the absorption edge; and thenear-edge region (sometimes called the X-ray absorption near-edgestructure or XANES) which consists of features close to the absorptionedge that are not part of the analyzable EXAFS, typically withinabout 50 eV of the absorption edge (Fig. 1). Near-edge spectra arisefrom transitions of the core electron into bound states. XAS is thuselement-specific and can be used to investigate solids, liquids (includingsolutions), gaseous materials, and any mixtures thereof. It probes alloccurrences of an element within a sample withmoderate sensitivityand is applicable to a very wide range of elements. The near-edgeportion of the spectrum is sensitive to both the metal coordinationand to electronic structure such as the oxidation state. The theoryof XAS is well developed, and the analysis methods of the EXAFSpart of the spectrum, yielding a local radial structure for the absorbingatom, are now considered well established.
3.1. Extended X-ray absorption fine structure spectroscopy
The EXAFS is an oscillatory modulation in the X-ray absorptionabove the absorption edge threshold energy E0. An empirical under-standing of the origins of the EXAFS can be obtained from consideringan emitted photo-electron de Broglie wave, which can be backscatteredby any nearby atoms. The EXAFS can be viewed as arising from interfer-ence between outgoing and backscattered photo-electron wave. TheEXAFS χ(k) is generally plotted as a function of the photo-electron
wave-vector k ¼ffiffiffiffiffiffiffiffiffiffiffiffiffiffiffiffiffiffiffiffiffiffiffi2me
J2 E−E0ð Þq
where me is the electron rest mass, E is
X-ray energy, and E0 the threshold energy, and can be analyzed usingthe following simple formalism:
χ kð Þ ¼ ∑i
NiAi k;Rð ÞkR2
i
e−2σ2i k
2
e−2Ri=λ kð Þ sin 2kRi þ ϕi kð Þ½ �: ð1Þ
Here, Ni is the number of backscatterer atoms of type i at a distanceRi from the absorber atom, Ai(k, R) andφi(k) are the total amplitude andphase function, respectively, and depend upon the nature of the back-scatterer atom, λ(k) is the photoelectron mean free path and e−2σi
2k2
is the Debye–Waller term where σi2 is the mean-square deviation in
Ri. The EXAFS spectra are extracted from the raw XAS spectra by whatare now standard background subtraction techniques [15]. It is acommon practice to weight the EXAFS by k3 (e.g. Fig. 1B) in orderto counteract the damping of the spectra caused by the Debye–Wallerfactor and the fall-off in scattering amplitude A(k). In addition, sincethe theory used to analyze the spectra increases in accuracy approxi-mately as k1, the k3-weighting emphasizes the part of the spectrumthat can be analyzed to yield the most accurate information.
3.1.1. EXAFS structural analysisStructural details are extracted from experimental EXAFS by a
modeling approach where potential ligands are tested; non-linearoptimization is used to refine the structural parameters N, R and σ2
for each ligand together with a shift in the threshold energy, ΔE0,which is usually held at a common value for all interactions. The vari-ablesN and σ2 show a strongmutual correlation in the refinement, asdo R and ΔE0. The consequence of this is thatN and σ2 generally cannotbe co-refined;modelswith integer values ofN are generally tested,withthemethod lacking accuracy in determination ofN (accepted errors areof the order of 20%). The correlation of R and ΔE0 does not in generalgive similar problems, both because the minimum for R is very sharp,
and because the use of a commonΔE0 for all components helps to definethe latter. Thus, R and ΔE0 can generally be co-refined, providing thatappropriate precautions are used and that data of adequate k-range isavailable [16].
3.1.2. EXAFS Fourier transformsEXAFS spectra are usually Fourier transformed and viewed as the
transform magnitude |ρ(R)| versus R in order to visualize the frequencycontributions to the EXAFS corresponding to individual interactions aspeaks (Fig. 1C). In general it is a good practice to use phase correctionby selecting an appropriate φ(k), which is typically that of the back-scatterer dominating the EXAFS.
ρ Rð Þ ¼ 14π1=2 ∫
kmax
kmin
χ kð Þk3ei2kRþiφ kð Þdk ð2Þ
If phase correction is neglected then the transform peaks will beasymmetric and R-shifted by Δ Rð Þ≈ 1
2∂ϕ kð Þ∂k
� �D E, typically about−0.3 Å.
129J.J.H. Cotelesage et al. / Journal of Inorganic Biochemistry 115 (2012) 127–137
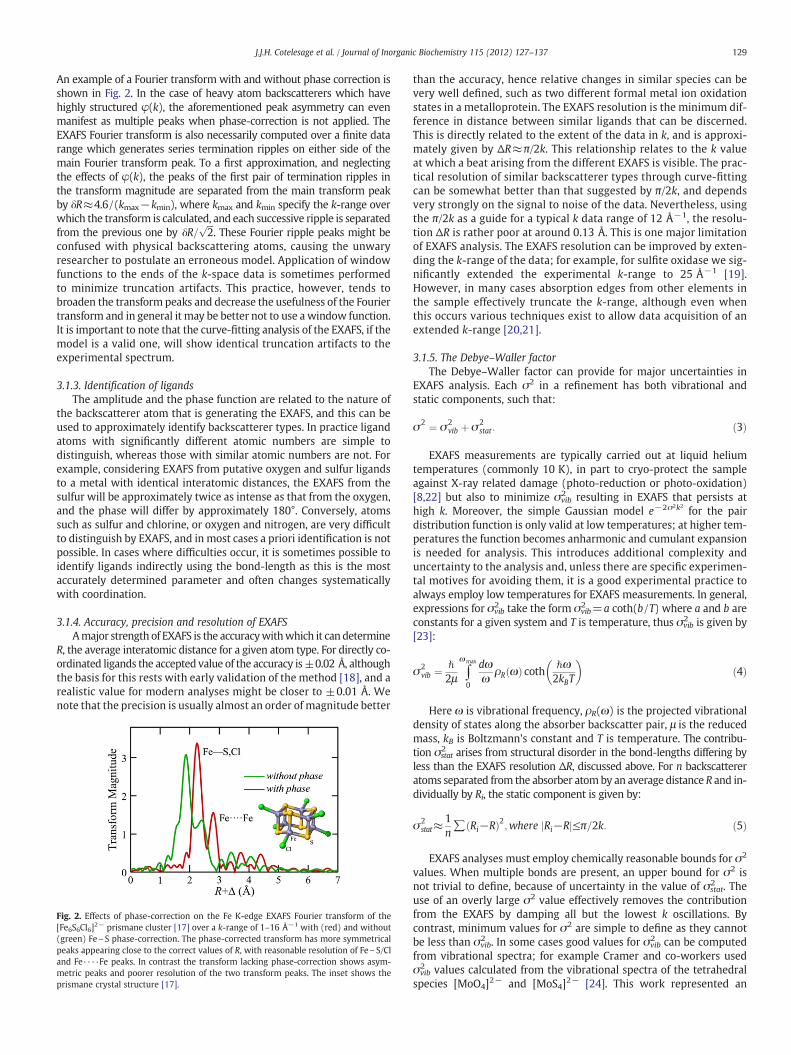
An example of a Fourier transform with and without phase correction isshown in Fig. 2. In the case of heavy atom backscatterers which havehighly structured φ(k), the aforementioned peak asymmetry can evenmanifest as multiple peaks when phase-correction is not applied. TheEXAFS Fourier transform is also necessarily computed over a finite datarange which generates series termination ripples on either side of themain Fourier transform peak. To a first approximation, and neglectingthe effects of φ(k), the peaks of the first pair of termination ripples inthe transform magnitude are separated from the main transform peakby δR≈4.6/(kmax−kmin), where kmax and kmin specify the k-range overwhich the transform is calculated, and each successive ripple is separatedfrom the previous one by δR=
ffiffiffi2
p. These Fourier ripple peaks might be
confused with physical backscattering atoms, causing the unwaryresearcher to postulate an erroneous model. Application of windowfunctions to the ends of the k-space data is sometimes performedto minimize truncation artifacts. This practice, however, tends tobroaden the transform peaks and decrease the usefulness of the Fouriertransform and in general it may be better not to use a window function.It is important to note that the curve-fitting analysis of the EXAFS, if themodel is a valid one, will show identical truncation artifacts to theexperimental spectrum.
3.1.3. Identification of ligandsThe amplitude and the phase function are related to the nature of
the backscatterer atom that is generating the EXAFS, and this can beused to approximately identify backscatterer types. In practice ligandatoms with significantly different atomic numbers are simple todistinguish, whereas those with similar atomic numbers are not. Forexample, considering EXAFS from putative oxygen and sulfur ligandsto a metal with identical interatomic distances, the EXAFS from thesulfur will be approximately twice as intense as that from the oxygen,and the phase will differ by approximately 180°. Conversely, atomssuch as sulfur and chlorine, or oxygen and nitrogen, are very difficultto distinguish by EXAFS, and in most cases a priori identification is notpossible. In cases where difficulties occur, it is sometimes possible toidentify ligands indirectly using the bond-length as this is the mostaccurately determined parameter and often changes systematicallywith coordination.
3.1.4. Accuracy, precision and resolution of EXAFSAmajor strength of EXAFS is the accuracywithwhich it can determine
R, the average interatomic distance for a given atom type. For directly co-ordinated ligands the accepted value of the accuracy is±0.02 Å, althoughthe basis for this rests with early validation of the method [18], and arealistic value for modern analyses might be closer to ±0.01 Å. Wenote that the precision is usually almost an order of magnitude better
Fig. 2. Effects of phase-correction on the Fe K-edge EXAFS Fourier transform of the[Fe6S6Cl6]2− prismane cluster [17] over a k-range of 1–16 Å−1 with (red) and without(green) Fe\S phase-correction. The phase-corrected transform has more symmetricalpeaks appearing close to the correct values of R, with reasonable resolution of Fe\S/Cland Fe····Fe peaks. In contrast the transform lacking phase-correction shows asym-metric peaks and poorer resolution of the two transform peaks. The inset shows theprismane crystal structure [17].
than the accuracy, hence relative changes in similar species can bevery well defined, such as two different formal metal ion oxidationstates in a metalloprotein. The EXAFS resolution is the minimum dif-ference in distance between similar ligands that can be discerned.This is directly related to the extent of the data in k, and is approxi-mately given by ΔR≈π/2k. This relationship relates to the k valueat which a beat arising from the different EXAFS is visible. The prac-tical resolution of similar backscatterer types through curve-fittingcan be somewhat better than that suggested by π/2k, and dependsvery strongly on the signal to noise of the data. Nevertheless, usingthe π/2k as a guide for a typical k data range of 12 Å−1, the resolu-tion ΔR is rather poor at around 0.13 Å. This is one major limitationof EXAFS analysis. The EXAFS resolution can be improved by exten-ding the k-range of the data; for example, for sulfite oxidase we sig-nificantly extended the experimental k-range to 25 Å−1 [19].However, in many cases absorption edges from other elements inthe sample effectively truncate the k-range, although even whenthis occurs various techniques exist to allow data acquisition of anextended k-range [20,21].
3.1.5. The Debye–Waller factorThe Debye–Waller factor can provide for major uncertainties in
EXAFS analysis. Each σ2 in a refinement has both vibrational andstatic components, such that:
σ2 ¼ σ2vib þ σ2
stat : ð3Þ
EXAFS measurements are typically carried out at liquid heliumtemperatures (commonly 10 K), in part to cryo-protect the sampleagainst X-ray related damage (photo-reduction or photo-oxidation)[8,22] but also to minimize σvib
2 resulting in EXAFS that persists athigh k. Moreover, the simple Gaussian model e−2σ2k2 for the pairdistribution function is only valid at low temperatures; at higher tem-peratures the function becomes anharmonic and cumulant expansionis needed for analysis. This introduces additional complexity anduncertainty to the analysis and, unless there are specific experimen-tal motives for avoiding them, it is a good experimental practice toalways employ low temperatures for EXAFS measurements. In general,expressions for σvib
2 take the form σvib2 =a coth(b/T) where a and b are
constants for a given system and T is temperature, thus σvib2 is given by
[23]:
σ2vib ¼ ℏ
2μ∫
ωmax
0
dωω
ρR ωð Þ coth ℏω2kBT
� �ð4Þ
Here ω is vibrational frequency, ρR(ω) is the projected vibrationaldensity of states along the absorber backscatter pair, μ is the reducedmass, kB is Boltzmann's constant and T is temperature. The contribu-tion σstat
2 arises from structural disorder in the bond-lengths differing byless than the EXAFS resolution ΔR, discussed above. For n backscattereratoms separated from the absorber atomby an average distance R and in-dividually by Ri, the static component is given by:
σ2stat≈
1n∑ Ri−Rð Þ2;where Ri−Rj j≤π=2k: ð5Þ
EXAFS analyses must employ chemically reasonable bounds for σ2
values. When multiple bonds are present, an upper bound for σ2 isnot trivial to define, because of uncertainty in the value of σstat
2 . Theuse of an overly large σ2 value effectively removes the contributionfrom the EXAFS by damping all but the lowest k oscillations. Bycontrast, minimum values for σ2 are simple to define as they cannotbe less than σvib
2 . In some cases good values for σvib2 can be computed
from vibrational spectra; for example Cramer and co-workers usedσvib2 values calculated from the vibrational spectra of the tetrahedral
species [MoO4]2− and [MoS4]2− [24]. This work represented an
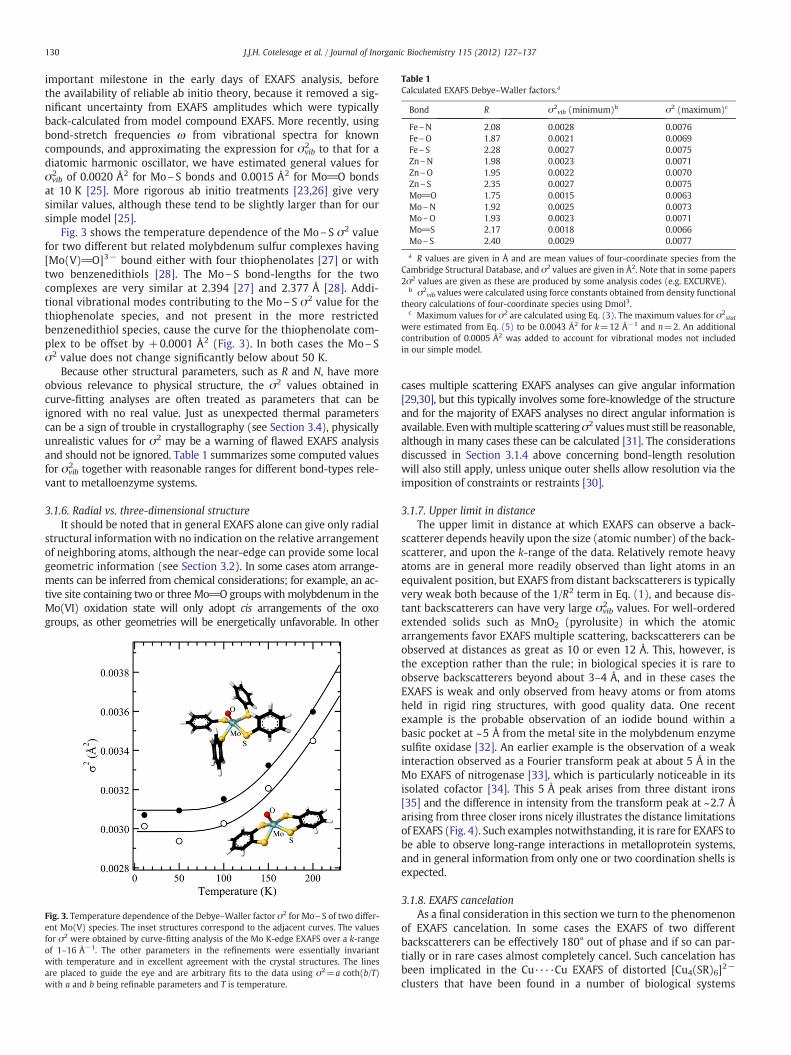
Table 1Calculated EXAFS Debye–Waller factors.a
Bond R σ2vib (minimum)b σ2 (maximum)c
Fe\N 2.08 0.0028 0.0076Fe\O 1.87 0.0021 0.0069Fe\S 2.28 0.0027 0.0075Zn\N 1.98 0.0023 0.0071Zn\O 1.95 0.0022 0.0070Zn\S 2.35 0.0027 0.0075Mo_O 1.75 0.0015 0.0063Mo\N 1.92 0.0025 0.0073Mo\O 1.93 0.0023 0.0071Mo_S 2.17 0.0018 0.0066Mo\S 2.40 0.0029 0.0077
a R values are given in Å and are mean values of four-coordinate species from theCambridge Structural Database, and σ2 values are given in Å2. Note that in some papers2σ2 values are given as these are produced by some analysis codes (e.g. EXCURVE).
b σ2vib values were calculated using force constants obtained from density functional
theory calculations of four-coordinate species using Dmol3.c Maximum values for σ2 are calculated using Eq. (3). The maximum values for σ2
stat
were estimated from Eq. (5) to be 0.0043 Å2 for k=12 Å−1 and n=2. An additionalcontribution of 0.0005 Å2 was added to account for vibrational modes not includedin our simple model.
130 J.J.H. Cotelesage et al. / Journal of Inorganic Biochemistry 115 (2012) 127–137
important milestone in the early days of EXAFS analysis, beforethe availability of reliable ab initio theory, because it removed a sig-nificant uncertainty from EXAFS amplitudes which were typicallyback-calculated from model compound EXAFS. More recently, usingbond-stretch frequencies ω from vibrational spectra for knowncompounds, and approximating the expression for σvib
2 to that for adiatomic harmonic oscillator, we have estimated general values forσvib2 of 0.0020 Å2 for Mo\S bonds and 0.0015 Å2 for Mo_O bonds
at 10 K [25]. More rigorous ab initio treatments [23,26] give verysimilar values, although these tend to be slightly larger than for oursimple model [25].
Fig. 3 shows the temperature dependence of the Mo\S σ2 valuefor two different but related molybdenum sulfur complexes having[Mo(V)_O]3− bound either with four thiophenolates [27] or withtwo benzenedithiols [28]. The Mo\S bond-lengths for the twocomplexes are very similar at 2.394 [27] and 2.377 Å [28]. Addi-tional vibrational modes contributing to the Mo\S σ2 value for thethiophenolate species, and not present in the more restrictedbenzenedithiol species, cause the curve for the thiophenolate com-plex to be offset by +0.0001 Å2 (Fig. 3). In both cases the Mo\Sσ2 value does not change significantly below about 50 K.
Because other structural parameters, such as R and N, have moreobvious relevance to physical structure, the σ2 values obtained incurve-fitting analyses are often treated as parameters that can beignored with no real value. Just as unexpected thermal parameterscan be a sign of trouble in crystallography (see Section 3.4), physicallyunrealistic values for σ2 may be a warning of flawed EXAFS analysisand should not be ignored. Table 1 summarizes some computed valuesfor σvib
2 together with reasonable ranges for different bond-types rele-vant to metalloenzyme systems.
3.1.6. Radial vs. three-dimensional structureIt should be noted that in general EXAFS alone can give only radial
structural information with no indication on the relative arrangementof neighboring atoms, although the near-edge can provide some localgeometric information (see Section 3.2). In some cases atom arrange-ments can be inferred from chemical considerations; for example, an ac-tive site containing two or three Mo_O groups withmolybdenum in theMo(VI) oxidation state will only adopt cis arrangements of the oxogroups, as other geometries will be energetically unfavorable. In other
Fig. 3. Temperature dependence of the Debye–Waller factor σ2 for Mo\S of two differ-ent Mo(V) species. The inset structures correspond to the adjacent curves. The valuesfor σ2 were obtained by curve-fitting analysis of the Mo K-edge EXAFS over a k-rangeof 1–16 Å−1. The other parameters in the refinements were essentially invariantwith temperature and in excellent agreement with the crystal structures. The linesare placed to guide the eye and are arbitrary fits to the data using σ2=a coth(b/T)with a and b being refinable parameters and T is temperature.
cases multiple scattering EXAFS analyses can give angular information[29,30], but this typically involves some fore-knowledge of the structureand for the majority of EXAFS analyses no direct angular information isavailable. Evenwithmultiple scatteringσ2 valuesmust still be reasonable,although in many cases these can be calculated [31]. The considerationsdiscussed in Section 3.1.4 above concerning bond-length resolutionwill also still apply, unless unique outer shells allow resolution via theimposition of constraints or restraints [30].
3.1.7. Upper limit in distanceThe upper limit in distance at which EXAFS can observe a back-
scatterer depends heavily upon the size (atomic number) of the back-scatterer, and upon the k-range of the data. Relatively remote heavyatoms are in general more readily observed than light atoms in anequivalent position, but EXAFS from distant backscatterers is typicallyvery weak both because of the 1/R2 term in Eq. (1), and because dis-tant backscatterers can have very large σvib
2 values. For well-orderedextended solids such as MnO2 (pyrolusite) in which the atomicarrangements favor EXAFS multiple scattering, backscatterers can beobserved at distances as great as 10 or even 12 Å. This, however, isthe exception rather than the rule; in biological species it is rare toobserve backscatterers beyond about 3–4 Å, and in these cases theEXAFS is weak and only observed from heavy atoms or from atomsheld in rigid ring structures, with good quality data. One recentexample is the probable observation of an iodide bound within abasic pocket at ~5 Å from the metal site in the molybdenum enzymesulfite oxidase [32]. An earlier example is the observation of a weakinteraction observed as a Fourier transform peak at about 5 Å in theMo EXAFS of nitrogenase [33], which is particularly noticeable in itsisolated cofactor [34]. This 5 Å peak arises from three distant irons[35] and the difference in intensity from the transform peak at ~2.7 Åarising from three closer irons nicely illustrates the distance limitationsof EXAFS (Fig. 4). Such examples notwithstanding, it is rare for EXAFS tobe able to observe long-range interactions in metalloprotein systems,and in general information from only one or two coordination shells isexpected.
3.1.8. EXAFS cancelationAs a final consideration in this section we turn to the phenomenon
of EXAFS cancelation. In some cases the EXAFS of two differentbackscatterers can be effectively 180° out of phase and if so can par-tially or in rare cases almost completely cancel. Such cancelation hasbeen implicated in the Cu····Cu EXAFS of distorted [Cu4(SR)6]2−
clusters that have been found in a number of biological systems
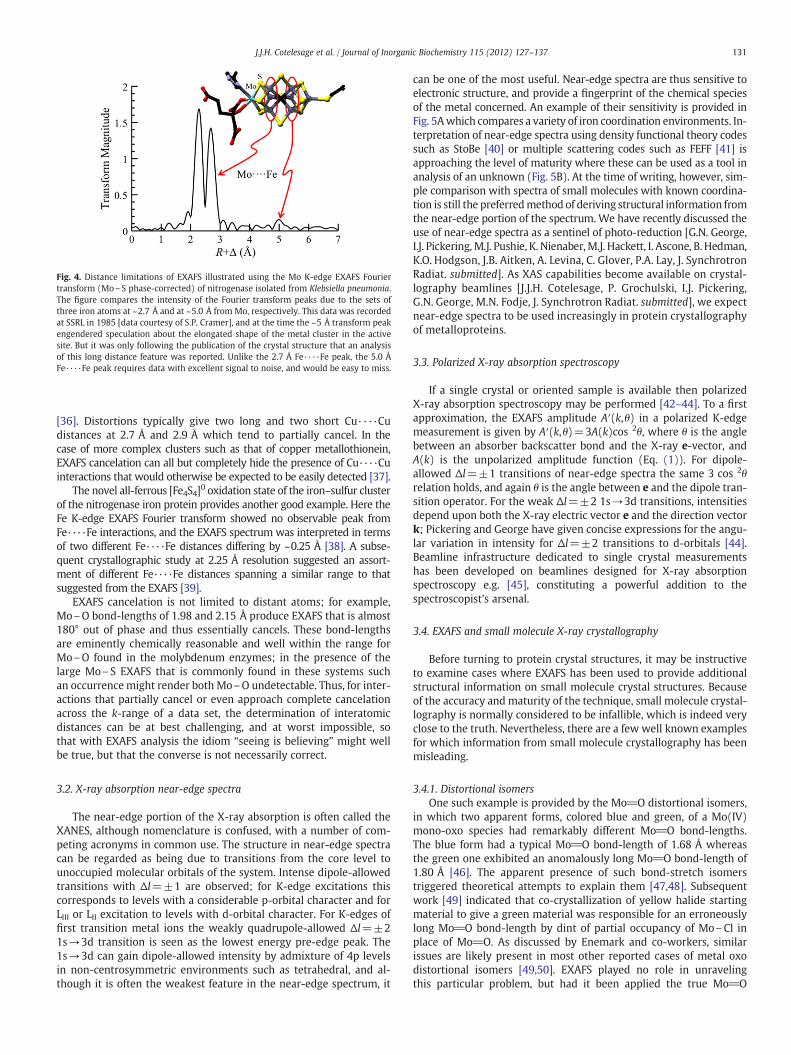
Fig. 4. Distance limitations of EXAFS illustrated using the Mo K-edge EXAFS Fouriertransform (Mo\S phase-corrected) of nitrogenase isolated from Klebsiella pneumonia.The figure compares the intensity of the Fourier transform peaks due to the sets ofthree iron atoms at ~2.7 Å and at ~5.0 Å from Mo, respectively. This data was recordedat SSRL in 1985 [data courtesy of S.P. Cramer], and at the time the ~5 Å transform peakengendered speculation about the elongated shape of the metal cluster in the activesite. But it was only following the publication of the crystal structure that an analysisof this long distance feature was reported. Unlike the 2.7 Å Fe····Fe peak, the 5.0 ÅFe····Fe peak requires data with excellent signal to noise, and would be easy to miss.
131J.J.H. Cotelesage et al. / Journal of Inorganic Biochemistry 115 (2012) 127–137
[36]. Distortions typically give two long and two short Cu····Cudistances at 2.7 Å and 2.9 Å which tend to partially cancel. In thecase of more complex clusters such as that of copper metallothionein,EXAFS cancelation can all but completely hide the presence of Cu····Cuinteractions that would otherwise be expected to be easily detected [37].
The novel all-ferrous [Fe4S4]0 oxidation state of the iron–sulfur clusterof the nitrogenase iron protein provides another good example. Here theFe K-edge EXAFS Fourier transform showed no observable peak fromFe····Fe interactions, and the EXAFS spectrum was interpreted in termsof two different Fe····Fe distances differing by ~0.25 Å [38]. A subse-quent crystallographic study at 2.25 Å resolution suggested an assort-ment of different Fe····Fe distances spanning a similar range to thatsuggested from the EXAFS [39].
EXAFS cancelation is not limited to distant atoms; for example,Mo\O bond-lengths of 1.98 and 2.15 Å produce EXAFS that is almost180° out of phase and thus essentially cancels. These bond-lengthsare eminently chemically reasonable and well within the range forMo\O found in the molybdenum enzymes; in the presence of thelarge Mo\S EXAFS that is commonly found in these systems suchan occurrencemight render both Mo\O undetectable. Thus, for inter-actions that partially cancel or even approach complete cancelationacross the k-range of a data set, the determination of interatomicdistances can be at best challenging, and at worst impossible, sothat with EXAFS analysis the idiom “seeing is believing” might wellbe true, but that the converse is not necessarily correct.
3.2. X-ray absorption near-edge spectra
The near-edge portion of the X-ray absorption is often called theXANES, although nomenclature is confused, with a number of com-peting acronyms in common use. The structure in near-edge spectracan be regarded as being due to transitions from the core level tounoccupied molecular orbitals of the system. Intense dipole-allowedtransitions with Δl=±1 are observed; for K-edge excitations thiscorresponds to levels with a considerable p-orbital character and forLIII or LII excitation to levels with d-orbital character. For K-edges offirst transition metal ions the weakly quadrupole-allowed Δl=±21s→3d transition is seen as the lowest energy pre-edge peak. The1s→3d can gain dipole-allowed intensity by admixture of 4p levelsin non-centrosymmetric environments such as tetrahedral, and al-though it is often the weakest feature in the near-edge spectrum, it
can be one of the most useful. Near-edge spectra are thus sensitive toelectronic structure, and provide a fingerprint of the chemical speciesof the metal concerned. An example of their sensitivity is provided inFig. 5Awhich compares a variety of iron coordination environments. In-terpretation of near-edge spectra using density functional theory codessuch as StoBe [40] or multiple scattering codes such as FEFF [41] isapproaching the level of maturity where these can be used as a tool inanalysis of an unknown (Fig. 5B). At the time of writing, however, sim-ple comparison with spectra of small molecules with known coordina-tion is still the preferredmethod of deriving structural information fromthe near-edge portion of the spectrum. We have recently discussed theuse of near-edge spectra as a sentinel of photo-reduction [G.N. George,I.J. Pickering,M.J. Pushie, K. Nienaber,M.J. Hackett, I. Ascone, B. Hedman,K.O. Hodgson, J.B. Aitken, A. Levina, C. Glover, P.A. Lay, J. SynchrotronRadiat. submitted]. As XAS capabilities become available on crystal-lography beamlines [J.J.H. Cotelesage, P. Grochulski, I.J. Pickering,G.N. George, M.N. Fodje, J. Synchrotron Radiat. submitted], we expectnear-edge spectra to be used increasingly in protein crystallographyof metalloproteins.
3.3. Polarized X-ray absorption spectroscopy
If a single crystal or oriented sample is available then polarizedX-ray absorption spectroscopy may be performed [42–44]. To a firstapproximation, the EXAFS amplitude A′(k,θ) in a polarized K-edgemeasurement is given by A′(k,θ)=3A(k)cos 2θ, where θ is the anglebetween an absorber backscatter bond and the X-ray e-vector, andA(k) is the unpolarized amplitude function (Eq. (1)). For dipole-allowed Δl=±1 transitions of near-edge spectra the same 3 cos 2θrelation holds, and again θ is the angle between e and the dipole tran-sition operator. For the weak Δl=±2 1s→3d transitions, intensitiesdepend upon both the X-ray electric vector e and the direction vectork; Pickering and George have given concise expressions for the angu-lar variation in intensity for Δl=±2 transitions to d-orbitals [44].Beamline infrastructure dedicated to single crystal measurementshas been developed on beamlines designed for X-ray absorptionspectroscopy e.g. [45], constituting a powerful addition to thespectroscopist's arsenal.
3.4. EXAFS and small molecule X-ray crystallography
Before turning to protein crystal structures, it may be instructiveto examine cases where EXAFS has been used to provide additionalstructural information on small molecule crystal structures. Becauseof the accuracy and maturity of the technique, small molecule crystal-lography is normally considered to be infallible, which is indeed veryclose to the truth. Nevertheless, there are a few well known examplesfor which information from small molecule crystallography has beenmisleading.
3.4.1. Distortional isomersOne such example is provided by the Mo_O distortional isomers,
in which two apparent forms, colored blue and green, of a Mo(IV)mono-oxo species had remarkably different Mo_O bond-lengths.The blue form had a typical Mo_O bond-length of 1.68 Å whereasthe green one exhibited an anomalously long Mo_O bond-length of1.80 Å [46]. The apparent presence of such bond-stretch isomerstriggered theoretical attempts to explain them [47,48]. Subsequentwork [49] indicated that co-crystallization of yellow halide startingmaterial to give a green material was responsible for an erroneouslylong Mo_O bond-length by dint of partial occupancy of Mo\Cl inplace of Mo_O. As discussed by Enemark and co-workers, similarissues are likely present in most other reported cases of metal oxodistortional isomers [49,50]. EXAFS played no role in unravelingthis particular problem, but had it been applied the true Mo_O
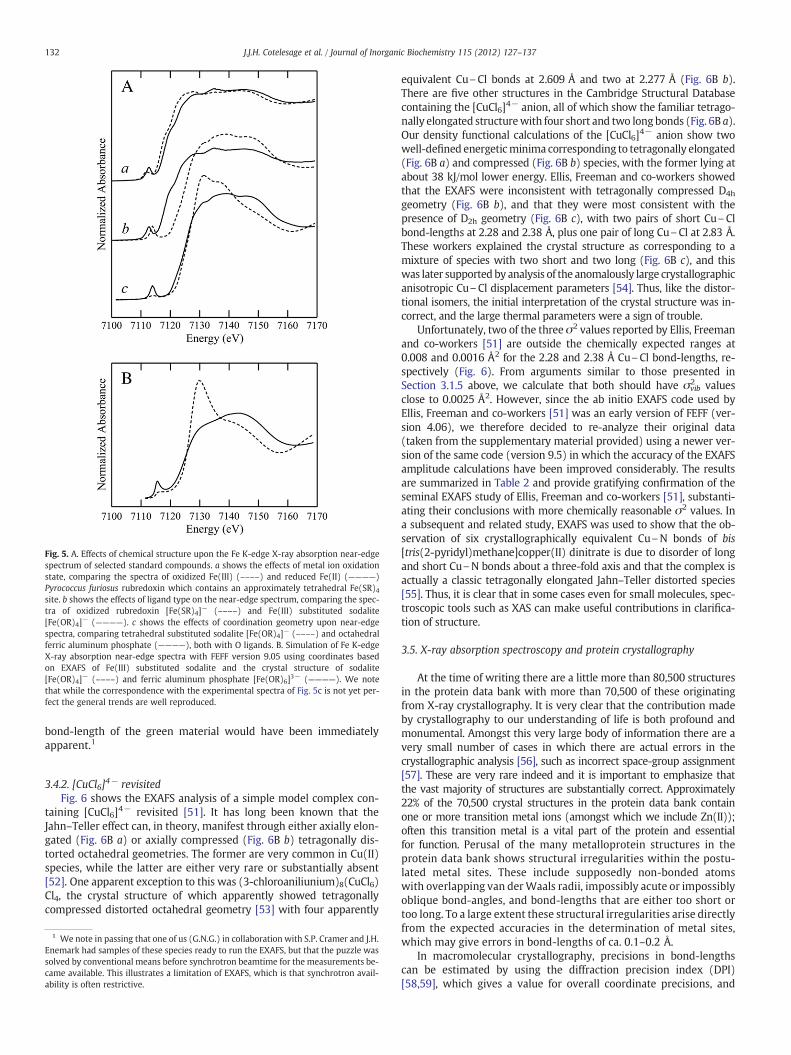
Fig. 5. A. Effects of chemical structure upon the Fe K-edge X-ray absorption near-edgespectrum of selected standard compounds. a shows the effects of metal ion oxidationstate, comparing the spectra of oxidized Fe(III) (––––) and reduced Fe(II) (————)Pyrococcus furiosus rubredoxin which contains an approximately tetrahedral Fe(SR)4site. b shows the effects of ligand type on the near-edge spectrum, comparing the spec-tra of oxidized rubredoxin [Fe(SR)4]− (––––) and Fe(III) substituted sodalite[Fe(OR)4]− (————). c shows the effects of coordination geometry upon near-edgespectra, comparing tetrahedral substituted sodalite [Fe(OR)4]− (––––) and octahedralferric aluminum phosphate (————), both with O ligands. B. Simulation of Fe K-edgeX-ray absorption near-edge spectra with FEFF version 9.05 using coordinates basedon EXAFS of Fe(III) substituted sodalite and the crystal structure of sodalite[Fe(OR)4]− (––––) and ferric aluminum phosphate [Fe(OR)6]3− (————). We notethat while the correspondence with the experimental spectra of Fig. 5c is not yet per-fect the general trends are well reproduced.
132 J.J.H. Cotelesage et al. / Journal of Inorganic Biochemistry 115 (2012) 127–137
bond-length of the green material would have been immediatelyapparent.1
3.4.2. [CuCl6]4− revisited
Fig. 6 shows the EXAFS analysis of a simple model complex con-taining [CuCl6]4− revisited [51]. It has long been known that theJahn–Teller effect can, in theory, manifest through either axially elon-gated (Fig. 6B a) or axially compressed (Fig. 6B b) tetragonally dis-torted octahedral geometries. The former are very common in Cu(II)species, while the latter are either very rare or substantially absent[52]. One apparent exception to this was (3-chloroaniliunium)8(CuCl6)Cl4, the crystal structure of which apparently showed tetragonallycompressed distorted octahedral geometry [53] with four apparently
1 We note in passing that one of us (G.N.G.) in collaboration with S.P. Cramer and J.H.Enemark had samples of these species ready to run the EXAFS, but that the puzzle wassolved by conventional means before synchrotron beamtime for the measurements be-came available. This illustrates a limitation of EXAFS, which is that synchrotron avail-ability is often restrictive.
equivalent Cu\Cl bonds at 2.609 Å and two at 2.277 Å (Fig. 6B b).There are five other structures in the Cambridge Structural Databasecontaining the [CuCl6]4− anion, all of which show the familiar tetrago-nally elongated structurewith four short and two long bonds (Fig. 6B a).Our density functional calculations of the [CuCl6]4− anion show twowell-defined energeticminima corresponding to tetragonally elongated(Fig. 6B a) and compressed (Fig. 6B b) species, with the former lying atabout 38 kJ/mol lower energy. Ellis, Freeman and co-workers showedthat the EXAFS were inconsistent with tetragonally compressed D4h
geometry (Fig. 6B b), and that they were most consistent with thepresence of D2h geometry (Fig. 6B c), with two pairs of short Cu\Clbond-lengths at 2.28 and 2.38 Å, plus one pair of long Cu\Cl at 2.83 Å.These workers explained the crystal structure as corresponding to amixture of species with two short and two long (Fig. 6B c), and thiswas later supported by analysis of the anomalously large crystallographicanisotropic Cu\Cl displacement parameters [54]. Thus, like the distor-tional isomers, the initial interpretation of the crystal structure was in-correct, and the large thermal parameters were a sign of trouble.
Unfortunately, two of the three σ2 values reported by Ellis, Freemanand co-workers [51] are outside the chemically expected ranges at0.008 and 0.0016 Å2 for the 2.28 and 2.38 Å Cu\Cl bond-lengths, re-spectively (Fig. 6). From arguments similar to those presented inSection 3.1.5 above, we calculate that both should have σvib
2 valuesclose to 0.0025 Å2. However, since the ab initio EXAFS code used byEllis, Freeman and co-workers [51] was an early version of FEFF (ver-sion 4.06), we therefore decided to re-analyze their original data(taken from the supplementary material provided) using a newer ver-sion of the same code (version 9.5) in which the accuracy of the EXAFSamplitude calculations have been improved considerably. The resultsare summarized in Table 2 and provide gratifying confirmation of theseminal EXAFS study of Ellis, Freeman and co-workers [51], substanti-ating their conclusions with more chemically reasonable σ2 values. Ina subsequent and related study, EXAFS was used to show that the ob-servation of six crystallographically equivalent Cu\N bonds of bis[tris(2-pyridyl)methane]copper(II) dinitrate is due to disorder of longand short Cu\N bonds about a three-fold axis and that the complex isactually a classic tetragonally elongated Jahn–Teller distorted species[55]. Thus, it is clear that in some cases even for small molecules, spec-troscopic tools such as XAS can make useful contributions in clarifica-tion of structure.
3.5. X-ray absorption spectroscopy and protein crystallography
At the time of writing there are a little more than 80,500 structuresin the protein data bank with more than 70,500 of these originatingfrom X-ray crystallography. It is very clear that the contribution madeby crystallography to our understanding of life is both profound andmonumental. Amongst this very large body of information there are avery small number of cases in which there are actual errors in thecrystallographic analysis [56], such as incorrect space-group assignment[57]. These are very rare indeed and it is important to emphasize thatthe vast majority of structures are substantially correct. Approximately22% of the 70,500 crystal structures in the protein data bank containone or more transition metal ions (amongst which we include Zn(II));often this transition metal is a vital part of the protein and essentialfor function. Perusal of the many metalloprotein structures in theprotein data bank shows structural irregularities within the postu-lated metal sites. These include supposedly non-bonded atomswith overlapping van derWaals radii, impossibly acute or impossiblyoblique bond-angles, and bond-lengths that are either too short ortoo long. To a large extent these structural irregularities arise directlyfrom the expected accuracies in the determination of metal sites,which may give errors in bond-lengths of ca. 0.1–0.2 Å.
In macromolecular crystallography, precisions in bond-lengthscan be estimated by using the diffraction precision index (DPI)[58,59], which gives a value for overall coordinate precisions, and
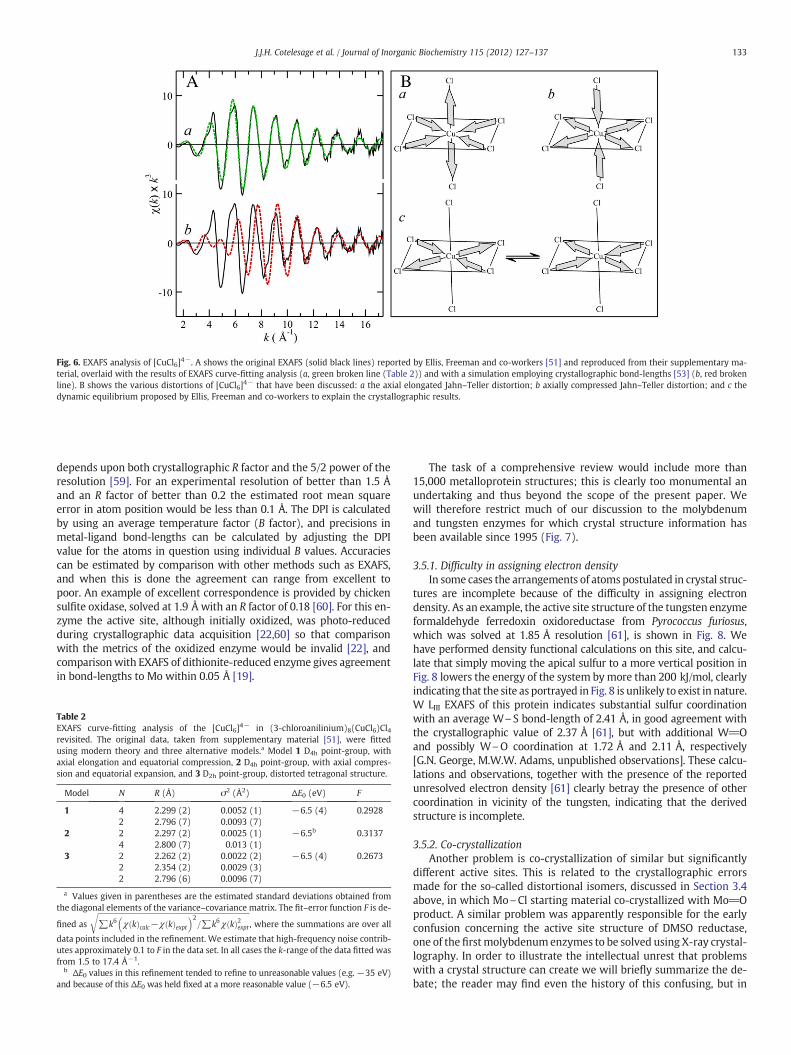
Fig. 6. EXAFS analysis of [CuCl6]4−. A shows the original EXAFS (solid black lines) reported by Ellis, Freeman and co-workers [51] and reproduced from their supplementary ma-terial, overlaid with the results of EXAFS curve-fitting analysis (a, green broken line (Table 2)) and with a simulation employing crystallographic bond-lengths [53] (b, red brokenline). B shows the various distortions of [CuCl6]4− that have been discussed: a the axial elongated Jahn–Teller distortion; b axially compressed Jahn–Teller distortion; and c thedynamic equilibrium proposed by Ellis, Freeman and co-workers to explain the crystallographic results.
133J.J.H. Cotelesage et al. / Journal of Inorganic Biochemistry 115 (2012) 127–137
depends upon both crystallographic R factor and the 5/2 power of theresolution [59]. For an experimental resolution of better than 1.5 Åand an R factor of better than 0.2 the estimated root mean squareerror in atom position would be less than 0.1 Å. The DPI is calculatedby using an average temperature factor (B factor), and precisions inmetal-ligand bond-lengths can be calculated by adjusting the DPIvalue for the atoms in question using individual B values. Accuraciescan be estimated by comparison with other methods such as EXAFS,and when this is done the agreement can range from excellent topoor. An example of excellent correspondence is provided by chickensulfite oxidase, solved at 1.9 Å with an R factor of 0.18 [60]. For this en-zyme the active site, although initially oxidized, was photo-reducedduring crystallographic data acquisition [22,60] so that comparisonwith the metrics of the oxidized enzyme would be invalid [22], andcomparisonwith EXAFS of dithionite-reduced enzyme gives agreementin bond-lengths to Mo within 0.05 Å [19].
Table 2EXAFS curve-fitting analysis of the [CuCl6]4− in (3-chloroanilinium)8(CuCl6)Cl4revisited. The original data, taken from supplementary material [51], were fittedusing modern theory and three alternative models.a Model 1 D4h point-group, withaxial elongation and equatorial compression, 2 D4h point-group, with axial compres-sion and equatorial expansion, and 3 D2h point-group, distorted tetragonal structure.
Model N R (Å) σ2 (Å2) ΔE0 (eV) F
1 4 2.299 (2) 0.0052 (1) −6.5 (4) 0.29282 2.796 (7) 0.0093 (7)
2 2 2.297 (2) 0.0025 (1) −6.5b 0.31374 2.800 (7) 0.013 (1)
3 2 2.262 (2) 0.0022 (2) −6.5 (4) 0.26732 2.354 (2) 0.0029 (3)2 2.796 (6) 0.0096 (7)
a Values given in parentheses are the estimated standard deviations obtained fromthe diagonal elements of the variance–covariance matrix. The fit–error function F is de-
fined as
ffiffiffiffiffiffiffiffiffiffiffiffiffiffiffiffiffiffiffiffiffiffiffiffiffiffiffiffiffiffiffiffiffiffiffiffiffiffiffiffiffiffiffiffiffiffiffiffiffiffiffiffiffiffiffiffiffiffiffiffiffiffiffiffiffiffiffiffiffiffiffiffiffiffiffiffiffiffiffiffiffiffiffiffiffiffi∑k6 χ kð Þcalc−χ kð Þexpt
� �2=∑k6χ kð Þ2expt
r, where the summations are over all
data points included in the refinement. We estimate that high-frequency noise contrib-utes approximately 0.1 to F in the data set. In all cases the k-range of the data fitted wasfrom 1.5 to 17.4 Å−1.
b ΔE0 values in this refinement tended to refine to unreasonable values (e.g. −35 eV)and because of this ΔE0 was held fixed at a more reasonable value (−6.5 eV).
The task of a comprehensive review would include more than15,000 metalloprotein structures; this is clearly too monumental anundertaking and thus beyond the scope of the present paper. Wewill therefore restrict much of our discussion to the molybdenumand tungsten enzymes for which crystal structure information hasbeen available since 1995 (Fig. 7).
3.5.1. Difficulty in assigning electron densityIn some cases the arrangements of atoms postulated in crystal struc-
tures are incomplete because of the difficulty in assigning electrondensity. As an example, the active site structure of the tungsten enzymeformaldehyde ferredoxin oxidoreductase from Pyrococcus furiosus,which was solved at 1.85 Å resolution [61], is shown in Fig. 8. Wehave performed density functional calculations on this site, and calcu-late that simply moving the apical sulfur to a more vertical position inFig. 8 lowers the energy of the system bymore than 200 kJ/mol, clearlyindicating that the site as portrayed in Fig. 8 is unlikely to exist in nature.W LIII EXAFS of this protein indicates substantial sulfur coordinationwith an average W\S bond-length of 2.41 Å, in good agreement withthe crystallographic value of 2.37 Å [61], but with additional W_Oand possibly W\O coordination at 1.72 Å and 2.11 Å, respectively[G.N. George, M.W.W. Adams, unpublished observations]. These calcu-lations and observations, together with the presence of the reportedunresolved electron density [61] clearly betray the presence of othercoordination in vicinity of the tungsten, indicating that the derivedstructure is incomplete.
3.5.2. Co-crystallizationAnother problem is co-crystallization of similar but significantly
different active sites. This is related to the crystallographic errorsmade for the so-called distortional isomers, discussed in Section 3.4above, in which Mo\Cl starting material co-crystallized with Mo_Oproduct. A similar problem was apparently responsible for the earlyconfusion concerning the active site structure of DMSO reductase,one of the firstmolybdenumenzymes to be solved using X-ray crystal-lography. In order to illustrate the intellectual unrest that problemswith a crystal structure can create we will briefly summarize the de-bate; the reader may find even the history of this confusing, but in
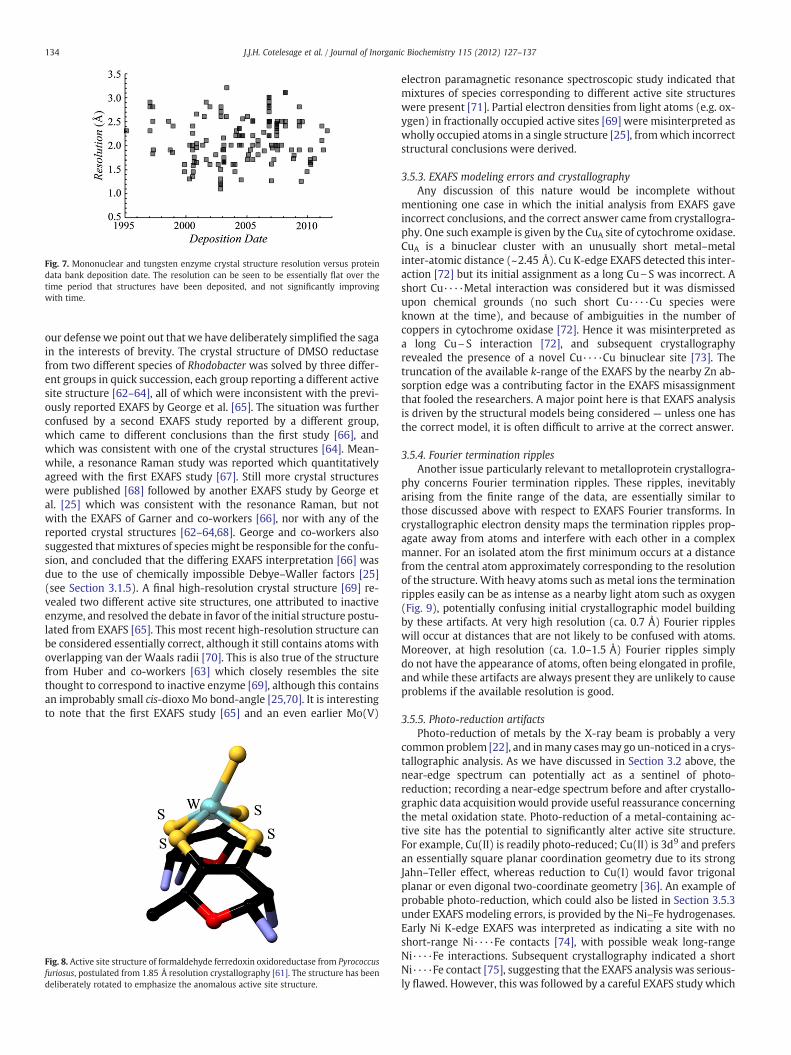
Fig. 7. Mononuclear and tungsten enzyme crystal structure resolution versus proteindata bank deposition date. The resolution can be seen to be essentially flat over thetime period that structures have been deposited, and not significantly improvingwith time.
134 J.J.H. Cotelesage et al. / Journal of Inorganic Biochemistry 115 (2012) 127–137
our defense we point out that we have deliberately simplified the sagain the interests of brevity. The crystal structure of DMSO reductasefrom two different species of Rhodobacter was solved by three differ-ent groups in quick succession, each group reporting a different activesite structure [62–64], all of which were inconsistent with the previ-ously reported EXAFS by George et al. [65]. The situation was furtherconfused by a second EXAFS study reported by a different group,which came to different conclusions than the first study [66], andwhich was consistent with one of the crystal structures [64]. Mean-while, a resonance Raman study was reported which quantitativelyagreed with the first EXAFS study [67]. Still more crystal structureswere published [68] followed by another EXAFS study by George etal. [25] which was consistent with the resonance Raman, but notwith the EXAFS of Garner and co-workers [66], nor with any of thereported crystal structures [62–64,68]. George and co-workers alsosuggested that mixtures of species might be responsible for the confu-sion, and concluded that the differing EXAFS interpretation [66] wasdue to the use of chemically impossible Debye–Waller factors [25](see Section 3.1.5). A final high-resolution crystal structure [69] re-vealed two different active site structures, one attributed to inactiveenzyme, and resolved the debate in favor of the initial structure postu-lated from EXAFS [65]. This most recent high-resolution structure canbe considered essentially correct, although it still contains atoms withoverlapping van der Waals radii [70]. This is also true of the structurefrom Huber and co-workers [63] which closely resembles the sitethought to correspond to inactive enzyme [69], although this containsan improbably small cis-dioxo Mo bond-angle [25,70]. It is interestingto note that the first EXAFS study [65] and an even earlier Mo(V)
Fig. 8. Active site structure of formaldehyde ferredoxin oxidoreductase from Pyrococcusfuriosus, postulated from 1.85 Å resolution crystallography [61]. The structure has beendeliberately rotated to emphasize the anomalous active site structure.
electron paramagnetic resonance spectroscopic study indicated thatmixtures of species corresponding to different active site structureswere present [71]. Partial electron densities from light atoms (e.g. ox-ygen) in fractionally occupied active sites [69] were misinterpreted aswholly occupied atoms in a single structure [25], fromwhich incorrectstructural conclusions were derived.
3.5.3. EXAFS modeling errors and crystallographyAny discussion of this nature would be incomplete without
mentioning one case in which the initial analysis from EXAFS gaveincorrect conclusions, and the correct answer came from crystallogra-phy. One such example is given by the CuA site of cytochrome oxidase.CuA is a binuclear cluster with an unusually short metal–metalinter-atomic distance (~2.45 Å). Cu K-edge EXAFS detected this inter-action [72] but its initial assignment as a long Cu\S was incorrect. Ashort Cu····Metal interaction was considered but it was dismissedupon chemical grounds (no such short Cu····Cu species wereknown at the time), and because of ambiguities in the number ofcoppers in cytochrome oxidase [72]. Hence it was misinterpreted asa long Cu\S interaction [72], and subsequent crystallographyrevealed the presence of a novel Cu····Cu binuclear site [73]. Thetruncation of the available k-range of the EXAFS by the nearby Zn ab-sorption edge was a contributing factor in the EXAFS misassignmentthat fooled the researchers. A major point here is that EXAFS analysisis driven by the structural models being considered — unless one hasthe correct model, it is often difficult to arrive at the correct answer.
3.5.4. Fourier termination ripplesAnother issue particularly relevant to metalloprotein crystallogra-
phy concerns Fourier termination ripples. These ripples, inevitablyarising from the finite range of the data, are essentially similar tothose discussed above with respect to EXAFS Fourier transforms. Incrystallographic electron density maps the termination ripples prop-agate away from atoms and interfere with each other in a complexmanner. For an isolated atom the first minimum occurs at a distancefrom the central atom approximately corresponding to the resolutionof the structure. With heavy atoms such as metal ions the terminationripples easily can be as intense as a nearby light atom such as oxygen(Fig. 9), potentially confusing initial crystallographic model buildingby these artifacts. At very high resolution (ca. 0.7 Å) Fourier rippleswill occur at distances that are not likely to be confused with atoms.Moreover, at high resolution (ca. 1.0–1.5 Å) Fourier ripples simplydo not have the appearance of atoms, often being elongated in profile,and while these artifacts are always present they are unlikely to causeproblems if the available resolution is good.
3.5.5. Photo-reduction artifactsPhoto-reduction of metals by the X-ray beam is probably a very
commonproblem [22], and inmany casesmay go un-noticed in a crys-tallographic analysis. As we have discussed in Section 3.2 above, thenear-edge spectrum can potentially act as a sentinel of photo-reduction; recording a near-edge spectrum before and after crystallo-graphic data acquisitionwould provide useful reassurance concerningthe metal oxidation state. Photo-reduction of a metal-containing ac-tive site has the potential to significantly alter active site structure.For example, Cu(II) is readily photo-reduced; Cu(II) is 3d9 and prefersan essentially square planar coordination geometry due to its strongJahn–Teller effect, whereas reduction to Cu(I) would favor trigonalplanar or even digonal two-coordinate geometry [36]. An example ofprobable photo-reduction, which could also be listed in Section 3.5.3under EXAFS modeling errors, is provided by the Ni–Fe hydrogenases.Early Ni K-edge EXAFS was interpreted as indicating a site with noshort-range Ni····Fe contacts [74], with possible weak long-rangeNi····Fe interactions. Subsequent crystallography indicated a shortNi····Fe contact [75], suggesting that the EXAFS analysis was serious-ly flawed. However, this was followed by a careful EXAFS study which
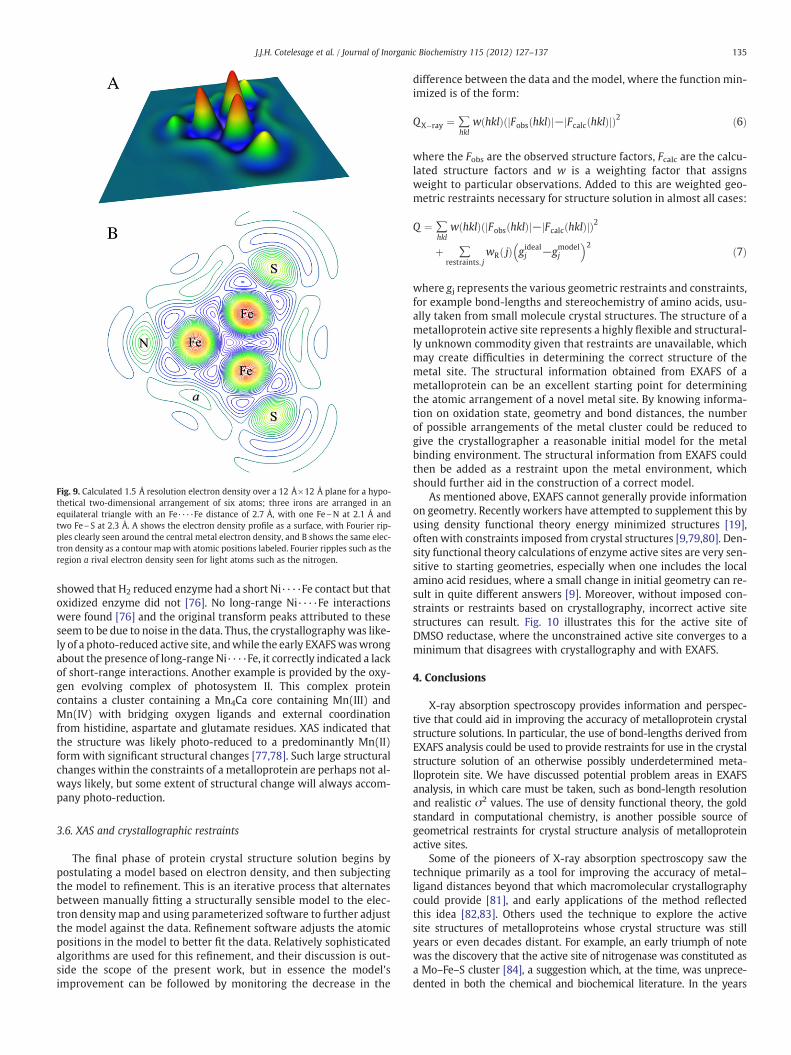
Fig. 9. Calculated 1.5 Å resolution electron density over a 12 Å×12 Å plane for a hypo-thetical two-dimensional arrangement of six atoms; three irons are arranged in anequilateral triangle with an Fe····Fe distance of 2.7 Å, with one Fe\N at 2.1 Å andtwo Fe\S at 2.3 Å. A shows the electron density profile as a surface, with Fourier rip-ples clearly seen around the central metal electron density, and B shows the same elec-tron density as a contour map with atomic positions labeled. Fourier ripples such as theregion a rival electron density seen for light atoms such as the nitrogen.
135J.J.H. Cotelesage et al. / Journal of Inorganic Biochemistry 115 (2012) 127–137
showed that H2 reduced enzyme had a short Ni····Fe contact but thatoxidized enzyme did not [76]. No long-range Ni····Fe interactionswere found [76] and the original transform peaks attributed to theseseem to be due to noise in the data. Thus, the crystallographywas like-ly of a photo-reduced active site, andwhile the early EXAFSwaswrongabout the presence of long-range Ni····Fe, it correctly indicated a lackof short-range interactions. Another example is provided by the oxy-gen evolving complex of photosystem II. This complex proteincontains a cluster containing a Mn4Ca core containing Mn(III) andMn(IV) with bridging oxygen ligands and external coordinationfrom histidine, aspartate and glutamate residues. XAS indicated thatthe structure was likely photo-reduced to a predominantly Mn(II)form with significant structural changes [77,78]. Such large structuralchanges within the constraints of a metalloprotein are perhaps not al-ways likely, but some extent of structural change will always accom-pany photo-reduction.
3.6. XAS and crystallographic restraints
The final phase of protein crystal structure solution begins bypostulating a model based on electron density, and then subjectingthe model to refinement. This is an iterative process that alternatesbetween manually fitting a structurally sensible model to the elec-tron density map and using parameterized software to further adjustthe model against the data. Refinement software adjusts the atomicpositions in the model to better fit the data. Relatively sophisticatedalgorithms are used for this refinement, and their discussion is out-side the scope of the present work, but in essence the model'simprovement can be followed by monitoring the decrease in the
difference between the data and the model, where the function min-imized is of the form:
QX�ray ¼ ∑hkl
w hklð Þ Fobs hklð Þj j− Fcalc hklð Þj jð Þ2 ð6Þ
where the Fobs are the observed structure factors, Fcalc are the calcu-lated structure factors and w is a weighting factor that assignsweight to particular observations. Added to this are weighted geo-metric restraints necessary for structure solution in almost all cases:
Q ¼ ∑hkl
w hklð Þ Fobs hklð Þj j− Fcalc hklð Þj jð Þ2
þ ∑restraints; j
wR jð Þ gidealj −gmodelj
� �2 ð7Þ
where gj represents the various geometric restraints and constraints,for example bond-lengths and stereochemistry of amino acids, usu-ally taken from small molecule crystal structures. The structure of ametalloprotein active site represents a highly flexible and structural-ly unknown commodity given that restraints are unavailable, whichmay create difficulties in determining the correct structure of themetal site. The structural information obtained from EXAFS of ametalloprotein can be an excellent starting point for determiningthe atomic arrangement of a novel metal site. By knowing informa-tion on oxidation state, geometry and bond distances, the numberof possible arrangements of the metal cluster could be reduced togive the crystallographer a reasonable initial model for the metalbinding environment. The structural information from EXAFS couldthen be added as a restraint upon the metal environment, whichshould further aid in the construction of a correct model.
As mentioned above, EXAFS cannot generally provide informationon geometry. Recently workers have attempted to supplement this byusing density functional theory energy minimized structures [19],often with constraints imposed from crystal structures [9,79,80]. Den-sity functional theory calculations of enzyme active sites are very sen-sitive to starting geometries, especially when one includes the localamino acid residues, where a small change in initial geometry can re-sult in quite different answers [9]. Moreover, without imposed con-straints or restraints based on crystallography, incorrect active sitestructures can result. Fig. 10 illustrates this for the active site ofDMSO reductase, where the unconstrained active site converges to aminimum that disagrees with crystallography and with EXAFS.
4. Conclusions
X-ray absorption spectroscopy provides information and perspec-tive that could aid in improving the accuracy of metalloprotein crystalstructure solutions. In particular, the use of bond-lengths derived fromEXAFS analysis could be used to provide restraints for use in the crystalstructure solution of an otherwise possibly underdetermined meta-lloprotein site. We have discussed potential problem areas in EXAFSanalysis, in which care must be taken, such as bond-length resolutionand realistic σ2 values. The use of density functional theory, the goldstandard in computational chemistry, is another possible source ofgeometrical restraints for crystal structure analysis of metalloproteinactive sites.
Some of the pioneers of X-ray absorption spectroscopy saw thetechnique primarily as a tool for improving the accuracy of metal–ligand distances beyond that which macromolecular crystallographycould provide [81], and early applications of the method reflectedthis idea [82,83]. Others used the technique to explore the activesite structures of metalloproteins whose crystal structure was stillyears or even decades distant. For example, an early triumph of notewas the discovery that the active site of nitrogenase was constituted asa Mo–Fe–S cluster [84], a suggestion which, at the time, was unprece-dented in both the chemical and biochemical literature. In the years

Fig. 10. Superposition of energy minimized geometry optimized density functional the-ory structures for the active site of DMSO reductase, with and without imposed con-straints from the crystal structure. The structure obtained without constraintsderived from crystallography is remarkably different from that obtained when usingthem. Moreover, the Mo\S bond-lengths from the unconstrained refinement are notconsistent with our EXAFS analyses [25,65], with a long 2.6 Å Mo\S, located trans tothe Mo_O group. Both geometry optimizations started from the crystal structure coor-dinates [69]. Hydrogen atoms were added to the crystal structure to appropriately ter-minate bonds, and are not shown in the interests of clarity.
136 J.J.H. Cotelesage et al. / Journal of Inorganic Biochemistry 115 (2012) 127–137
since these pioneering efforts, this second application of the methodhas predominated, although the method still makes contributions inimproving the accuracy of crystallographic work [23,36,80,85]. As XASinfrastructure and theory continue to improve we can expect XAS tofurther mature from being a somewhat esoteric technique used onlyby specialists, to being one of the many spectroscopic tools employedby the inorganic biochemist to solve structural problems. In our view,the increase in the capabilities and throughput of macromolecular crys-tallographymeans that the contributions of XAS as an ancillary methodto crystallography are likely to increase. Indeed, XAS experimental fa-cilities are now appearing on beamlines optimized for macromolec-ular crystallography [J.J.H. Cotelesage, P. Grochulski, I.J. Pickering, G.N.George, M.N. Fodje, J. Synchrotron Radiat. submitted]. Thus, the tech-nique may in a sense come full circle, with renewed importance of therole that was suggested in the very first application [82]; a role whichHans Freeman clearly realized could be important.
Acknowledgments
Work at the University of Saskatchewan was supported by the Nat-ural Sciences and Engineering Research Council of Canada, the CanadianInstitutes for Health Research (CIHR) and the Saskatchewan Health Re-search Foundation (SHRF). G.N.G. and I.J.P. are Canada Research Chairs.J.J.H.C. and M.J.P. are Fellows in the CIHR Training grant in Health Re-search Using Synchrotron Techniques (CIHR-THRUST). M.J.P. is a CIHRPostdoctoral Fellow and is also supported by SHRF. Further supportwas available from PrioNet Canada. Portions of this work were carriedout at the Stanford Synchrotron Radiation Lightsource, a Directorate ofSLAC National Accelerator Laboratory and an Office of Science User Fa-cility operated for the U.S. Department of Energy Office of Science byStanford University. The SSRL Structural Molecular Biology Program issupported by the DOE Office of Biological and Environmental Research,
and by the National Institutes of Health, National Center for ResearchResources (5P41RR001209) and the National Institute of GeneralMedical Sciences (8 P41 GM103393). The Canadian Light Source issupported by the Natural Sciences and Engineering Research Councilof Canada, the National Research Council Canada, the Canadian Insti-tutes of Health Research, the Province of Saskatchewan, Western Eco-nomic Diversification Canada, and the University of Saskatchewan.
References
[1] M. Jakolski, M. Gilski, Z. Dauter, A. Wlodawer, Biol. Cryst. D 63 (2007) 611–620.[2] R. Engh, R. Huber, Acta Crystallogr. A 47 (1991) 392–400.[3] M. Sommerhalter, R.L. Lieberman, A.C. Rosenzweig, Inorg. Chem. 44 (2005)
770–778.[4] H. Schindelin, C. Kisker, D.C. Rees, J. Biol. Inorg. Chem. 2 (1997) 773–781.[5] O. Einsle, F.A. Tezcan, S.L.A. Andrade, B. Schmid, M. Yoshida, J.B. Howard, D.C.
Rees, Science 297 (2002) 1696–1700.[6] J.M. Guss, E.A. Merritt, R.P. Phizackerley, B. Hedman, M. Murata, K.O. Hodgson,
H.C. Freeman, Science 241 (1988) 806–811.[7] R.A. Scott, J.E. Hahn, S. Doniach, H.C. Freeman, K.O. Hodgson, J. Am. Chem. Soc. 104
(1982) 5364–5369.[8] J.E. Penner-Hahn, M. Murata, K.O. Hodgson, H.C. Freeman, Inorg. Chem. 28 (1989)
1826–1832.[9] M.J. Pushie, C.J. Doonan, H.L. Wilson, K.V. Rajagopalan, G.N. George, Inorg. Chem.
50 (2011) 9406–9413.[10] B. Delley, J. Chem. Phys. 92 (1990) 508–517.[11] B. Delley, J. Chem. Phys. 113 (2000) 7756–7764.[12] J.P. Perdew, K. Burke, M. Ernzerhof, Phys. Rev. Lett. 77 (1996) 3865–3868.[13] J.P. Perdew, K. Burke, M. Ernzerhof, Phys. Rev. Lett. 78 (1997) 1396.[14] A. Klamt, G. Schüürmann, J. Chem. Soc., Perkin Trans. 2 2 (1993) 799–805.[15] T.C. Weng, G.S. Waldo, J.E. Penner-Hahn, J. Synchrotron Radiat. 12 (2005) 506–510.[16] K. Clark-Baldwin, D.L. Tierney, N. Govindaswamy, E.S. Gruff, C. Kim, J. Berg, S.A. Koch,
J.E. Penner-Hahn, J. Am. Chem. Soc. 120 (1998) 8401–8409.[17] D. Coucouvanis, M.G. Kanatzidis, W.R. Dunham, W.R. Hagen, J. Am. Chem. Soc. 106
(1984) 7998–7999.[18] S.P. Cramer, K.O. Hodgson, E.I. Stiefel, W.E. Newton, J. Am. Chem. Soc. 100 (1978)
2748–2761.[19] H.H. Harris, G.N. George, K.V. Rajagopalan, Inorg. Chem. 45 (2006) 493–495.[20] M. Korbas, A.J. Percy, J. Gailer, G.N. George, J. Biol. Inorg. Chem. 13 (2008) 461–470.[21] J. Yano, Y. Pushkar, P. Glatzel, A. Lewis, K. Sauer, J. Messinger, U. Bergmann,
V. Yachandra, J. Am. Chem. Soc. 127 (2005) 14974–14975.[22] G.N. George, I.J. Pickering, C. Kisker, Inorg. Chem. 38 (1999) 2539–2540.[23] F.D. Vila, V.E. Lindahl, J.J. Rehr, Phys. Rev. B 85 (2012) (024303-1-9).[24] S.P. Cramer, R. Wahl, K.V. Rajagopalan, J. Am. Chem. Soc. 103 (1981) 7721–7727.[25] G.N. George, J. Hilton, C. Temple, R.C. Prince, K.V. Rajagopalan, J. Am. Chem. Soc.
121 (1999) 1256–1266.[26] A.V. Poirakova, J.J. Rehr, J. Synchrotron Radiat. 8 (2001) 313–314.[27] J.R. Bradbury, M.F. Mackay, A.G. Wedd, Aust. J. Chem. 31 (1978) 2423–2430.[28] S. Boyde, S.R. Ellis, C.D. Garner, W. Clegg, J. Chem. Soc. Chem. Commun. (1986)
1541–1543.[29] G.N. George, I.J. Pickering, X-ray absorption spectroscopy in biology and chemistry,
In: in: V. Tsakanov, H. Wiedemann (Eds.), Brilliant Light in Life and MaterialsSciences, Springer, Dordrecht, NL, 2007, pp. 97–119.
[30] A. Levina, R.S. Armstrong, P.A. Lay, Coord. Chem. Rev. 249 (2005) 141–160.[31] G.C. Ferreira, R. Franco, A. Mangravita, G.N. George, Biochemistry 41 (2002)
4809–4818.[32] M.J. Pushie, C.J. Doonan, H.L. Wilson, K.V. Rajagopalan, G.N. George, Inorg. Chem.
50 (2011) 9406–9413.[33] M.K. Eidsness, A.M. Flank, B.E. Smith, A. Flood, C.D. Garner, S.P. Cramer, J. Am.
Chem. Soc. 108 (1986) 2746–2747.[34] H.I. Liu, A. Filipponi, N. Cavini, B.K. Burgess, B. Hedman, A. Di Cicco, C.R. Natoli,
K.O. Hodgson, J. Am. Chem. Soc. 116 (1994) 2418–2423.[35] S.J. George, B.M. Barney, D. Mitra, R.Y. Igarashi, Y. Guo, D.R. Dean, S.P. Cramer,
L.C. Seefeldt, J. Inorg. Biochem. 112 (2012) 85–92.[36] M.J. Pushie, L. Zhang, I.J. Pickering, G.N. George, Biochim. Biophys. Acta 1817
(2012) 938–947.[37] L. Zhang, I.J. Pickering, D.R. Winge, G.N. George, Chem. Biodivers. 5 (2008)
2042–2049.[38] K.B. Musgrave, H.C. Angove, B.K. Burgess, B. Hedman, K.O. Hodgson, J. Am. Chem.
Soc. 120 (1998) 5325–5326.[39] P. Strop, P.M. Takahara, H.-J. Chiu, H.C. Angove, B.K. Burgess, D.C. Rees, Biochemistry
40 (2001) 651–656.[40] http://www.fhi-berlin.mpg.de/KHsoftware/StoBe/index.html.[41] J.J. Rehr, J.J. Kas, F.D. Vila, M.P. Prange, K. Jorissen, Phys. Chem. Chem. Phys. 12
(2010) 5503–5513.[42] G.N. George, R.C. Prince, T.G. Frey, S.P. Cramer, Physica B 158 (1989) 81–83.[43] G.N. George, R.C. Prince, S.P. Cramer, Science 244 (1989) 789–791.[44] I.J. Pickering, G.N. George, Inorg. Chem. 34 (1995) 3142–3152.[45] M.J. Latimer, K. Ito, S.E. McPhillips, B. Hedman, J. Synchrotron Radiat. 12 (2005)
23–27.[46] J. Chatt, L. Manojlovic-Muir, K.W. Muir, J. Chem. Soc. D (1971) 655–656.[47] Y. Jean, A. Lledos, J.K. Burdett, R. Hoffmann, J. Am. Chem. Soc. 110 (1988)
4506–4516.

137J.J.H. Cotelesage et al. / Journal of Inorganic Biochemistry 115 (2012) 127–137
[48] G. Parkin, Acc. Chem. Res. 25 (1992) 455–460.[49] P.J. Desrochers, K.W. Nebesny, M.J. LaBarre, S.E. Lincoln, T.M. Loehr, J.H. Enemark,
J. Am. Chem. Soc. 113 (1991) 9193–9200.[50] P.J. Desrochers, K.W. Nebesny, M.J. LaBarre, M.A. Bruck, G.F. Neilson, R.P. Sperline,
J.H. Enemark, G. Backes, K. Wieghardt, Inorg. Chem. 33 (1994) 15–24.[51] P.J. Ellis, H.C. Freeman, M.A. Hitchman, D. Reinen, B. Wagner, Inorg. Chem. 33
(1994) 1249–1250.[52] F.H. Allen, O. Kennard, D.G. Watson, Struct. Correl. 1 (1994) 71–110.[53] D. Tucker, P.S. White, K.L. Trojan, M.L. Kirk, W.E. Hatfield, Inorg. Chem. 30 (1991)
823–826.[54] M. Wei, R.D. Willett, Inorg. Chem. 34 (1995) 3780–3784.[55] T. Astley, P.J. Ellis, H.C. Freeman, M.A. Hitchman, F.R. Keene, E.R.T. Tiekink, J. Chem.
Soc., Dalton Trans. (1995) 595–601.[56] D.E. Tronrud, B.W. Matthews, Protein Sci. 18 (2009) 2–5.[57] G.N. George, S.J. George, Trends Biochem. Sci. 13 (1988) 369–370.[58] D.W.J. Cruickshank, Acta Crystallogr. D Biol. Crystallogr. 55 (1999) 583–601.[59] D.M. Blow, Acta Crystallogr. D Biol. Crystallogr. 58 (2002) 792–797.[60] C. Kisker, H. Schindelin, A. Pacheco, W.A. Wehbi, R.M. Garrett, K.V. Rajagopalan,
J.H. Enemark, D.C. Rees, Cell 91 (1997) 973–983.[61] Y. Hu, S. Faham, R. Roy, M.W.W. Adams, D.C. Rees, J. Mol. Biol. 286 (1999)
899–914.[62] H. Schindelin, C. Kisker, J. Hilton, K.V. Rajagopalan, D.C. Rees, Science 272 (1996)
1615–1621.[63] F. Schneider, J. Löwe, R. Huber, H. Schindelin, C. Kisker, J. Knäblein, J. Mol. Biol. 263
(1996) 53–69.[64] A.S. McAlpine, A.G. McEwan, A.L. Shaw, S. Bailey, J. Biol. Inorg. Chem. 2 (1997)
690–701.[65] G.N. George, J. Hilton, K.V. Rajagopalan, J. Am. Chem. Soc. 118 (1996) 1113–1117.[66] P.E. Baugh, C.D. Garner, J.M. Charnock, D. Collison, E.S. Davies, A.S. McAlpine, S.
Bailey, I. Lane, G.R. Hanson, A.G. McEwan, J. Biol. Inorg. Chem. 2 (1997) 634–643.[67] S.D. Garton, J. Hilton, O. Hiroyuki, B.R. Crouse, K.V. Rajagopalan, M.K. Johnson, J. Am.
Chem. Soc. 119 (1997) 12906–12916.
[68] A.S. McAlpine, A.G. McEwan, S.J. Bailey, J. Mol. Biol. 275 (1998) 613–623.[69] H.K. Li, C. Temple, K.V. Rajagopalan, H. Schindelin, J. Am. Chem. Soc. 122 (2000)
7673–7680.[70] M.J. Pushie, G.N. George, Coord. Chem. Rev. 255 (2011) 1055–1084.[71] B. Bennett, N. Benson, A.G. McEwan, R.C. Bray, Biochem. J. 255 (1994) 321–331.[72] G.N. George, S.P. Cramer, T.G. Frey, R.C. Prince, Biochim. Biophys. Acta 1142
(1993) 240–252.[73] T. Tsukihara, H. Aoyama, E. Yamashita, T. Tomizaki, H. Yamaguchi, K. Shinzawa-Itoh,
R. Nakashima, R. Yaono, S. Yoshikawa, Science 269 (1995) 1069–1074.[74] C. Bagyinka, J.P. Whitehead, M.J. Maroney, J. Am. Chem. Soc. 115 (1993)
3576–3585.[75] A. Volbeda, M.-H. Charon, C. Piras, E.C. Hatchikian, M. Frey, J.C. Fontecilla-Camps,
Nature 373 (1995) 580–587.[76] W. Gu, L. Jacquamet, D.S. Patil, H.-X. Wang, D.J. Evans, M.C. Smith, M. Millar, S. Koch,
D.M. Eichhorn, M. Latimer, S.P. Cramer, J. Inorg. Biochem. 93 (2003) 41–51.[77] J. Yano, J. Kern, K. Sauer, M.J. Latimer, Y. Pushkar, J. Beisiadka, B. Loll, W. Saenger,
J. Messinger, A. Zoun, V. Yachandra, Science 314 (2006) 821–825.[78] A. Grudnmeier, H. Dau, Biochim. Biophys. Acta 1817 (2012) 88–105.[79] M.J. Pushie, C.J. Doonan, K. Moquin, J.H. Weiner, R. Rothery, G.N. George, Inorg.
Chem. 50 (2011) 732–740.[80] J.A.Qiu, H.L.Wilson,M.J. Pushie, C. Kisker, G.N. George, K.V. Rajagopalan, Biochemistry
49 (2010) 3989–4000.[81] R.G. Shulman, Trends Biochem. Sci. 4 (1979) N282–N283.[82] R.G. Shulman, P. Eisenberger, W.E. Blumberg, N.A. Stombaugh, Proc. Natl. Acad.
Sci. U. S. A. 72 (1975) 4003–4007.[83] P. Eisenberger, R.G. Shulman, B.M. Kincaid, G.S. Brown, S. Ogawa, Nature 274
(1978) 30–34.[84] S.P. Cramer, W.O. Gillum, K.O. Hodgson, L.E. Mortenson, E.I. Stiefel, J.R. Chisnell,
W.J. Brill, V.K. Shah, J. Am. Chem. Soc. 100 (1978) 3814–3819.[85] C.J. Doonan, A. Stockert, R. Hille, G.N. George, J. Am. Chem. Soc. 127 (2005)
4518–4522.