Be/X-ray Binaries - arXiv
30
arXiv:1101.5036v1 [astro-ph.HE] 26 Jan 2011 Be/X-ray Binaries Pablo Reig 1,2 Abstract The interest in X/γ -ray Astronomy has grown enor- mously in the last decades thanks to the ability to send X-ray space missions above the Earth’s atmosphere. There are more than half a million X-ray sources de- tected and over a hundred missions (past and currently operational) devoted to the study of cosmic X/γ rays. With the improved sensibilities of the currently active missions new detections occur almost on a daily ba- sis. Among these, neutron-star X-ray binaries form an important group because they are among the brightest extra-solar objects in the sky and are characterized by dramatic variability in brightness on timescales rang- ing from milliseconds to months and years. Their main source of power is the gravitational energy released by matter accreted from a companion star and falling onto the neutron star in a relatively close binary system. Neutron-star X-ray binaries divide into high-mass and low-mass systems according to whether the mass of the donor star is above ∼8 or below ∼2M ⊙ , respec- tively. Massive X-ray binaries divide further into super- giant X-ray binaries and Be/X-ray binaries depending on the evolutionary status of the optical companion. Virtually all Be/X-ray binaries show X-ray pulsations. Therefore, these systems can be used as unique natu- ral laboratories to investigate the properties of matter under extreme conditions of gravity and magnetic field. The purpose of this work is to review the obser- vational properties of Be/X-ray binaries. The open questions in Be/X-ray binaries include those related to the Be star companion, that is, the so-called ”Be phe- nomenon”, such as, timescales associated to the for- Pablo Reig 1 IESL, Foundation for Reseach and Technology-Hellas, 71110, Heraklion, Greece. 2 Physics Department, University of Crete, 71003, Heraklion, Greece. mation and dissipation of the equatorial disc, mass- ejection mechanisms, V/R variability, and rotation rates; those related to the neutron star, such as, mass determination, accretion physics, and spin period evo- lution; but also, those that result from the interaction of the two constituents, such as, disc truncation and mass transfer. Until recently, it was thought that the Be stars’ disc was not significantly affected by the neu- tron star. In this review, I present the observational evidence accumulated in recent years on the interaction between the circumstellar disc and the compact com- panion. The most obvious effect is the tidal truncation of the disc. As a result, the equatorial discs in Be/X- ray binaries are smaller and denser than those around isolated Be stars. Keywords X-rays: binaries – stars: neutron – stars: binaries close –stars: emission line, Be 1 Definition and classification of X-ray binaries In very general terms, one can simply define X-ray bina- ries as systems that consist of a compact object orbiting an optical companion. They are ”close” binary systems because there exists a transfer of mass from the optical component to the compact object. By ”optical compan- ion” it is understood that nuclear burning is still taking place in its interior. Figure 1 shows a tree-diagram de- picting all the different subsystems that comprise the generic group of X-ray binaries. In referring to the two components in an X-ray bi- nary one should be careful and learn which is the sub- ject of investigation as the same name can be used to mean different components. In massive X-ray bina- ries, the most massive star is normally termed primary whereas the less massive one is called secondary. In low- mass systems, the term primary refers to the neutron
-
Upload
khangminh22 -
Category
Documents
-
view
4 -
download
0
Transcript of Be/X-ray Binaries - arXiv

arX
iv:1
101.
5036
v1 [
astr
o-ph
.HE
] 2
6 Ja
n 20
11
Be/X-ray Binaries
Pablo Reig1,2
AbstractThe interest in X/γ-ray Astronomy has grown enor-
mously in the last decades thanks to the ability to sendX-ray space missions above the Earth’s atmosphere.There are more than half a million X-ray sources de-tected and over a hundred missions (past and currentlyoperational) devoted to the study of cosmic X/γ rays.With the improved sensibilities of the currently activemissions new detections occur almost on a daily ba-sis. Among these, neutron-star X-ray binaries form animportant group because they are among the brightestextra-solar objects in the sky and are characterized bydramatic variability in brightness on timescales rang-ing from milliseconds to months and years. Their mainsource of power is the gravitational energy released bymatter accreted from a companion star and falling ontothe neutron star in a relatively close binary system.
Neutron-star X-ray binaries divide into high-massand low-mass systems according to whether the massof the donor star is above ∼8 or below ∼2 M⊙, respec-tively. Massive X-ray binaries divide further into super-giant X-ray binaries and Be/X-ray binaries dependingon the evolutionary status of the optical companion.Virtually all Be/X-ray binaries show X-ray pulsations.Therefore, these systems can be used as unique natu-ral laboratories to investigate the properties of matterunder extreme conditions of gravity and magnetic field.
The purpose of this work is to review the obser-vational properties of Be/X-ray binaries. The openquestions in Be/X-ray binaries include those related tothe Be star companion, that is, the so-called ”Be phe-nomenon”, such as, timescales associated to the for-
Pablo Reig
1IESL, Foundation for Reseach and Technology-Hellas, 71110,Heraklion, Greece.
2Physics Department, University of Crete, 71003, Heraklion,Greece.
mation and dissipation of the equatorial disc, mass-
ejection mechanisms, V/R variability, and rotation
rates; those related to the neutron star, such as, massdetermination, accretion physics, and spin period evo-
lution; but also, those that result from the interaction
of the two constituents, such as, disc truncation and
mass transfer. Until recently, it was thought that theBe stars’ disc was not significantly affected by the neu-
tron star. In this review, I present the observational
evidence accumulated in recent years on the interaction
between the circumstellar disc and the compact com-panion. The most obvious effect is the tidal truncation
of the disc. As a result, the equatorial discs in Be/X-
ray binaries are smaller and denser than those around
isolated Be stars.
Keywords X-rays: binaries – stars: neutron – stars:
binaries close –stars: emission line, Be
1 Definition and classification of X-ray binaries
In very general terms, one can simply define X-ray bina-
ries as systems that consist of a compact object orbitingan optical companion. They are ”close” binary systems
because there exists a transfer of mass from the optical
component to the compact object. By ”optical compan-
ion” it is understood that nuclear burning is still taking
place in its interior. Figure 1 shows a tree-diagram de-picting all the different subsystems that comprise the
generic group of X-ray binaries.
In referring to the two components in an X-ray bi-
nary one should be careful and learn which is the sub-ject of investigation as the same name can be used to
mean different components. In massive X-ray bina-
ries, the most massive star is normally termed primary
whereas the less massive one is called secondary. In low-mass systems, the term primary refers to the neutron

2
XRB
Black Holes Neutron stars White dwarf
HMXBLMXBHMXB LMXB
- (Classical) novae
- Recurrent novae
- Dwarf novae
- Polars
- VY Sculptoris
- AM Canum
- SW Sextantis
atoll ZBeXB SGXB
- disc-fed
- wind-fed
- SFXT
- Transient
- Persistent
Fig. 1 Classification of X-ray binaries.
star while the word secondary is reserved for the late-type companion. Other names also used are ”optical”
or ”donor” for the larger star and ”compact”, ”gainer”
or ”accreting” for the denser companion.
They admit several classification schemes depend-ing upon whether the emphasis is put on the type of
the compact companion or the physical properties of
the optical star. X-ray binaries divide up into black-
hole systems, neutron star X-ray binaries or cataclysmic
variables (if the compact object is a white dwarf). Nev-ertheless, the term ”X-ray binaries” is normally re-
served to designate binaries with neutron stars.
1.1 High-mass X-ray binaries
Neutron-star X-ray binaries are divided up into high-
mass (HMXBs) and low-mass (LMXBs) X-ray binaries
depending on the spectral type of the mass donor, as
this feature determines the mode of transferring massto the compact object and the environment surround-
ing the X-ray source. HMXBs contain early-type (O or
B) companions, while the spectral type of the optical
star in LMXBs is later than A. HMXBs are strong emit-ters of X-ray radiation. Sometimes they appear as the
brightest objects of the X-ray sky. The high-energy ra-
diation is produced as the result of accretion of matter
from the optical companion onto the neutron star. The
term accretion refers to the gradual accumulation or de-position of matter onto the surface of an object under
the influence of gravity. If the accreting object is a neu-
tron star (or black hole), then matter falls down onto
an enormous well of gravitational potential and is accel-erated to extremely high velocities. When the matter
reaches the surface of the neutron star, it is rapidly de-
celerated and the free-fall kinetic energy radiated away
as heat which is available to power the X-ray source.
The luminosity class serves to subdivide HMXBs intoBe/X-ray binaries (BeXB), when the optical star is a
dwarf, subgiant or giant OBe star (luminosity class III,
IV or V) and supergiant X-ray binaries (SGXBs), ifthey contain a luminosity class I-II star.
In SGXBs, the optical star emits a substantial stel-lar wind, removing between 10−6− 10−8 M⊙ yr−1 witha terminal velocity up to 2000 km s−1. A neutron starin a relatively close orbit will capture some fraction ofthis wind, sufficient to power a bright X-ray source.If mass transfer occurs via Roche lobe overflow, thenthe X-ray emission is highly enhanced and an accretiondisc is formed around the neutron star. At present,there is known only one disc-fed SGXB in the Galaxy(Cen X-3) and three in total (SMC X-1 and LMC X-4),while there are about a few tens of wind-fed SGXBs.Because of their brightness and persistent X-ray emis-sion, SGXBs were the first to be discovered. They wereinitially thought to represent the dominating popula-tion of HMXBs, whereas BeXB were considered atyp-ical cases. Hence, the name classical or standard wasgiven to SGXBs.
In BeXB, the optical companion is a Be star. Bestars are non-supergiant fast-rotating B-type and lu-minosity class III-V stars which at some point of theirlives have shown spectral lines in emission, hence thequalifier ”e” in their spectral types (Porter & Rivinius2003; Balona 2000; Slettebak 1988). The best stud-ied lines are those of hydrogen (Balmer and Paschenseries) but Be stars may also show He, Fe in emission(see e.g Hanuschik 1996). They also show an amount ofIR radiation than is larger than that expected from anabsorption-line B star of the same spectral type. Thisextra long-wavelength emission is known as infrared ex-cess.
The origin of the emission lines and infrared excessin BeXB is attributed to an equatorial disc, fed frommaterial expelled from the rapidly rotating Be star in amanner that it is not yet understood (Porter & Rivinius2003). During periastron, the neutron star passes closeto this disc, sometimes may even go through it caus-ing major disruption. A large flow of matter is thenaccreted onto the compact object. The conversion ofthe kinetic energy of the in-falling matter into radiationpowers the X rays. BeXB have large orbital periods andby definition they are non-supergiant systems. Hence,the Be star is well within the Roche lobe. However,transient Roche lobe overflow may occur during perias-tron passage in systems with large eccentric orbits orduring giant X-ray outbursts when a large fraction ofthe Be star’s disc is believed to be accreted.
Most BeXB are transient systems and present mod-erately eccentric orbits (e >∼ 0.3), although persistentsources also exist (Reig & Roche 1999). PersistentBeXB differ from transient BeXB in that they displaymuch less X-ray variability (no large outbursts are de-tected), lower luminosity (Lx <∼ 1035 erg s−1), contain

3
110
1001000
Porb (d)
0.01 1
100
10000
Pspin
(s)
BeX
B
disc-fed SGX
R
wind-fed SG
XR
Fig.2
Porb−Pspindiagram.Theopen
triangles
corresp
ond
to2S0114+65andOAO
1657-41andtheopen
circleto
SAX
J2103.5+4545.
slowly
rotatin
gneutro
nsta
rs(P
spin>
200s)
andresid
e
inwider
orbitsystem
s(P
orb
>200d).
Table
1.1
liststheconfirm
edBeX
B.This
table
in-
cludes
only
those
system
swith
identifi
edoptica
lcoun-
terparts
andwhose
X-ray
andoptica
l/IR
varia
bility
has
been
show
nto
betypica
lofBeX
B(see
Sects.
2and3).
Table
2gives
thenumber
ofvario
ustypes
ofX-ray
bi-
naries.
There
are
more
than300brig
htX-ray
sources
with
fluxes
well
above10−10erg
cm−2s−1in
theen-
ergyrange1–10keV
(Liu
etal.2006,
2007;
Bird
etal.
2010).
Thedistrib
utio
nofthese
sources
show
saclea
rconcen
tratio
ntow
ardstheGalactic
center
andalso
to-
wardstheGalactic
plane,
indica
tingthatthemajority
belo
ngindeed
toourGalaxy.
Until
theadventoftheIN
TEGRALmissio
nin
2002,
thenumber
ofBeX
Bwasgrow
ingfast,
while
thenum-
ber
ofSGXBshad
stabilised
.Durin
gthe80’s
and
90’stherate
ofnew
discov
erieswasapprox
imately
four
BeX
BforoneSGXB.Therea
sonlies
inthedifferen
tori-
gin
oftheaccreted
mass
(stellarwindversu
sBesta
r’senvelo
pe),
leadingto
persisten
tem
issionin
SGXBsand
transien
tem
issionin
BeX
B.Since
SGXBsare
persisten
t
sources,
new
discov
eriescomefro
mtheim
prov
ementof
thesen
sitivity
oftheX-ray
detecto
rsonboard
space
missio
ns.
BeX
Bbenefited
from
thetech
nica
ladvances
toobutthediscov
eryofnew
system
sis
also
related
to
their
triggerin
gmech
anism
bein
gactiva
ted.
Inaddi-
tion,theevolutio
nary
timesca
lesinvolved
imply
that
SGXBsare
lessnumero
usthanBeX
B.Theaccretio
n-
pow
eredphase
isrela
tively
short
forOBsuperg
iantsys-
tems(oftheorder
of10000years).
Thedifferen
ttypes
ofHMXBsoccu
pywell-d
efined
positio
nsin
thespin
perio
dversu
sorbita
lperio
ddia-
gram
(Corbet
1986),
which
reflects
thedifferen
ttypes
of
mass
transfer.
SGXBsexhibitnocorrela
tionatalloran
antico
rrelatio
n,while
BeX
Bshow
apositiv
ecorrela
tion
inthis
diagram.Figure
2disp
laysanupdated
versio
n
Table 1 List of galactic BeXB. Only systems with known optical counterparts and well-established optical/X-ray behaviour are included
X-ray name Optical Ctp. RA (J2000) Dec (J2000) Spec. type V J E(B-V) Pspin (s) Porb (d) e d (kpc)
4U 0115+634 V635 Cas 01 18 31.90 +63 44 24.0 B0.2 Ve 14.8-15.5 10.8-12.3 1.55 3.6 24.3 0.34 8IGR J01363+6610 – 01 36 18.00 +66 10 36.0 B1 IV-Ve 13.3 10 1.61 – – – 2RX J0146.9+6121 LS I +61 235 01 47 00.17 +61 21 23.7 B1Ve 11.2 10 0.93 1412 330 – 2.3IGR J01583+6713 – 01 58 18.20 +67 13 26.0 B2IVe 14.4 11.5 1.46 19692 – – 4RX J0240.4+6112 LS I +61 303 02 40 31.67 +61 13 45.6 B0.5 Ve 10.7 8.8 0.75 – 26.45 0.54 3.1V 0331+530 BQ Cam 03 34 59.89 +53 10 23.6 O8-9 Ve 15.1-15.8 11.4-12.2 1.9 4.4 34.3 0.3 74U 0352+309 (X Per) HD 24534 03 55 23.08 +31 02 45.0 O9.5IIIe-B0Ve 6.1-6.8 5.7-6.5 0.4 837 250 0.11 1.3RX J0440.9+4431 LS V +44 17 04 40 59.32 +44 31 49.3 B0.2Ve 10.8 9.2 0.65 203 – – 3.31A 0535+262 V725 Tau 05 38 54.57 +26 18 56.8 B0 IIIe 8.9-9.6 7.7-8.5 0.75 105 111 0.47 2.4IGR J06074+2205 – 06 07 24.00 +22 05 00.0 B0.5V 12.3 10.5 1.88 – – – 5XTE J0658-073 – 06 58 42.00 –07 11 00.0 O9.7 Ve 12.1 9.7 1.19 160.4 – – 3.94U 0726-260 V441 Pup 07 28 53.60 –26 06 29.0 O8-9Ve 11.6 10.4 0.73 103.2 34.5 – 6RX J0812.4-3114 LS 992 08 12 28.84 –31 14 52.2 B0.2 III-IVe 12.4 11.2-12.0 0.65 31.89 80 – 9GS 0834-430 – 08 35 55.00 –43 11 06.0 B0-2 III-Ve 20.4 13.3 4.0 12.3 105.8 0.12 5GRO J1008-57 – 10 09 46.00 –58 17 30.0 O9e-B1e 15.3 10.9 1.9 93.5 247.5 0.66 2RX J1037.5-5647 LS 1698 10 37 35.50 –56 48 11.0 B0 III-Ve 11.3 – 0.75 862 – – 51A 1118-615 Hen 3-640 11 20 57.21 –61 55 00.3 O9.5 III-Ve 12.1 9.6 0.92 405 – – 54U 1145-619 V801 Cen 11 48 00.02 –62 12 24.9 B1 Vne 9.3 8.7 0.29 292.4 187.5 >0.5 3.14U 1258-613 GX 304-1 13 01 17.20 –61 36 07.0 B2 Vne 13.5 9.8 2.0 272 132.5 >0.5 2.42S 1417-624 – 14 21 12.80 –62 41 54.0 B1 Ve 17.2 13.3 2.0 17.6 42.12 0.45 10GS 1843+00 – 18 45 36.90 +00 51 48.2 B0-2 IV-Ve 20.9 13.7 2.5 29.5 – – >10XTE J1946+274 – 19 45 39.30 +27 21 55.0 B0-1 IV-Ve 16.8 12.5 2.0 15.8 169.2 0.33 8-10KS 1947+300 – 19 49 30.50 +30 12 24.0 B0 Ve 14.2 11.7 1.09 18.76 40.4 0.03 9.5EXO 2030+375 V2246 Cyg 20 32 15.20 +37 38 15.0 B0e 19.7 12.1 3.8 41.8 46.03 0.41 5GRO J2058+42 – 20 59 00.00 +41 43 00.0 O9.5-B0 IV-Ve 14.9 11.7 1.38 192 110 – 9SAX J2103.5+4545 – 21 03 35.71 +45 45 05.5 B0 Ve 14.2 11.8 1.35 358.6 12.67 0.4 6.84U 2135+57 Cep X-4 21 39 30.72 +56 59 10.0 B1-B2 Ve 14.2 11.8 1.3 66.3 – – 3.8SAX J2239.3+6116 – 22 39 20.90 +61 16 26.8 B0-2 III-Ve 15.1 11.5 1.4 1247 262.6 – 4.4
4
Table 2 Statistics on HMXBs in the Milky Way
Number of neutron-star X-ray binaries1 327
Number of suspected HMXB1 131
Number of suspected BeXB2 63Number of confirmed BeXB3 28
1Sources in the Liu et al. (2007) and Liu et al. (2006) catalogs plus update from the 4th IBIS/ISGRI soft gamma-ray survey catalog(Bird et al. 2010)2Sources in the updated on-line version of the Raguzova & Popov (2005) catalog (http://xray.sai.msu.ru/∼raguzova/BeXcat/)3Systems with known optical counterpart and verified X-ray behaviour (from Table 1.1)
of Corbet’s diagram. Disc-fed SGXBs (squares) show
short orbital periods and short spin periods and dis-
play an anticorrelation in the Porb−Pspin diagram. Thesmall orbital separation and evolved companions make
Roche lobe overflow the most likely mass transfer mech-
anism. Wind-fed SGXBs (triangles) show long spin pe-
riods and short orbital periods, occupying a more or
less flat region in the Porb − Pspin diagram. Two sys-tems (open triangles) prevent the region from being a
horizontal line: OAO1657-41, which might be making
a transition to the disc-fed SGXB and 2S 0114+65, for
which the association of the 104 s pulsations with thespin period of the neutron star remains controversial
(Koenigsberger et al. 2006). The spin and orbital peri-
ods of BeXB (filled circles) exhibit a clear correlation.
The open circle in Fig. 2 represents SAX J2103.5+4545,
a peculiar system whose X-ray properties are similar tothose of wind-fed systems but whose optical/IR emis-
sion resemble that of BeXB (Reig et al. 2010a).
The observed correlation in Be/X systems is ex-
plained in terms of the equilibrium period, defined asthe period at which the outer edge of the magneto-
sphere rotates with the Keplerian velocity (Davidson & Ostriker
1973; Stella et al. 1986; Waters & van Kerkwijk 1989).
If the the neutron star (and hence the magnetosphere)
rotates faster that the equilibrium period, then matteris spun away by the propeller mechanism; only when
the spin period is larger than the equilibrium period can
matter be accreted on to the neutron star surface. This
results in angular momentum transfer to the neutronstar, increasing its rotation velocity (decreasing the spin
period). The equilibrium period depends mainly on the
mass flux (or accretion rate) because it determines the
size of the magnetosphere which is assumed to corotate
with the neutron star. In turn, the accretion rate de-pends on the separation of the two components of the
binary systems, hence on the orbital period.
The compact object in all confirmed BeXB (Ta-
ble 1.1) is a neutron star. In fact, many times the neu-tron star is taken as a defining property of BeXB. It is
common to read in the literature that a BeXB consists
of a neutron star and a Be star. However, there seems
to be no apparent mechanism that would prevent the
formation of Be stars with black holes (BH) or whitedwarfs (WD). Surprisingly, not a single BeXB is known
to host a black-hole companion in our Galaxy, whereas
the interpretation of γ Cas as a Be+WD system still
remains very controversial.
Two ideas have been put forward to explain thisapparent lack of Be/BH binaries. Zhang et al. (2004)
extended the application of the viscous decretion disc
model of Okazaki & Negueruela (2001) to compact
companions of arbitrary mass and showed that the mosteffective Be disc truncation would occur in relatively
narrow systems. Using the population synthesis results
of Podsiadlowski et al. (2003), which state that binary
black holes are most likely to be born in systems with
narrow orbits (Porb<∼30 days), the reason for the lack ofthese systems can be attributed to the difficulty to de-
tecting them. Be/BH binaries are expected to be X-ray
transients with very long quiescent states. In contrast,
Belczynski & Ziolkowski (2009) showed that Be/BH bi-naries do not necessarily have narrow orbits. These
authors argued that the predicted ratio of Be/NS bina-
ries to Be/BH binaries (FNS−to−BH ∼ 30 − 50) in our
Galaxy, based on current population synthesis models
and evolutionary scenarios, is consistent with the obser-vations: there are 60 known Be/NS binaries, hence one
would expect 0–2 Be/BH binaries, consistent with the
observed galactic sample. Both Zhang et al. (2004) and
Belczynski & Ziolkowski (2009) agree in that Be/BHbinaries should exist in the Galaxy.
1.2 Other types of high-mass X-ray binaries
The traditional picture of two classes of HMXBs,namely SGXB — subdivided into low-luminosity or
wind-fed systems and high-luminosity or disc-fed sys-
tems — and BeXB — transient and persistent — is
giving way to a more complex situation where newlydiscovered systems may not fit in these categories.

5
1.2.1 Low eccentricity BeXB
There is a group of so far five BeXB (X Per, GS 0834–430, KS 1947+300, XTE J1543–568, and 2S 1553-5421),characterised by Porb>∼ 30 d and very low eccentricity(e <∼ 0.2). Their low eccentricity requires that the neu-tron star received a much lower kick velocity at birththan previously assumed by current evolutionary mod-els (Pfahl et al. 2002).
Most popular models for neutron star kicks involvea momentum impulse delivered around the time of thecore collapse that produced the neutron star. Thesemodels assume that neutron stars are born with speedsin excess of 100-200 km s−1. Such velocities imply aprobability close to zero that the post-supernova ec-centricity is less than 0.2. Hence, the discovery ofthese low-eccentricity BeXB with wide orbits was un-expected. Tidal circularizacion is ruled out since thismechanism requires that the star almost fills its Rochelobe and that there be an effective mechanism for damp-ing the tide. Tidal torques should have little effect onthe orbit of a HMXB with Porb = 10 days, as long asthe secondary is not too evolved and the eccentricityis not so large that the tidal interaction is enhanceddramatically at periastron (as it is the case of typicalBeXB).
Pfahl et al. (2002) developed a phenomenologicalmodel that simultaneously accounts for the long-period(>∼30 d), low-eccentricity (<∼0.2) HMXBs and whichdoes not violate any previous notions regarding thenumbers and kinematics of other neutron star popu-lations. They propose that a neutron star receives arelatively small kick (<∼50 km s−1) if the progenitor, i.e.,the core of the initially more massive star in the binary,rotates rapidly. This condition may be met when theprogenitor star experienced case Be or Ce mass trans-fer in a binary system2. If the hydrogen-exhausted coreof an initially rapidly rotating massive star is exposedfollowing case Be or Ce mass transfer in a binary, thenthe core is also likely to be a rapid rotator.
1.2.2 Obscured sources & Supergiant fast X-raytransients
Since the launch of INTEGRAL in October 2002, thesituation is also changing among the SGXB group.
1The optical counterparts of XTE J1543–568 and 2S 1553-542are not known, hence they do not appear in Table 1.1.
2In case B, mass transfer occurs during the shell hydrogen-burning phase, but prior to central helium ignition, while caseC evolution begins after helium has been depleted in the core.Cases B and C are naturally divided into an early case (Be orCe), where the envelope of the primary is mostly radiative, anda late case (Bl or Cl), where the primary has a deep convectiveenvelope.
Fig. 3 Spectral energy distribution of LSI +61 303. FromChernyakova et al. (2006)
.
INTEGRAL has unveiled a population of highly ob-scured HMXBs with supergiant companions and a newtype of source displaying outbursts which are signif-icantly shorter than typical for BeXB and which arecharacterized by bright flares with a duration of a
few hours and peak luminosities of 1036 − 1037 ergs−1. These new systems have been termed as Super-giant fast X-ray Transients (SFXTs, Smith et al. 2006;Negueruela et al. 2006; Walter & Zurita-Heras 2007;Negueruela et al. 2008).
Both obscured HMXBs and SFXTs display X-rayand IR spectra typical of SGXBs. In some cases,the X-ray sources are pulsed and orbital parameterstypical of persistent SGXBs have been found (e.g.,Bodaghee et al. 2006; Zurita Heras et al. 2006). Theheavily-absorbed sources had not been detected by pre-vious missions due to high absorption, which renderstheir spectra very hard. The current understanding isthat the entire binary system is surrounded by a denseand absorbing circumstellar material envelope or co-coon, made of cold gas and/or dust (Chaty 2008).
SFXTs differ from SGXBs because they are onlydetected sporadically, during very brief outbursts(Romano et al. 2010). A promising model to ex-
plain SFXTs invokes highly structured (clumpy) stellarwinds. The outburst occurs as a result of the accretionof one of the clumps of dense matter from the wind. Analternative model (”Be-type” model) assumes a very el-liptical orbit for the binary. In this model outbursts aretriggered when the compact object travels through itsperiastron. Other possibilities imply that SFXTs con-tain strongly magnetised neutron stars. The outburstsresult from the overcoming of centrifugal and magneticbarriers (see Grebenev 2010, and references therein).
1.2.3 γ-ray binaries
γ-ray binaries are HMXBs that emit most of their ra-diative output in the MeV-TeV range. Currently, onlyfour HMXBs are well-established members of this groupof high-energy sources: LS I +61 303, LS 5039, PSR

6
B1259-63, and Cygnus X-3, while other two are firm
candidates: Cygnus X-1, and HESS J0632+0573. Theoptical counterpart is either a luminous O-type star
(Cygnus X-1, LS 5039), a Be star (LS I +61 303, PSR
B1259-63, HESS J0632+057) or a likely Wolf-Rayet
star in Cygnus X-3. In addition to the variable γ-rayemission these systems share in common a resolved ra-
dio counterpart with a jet or jet-like structure, multi-
wavelength orbital modulation and spectral energy dis-
tribution (Fig. 3). The wide range of orbital parameters
(Paredes 2008) and the non-unique nature of the com-pact companion (unknown in most systems but with a
confirmed neutron star in PSR B1259-63 and a fairly se-
cure black hole in Cyg X-1) represent a challenge for the
theoretical modelling of these systems. Two alternativescenarios may explain the variable γ-ray emission: the
microquasar or accretion-powered scenario and the pul-
sar wind scenario.
All confirmed γ-ray binaries show a jet or jet-like
radio structure, which would indicate the presence ofrelativistic particles. In black-hole binaries the radio
jet can account for their broad-band spectrum, from
radio to X-rays (Markoff et al. 2003) as well as for the
origin of most of the timing variability (Kylafis et al.2008). Therefore, it is reasonable to think that the
jet may also be the origin of the very high-energy γ-
rays. In the context of relativistic jets, the most efficient
gamma-ray mechanism would be inverse Compton scat-
tering, by which relativistic particles collide with stellarand/or synchrotron photons and boost their energies to
the VHE range. Two flavors of the microquasar model
can be found in the literature depending on whether
hadronic or leptonic jet matter dominates the emissionat such an energy range. Among leptonic jet mod-
els, there are inverse Compton jet emission models in
which X-rays and γ-rays result from synchrotron self-
Compton processes (Atoyan & Aharonian 1999), or in
which the seed photons come from external sources,i.e., companion star and/or accretion disk photons
(Kaufman Bernado et al. 2002; Georganopoulos et al.
2002). In the hadronic scenario, the gamma-ray emis-
sion arises from the decay of neutral pions createdin the inelastic collisions between relativistic protons
in the jet and either the ions in the stellar wind of
the massive companion star (Romero et al. 2003) or
nearby high-density regions (i.e. molecular clouds)
(Bosch-Ramon et al. 2005).Alternatively, relativistic particles can be injected
in the surrounding medium by the wind from a young
3The Be star HD 215227, likely counterpart of the gamma-raysource AGL J2241+4454, has been suggested as a new candidate(Wiliams et al. 2010).
pulsar. In the pulsar wind scenario, the rotation of a
young pulsar provides stable energy to the nonthermalrelativistic particles in the shocked pulsar wind mate-
rial outflowing from the binary companion. As in the
microquasar-jet models, the γ-ray emission can be pro-
duced by inverse Compton scattering of the relativis-tic particles from the pulsar wind on stellar photons
(Torres 2010, and references therein). In the pulsar
wind scenario the resolved radio emission is not due
to a relativistic jet akin to those of microquasars, but
arises instead from shocked pulsar wind material out-flowing from the binary (Dubus 2006).
1.2.4 γ-Cas like objects
A growing number of early Be stars discovered in X-
ray surveys exhibit strong X/optical flux correlations
and X-ray luminosities intermediate between those of
normal stars and those of most BeXB in quiescence
(Lopes de Oliveira et al. 2006). The optical propertiesare very similar to those of BeXB: i) the spectral type
is always in the range B0-B1 III-Ve, and ii) show Hα
equivalent widths stronger than −20 A. However, they
differ from the typical BeXB in their X-ray properties:i) they show harder X-ray spectra that can be best
fitted by a thin thermal plasma with T ∼ 108 K, rather
than a power law as seen typically in HMXBs, ii) there
is no evidence for coherent pulsations in any of these
systems but strong variability on time scales as shortas 100 s is usually observed, and iii) they do not exhibit
large X-ray outbursts.
The prototype of this group of sources is γ Cas. Two
models have been put forward to explain this type ofsystem: accretion onto a compact object (most likely
a white dwarf) and magnetically heated material be-
tween the photosphere of the B star and the inner
part of its disc (Robinson et al. 2002). In the mag-
netic corona model the hard X-rays result from high-energy particles that are emitted due to magnetic recon-
nection, while the optical variability is due to changes
in the density structure of the inner disc as a conse-
quence of turbulence generated by changes in the mag-netic field. In support of this scenario there is the
fact that X-ray fluxes show random variations with or-
bital phase, thereby contradicting the binary accretion
model, which predicts a substantial modulation. In
favour of the binary model is the similarity of the X-rayspectra with those of cataclysmic variables, the rapid
variability and large numbers of Be + white dwarf sys-
tems predicted by the theory of evolution of massive
binaries.In the remaining part of this report I shall concen-
trate on the properties and variability of BeXBOnly

7
1000 10000Wavelength (A)
10-13
10-12
10-11
10-10
10-9
Flux
(er
g s-1
cm
-2 A
-1)
(Teff, log g) = (30000, 3.5)
discno disc
X Per
0.85
0.9
0.95
1
1.05
Inte
nsity
6400 6500 6600 6700 6800Wavelength (A)
2000
3000
4000
Inte
nsity
no disc
disc
Hα He
X Per
X Per
Fig. 4 IR excess and Hα emission are the two main observational characteristics of Be stars.
when for the sake of the discussion a comparison with
the behaviour of other type of X-ray binaries may be
illustrative, will these other type of binaries be men-tioned.
2 Optical/IR properties of BeXB
The optical and infrared flux of a BeXB is completely
dominated by the Be star companion. While the X-ray
emission from BeXB provides information on the physi-
cal conditions in the vicinity of the compact object, theoptical and infrared emission reveals the physical state
of the mass donor component. Since the fuel that pow-
ers the X-ray emission, namely matter from a powerful
stellar wind or from a equatorially concentrated denserdisc, comes from the massive companion, observations
of BeXB in the optical/IR are crucial to understand
the physical conditions under which the neutron star is
accreting.
The two main observational characteristics of Bestars are the emission spectral lines, as opposed to the
normal absorption photospheric lines and an excess of
IR emission. Both properties, line emission and IR ex-
cess, originate from extended circumstellar envelopes ofionised gas surrounding the equator of the B star. They
result from free-free and free-bound emission from the
disc, i.e. recombination of the optical and UV radiation
from the central star (Woolf et al. 1970; Gehrz et al.
1974). The assumption of a common origin for theline emission and IR excess is strongly supported by
the correlation between the intensities of continuous IR
emission, as measured either by colour indices (J−M),
(J − K) or fluxes at a certain wavelength and the in-tensity of the Hα line, as measured either as equivalent
width or fluxes (Dachs & Wamsteker 1982; Dachs et al.
1988; Neto & de Freitas Pacheco 1982). By studying
the line variability one can obtain important constraints
on the geometry (size, shape) and dynamics (veloc-
ity and density laws) of the envelope (Hanuschik 1986,
1995; Dachs 1992).Figure 4 illustrates graphically these two properties
for the system X Persei. When an equatorial disc is
present the near-IR emission exceeds that predicted
by model atmosphere (shown is a Kuruzc model withTeff = 30000 K and log g = 3.5) and emission lines are
prominently seen.
2.1 Hα line profiles
The Hα line is the prime indicator of the circumstel-
lar disc state. Hα emission lines can be morphologi-
cally divided in two classes (Hummel & Vrancken 1995;
Silaj et al. 2010): class 1 are symmetric and includessymmetric double-peak, wine-bottle and shell profiles
and class 2, which are asymmetric and show variability
on time scales of years. Each class does not refer to dif-
ferent groups of sources because individual Be stars can
change from one to the other. These changes are nor-mally slow (of the order of years to decades in isolated
Be stars and months to years in BeXB). Symmetric
profiles are believed to be generated in quasi-Keplerian
discs (see e.g. Hummel 1994), while asymmetric pro-files are associated with distorted density distributions
(Hanuschik 1995; Hummel & Hanuschik 1997).
Most BeXB show asymmetric split Hα profiles. The
peaks adopt the names of the relative position of their
central wavelengths. In a spectrum with monotonicallyincreasing wavelength values, the left peak is known
as the ”blue” (or violet) peak, while the right peak is
named the ”red” peak. V/R variability refers then to
the variation of the relative strength of the blue to thered peak. Therefore the V/R ratio, defined as the ratio
of violet-side to red-side peak intensities above contin-
uum in units of continuum intensity represents a mea-
sure of the asymmetry of the line. A more convenient

8
quantity is the logarithmic of this ratio, log(V/R), be-
cause in this case, positive values of log(V/R) corre-spond to a blue-dominated profile and negative values
to a red-dominated line. The top panel of Fig. 5 dis-
plays the V/R variability of the BeXB LS I +61 235
(Reig et al. 2000).V/R variability can be explained in terms of a non-
axisymmetrical equatorial disc in which a one-armed
perturbation (a zone in the disc with higher density)
propagates (Okazaki 1991, 1996, 1997; Papaloizou et al.
1992; Savonije & Heemskerk 1993). Double-peak sym-metric profiles are expected when the high-density part
is behind or in front of the star, while asymmetric pro-
files are seen when the high-density perturbation is on
one side of the disc. More precisely, when the high-density part of the disc perturbation is located on the
side of the disc where the rotational motion is directed
away from us, we see enhanced red emission (V <
R), while when the high-density part is moving toward
the observer, blue-dominated profiles V > R are ex-pected (Telting et al. 1994). For systems seen at high-
inclination angle, the two symmetric cases can be read-
ily distinguished since the central depression between
the two symmetric peaks would be more pronounced(reaching or going beyond the continuum, the so-called
shell profile), when the perturbation is between the ob-
server and the star. The reason is that shell profiles are
thought to be due to a perspective effect, namely, when
the line of sight toward the star probes the equato-rial disc and self-absorption is produced (Rivinius et al.
2006). If the density perturbation revolves around the
star in the same direction as the material in the disc
(prograde precession), then the V/R sequence would beaccording to Telting et al. (1994): V = R (perturbation
behind the star) −→ V > R −→ V = R (perturbation
in front of the star, shell profile) −→ V < R.
One prediction of the model is that no changes in
the slope of the infrared continuum are expected be-cause the V/R variations are not the result of changes
in the radial gradient of the circumstellar gas. This is
exactly the behaviour that it is found in LS I +61 235
(bottom panel of Fig. 5). While the individual infraredphotometric bands changed (∆J ≈ ∆H ≈ ∆K ∼ 0.3
magnitudes) the infrared colours (e.g. J−K) remained
unchanged (Reig et al. 2000).
V/R variability is also seen in other lines, like HeI
6678A. Since helium lines are generated at smaller discradii than the hydrogen lines (Hummel & Vrancken
1995; Jaschek & Jaschek 2004), the asymmetry of the
HeI line profiles indicates that the internal changes of
the disc are global, affecting its entire structure.V/R quasi-periods in BeXB range from 1-5 yr (Ta-
ble 5) and are shorter than those seen in isolated Be
-1-0.5
00.5
1
log(
V/R
)
9.69.810
10.2J
0.10.20.30.4
J-K
48500 49000 49500 50000 50500 51000 51500MJD
-20
-15
-10
-5
EW
(H
)α
Fig. 5 Top: V/R variability observed in the Hα line ofLS I +61 235. From Reig et al. (2000). Bottom: Evolutionof the V/R ratio, J magnitude, J − K colour and the Hαequivalent width in LS I +61 235. From Reig et al. (2000).
stars, which are found in the range 2-11 years with an
average of 7 years (Okazaki 1997).
2.2 EW(Hα) vs infrared colours
If the infrared excess observed in Be stars is due to
the same processes as those responsible for Balmer
line emission, namely absorption and subsequent re-emission of the optical and UV light from the underly-
ing star in the circumstellar envelope, then a correlation
between IR colours and the strength of the hydrogen
lines should be expected. Such correlation has been re-ported for isolated Be stars (Dachs & Wamsteker 1982;
Neto & de Freitas Pacheco 1982; Dachs et al. 1988)
and BeXB (Coe et al. 1994, 2005, although mixed with
isolated Be stars). Figure 6 shows the first such dia-
gram made from BeXB only. It displays the IR colourindex (J−K)0 as a function of the Hα equivalent width,
EW(Hα), for the sources listed in Table 3. The infrared
colours were corrected for interstellar extinction. Only
contemporaneous data (when the time difference be-tween the IR and optical observations was less than

9
-0.4 -0.2 0 0.2 0.4 0.6(J-K)
0
1
10
100
EW
(Hα)
Fig. 6 Correlation between the equivalent width of the Hαline and the infrared colour J −K. Different colours repre-sent different systems. This correlation implies a commonorigin for the infrared excess and the line emission, namely,the circumstellar disc round the Be star.
one month) were used. The second and third columnsin Table 3 represent the amplitude of change in the
infrared colour (J −K) and the EW(Hα) over the ob-served range, whereas Fig. 6 plots the actual values.
In Fig. 6 we have included only those sources for
which we are confident that the colour excess E(B−V )is free of circumstellar effects. Due to the surround-
ing envelope, the use of photometric magnitudes andcolours to derive astrophysical parameters, like E(B −V ), may be misleading because they are contaminatedby disc emission. The effect of the disc is to make
the photometric indices to appear redder than a non-emitting B star of the same spectral type. The disc
emission makes a maximum contribution to the op-
tical (B − V ) colour of a few tenths of a magnitude(Dachs et al. 1988; Howells et al. 2001). The values of
E(B − V ) used to produce Fig. 6 were obtained from
Table 3 List of BeXB used in Fig. 6 with colour excessand amplitude of change in (J −K)0 and EW(Hα).
X-ray source E(B − V ) ∆(J −K)0 ∆EW (Hα)(mag) (mag) (A)
4U 0115+63 1.65 0.8 20RX J0146.9+6121 0.93 0.7 10V 0332+53 1.88 0.4 64U 0352+30 0.39 1.1 18RX J0440.1+4431 0.65 0.3 51A 0535+262 0.75 1.0 154U 0728-25 0.73 0.1 2RX J0812.4-3114 0.65 0.2 5GRO J1008-57 1.90 1.0 151A 1118-616 0.90 1.5 254U 1145-619 0.29 2.8 40EXO 2030+375 3.8 1.1 15SAX J2103.5+4545 1.35 0.1 1
either diffuse interstellar bands, disc-loss episodes or by
disentangling the circumstellar and interstellar redden-ing (see Fabregat & Torrejon 1998).
Under these conditions, namely, simultaneity of the
optical and infrared data and used of the extinction-
corrected (J − K) index, the EW (Hα) − (J − K)0becomes a useful tool to estimate the extra reddening
caused by the circumstellar disc. Once a value of the
EW(Hα) is known, one can look for the corresponding
intrinsic (J − K) in Fig. 6. By comparing this value
with that expected according to the spectral type, anestimated of the disc contribution on the index (J−K)
can be obtained. The relatively large scatter, however,
may limit the usefulness of the diagram.
It should be noticed that although the Hα and in-frared emission correlate as expected for a common ori-
gin in the disc, the spatial extension and precise lo-
calisation in the disc are different. From long-baseline
interferometric observations in the K ′ band Gies et al.
(2007) found that the angular size of the infrared emis-sion is consistently smaller than that determined for
the Hα emission. In other words, the near-IR emis-
sion forms closer to the star than does the Hα emis-
sion. Furthermore there is good evidence in severalcases (Clark et al. 2001; Grundstrom et al. 2007) that
an increase in disc brightness occurs first in the near-IR
flux excess and later in Hα as expected for an outwardly
progressing density enhancement. This difference can
be explained if the dependence with disc radius of theHα optical depth is less steep than that of the infrared
optical depth (Gies et al. 2007).
2.3 Identification of the optical counterparts
With the improved sensitivities of the currently opera-
tional space missions many new X-ray sources are being
discovered. About one third of the the X/γ-ray sources
in the 4th INTEGRAL catalogue (Bird et al. 2010) arethought to be X-ray binaries, of which half are believed
to contain early-type companions. An optical identi-
fication is necessary to facilitate a complete study of
these systems. Without a known counterpart, observa-tions are limited to X-ray energies, and hence our un-
derstanding of the structure and dynamics of those sys-
tems that remain optically unidentified is incomplete.
If the only available information is that provided by
an isolated X-ray detection then potential HMXBs areselected as those exhibiting properties of a magnetised
neutron star, namely, X-ray pulsations and/or an ab-
sorbed power-law continuum spectrum with an expo-
nential cutoff at 10-30 keV and cyclotron absorptionfeatures. Extra information on the nature of the source
can be obtained if the long-term X-ray variability is

10
0.5 1 1.5 2 2.5B-V
-6
-5.8
-5.6
-5.4
-5.2
-5
R-H
α
SAX J2103.5+4545
1 1.5 2 2.5B-V
-6
-5.5
-5
-4.5
-4
R-H
α
IGR J01363+6610
Fig. 7 Colour-colour diagrams and V-band images of the field around SAX J2103.5+4545 (top) and IGR J01363+6610(bottom). The position of the confirmed optical counterpart in the colour-colour diagram is marked with a filled circle.Good candidates are those that occupy the upper part of the colour-colour diagram and lie inside or very close to the X-rayuncertainty region. For example, the stars that are close to SAX J2103.5+4545 in the colour-colour diagram lie far awayfrom the satellite error circles.
known (information provided by all-sky monitors, likeASM RXTE or BAT SWIFT). The presence of regularand periodic outbursts or unexpected giant outburstsreaching Eddington luminosity at their peaks may indi-cate the presence of a Be star. Likewise, erratic flaring,i.e., X-ray variability with changes in the X-ray inten-sity by a factor 3-5 over a few minutes might indicatethe presence of a strong stellar wind from an early-type,probably evolved, companion.
However, a system with X-ray data only will remainin the category of suspected HMXBs until a confirmedoptical identification is performed. The most obviousobservational features to look for is Hα emission andnear-infrared excess emission. While the detection ofthese two observational features does not guaranteethat the source is indeed an OBe type star, it defi-nitely narrows the number of candidates to a handfulof sources.
The size of the uncertainty in the location of theX-ray source, the so-called error circle, determines thetype of observational technique to use. If the error circleis small (a few arcseconds) then the number of visiblestars in the region is expected to be small and it is pos-sible to perform narrow-slit spectroscopic observationsand look for early-type, Hα emitting line stars. If theerror radius is large (>∼1 arcminute), then it is likely toinclude a large number of sources and hence narrow-slitspectroscopy becomes impractical. In this case colour-colour diagrams can be used to identify good candi-
dates. Furthermore, uncertainty regions are given toa certain confidence level, hence it is possible that thetrue optical companion is located close but outside theX-ray error circle.
Photometric detection of Be stars can be performedby selecting colours directly related to the excess emis-sion both in the Hα line (”red” colour) and the contin-uum (”blue” colour). Observing through a narrow filtercentred on the Hα line and a wider filter also contain-ing this line, e.g. Johnson R filter (Reig et al. 2005),Sloan-r (Gutierrez-Soto 2006) would account for theemission line, while Johnson B − V (Reig et al. 2005)or Stromgren b − y (Gutierrez-Soto 2006) can be usedas reddening indicators. The use of Stromgren b, y, andnarrow-band Hα photometry through (b− y, y) colour-magnitude and (b− y, y−Hα) colour-colour diagramsis particularly suitable to identify Be stars in open clus-ters (Grebel et al. 1992; McSwain & Gies 2005).
Stars with a moderately or large Hα excess can bedistinguished from the rest because they deviate fromthe general trend and occupy the upper left parts of thediagram. Be star are expected to show bluer colours,i.e., low (B−V ) or (b− y), because they are early-typestars (although they normally appear redder than non-emitting B stars due to the circumstellar disc) and alsolarger (i.e., less negative) R−Hα colours because theyshow Hα in emission. Once the number of candidates isreduced to a few systems, narrow-slit spectroscopy be-comes feasible. The final step is to obtain a spectrum

11
-0.4 -0.2 0 0.2 0.4 0.6 0.8Q
4
6
8
10
12
KKS1947+3004U0115LSI61235
0 0.2 0.4 0.6 0.8H-K
s
-4.8
-4.7
-4.6
-4.5
-4.4
-4.3
Brγ
-Ks
0 0.2 0.4 0.6 0.8 1 1.2H-K
s
-4.3
-4.2
-4.1
HeI
-Ks
Fig. 8 Top left: Q −K diagram for three well-known systems. BeXB systems tend to occupy the left-most part of thisdiagram. Top left: (b − y,y) diagram of the open cluster NGC 3766. Be stars (diamonds) are distinguished from all otherstars (dots) in the diagram. From McSwain & Gies (2005). Bottom: IR photometric diagrams of the field around the BeXB1A 1118-615 (red cross). BeXB candidates (open circles) show up below the sequence of absorption-line stars (black dots).
in the 4000-5000 A, and perform spectral classification.Figure 7 shows the V-band images and the correspond-
ing (B − V , R − Hα) colour-colour diagrams of two
recently identified systems
At other wavelengths, similar photometric diagramshave been used. Negueruela & Schurch (2007) defined
the reddening-free quantityQ = (J−H)−1.70(H−KS),
and createdQ/KS diagrams to separate early type from
late type stars. The majority of stars in Galactic fields
concentrate around Q=0.4-0.5, corresponding to fieldK and M stars, while early-type stars typically have
Q ≃ 0. The top left panel in Fig. 8 shows one such
diagram with three well-known BeXB.
More recently, Nespoli (2010) built up infraredcolour diagrams (Brγ −KS) − (H −KS) and (HeI −KS)−(H−KS) to identify emission-line objects. Brγ is
the most prominent feature in Be stars in the K band,
while He I 20580 A is found in early type Be stars,
up to B2.5 (Clark & Steele 2000). Emission-line ob-jects show up below the absorption-line stars sequence.
Since Be stars present moderate emission line strengths,
when compard to other groups (young stellar objects,
cataclysmic variables, planetary nebulae), Be star can-didates are those below the main sequence but that do
not differ more than ∼ 0.3 mag (Fig. 8). The top rightdiagram in Fig. 8 also shows an example of the use of
narrow-band filters to identify Be stars in clusters (from
McSwain & Gies 2005).
3 X-ray properties
Tradiationally, BeXB have been considered as transient
X-ray binaries harbouring a fast rotating neutron starthat orbits a Be stype star in a rather eccentric orbit
(e >∼ 0.3). Although X-Per was recognized as a BeXB
since the beginning of the suggestion of the existence
of this type of objects in the early 70’s (Moffat et al.1973), it was the only BeXB showing permanent low
level X-ray emission. As the number of BeXB sys-
tems began to grow, the X-ray behaviour increased in
complexity and new persistent sources were discovered
(Reig & Roche 1999).Because all BeXB are variable and the detectability
of a source depends on the sensitivity of the detector
used, the distinction between transient and persistent
sources undergoing a large intensity increase is some-times ambiguous. The term transient is normally used

12
53500 54000 54500 55000MJD
0
10
20
30
40R
XT
E A
SM c
/s
Type I Type I
Type II EXO 2030+375
51000 52000 53000 54000 55000MJD
0
10
20
30
40
RX
TE
ASM
c/s
4U 0115+63
Type II
Type I
Type II
Fig. 9 Long-term light curves of EXO 2030+375 (left) and 4U 0115+63 (right). Although the two systems have beenseen to display both type I and type II outbursts, type II outbursts in EXO 2030+375 are rare whereas type I are almostalways present. In 4U 0115+63 the opposite occurs.
when the variability of the source exceeds, at least, twoorders of magnitude with respect to the quiescent state,which may correspond to a non-detection state.
3.1 Persistent versus transient X-ray emission
Reig & Roche (1999) proposed the following character-istics differentiating between persistent and transientBeXB. Persistent sources are characterised by
• low X-ray luminosity, L2−20keV ∼ 1034−35 erg s−1.• relatively quiet systems showing flat light curves withsporadic and unpredicted increases in intensity byless than an order of magnitude.
• slowly rotating pulsars, Pspin >∼ 200 seconds.• absence of, or very weak, iron line at ∼6.4 keV, in-dicative of only small amounts of material in thevicinity of the neutron star.
These X-ray properties could be accommodatedin systems with wide (Porb >∼ 200 days) and low-eccentric orbits (e <∼ 0.2). A thermal excess of black-body type, with high temperature (kT > 1 keV) andsmall emission area (R < 0.5 km), has recently beensuggested as another common feature of this typeof sources (La Palombara et al. 2009, and referencestherein). Members of this group are: X Per, RXJ0146.9+6121/LS I +61 235, RX J0440.9+4431/BSD24-491 and RX J1037.5-564/LS 1698.
In contrast, the X-ray behaviour of transient BeXBis characterised by two type of outbursting activity:
• Type I outbursts. These are regular and periodic(or quasiperiodic) outbursts, normally peaking at orclose to periastron passage of the neutron star. Theyare short-lived, i.e., tend to cover a relatively smallfraction of the orbital period (typically 0.2-0.3 Porb).The X-ray flux increases by about one order of magni-tude with respect to the pre-outburst state, reachingpeak luminosities Lx ≤ 1037 erg s−1.
• Type II outbursts represent major increases of theX-ray flux, 103 − 104 times that at quiescence. Theyreach the Eddington luminosity for a neutron starand become the brightest objects of the X-ray sky.They do not show any preferred orbital phase andlast for a large fraction of an orbital period or evenfor several orbital periods. The formation of an ac-cretion disc during Type II outbursts (Kriss et al.1983; Motch etal 1991; Hayasaki & Ozakaki 2004;Wilson et al. 2008) may occur. The discovery ofquasi-periodic oscillations in some systems (?, andreference therein) would support this scenario. Thepresence of an accretion disc also helps explain thelarge and steady spin-up rates seen during the giantoutbursts, which are difficult to account for by meansof direct accretion.
Figure 9 shows these two types of X-ray variabil-ity. The long-term X-ray emission of EXO 2030+375appears clearly modulated by the orbital period of 46days just before and after the type II outburst at MJD53950. 4U 0115+63 has exhibited four type II outburstin the time interval 1996-2009.
Type II outbursts are major events. Since the fuelthat powers these outbursts comes from the material inthe circumstellar disc, one would expect major changesin the structure of the disc. The disruption should beobservable in the parameters that best sample the phys-ical condition in the disc, namely the Hα line param-eters (strength and shape) and the IR colours and in-dices. Figure 10 displays the long-term evolution of theoptical/IR and Hα equivalent width of 4U 0115+63.Vertical dotted lines mark the occurrence of type II X-ray outbursts. As it can be seen, the large amplitudechanges in the optical and IR photometric and spec-troscopic parameters after the X-ray outbursts indicatemajor disruption in the physical conditions of the cir-cumstellar. In fact, the type II outbursts led to the

13
12
14
16
OP
TIC
AL
mag
2000 2002 2003 2004 2005 20061999
10
11
12IR m
ag
-30
-20
-10
0
EW
(Hα)
51500 52000 52500 53000 53500 54000Modified Julian Date
0
200
400
600
800
∆ peak
(km
s-1
)
2001
VB
RI
JHK
Fig. 10 Long-term evolution of the optical/IR magnitudes and the Hα equivalent width and peak separation of double-peak profiles of 4U 0115+63 . Dotted lines mark the occurrence of X-ray outbursts. Adapted from Reig et al. (2007)
complete disappearance of the disc. Evidence for theloss of the disc stems from the Hα equivalent width,which changed sign from negative, indicating that thespectral line was in emission before the outburst to pos-
itive, that is absorption, after the outburst.However, type II outbursts are not always followed
by a disc-loss phase. Figure 11 shows the case of1A 0535+262 and KS 1947+300. In the case of 1A0535+262, the Hα equivalent width decreased signif-icantly after the X-ray outburst, indicating a majordisruption in the structure of the disc, but the Hαequivalent width remained negative. The case of KS1947+300 is hard to explain. Apparently, the X-rayoutbursts produced no effect on the disc. The Hα equiv-alent width did not change significantly after the out-burst.
3.2 Periodic variability: X-ray pulsations
Observations of X-ray binaries show considerable vari-ability on a wide range of time scales in all wavelengths.
In LMXB, in the so-called millisecond pulsars, the X-ray periodic variability goes down to less than a mil-lisecond. In BeXB the shortest timescales are of theorder of few seconds4, and correspond to the X-ray pul-sations.
4There are at least two systems, A0535-66 and SAX J0635+0533,with B-type companions that exhibit millisecond pulsations.However, they are thought to be rotation-powered pulsars.
The detection of coherent pulsations from an accret-
ing X-ray source provides one of the strongest evidence
that the compact object is a neutron star. The pulses of
high-energy radiation are due to a misalignment of theneutron star’s rotation axis and its magnetic axis. Gas
is accreted from the stellar companion and is channeled
by the neutron star’s magnetic field onto the magnetic
poles producing two or more localized X-ray hot spots.These hot spots move into and out of view as the neu-
tron star spins, giving rise to regular X-ray pulses.
Almost all BeXB show X-ray pulsations. The pul-
sation period of an X-ray pulsar with a Be compan-
ion can be as short as a few seconds (4U 0115+63)and as long as few tens of minutes (LS I +61 235).
The longest periods in main-sequence HMXBs are those
of 4U 2206+54 with 1.54 hr (Reig et al. 2009) and
IGR J01583+6713 with 5.47 hr (Wang 2009). How-ever, these two sources are somehow peculiar and can-
not be considered as canonical BeXB. Although 4U
2206+54 exhibits a double-peaked emission Hα profile
and the optical companion is an O9.5 main-sequence
star, its optical spectrum is complex and far from thatof a ”typical” Be star (Blay et al. 2006). The 5.47-
hr period of IGR J01583+6713 needs confirmation as
a shorter (469 s) periodicity has also been suggested
(Kaur et al. 2008). Among HMXBs with a supergiantcompanion, 2S 0114+65 shows the longest spin period
with 2.78 hr (Finley et al. 1994). The only BeXB for
which no pulsations have been detected is LS I +61

14
0
20
40
60A
SM (
coun
t/s)
2000 2001 2002 2003 2004 2005 2006 2007 2008
52000 52500 53000 53500 54000 54500MJD
-16
-14
-12
-10
-8
EW
(H
α) (
A)
A0535+262
o
0
5
ASM
(co
unt/s
)
2002 20042001 2003 20062005 2007 20082000
52000 52500 53000 53500 54000 54500MJD
-18
-16
-14
EW
(H
α) (
A)
KS 1947+300
o
Fig. 11 Long-term evolution of the X-ray intensity (1.3–12.1 keV) and the Hα equivalent of 1A 0535+262 (left) and KS1947+300 (right).
303/2E 0236.6+6101. The nature of this system is un-
der debate. The lack of pulsations can be explained if
it contains a black hole, that is, if LS I +61 303 is amicroquasar. Radial velocity studies do not completely
rule out this possibility (Casares et al. 2005a). On the
other hand, radio observations favour the presence of a
neutron star. However, in this case LS I +61 303 would
contain a rotation-powered pulsar with nebula and notan accretion-powered pulsar (Dhawan et al. 2006, see
also Sect. 1.2.3).
During major outbursts, transient accretion-powered
pulsars show spin-up episodes, with the spin-up rateincreasing with accretion luminosity (Fig. 12). This is
consistent with the simple model of disc magnetosphere
interaction (Ghosh & Lamb 1979), in which, as the ac-
cretion rate increases, the rate of angular momentum
transfer from the accretion flow to the neutron star in-creases. At the limit of very low mass accretion rate,
the neutron stars are expected to spin down, because
the magnetic field lines that couple to the outer, slower
accretion flow remove spin angular momentum from theneutron star.
Spin periods in the range 1-1000 s can be ex-
plained according to the current understanding of
the neutron star’s spin evolution in a close binary
system (Davies et al. 1979; Davies & Pringle 1981;Zhang et al. 2004; Dai et al. 2006). Longer periods
are, however, difficult to accommodate in the standard
theory. The spin evolution of a neutron star in a bi-
nary system is divided into three basic phases or states.Each state is characterised by a different energy release
mechanism and corresponds to a different evolution-
ary stage of the neutron star. These phases are known
as the pulsar (or ejector) phase, the propeller phaseand the accretion phase. To explain the existence of
long-period pulsars (Pspin >∼ 1000 s), a subphase of the
propeller state needs to be invoked. This subphase is
called the subsonic propeller phase (Davies & Pringle
1981; Ikhsanov 2001a,b, 2007).
After a supernova explosion a neutron star is formedas a rapidly rotating radio pulsar. The spin period at
birth is of the order of a fraction of a second and its
magnetic field of the order of 1013 G. In this phase, the
neutron star radiates at the expense of its rotational
energy.The condition for the transition of a slowing-down
neutron star from the ejector phase into the supersonic
propeller phase occurs when the pressure of the rel-
ativistic wind ejected by the neutron star (magneticpressure) is balanced by the pressure of the plasma sur-
rounding the neutron star (ram pressure) at the grav-
itational capture or accretion radius racc = 2GMx/v2w,
where Mx is the neutron star mass and vw is the stel-
lar wind velocity. The plasma will tend to accrete ontothe neutron star under the action of gravitation. The
electromagnetic field, however, will obstruct this pro-
cess, and the accreting matter will come to a stop at
the magnetospheric boundary. The accreted materialcannot penetrate any further because the drag exerted
by the magnetic field is super-Keplerian. The in-falling
matter is accelerated outward, taking away the angular
momentum of the neutron star. Thus the spin-down
of the neutron star continues until the centrifugal andgravity forces acting on a particle that corotates with
the neutron star balance. This occurs at the so-called
equilibrium period.
If the neutron star spin period is larger than the equi-librium period, then the centrifugal barrier ceases to be
effective and plasma that penetrates into the magneto-
sphere is able to reach the neutron star surface, moving
along the magnetic field lines in the direction of themagnetic poles.
Since the material accreted carries substantial angu-
lar momentum, the neutron star will experience strong

15
spin-up. Therefore, in principle, the equilibrium period
given by
Peq ≈ 23µ6/730 M
−3/715
(
Mx
M⊙
)−5/7
s
represents the maximum period for a given mass accre-
tion rate. µ30 and M15 are the magnetic moment and
mass accretion rate in units of 1030 G cm3 and 1015 g
s−1, respectively.Peq ∼ 103 s can be achieved if the magnetic field
strength in units of 1012 G, B12 > 100 or if M15 <
10−3. None of these conditions is supported by the
observations. The condition of supercritical magnetic
fields would imply that the neutron star is a magnetar.However, the detection of cyclotron lines in the range
10-100 keV indicates that the magnetic field strength
is of the order a few times 1012 G (B12 ∼ 1 − 6). The
low mass accretion rate condition would imply an X-rayluminosity two to three orders of magnitude lower than
observed.
In order to explain spin periods longer than ∼ 103
s, another phase in the spin-period evolution has to
be considered. This phase is called subsonic propellerphase and occurs prior to the accretion-powered phase
(Ikhsanov 2001a,b, 2007).
We indicated above that if Pspin > Peq then matter
can be accreted onto the neutron star surface. How-ever, this is actually not always true. Davies & Pringle
(1981) showed that the star’s magnetosphere dur-
ing the propeller spin-down epoch is surrounded by
a hot, spherical quasi-static envelope. This enve-
lope extends from the magnetospheric radius rm =(
µ2/M√2GMx
)2/7
up to the accretion radius racc =
2GMx/v2w. The interaction between the magnetosphere
and the envelope leads to the deceleration of the rota-
tion rate of the neutron star: the rotational energy loss
by the star is convected up through the envelope by theturbulent motions and lost through its outer boundary.
The neutron star remains in the propeller state as long
as the energy input to the envelope due to the propeller
action by the star dominates the radiative losses from
the envelope plasma.Steady accretion under the condition Pspin > Peq can
be realized only if the cooling of the envelope plasma
(due to radiation and convective motions) dominates
the energy input. The subsonic propeller phase corre-sponds to the phase when this cooling occurs.
The condition for accretion then translates to Pspin >
Pbr, where Pbr is the so-called break period, which is
given by (Ikhsanov 2007)
Pbr ≈ 7× 10⁻⁴µ16/21M−4/21x M−5/7
Pbr ≈ 442 µ16/2130 M
−5/715
(
Mx
M⊙
)−4/21
s
While Pspin < Pbr the temperature of the envelope re-mains higher than the free-fall temperature (Tff(rm) =GMxmp/krm, where mp is the proton mass and k the
Boltzmann constant) and no accretion is possible.
Fig. 12 Observed relationships between flux and pul-sar spin-up rate Left: A 0535+262 during the 1994 gi-ant and GRO J1744+28 during the 1995-1996 outburst(Bildsten et al. 1997). Right: EXO 2030+375 during the2006 giant outburst (Wilson et al. 2008)
3.3 Aperiodic variability
Aperiodic variability refers to the variability caused byprocesses that do not repeat themselves in a periodic
way (van der Klis 1995, 2006). Pulsations, eclipses,outbursts are excluded from the analysis of aperiodicvariability studies. In contrast, flickering, irregular flar-
ing, fluctuations are the subject of study. The maintool used for studying the aperiodic variability is theFourier power spectrum, or a Power Spectral Density(PSD), of the count-rate time series. A number of vari-
ability components, or power-spectral components, to-gether make up the power spectrum. An aperiodic com-ponent by definition covers several frequency resolution
elements. Broad features are called noise and narrowfeatures are called quasi-periodic oscillations (QPOs).The so-calledQ-factor determines whether a noise com-ponent deserves the name QPO. If the Q-factor, defined
as the ratio between the characteristic frequency of thecomponent over its width, Q = ν/FWHM , is largerthan 2, then the noise component is considered to be
narrow enough to be called a QPO.Aperiodic variability studies are normally carried out
in correlation with the position of the source in the

16
0 100 200 300
0.4
0.5
0.6H
C
0 500 1000
0.2
0.3
0.4
0 500 1000 15000.3
0.4
0.5
0 1000 2000 3000 40000.3
0.4
0.5
HC
0 100 200 300 400 5000.3
0.4
0.5
0 500 10000.3
0.4
0.5
0 100 200 300 400 500Count rate (c/s)
0.5
0.6
0.7
HC
0 100 200 300Count rate (c/s)
0.2
0.3
0.4
0.5
KS1947+300 4U 0115+63 EXO 2030+375
V 0332+53 4U 1901+03
XTE J0658-073
A 1118-616 SWIFT J1626.6-5156
Fig. 13 Hardness-intensity diagrams traced by various BeXB during giant (type II) outbursts observed by RXTE. Thehard colour, HC, is the ratio between the count rate in the energy range 15-30 keV over 10-15 keV.
colour-colour diagram and/or hardness-intensity dia-gram. An X-ray color is a ’hardness’ ratio betweenthe photon counts in two broad bands. A colour-colourdiagram (CD) is the plot of one color vs. another cal-culated in different energy bands. The higher energyrange color is called hard colour, while the lower energyrange is the soft colour. A hardness-intensity diagram(HID) is instead the plot of a colour vs. the count-ratein some broad spectral range. Figure 13 shows the HIDof eight BeXB during type II outbursts. The CD/HIDare very useful tools to investigate the spectral varia-tions of an X-ray source because they are model- andinstrument-independent and reflect the intrinsic prop-erties of the system.
Together with the functional form of the variabilitycomponents (”noise”), CD and HID have revolutionisedour understanding of X-ray binaries, unveiling a wholenew phenomenology on the spectral and timing prop-erties of X-ray binaries by introducing the notion ofsource states. A state is defined by the appearance of aspectral (i.e. power-law, blackbody) or variability com-ponent (i.e. Lorentzian) associated with a particularand well-defined position of the source in the CD/HID.A transition between states takes place when the rela-tive strength of the spectral or variability componentsvaries and the source motion in the CD/HID changesdirection (van der Klis 2006).
In LMXBs and BHBs the aperiodic variability is
thought to originate in the irregular nature of the in-ner accretion flow, as an accretion disc is assumed to
exist in this type of systems. In HMXBs the details of
how the magnetic field affects the accretion flow are not
fully understood.While there are numerous references in the litera-
ture on the application of CD/HID analysis on LMXBs
and BHBs, very little work of this type has been done
on HMXBs (Belloni & Hasinger 1990). Recently, Reig
(2008) performed the first systematic analysis of thespectral and rapid aperiodic variability of Be/X-ray bi-
naries during type II outbursts. He found similarities
and differences with respect to the behaviour of LMXBs
and BHBs.The similarities include: i) existence of spectral
branches in the CD/HID. At high and intermediate
flux the sources move along a diagonal branch (DB),
while at very low flux the soft colour decreases while
the hard colour remains constant defining a horizontalbranch (HB); ii) the source does not jump through the
diagram but moves smoothly, i.e. without jumps, fol-
lowing the pattern; iii) the broad noise components in
the HB are more variable (in terms of fractional rms)than in the DB; iv) the power spectra of HMXBs can be
fitted acceptably with a sum of a small number (2–4)

17
of Lorentzian functions (Fig. 14). All sources present
peaked noise in certain spectral states.While the differences are: i) presence of hysteresis
patterns in the CD/HID that might be a manifestation
of the magnetic field (through cyclotron resonant scat-
tering features); ii) slower motion along the spectralbranches, hours to days in LMXBs, days to weeks in
HMXBs; iii) the characteristic time scales implied by
the noise components are about one order of magnitude
longer in HMXBs. There are about 14 HMXBs pulsars
that show QPOs in their power spectra (James et al.2010). The frequencies of these QPOs range from 1–
200 mHz. In contrast, in LMXBs and BHBs QPO range
1-1000 Hz; iv) the so-called LS noise, whose central fre-
quency coincides with the frequency of the fundamentalpeak of the pulse period and suggests a strong coupling
between the periodic and aperiodic noise components.
This coupling implies that the instabilities in the ac-
cretion flow that give rise to the aperiodic variability
must travel all the way down to the neutron star sur-face (Lazzati & Stella 1997; Burderi et al. 1997), and
v) no apparent correlation between the power spectral
parameters (characteristic frequencies, rms) and mass
accretion rate.
4 Circumstellar disc
4.1 Disc formation
Be stars are fast rotators. They have, on average, larger
observed rotational velocities than B stars as a group
(Slettebak 1982). The determination of the rotationalvelocity is believed to be a crucial parameter in the
formation of the circumstellar disc. A rotational veloc-
ity close to the break-up or critical velocity (i.e. the
velocity at which centrifugal forces balance Newtonian
gravity) reduces the effective equatorial gravity to theextent that weak processes such as, gas pressure and/or
non-radial pulsations may trigger the ejection of photo-
spheric matter with sufficient energy and angular mo-
mentum to make it spin up into a Keplerian disc.At present, there is no consensus on how close to
critical velocity Be stars rotate, nor on how Be stars
reached such high spinning rates. Observations suggest
that a large fraction of Be stars rotate at 70–80% of
the critical value (Slettebak 1982; Porter 1996; Yudin2001). However, Townsend et al. (2004) claimed that
if gravity darkening is taken into account then most
or all Be stars may be rotating very nearly at critical
velocity. Whether the rotational velocities of Be starsreflect the initial distribution of angular momentum or
they have been spun up as a result of binary evolution
is still a matter of debate. There is growing evidencethat supports the idea that some Be stars were spunup by mass transfer in interacting binaries (Gies 2000).The former mass donors are now found as neutron stars(i.e. BeXB) in some cases and as a small hot subdwarfsstripped of its outer envelope (Phi Per, 59 Cyg, FYCMa) in other cases (Gies et al. 1998; Rivinius et al.2004; Maintz et al. 2005; Peters et al. 2008).
The projected rotational velocities are determinedby measuring the width of certain spectral lines (seee.g. Steele et al. 1999), as it is generally assumed thatthe width of the spectral lines and the rotational ve-locity are linearly related. This is true even with theinclusion of limb and intrinsic darkening, but if gravi-tational darkening is taken into account, then for starsrotating above ∼80% of critical speeds the linear rela-tionship is no longer applicable. Any increase in therotational velocity is accompanied by almost no changein the line width (Collins & Truax 1995; Cohen et al.2005). As a result, the observational parameter v sin imay systematically underestimate the true projectedequatorial rotation velocity (Townsend et al. 2004). Incontrast, Cranmer (2005) found that this may be truefor the late-type Be stars (i.e., spectral types B3 andlater), but early-type Be stars do seem to be consistentwith a range of intrinsic rotation speeds between ∼40%and 100% critical. For stars rotating sufficiently belowthe critical velocity, any physical model for the origin ofBe-star discs requires a significant increase in angularmomentum above the photosphere.
While the origin of the gas in these discs is agreedto be material ejected from the stellar photosphere, theprecise mechanism triggering this mass ejection remainselusive. One of the first models that tried to explain theformation of circumstellar discs is the wind-compressedmodel (Bjorkman & Cassinelli 1993). The fundamen-tal idea behind this model is that in a rotating wind,the material in the wind tends to orbit the star dur-ing the time it is accelerated outward. If the outwardacceleration is small compared to the rotation, thenthe radiation-driven wind flows toward the equator.Complimentary streamlines from opposite hemisphereswould intercept each other at the equatorial plane giv-ing rise to a pair of shocks above and below the equatorand eventually the disc. Note that the disc is not a re-sult of enhanced equatorial mass-loss. A major problemof this model arises when non-radial components areincluded in the radiation force, as these componentslead to an effective suppression of the equatorward flowneeded to compress the wind (Owocki et al. 1996). Inaddition, this model was unable to reproduce the IRexcess of Be stars (Porter 1997).
The magnetically torqued disc model (Brown et al.1998) extends the ideas of the wind compressed disc

18
0.01 0.1 1 10 1000.0001
0.001
0.01
0.1
ν x
Pν (
rms/
mea
n)2
0.01 0.1 1 10 100 0.01 0.1 1 10 100
0.01 0.1 1 10 1000.0001
0.001
0.01
0.1
ν x
Pν (
rms/
mea
n)2
0.01 0.1 1 10 100Frequency (Hz)
0.01 0.1 1 10 100
rise1 rise2 peak
decay1 decay2 decay4
4U 0115+63
7.5 11.8 11.0
7.9 6.0 0.9HB
Lu
Ll
LLF
LmQPOLb
Fig. 14 Power spectra of 4U 0115+63 at various stages of the 2004 giant outburst. The number at the top left of eachpanel is the X-ray luminosity in units of 1037 erg s−1. From Reig (2008).
model by adding magnetic steering and torquing up ofthe angular momentum of the wind. The up-flowingwind from near the star is magnetically channeled backto the equator. This obviates the Owocki et al. (1996)objections such as the driving of a polar flow by the non-radial radiation field. The magnetically torqued discmodel requires a dipole-like magnetic field to channelthe flow of wind material into a disc region along theequatorial plane.
An alternative scenario that has been put forwardto elevate disc matter to orbits well above the stel-lar surface and which is increasing in popularity isnon-radial pulsations (Cranmer 2009, and referencestherein). Non-radial pulsations may give rise to out-wardly propagating circumstellar waves, which injectenough angular momentum into the upper atmosphereto spin up a Keplerian disc. The main uncertainty inthis model is the connection between pulsations andresonant waves since pulsations themselves are evanes-cent in the stellar photosphere. However, once theresonant waves have been formed, they grow in am-plitude with increasing height, begin to propagate up-wards, and steepen into shocks. The resulting dissipa-tion would create substantial wave pressure that bothincreases the atmospheric scale height and transportsangular momentum upwards.
Once the disc is formed, the viscous decretion discmodel (Lee et al. 1991; Okazaki 2001) stands up as avery promising model that explains many of the ob-served features in discs around Be stars. In this model,
matter supplied from the equatorial surface of the stargradually drifts outward by the viscous torque andforms the disc. Decretion discs operate in a simi-lar fashion to accretion discs, except that the sign ofM (mass decretion/accretion rate) is opposite. Vis-cosity is treated following the Shakura-Sunyaev’s α-prescription. The outflow is highly subsonic in the innerpart of the disc and close to Keplerian. Although as-pects of the modeling (e.g., the supply of matter withsufficient angular momentum to the inner edge of thedisc or the interaction of the stellar radiation with thedisc matter) are not fully solved yet, the model is ableto explain the very low outflow velocities (the observedupper limits are, at most, a few km s−1) and also theV/R variability observed in Be stars.
4.2 Disc-loss episodes
The use of photometric calibration for the determina-tion of the spectral type and luminosity class in a Bestar is not as straightforward as in a non-emission-lineB-type star owing to the presence of the surround-ing envelope, which distorts the characteristic photo-spheric spectrum. Be stars appear redder than thenon-emission B stars, owing to the additional redden-ing caused by the hydrogen free-bound and free-freeprocesses in the circumstellar envelope.
Thus, in a Be star, one has to correct for both cir-cumstellar and interstellar reddening before any cali-bration can be used. There is no easy way to decouple

19
Table 4 Rotational velocity of Be/X-ray binaries
X-ray Optical Spectral Inclination v sin i Reference
source counterpart type angle (◦) (km s−1)
4U 0115+634 V635 Cas B0.2V 43 300±50 1
RX J0146.9+6121 LS I +61 235 B1III-V – 200±30 2
V 0332+53 BQ Cam O8-9V <10 <150 3
X-Per HD 24534 O9.5III 23-30 215±10 4,5RX J0440.9+4431 LS V +44 17 B1III-V 235±15 6
1A 0535+262 HD 245770 O9.7III 28-35 225±10 7,8
RX J0812.4–3114 LS 992 B0.5III – 240±20 9
1A 1118–615 Hen 3-640 O9.5IV – 300 10
4U 1145–619 V801 Cen B0.2III <45 250±30, 290 11,124U 1258–61 V850 Cen B2V 90 sh – 13
SAX J2103.5+4545 – B0V – 240±20 14
Note: [1] Negueruela et al. (2001), [2] Reig et al. (1997), [3] Negueruela et al. (1999) [4] Lyubimkov et al. (1997), [5]Delgado-Martı et al. (2001), [6] Reig et al. (2005) [7] Haigh et al. (2004), [8] Grundstrom et al. (1997), [9] Reig et al. (2001) [10]Janot-Pacheco et al. (1981), [11] Janot-Pacheco et al. (1982), [12] Webster (1974) [13] Parkes et al (1980), [14] Reig et al. (2004)
Table 5 Disc-loss episodes in Be/X-ray binaries.
Source Spectral V0 (B − V )0 EW(Hα) Tdisc Tloss Reference
name type (A) (year) (day)
4U 0115+63 B0.2Ve 15.5 1.43 +2.4 3-5 800 1,2X Per B0Ve 6.80 0.14 +2.7 7 800 3,4
1A 0535+262 O9.7IIIe 9.44 0.41 +2.5 4-5 600 5,6
RX J0812.4–3114 B0.2IVe 12.5 0.4 +1.4 4 – 7
RX J0440.9+4431 B0.2Ve – – –0.5 >10 <200 8
IGR J06074+2205 B0.5Ve – – +2.2 >5 – 9SAX J2103.5+4545 B0Ve 14.35 1.07 +2.8 1.5-2 1000 10
Note: [1] Negueruela et al. (2001), [2] Reig et al. (2007), [3] Roche et al. (1997), [4] Clark et al. (2001) [5] Haigh et al. (1999), [6]Clark et al. (1998), [7] Reig et al. (2001), [8] Reig et al. (2005) [9] Reig et al. (2010b), [10] Reig et al. (2010a)
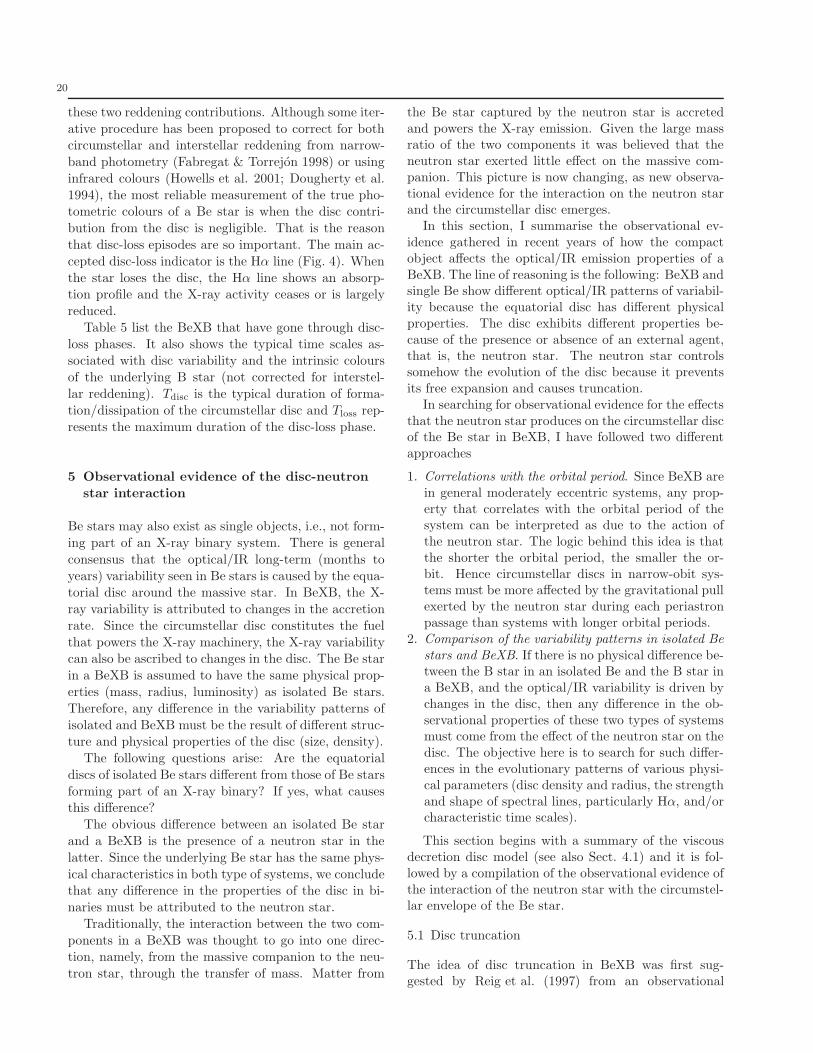
20
these two reddening contributions. Although some iter-
ative procedure has been proposed to correct for bothcircumstellar and interstellar reddening from narrow-
band photometry (Fabregat & Torrejon 1998) or using
infrared colours (Howells et al. 2001; Dougherty et al.
1994), the most reliable measurement of the true pho-tometric colours of a Be star is when the disc contri-
bution from the disc is negligible. That is the reason
that disc-loss episodes are so important. The main ac-
cepted disc-loss indicator is the Hα line (Fig. 4). When
the star loses the disc, the Hα line shows an absorp-tion profile and the X-ray activity ceases or is largely
reduced.
Table 5 list the BeXB that have gone through disc-
loss phases. It also shows the typical time scales as-sociated with disc variability and the intrinsic colours
of the underlying B star (not corrected for interstel-
lar reddening). Tdisc is the typical duration of forma-
tion/dissipation of the circumstellar disc and Tloss rep-
resents the maximum duration of the disc-loss phase.
5 Observational evidence of the disc-neutron
star interaction
Be stars may also exist as single objects, i.e., not form-
ing part of an X-ray binary system. There is general
consensus that the optical/IR long-term (months to
years) variability seen in Be stars is caused by the equa-torial disc around the massive star. In BeXB, the X-
ray variability is attributed to changes in the accretion
rate. Since the circumstellar disc constitutes the fuel
that powers the X-ray machinery, the X-ray variabilitycan also be ascribed to changes in the disc. The Be star
in a BeXB is assumed to have the same physical prop-
erties (mass, radius, luminosity) as isolated Be stars.
Therefore, any difference in the variability patterns of
isolated and BeXB must be the result of different struc-ture and physical properties of the disc (size, density).
The following questions arise: Are the equatorial
discs of isolated Be stars different from those of Be stars
forming part of an X-ray binary? If yes, what causesthis difference?
The obvious difference between an isolated Be star
and a BeXB is the presence of a neutron star in the
latter. Since the underlying Be star has the same phys-
ical characteristics in both type of systems, we concludethat any difference in the properties of the disc in bi-
naries must be attributed to the neutron star.
Traditionally, the interaction between the two com-
ponents in a BeXB was thought to go into one direc-tion, namely, from the massive companion to the neu-
tron star, through the transfer of mass. Matter from
the Be star captured by the neutron star is accretedand powers the X-ray emission. Given the large massratio of the two components it was believed that theneutron star exerted little effect on the massive com-panion. This picture is now changing, as new observa-tional evidence for the interaction on the neutron starand the circumstellar disc emerges.
In this section, I summarise the observational ev-idence gathered in recent years of how the compactobject affects the optical/IR emission properties of aBeXB. The line of reasoning is the following: BeXB andsingle Be show different optical/IR patterns of variabil-ity because the equatorial disc has different physicalproperties. The disc exhibits different properties be-cause of the presence or absence of an external agent,that is, the neutron star. The neutron star controlssomehow the evolution of the disc because it preventsits free expansion and causes truncation.
In searching for observational evidence for the effectsthat the neutron star produces on the circumstellar discof the Be star in BeXB, I have followed two differentapproaches
1. Correlations with the orbital period. Since BeXB arein general moderately eccentric systems, any prop-erty that correlates with the orbital period of thesystem can be interpreted as due to the action ofthe neutron star. The logic behind this idea is thatthe shorter the orbital period, the smaller the or-bit. Hence circumstellar discs in narrow-obit sys-tems must be more affected by the gravitational pullexerted by the neutron star during each periastronpassage than systems with longer orbital periods.
2. Comparison of the variability patterns in isolated Bestars and BeXB. If there is no physical difference be-tween the B star in an isolated Be and the B star ina BeXB, and the optical/IR variability is driven bychanges in the disc, then any difference in the ob-servational properties of these two types of systemsmust come from the effect of the neutron star on thedisc. The objective here is to search for such differ-ences in the evolutionary patterns of various physi-cal parameters (disc density and radius, the strengthand shape of spectral lines, particularly Hα, and/orcharacteristic time scales).
This section begins with a summary of the viscousdecretion disc model (see also Sect. 4.1) and it is fol-lowed by a compilation of the observational evidence ofthe interaction of the neutron star with the circumstel-lar envelope of the Be star.
5.1 Disc truncation
The idea of disc truncation in BeXB was first sug-gested by Reig et al. (1997) from an observational

21
0 100 200Orbital period (days)
20
40
60
EW
(H ) α
Fig. 15 Porb–EW(Hα) diagram. Milky way objects havebeen represented by circles and BeXB in the Small Mag-ellanic Clouds by squares. The linear regression for thecombined data sample is shown with a solid line, while thedashed line represents a power-law fit with exponent n=4/3.
point of view and the theory subsequently developedby Okazaki and collaborators in a series of papers:Negueruela & Okazaki (2001); Okazaki & Negueruela(2001); Okazaki et al. (2002).
The central idea behind the viscous decretion discmodels is that Be stars’ discs are supported by viscos-ity. In this respect, the viscous excretion discs are verysimilar to the well-known viscous accretion discs, exceptfor the changed sign of the rate of the mass flow. Angu-lar momentum is transferred from the optical compan-ion to the inner edge of the disc, increasing its angularvelocity to Keplerian (rotationally supported). The ra-dial velocity component is subsonic even at the distancewhere the neutron star lies. Truncation occurs by thetidal interaction when the resonant torque exerted bythe neutron star exceeds the viscous torque. This oc-curs only at certain radii — where the ratio betweenthe angular frequency of disc rotation and the angu-lar frequency of the mean binary motion is a rationalnumber. The efficiency of truncation depends stronglyon the gap, δr, between the truncation radius and theinner Lagrangian point and the viscosity parameter α.If τdrift is the time scale for a particle in the disc tocross this gap then truncation will be efficient whenτdrift > Porb. Typical values of the viscosity parameterare α < 1. Truncation is expected to be more efficientin low and moderate eccentricity systems (e<∼0.3) withnarrow orbits (Porb <∼ 40 d) than in high eccentricitysystems because the former have wider gaps.
Okazaki et al. (2002) performed numerical simula-tions of the disc formation around isolated Be stars andof the interaction between the Be-star disc and the neu-tron star in BeXB and showed that resonant truncationis effective if the viscosity parameter is α << 1. There
is a radius outside of which the azimuthally-averaged
surface density decreases steeply. When α ∼ 0.1 theslope outside this radius is steeper, giving a stronger
truncation effect on the disc. In the truncated disc
model, the material lost from the Be star accumu-
lates and the disc becomes denser more rapidly thanif around an isolated Be star.
5.2 Correlations with orbital period
If the circumstellar disc is responsible for the variabilityobserved at all wavelengths in BeXB, then correlations
of an observational parameter with the orbital period
can be attributed to the interaction of the neutron star
with the disc.
5.2.1 The Porb–EW(Hα) diagram
Figure 15 shows an updated version of the Porb–
EW(Hα) diagram by Reig et al. (1997, see also Reig(2007); Antoniou et al. (2009b)). The original Porb–
EW(Hα) diagram contained 11 BeXB, of which only 9
had well established orbital periods. Since then sev-
eral new BeXB have been discovered and their or-bital periods determined. Especially remarkable has
been the discovery of a large number of BeXB in the
Magellanic Clouds (Coe et al. 2005; Liu et al. 2005;
Schmidtke & Cowly 2006; Antoniou et al. 2009b). In
this figure, only sources with well-determined orbitalperiods have been included, thus other SMC X-ray pul-
sars (such as SXP756, SXP8.80, SXP46.6, and SXP304)
with published Hα equivalent widths are not present in
the figure.The Porb–EW(Hα) diagram is based on the fact that
the Hα line is the prime indicator of the circumstel-
lar disc state. Although an instantaneous measure-
ment of the EW(Hα) may not be an effective mea-
surement of the size of the disc, the maximum equiv-alent width, when monitored during a long length of
time (longer than the typical time scales for changes
in the circumstellar disc, namely, from few months
to a few years) becomes a significant indicator of thesize of the disc. Based on interferometric observations,
Quirrenbach et al. (1997) and Tycner et al. (2005) have
shown that there is a clear linear correlation between
the net Hα emission and the physical extent of the emit-
ting region. Also, the observed correlations between thespectral parameters of the Hα line (FWHM, EW, peak
separation in double-peak profiles) and the rotational
velocity that have been observed in many Be stars are
interpreted as evidence for rotationally dominated cir-cumstellar disc (Dachs et al. 1986). In particular, in-
terpreting the peak separation (∆peak) of the Hα split

22
profiles as the outer radius (Rout) of the emission line
forming region (Huang 1972)
Rout
R∗
=
(
2v sin i
∆peak
)2
(1)
the radius of the emitting region can be estimated(Hummel & Vrancken 1995; Jaschek & Jaschek 2004).
v sin i is the projected rotational velocity of the B star
(v is the equatorial rotational velocity and i the in-
clination toward the observer). As the EW(Hα) in-
creases, the peak separation decreases, hence increas-ing the radius of the Hα emitting region (Dachs 1992;
Hanuschik 1988). Single peak profiles typically corre-
spond to larger discs.
Note that the value of the Hα equivalent width ofFig. 15 is the maximum ever reported. Some systems,
especially in the SMC systems, have been discovered
recently, hence the monitoring of the Hα is necessarily
short. For these systems, the value of the EW(Hα)
may not represent a high state of the circumstellar disc.The EW(Hα) of such systems should be considered as
lower limits. This is the case of the galactic BeXB GRO
J2058+42 and most likely of the SMC source SXP455
(RX J0101.3-7211).Assuming then, that EW(Hα) provides a good mea-
sure of the size of the circumstellar disc, Fig. 15 in-
dicates that systems with long orbital periods have
larger discs, while narrow orbit systems contain smaller
discs. The existence of the above relationship providesa strong argument that the discs are truncated, due to
the action of the compact object, to a radius that is
a fraction of the semimajor axis. Given the similar-
ity in masses of the optical companions in BeXB, wewould expect that the truncation radius rtrunc would
scale with the semimajor axis according to Kepler’s
Third Law as rtrunc ∝ P 2/3. Since EW(Hα) scales
as the square of the disc radius all other things beingequal (Grundstrom & Gies 2006), the simple prediction
would be EW (Hα) ∝ P 4/3. The solid line in Fig. 15
corresponds to a simple linear regression fit, while the
dashed line represents a power-law fit with exponent
equal to 4/3.
5.2.2 Be −→ B −→ Be phase
Column 4 of Table 5 gives the duration of the discformation/dissipation phase, Tdisc, of those BeXB for
which reliable data exist. The orbital period is given in
column 6. As can be seen there is a good correlation be-
tween Tdisc and the orbital period. Systems with short
orbital periods tend to show faster disc growth and dis-sipation cycles, while longer time scales are associated
with longer orbital periods. This result agrees with
the scenario that the Be disc is truncated by the tidaltorques from the neutron star, which would be more
significant for narrower orbits.
5.2.3 Long-term X-ray variability
Reig (2007) investigated the long-term X-ray variabil-
ity, expressed as the root-mean-square (rms) of the
ASM/RXTE light curves, of a set of BeXB and found
that the systems with the larger rms are those har-bouring faster rotating neutron stars and those in low
eccentric and relatively narrow orbits. The rms am-
plitude was computed as rms = σ2/x2, where x is the
mean count rate and σ2 = σ2obs − σ2
exp is the differencebetween the observed variance, σ2
obs =∑
i(xi − x)2/N ,
and the expected variance, σ2exp =
∑
i σ2i /N (σi are
the experimental errors, and N is the total number of
points).
Figure 16 shows the rms as a function of the spinperiod, eccentricity and orbital period of the systems.
Note that by using the rms the emphasis is put on the
amplitude of the variations rather than on how often
the variations take place. For the sake of comparison,persistent BeXB and supergiant X-ray binaries, that is,
systems whose optical companion is an evolved (lumi-
nosity class I-II) star, have also been included. Different
type of systems have been represented by different sym-
bols as follows: transient BeXB by circles, persistentBeXB by stars and supergiants by squares. Systems
that have shown Type II outbursts are represented by
black filled circles. Triangles denote the class of low-e
BeXB (Sect. 1.2.1). It is very likely that low-e BeXBand persistent BeXB form only one class of systems.
In fact, X-Per, which is considered the prototype of
the persistent BeXB, also belongs to the class of low-e
BeXB.
In all cases a clear anticorrelation is apparent: thesystems with the faster rotating neutron stars and with
low eccentricity and narrow orbits are more variable,
i.e., present higher rms. This plot then suggests two in-
teresting results. First, since the BeXB and the SGXBoccupy clearly distinct regions in Fig. 16, the X-ray
variability in high-mass X-ray binaries does not only
depend on the physical conditions in the vicinity of the
compact object but also on the mass transfer mech-
anism, i.e., whether a circumstellar disc is present ornot. Second, the systems containing fast spinning neu-
tron stars are more likely to exhibit Type II outbursts.
In general, i) the more eccentric the orbit the lower
the variability and ii) type II activity mainly occursin low-eccentric systems. The low eccentricity class of
BeXB follow the general trend in the rms − Pspin and
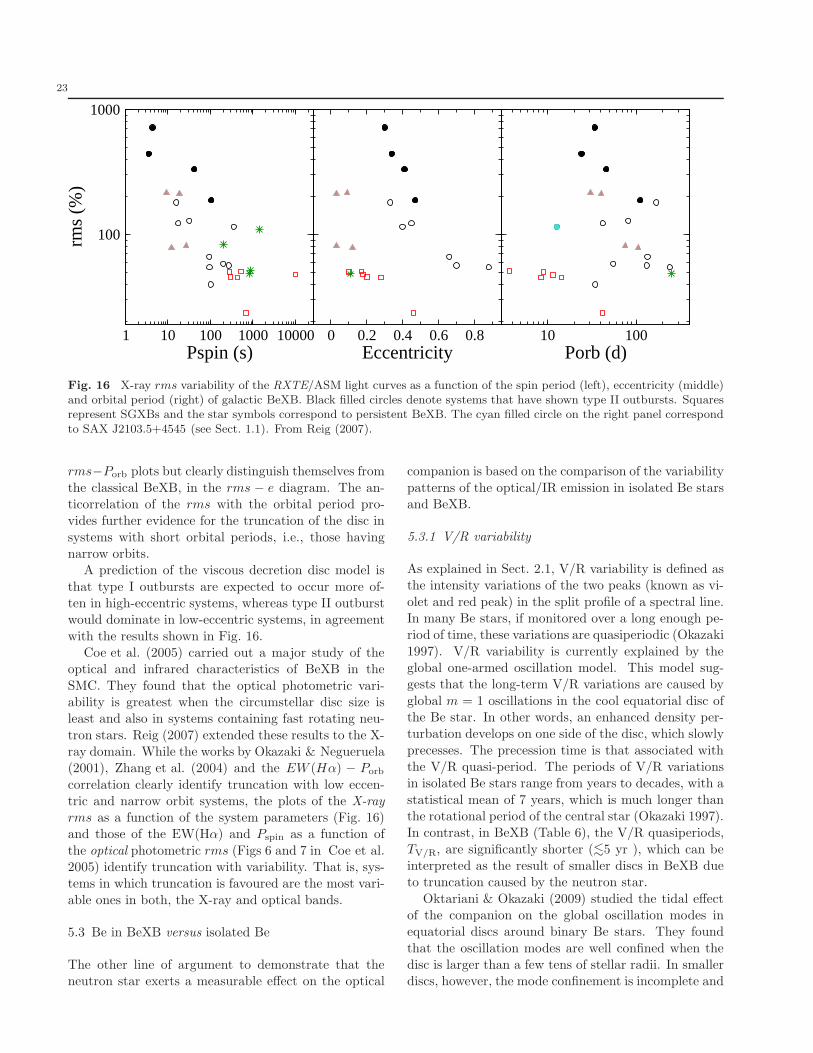
23
1 10 100 1000 10000Pspin (s)
100
1000
rms
(%)
0 0.2 0.4 0.6 0.8Eccentricity
10 100Porb (d)
Fig. 16 X-ray rms variability of the RXTE/ASM light curves as a function of the spin period (left), eccentricity (middle)and orbital period (right) of galactic BeXB. Black filled circles denote systems that have shown type II outbursts. Squaresrepresent SGXBs and the star symbols correspond to persistent BeXB. The cyan filled circle on the right panel correspondto SAX J2103.5+4545 (see Sect. 1.1). From Reig (2007).
rms−Porb plots but clearly distinguish themselves from
the classical BeXB, in the rms − e diagram. The an-ticorrelation of the rms with the orbital period pro-vides further evidence for the truncation of the disc in
systems with short orbital periods, i.e., those havingnarrow orbits.
A prediction of the viscous decretion disc model is
that type I outbursts are expected to occur more of-ten in high-eccentric systems, whereas type II outburstwould dominate in low-eccentric systems, in agreement
with the results shown in Fig. 16.Coe et al. (2005) carried out a major study of the
optical and infrared characteristics of BeXB in the
SMC. They found that the optical photometric vari-ability is greatest when the circumstellar disc size isleast and also in systems containing fast rotating neu-
tron stars. Reig (2007) extended these results to the X-ray domain. While the works by Okazaki & Negueruela(2001), Zhang et al. (2004) and the EW (Hα) − Porb
correlation clearly identify truncation with low eccen-tric and narrow orbit systems, the plots of the X-rayrms as a function of the system parameters (Fig. 16)and those of the EW(Hα) and Pspin as a function of
the optical photometric rms (Figs 6 and 7 in Coe et al.2005) identify truncation with variability. That is, sys-tems in which truncation is favoured are the most vari-
able ones in both, the X-ray and optical bands.
5.3 Be in BeXB versus isolated Be
The other line of argument to demonstrate that theneutron star exerts a measurable effect on the optical
companion is based on the comparison of the variability
patterns of the optical/IR emission in isolated Be starsand BeXB.
5.3.1 V/R variability
As explained in Sect. 2.1, V/R variability is defined asthe intensity variations of the two peaks (known as vi-
olet and red peak) in the split profile of a spectral line.In many Be stars, if monitored over a long enough pe-riod of time, these variations are quasiperiodic (Okazaki
1997). V/R variability is currently explained by theglobal one-armed oscillation model. This model sug-gests that the long-term V/R variations are caused by
global m = 1 oscillations in the cool equatorial disc ofthe Be star. In other words, an enhanced density per-turbation develops on one side of the disc, which slowly
precesses. The precession time is that associated withthe V/R quasi-period. The periods of V/R variationsin isolated Be stars range from years to decades, with a
statistical mean of 7 years, which is much longer thanthe rotational period of the central star (Okazaki 1997).In contrast, in BeXB (Table 6), the V/R quasiperiods,
TV/R, are significantly shorter (<∼5 yr ), which can beinterpreted as the result of smaller discs in BeXB dueto truncation caused by the neutron star.
Oktariani & Okazaki (2009) studied the tidal effectof the companion on the global oscillation modes inequatorial discs around binary Be stars. They found
that the oscillation modes are well confined when thedisc is larger than a few tens of stellar radii. In smallerdiscs, however, the mode confinement is incomplete and

24
Fig. 17 Peak separation as a function of EW(Hα). Thedashed line represents the average behaviour of the iso-lated Be stars. Be/X-ray binaries show, on average denserdisks. Different sysmbols correspond to different BeXB.From Zamanov et al. (2001).
the oscillation period depends on the binary parameters
significantly. The oscillation period becomes longer in
the case of a wider binary separation and/or a lower
binary mass ratio. Such dependence is observed onlyfor short period binaries. In wide binaries where the
disc size is large enough to confine the one-armed modes
in the inner part of the disc, the mode characteristics
depend little on the binary parameters.
5.3.2 Disc density
Zamanov et al. (2001) carried out a comparative study
of the circumstellar discs in BeXB and isolated Be starsbased on the Hα line emission properties. They found
that the discs of BeXB are twice as dense as and have,
on average, smaller size than the discs of isolated Be
stars.
Hanuschik (1988, 1989) showed that there is a corre-lation between the Hα peak separation and the equiv-
alent width in Be stars, according to the law
log
(
∆V
2 v sin i
)
= a log
(
−EW (Hα)
A
)
+ b
where v sin i is the projected rotational velocity and
EW(Hα) is given in Angstroms. a and b are related tothe rotational law index a = −j/2 (j=0.5 for Keplerian
rotation and j=1 for conservation of angular momen-
tum) and with the disc electron density, respectively.
Figure 17 shows the plot of log ∆V2 v sin i vs log EW(Hα)
for a number of BeXB. The straight line (a = −0.4,b = −0.1) represents the average behaviour of the iso-
lated Be stars investigated by Hanuschik (1989). The
data points correspond to BeXB. As can be seen, the
vast majority of the data points lie above the averageline, i.e. they are shifted towards denser discs.
Another result that supports denser disc in Be bina-ries is the correlation observed between the Hα equiv-alent width and the (B − V ) colour excess in a sam-ple of Be/X-ray binaries in the Magellanic Clouds(Torrejon et al. 2007). The total reddening in the di-rection of a Be star or BeXB binary is composed oftwo components: one (constant) produced mainly bydust in the interstellar space through the line of sightEis(B − V ) and another one (variable) produced bythe circumstellar gas around the Be star Ecs(B − V ).The nature and wavelength dependence of these tworeddenings is completely different but their final effectupon the photometric indices and spectrum is, in prin-ciple, indistinguishable. Torrejon et al. (2007) foundthat the circumstellar excess is ∼ 10 times larger forBe stars in binaries than for isolated Be stars with thesame amount of emission, and also that the circumstel-lar colour excess, Ecs(B−V ) saturates at∼ 0.2 magni-tudes beyond EW(Hα)≈20 A.
Again the denser discs seen in BeXB can be ex-plained by disc truncation. Okazaki et al. (2002)showed that during the initial build-up phase, the discevolution is similar to that for isolated Be stars. But,later on, the effect of the resonant torque becomes ap-parent, preventing the disc gas from drifting outwardsat several resonance radii. As a result, the disc densityincreases more rapidly than that for isolated Be stars,in agreement with the results presented in this section.
5.3.3 Disc size
As mentioned above, interferometric observations haveshown that there is a clear linear correlation betweenthe net Hα emission and the physical extent of theemitting region (Quirrenbach et al. 1997; Tycner et al.2005). Using numerical models of the circumstellardiscs of Be stars, Grundstrom & Gies (2006) showedthat there are monotonic relationships between theemission-line equivalent width and the ratio of the an-gular half-width at half maximum of the projected discmajor axis to the radius of the star, providing a methodto estimate disc radii based only on the Hα equivalentwidth with an accuracy of about 30%. Since, on av-erage, isolated Be stars show larger EW(Hα) than Bestars in BeXB (Reig et al. 1997; Antoniou et al. 2009b),we conclude that, on average, the envelopes of Be starsin BeXB are smaller than those present in isolated Bestars.
5.4 Quantized infrared excess flux states
Further evidence in favour of the decretion disc modeland disc truncation comes from the infrared band.

25
Table 6 Characteristic timescales for disc variability in Be/X-ray binaries.
X-ray Optical Spectral Tdisc TV/R Porb Reference
name name type (year) (year) (day)
4U 0115+63 V635 Cas B0.2Ve 3-5 0.5-1.5 24.3 1
V 0332+53 BQ Cam O9Ve 4-5 1 34.2 2,3
4U 0352+309 X Per B0Ve 7 0.6-2 250 41A 0535+262 V725 Tau O9.7IIIe 4-5 1-1.5 111 5,6
RX J0812.4-3114 LS 992 B0.2IVe 4 − 80 7
SAX J2103.5+4545 – B0.5V 1.5-2 − 12.7 8
RX J 0146.9+6121 LS I +61 235 B1Ve >10 3.4 >200∗ 9
4U 1145-619 V801 Cen B1Ve >10 3 186 10RX J0440.9+4431 LS V +44 17 B0.2Ve >10 − >150∗ 11
IGR J06074+2205 – B0.5V >5 ∼5 – 12
∗Obtained from the Pspin − Porb correlation.
Note: [1] Negueruela et al. (2001), [2] Negueruela et al. (1999), [3] Goranskii (2001) [4] Clark et al. (2001), [5] Haigh et al. (2004), [6]Clark et al. (1998) [7] Reig et al. (2001), [8] Reig et al. (2010a), [9] Reig et al. (2000) [10] Stevens et al. (1997), [11] Reig et al. (2005),
[12] Reig et al. (2010b)
Haigh et al. (2004) showed that the Be/X-ray binaryA 0535+26 displays a clear bimodality in the infraredmagnitudes distribution, suggesting that the system al-ternates between a faint and a bright flux state.
These quantized infrared excess flux states are a nat-ural consequence of the resonant truncation hypothesisproposed by Okazaki & Negueruela (2001) and consti-tute a firm observational verification of the proposedresonant truncation scheme for Be X-ray binaries. Ac-cording to this model, tidal torques, which operate moststrongly in orbits resonant with that of the neutronstar, truncate the disc at radii meeting the conditionPNS : Ptrunc = n : 1 where n is an integer. Haigh et al.(2004) identified the two states with resonances 5:1 and6:1. A possible brighter infrared state corresponding toresonance 4:1 may have also been seen during the 70’s.
The simultaneity of X-ray activity with transitionsbetween these states strongly suggests a broad mecha-nism for outbursts, in which material lost from the discduring the reduction of the truncation radius is accretedby the neutron star.
The idea is simple and neat. When the disc outer ra-dius makes a quantum leap inwards the material presentbetween those radii must be relocated elsewhere in thesystem and becomes available for accretion. In 1993/94a change of infrared state as accompanied by a giantX-ray outburst. This simultaneity of the type II out-burst with the change of infrared state strongly suggeststhat the giant outburst was caused by the accretion ofmaterial previously resident between the 5:1 and 6:1resonances. Importantly, truncation would appear tobe the cause of the X-radiation and not vice versa, astruncation commenced before X-ray emission.
6 Be/X in other galaxies
The study of X-ray source populations in other galaxiesis hampered by the large distance from us. Even othergalaxies of the Local Group are too far to reach thequiescence population of HMXBs (LX ∼ 1033 − 1035
erg s −1). Good enough signal-to-noise optical spec-tra, needed to derive the spectral type of the opticalcounterparts, are very hard to achieve. Because of therelatively low intergalactic extinction, well-establisheddistance and their proximity, the Magellanic Clouds(MC) represent the best targets to study a completeX-ray binary population. In fact, they are the onlygalaxies for which meaningful statistical studies can beperformed (current space detectors can detect MC X-ray sources down to a few 1033 erg s −1). Moreover, theMC show different chemical compositions and are heav-ily interacting with the Milky Way, which affects theirstar formation history. Therefore, the study of stellarpopulations in the MC is particularly rewarding.
Although past X-ray missions with imaging capa-bilities, such as Einstein (Wang & Wu 1992), ROSAT(Haberl et al. 2000), and ASCA (Yokogawa et al. 2003)have surveyed the MC, the deep surveys of the currentmissionsXMM-Newton (Sasaki et al. 2003; Eger & Haberl2008), CHANDRA (McGowan et al. 2008), RXTE(Galache et al. 2008) and INTEGRAL (Gotz et al.2006; Coe et al. 2010) complemented with observa-tions from ground-based telescopes in the optical/IRband (Schmidtke & Cowly 2006; Schurch et al. 2007;McBride et al. 2008; Antoniou et al. 2009a,b) are theones giving new insights into population synthesis mod-els.
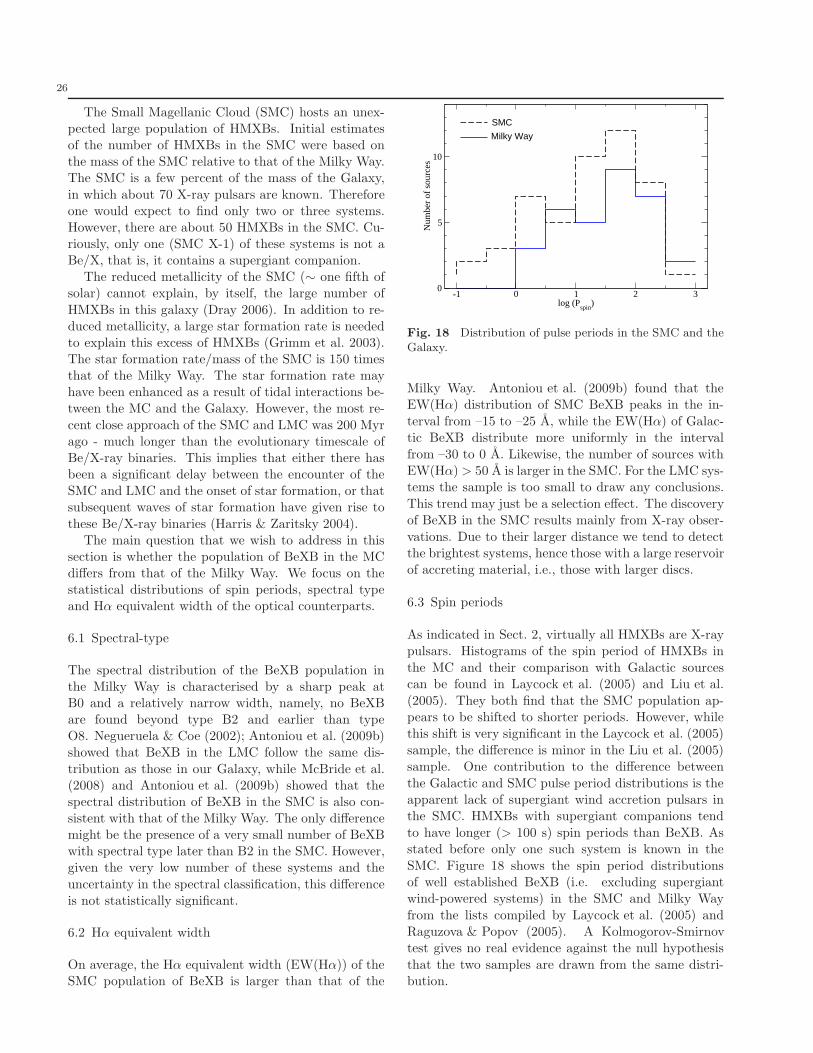
26
The Small Magellanic Cloud (SMC) hosts an unex-pected large population of HMXBs. Initial estimatesof the number of HMXBs in the SMC were based onthe mass of the SMC relative to that of the Milky Way.The SMC is a few percent of the mass of the Galaxy,
in which about 70 X-ray pulsars are known. Thereforeone would expect to find only two or three systems.However, there are about 50 HMXBs in the SMC. Cu-riously, only one (SMC X-1) of these systems is not aBe/X, that is, it contains a supergiant companion.
The reduced metallicity of the SMC (∼ one fifth ofsolar) cannot explain, by itself, the large number of
HMXBs in this galaxy (Dray 2006). In addition to re-duced metallicity, a large star formation rate is neededto explain this excess of HMXBs (Grimm et al. 2003).The star formation rate/mass of the SMC is 150 timesthat of the Milky Way. The star formation rate mayhave been enhanced as a result of tidal interactions be-tween the MC and the Galaxy. However, the most re-
cent close approach of the SMC and LMC was 200 Myrago - much longer than the evolutionary timescale ofBe/X-ray binaries. This implies that either there hasbeen a significant delay between the encounter of theSMC and LMC and the onset of star formation, or thatsubsequent waves of star formation have given rise to
these Be/X-ray binaries (Harris & Zaritsky 2004).The main question that we wish to address in this
section is whether the population of BeXB in the MCdiffers from that of the Milky Way. We focus on thestatistical distributions of spin periods, spectral typeand Hα equivalent width of the optical counterparts.
6.1 Spectral-type
The spectral distribution of the BeXB population inthe Milky Way is characterised by a sharp peak atB0 and a relatively narrow width, namely, no BeXBare found beyond type B2 and earlier than typeO8. Negueruela & Coe (2002); Antoniou et al. (2009b)showed that BeXB in the LMC follow the same dis-
tribution as those in our Galaxy, while McBride et al.(2008) and Antoniou et al. (2009b) showed that thespectral distribution of BeXB in the SMC is also con-sistent with that of the Milky Way. The only differencemight be the presence of a very small number of BeXBwith spectral type later than B2 in the SMC. However,given the very low number of these systems and the
uncertainty in the spectral classification, this differenceis not statistically significant.
6.2 Hα equivalent width
On average, the Hα equivalent width (EW(Hα)) of theSMC population of BeXB is larger than that of the
-1 0 1 2 3log (P
spin)
0
5
10
Num
ber
of s
ourc
es
SMC
Milky Way
Fig. 18 Distribution of pulse periods in the SMC and theGalaxy.
Milky Way. Antoniou et al. (2009b) found that theEW(Hα) distribution of SMC BeXB peaks in the in-
terval from –15 to –25 A, while the EW(Hα) of Galac-tic BeXB distribute more uniformly in the interval
from –30 to 0 A. Likewise, the number of sources withEW(Hα) > 50 A is larger in the SMC. For the LMC sys-tems the sample is too small to draw any conclusions.
This trend may just be a selection effect. The discoveryof BeXB in the SMC results mainly from X-ray obser-
vations. Due to their larger distance we tend to detectthe brightest systems, hence those with a large reservoirof accreting material, i.e., those with larger discs.
6.3 Spin periods
As indicated in Sect. 2, virtually all HMXBs are X-raypulsars. Histograms of the spin period of HMXBs in
the MC and their comparison with Galactic sourcescan be found in Laycock et al. (2005) and Liu et al.
(2005). They both find that the SMC population ap-pears to be shifted to shorter periods. However, whilethis shift is very significant in the Laycock et al. (2005)
sample, the difference is minor in the Liu et al. (2005)sample. One contribution to the difference between
the Galactic and SMC pulse period distributions is theapparent lack of supergiant wind accretion pulsars inthe SMC. HMXBs with supergiant companions tend
to have longer (> 100 s) spin periods than BeXB. Asstated before only one such system is known in the
SMC. Figure 18 shows the spin period distributionsof well established BeXB (i.e. excluding supergiantwind-powered systems) in the SMC and Milky Way
from the lists compiled by Laycock et al. (2005) andRaguzova & Popov (2005). A Kolmogorov-Smirnovtest gives no real evidence against the null hypothesis
that the two samples are drawn from the same distri-bution.

27
7 Summary
The traditional picture of two classes of high-massX-ray binaries, namely supergiant X-ray binaries andBe/X-ray binaries is giving way to a more complexsituation where newly discovered systems may not fitin these categories. Superfast X-ray transients, loweccentricity BeXB, γ-ray binaries, and γ-Cas like ob-jects are among the new type of systems that only re-cently have begun to emerge. BeXB do not form a ho-mogeneous group either with transient and persistentsources, highly eccentric and nearly circular orbits, andfast (Pspin ∼ few seconds) and slow (Pspin ∼ few hun-dred of seconds) rotating neutron stars.
Virtually, all BeXB are X-ray pulsars. The studyof the variability of the X-ray spectral and pulse tim-ing parameters across giant outbursts is crucial to un-derstand the physics of accretion in strongly magne-tised neutron stars. Only recently, attention is beingpaid to the aperiodic variability and evolution of broad-band noise components across the outburst. The ap-plication of diagrams such as hardness-intensity andcolour-colour diagrams, so widely used in black-holeand low-mass binaries, to BeXB and the definition ofspectral states is a promising way to understand thephenomenology of the evolution of outbursts in thesesystems.
Progress in understanding BeXB is also being madein the optical and infrared bands where the massivecompanion shines bright. The data gathered over thepast ten years indicate that the interaction between thecompact object and the Be type star works in two di-rections: the massive companion provides the sourceof matter for accretion; the amount of matter capturedand the way it is captured (transfer mechanism) changethe physical conditions of the neutron star (e.g. byspinning it up or down and shrinking or expanding themagnetosphere). But also, the continuous revolution ofthe neutron star around the optical counterpart pro-duces observable effects, the most important of whichis the truncation of the Be star’s equatorial disc.
Future missions with improved sensitivities in the X-ray band will help solve remaining open questions suchas the formation of accretion discs during X-ray out-bursts, the origin of quasi-periodic oscillations, charac-terisation of the population of persistent BeXB and thetriggering mechanism of the giant outbursts.
AcknowledgementsI want to thank the referee, Douglas Gies, for his
careful reading of this manuscript and his useful andimportant comments. This work has been supportedby the European Union Marie Curie grant MTKD-CT-2006-039965 and EU FP7 ”Capacities” GA No206469.

28
References
Antoniou, V., Zezas, A., Hatzidimitriou, D., & McDowell,J.C., 2009a, ApJ, 697, 1695
Antoniou, V., Hatzidimitriou, D., Zezas, A., & Reig, P.,2009b, ApJ, 707, 1080
Atoyan, A. M., & Aharonian, F. A., 1999, MNRAS, 302,253
Balona, L.A. 2000, in The Be phenomenon in early-type
stars, IAU Colloq. 175, p.1, Eds. Smith, M., Henrichs,H.F., & Fabregat, J., ASPC, 214, 1
Belczynski, K., & Ziolkowski, J., 2009, ApJ, 707, 870Belloni, T., & Hasinger, G. 1990, 230, 103Bildsten, L., Chakrabarty, D., Chiu, J., Finger, M. H., Koh,
D. T., et al. 1997, ApJS, 113, 367Bird, A. J., Bazzano, A., Bassani, L., Capitanio, F., Fiocchi,
M., Hill, A. B., Malizia, A., McBride, V. A., Scaringi, S.,Sguera, V., et al. 2010, ApJS, 186, 1
Bjorkman, J.E., & Cassinelli, J.P., 1993, ApJ, 409, 429Blay, P., Negueruela, I., Reig, P., Coe, M. J., Corbet, R. H.
D., Fabregat, J., & Tarasov, A. E., 2006, A&A, 446, 1095Bodaghee, A., Walter, R., Zurita-Heras, J. A., et al. 2006,
A&A, 447, 1027Bosch-Ramon, V., Aharonian, F:A., & Paredes, J.M., 2005,
A&A, 432, 609Brown, J. C., Cassinelli, J. P., & Maheswaran, M., 2008,
ApJ, 688, 132Burderi, L., Robba, N.R., La Barbera, N., Guainazzi, M.
1997, ApJ, 481, 943Casares, J., Ribas, I., Paredes, J. M., Martı, J., Allende
Prieto, C. 2005a, MNRAS, 360, 1105Chaty, S., 2008, ChJAS, 8, 197Chernyakova, M., Neronov, A., & Walter, R., 2006, MN-
RAS, 372, 1585Clark, J. S., Tarasov, A. E., Steele, et al. 1998, MNRAS,
294, 165Clark, J. S. Steele I.A., 2000, A&AS, 141, 65Clark, J. S., Tarasov, A. E., Okazaki, A. T., Roche, P.,
Lyuty, V. M. 2001, 380, 615Coe, M. J., Roche, P., Everall, C., Fishman, G. J., Hagedon,
K. S., Finger, M., Wilson, R. B., Buckley, D. A. H. et al.Coe, M. J., Edge, W. R. T., Galache, J. L., & McBride, V.
A., 2005, MNRAS, 356, 502Coe, M.J., Bird, A.J., Buckley, D,A.H., Corbet, R.H.D.,
Dean, A.J. et al. 2010, MNRAS, in press, arXiv:1004.2219Cohen, D. H., Hanson, M. M., Townsend, R. H. D., Bjork-
man, K. S., & Gage, M., 2005, in The Nature and Evolu-
tion of Disks Around Hot Stars, ASP Conference Series,Vol. 337, astro-ph/0410317.
Collins, George W., & Truax, Ryland J., 1995, ApJ, 439,860
Corbet, R. H. D., 1986, MNRAS, 220, 1047Cranmer, S. R., 2005, ApJ, 634, 585Cranmer, S. R., 2009, ApJ, 701, 396Dachs, J. & Wamsteker, W. 1982, A&A, 107, 240Dachs, J., Hanuschik, R.W., Kaiser, D., & Rohe, D. 1986,
A&A, 159, 276Dachs, J., Engels, D., & Kiehling, R. 1988, A&A, 194, 167Dachs, J., Hummel, W., & Hanuschik, R.W. 1992, A&ASS,
95, 437Dai, H.-L. Liu, X.-W., & Li, X.-D. 2006, ApJ, 653, 1410
Davidson, K., & Ostriker, J.P., 1973, ApJ, 179, 585Davies, R. E., Fabian, A. C., & Pringle, J. E. 1979, MNRAS,
186, 779Davies, R. E., & Pringle, J. E. 1981, MNRAS, 196, 209Delgado-Martı, H., Levine, A. M., Pfahl, E., Rappaport, S.
A., 2001, ApJ, 546, 455Dhawan, V., Mioduszewski, A., & Rupen, M., 2006, in Pro-
ceedings of the VI Microquasar Workshop: Microquasarsand Beyond, September 18-22, Como, Italy, 52
Dougherty, S. M.; Waters, L. B. F. M., Burki, G., Cote, J.,Cramer, N., van Kerkwijk, M. H., & Taylor, A. R., 1994,A&A, 290, 609
Dray, L.M., 2006, MNRAS, 370, 2079Dubus, G., 2006, A&A, 456, 801Eger, P. & Haberl, F., 2008, A&A, 491, 841Fabregat, J. & Torrejon, J.M., 1998, A&A, 332, 643Finley, J. P., Taylor, M., & Belloni, T. 1994, ApJ, 429, 356Galache, J. L., Corbet, R. H. D., Coe, M. J., Laycock,
S., Schurch, M. P. E., Markwardt, C., Marshall, F. E.,Lochner, J., 2008, ApJS, 177, 189
Gehrz, R. D., Hackwell, J. A., & Jones, T. W. 1974, ApJ,191, 675
Georganopoulos, M., Aharonian, F. A., & Kirk, J. G. 2002,A&A, 388, L25
Ghosh,P. & Lamb, F.K., 1979, ApJ, 234, 296Gies, D.R., Bagnuolo, W.G., Jr., Ferrara, E.C., Kaye, A.B.,
Thaller, M.L., Penny, L.R., & Peters, G.J., 1998, ApJ,493, 440
Gies, D.R., 2000, in IAU Coll. 175: The Be Phenomenon
in Early- Type Stars, ASP Conf. Ser., 214, 668Gies, D. R., Bagnuolo, W. G., Jr., Baines, E. K., ten Brum-
melaar, T. A., Farrington, C. D., et al., 2007, ApJ, 654,527
Goranskii, V. P. 2001, AstL, 27, 516Gtz, D., Mereghetti, S., Merlini, D., Sidoli, L., & Belloni,
T. 2006, A&A, 448, 873Grebel, E. K., Richtler, T., & de Boer, K. S., 1992, A&A,
254, L5Grebenev, S.A., 2010, in Proceedings of the Workshop
The Extreme sky: Sampling the Universe above 10 keV,Otranto, Italy, PoS, 96, 60
Grimm, H.-J., Gilfanov, M., & Sunyaev, R., 2003, MNRAS,339, 793
Grundstrom, E.D., Boyajian, T.S., Finch, C. et al. 2007,ApJ, 660, 1398
Grundstrom, E.D., & Gies, D.R., 2006, ApJ, 651, L53.Grundstrom, E. D., Boyajian, T. S., Finch, C., Gies, D. R.,
Huang, W., et al. 2007, ApJ, 660, 1398Gutierrez Soto, J., 2006, PhD ”Non-radial pulsations in Be
stars: preparation of the COROT space mission”, Uni-versity of Valencia
Haberl, F., Filipovic, M. D., Pietsch, W., & Kahabka, P.,2000, A&AS, 142, 41
Haigh, N. J., Coe, M. J., Steele, I. A., & Fabregat, J. 1999,MNRAS, 310, L21
Haigh, N. J., Coe, M. J., Fabregat, J. 2004, MNRAS, 350,1457
Hanuschik, R.W. 1986, A&A, 166, 185Hanuschik, R.W., Kozok, J.R., & Kaiser, D. 1988, A&A,
189, 147Hanuschik, R.W. 1989, Ap&SS, 161, 61

29
Hanuschik, R.W., Hummel, W., Dietle, O., & Sutorius, E.1995, A&A, 300, 163
Hanuschik, R.W., 1996, 308,170Hayasaki, K. & Ozakaki, A.T. 2004, MNRAS, 350, 971Huang, S.S. 1972, ApJ, 171, 549Harris, J., & Zaritsky, D., 2004, AJ, 127, 1531Howells, L., Steele, I.A., Porter, J.M., & Etherton, J., 2001,
A&A, 369, 99Hummel, W. 1994, A&A, 289, 458Hummel, W., & Vrancken, M. 1995, 302, 751Hummel, W., & Hanuschik, R.W. 1997, A&A, 320, 852Ikhsanov, N.R., 2001a, 368, L5Ikhsanov, N.R., 2001b, 375, 944Ikhsanov, N.R., 2007, MNRAS, 375, 698James, M., Paul, B., Devasia, J., & Indulekha, K., 2010
MNRAS, 407, 285Janot-Pacheco, E., Ilovaisky, S. A., & Chevalier, C. 1981,
A&A, 99, 274Janot-Pacheco, E., Chevalier, C., & Ilovaisky, S.A., 1982,
IAUS, 98, 151Jaschek, C., & Jaschek, M. 2004yCat, 6057, 0. VizieR On-
line Data Catalog: VI/57. Originally published in: 1993,A&AS, 97, 807
Kaufman Bernado, M. M., Romero, G. E., & Mirabel, I. F.2002, A&A, 385, L10
Kaur, R., Paul, B., Kumar, B., & Sagar, R., 2008, MNRAS,386, 2253
Koenigsberger, G., Georgiev, L., Moreno, E., Richer, M.G.,Toledano, O., Canalizo, G., & Arrieta, A., 2006, A&A458, 513
Kriss, G. A., Cioffi, D. F., Canizares, C. R. 1983, ApJ, 272,439
Kylafis, N.D., Papadakis, I.E., Reig, P., Giannios, D., &Pooley, G.G., 2008, A&A, 489, 481
La Palombara, N., Sidoli, L., Esposito, P., Tiengo, A., &Mereghetti, S., 2009, A&A, 505, 947
Laycock, S., Corbet, R. H. D., Coe, M. J., Marshall, F. E.,Markwardt, C., Lochner, J., 2005, ApJS, 161, 96
Lazzati, D. & Stella, L., 1997, ApJ, 476, 267Lee, U., Saio, H., & Osaki, Y., 1991, MNRAS, 250, 432Liu, Q. Z., van Paradijs, J., van den Heuvel, E. P. J. 2005,
A&A, 442, 1135Liu, Q. Z., van Paradijs, J., van den Heuvel, E. P. J., 2006,
A&A, 455, 1165Liu, Q. Z., van Paradijs, J., van den Heuvel, E. P. J., 2007,
A&A, 469, 807Lopes de Oliveira, R., Motch, C., Haberl, F., Negueruela,
I., & Janot-Pacheco, E., 2006, A&A, 454, 265Lucy, L.B. & Solomon, P.M. 1970, ApJ, 159, 879Lyubimkov, L. S., Rostopchin, S. I., Roche, P., & Tarasov,
A. E., 1997, MNRAS, 286, 549Maintz, M., Rivinius, T., Stahl, O., Stefl, S., & Appenzeller,
I. 2005, Publ. Astron. Inst. Czechoslovakia, 93, 21Markoff, S., Nowak, M., Corbel, S., Fender, R., & Falcke,
H., 2003, A&A, 397, 645McBride, V. A., Coe, M. J., Negueruela, I., Schurch, M. P.
E., McGowan, K. E., 2008, MNRAS, 388, 1198McGowan, K. E., Coe, M. J., Schurch, M. P. E., McBride,
V. A., Galache, J. L., Edge, W. R. T., Corbet, R. H. D.,Laycock, S., Buckley, D. A. H., 2008, MNRAS, 383, 330
McSwain, M. V., & Gies, D. R., 2005, ApJ, 622, 1052
Moffat, A. F. J., Haupt, W., & Schmidt-Kaler, T., 1973,A&A, 23, 433
Motch, C., Stella, L., Janot-Pacheco, E., & Mouchet, M.1991, ApJ, 369, 490
Negueruela, I., Roche, P., Fabregat, J., Coe, M. J. 1999,MNRAS, 307, 695
Negueruela, I., & Okazaki, A. T., 2001, A&A, 369, 108Negueruela, I., Okazaki, A. T., Fabregat, J., Coe, M. J.,
Munari, U., Tomov, T. 2001, A&A, 369, 117Negueruela, I., & Coe, M. J., 2002, A&A, 385, 517Negueruela, I., Smith, D. M., Reig, P., Chaty, S., & Torrejn,
J. M., 2006, ESASP, 604, 165Negueruela, I. & Schurch, M. P. E., 2007, A&A, 461, 631Negueruela, I., Torrejon, J.M., Reig, P., Ribo, M., Smith,
D. M., 2008, AIPC, 1010, 252Nespoli, E.,2010, in Multiwavelength study of accretion-
powered pulsars, PhD dissertation thesis. University ofValencia (Spain).
Neto, T.V., & de Freitas Pacheco, S.J.C., 1982, MNRAS,198, 659
Okazaki A.T. 1991, PASJ 43, 7Okazaki A.T. 1996, PASJ, 48, 305Okazaki A.T. 1997, A&A, 318, 548Okazaki A.T. 2001, PASJ, 53, 119Okazaki, A.T., & Negueruela, I. 2001, A&A, 377, 161Okazaki, A. T., Bate, M. R., Ogilvie, G. I., & Pringle, J.
E., 2002, MNRAS, 337, 967Oktariani, F., & Okazaki, A.T., 2009, PASJ, 61, 57Owocki, S. P., Cranmer, S. R., & Gayley, K. G, 1996, ApJ,
472, L115Papaloizou, J.C., Savonije, G. J., Henrichs, H. F. 1992,
A&A, 265, L45Paredes, J.M., 2008, AIPC, 1085, 157Parkes, G. E., Murdin, P. G., & Mason, K. O., 1980, MN-
RAS, 190, 537Peters, G. J., Gies, D. R., Grundstrom, E. D., & McSwain,
M. V., 2008, ApJ, 686, 1280Pfahl, E., Rappaport, S., Podsiadlowski, P., Spruit, H. 2002,
ApJ, 574, 364Podsiadlowski, Ph., Rappaport, S., & Han, Z., 2003, MN-
RAS, 341, 385Porter, J.M., 1996, MNRAS, 280, L31Porter, J.M., 1997, A&A, 324, 597Porter, J. M. & Rivinius, T. 2003, PASP, 115, 1153Quirrenbach, A., Bjorkman, K. S., Bjorkman, J. E. 1997,
ApJ, 479, 477Raguzova, N. V., & Popov, S. B., 2005, A&AT, 24, 151Reig, P., Fabregat, J., Coe, M. J. 1997, A&A, 322, 193Reig, P. & Roche, P. 1999, MNRAS, 306, 100Reig, P., Negueruela, I., Coe, M. J. et al. 2000, MNRAS,
317, 205Reig, P., Negueruela, I., Buckley, D. A. H., Coe, M. J.,
Fabregat, J., Haigh, N. J. 2001, A&A, 367, 266Reig, P., Negueruela, I., Fabregat, J., Chato, R., Blay, P.,
& Mavromatakis, F., 2004, A&A, 421, 673Reig, P., Negueruela, I., Fabregat, J., Chato, R., Coe, M. J.
2005, A&A, 440, 1079Reig, P., Larionov, V., Negueruela, I., Arkharov, A. A.,
Kudryavtseva, N. A. 2007, A&A, 462, 1081Reig, P., 2007, MNRAS, 377, 867Reig, P., 2008, A&A, 489, 725
30
Reig, P., Torrejon, J.M., Negueruela, I., Blay, P., Ribo, M.Wilms, J. 2008, A&A, 2009, A&A, 494, 1073
Reig, P., S owikowska, A., Zezas, A., & Blay, P., 2010, MN-RAS, 401, 55
Reig, P., Zezas, A., & Gkoubelis, L., 2010, A&A, in pressRivinus, Th., Stefl, S., Maintz, M., Stahl, O. & Baade, D.,
2004, A&A, 427, 307Rivinus, Th., Stefl, S., & Baade, D., 2006, A&A, 459, 137Robinson, R. D., Smith, M. A., & Henry, G.W., 2002, ApJ,
575, 435Roche, P., Larionov, V., Tarasov, A. E. et al. 1997, A&A,
322, 139Romano, P., Sidoli, L., et al. 2010, arXiv1001.2439Romero, G.E., Torres, D.F., Kaufman Bernad, M.M., &
Mirabel, I.F., 2003, A&A, 410, L1Sasaki, M., Pietsch, W., & Haberl, F., 2003, A&A, 403, 901Savonije G.J. & Heemskerk M.H.M. 1993, A&A, 276, 409Schmidtke, P.C. & Cowly, A.P. 2006, ApJ, 132, 919Schurch, M.P.E., Coe, M.J., McGowan, K.E., McBride,
V.A., Buckley, D. et al. 2007, MNRAS, 381, 1561Silaj, J., Jones, C. E., Tycner, C., Sigut, T. A. A., & Smith,
A. D., 2010, ApJS, 187, 228Slettebak, A. 1982, ApJS, 50, 55Slettebak, A. 1988, PASP, 100, 770Smith, D. M., Heindl, W.A., Markwardt, C.A., et al. 2006,
ApJ, 638, 974Steele,I.A., Negueruela, I., & Clark, J.S., 1999, A&AS, 137,
147Stella, L., White, N. E., & Rosner, R., 1986, ApJ, 308, 669Stevens, J. B., Reig, P., Coe, M. J., et al. 1997, MNRAS,
288, 988Telting, J. H., Heemskerk, M. H. M., Henrichs, H. F., &
Savonije, G. J. 1994, A&A, 288, 558Torrejon, J. M., Negueruela, I., & Riquelme, M. S., 2007,
ASPC, 361, 503Torres, D., 2010, Proceedings of the 1st Sant Cugat
Forum on Astrophysics, ”ICREA Workshop on thehigh-energy emission from pulsars and their systems”,arXiv:1008.0483.
Townsend, R. H. D., Owocki, S. P., & Howarth, I. D., 2004,MNRAS, 350, 189
Tycner, C., Lester, J.B., Hajian, A.R., et al. 2005, ApJ, 624,359
van der Klis, M. 2006, in X-ray sources Binaries, eds.W.H.G. Lewin & J. van Paradijs, E.P.J. van den Heuvel,1995 Cambridge University Press, p.252
van der Klis, M. 2006, in Compact Stellar X-ray sources, eds.W.H.G. Lewin & M. van der Klis, Cambridge UniversityPress, p.39
Walter, R. & Zurita Heras, J. 2007, A&A, 476, 335Wang, Q, & Wu, X., 1992, ApJS, 78, 391Wang, W, 2009, A&A, arXiv0912.0337Waters, L.B.F.M., & van Kerkwijk, M.H., 1989, A&A, 223,
196Webster, B. L., 1974, MNRAS, 169, 53Williams, S.J., Gies, D.R., Matson, R.A., Touhami, Y.,
Grundstrom, E.D., Huang, W., & McSwain, M.W., 2010,arXiv:1009.4947
Wilson, C. A., Finger, M. H., & Camero-Arranz, A., 2008,ApJ, 678, 1263
Woolf, N. J., Stein, W. A., & Strittmatter, P. A. 1970, A&A,9, 252
Yokogawa, J., Imanishi, K., Tsujimoto, M., Koyama, K., &Nishiuchi, M., 2003, PASJ, 55, 161
Yudin, R.V., 2001, A&A, 368, 912Zamanov, R. K., Reig, P., Mart, J., Coe, M. J., Fabregat,
J., Tomov, N. A., & Valchev, T. 2001, A&A, 367, 884Zhang, F., Li, X.D., & Wang, Z.R. 2004a, ApJ, 603, 663Zhang, F., Li, X.D., & Wang, Z.R., 2004b, Chin. J. Astron.
Astrophy., 4, 320Zurita Heras, J. A., de Cesare, G., Walter, R., et al. 2006,
A&A, 448, 261
This manuscript was prepared with the AAS LATEX macros v5.2.