X-ray Bursts in Neutron Star and Black Hole Binaries from USA Data: Detections and Upper Limits
24
SLAC–PUB–9649 X-ray Bursts in Neutron Star and Black Hole Binaries from USA and RXTE Data: Detections and Upper Limits ∗ D. Tournear, E. Raffauf, E. D. Bloom, W. Focke, B. Giebels † , G. Godfrey, P. M. Saz Parkinson, K. T. Reilly Stanford Linear Accelerator Center, Stanford University, Stanford, CA 94309 K. S. Wood, P. S. Ray, M. T. Wolff, R. M. Bandyopadhyay ‡§ , M. N. Lovellette E. O. Hulburt Center for Space Research, Naval Research Laboratory, Washington, DC 20375 Abstract Narayan and Heyl (2002) have developed a theoretical framework to convert suitable upper limits on type I X-ray bursts from accreting black hole candidates (BHCs) into evidence for an event horizon. However, no appropriate observational limit exists in the literature. In this paper we survey 2101.2 ks of data from the Unconventional Stellar Aspect (USA) X-ray timing experiment and 5142 ks of data from the Rossi X-ray Timing Explorer (RXTE) experiment to obtain a formal constraint of this type. 1122 ks of neutron star data yield a population averaged mean burst rate of 1.69 × 10 −5 bursts s −1 while 6081 ks of BHC data yield a 95% confidence level upper limit of 4.9 × 10 −7 bursts s −1 . This is the first published limit of this type for Black Hole Candidates. Applying the theoretical framework of Narayan and Heyl (2002) we calculate regions of unstable luminosity where the neutron stars are expected to burst and the BHCs would be expected to burst if they had a surface. In this unstable luminosity region 464 ks of neutron ∗ Work at SLAC was supported by Department of Energy contract DE-AC 03-76-SFO0515. † Current address: Laboratoire Leprince-Ringuet, Ecole Polytechnique, Palaiseau F-91128 ‡ NRC/NRL Cooperative Research Associate § Current address: Department of Astrophysics, Oxford University June 2003 Revised
-
Upload
independent -
Category
Documents
-
view
0 -
download
0
Transcript of X-ray Bursts in Neutron Star and Black Hole Binaries from USA Data: Detections and Upper Limits

SLAC–PUB–9649
X-ray Bursts in Neutron Star and Black Hole Binaries from USAand RXTE Data: Detections and Upper Limits∗
D. Tournear, E. Raffauf, E. D. Bloom, W. Focke, B. Giebels†, G. Godfrey, P. M. SazParkinson, K. T. Reilly
Stanford Linear Accelerator Center, Stanford University, Stanford, CA 94309
K. S. Wood, P. S. Ray, M. T. Wolff, R. M. Bandyopadhyay‡§,M. N. Lovellette
E. O. Hulburt Center for Space Research, Naval Research Laboratory, Washington, DC
20375
Abstract
Narayan and Heyl (2002) have developed a theoretical framework to convert suitable upper
limits on type I X-ray bursts from accreting black hole candidates (BHCs) into evidence
for an event horizon. However, no appropriate observational limit exists in the literature.
In this paper we survey 2101.2 ks of data from the Unconventional Stellar Aspect (USA)
X-ray timing experiment and 5142 ks of data from the Rossi X-ray Timing Explorer (RXTE)
experiment to obtain a formal constraint of this type. 1122 ks of neutron star data yield a
population averaged mean burst rate of 1.69× 10⁻⁵ bursts s−1 while 6081 ks of BHC data
yield a 95% confidence level upper limit of 4.9× 10⁻⁷ bursts s−1. This is the first published
limit of this type for Black Hole Candidates.
Applying the theoretical framework of Narayan and Heyl (2002) we calculate regions of
unstable luminosity where the neutron stars are expected to burst and the BHCs would be
expected to burst if they had a surface. In this unstable luminosity region 464 ks of neutron
∗Work at SLAC was supported by Department of Energy contract DE-AC 03-76-SFO0515.
†Current address: Laboratoire Leprince-Ringuet, Ecole Polytechnique, Palaiseau F-91128
‡NRC/NRL Cooperative Research Associate
§Current address: Department of Astrophysics, Oxford University
June 2003
Revised
– 2 –
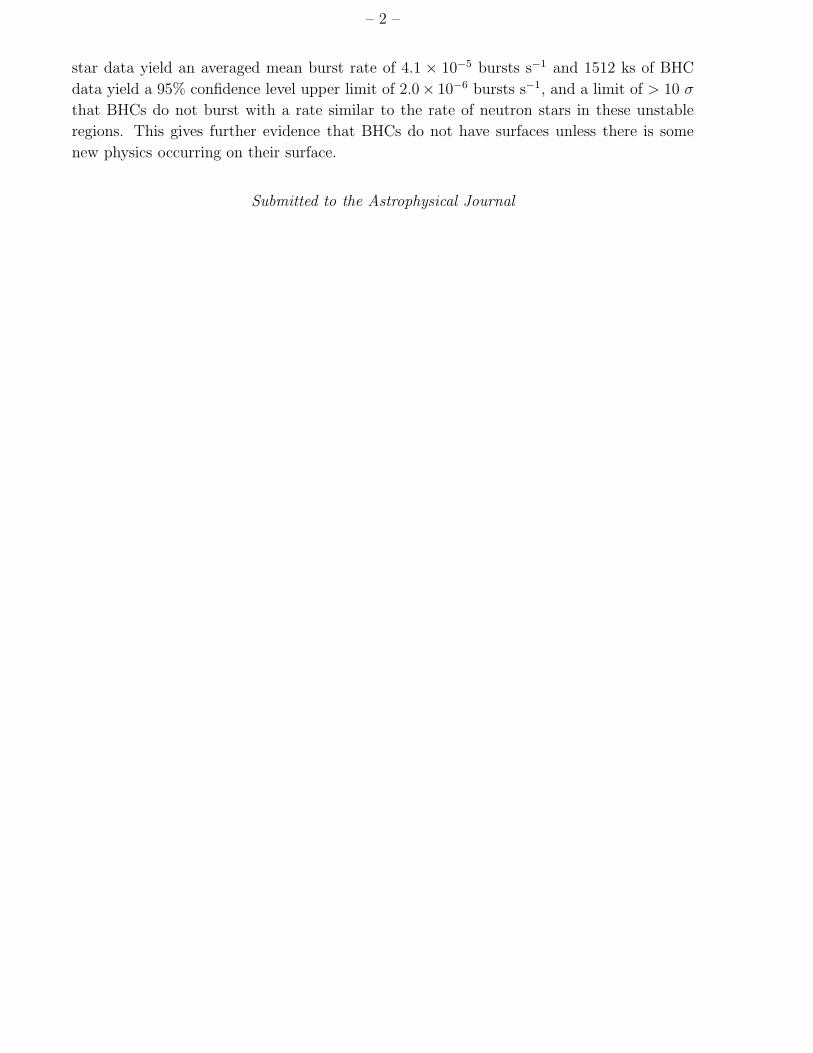
star data yield an averaged mean burst rate of 4.1 × 10⁻⁵ bursts s−1 and 1512 ks of BHC
data yield a 95% confidence level upper limit of 2.0× 10⁻⁶ bursts s−1, and a limit of > 10 σ
that BHCs do not burst with a rate similar to the rate of neutron stars in these unstable
regions. This gives further evidence that BHCs do not have surfaces unless there is some
new physics occurring on their surface.
Submitted to the Astrophysical Journal

1. Introduction
In the nuclear burning model for X-ray bursts, a well-defined surface must exist for a
type I X-ray burst to occur. Narayan & Heyl (2002) (hereafter NH02) performed a stability
analysis of accumulating fuel on the surface of a generic compact object and showed that
if Black Hole Candidates (BHCs) had surfaces, they would be expected to exhibit X-ray
bursts. For this reason the lack of type I X-ray bursts in BHCs in stellar systems can be
considered as evidence for an event horizon.
BHCs are typically distinguished from neutron stars using one of three methods. The
primary method is direct dynamical measurements of their companions yielding masses for
the compact objects that are � 3M�, where a stable equation of state for a neutron stardoes not exist. The second method is that if timing and spectral analysis of the radiation
from the accretion onto the compact object resembles other known BHCs the compact object
is usually classified as a BHC. This typically means very little power above ∼500 Hz in aFourier power density spectrum (Sunyaev & Revnivtsev 2000) and an energy spectrum that
cannot be explained by a low temperature blackbody with an emission radius of ∼10 km(Rutledge et al. 2000). Thirdly, if an object exhibits type I burst behavior it is assumed to
be a neutron star as this is strong evidence for the presence of a surface. This is the case
for the compact object in GS 1826-238, which was first classified as a BHC based on timing
and spectral behavior. It was only reclassified as a neutron star when type I X-ray bursts
were detected (Ubertini et al. 1999).
Unstable thermonuclear burning on the surface of a weakly magnetized neutron star
is the generally accepted model for type I X-ray bursts. Material accretes onto the surface
until it reaches densities and temperatures sufficient for nuclear ignition. For some accretion
rates, the burning is unstable and propagates around the star consuming all of the available
fuel, resulting in an X-ray burst. This type of X-ray burst is characterized by a fast rise time
of a few seconds and a decay time longer than a few seconds (up to several minutes). See
Strohmayer & Bildsten (2003), Hansen & van Horn (1975), Lewin et al. (1995), Paczynski
(1983), and Bildsten (2000) for a more detailed description. The type I X-ray bursts discussed
in this paper are different from the X-ray superbursts recently discovered (e.g. Kuulkers et al.
2002). Type I X-ray bursts occur when helium on the surface of a neutron star ignites via
the triple-alpha process forming carbon and oxygen. These bursts last ∼ a few seconds –
100s of seconds. Superbursts likely occur due to nuclear burning of carbon or by some other
nuclear processes and last for several hours (see Cumming & Bildsten 2001 and Strohmayer
& Brown 2002 for a review).
In this paper we present observations of neutron star LMXBs and BHCs from the
USA Experiment as observational support for the work of NH02. We survey both neutron
star and BHC systems for X-ray bursts and calculate burst rates for neutron stars and
3
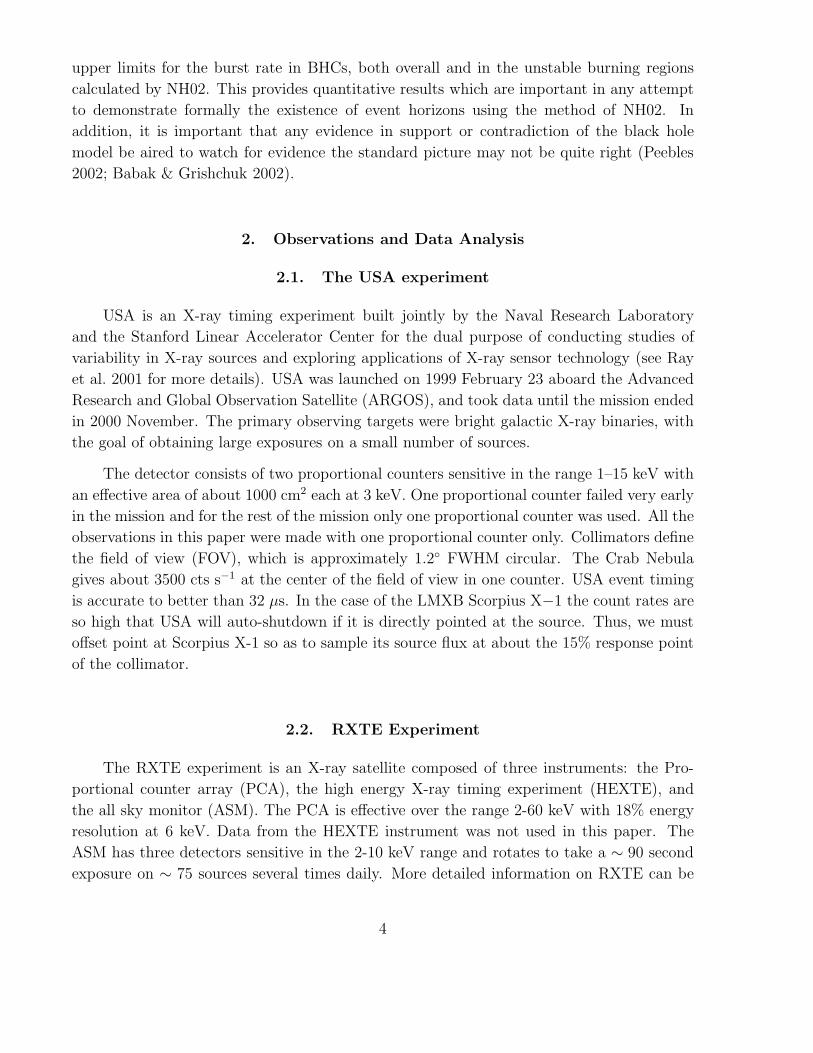
upper limits for the burst rate in BHCs, both overall and in the unstable burning regions
calculated by NH02. This provides quantitative results which are important in any attempt
to demonstrate formally the existence of event horizons using the method of NH02. In
addition, it is important that any evidence in support or contradiction of the black hole
model be aired to watch for evidence the standard picture may not be quite right (Peebles
2002; Babak & Grishchuk 2002).
2. Observations and Data Analysis
2.1. The USA experiment
USA is an X-ray timing experiment built jointly by the Naval Research Laboratory
and the Stanford Linear Accelerator Center for the dual purpose of conducting studies of
variability in X-ray sources and exploring applications of X-ray sensor technology (see Ray
et al. 2001 for more details). USA was launched on 1999 February 23 aboard the Advanced
Research and Global Observation Satellite (ARGOS), and took data until the mission ended
in 2000 November. The primary observing targets were bright galactic X-ray binaries, with
the goal of obtaining large exposures on a small number of sources.
The detector consists of two proportional counters sensitive in the range 1–15 keV with
an effective area of about 1000 cm2 each at 3 keV. One proportional counter failed very early
in the mission and for the rest of the mission only one proportional counter was used. All the
observations in this paper were made with one proportional counter only. Collimators define
the field of view (FOV), which is approximately 1.2◦ FWHM circular. The Crab Nebula
gives about 3500 cts s−1 at the center of the field of view in one counter. USA event timing
is accurate to better than 32 µs. In the case of the LMXB Scorpius X−1 the count rates areso high that USA will auto-shutdown if it is directly pointed at the source. Thus, we must
offset point at Scorpius X-1 so as to sample its source flux at about the 15% response point
of the collimator.
2.2. RXTE Experiment
The RXTE experiment is an X-ray satellite composed of three instruments: the Pro-
portional counter array (PCA), the high energy X-ray timing experiment (HEXTE), and
the all sky monitor (ASM). The PCA is effective over the range 2-60 keV with 18% energy
resolution at 6 keV. Data from the HEXTE instrument was not used in this paper. The
ASM has three detectors sensitive in the 2-10 keV range and rotates to take a ∼ 90 secondexposure on ∼ 75 sources several times daily. More detailed information on RXTE can be
4

found in Jahoda et al. (1996).
2.3. Data Analysis
All binary sources with more than 30 ks of exposure time with the USA detector were
scanned for bursts, including seven BHCs and seventeen neutron stars. The data analyzed
were selected based on low background counting rate and a small ≤ 0.5◦ pointing offset.The selection criteria result in less than 30 ks of analyzed data on some sources. The list of
selected data analyzed in this paper is shown in Table 1. The columns are the source name,
total time of good data analyzed, distance and mass of the source, classification of the source
(BHC) Black Hole Candidate, Neutron Star (NS) and if a subdivision of Z or Atoll is clear.
Additional information on the sources can be found in the references given. To supplement
the USA BHC data, the RXTE public BHC data was analyzed for each USA BHC source
analyzed in this paper, all public data for these sources as of April 2003, were analyzed.
2.3.1. Source Categorization Criteria
Because we are testing for the presence of bursts on objects purported to be black holes
the classification criteria used must be crafted to avoid selection effects. Most importantly,
the sources must not be classified based on the presence or absence of type I bursts. We
have thus categorized our sources into neutron stars or black holes as follows.
Black Hole Candidates Each of the BHCs, with the exception of 4U 1630−472, havea known mass function or other mass estimate that give a lower mass limit of the compact
object that exceed current theoretical limits for neutron stars. Since 4U 1630−472 does nothave a mass limit requiring it to be a BHC, the data from this source is not used in calculating
any of the bursting rates or bursting rate limits used later in this paper. Cygnus X-3 also
has a debateable compact object. Cygnus X-3 has a mass function of 2.3M� (Schmutz et al.1996) which does not rule out the possibility that the compact object is a neutron star.
Therefore, the data of Cygnus X-3 is not used in calculating any burst rates or limits quoted
in this paper. These two sources are included in Table 1 for completeness, to let the curious
reader know that we did search the data of these sources and no X-ray bursts were detected.
Neutron Stars The following neutron stars were classified as such based on the presence
of kilohertz Quasi-Periodic Oscillations (QPOs): Cygnus X-2, Aquila X-1, EXO 0748−676,GX 354−0 (4U 1728-34), 4U 0614+09, GX 349+2, Scorpius X-1, 4U 1735−445, X1636−536,GX 5-1, GX 340+0, and GX 17+2. The generally accepted view is that these kHz QPOs
5

represent in some way an orbital frequency around the compact object. The frequency of an
orbit around a compact object is:
νorb =
(GM
4π2r3orb
)1/2
≈ 1200 Hz( rorb
15 km
)−3/2
M1/21.4 (1)
where, M1.4 is the mass of the compact object in units of 1.4M�. From general relativity,
no stable orbital motion is possible within the Innermost Stable Circular Orbit (ISCO).
RISCO = 6GM/c2 ≈ 12.5M1.4 km. At this orbit, the the frequency is νISCO ≈ (1580/M1.4)
Hz (van der Klis 2000). From this, one can see that an object too massive to exist as
a neutron star, M � 3M�, can not demonstrate QPOs in the kHz range. For a list ofknown sources demonstrating kilohertz QPOs and a review of millisecond oscillations in
X-ray binaries see van der Klis (2000).
The Rapid Burster is classified as a neutron star based on the presence of excess power
in the kHz range during it’s type II X-ray bursts as reported in Guerriero et al. (1997). The
presence of significant noise above 500 Hz in an X-ray Power Density Spectrum (PDS) gives
evidence for a neutron star according to Sunyaev & Revnivtsev (2000). In addition, spectral
work from Chandra data gives evidence of a radius ∼ 10 km for this source by looking at thetype II X-ray bursts (Marshall et al. 2001), giving further evidence that this source should
be classified as a neutron star.
The sources XB 1254-690 and Circinus X-1 do not have strong enough evidence to
support that they are neutron stars independent of the past observed Type I X-ray bursts.
Therefore, these sources will be included in Table 1 for completeness, but will not be included
in any bursting rate or bursting rate limit calculations.
2.3.2. Detecting Bursts
The data were searched for bursts by visually inspecting the light curves, binned in 1
second intervals for USA data and 1/8 second intervals for RXTE data, of each observation
several times. The visual scan looked for events that displayed properties consistent with
type I X-ray bursts: large changes in flux with Fast Rise Exponential Decay (FRED) profiles,
rise times of a few seconds, and decay times of several seconds or more. At the flux levels
of all of the sources included in this work, this method will easily detect all type I X-ray
bursts. Even if a burst in a BHC occurred with an order of magnitude less luminosity, as
would be expected due to general relativistic effects see (Abramowicz et al. 2002), we expect
to have detected them visually. Figure 1 shows an example of a typical type I X-ray burst
found by USA in 4U 1735− 445. We did not search the USA data archive for superbursts.The longest continuous observation by USA was 20 minutes, with no less than 90 minutes
between observations of the same source, making a burst spanning several hours difficult to
6

detect. Unless specified, the term “X-ray burst” used in this paper refers to type I X-ray
bursts.
2.4. Observations of Neutron Star Systems
Of the seventeen neutron stars that we studied (see Table 1), seven were observed to
have type I X-ray bursts. These are: Aquila X-1, EXO 0748−676, GX 354−0, the RapidBurster, 4U 1735−445 , GX 3+1, and MXB 1659−298. The Rapid Burster and GX 354−0are separated in the sky by only 0.54◦. Thus, they will be in the USA FOV at the sametime making it possible to mistake a burst in one source for a burst in the other source,
albeit attenuated by a factor of 0.53. For this reason, the data for these two sources were
double counted in our analysis, meaning that an observation pointed at either source was
considered to be a simultaneous observation of both sources. Therefore, the total observing
time of these two sources will be twice the sum of the respective pointed observations. In
theory, one may distinguish the Rapid Burster type I X-ray bursts from the GX 354−0 X-raybursts. The GX 354−0 bursts nearly always show radius expansion and are much brighterthan the Rapid Burster type I X-ray bursts (Kuulkers 2003; Fox 2003). In addition, the
GX 354−0 bursts may display a harder spectrum than the Rapid Burster bursts (Fox et al.
2001; Fox 2003). However, we were not able to see definite evidence for radius expansion in
the energy spectra of any of these bursts, and we were not able to distinguish two groups
of bursts by any energy or timing analysis of the bursts from these sources, this may be
due to the energy resolution of the USA experiment. The intensity difference can not be
used to distinguish these sources since a collimator effect would disguise the burst intensity.
Therefore, since the Rapid Burster and GX 354−0 are both known to display type I X-raybursts regularly (Lewin et al. 1995; Fox et al. 2001), we can not distinguish the bursts from
these two sources.
Several type I X-ray bursts were observed in the vicinity of the Rapid Burster in addition
to the hundreds of type II bursts that occur continuously in this source when it is in a
bursting state. We distinguished the type II bursts in this source from the type I bursts
by their regular, “rapid-fire”, intervals. Spectral differences can be used to give a more
definite distinction between the types of X-ray bursts. Type I X-ray bursts always have
cooling blackbody spectra. Type II X-ray bursts do not show softening throughout the
burst characteristic of a cooling blackbody. See Guerriero et al. (1999); Lewin et al. (1993)
for more information on the Rapid Burster and type II X-ray bursts. Table 2 gives a list of
bursts found in each source in our survey.
We did not detect bursts in ten of the seventeen neutron stars in our data: Cygnus
X-2, Circinus X-1, 4U 0614+09, GX 349+2, XB 1254−690, Scorpius X-1, X1636−536, GX
7

5−1, GX 340+0, GX 17+2. Type I X-ray bursts have been detected in the past for eachof these neutron star systems observed except for GX 349+2, Scorpius X-1, GX 5−1, andGX 340+0. Using the data from all seventeen neutron stars, we calculate an overall neutron
star bursting rate λNS = 1.69 × 10⁻⁵ bursts s−1. This results in an observed average time
between bursts in our data, RNS = 59.1 ks, about 16.5 hours, from 1122 ks of data (double
counting the GX 354−0 and Rapid Burster data).
2.5. Observations of Black Hole Candidates
Seven BHCs were searched for bursts: Cygnus X-1, XTE J1118+480, GRS 1915+105,
XTE J1859+226, XTE J1550−564, 4U 1630−472, and Cygnus X-3. The total USA observ-ing time for all of these BHCs is 1022 ks, the total observing time for RXTE is 5477 ks. No
evidence of bursts was detected. Data from 4U 1630−472 and Cygnus X-3 were not used inany burst limit calculations. GRS 1915+105 showed several flares during the USA observa-
tions, close examination showed no distinct FRED profiles in these flares that would signal
a type I X-ray burst. The USA observations were scheduled for repeated sampling to obtain
many short observations over a long time period. The RXTE Target of Opportunity (TOO)
observations repeatedly sampled transient sources during outbursts. As applied to transients
this is particularly effective for the sources studied here: bursting may not occur in all ranges
of mass accretion rate but the USA and RXTE observations sampled this critical parameter
over the maximum extent possible. If BHCs burst in a narrow range of mass accretion rate,
we are likely to have sampled that range. The USA experiment was fortunate that over its
lifetime it was able to observe a number of very important transients, including systems with
the largest known physical dimensions (GRS 1915+105) and the smallest (XTE J1118+480).
USA and RXTE also devoted substantial time to Cygnus X-1 and GRS 1915+105, so that
there was ample opportunity for any rare modes of bursting to be present in our observation
of these sources.
Type I X-ray bursts are not a Poisson process. The time between bursts is a function
of how long it takes to accumulate fuel to reach a critical density and temperature where
unstable nuclear burning can occur. Burst intervals have been observed to be regular and
irregular, and range from ∼ 5 min to days or longer (Lewin et al. 1995), and are dependenton the accretion composition and rate (Strohmayer & Brown 2002). However, since our
observation times were short compared to typical burst intervals and the revisit times were
hours or longer, we are unlikely to observe consecutive bursts. Therefore, we treat these
observations using Poisson statistics in order to place a numerical limit on the bursting rate.
The probability of observing n events of a Poisson process is:
P (n) = (λT )ne−λT
n!(2)
8
where: λ is the rate of bursts (bursts s−1) and T is the total observing time. We will also
define R = 1/λ the average time between bursts. To set a limit on the burst rate to a
confidence level of CL = 95% we calculate from eq. 2 for n = 0:
λ = − ln (1− CL)
T(3)
where P = 1−CL. For the values given, we calculate the upper limit of λBHC = 4.9× 10⁻⁷
bursts s−1 with a 95% confidence level. This is the first published survey to place quantitative
limits on the rate of occurrence of bursts in a wide range of BHCs with a significant amount
of data. As discussed in (Knight 2003) limits of these type emphasizing searches and null
results are important to promulgate to the rest of the scientific community.
3. Discussion
In this section we discuss these observations in the context of the theoretical work of
NH02. We start by converting our results to a format which allows easy comparison with
theoretical predictions. Next, we show that our data in conjunction with the stability analysis
of NH02, can place a probablity-limit on the existence of a surface on a BHC. Finally, we
check our neutron star results for consistency with the NH02 analysis.
3.1. Luminosity Calculation
From the 17 neutron stars analyzed we calculate a bursting rate of λNS = 1.69 ×10⁻⁵ bursts s−1. This is comparable to rates found by other observers (see Strohmayer
& Bildsten 2003). NH02 predict that the occurrence of Type I X-ray bursts is a strong
function of log(
LLEdd
), where LEdd is the Eddington luminosity of the source, LEdd = 1.3×
1038M ergs s−1 (For H rich material) andM is the mass of the compact object in M�. NH02
show that for certain values of log(
LLEdd
)there can be stable burning and for other values
there will be unstable burning leading to type I X-ray bursts. The exact ranges of L for
stable accretion depend on the surface temperature of the compact object and its radius.
For neutron stars, assuming a temperature at the base of the accretion layer of 108 K, the
region of instability lies between −1.5 � log(
LLEdd
)� −0.5.
For each of the sources analyzed, we made a light curve in units of log(
LLEdd
)for each
observation. We then looked at the fraction of time sources were in the range of L where
NH02 predict bursts should occur. In order to calculate the luminosity of the source, we
fit a spectrum to a typical observation of the source using XSPEC (Dorman & Arnaud
2001). If distinct states in the source were evident from the source’s hardness ratio, then
9
observations from these states were fit separately. Most sources were fit using the Bulk
Motion Comptonization (BMC) (Titarchuk et al. 1997) model in XSPEC with absorption
and iron emission lines as needed. The BMC was the best fitting model to most of our data.
After fitting a model to the data we obtained the model flux in the 0.2 − 30.0 keV band.Since we know the USA count rate of the source for this flux, we are able to calculate a
conversion factor from USA rate to source flux.
1 USA cts s−1 ≈ C × 10−12ergs cm−2 s−1 (4)
Where C is the measured conversion factor. C is between 7 − 12 for most sources. Thismethod yields a flux of 2.9×10⁻⁸ergs cm−2 s−1 for the Crab Nebula in the 2−10 keV band,which is within 5% of the accepted value of 2.8× 10⁻⁸ergs cm−2 s−1. Based on this result,
we believe the value of C to be correct in our observations at the 10% level. Utilizing this
conversion and assuming isotropic radiation we find:
log
(L
LEdd
)= log
((USA rate)(C × 10−12)(4πd2)
1.3× 1038M
)(5)
where d is the distance to the source in cm and M is the mass of the compact object in
M�. For the RXTE BHC data, a conversion factor was calculated to match the count
rate per PCU in the PCA standard one data to the count rate seen by USA in the same
source for an observation during the same day. The average count rate per observation was
used to calculate this conversion. This conversion was calculated for each source to account
for different detector response between the two experiments. After the RXTE data was
converted to USA rate then the log(
LLEdd
)was calculated following the method above.
Figures 2 and 3 give the resulting values of log(
LLEdd
)for the BHC data and neutron
star data analyzed in this paper. Figure 3 also shows the distribution of where we observed
bursts in the data.
3.1.1. Luminosity Uncertainties
In order to estimate the uncertainty in the amount of data that falls within the bursting
region we use eq. 5 to calculate an uncertainty in log(
LLEdd
)for each source and use this
uncertainty with Monte Carlo techniques . The distance and the mass contribute the largest
systematic uncertainties to log(
LLEdd
). The distances and masses used and the errors are
given in Table 1. Uncertainties in L are estimated using error estimates on the mass ∼ 20%,if a definite uncertainty is not quoted in Table 1, and the distance ∼ 20%, if a definite
uncertainty is not quoted in Table 1. We assume an uncertainty in C of 10%, based on
10

estimates of the Crab luminosity, and assume the uncertainty in USA rate is negligible for
all sources except GX 354−0 and the Rapid Burster. For these two sources the counting rateof one was contaminated with counts from the other as discussed in §2.4. We were able todeconvolve the two sources since we know the total USA counting rate while pointed at each
source and we know the factor of contamination from the source off axis. For observations
where one of these two sources was directly observed and the other was not directly observed
within a few days, the RXTE ASM counting rate was used to estimate the rate of the off axis
source. To do this, the ASM rate was converted to USA rate using 72 ASM counts s−1 as
one Crab, and 3500 USA counts s−1 as one Crab. Therefore, for the Rapid Burster and GX
354−0, an error on the USA rate of 20% was used to calculate the errors on luminosity. Thisaccounts for changes in counting rate of the off axis source between observations, and/or
errors in the ASM counting rate. For each observation, a Gaussian deviate was calculated
with the same mean as the measured value of log(
LLEdd
)and a σ equal to the uncertainty
value calculated for that source. Then the fraction of this simulated data in the bursting
region was measured. We performed 10, 000 iterations in this manner and calculated the
distribution of the fraction of data in the bursting region. We found that the distribution of
the amount of data within the bursting region was rather tight, even though the individual
errors on log(
LLEdd
)were large. We found that, to a confidence level of 99.5%, 25% of our
BHC data and 42% of our neutron star data fall within the region where one would expect
bursts according to Narayan & Heyl (2002). Our analysis assumed that each of the sources
analyzed were accreting Hydrogen rich material. If the accreted material has a large fraction
of Helium, as do some bursters, then this will increase the value of LEdd.
3.2. BHC Surface Limit
Narayan & Heyl (2002), calculated what would occur in a 10M� object if it were assumedto have a surface similar to that of a neutron star, and showed that the rate of bursts should
be comparable to the rate in neutron stars. However, they find different regions of L where
bursts should occur. For a 10M� object with a surface and a base temperature of 107 K, the
regions where they expect to see bursts are approximately: −2 ≤ log(
LLEdd
)� −1.5 and
−1 � log(
LLEdd
)� 0. For the BHC data analyzed, at least 25% (1512 ks) of the data fall
within this range to a confidence level of 99.5% using Monte Carlo estimates of uncertainty
described above. Figure 2 shows the distribution of the observations analyzed in this paper
in the units log(
LLEdd
).
Considering only the neutron star data that fall in the luminosity range corresponding
to unstable nuclear burning, we find that the 19 bursts occurred in 464 ks of data. This
11

464 ks value is the 99.5% confidence level on the amount of data within the bursting region
based on the Monte Carlo techniques described above, thus accounting for uncertainties in
the value of log(
LLEdd
).
Using these data, we calculate the rate of bursting of neutron stars in the unstable
region λNS = 4.1 × 10⁻⁵ bursts s−1, RNS = 24.4 ks or ∼ 7 hours. Taking the Narayan &
Heyl (2002) prediction for the rate of bursting in a BHC having a surface should be similar
to that of a neutron star provided both are within regions of unstable L, we can calculate
the probability of seeing no burst in our BHC data. From eq. 2, the probability of observing
zero bursts in BHCs, if they exist with a rate similar to the rate observed in neutron stars,
is e−λNST = 1× 10⁻²⁷, where T , the amount of BHC data residing in the unstable region, is
1512 ks. Analyzing the data this way suggests that BHC do not have a surface as described
by Narayan & Heyl (2002) to a confidence level of > 10 σ. The limits and measured X-ray
bursting rates can be found in Table 3. The columns are the bursting rate or limit calculated
using all data analyzed, and then the bursting rate or limit calculated using only the data
whose luminosity is within the bursting range calculated by NH02. This is the first such
quantitative observational limit placed that quantifies what the lack of bursts means to the
BHC theories.
One should point out that this is not definitive proof of the existence of black holes.
Other authors have pointed out that there are other states of matter that may exist in
these massive compact objects that do not show X-ray bursts but also do not possess event
horizons. See Abramowicz et al. (2002) for several arguments along these lines. The authors
in Abramowicz et al. (2002) outline arguments that the accreted material could immediately
be converted to some exotic form that would not show X-ray bursts (Alford et al. 1998;
Rapp et al. 1998). In addition, the argument is made that gravastars, if they exist, (Mottola
& Mazur 2002) would be observational indistinguishable from black holes even though a
gravastar exists without an event horizon or a singularity.
3.3. Neutron Star Observations Compared to Theory
In order to test the validity of the Narayan & Heyl (2002) predictions, we compare the
occurrence of the type I X-ray bursts in neutron stars to the predicted occurrence calculated
in Narayan & Heyl (2002). Specifically, after accounting for errors in measuring LLEdd
, we
see no evidence that any of the observed neutron star bursts occurred when the source was
not in the region of unstable burning where bursts would be expected. We investigated the
neutron stars in which bursts were not observed, to determine if we expected to see bursts
based on the theory put forth in Narayan & Heyl (2002). Of the neutron stars analyzed
where we did not see bursts, we acquired 60 ks of data on GX 349+2 when it was in the
12
region of luminosity where one would expect bursts. This is the largest amount of individual
neutron star data in the bursting region in which we did not detect any bursts. Again, using
Poisson statistics and assuming a bursting rate of λNS = 4.1 × 10⁻⁵ bursts s−1 calculated
above, we find that we have a ∼ 10% chance of not seeing a burst in this source. Therefore,there is some reason to believe there is room to examine the boundaries of the bursting
region predicting where the bursts will occur. However, it is worth noting that the USA
data of X-ray binaries Scorpius X-1 and GX 349+2 are in the bursting region 43% and 74%
of the time respectively (99.5% confidence level). In fact, one could use the fact that these
are neutron stars that have never been observed to burst to place limits on the distances
to these sources. Assuming a mass of 1.4M�, GX 349+2 must not reside between 5.9+0.6−0.5 –
9.7+1.0−0.8 kpc and Scorpius X-1 must not reside between2.5
+0.6−0.4 – 4.1
+1.1−0.6 kpc. The errors are
based on 1 σ deviations in the observed rate from these sources. Previous distance estimates
for GX 349+2 place it around the galactic center 5–8.5 kpc (Christian & Swank 1997; Cooke
& Ponman 1991), and estimates place Scorpius X-1 at 2.8±0.3 kpc (Geldzahler et al. 1999).Both of these estimates place these sources at the edge of our excluded region. The other two
neutron star systems that we analyzed and have never been observed to burst, GX 340+0
and GX 5− 1 only spend < 15% and < 2% of their time in the bursting region. Therefore,
it is likely that these sources are neutron stars that rarely, if ever, burst.
4. Conclusions
We present the burst catalog of the USA experiment X-ray binary data, and calculate
limits on the rate of X-ray bursts in BHCs. We detected nineteen type I X-ray bursts in
seven neutron stars. From our neutron star data we conclude that the average time between
bursts in neutron stars is 59.1 ks, λNS = 1.69 × 10⁻⁵ bursts s−1. The BHC data scanned
showed no evidence for bursts. Therefore, we place a 95% confidence limit on the burst rate
in BHCs to be ≤ 4.9 × 10⁻⁷ bursts s−1 or R ≥ 470 ks between bursts, based on USA and
RXTE BHC data. The value of this upper limit is that it is at a level that is not easily
pushed lower. This is because most BHCs are transients that, with some exceptions, last
less than a few Megaseconds. The few BHCs that are relatively steady (primarily Cygnus
X-1 but arguably GX 339−4 and GRS 1915−105) do not have more than a few tens of
Megaseconds of observation. Thus, 10−6 − 10−7 bursts s−1 is a rough order of magnitude for
the attainable limit. A sensitive all sky monitor might eventually reach a slightly lower value.
Applying the theoretical framework of Narayan & Heyl (2002), who claim that if BHCs
have surfaces they will burst as prolifically as neutron stars if both are in a regime of unstable
nuclear burning, we find that the BHCs in this regime do not burst with the same or higher
rate as neutron stars to a confidence level of > 10 σ based on our limits. Therefore, these
13
observations, analyzed according to the theory proposed by Narayan & Heyl (2002) leads us
to believe that BHCs do not have a surface, as described in NH02, to a very high confidence
level.
Work at SLAC was supported by Department of Energy contract DE-AC 03-76-SFO0515.
Basic research in X-ray astronomy at the Naval Research Laboratory is supported by ONR/NRL.
This work was also supported by the NASA Applied Information Systems Research Program.
The authors would also like to thank Dr. Erik Kullkers, Dr. Lev Titarchuk, Dr. Jean-Pierre
Lasota and the anonymous referee for useful comments.
REFERENCES
Abramowicz, M. A., Kluzniak, W., & Lasota, J.-P. 2002, A&A, 396, L31
Alford, M., Rajagopal, K., & Wilczek, F. 1998, Physics Letters B, 422, 247
Augusteijn, T., Kuulkers, E., & van Kerkwijk, M. H. 2001, A&A, 375, 447
Babak, S. V., & Grishchuk, L. P. 2002, gr-qc/0209006
Bildsten, L. 2000, in Rossi2000: Astrophysics with the Rossi X-ray Timing Explorer. March
22-24, 2000 at NASA’s Goddard Space Flight Center, Greenbelt, MD USA, p.E65
Brandt, S., Castro-Tirado, A. J., Lund, N., Dremin, V., Lapshov, I., & Syunyaev, R. 1992,
A&A, 262, L15
Christian, D. J., & Swank, J. H. 1997, ApJS, 109, 177
Cooke, B. A., & Ponman, T. J. 1991, A&A, 244, 358
Cumming, A., & Bildsten, L. 2001, ApJ, 559, L127
Dorman, B., & Arnaud, K. A. 2001, in ASP Conf. Ser. 238: Astronomical Data Analysis
Software and Systems X, Vol. 10, 415
Filippenko, A. V., & Chornock, R. 2001, IAU Circ., 7644, 2
Fox, D. D. 2003, Personal Communication
Fox, D. W., et al. 2001, MNRAS, 321, 776
Galloway, D. K., Psaltis, D., Chakrabarty, D., & Muno, M. 2003, ApJ, in press, astro-
ph/0208464
14

Geldzahler, B. J., Fomalont, E. B., & Bradshaw, C. F. 1999, Bulletin of the American
Astronomical Society, 31, 897
Greiner, J., Cuby, J. G., & McCaughrean, M. J. 2001, Nature, 414, 522
Guerriero, R., et al. 1997, American Astronomical Society Meeting, 191, 0
Guerriero, R., et al. 1999, MNRAS, 307, 179
Hansen, C. J., & van Horn, H. M. 1975, ApJ, 195, 735
Herrero, A., Kudritzki, R. P., Gabler, R., Vilchez, J. M., & Gabler, A. 1995, A&A, 297, 556
Iaria, R., Di Salvo, T., Burderi, L., & Robba, N. R. 2001, ApJ, 548, 883
Jahoda, K., Swank, J. H., Giles, A. B., Stark, M. J., Strohmayer, T., Zhang, W., & Morgan,
E. H. 1996, in Proc. SPIE, ed. O. H. Siegmund & M. A. Gummin, Vol. 2808, 59
Knight, J. 2003, Nature, 422, 554
Kuulkers, D. E. 2003, Personal Communication
Kuulkers, E., et al. 2002, A&A, 382, 503
Kuulkers, E., & van der Klis, M. 2000, A&A, 356, L45
Lewin, W. H. G., van Paradijs, J., & Taam, R. E. 1993, Space Science Reviews, 62
Lewin, W. H. G., van Paradijs, J., & Taam, R. E. 1995, in X-ray Binaries, ed. W. H. G.
Lewin, J. van Paradijs, & E. P. J. van den Heuvel (Cambridge University)
Marshall, H. L., et al. 2001, AJ, 122, 21
McClintock, J. E., et al. 2001, ApJ, 555, 477
Meyer-Hofmeister, E., & Meyer, F. 2001, A&A, 372, 508
Mignani, R. P., De Luca, A., Caraveo, P. A., & Mirabel, I. F. 2002, A&A, 386, 487
Mottola, E., & Mazur, P. O. 2002, in American Physical Society, April Meeting, Jointly
Sponsored with the High Energy Astrophysics Division (HEAD) of the American As-
tronomical Society April 20 - 23, 2002 Albuquerque Convention Center Albuquerque,
New Mexico Meeting ID: APR02, abstract #I12.011, 12011
Narayan, R., & Heyl, J. S. 2002, ApJ, 574, L139
O’Neill, P. M., Kuulkers, E., Sood, R. K., & van der Klis, M. 2002, MNRAS, 336, 217
15

Orosz, J. A., et al. 2002, ApJ, 568, 845
Orosz, J. A., & Kuulkers, E. 1999, MNRAS, 305, 132
Paczynski, B. 1983, ApJ, 264, 282
Peebles, P. J. E. 2002, astro-ph/0209403
Rapp, R., Schafer, T., Shuryak, E., & Velkovsky, M. 1998, Physical Review Letters, 81, 53
Ray, P. S., et al. 2001, in AIP Conference Proceedings, Vol. 599, X-ray Astronomy 1999 –
Stellar Endpoints, AGN, and the Diffuse Background, ed. G. Malaguti, G. Palumbo,
& N. White (Melville, New York: AIP), 336
Rutledge, R. E., Bildsten, L., Brown, E. F., Pavlov, G. G., & Zavlin, V. E. 2000, ApJ, 529,
985
Rutledge, R. E., Bildsten, L., Brown, E. F., Pavlov, G. G., & Zavlin, V. E. 2001, ApJ, 559,
1054
Saz Parkinson, P. M. 2003, Ph.D. thesis, Stanford Universtiy, In Press
Schmutz, W., Geballe, T. R., & Schild, H. 1996, A&A, 311, L25
Seon, K., Min, K., Yoshida, K., Makino, F., Lewin, W. H. G., van der Klis, M., & van
Paradijs, J. 1997, ApJ, 479, 398
Shahbaz, T., & Kuulkers, E. 1998, MNRAS, 295, L1
Singh, N. S., Naik, S., Paul, B., Agrawal, P. C., Rao, A. R., & Singh, K. Y. 2002, A&A,
392, 161
Strohmayer, T., & Bildsten, L. 2003, in Compact Stellar X-ray Sources, ed. W. H. G. Lewin
& M. van der Klis (Cambridge University Press), in press astro-ph/0301544
Strohmayer, T. E., & Brown, E. F. 2002, ApJ, 566, 1045
Sunyaev, R., & Revnivtsev, M. 2000, A&A, 358, 617
Titarchuk, L., Mastichiadis, A., & Kylafis, N. D. 1997, ApJ, 487, 834
Titarchuk, L., & Shaposhnikov, N. 2002, ApJ, 570, L25
Ubertini, P., Bazzano, A., Cocchi, M., Natalucci, L., Heise, J., Muller, J. M., & in ’t Zand,
J. J. M. 1999, ApJ, 514, L27
van der Klis, M. 2000, ARA&A, 38, 717
16
van Paradijs, J., & White, N. 1995, ApJ, 447, L33
Wagner, R. M., Foltz, C. B., Shahbaz, T., Casares, J., Charles, P. A., Starrfield, S. G., &
Hewett, P. 2001, ApJ, 556, 42
Wijnands, R., Muno, M. P., Miller, J. M., Franco, L. ., Strohmayer, T., Galloway, D., &
Chakrabarty, D. 2002, ApJ, 566, 1060
Zurita, C., et al. 2002, MNRAS, 334, 999
This preprint was prepared with the AAS LATEX macros v5.0.
17
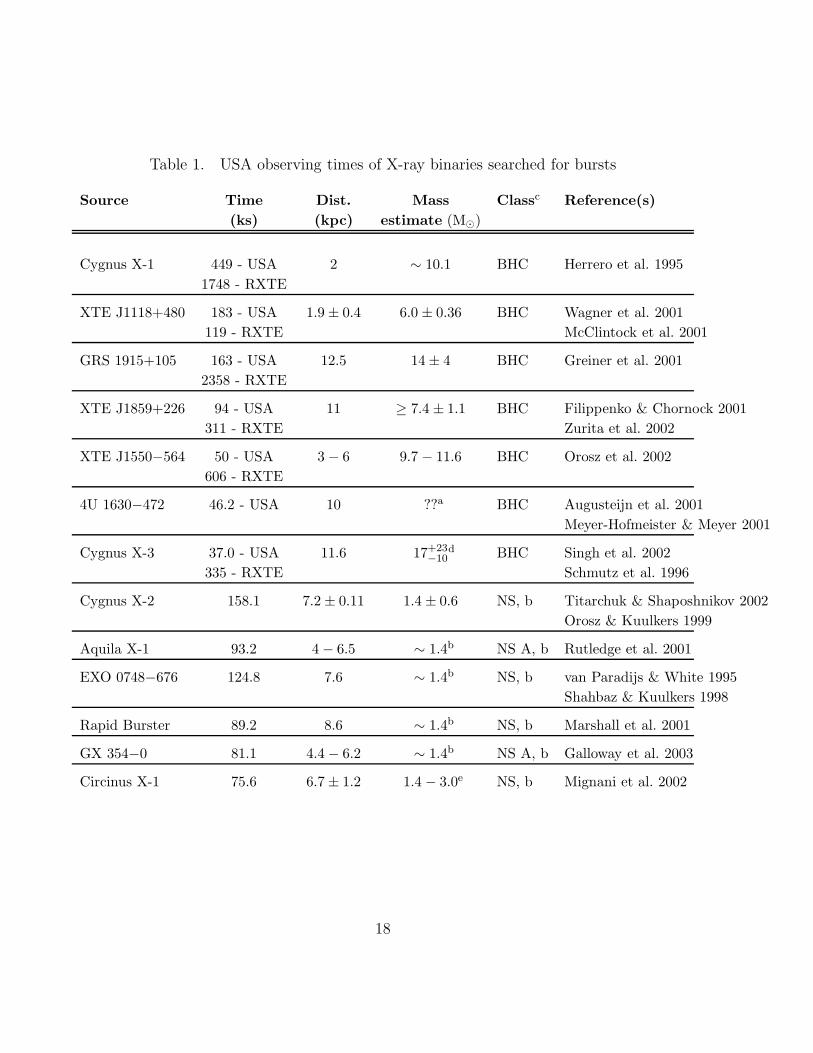
Table 1. USA observing times of X-ray binaries searched for bursts
Source Time Dist. Mass Classc Reference(s)(ks) (kpc) estimate (M�)
Cygnus X-1 449 - USA 2 ∼ 10.1 BHC Herrero et al. 19951748 - RXTE
XTE J1118+480 183 - USA 1.9 ± 0.4 6.0 ± 0.36 BHC Wagner et al. 2001119 - RXTE McClintock et al. 2001
GRS 1915+105 163 - USA 12.5 14 ± 4 BHC Greiner et al. 20012358 - RXTE
XTE J1859+226 94 - USA 11 ≥ 7.4 ± 1.1 BHC Filippenko & Chornock 2001311 - RXTE Zurita et al. 2002
XTE J1550−564 50 - USA 3 − 6 9.7 − 11.6 BHC Orosz et al. 2002606 - RXTE
4U 1630−472 46.2 - USA 10 ??a BHC Augusteijn et al. 2001Meyer-Hofmeister & Meyer 2001
Cygnus X-3 37.0 - USA 11.6 17+23−10
d BHC Singh et al. 2002335 - RXTE Schmutz et al. 1996
Cygnus X-2 158.1 7.2 ± 0.11 1.4 ± 0.6 NS, b Titarchuk & Shaposhnikov 2002Orosz & Kuulkers 1999
Aquila X-1 93.2 4 − 6.5 ∼ 1.4b NS A, b Rutledge et al. 2001
EXO 0748−676 124.8 7.6 ∼ 1.4b NS, b van Paradijs & White 1995Shahbaz & Kuulkers 1998
Rapid Burster 89.2 8.6 ∼ 1.4b NS, b Marshall et al. 2001
GX 354−0 81.1 4.4 − 6.2 ∼ 1.4b NS A, b Galloway et al. 2003
Circinus X-1 75.6 6.7 ± 1.2 1.4 − 3.0e NS, b Mignani et al. 2002
18

Table 1—Continued
Saz Parkinson 2003
4U 0614+09 66.2 5 ∼ 1.4b NS, b Brandt et al. 1992Christian & Swank 1997
GX 349+2 81.6 5 ∼ 1.4b NS Z O’Neill et al. 2002(Scorpius X-2) Christian & Swank 1997
XB 1254−690 51.7 12 ??f NS, b Iaria et al. 2001Christian & Swank 1997
Scorpius X-1 44.3 2.8 ± 0.3 1.4 ± 0.6 NS, Z Titarchuk & Shaposhnikov 2002Geldzahler et al. 1999
4U 1735−445 38.1 9.2 ∼ 1.4b NS A, b Seon et al. 1997van Paradijs & White 1995
X1636−536 37.9 6.5 ± 0.2 ∼ 1.4b NS, b van Paradijs & White 1995Christian & Swank 1997
GX 5−1 34.6 9 ∼ 1.4b NS, Z Christian & Swank 1997
GX 3+1 28.7 4-6 ∼ 1.4b NS A, b Kuulkers & van der Klis 2000Christian & Swank 1997
GX 340+0 28.5 9.5-11.0 ∼ 1.4b NS, Z Christian & Swank 1997
GX 17+2 29.4 7.5 ∼ 1.4b NS, Z, b Christian & Swank 1997MXB 1659−298 16.0 ∼ 10 ∼ 1.4b NS A, b Wijnands et al. 2002
aThere is no dynamical mass estimate for 4U 1630−472. This source was not used in burst ratelimit calculations.
bThis neutron star mass is unknown, a value of 1.4M� was assumed.cClass of the source: BHC - Black Hole Candidate; NS - Neutron Star; A - Atoll source; Z - Z
source; b - if bursts have been detected in the source in the past.dThe mass function for this source is 2.3M�, the nature of the compact object in this source is
still unknown. This source was not used in burst rate limit calculations.eTiming and spectral analysis of this source give evidence that Circinus X-1 is larger than 1.4M�
(Saz Parkinson 2003). This source was not used in burst rate calculationsfThe nature of this source could not be identified independent of bursts, therefore this source
was not used in burst rate calculations.
19

Table 2: Detected type I X-ray bursts of the USA experiment
Source Time of Burst Rate Change
Peak [MJD] [cts s−1]
Aquila X-1 51856.15684 1000 −→ 5000
EXO 0748−676 51614.54328 30 −→ 420
51648.97544 40 −→ 420
51648.41676 35 −→ 400
51669.44317 40 −→ 470
51687.50888 50 −→ 520
Rapid Burster / 51482.51368 300 −→ 2700
GX 354−0a 51487.23736 200 −→ 2100
51492.94726 150 −→ 2100
51861.23391 220 −→ 1100
51861.93667 120 −→ 1500
51491.82323 300 −→ 2000
51743.31991 250 −→ 2600
51812.96651 250 −→ 3000
51816.00111 300 −→ 4000
51817.41458 250 −→ 4400
4U 1735−445 51379.11730 400 −→ 3400
GX 3+1 51396.12709 200 −→ 1000
MXB 1659−298 51850.08140 180 −→ 400
a The Rapid Burster and GX 354−0 are both in the USA FOV at the same time, therefore a burst in onesource would be indistinguishable from a burst in the other.
20
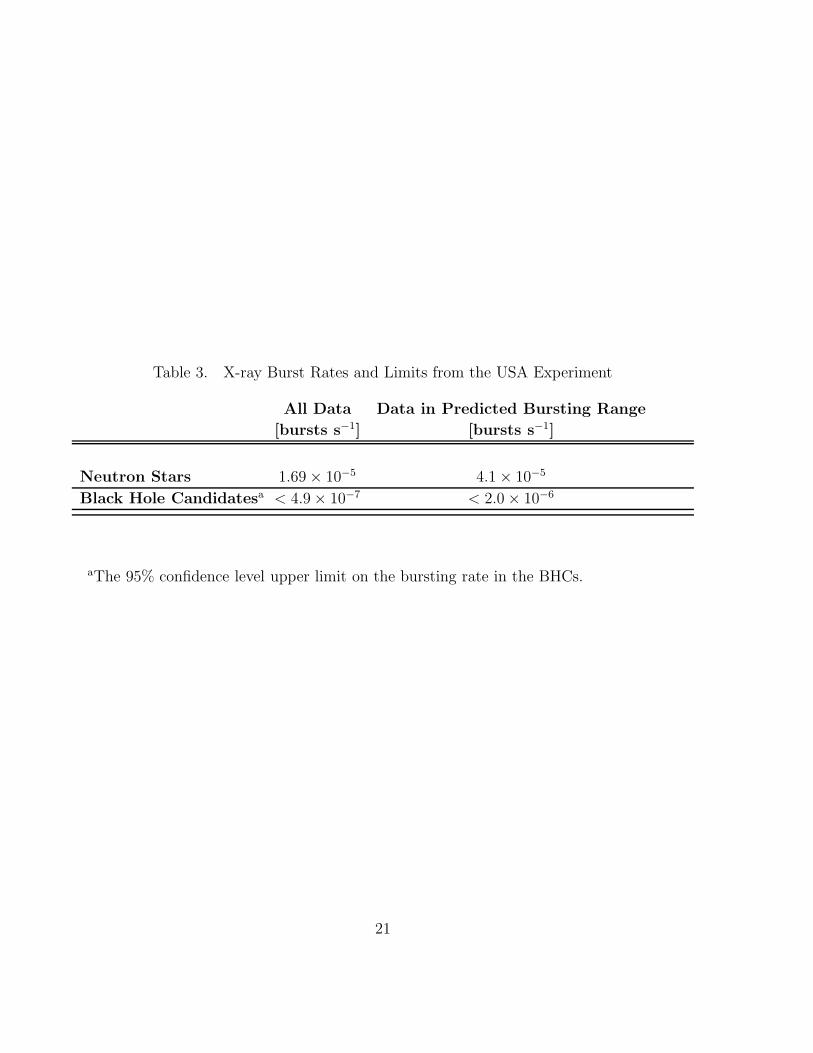
Table 3. X-ray Burst Rates and Limits from the USA Experiment
All Data Data in Predicted Bursting Range
[bursts s−1] [bursts s−1]
Neutron Stars 1.69× 10⁻⁵ 4.1× 10⁻⁵
Black Hole Candidatesa < 4.9× 10⁻⁷ < 2.0× 10⁻⁶
aThe 95% confidence level upper limit on the bursting rate in the BHCs.
21
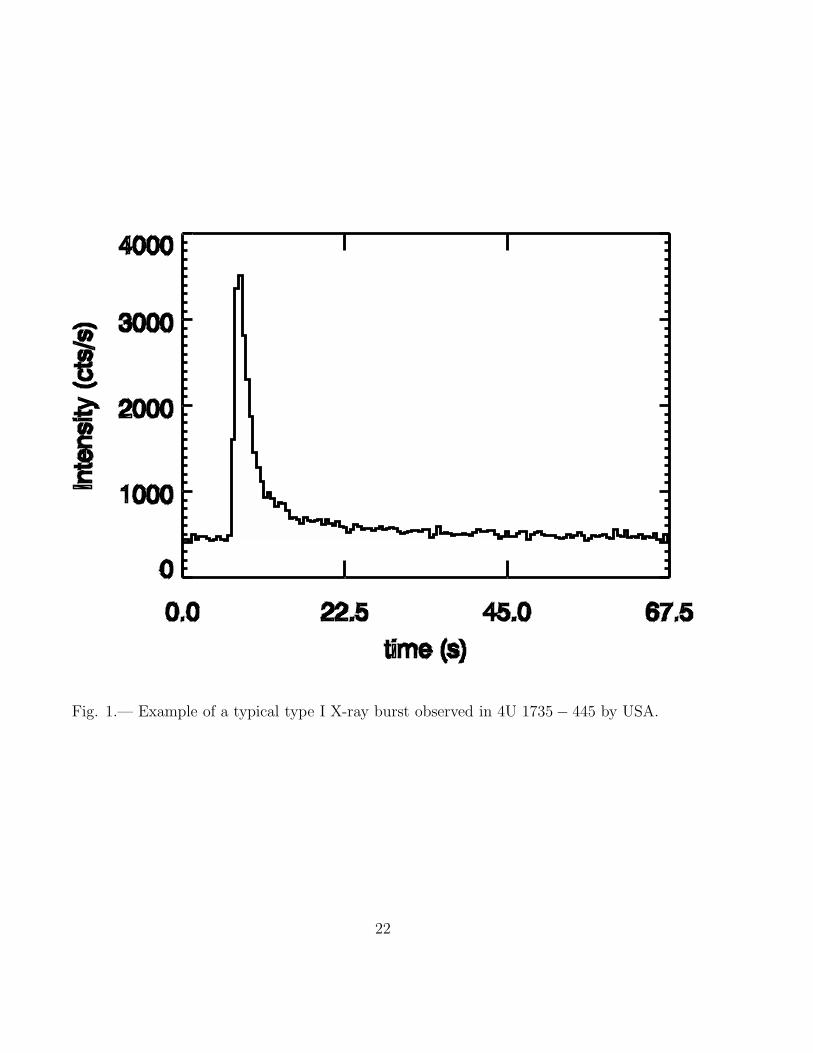
Fig. 1.— Example of a typical type I X-ray burst observed in 4U 1735− 445 by USA.
22
)EddLog(L/L-4 -3.5 -3 -2.5 -2 -1.5 -1 -0.5 0
ks o
f O
bse
rvat
ion
0
200
400
600
800
1000
1200 PredictedBurstingRegion
PredictedBursting Region
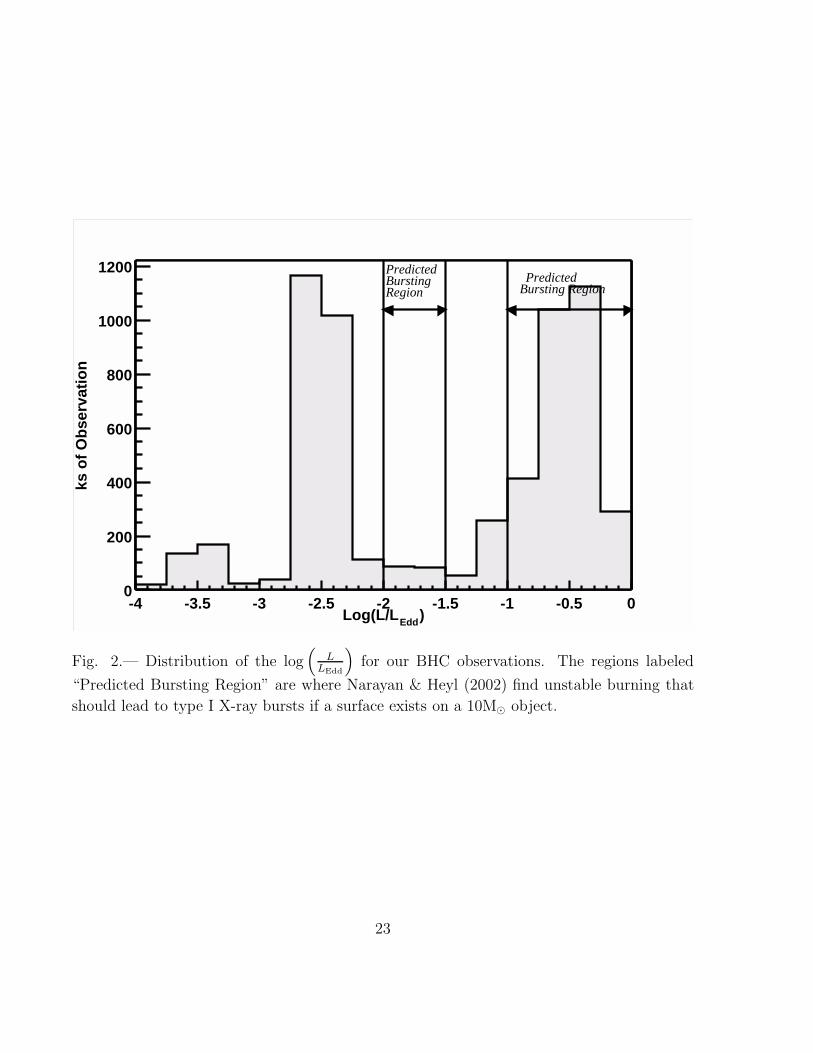
Fig. 2.— Distribution of the log(
LLEdd
)for our BHC observations. The regions labeled
“Predicted Bursting Region” are where Narayan & Heyl (2002) find unstable burning that
should lead to type I X-ray bursts if a surface exists on a 10M� object.
23

)EddLog(L/L-2.5 -2 -1.5 -1 -0.5 0
ks o
f O
bse
rvat
ion
0
50
100
150
200
250
Predicted Bursting Region
Bu
rsts
per
ks
of
ob
serv
atio
n
0
0.01
0.02
0.03
0.04
0.05NS observations
burst/ks.
Fig. 3.— Distribution of the log(
LLEdd
)for our neutron star observations. The solid his-
togram contains all the observations of the seventeen neutron stars that we analyzed in this
paper. The region labeled “Predicted Bursting Region” is where Narayan & Heyl (2002)
find unstable burning that should lead to type I X-ray bursts. The gray stars and the right
ordinate show where the nineteen bursts detected by USA were observed, and show a burst-
ing rate in that particular bin. The error bars reflect the uncertainties in the luminosity of
the source(s) that had the burst(s) that went into the particular luminosity bin.
24