Confinement of selenium inside carbon nanotubes. Structural characterization by X-ray diffraction...
10
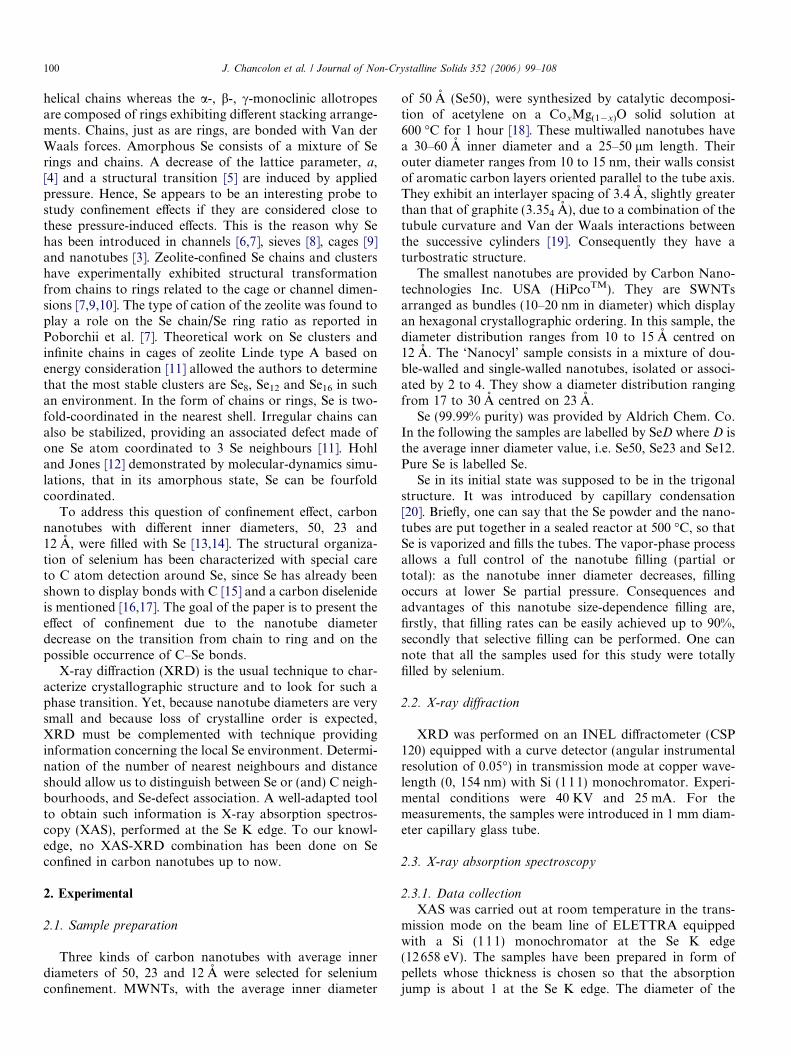
Confinement of selenium inside carbon nanotubes. Structural characterization by X-ray diffraction and X-ray absorption spectroscopy Je ´rome Chancolon a, * , Franc ¸oise Archaimbault a , Sylvie Bonnamy a , Agne `s Traverse b , Luca Olivi c , Gilberto Vlaic c,d a Centre de Recherche sur la Matie `re Divise ´e, 1B rue de la Fe ´rollerie, 45071 Orleans cedex 2, France b Laboratoire pour l’Utilisation du Rayonnement Electromagne ´tique, Ba ˆt 209D, BP34, 91898 Orsay cedex, France c EXAFS Beamline at ELETTRA, Sincrotrone Trieste S. C. p. A., S. S. 14 km 163.5 Basovizza (Trieste) 34012, Italy d Dep. of Chemistry, Univ. of Trieste Via L.Giorgieri 1, 34127 Trieste, Italy Received 20 April 2005; received in revised form 18 November 2005 Available online 27 December 2005 Abstract In order to study the effect of confinement on crystallographic arrangement, selenium (Se) was introduced into carbon nanotubes with average diameters of 12, 23 and 50 A ˚ . The evolution of the Se long-range crystallographic arrangement and the Se short-range atomic surroundings was characterized by X-ray diffraction and X-ray absorption spectroscopy, respectively. A transition from an initially dis- ordered trigonal structure, where part of the chains are not well connected, to a structure exhibiting well-organized rings was observed when the tube diameter was of the order of 12 A ˚ . Se–C bonds, detected when nanotube average diameters were of the order of 20 A ˚ and less, might play a role in the structural transition. Ó 2005 Elsevier B.V. All rights reserved. PACS: 61.10.Ht; 64.70.Kb Keywords: Diffraction and scattering measurements; X-ray diffraction; Nanotubes; Structure; X-ray absorption 1. Introduction The goal of this work is to study the effect of confine- ment on atomic arrangement. Confinement is interesting as a tool to prepare nano-sized materials. In addition to a reduction of the lattice parameter, the question is to know if confinement also modifies the long-range order in the case of a crystal and/or if it induces a new crystallo- graphic structure. To address this question, a relevant choice of confined and host materials is a prerequisite. Carbon nanotubes are at the forefront of materials sci- ence at the nanoscale, due to their diameters (from 4 A ˚ to few 1000 A ˚ ) and their one-dimensionality, providing important electronic, mechanical, conducting and other properties [1]. Filling them raises the possibility of prepar- ing hybrids materials with new properties on a nanometric scale with promising practical applications, mainly in the field of nano-electronic [2,3]. When their diameter is small, filling of the tube is of fundamental interest since confine- ment is combined with 1D preferential organization. Se displays various crystallographic structures depend- ing on the temperature and pressure conditions. Trigonal selenium, the most stable allotrope under normal tempera- ture and pressure conditions, displays infinite ordered 0022-3093/$ - see front matter Ó 2005 Elsevier B.V. All rights reserved. doi:10.1016/j.jnoncrysol.2005.11.032 * Corresponding author. Tel.: +33 169089187. E-mail addresses: [email protected], jerome.chanco- [email protected] (J. Chancolon). www.elsevier.com/locate/jnoncrysol Journal of Non-Crystalline Solids 352 (2006) 99–108
Transcript of Confinement of selenium inside carbon nanotubes. Structural characterization by X-ray diffraction...
www.elsevier.com/locate/jnoncrysol
Journal of Non-Crystalline Solids 352 (2006) 99–108
Confinement of selenium inside carbon nanotubes.Structural characterization by X-ray diffraction and
X-ray absorption spectroscopy
Jerome Chancolon a,*, Francoise Archaimbault a, Sylvie Bonnamy a, Agnes Traverse b,Luca Olivi c, Gilberto Vlaic c,d
a Centre de Recherche sur la Matiere Divisee, 1B rue de la Ferollerie, 45071 Orleans cedex 2, Franceb Laboratoire pour l’Utilisation du Rayonnement Electromagnetique, Bat 209D, BP34, 91898 Orsay cedex, France
c EXAFS Beamline at ELETTRA, Sincrotrone Trieste S. C. p. A., S. S. 14 km 163.5 Basovizza (Trieste) 34012, Italyd Dep. of Chemistry, Univ. of Trieste Via L.Giorgieri 1, 34127 Trieste, Italy
Received 20 April 2005; received in revised form 18 November 2005Available online 27 December 2005
Abstract
In order to study the effect of confinement on crystallographic arrangement, selenium (Se) was introduced into carbon nanotubes withaverage diameters of 12, 23 and 50 A. The evolution of the Se long-range crystallographic arrangement and the Se short-range atomicsurroundings was characterized by X-ray diffraction and X-ray absorption spectroscopy, respectively. A transition from an initially dis-ordered trigonal structure, where part of the chains are not well connected, to a structure exhibiting well-organized rings was observedwhen the tube diameter was of the order of 12 A. Se–C bonds, detected when nanotube average diameters were of the order of 20 A andless, might play a role in the structural transition.� 2005 Elsevier B.V. All rights reserved.
PACS: 61.10.Ht; 64.70.Kb
Keywords: Diffraction and scattering measurements; X-ray diffraction; Nanotubes; Structure; X-ray absorption
1. Introduction
The goal of this work is to study the effect of confine-ment on atomic arrangement. Confinement is interestingas a tool to prepare nano-sized materials. In addition toa reduction of the lattice parameter, the question is toknow if confinement also modifies the long-range orderin the case of a crystal and/or if it induces a new crystallo-graphic structure. To address this question, a relevantchoice of confined and host materials is a prerequisite.
0022-3093/$ - see front matter � 2005 Elsevier B.V. All rights reserved.
doi:10.1016/j.jnoncrysol.2005.11.032
* Corresponding author. Tel.: +33 169089187.E-mail addresses: [email protected], jerome.chanco-
[email protected] (J. Chancolon).
Carbon nanotubes are at the forefront of materials sci-ence at the nanoscale, due to their diameters (from 4 Ato few 1000 A) and their one-dimensionality, providingimportant electronic, mechanical, conducting and otherproperties [1]. Filling them raises the possibility of prepar-ing hybrids materials with new properties on a nanometricscale with promising practical applications, mainly in thefield of nano-electronic [2,3]. When their diameter is small,filling of the tube is of fundamental interest since confine-ment is combined with 1D preferential organization.
Se displays various crystallographic structures depend-ing on the temperature and pressure conditions. Trigonalselenium, the most stable allotrope under normal tempera-ture and pressure conditions, displays infinite ordered
100 J. Chancolon et al. / Journal of Non-Crystalline Solids 352 (2006) 99–108
helical chains whereas the a-, b-, c-monoclinic allotropesare composed of rings exhibiting different stacking arrange-ments. Chains, just as are rings, are bonded with Van derWaals forces. Amorphous Se consists of a mixture of Serings and chains. A decrease of the lattice parameter, a,[4] and a structural transition [5] are induced by appliedpressure. Hence, Se appears to be an interesting probe tostudy confinement effects if they are considered close tothese pressure-induced effects. This is the reason why Sehas been introduced in channels [6,7], sieves [8], cages [9]and nanotubes [3]. Zeolite-confined Se chains and clustershave experimentally exhibited structural transformationfrom chains to rings related to the cage or channel dimen-sions [7,9,10]. The type of cation of the zeolite was found toplay a role on the Se chain/Se ring ratio as reported inPoborchii et al. [7]. Theoretical work on Se clusters andinfinite chains in cages of zeolite Linde type A based onenergy consideration [11] allowed the authors to determinethat the most stable clusters are Se8, Se12 and Se16 in suchan environment. In the form of chains or rings, Se is two-fold-coordinated in the nearest shell. Irregular chains canalso be stabilized, providing an associated defect made ofone Se atom coordinated to 3 Se neighbours [11]. Hohland Jones [12] demonstrated by molecular-dynamics simu-lations, that in its amorphous state, Se can be fourfoldcoordinated.
To address this question of confinement effect, carbonnanotubes with different inner diameters, 50, 23 and12 A, were filled with Se [13,14]. The structural organiza-tion of selenium has been characterized with special careto C atom detection around Se, since Se has already beenshown to display bonds with C [15] and a carbon diselenideis mentioned [16,17]. The goal of the paper is to present theeffect of confinement due to the nanotube diameterdecrease on the transition from chain to ring and on thepossible occurrence of C–Se bonds.
X-ray diffraction (XRD) is the usual technique to char-acterize crystallographic structure and to look for such aphase transition. Yet, because nanotube diameters are verysmall and because loss of crystalline order is expected,XRD must be complemented with technique providinginformation concerning the local Se environment. Determi-nation of the number of nearest neighbours and distanceshould allow us to distinguish between Se or (and) C neigh-bourhoods, and Se-defect association. A well-adapted toolto obtain such information is X-ray absorption spectros-copy (XAS), performed at the Se K edge. To our knowl-edge, no XAS-XRD combination has been done on Seconfined in carbon nanotubes up to now.
2. Experimental
2.1. Sample preparation
Three kinds of carbon nanotubes with average innerdiameters of 50, 23 and 12 A were selected for seleniumconfinement. MWNTs, with the average inner diameter
of 50 A (Se50), were synthesized by catalytic decomposi-tion of acetylene on a CoxMg(1�x)O solid solution at600 �C for 1 hour [18]. These multiwalled nanotubes havea 30–60 A inner diameter and a 25–50 lm length. Theirouter diameter ranges from 10 to 15 nm, their walls consistof aromatic carbon layers oriented parallel to the tube axis.They exhibit an interlayer spacing of 3.4 A, slightly greaterthan that of graphite (3.354 A), due to a combination of thetubule curvature and Van der Waals interactions betweenthe successive cylinders [19]. Consequently they have aturbostratic structure.
The smallest nanotubes are provided by Carbon Nano-technologies Inc. USA (HiPcoTM). They are SWNTsarranged as bundles (10–20 nm in diameter) which displayan hexagonal crystallographic ordering. In this sample, thediameter distribution ranges from 10 to 15 A centred on12 A. The ‘Nanocyl’ sample consists in a mixture of dou-ble-walled and single-walled nanotubes, isolated or associ-ated by 2 to 4. They show a diameter distribution rangingfrom 17 to 30 A centred on 23 A.
Se (99.99% purity) was provided by Aldrich Chem. Co.In the following the samples are labelled by SeD where D isthe average inner diameter value, i.e. Se50, Se23 and Se12.Pure Se is labelled Se.
Se in its initial state was supposed to be in the trigonalstructure. It was introduced by capillary condensation[20]. Briefly, one can say that the Se powder and the nano-tubes are put together in a sealed reactor at 500 �C, so thatSe is vaporized and fills the tubes. The vapor-phase processallows a full control of the nanotube filling (partial ortotal): as the nanotube inner diameter decreases, fillingoccurs at lower Se partial pressure. Consequences andadvantages of this nanotube size-dependence filling are,firstly, that filling rates can be easily achieved up to 90%,secondly that selective filling can be performed. One cannote that all the samples used for this study were totallyfilled by selenium.
2.2. X-ray diffraction
XRD was performed on an INEL diffractometer (CSP120) equipped with a curve detector (angular instrumentalresolution of 0.05�) in transmission mode at copper wave-length (0, 154 nm) with Si (111) monochromator. Experi-mental conditions were 40 KV and 25 mA. For themeasurements, the samples were introduced in 1 mm diam-eter capillary glass tube.
2.3. X-ray absorption spectroscopy
2.3.1. Data collection
XAS was carried out at room temperature in the trans-mission mode on the beam line of ELETTRA equippedwith a Si (111) monochromator at the Se K edge(12658 eV). The samples have been prepared in form ofpellets whose thickness is chosen so that the absorptionjump is about 1 at the Se K edge. The diameter of the
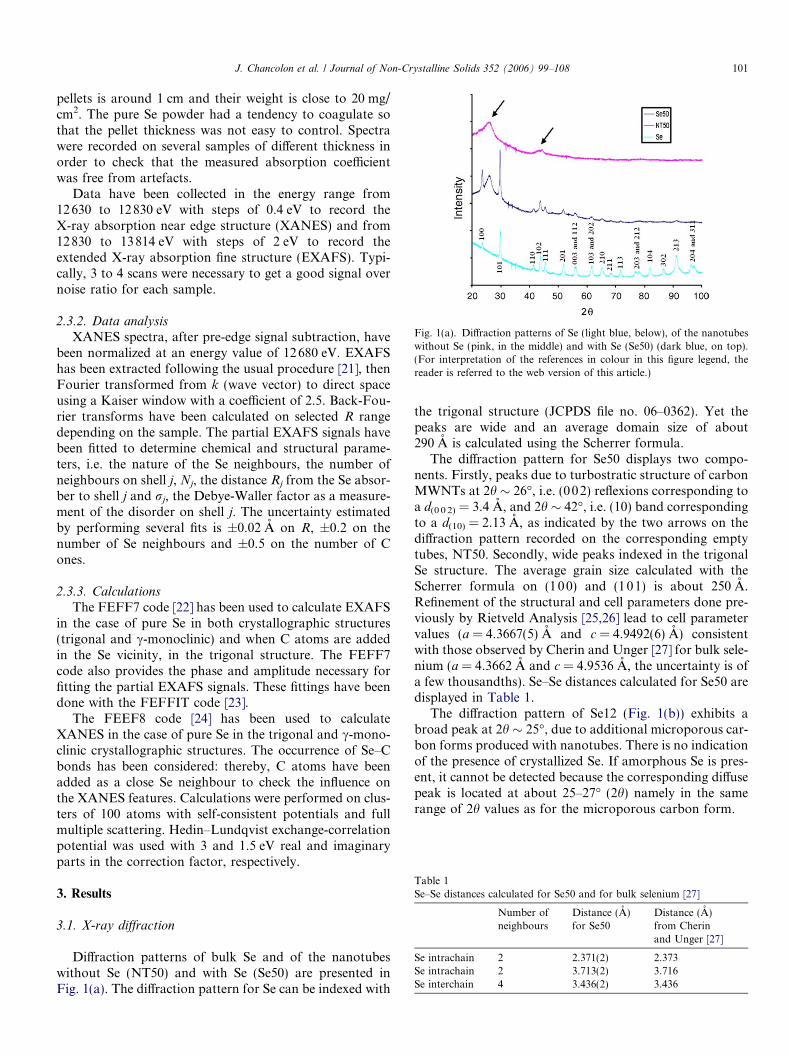
Fig. 1(a). Diffraction patterns of Se (light blue, below), of the nanotubeswithout Se (pink, in the middle) and with Se (Se50) (dark blue, on top).(For interpretation of the references in colour in this figure legend, thereader is referred to the web version of this article.)
Table 1Se–Se distances calculated for Se50 and for bulk selenium [27]
Number ofneighbours
Distance (A)for Se50
Distance (A)from Cherinand Unger [27]
Se intrachain 2 2.371(2) 2.373Se intrachain 2 3.713(2) 3.716Se interchain 4 3.436(2) 3.436
J. Chancolon et al. / Journal of Non-Crystalline Solids 352 (2006) 99–108 101
pellets is around 1 cm and their weight is close to 20 mg/cm2. The pure Se powder had a tendency to coagulate sothat the pellet thickness was not easy to control. Spectrawere recorded on several samples of different thickness inorder to check that the measured absorption coefficientwas free from artefacts.
Data have been collected in the energy range from12630 to 12830 eV with steps of 0.4 eV to record theX-ray absorption near edge structure (XANES) and from12830 to 13814 eV with steps of 2 eV to record theextended X-ray absorption fine structure (EXAFS). Typi-cally, 3 to 4 scans were necessary to get a good signal overnoise ratio for each sample.
2.3.2. Data analysis
XANES spectra, after pre-edge signal subtraction, havebeen normalized at an energy value of 12680 eV. EXAFShas been extracted following the usual procedure [21], thenFourier transformed from k (wave vector) to direct spaceusing a Kaiser window with a coefficient of 2.5. Back-Fou-rier transforms have been calculated on selected R rangedepending on the sample. The partial EXAFS signals havebeen fitted to determine chemical and structural parame-ters, i.e. the nature of the Se neighbours, the number ofneighbours on shell j, Nj, the distance Rj from the Se absor-ber to shell j and rj, the Debye-Waller factor as a measure-ment of the disorder on shell j. The uncertainty estimatedby performing several fits is ±0.02 A on R, ±0.2 on thenumber of Se neighbours and ±0.5 on the number of Cones.
2.3.3. Calculations
The FEFF7 code [22] has been used to calculate EXAFSin the case of pure Se in both crystallographic structures(trigonal and c-monoclinic) and when C atoms are addedin the Se vicinity, in the trigonal structure. The FEFF7code also provides the phase and amplitude necessary forfitting the partial EXAFS signals. These fittings have beendone with the FEFFIT code [23].
The FEEF8 code [24] has been used to calculateXANES in the case of pure Se in the trigonal and c-mono-clinic crystallographic structures. The occurrence of Se–Cbonds has been considered: thereby, C atoms have beenadded as a close Se neighbour to check the influence onthe XANES features. Calculations were performed on clus-ters of 100 atoms with self-consistent potentials and fullmultiple scattering. Hedin–Lundqvist exchange-correlationpotential was used with 3 and 1.5 eV real and imaginaryparts in the correction factor, respectively.
3. Results
3.1. X-ray diffraction
Diffraction patterns of bulk Se and of the nanotubeswithout Se (NT50) and with Se (Se50) are presented inFig. 1(a). The diffraction pattern for Se can be indexed with
the trigonal structure (JCPDS file no. 06–0362). Yet thepeaks are wide and an average domain size of about290 A is calculated using the Scherrer formula.
The diffraction pattern for Se50 displays two compo-nents. Firstly, peaks due to turbostratic structure of carbonMWNTs at 2h � 26�, i.e. (002) reflexions corresponding toa d(0 0 2) = 3.4 A, and 2h � 42�, i.e. (10) band correspondingto a d(10) = 2.13 A, as indicated by the two arrows on thediffraction pattern recorded on the corresponding emptytubes, NT50. Secondly, wide peaks indexed in the trigonalSe structure. The average grain size calculated with theScherrer formula on (100) and (101) is about 250 A.Refinement of the structural and cell parameters done pre-viously by Rietveld Analysis [25,26] lead to cell parametervalues (a = 4.3667(5) A and c = 4.9492(6) A) consistentwith those observed by Cherin and Unger [27] for bulk sele-nium (a = 4.3662 A and c = 4.9536 A, the uncertainty is ofa few thousandths). Se–Se distances calculated for Se50 aredisplayed in Table 1.
The diffraction pattern of Se12 (Fig. 1(b)) exhibits abroad peak at 2h � 25�, due to additional microporous car-bon forms produced with nanotubes. There is no indicationof the presence of crystallized Se. If amorphous Se is pres-ent, it cannot be detected because the corresponding diffusepeak is located at about 25–27� (2h) namely in the samerange of 2h values as for the microporous carbon form.
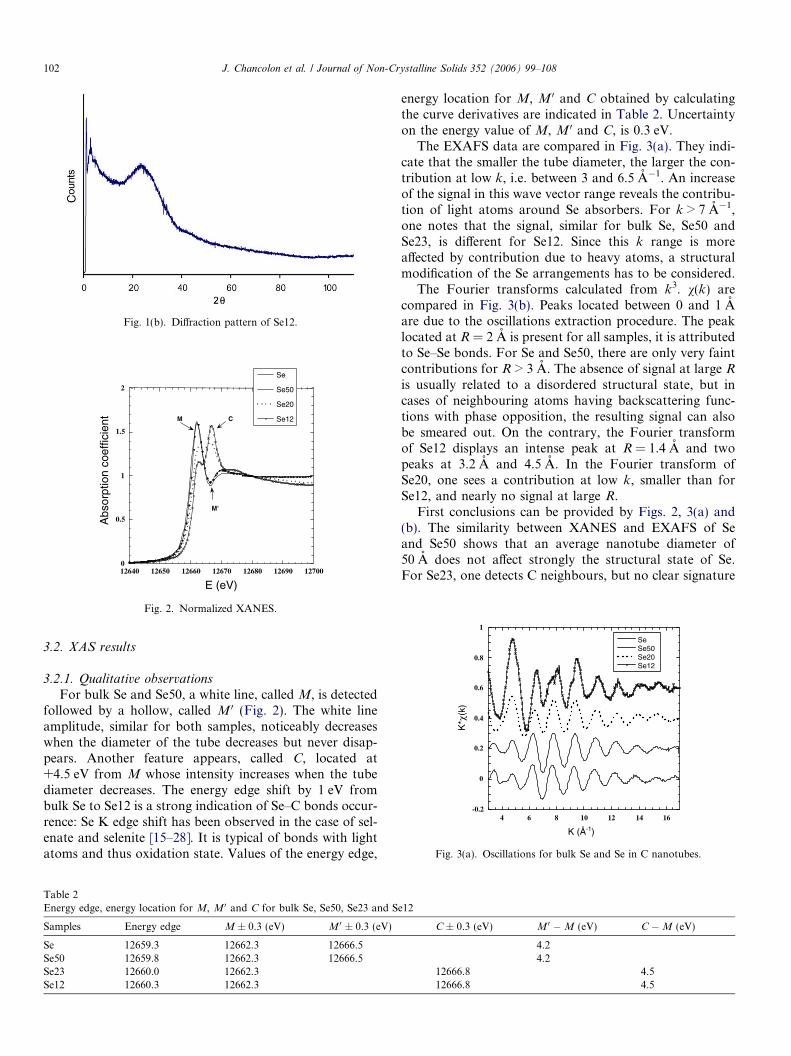
Fig. 1(b). Diffraction pattern of Se12.
0
0.5
1
1.5
2
12640 12650 12660 12670 12680 12690 12700
Se
Se50
Se20
Se12
Abs
orpt
ion
coef
ficie
nt
E (eV)
M C
M'
Fig. 2. Normalized XANES.
-0.2
0
0.2
0.4
0.6
0.8
1
4 6 8 10 12 14 16
SeSe50Se20Se12
K*χ
(k)
K (Å-1)
Fig. 3(a). Oscillations for bulk Se and Se in C nanotubes.
102 J. Chancolon et al. / Journal of Non-Crystalline Solids 352 (2006) 99–108
3.2. XAS results
3.2.1. Qualitative observations
For bulk Se and Se50, a white line, called M, is detectedfollowed by a hollow, called M 0 (Fig. 2). The white lineamplitude, similar for both samples, noticeably decreaseswhen the diameter of the tube decreases but never disap-pears. Another feature appears, called C, located at+4.5 eV from M whose intensity increases when the tubediameter decreases. The energy edge shift by 1 eV frombulk Se to Se12 is a strong indication of Se–C bonds occur-rence: Se K edge shift has been observed in the case of sel-enate and selenite [15–28]. It is typical of bonds with lightatoms and thus oxidation state. Values of the energy edge,
Table 2Energy edge, energy location for M, M 0 and C for bulk Se, Se50, Se23 and S
Samples Energy edge M ± 0.3 (eV) M0 ± 0.3 (eV)
Se 12659.3 12662.3 12666.5Se50 12659.8 12662.3 12666.5Se23 12660.0 12662.3Se12 12660.3 12662.3
energy location for M, M 0 and C obtained by calculatingthe curve derivatives are indicated in Table 2. Uncertaintyon the energy value of M, M 0 and C, is 0.3 eV.
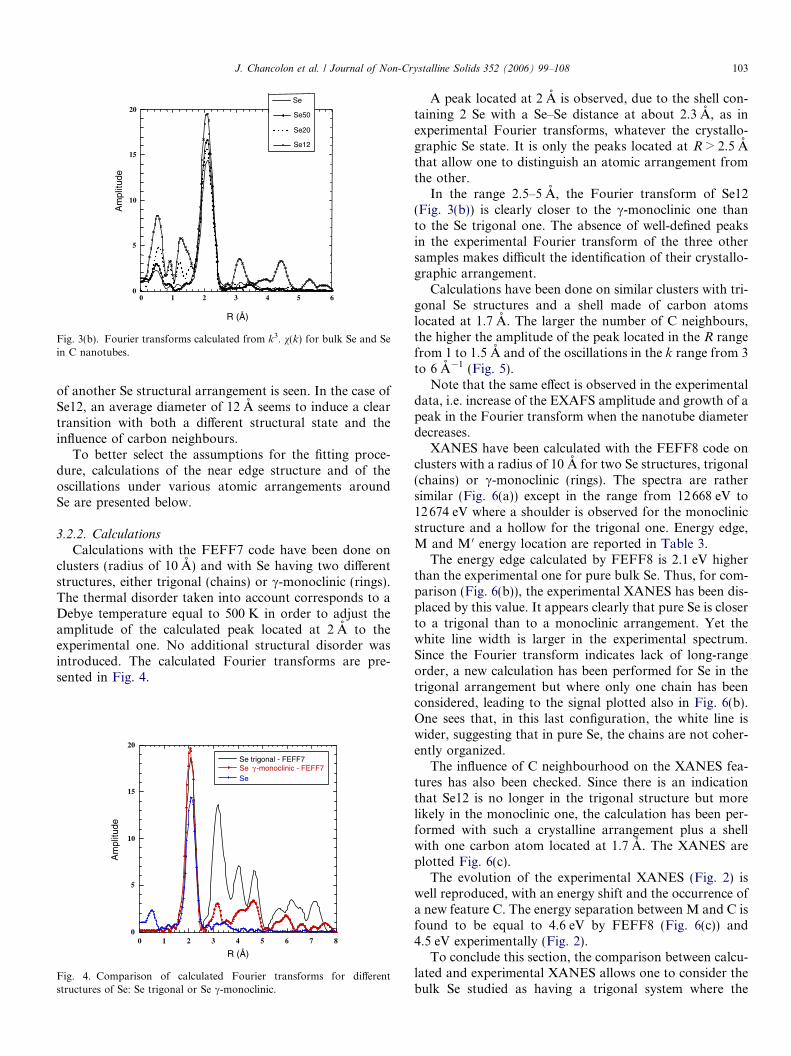
The EXAFS data are compared in Fig. 3(a). They indi-cate that the smaller the tube diameter, the larger the con-tribution at low k, i.e. between 3 and 6.5 A�1. An increaseof the signal in this wave vector range reveals the contribu-tion of light atoms around Se absorbers. For k > 7 A�1,one notes that the signal, similar for bulk Se, Se50 andSe23, is different for Se12. Since this k range is moreaffected by contribution due to heavy atoms, a structuralmodification of the Se arrangements has to be considered.
The Fourier transforms calculated from k3. v(k) arecompared in Fig. 3(b). Peaks located between 0 and 1 Aare due to the oscillations extraction procedure. The peaklocated at R = 2 A is present for all samples, it is attributedto Se–Se bonds. For Se and Se50, there are only very faintcontributions for R > 3 A. The absence of signal at large Ris usually related to a disordered structural state, but incases of neighbouring atoms having backscattering func-tions with phase opposition, the resulting signal can alsobe smeared out. On the contrary, the Fourier transformof Se12 displays an intense peak at R = 1.4 A and twopeaks at 3.2 A and 4.5 A. In the Fourier transform ofSe20, one sees a contribution at low k, smaller than forSe12, and nearly no signal at large R.
First conclusions can be provided by Figs. 2, 3(a) and(b). The similarity between XANES and EXAFS of Seand Se50 shows that an average nanotube diameter of50 A does not affect strongly the structural state of Se.For Se23, one detects C neighbours, but no clear signature
e12
C ± 0.3 (eV) M0 �M (eV) C �M (eV)
4.24.2
12666.8 4.512666.8 4.5
00 1 2 3 4 5 6
5
10
15
20Se
Se50
Se20
Se12
Am
plitu
de
R (Å)
Fig. 3(b). Fourier transforms calculated from k3. v(k) for bulk Se and Sein C nanotubes.
J. Chancolon et al. / Journal of Non-Crystalline Solids 352 (2006) 99–108 103
of another Se structural arrangement is seen. In the case ofSe12, an average diameter of 12 A seems to induce a cleartransition with both a different structural state and theinfluence of carbon neighbours.
To better select the assumptions for the fitting proce-dure, calculations of the near edge structure and of theoscillations under various atomic arrangements aroundSe are presented below.
3.2.2. Calculations
Calculations with the FEFF7 code have been done onclusters (radius of 10 A) and with Se having two differentstructures, either trigonal (chains) or c-monoclinic (rings).The thermal disorder taken into account corresponds to aDebye temperature equal to 500 K in order to adjust theamplitude of the calculated peak located at 2 A to theexperimental one. No additional structural disorder wasintroduced. The calculated Fourier transforms are pre-sented in Fig. 4.
0
5
10
15
20
0 1 2 3 4 5 6 7 8
Se trigonal - FEFF7Se γ -monoclinic - FEFF7Se
Am
plitu
de
R (Å)
Fig. 4. Comparison of calculated Fourier transforms for differentstructures of Se: Se trigonal or Se c-monoclinic.
A peak located at 2 A is observed, due to the shell con-taining 2 Se with a Se–Se distance at about 2.3 A, as inexperimental Fourier transforms, whatever the crystallo-graphic Se state. It is only the peaks located at R > 2.5 Athat allow one to distinguish an atomic arrangement fromthe other.
In the range 2.5–5 A, the Fourier transform of Se12(Fig. 3(b)) is clearly closer to the c-monoclinic one thanto the Se trigonal one. The absence of well-defined peaksin the experimental Fourier transform of the three othersamples makes difficult the identification of their crystallo-graphic arrangement.
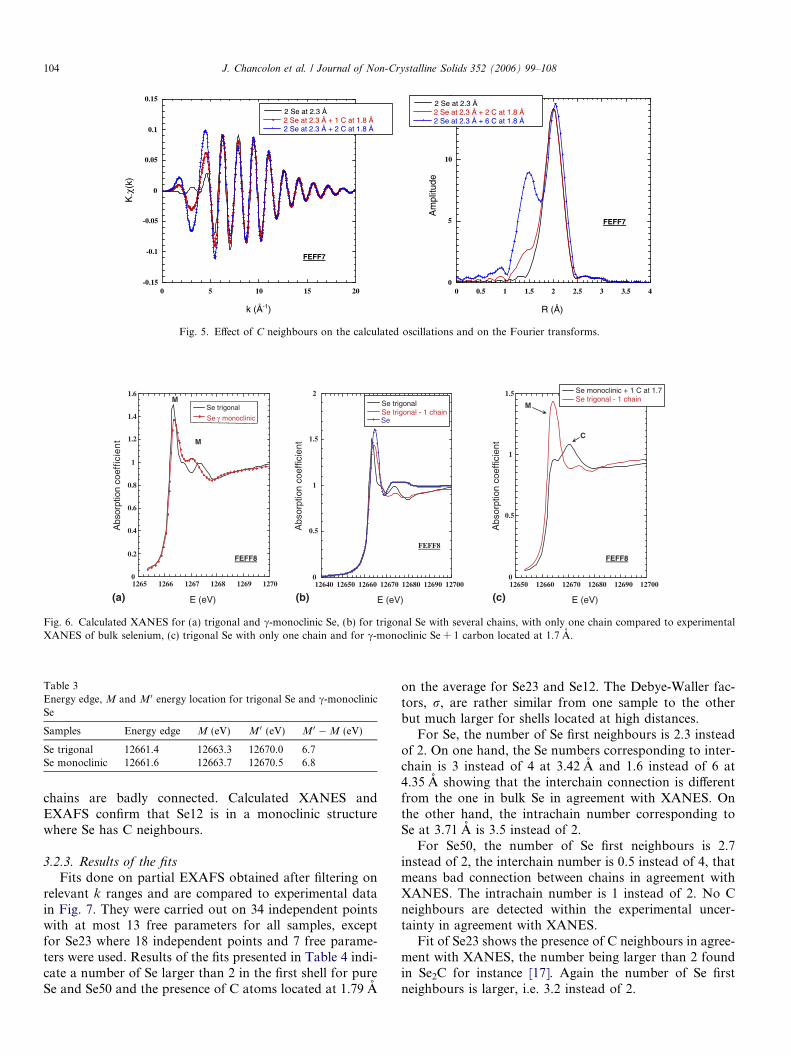
Calculations have been done on similar clusters with tri-gonal Se structures and a shell made of carbon atomslocated at 1.7 A. The larger the number of C neighbours,the higher the amplitude of the peak located in the R rangefrom 1 to 1.5 A and of the oscillations in the k range from 3to 6 A�1 (Fig. 5).
Note that the same effect is observed in the experimentaldata, i.e. increase of the EXAFS amplitude and growth of apeak in the Fourier transform when the nanotube diameterdecreases.
XANES have been calculated with the FEFF8 code onclusters with a radius of 10 A for two Se structures, trigonal(chains) or c-monoclinic (rings). The spectra are rathersimilar (Fig. 6(a)) except in the range from 12668 eV to12674 eV where a shoulder is observed for the monoclinicstructure and a hollow for the trigonal one. Energy edge,M and M 0 energy location are reported in Table 3.
The energy edge calculated by FEFF8 is 2.1 eV higherthan the experimental one for pure bulk Se. Thus, for com-parison (Fig. 6(b)), the experimental XANES has been dis-placed by this value. It appears clearly that pure Se is closerto a trigonal than to a monoclinic arrangement. Yet thewhite line width is larger in the experimental spectrum.Since the Fourier transform indicates lack of long-rangeorder, a new calculation has been performed for Se in thetrigonal arrangement but where only one chain has beenconsidered, leading to the signal plotted also in Fig. 6(b).One sees that, in this last configuration, the white line iswider, suggesting that in pure Se, the chains are not coher-ently organized.
The influence of C neighbourhood on the XANES fea-tures has also been checked. Since there is an indicationthat Se12 is no longer in the trigonal structure but morelikely in the monoclinic one, the calculation has been per-formed with such a crystalline arrangement plus a shellwith one carbon atom located at 1.7 A. The XANES areplotted Fig. 6(c).
The evolution of the experimental XANES (Fig. 2) iswell reproduced, with an energy shift and the occurrence ofa new feature C. The energy separation between M and C isfound to be equal to 4.6 eV by FEFF8 (Fig. 6(c)) and4.5 eV experimentally (Fig. 2).
To conclude this section, the comparison between calcu-lated and experimental XANES allows one to consider thebulk Se studied as having a trigonal system where the
0
5
10
15
0 0.5 1 1.5 2 2.5 3 3.5 4
FEFF7
2 Se at 2.3 Å
-0.15
-0.1
-0.05
0
0.05
0.1
0.15
0 5 10 15 20
FEFF7
2 Se at 2.3 Å 2 Se at 2.3 Å + 2 C at 1.8 Å2 Se at 2.3 Å + 6 C at 1.8 Å
Am
plitu
de
R (Å)
2 Se at 2.3 Å + 1 C at 1.8 Å2 Se at 2.3 Å + 2 C at 1.8 Å
K.χ
(k)
k (Å-1)
Fig. 5. Effect of C neighbours on the calculated oscillations and on the Fourier transforms.
0
0.2
0.4
0.6
0.8
1
1.2
1.4
1.6
1265 1266 1267 1268 1269 1270
Se trigonal
0
0.5
1
1.5
12650 12660 12670 12680 12690 12700
FEFF8FEFF8
Se monoclinic + 1 C at 1.7
Abs
orpt
ion
coef
ficie
nt
E (eV)
M
M
0
0.5
1
1.5
2
12640 12650 12660 12670 12680 12690 12700
FEFF8
Se trigonalSe trigonal - 1 chain
Abs
orpt
ion
coef
ficie
nt
E (eV)
M
C
Se monoclinicγSe trigonal - 1 chainSe
Abs
orpt
ion
coef
ficie
nt
E (eV)(a) (b) (c)
Fig. 6. Calculated XANES for (a) trigonal and c-monoclinic Se, (b) for trigonal Se with several chains, with only one chain compared to experimentalXANES of bulk selenium, (c) trigonal Se with only one chain and for c-monoclinic Se + 1 carbon located at 1.7 A.
Table 3Energy edge, M and M 0 energy location for trigonal Se and c-monoclinicSe
Samples Energy edge M (eV) M0 (eV) M0 �M (eV)
Se trigonal 12661.4 12663.3 12670.0 6.7Se monoclinic 12661.6 12663.7 12670.5 6.8
104 J. Chancolon et al. / Journal of Non-Crystalline Solids 352 (2006) 99–108
chains are badly connected. Calculated XANES andEXAFS confirm that Se12 is in a monoclinic structurewhere Se has C neighbours.
3.2.3. Results of the fits
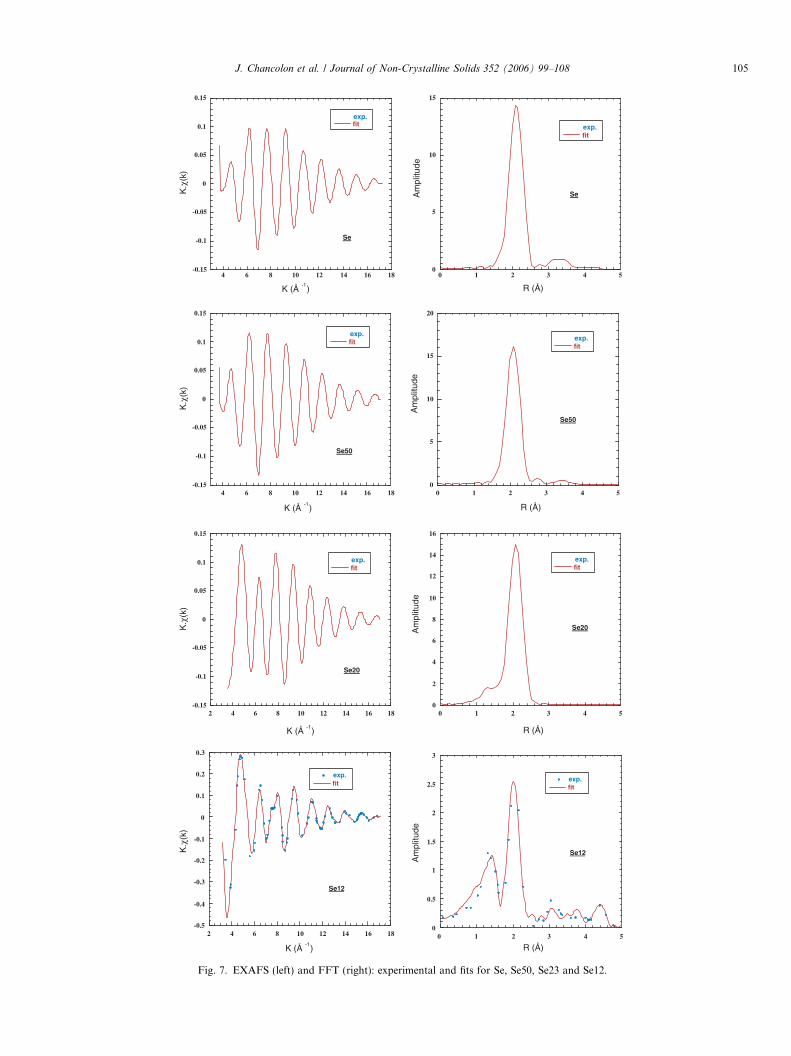
Fits done on partial EXAFS obtained after filtering onrelevant k ranges and are compared to experimental datain Fig. 7. They were carried out on 34 independent pointswith at most 13 free parameters for all samples, exceptfor Se23 where 18 independent points and 7 free parame-ters were used. Results of the fits presented in Table 4 indi-cate a number of Se larger than 2 in the first shell for pureSe and Se50 and the presence of C atoms located at 1.79 A
on the average for Se23 and Se12. The Debye-Waller fac-tors, r, are rather similar from one sample to the otherbut much larger for shells located at high distances.
For Se, the number of Se first neighbours is 2.3 insteadof 2. On one hand, the Se numbers corresponding to inter-chain is 3 instead of 4 at 3.42 A and 1.6 instead of 6 at4.35 A showing that the interchain connection is differentfrom the one in bulk Se in agreement with XANES. Onthe other hand, the intrachain number corresponding toSe at 3.71 A is 3.5 instead of 2.
For Se50, the number of Se first neighbours is 2.7instead of 2, the interchain number is 0.5 instead of 4, thatmeans bad connection between chains in agreement withXANES. The intrachain number is 1 instead of 2. No Cneighbours are detected within the experimental uncer-tainty in agreement with XANES.
Fit of Se23 shows the presence of C neighbours in agree-ment with XANES, the number being larger than 2 foundin Se2C for instance [17]. Again the number of Se firstneighbours is larger, i.e. 3.2 instead of 2.
0
5
10
15
0 1 2 3 4 5
Se
exp.
-0.15
-0.1
-0.05
0
0.05
0.1
0.15
4 6 8 10 12 14 16 18
Se
exp.fit
fit
Am
plitu
de
R (Å)K (Å-1
)
-0.15
-0.1
-0.05
0
0.05
0.1
0.15
4 6 8 10 12 14 16 18
Se50
exp.
0
5
10
15
20
0 1 2 3 4 5
Se50
exp.fitfit
Am
plitu
de
R (Å)
K.χ
(k)
K.χ
(k)
K (Å-1
)
-0.15
-0.1
-0.05
0
0.05
0.1
0.15
2 4 6 8 10 12 14 16 18
Se20
exp.
0
2
4
6
8
10
12
14
16
0 1 2 3 4 5
Se20
exp.fitfit
Am
plitu
deA
mpl
itude
R (Å)
R (Å)
K.χ
(k)
K.χ
(k)
K (Å-1
)
-0.5
-0.4
-0.3
-0.2
-0.1
0
0.1
0.2
0.3
12108642 14 16 18
Se12
exp.
0
0.5
1
1.5
2
2.5
3
43210 5
Se12
exp.fit fit
K (Å-1
)
Fig. 7. EXAFS (left) and FFT (right): experimental and fits for Se, Se50, Se23 and Se12.
J. Chancolon et al. / Journal of Non-Crystalline Solids 352 (2006) 99–108 105

Table 4Results of the fits presented in Fig. 7
Sample R range Type of neighbour Number ±0.2 for Se ±0.5 for C Distance (A) ±0.02 r (A) ±0.02
Bulk Se 1–5 A Se intrachain 2.3 2.37 0.07Se interchain 3 3.42 0.13Se intrachain 3.5 3.71 0.12Se interchain 1.6 4.35 0.13
Se50 0.75–4.59 A Se 2.7 2.36 0.06Se 0.5 2.90 0.09Se 1 3.74 0.105
Se23 0.75–2.7 A Se 3.2 2.34 0.08C 3.1 1.76 0.12
Se12 0.75–4.9A C 4.2 1.81 0.08C 0.7 3.42Se 2.6 2.33 0.06Se 5.5 3.84 0.11
Trigonal Se Se intrachain 2 2.371Se interchain 4 3.436Se intrachain 2 3.716Se interchain 6 4.366
Monoclinic Se Se intraring 2 2.332Se intering 3 3.468–3.570Se intraring 3 3.660–3.887
In column one, the k range. In the next columns, type of neighbour, number, distances, r. Data for trigonal and c-monoclinic Se are also given forcomparison.
106 J. Chancolon et al. / Journal of Non-Crystalline Solids 352 (2006) 99–108
For Se12, the presence of Se atoms at 3.84 A is due tothe existence of the rings, yet the absence of Se around3.5 A can be interpreted by absence of ring connections.The number of C at short distance has increased as com-pared to Se23 and another C shell is found at 3.42 A.
Note that the Se–Se distance diminishes regularly inrelationship with the tube diameter decrease and that thenumber of Se first neighbours is always larger than 2.
4. Interpretation and discussion
Bulk Se is made of trigonal domains of 290 A averagediameter as shown by XRD. XAS clearly indicates a veryfaint long-range order. One has to know that amorphousblack selenium is the ordinary commercial form of the ele-ment. Indeed, in the literature, the Fourier transforms forSe trigonal standards do not display an intense signal forR > 2.6 A [6–8]. To reconcile results from XRD andXAS, we must assume that the transformation to hexago-nal selenium has occurred only to some extent at roomtemperature in our samples. This is this part of the samplethat is detected by XRD.
4.1. Se associated to defects
The number of Se first neighbours is larger than 2 inall samples and the interchain connections are differentfrom the bulk one in Se50. An increase in the nearestnumber of neighbours has been already experimentallyobserved in amorphous Se [29]. The value was 2.15 inagreement with molecular-dynamics calculations provid-
ing a value of 2.17 at 350 K [12]. In crystalline Se, exis-tence of defects has been invoked to account for morethan two nearest Se. For example, [11], the authors founda structural defect along the chain, called C1–C3 valencealternating pair where Se atoms are threefold-coordi-nated. Another type of stable defect is described by Hohland Jones [12] where Se is fourfold-coordinated. Inmechanically-milled Se [30], before reaching the amorph-ization, an interchain covalent bond is assumed whichforms threefold-coordinated Se sites. Such a picture mightbe valid for bulk Se, Se50 and Se23, since it correspondsnot only to a larger Se nearest-neighbour number but alsoto connections between the chains different from the bulkones. The interchain distance of 2.90 A in Se50 supportssuch a picture of chains closer because connected via adefect.
Assuming threefold-coordinated Se, the proportion, x,of normally coordinated Se can be deduced by writing thatthe measured number of Se nearest-neighbour =2x + 3(1 � x). This gives 70% of twofold-coordinated Sein pure Se and could be another evidence of amorphousSe co-existing with crystallized Se as discussed in the begin-ning of this section.
The broad peaks observed on the diffractogram for Se50lead to trigonal domains of average size 250 A. An amor-phous contribution is probably present but not clearlydetected by XRD because of the presence of carbon nano-tubes. By XAS, only one neighbour instead of two isdetected at 3.74 A, thus one can assume that only 50% ofSe is crystallized in the trigonal form, the other 50% of con-fined Se are due to defective chains with some threefold
J. Chancolon et al. / Journal of Non-Crystalline Solids 352 (2006) 99–108 107
coordinated Se. The value of Se nearest-neighbours leadsto only 30% twofold-coordinated Se.
For Se23, an assumption of threefold coordinated Se isno longer valid where fourfold-coordinated Se atoms mustbe invoked, leading to only 40% of twofold-coordinated Se.With the same assumption in the Se12, there is 70% of two-fold-coordinated Se. In this last sample, Se is in form ofrings as shown by comparison between calculated andexperimental Fourier transforms. Thus a fourfold-coordi-nated Se might be interpreted in terms of inter-ring connec-tions. The existence of this defect in Se23 could be anindication of the occurrence of rings, yet very disorderedsince no signal is observed in the Fourier transform forlarge R values.
4.2. Se–C bonds
C neighbours appear for tubes with average diameter of23 and 12 A. Se–C chemical bonds exist in carbon disele-nide or in complex molecules, such as selenate reductase[15]. Different C number and Se–C distance can be foundin other systems: 0.3 at 1.74 A and 0.4 at 1.94 A [28], 2 at1.96 A and 1 at 2.93 A [31]. In Se12 and Se23, the numberof C at short distance, about 1.8 A, is larger than 2(respectively 4.2 and 3.1). The large number of C neigh-bours for Se12 suggests that Se atoms should be locatedin the middle of the C hexagons forming the tube, orslightly higher than this position. This configurationshould provide 6 C neighbours for each Se. The fact thatthey are only 3 C at 1.8 A in Se23 and 4 in Se12 could indi-cate that only 50% and 60% of Se, respectively, is in such asite.
During the filling process of this type of thin tubes, it hasbeen shown that Se can be placed in the interstitial volumeof the nanotubes bundles. This interstitial free volumeshave diameters of about 3–4 A, one Se located in the centerof such a channel is thus at about 3–3.5 A of C atoms, thesecond Se–C bond length identified in Se12. Channelsbetween the nanotubes do not exist in Se23, this might bethe reason why in this sample no Se–C contribution at3.42 A is found.
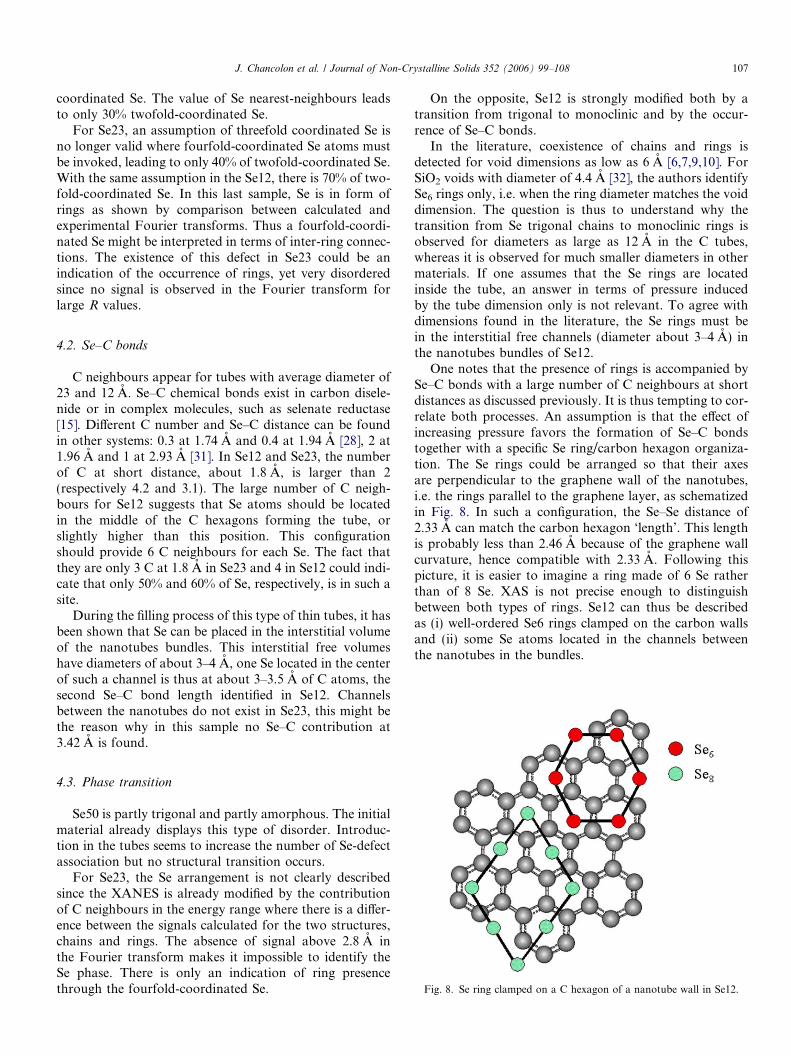
Fig. 8. Se ring clamped on a C hexagon of a nanotube wall in Se12.
4.3. Phase transition
Se50 is partly trigonal and partly amorphous. The initialmaterial already displays this type of disorder. Introduc-tion in the tubes seems to increase the number of Se-defectassociation but no structural transition occurs.
For Se23, the Se arrangement is not clearly describedsince the XANES is already modified by the contributionof C neighbours in the energy range where there is a differ-ence between the signals calculated for the two structures,chains and rings. The absence of signal above 2.8 A inthe Fourier transform makes it impossible to identify theSe phase. There is only an indication of ring presencethrough the fourfold-coordinated Se.
On the opposite, Se12 is strongly modified both by atransition from trigonal to monoclinic and by the occur-rence of Se–C bonds.
In the literature, coexistence of chains and rings isdetected for void dimensions as low as 6 A [6,7,9,10]. ForSiO2 voids with diameter of 4.4 A [32], the authors identifySe6 rings only, i.e. when the ring diameter matches the voiddimension. The question is thus to understand why thetransition from Se trigonal chains to monoclinic rings isobserved for diameters as large as 12 A in the C tubes,whereas it is observed for much smaller diameters in othermaterials. If one assumes that the Se rings are locatedinside the tube, an answer in terms of pressure inducedby the tube dimension only is not relevant. To agree withdimensions found in the literature, the Se rings must bein the interstitial free channels (diameter about 3–4 A) inthe nanotubes bundles of Se12.
One notes that the presence of rings is accompanied bySe–C bonds with a large number of C neighbours at shortdistances as discussed previously. It is thus tempting to cor-relate both processes. An assumption is that the effect ofincreasing pressure favors the formation of Se–C bondstogether with a specific Se ring/carbon hexagon organiza-tion. The Se rings could be arranged so that their axesare perpendicular to the graphene wall of the nanotubes,i.e. the rings parallel to the graphene layer, as schematizedin Fig. 8. In such a configuration, the Se–Se distance of2.33 A can match the carbon hexagon ‘length’. This lengthis probably less than 2.46 A because of the graphene wallcurvature, hence compatible with 2.33 A. Following thispicture, it is easier to imagine a ring made of 6 Se ratherthan of 8 Se. XAS is not precise enough to distinguishbetween both types of rings. Se12 can thus be describedas (i) well-ordered Se6 rings clamped on the carbon wallsand (ii) some Se atoms located in the channels betweenthe nanotubes in the bundles.
108 J. Chancolon et al. / Journal of Non-Crystalline Solids 352 (2006) 99–108
5. Conclusion
The short-range and long-range order for Se confined incarbon nanotubes of different average inner diameters hasbeen studied by XAS and XRD. Se in its initial structuralstate is partly made of ordered trigonal chains and partly ofamorphous Se. Introduction into tubes with average innerdiameter of 50 A seems to reduce the amount of orderedSe, the ordered part keeping the chain arrangement. Seatoms can be threefold coordinated in bulk Se, Se50 andSe23 that could be the proof of connected chains, theamount of defect-connected Se increasing when the tubediameter decreases. Part of the Se atoms is fourfold coordi-nated in Se12.
The main result is the occurrence of a structural transi-tion from chains to well-ordered rings in Se12 together withSe–C bonds. An interpretation of this transition in terms ofa pressure effect only leads to the conclusion that the innertube diameter is too large to induce such an effect. Thus,the part of Se in the form of rings must be located in thechannels between the nanotubes and the other part of theSe is connected to the C hexagon of the tube walls insidethem. If we consider that the structural transition and theSe–C bonds might be strongly connected, another picturecan be proposed. Se exists partly in the form of Se6 ringsclamped on the nanotube walls with Se atoms locatedabove the centre of each C hexagon giving rise to a well-ordered system. Another portion of the Se phase is locatedin the channels between the bundles. There is a competi-tion between Se–C and Se–Se bonds leading to this newstructural arrangement. If true, the Se electronic statedistribution and consequently the chemical and physicalproperties should be strongly modified. Indeed, a way todistinguish between the two possible Se organizationsshould be to perform high-resolution TEM and a comple-mentary EXAFS study on the partially filled carbonnanotubes, especially on Se12 sample. Moreover, XPSmeasurements should provide some supplementary infor-mation on the Se–C bonds clearly evidenced by XANES.
References
[1] M.S. Dresselhaus, G. Dresselhaus, P. Avouris (Eds.), CarbonNanotubes, Synthesis, Structure, Properties and Applications, Topicsin Applied Physics, vol. 80, Springer, Berlin, 2001.
[2] J. Sloan, M.L.H. Green, Hanbook Nanostruct. Mater. Nanotechnol.5 (2000) 407.
[3] A. Loiseau, H. Pascard, Chem. Phys. Lett. 256 (1996) 246.[4] R. Keller, W.P. Holzapfel, H. Schulz, Phys. Rev. B 16 (1977) 4404.[5] G. Parthasarathy, W.B. Holzapfel, Phys. Rev. B 38 (1988) 10105.[6] L. Khouchaf, M.H. Tuilier, J.L. Guth, B. Elouad, J. Phys. Chem.
Solids 57 (1996) 251.[7] V. Poborchii, A. Kobolov, H. Oyanagi, S. Romanov, K. Tanaka,
Nanostruct. Mater. 10 (1998) 427.[8] J.B. Parise, J. McDouglas, N. Herron, R. Farlee, A.W. Sleight, Y.
Wang, T. Bein, K. Moller, L.M. Moroley, Inorg. Chem. 27 (1988)221.
[9] A. Goldbach, M.L. Saboungi, Eur. Phys. J. E 12 (2003) 185.[10] I.L. Li, P. Launois, Z.K. Tang, Appl. Surf. Sci. 226 (2004) 36.[11] A.A. Demkov, O.F. Sankey, J. Phys. Cond. Mat. 13 (2001) 10433.[12] D. Hohl, R.O. Jones, Phys. Rev. B 43 (1991) 3856.[13] J. Chancolon, A. Pineau, F. Achaimbault, S. Bonnamy, Fullerenes
Nanotubes Carbon Nanostruct. 13 (2005) 189.[14] J. Chancolon, A. Pineau, F. Archaimbault, S. Bonnamy, J. Nanosci.
Nanotechnol. 6 (2006) 1.[15] M.J. Maher, J. Santini, I.J. Pickering, R.C. Prince, J.M. Macy, G.N.
George, Inorg. Chem. 43 (2004) 402.[16] B.M. Powell, B.H. Torrie, Acta Cryst. C39 (1983) 963.[17] Z. Iqbal, S.T. Correale, F. Reidinger, R.H. Baughman, J. Chem.
Phys. 88 (1988) 4492.[18] Y. Soneda, K. Szostak, S. Delpeux, S. Bonnamy, F. Beguin,
Electronic Properties of Molecular Nanostructures, in: H. Kuzmany,J. Fink, M. Mehring, S. Roth (Eds.), AIP Conference Proceedings,vol. 591, 2001, p. 199.
[19] S. Iijima, Nature 354 (1991) 56.[20] J. Chancolon, R.J.M. Pellenq, C. Bichara, A. Pineau, F. Archaimba-
ult, S. Bonnamy, Langmuir, submitted for publication.[21] A. Michalowicz (Ed.), Logiciels pour la Chimie, Soc. Francaise de
Chimie, Paris, 1991, p. 102.[22] J. Mustre de Leon, J.J. Rehr, S.I. Sabinski, R.C. Albers, Phys. Rev. B
44 (1991) 4146.[23] M. Newville, J. Synchrotron Rad. 8 (2001) 322.[24] A.L. Ankudinov, B. Ravel, J.J. Rehr, S.D. Conradson, Phys. Rev. B
58 (1998) 7565.[25] T. Roisnel, J. Rodriguez-Carvajal, Win PLOTR: a Windows tool for
powder diffraction patterns analysis, Materials Science Forum, in: R.Delhez, E.J. Mittenmeijer (Eds.), Proceedings of the Seventh Euro-pean Powder Diffraction Conference (EPDIC 7), 2000, p. 118.
[26] J. Rodriguez-Carvajal, FULLPROF: A Program for Rietveld Refine-ment and Pattern Matching Analysis, Abstract of the SatelliteMeeting on Powder Diffraction of the XV Congress of the IUCr,Toulouse, France, 1990, p. 127.
[27] P. Cherin, P. Unger, Inorg. Chem. 6 (1967) 1589.[28] M.M. Lamoureux, J. Craig Hutton, D.L. Styris, Spectrom. Acta Part
B 53 (1998) 993.[29] A. Kolobov, H. Oyanagi, K. Tanaka, K. Tanaka, Phys. Rev. B 55
(1997) 726.[30] H. Zhao, K. Lu, T. Liu, J. Non-Cryst. Solids 333 (2004) 246.[31] M. Gnida, R. Ferner, L. Gremer, O. Meyer, W. Meyer-Klaucke,
Biochemistry 42 (2003) 222.[32] G. Winrsberger, H.P. Fritzer, R. Zink, A. Popitsch, B. Pillep, P.
Behrens, J. Phys. Chem. 103 (1999) 5797.