Pressure study of monoclinic Re O2 up to 1.2 GPa using X-ray absorption spectroscopy and X-ray...
10
electronic reprint Journal of Synchrotron Radiation ISSN 0909-0495 Editors: G. Ice, A ˚ . Kvick and T. Ohta Pressure study of monoclinic ReO 2 up to 1.2 GPa using X-ray absorption spectroscopy and X-ray diffraction Fabio Furlan Ferreira, Hamilton P. S. Corrˆ ea, Marcos T. D. Orlando, Jos´ e L. Passamai, C´ ıntia G. P. Orlando, Isabela P. Cavalcante, Fl´ avio Garcia, Edilson Tamura, Luis G. Martinez, Jesualdo L. Rossi and Francisco C. L. de Melo J. Synchrotron Rad. (2009). 16, 48–56 Copyright c International Union of Crystallography Author(s) of this paper may load this reprint on their own web site or institutional repository provided that this cover page is retained. Republication of this article or its storage in electronic databases other than as specified above is not permitted without prior permission in writing from the IUCr. For further information see http://journals.iucr.org/services/authorrights.html Synchrotron radiation research is rapidly expanding with many new sources of radiation being created globally. Synchrotron radiation plays a leading role in pure science and in emerging technologies. The Journal of Synchrotron Radiation provides comprehensive coverage of the entire field of synchrotron radiation research including instrumentation, theory, computing and scientific applications in areas such as biology, nanoscience and materials science. Rapid publication ensures an up-to-date information resource for sci- entists and engineers in the field. Crystallography Journals Online is available from journals.iucr.org J. Synchrotron Rad. (2009). 16, 48–56 Fabio Furlan Ferreira et al. · Pressure study of monoclinic ReO 2
Transcript of Pressure study of monoclinic Re O2 up to 1.2 GPa using X-ray absorption spectroscopy and X-ray...

electronic reprintJournal of
SynchrotronRadiation
ISSN 0909-0495
Editors: G. Ice, A. Kvick and T. Ohta
Pressure study of monoclinic ReO2 up to 1.2 GPa using X-rayabsorption spectroscopy and X-ray diffraction
Fabio Furlan Ferreira, Hamilton P. S. Correa, Marcos T. D. Orlando, Jose L.Passamai, Cıntia G. P. Orlando, Isabela P. Cavalcante, Flavio Garcia,Edilson Tamura, Luis G. Martinez, Jesualdo L. Rossi and Francisco C. L. deMelo
J. Synchrotron Rad. (2009). 16, 48–56
Copyright c© International Union of Crystallography
Author(s) of this paper may load this reprint on their own web site or institutional repository provided thatthis cover page is retained. Republication of this article or its storage in electronic databases other than asspecified above is not permitted without prior permission in writing from the IUCr.
For further information see http://journals.iucr.org/services/authorrights.html
Synchrotron radiation research is rapidly expanding with many new sources of radiationbeing created globally. Synchrotron radiation plays a leading role in pure science andin emerging technologies. The Journal of Synchrotron Radiation provides comprehensivecoverage of the entire field of synchrotron radiation research including instrumentation,theory, computing and scientific applications in areas such as biology, nanoscience andmaterials science. Rapid publication ensures an up-to-date information resource for sci-entists and engineers in the field.
Crystallography Journals Online is available from journals.iucr.org
J. Synchrotron Rad. (2009). 16, 48–56 Fabio Furlan Ferreira et al. · Pressure study of monoclinic ReO2
research papers
48 doi:10.1107/S0909049508036029 J. Synchrotron Rad. (2009). 16, 48–56
Journal of
SynchrotronRadiation
ISSN 0909-0495
Received 31 December 2007
Accepted 3 November 2008
# 2009 International Union of Crystallography
Printed in Singapore – all rights reserved
Pressure study of monoclinic ReO2 up to 1.2 GPausing X-ray absorption spectroscopy and X-raydiffraction
Fabio Furlan Ferreira,a* Hamilton P. S. Correa,b Marcos T. D. Orlando,c
Jose L. Passamai Jr,c Cıntia G. P. Orlando,c Isabela P. Cavalcante,b Flavio Garcia,a
Edilson Tamura,a Luis G. Martinez,d Jesualdo L. Rossid and Francisco C. L. de Meloe
aLaboratorio Nacional de Luz Sıncrotron, Caixa Postal 6192, CEP 13083-970, Campinas, SP, Brazil,bCCET, UFMS, CEP 79070-900, Campo Grande, MS, Brazil, cCCE, Departamento de Fısica
e Quımica – UFES, av. Fernando Ferrari 514, CEP 29075-910, Vitoria, ES, Brazil, dInstituto de
Pesquisas Energeticas e Nucleares – IPEN, Av. Professor Lineu Prestes 2242, CEP 05508-000, Sao
Paulo, SP, Brazil, and eCentro Tecnico Aeroespacial – IEA, Pca. Marechal-do-ar Eduardo Gomes
50, CEP 12228-904, Sao Jose dos Campos, SP, Brazil. E-mail: [email protected]
The crystal and local atomic structure of monoclinic ReO2 (�-ReO2) under
hydrostatic pressure up to 1.2 GPa was investigated for the first time using both
X-ray absorption spectroscopy and high-resolution synchrotron X-ray powder
diffraction and a home-built B4C anvil pressure cell developed for this purpose.
Extended X-ray absorption fine-structure (EXAFS) data analysis at pressures
from ambient up to 1.2 GPa indicates that there are two distinct Re—Re
distances and a distorted ReO6 octahedron in the �-ReO2 structure. X-ray
diffraction analysis at ambient pressure revealed an unambiguous solution for
the crystal structure of the �-phase, demonstrating a modulation of the Re—Re
distances. The relatively small portion of the diffraction pattern accessed in the
pressure-dependent measurements does not allow for a detailed study of the
crystal structure of �-ReO2 under pressure. Nonetheless, a shift and reduction
in the (011) Bragg peak intensity between 0.4 and 1.2 GPa is observed, with
correlation to a decrease in Re—Re distance modulation, as confirmed by
EXAFS analysis in the same pressure range. This behavior reveals that �-ReO2
is a possible inner pressure gauge for future experiments up to 1.2 GPa.
Keywords: X-ray diffraction; pressure; EXAFS; ReO2.
1. Introduction
ReO2 ([Xe]4f145d3 configuration) is observed in two crystal
forms: monoclinic (�-ReO2) and orthorhombic (�-ReO2). �-ReO2 is metastable and suffers an irreversible transformation
to �-ReO2 above 733 K (Colaıtis & Lecaille, 1972). The crystal
sizes obtained under typical production conditions for �-ReO2
are not large enough for single-crystal analysis. Both ReO2
variants exhibit metallic conductivity and Pauli para-
magnetism (Goodenough et al., 1965).
The main interest in the study of �-ReO2 is to stabilize
synthesis of the ceramic superconductor phase Hg1–xRex-
Ba2Ca2Cu3O8+�. This superconductor compound exhibits the
highest transition temperature ever reported, i.e. Tc = 135 K at
atmospheric pressure, and is considered the best candidate for
technological applications (Passos et al., 2006). �-ReO2 is used
in the synthesis of Hg1–xRexBa2Ca2Cu3O8+� to reduce the
formation and stabilization of the undesired HgCaO2 phase
(Sin et al., 1998). The metastable �-ReO2 reacts with CaO at
713 K to form Ca5Re2O12, avoiding the formation of HgCaO2
at 903 K (Cunha et al., 2001).
The structures of rhenium oxides were extensively studied
by Magneli (1957), who pointed to the existence of the Re—
Re bond, which greatly influences the arrangement of ReO6
octahedra and the physical properties of rhenium oxides.
Magneli (1957) also fully determined the �-ReO2 structure
from single-crystal analysis. The structure of �-ReO2 was only
proposed in papers based on polycrystalline samples (Colaıtis
& Lecaille, 1972). The proposed structure for �-ReO2
resembles that of MoO2 with slightly modified parameters, as
originally proposed by Zachariasen (1951), and based on the
great similarity between these two oxides.
There is only one entry for �-ReO2 in the Inorganic Crystal
Structure Database (ICSD card #151412), which was deter-
mined by Correa et al. (2004). The �-ReO2 crystal structure
belongs to the monoclinic space group P21/c, with lattice
parameters a = 5.615 (3) A, b = 4.782 (2) A, c = 5.574 (2) A
and � = 120.13 (1)� (Correa et al., 2004; Correa, 2001). On the
electronic reprint
other hand, the �-ReO2 structure, with space group Pbcn and
lattice parameters a = 4.8094 (5) A, b = 5.6433 (5) A and c =
4.6007 (5) A (ICSD card #24060), similarly to the PbO2-type
structure, has Re atoms in a quincunx configuration, with four
atoms at the corners and the fifth at the center. The rhenium
atoms are equally spaced, with an Re—Re distance of 2.61 A
(Goodenough et al., 1965).
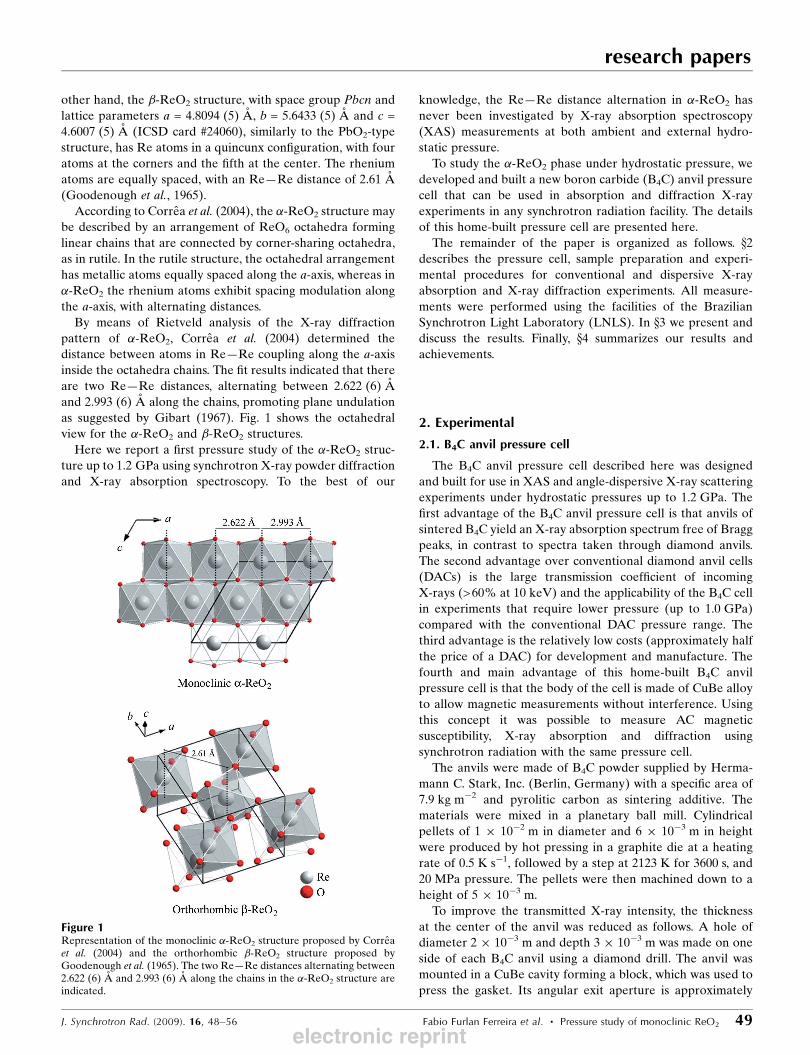
According to Correa et al. (2004), the �-ReO2 structure may
be described by an arrangement of ReO6 octahedra forming
linear chains that are connected by corner-sharing octahedra,
as in rutile. In the rutile structure, the octahedral arrangement
has metallic atoms equally spaced along the a-axis, whereas in
�-ReO2 the rhenium atoms exhibit spacing modulation along
the a-axis, with alternating distances.
By means of Rietveld analysis of the X-ray diffraction
pattern of �-ReO2, Correa et al. (2004) determined the
distance between atoms in Re—Re coupling along the a-axis
inside the octahedra chains. The fit results indicated that there
are two Re—Re distances, alternating between 2.622 (6) A
and 2.993 (6) A along the chains, promoting plane undulation
as suggested by Gibart (1967). Fig. 1 shows the octahedral
view for the �-ReO2 and �-ReO2 structures.
Here we report a first pressure study of the �-ReO2 struc-
ture up to 1.2 GPa using synchrotron X-ray powder diffraction
and X-ray absorption spectroscopy. To the best of our
knowledge, the Re—Re distance alternation in �-ReO2 has
never been investigated by X-ray absorption spectroscopy
(XAS) measurements at both ambient and external hydro-
static pressure.
To study the �-ReO2 phase under hydrostatic pressure, we
developed and built a new boron carbide (B4C) anvil pressure
cell that can be used in absorption and diffraction X-ray
experiments in any synchrotron radiation facility. The details
of this home-built pressure cell are presented here.
The remainder of the paper is organized as follows. x2describes the pressure cell, sample preparation and experi-
mental procedures for conventional and dispersive X-ray
absorption and X-ray diffraction experiments. All measure-
ments were performed using the facilities of the Brazilian
Synchrotron Light Laboratory (LNLS). In x3 we present and
discuss the results. Finally, x4 summarizes our results and
achievements.
2. Experimental
2.1. B4C anvil pressure cell
The B4C anvil pressure cell described here was designed
and built for use in XAS and angle-dispersive X-ray scattering
experiments under hydrostatic pressures up to 1.2 GPa. The
first advantage of the B4C anvil pressure cell is that anvils of
sintered B4C yield an X-ray absorption spectrum free of Bragg
peaks, in contrast to spectra taken through diamond anvils.
The second advantage over conventional diamond anvil cells
(DACs) is the large transmission coefficient of incoming
X-rays (>60% at 10 keV) and the applicability of the B4C cell
in experiments that require lower pressure (up to 1.0 GPa)
compared with the conventional DAC pressure range. The
third advantage is the relatively low costs (approximately half
the price of a DAC) for development and manufacture. The
fourth and main advantage of this home-built B4C anvil
pressure cell is that the body of the cell is made of CuBe alloy
to allow magnetic measurements without interference. Using
this concept it was possible to measure AC magnetic
susceptibility, X-ray absorption and diffraction using
synchrotron radiation with the same pressure cell.
The anvils were made of B4C powder supplied by Herma-
mann C. Stark, Inc. (Berlin, Germany) with a specific area of
7.9 kg m�2 and pyrolitic carbon as sintering additive. The
materials were mixed in a planetary ball mill. Cylindrical
pellets of 1 � 10�2 m in diameter and 6 � 10�3 m in height
were produced by hot pressing in a graphite die at a heating
rate of 0.5 K s�1, followed by a step at 2123 K for 3600 s, and
20 MPa pressure. The pellets were then machined down to a
height of 5 � 10�3 m.
To improve the transmitted X-ray intensity, the thickness
at the center of the anvil was reduced as follows. A hole of
diameter 2 � 10�3 m and depth 3 � 10�3 m was made on one
side of each B4C anvil using a diamond drill. The anvil was
mounted in a CuBe cavity forming a block, which was used to
press the gasket. Its angular exit aperture is approximately
research papers
J. Synchrotron Rad. (2009). 16, 48–56 Fabio Furlan Ferreira et al. � Pressure study of monoclinic ReO2 49
Figure 1Representation of the monoclinic �-ReO2 structure proposed by Correaet al. (2004) and the orthorhombic �-ReO2 structure proposed byGoodenough et al. (1965). The two Re—Re distances alternating between2.622 (6) A and 2.993 (6) A along the chains in the �-ReO2 structure areindicated.
electronic reprint

30� 2�. Fig. 2 shows a schematic drawing of the pressure cell
and gaskets.
Hydrostatic pressure conditions were obtained by filling the
CuBe gasket hole (2 � 10�3 m in diameter and 0.45 � 10�3 m
thick) with a mineral oil/n-pentanol mixture (1/1). The inner
pressure was calibrated using a superconducting Hg0.8Re0.2-
Ba2Ca2Cu3O8.8 (Hg,Re-1223) manometer placed in the gasket
cavity and mounted in the inner gasket border, forming a ring
outside the X-ray beam spot (Fig. 2). For X-ray diffraction
experiments the sample was placed in the center of this
superconductor ring. The gasket set-up was improved for XAS
measurements (Fig. 2) by addition of an extra ReO3 inner
pressure gauge. The inner hydrostatic pressure is linearly
dependent on the critical superconducting temperature in
the optimal oxygen-doped Hg,Re-1223 superconductor, with
dTc /dP = 1.9 GPa K�1, as described by Orlando et al. (2006;
Fig. 3 therein), de Mello et al. (2002) and Orlando et al. (2000).
The B4C anvil cell was submitted to thermal variation from
300 K to 77 K to measure the AC magnetic susceptibility as
a function of temperature and to determine the critical
temperature. The inner pressure did not change during the
thermal cycle according to measurements of Tc with an
accuracy of 0.05 K corresponding to 0.1 GPa.
2.2. Sample preparation
The �-ReO2 powder was purchased from AlfaAesar
(#62109, 99.9% pure). The powder was mechanically crushed
very carefully in an agate mortar inside an argon-filled
(99.999%) glove box. X-ray diffraction patterns of as-
purchased and crushed powder samples showed the same
monoclinic structure of �-ReO2. The crushed powder, with a
particle size of less than 20 � 10�6 m, was stored in several
sealed argon-filled (99.999%) quartz tubes to avoid atmo-
spheric contamination before use in experiments.
2.3. Conventional XAS
The local ReO6 octahedral oxygen coordination was
investigated by extended X-ray absorption fine structure
(EXAFS) using the D04B-XAFS1 beamline (Tolentino et al.,
2001) for cubic ReO3 (ICDD card #03-065-7483) and mono-
clinic �-ReO2 powdered samples. Ex situ measurements were
recorded three times at the Re LIII-edge (10.535 keV) in
transmission mode at room temperature and averaged. The
monochromator was a channel-cut Si(111) (2d = 6.271 A)
crystal. Energy calibration was carried out using the first
inflection point of the XANES spectrum of Pt (LIII-edge
11.564 keV), Zn (K-edge 9.659 keV) and Ta (LIII-edge
9.881 keV) foils as references.
2.4. Dispersive XAS
To further investigate the ReO6 octahedral oxygen coor-
dination, dispersive X-ray measurements were performed for
cubic ReO3 and �-ReO2 at the Re LIII-edge from ambient
pressure up to 1.2 GPa.
The energy-dispersive XAS beamline (D06B-DXAS) of
LNLS is installed using a dipole source and the optics
combines a vertical focusing mirror and a Bragg dispersive
geometry, which together focus the polychromatic beam to a
spot area of 0.3� 10�3 m� 0.3� 10�3 m and a focus depth of
150 � 10�6 m. Vertical focusing is provided by a 60 nm-thick
Rh-coated mirror working at a grazing angle of 3.8 mrad,
which focuses the beam on the bent (111) silicon crystal. The
polychromator uses a 1.8 � 10�3 m-thick Si(111) rectangular
crystal mounted in a mechanical set-up that bends the crystal
to a curvature radius varying from 3 to 10 m requiring
displacement of approximately 2.3 � 10�3 m at the actuator
position. At a focusing ratio of 9.75:1 with Si(111) working
at 10.500 keV, the curvature radius R is 9.158 m, L0 /R is
21.22 mrad, and the bend angle is 0.113 mrad (Tolentino et al.,
2005). The full spectrum of the transmitted beam is collected
by a CCD-based position-sensitive detector in a few tens of
milliseconds. A Princeton Instruments model ST-133 high-
performance CCD camera controller in conjunction with a
PI-MAX camera provides a data transfer rate of up to
1 Mpixel s�1. The energy resolution for the standard geometry
is 2 eV pixel�1 and can reach 0.46 eV pixel�1 for an optimal
geometry. The CCD camera system contains a front-illumi-
nated scientific grade 1 MPP CCD with 1340 � 1300 pixels,
20 � 10�6 m � 20 � 10�6 m pixel�1, covering a total image
area of 26.8 � 10�3 m � 26.0 � 10�3 m, and is cryogenically
cooled for lower readout noise (Tolentino et al., 2005). A
GdOS phosphor screen, optimized for 8 keV X-rays, receives
the incoming beam at an angle of 20� and converts the X-rays
research papers
50 Fabio Furlan Ferreira et al. � Pressure study of monoclinic ReO2 J. Synchrotron Rad. (2009). 16, 48–56
Figure 2Schematic drawing of the B4C anvil pressure cell with the followingdetails: (a) non-magnetic CuBe cell body, (b) B4C anvil, (c) external coil(AC magnetic field generator), (d) CuBe gasket and (e) pickup coil. Inboth B4C anvils the largest (smallest) diameter is 8 � 10�3 m (4 �10�3 m). The gasket set-up for X-ray absorption fine structure (XAFS)measurements had ReO3 and �-ReO2 inside the hole, while the set-up fordiffraction had only �-ReO2. In both cases there was an O-ring made ofHg0.8Re0.2Ba2Ca2Cu3O8.8 (Hg, Re-1223) superconductor around thegasket hole wall.
electronic reprint

to visible light. A set of lenses guides the light to the CCD
detector with a demagnification factor of 1.75, so that the real
pixel at the phosphor screen is 35 � 10�6 m � 35 � 10�6 m
wide. In fact, the resolution measured in the dispersion
direction was approximately 2.5- to three-fold this pixel size,
i.e. 100 � 10�6 m2, limited by the phosphor screen size. To
improve this resolution, the phosphor screen was covered with
a thinner deposited film.
For in situ studies under extreme conditions such as high
pressure, the small spot size of the focal point offers experi-
mental advantages compared with conventional XAS, because
it avoids photon loss through the small gasket holes normally
used in high-pressure cells, which are typically smaller than the
spot size. Moreover, the capability of acquiring an almost real-
time spectrum is very helpful in the alignment of this type of
cell, allowing the elimination of possible spurious features in
spectra owing to the pressure cell windows. By installing the
B4C anvil pressure cell at the focal point, it was possible to
study the ReO6 octahedral oxygen coordination in cubic ReO3
and �-ReO2 under the same hydrostatic pressure at the Re
LIII-edge using the arrangement shown in Fig. 2.
2.5. X-ray diffraction
High-resolution and high-intensity synchrotron X-ray
diffraction data were collected at the XPD beamline placed
after the D10B bending-magnet source of LNLS (Ferreira et
al., 2006). X-rays of wavelength 1.19197 (3) Awere selected by
a double-bounce Si(111) monochromator, with water cooling
of the first crystal and the second one bent for sagittal focusing
(Giles et al., 2003). The beam is vertically focused or colli-
mated by a bent Rh-coated ultralow-expansion glass mirror
placed before the monochromator, which also provides
filtering of high-energy photons (third- and higher-order
harmonics). A vertically focused beam was used in the
experiments, delivering at 7.0 keV a flux of �6 �1010 photons s�1 at 100 mA in a spot of �1 � 10�3 m
(vertical) � �2 � 10�3 m (horizontal) at the sample position.
Experiments were performed in the vertical scattering plane,
i.e. perpendicular to the linear polarization of the incident
photons. The wavelength was determined from several well
defined reflections of the NIST SRM640c silicon standard. The
diffracted beam was detected with a Na(Tl)I scintillation
counter with a pulse-height discriminator. The intensity of the
incoming beam was also monitored by a scintillation counter
for normalization of the decay of the primary beam. In this
parallel-beam configuration the resolution is determined by
the slits in front of the detector. The powder samples were
loaded into the CuBe pressure cell, which was kept at an
incident angle of 8�, and data were recorded at room
temperature for 40 s in steps of 0.02� between 15� and 29� (2�).To reassess the �-ReO2 crystal structure, a high-resolution
synchrotron X-ray powder diffraction measurement was
performed at ambient pressure with X-rays of 1.24000 (3) A
using a Ge(111) analyzer crystal. The powder diffraction
pattern was analyzed by the Rietveld method using the
General Structure Analysis System (GSAS) (Larson & Von
Dreele, 2001) program and its graphical user interface
EXPGUI (Toby, 2001). The background was fit using a 14-
term shifted Chebyschev function. The peak profile was
modeled by a pseudo-Voigt profile function as parameterized
by Thompson et al. (1987) with asymmetry corrections by
Finger et al. (1994) and microstrain anisotropic broadening
terms by Stephens (1999).
3. Results and discussion
3.1. Synchrotron X-ray powder diffraction
The diffraction pattern and the Rietveld analysis fit shown
in Fig. 3 exhibit three phases. Besides a major �-ReO2 phase,
ReO3 (P4/mbm, ICSD card #77680) and �-ReO2 phases are
evident in smaller amounts. The phase quantification results
are 78.90 (4)%, 18.42 (9)% and 2.68 (4)% for �-ReO2, �-ReO2
and ReO3, respectively. The refined crystal structure para-
meters proposed and the reliability factors of the Rietveld
analysis for the �-ReO2 phase are presented in Table 1.1 The
results improve the structural description by Correa et al.
(2004) in terms of the precision of the Re atomic coordinates.
It can be observed from Fig. 4 that each O atom has three
first neighbors (Re atoms) forming a triangle that is coplanar
with the O atom. There is no closer Re neighbor normal to this
plane. As a consequence, the O atoms exhibit three sp2–�orbitals forming �-bonds and one p–� orbital available for a
�-bond. It is also evident that the �-ReO2 structure contains
ReO6 octahedron chains with common edges, whereby the
chains are reconnected by common peaks, thus forming fairly
straight chains along the a edge.
The rutile-type structure consists of linear chains of regular
octahedra, with metallic (Re) atoms equally shared inside
research papers
J. Synchrotron Rad. (2009). 16, 48–56 Fabio Furlan Ferreira et al. � Pressure study of monoclinic ReO2 51
Figure 3Rietveld plot for ReO2 from AlfaAesar (#62109, 99.9% pure) with anindication of the phases �-ReO2, �-ReO2 and ReO3. The inset shows the�-ReO2 (011) peak with the fitting result. High-resolution synchrotronX-ray powder diffraction at ambient pressure was performed with X-raysof wavelength 1.24000 (3) A using a Ge(111) analyzer crystal.
1 Supplementary data for this paper are available from the IUCr electronicarchives (Reference: WA5006). Services for accessing these data are describedat the back of the journal.
electronic reprint

them. �-ReO2, on the other hand,
exhibits a deformed rutile structure
of linear but wavy chains owing to
coupling among Re atoms, with Re—
Re distances alternating between 2.634
and 2.979 A, as shown in Table 2.
3.2. EXAFS analysis of a-ReO2 at
ambient pressure
The structural parameters of �-ReO2
proposed by Correa et al. (2004) and
those proposed here were confirmed by
XAS measurements performed at the
Re LIII-edge (10.535 keV) at ambient
pressure. Fig. 5 shows the EXAFS
signal of �-ReO2 at 50 eV above the
edge. The ReO2 used in this study came
from the same sample as that investi-
gated by Correa et al. (2004) by X-ray
powder diffraction (AlfaAesar #62109,
99.9% pure).
Data analyses of the EXAFS spectra were performed using
the ATOMS (Ravel, 2001), FEFF8 (Ankudinov et al., 1998)
and IFEFFIT (Newville, 2001) programs. The best goodness-
of-fit (R = 0.0066) was obtained using 68 fitting parameters, as
follows: a shift in threshold energy; an overall amplitude
factor; an overall constant phase; thermal factors for single
scattering from first-, second- and third-neighbor oxygen
atoms; thermal factors for single and multiple scattering from
first- and second-neighbor Re atoms; k-dependent phase
corrections for scattering by oxygen and by the absorber; and
the Re1—O—Re2 and Re2—O—Re1i bond angles. The range
research papers
52 Fabio Furlan Ferreira et al. � Pressure study of monoclinic ReO2 J. Synchrotron Rad. (2009). 16, 48–56
Table 2Comparison of distances (A) obtained by different authors in the �-ReO2
system.
Gibart(1967)
Correa etal. (2004)
XRPD(this work)
EXAFS(this work)
Re1—Re2 2.53 2.622 (6) 2.6336 (26) 2.542 (7)Re2—Re1i 3.14 2.993 (6) 2.9793 (26) 3.088 (8)
Symmetry code: (i) 1 + x, y, z.
Figure 5Experimental (circles) and fitted (blue line) ex situ EXAFS signal[�(k)k2] of �-ReO2 as a function of the wavenumber k. The ex situmeasurements were recorded in transmission mode at room temperature,with averaging over three independent scans at the Re LIII-edge(10.535 keV). The monochromator was a channel-cut Si(111) (2d =6.271 A) crystal. The energy calibration was carried out using the firstinflection point of the XANES spectrum of Pt (LIII-edge 11.564 keV), Zn(K-edge 9.659 keV) and Ta (LIII-edge 9.881 keV) foils as references. Thek range was 0.2 < k < 16.65 A�1, with Hanning window sills and 1024points in FFT.
Table 1Fit results from Rietveld analysis: crystallographic parameters [space group, cell dimensions,fractional coordinates (x, y, z), thermal parameters (Uiso) and some selected interatomic distances],goodness-of-fit indicator and R-factors for the proposed �-ReO2 structure.
Space group P21/cUnit-cell dimensions a = 5.61113 (15) A b = 4.80456 (9) A c = 5.54783 (17) A � = 120.272 (2)�
Cell volume 129.170 (6) A3
Z 4
Atom / Ox / Site x y z Uiso (A2)
Re / 4+ / 4(e) 0.23794 (20) �0.0026 (15) 0.00671 (26) 0.01831 (11)O1 / 2� / 4(e) 0.112 (5) 0.200 (5) 0.227 (4) 0.01831 (11)O2 / 2� / 4(e) 0.387 (5) 0.709 (5) 0.293 (4) 0.01831 (11)
Interatomic distances (A)Re—Rei 2.9793 (26) Re—O1ii 1.966 (23)Re—O1iii 1.979 (21) Re—O2iii 2.023 (29)Re—Reii 2.6336 (26) Re—O1 1.952 (28)Re—O2iv 2.085 (24) Re—O2v 1.952 (28)Rwp 9.82%RF
2 5.96%�2 1.768
Symmetry codes: (i) 1� x,�y,�z; (ii)�x,�y,�z; (iii) x, 0.5� y,�0.5 + z; (iv) 1� x,�0.5 + y, 0.5� z; (v) x,�1 + y, z.
Figure 4Two-dimensional view of �-ReO2 structure along the [010] and [100]directions. It exhibits a deformed rutile structure of linear but wavychains, with Re—Re distances alternating between 2.634 and 2.979 A.
electronic reprint
0.2 < k < 16.65 A�1, Hanning window sills and 1024 points
were considered in fast Fourier transforms (FFTs) for fitting.
The fit is graphically represented by the solid line in Fig. 5.
The single-scattering analyses revealed two distances
between the absorber and Re atoms located in outer shells.
The first distance is Re1—Re2 ! 2.542 (7) A (absorber !first outer rhenium shell) and the second is Re2—Re1i !3.088 (8) A, where the index (i) represents Re atoms in the
second outer Re shell [(i) 1 + x, y, z]. The EXAFS results are
in agreement with the existence of two distances indicated by
Correa et al. (2004) and first proposed by Gibart (1967). A
comparison of the results reported by Correa et al. (2004) and
Gibart (1967) and the EXAFS and XRPD results is presented
in Table 2.
The EXAFS fit also indicates a distortion in the ReO6
octahedron that is associated with three different distances
among rhenium and oxygen (Table 3). This distortion was also
pointed out by Gibart (1967) and can be justified by taking
into account that the Re ion is located in a site of lower
symmetry than D4h–C2h (outside the octahedron center). This
distortion is small and, according to the model of Brown &
Altermatt (1985), the oxygen configuration indicated in
Table 3 assigns a valence of +4 to the Re in �-ReO2. The
valence evaluation was confirmed by measurements of the
XANES edge shift compared with Re foil (LIII-edge
10.535 keV) and our calibration references (Pt LIII-edge
11.563 keV, Zn K-edge 9.659 keVand Ta LIII-edge 9.881 keV)
(Orlando et al., 2006).
3.3. Dispersive EXAFS under pressure
To verify the pressure performance of the B4C cell, the first
compound investigated under external hydrostatic pressure
was ReO3 powder of 99.9% purity obtained from Aldrich
(#38099-7). The ReO3 cubic perovskite is a well known pres-
sure-sensitive system owing to its second-order transition
(compressibility collapse), which occurs at approximately
0.5 GPa (Batlogg et al., 1984). The structure of ReO3 is Pm�33mup to 0.5 GPa (Jørgensen et al., 2004), above which it trans-
forms to Im�33, which is stable up to 2.8 GPa. Compression of
the low-pressure Pm�33m phase occurs via compression of Re—
O bonds (Jørgensen et al., 2004). However the Re—O—Re
bond angle changes at pressures between 0.6 and 2.8 GPa, as
observed by Houser & Ingalls (2000) in XAS and neutron
diffraction measurements.
XAS measurements of ReO3 at ambient pressure and 0.6,
0.8, 1.0 and 1.2 GPa were carried out at the D06B-DXAS
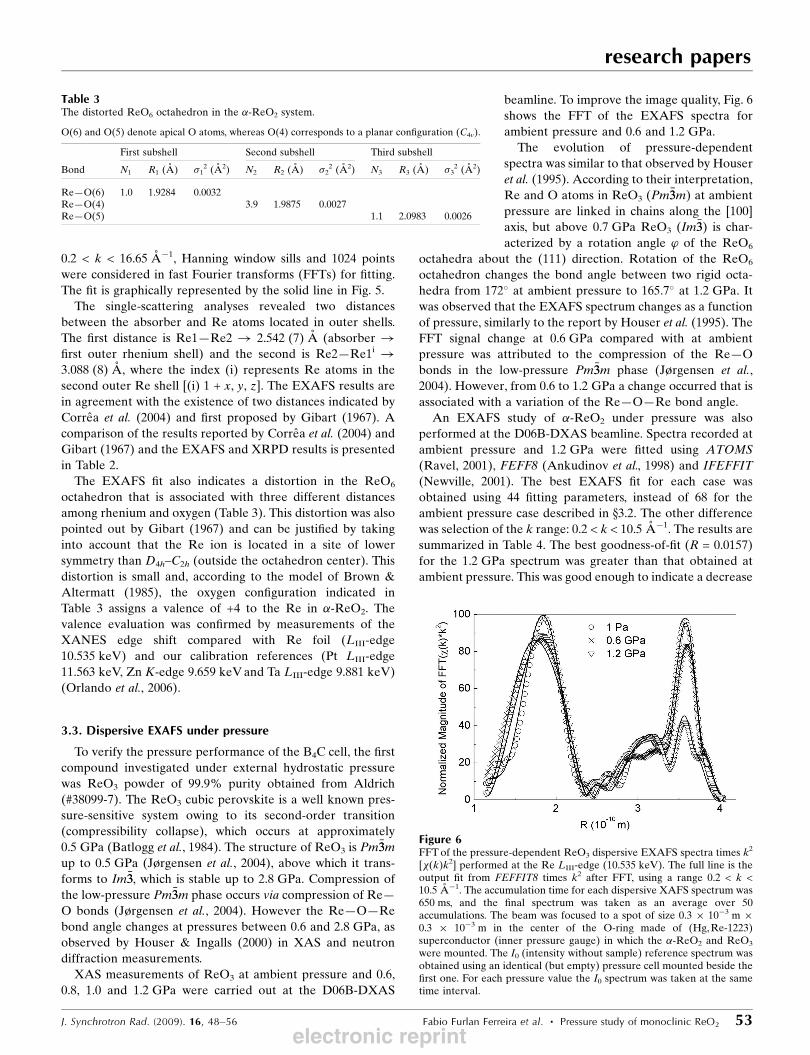
beamline. To improve the image quality, Fig. 6
shows the FFT of the EXAFS spectra for
ambient pressure and 0.6 and 1.2 GPa.
The evolution of pressure-dependent
spectra was similar to that observed by Houser
et al. (1995). According to their interpretation,
Re and O atoms in ReO3 (Pm�33m) at ambient
pressure are linked in chains along the [100]
axis, but above 0.7 GPa ReO3 (Im�33) is char-acterized by a rotation angle ’ of the ReO6
octahedra about the (111) direction. Rotation of the ReO6
octahedron changes the bond angle between two rigid octa-
hedra from 172� at ambient pressure to 165.7� at 1.2 GPa. It
was observed that the EXAFS spectrum changes as a function
of pressure, similarly to the report by Houser et al. (1995). The
FFT signal change at 0.6 GPa compared with at ambient
pressure was attributed to the compression of the Re—O
bonds in the low-pressure Pm�33m phase (Jørgensen et al.,
2004). However, from 0.6 to 1.2 GPa a change occurred that is
associated with a variation of the Re—O—Re bond angle.
An EXAFS study of �-ReO2 under pressure was also
performed at the D06B-DXAS beamline. Spectra recorded at
ambient pressure and 1.2 GPa were fitted using ATOMS
(Ravel, 2001), FEFF8 (Ankudinov et al., 1998) and IFEFFIT
(Newville, 2001). The best EXAFS fit for each case was
obtained using 44 fitting parameters, instead of 68 for the
ambient pressure case described in x3.2. The other difference
was selection of the k range: 0.2 < k < 10.5 A�1. The results are
summarized in Table 4. The best goodness-of-fit (R = 0.0157)
for the 1.2 GPa spectrum was greater than that obtained at
ambient pressure. This was good enough to indicate a decrease
research papers
J. Synchrotron Rad. (2009). 16, 48–56 Fabio Furlan Ferreira et al. � Pressure study of monoclinic ReO2 53
Figure 6FFTof the pressure-dependent ReO3 dispersive EXAFS spectra times k2
[�(k)k2] performed at the Re LIII-edge (10.535 keV). The full line is theoutput fit from FEFFIT8 times k2 after FFT, using a range 0.2 < k <10.5 A�1. The accumulation time for each dispersive XAFS spectrum was650 ms, and the final spectrum was taken as an average over 50accumulations. The beam was focused to a spot of size 0.3 � 10�3 m �0.3 � 10�3 m in the center of the O-ring made of (Hg,Re-1223)superconductor (inner pressure gauge) in which the �-ReO2 and ReO3
were mounted. The I0 (intensity without sample) reference spectrum wasobtained using an identical (but empty) pressure cell mounted beside thefirst one. For each pressure value the I0 spectrum was taken at the sametime interval.
Table 3The distorted ReO6 octahedron in the �-ReO2 system.
O(6) and O(5) denote apical O atoms, whereas O(4) corresponds to a planar configuration (C4v).
First subshell Second subshell Third subshell
Bond N1 R1 (A) �12 (A2) N2 R2 (A) �2
2 (A2) N3 R3 (A) �32 (A2)
Re—O(6) 1.0 1.9284 0.0032Re—O(4) 3.9 1.9875 0.0027Re—O(5) 1.1 2.0983 0.0026
electronic reprint
in the Re2—Re1i distance without changes in the Re—O
average distance, as shown in Fig. 7, which presents the FFTof
�-ReO2 �(k) times k2 [FFT �(k)k2] versus R (A).
The fitting results confirm that the lower symmetry of the
Re site in the octahedron (outside the center) was invariant up
to 1.2 GPa. However, the EXAFS spectrum fit using single-
and multiple-scattering paths revealed that the 1.2 GPa
configuration of �-ReO2 octahedra cannot be attributed to a
single rotation angle ’ for the ReO6 rigid body among the
octahedra. The �-ReO2 octahedral configuration at 1.2 GPa is
similar to �-ReO2 (Fig. 1) and indicates a decrease in the
Re2—Re1i distance.
3.4. X-ray diffraction under hydrostatic pressure
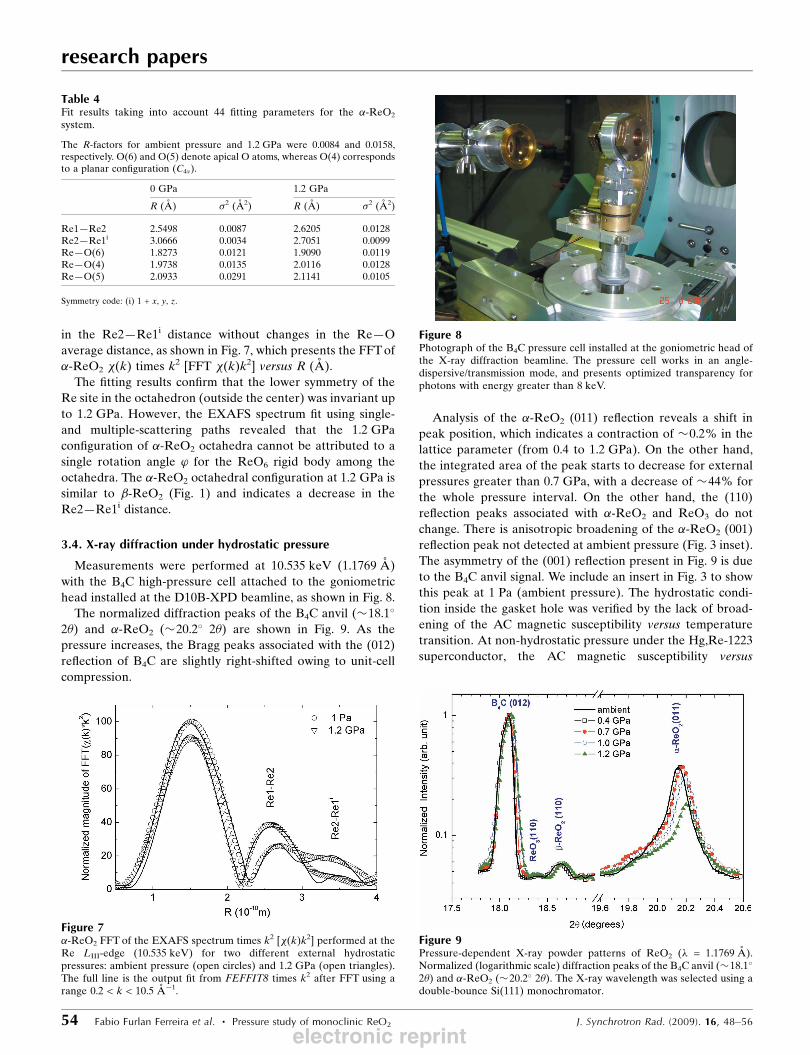
Measurements were performed at 10.535 keV (1.1769 A)
with the B4C high-pressure cell attached to the goniometric
head installed at the D10B-XPD beamline, as shown in Fig. 8.
The normalized diffraction peaks of the B4C anvil (�18.1�
2�) and �-ReO2 (�20.2� 2�) are shown in Fig. 9. As the
pressure increases, the Bragg peaks associated with the (012)
reflection of B4C are slightly right-shifted owing to unit-cell
compression.
Analysis of the �-ReO2 (011) reflection reveals a shift in
peak position, which indicates a contraction of �0.2% in the
lattice parameter (from 0.4 to 1.2 GPa). On the other hand,
the integrated area of the peak starts to decrease for external
pressures greater than 0.7 GPa, with a decrease of �44% for
the whole pressure interval. On the other hand, the (110)
reflection peaks associated with �-ReO2 and ReO3 do not
change. There is anisotropic broadening of the �-ReO2 (001)
reflection peak not detected at ambient pressure (Fig. 3 inset).
The asymmetry of the (001) reflection present in Fig. 9 is due
to the B4C anvil signal. We include an insert in Fig. 3 to show
this peak at 1 Pa (ambient pressure). The hydrostatic condi-
tion inside the gasket hole was verified by the lack of broad-
ening of the AC magnetic susceptibility versus temperature
transition. At non-hydrostatic pressure under the Hg,Re-1223
superconductor, the AC magnetic susceptibility versus
research papers
54 Fabio Furlan Ferreira et al. � Pressure study of monoclinic ReO2 J. Synchrotron Rad. (2009). 16, 48–56
Figure 8Photograph of the B4C pressure cell installed at the goniometric head ofthe X-ray diffraction beamline. The pressure cell works in an angle-dispersive/transmission mode, and presents optimized transparency forphotons with energy greater than 8 keV.
Figure 9Pressure-dependent X-ray powder patterns of ReO2 (� = 1.1769 A).Normalized (logarithmic scale) diffraction peaks of the B4C anvil (�18.1�
2�) and �-ReO2 (�20.2� 2�). The X-ray wavelength was selected using adouble-bounce Si(111) monochromator.
Figure 7�-ReO2 FFT of the EXAFS spectrum times k2 [�(k)k2] performed at theRe LIII-edge (10.535 keV) for two different external hydrostaticpressures: ambient pressure (open circles) and 1.2 GPa (open triangles).The full line is the output fit from FEFFIT8 times k2 after FFT using arange 0.2 < k < 10.5 A�1.
Table 4Fit results taking into account 44 fitting parameters for the �-ReO2
system.
The R-factors for ambient pressure and 1.2 GPa were 0.0084 and 0.0158,respectively. O(6) and O(5) denote apical O atoms, whereas O(4) correspondsto a planar configuration (C4v).
0 GPa 1.2 GPa
R (A) �2 (A2) R (A) �2 (A2)
Re1—Re2 2.5498 0.0087 2.6205 0.0128Re2—Re1i 3.0666 0.0034 2.7051 0.0099Re—O(6) 1.8273 0.0121 1.9090 0.0119Re—O(4) 1.9738 0.0135 2.0116 0.0128Re—O(5) 2.0933 0.0291 2.1141 0.0105
Symmetry code: (i) 1 + x, y, z.
electronic reprint
temperature exhibits broadening of the first derivative.
The Hg,Re-1223 superconductor inside the gasket exhibits
no broadening of the AC magnetic susceptibility versus
temperature considering that the lock-in amplifier used to
detect the AC signal can show this effect with a precision of
100 p.p.m. (<1 GPa).
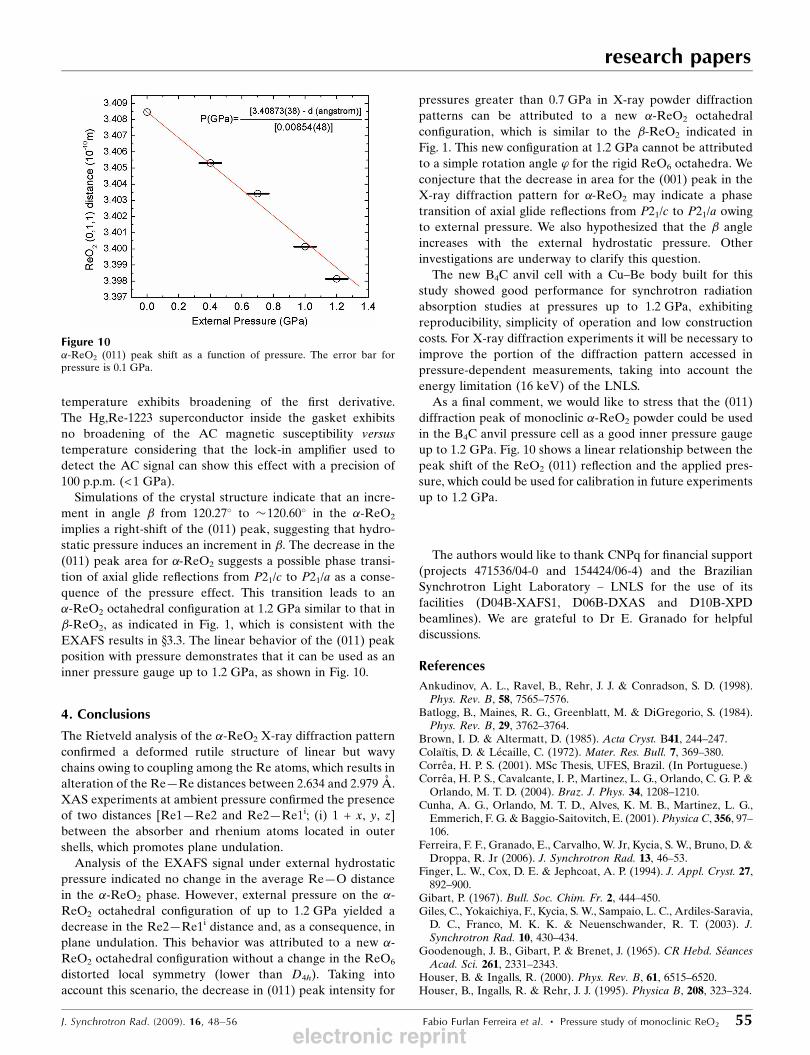
Simulations of the crystal structure indicate that an incre-
ment in angle � from 120.27� to �120.60� in the �-ReO2
implies a right-shift of the (011) peak, suggesting that hydro-
static pressure induces an increment in �. The decrease in the
(011) peak area for �-ReO2 suggests a possible phase transi-
tion of axial glide reflections from P21/c to P21/a as a conse-
quence of the pressure effect. This transition leads to an
�-ReO2 octahedral configuration at 1.2 GPa similar to that in
�-ReO2, as indicated in Fig. 1, which is consistent with the
EXAFS results in x3.3. The linear behavior of the (011) peak
position with pressure demonstrates that it can be used as an
inner pressure gauge up to 1.2 GPa, as shown in Fig. 10.
4. Conclusions
The Rietveld analysis of the �-ReO2 X-ray diffraction pattern
confirmed a deformed rutile structure of linear but wavy
chains owing to coupling among the Re atoms, which results in
alteration of the Re—Re distances between 2.634 and 2.979 A.
XAS experiments at ambient pressure confirmed the presence
of two distances [Re1—Re2 and Re2—Re1i; (i) 1 + x, y, z]
between the absorber and rhenium atoms located in outer
shells, which promotes plane undulation.
Analysis of the EXAFS signal under external hydrostatic
pressure indicated no change in the average Re—O distance
in the �-ReO2 phase. However, external pressure on the �-ReO2 octahedral configuration of up to 1.2 GPa yielded a
decrease in the Re2—Re1i distance and, as a consequence, in
plane undulation. This behavior was attributed to a new �-ReO2 octahedral configuration without a change in the ReO6
distorted local symmetry (lower than D4h). Taking into
account this scenario, the decrease in (011) peak intensity for
pressures greater than 0.7 GPa in X-ray powder diffraction
patterns can be attributed to a new �-ReO2 octahedral
configuration, which is similar to the �-ReO2 indicated in
Fig. 1. This new configuration at 1.2 GPa cannot be attributed
to a simple rotation angle ’ for the rigid ReO6 octahedra. We
conjecture that the decrease in area for the (001) peak in the
X-ray diffraction pattern for �-ReO2 may indicate a phase
transition of axial glide reflections from P21/c to P21/a owing
to external pressure. We also hypothesized that the � angle
increases with the external hydrostatic pressure. Other
investigations are underway to clarify this question.
The new B4C anvil cell with a Cu–Be body built for this
study showed good performance for synchrotron radiation
absorption studies at pressures up to 1.2 GPa, exhibiting
reproducibility, simplicity of operation and low construction
costs. For X-ray diffraction experiments it will be necessary to
improve the portion of the diffraction pattern accessed in
pressure-dependent measurements, taking into account the
energy limitation (16 keV) of the LNLS.
As a final comment, we would like to stress that the (011)
diffraction peak of monoclinic �-ReO2 powder could be used
in the B4C anvil pressure cell as a good inner pressure gauge
up to 1.2 GPa. Fig. 10 shows a linear relationship between the
peak shift of the ReO2 (011) reflection and the applied pres-
sure, which could be used for calibration in future experiments
up to 1.2 GPa.
The authors would like to thank CNPq for financial support
(projects 471536/04-0 and 154424/06-4) and the Brazilian
Synchrotron Light Laboratory – LNLS for the use of its
facilities (D04B-XAFS1, D06B-DXAS and D10B-XPD
beamlines). We are grateful to Dr E. Granado for helpful
discussions.
References
Ankudinov, A. L., Ravel, B., Rehr, J. J. & Conradson, S. D. (1998).Phys. Rev. B, 58, 7565–7576.
Batlogg, B., Maines, R. G., Greenblatt, M. & DiGregorio, S. (1984).Phys. Rev. B, 29, 3762–3764.
Brown, I. D. & Altermatt, D. (1985). Acta Cryst. B41, 244–247.Colaıtis, D. & Lecaille, C. (1972). Mater. Res. Bull. 7, 369–380.Correa, H. P. S. (2001). MSc Thesis, UFES, Brazil. (In Portuguese.)Correa, H. P. S., Cavalcante, I. P., Martinez, L. G., Orlando, C. G. P. &Orlando, M. T. D. (2004). Braz. J. Phys. 34, 1208–1210.
Cunha, A. G., Orlando, M. T. D., Alves, K. M. B., Martinez, L. G.,Emmerich, F. G. & Baggio-Saitovitch, E. (2001). Physica C, 356, 97–106.
Ferreira, F. F., Granado, E., Carvalho, W. Jr, Kycia, S. W., Bruno, D. &Droppa, R. Jr (2006). J. Synchrotron Rad. 13, 46–53.
Finger, L. W., Cox, D. E. & Jephcoat, A. P. (1994). J. Appl. Cryst. 27,892–900.
Gibart, P. (1967). Bull. Soc. Chim. Fr. 2, 444–450.Giles, C., Yokaichiya, F., Kycia, S. W., Sampaio, L. C., Ardiles-Saravia,D. C., Franco, M. K. K. & Neuenschwander, R. T. (2003). J.Synchrotron Rad. 10, 430–434.
Goodenough, J. B., Gibart, P. & Brenet, J. (1965). CR Hebd. SeancesAcad. Sci. 261, 2331–2343.
Houser, B. & Ingalls, R. (2000). Phys. Rev. B, 61, 6515–6520.Houser, B., Ingalls, R. & Rehr, J. J. (1995). Physica B, 208, 323–324.
research papers
J. Synchrotron Rad. (2009). 16, 48–56 Fabio Furlan Ferreira et al. � Pressure study of monoclinic ReO2 55
Figure 10�-ReO2 (011) peak shift as a function of pressure. The error bar forpressure is 0.1 GPa.
electronic reprint

Jørgensen, J.-E., Marshall, W. G., Smith, R. I., Staun Olsen, J. &Gerward, L. (2004). J. Appl. Cryst. 37, 857–861.
Larson, A. C. & Von Dreele, R. B. (2001). LANL Report LAUR86-748. Los Alamos National Laboratory, NM, USA.
Magneli, A. (1957). Acta Chem. Scand. 11, 28–33.Mello, E. V. L. de, Orlando, M. T. D., Gonzalez, J. L., Caixeiro, E. S. &Baggio-Saitovitch, E. (2002). Phys. Rev. B, 66, 092504.
Newville, M. (2001). J. Synchrotron Rad. 8, 322–324.Orlando, M. T. D., Cunha, A. G., de Mello, E. V. L., Belich, H.,Baggio-Saitovitch, E., Sin, A., Obradors, X., Burghardt, T. &Eichler, A. (2000). Phys. Rev. B, 61, 15454–15461.
Orlando, M. T. D., Passos, C. A. C., Passamai, J. L., Medeiros, E. F.,Orlando, C. G. P., Sampaio, R. V., Correa, H. S. P., de Melo, F. C. L.,Martinez, L. G. & Rossi, J. L. (2006). Physica C, 434, 53–61.
Passos, C. A. C., Orlando, M. T. D., Passamai, J. L., Medeiros, E. F.,Oliveira, F. D. C., Fardin, J. F. & Simonetti, D. S. L. (2006). Appl.Phys. Lett. 89, 242503.
Ravel, B. (2001). J. Synchrotron Rad. 8, 314–316.Sin, A., Cunha, A. G., Calleja, A., Orlando, M. T. D., Emmerich, F. G.,Baggio-Saitovitch, E., Pinol, S., Chimenos, J. M. & Obradors, X.(1998). Physica C, 306, 34–36.
Stephens, P. W. (1999). J. Appl. Cryst. 32, 281–289.Toby, B. H. (2001). J. Appl. Cryst. 34, 210–213.Tolentino, H. C. N., Cezar, J. C., Watanabe, N., Piamonteze, C., Souza-Neto, N. M., Tamura, E., Ramos, A. Y. & Neueschwander,R. (2005). Phys. Scr. T115, 977–979; AIP Conf. Proc. 705, 647–650.
Tolentino, H. C. N., Ramos, A. Y., Alves, M. C. M., Barrea, R. A.,Tamura, E., Cezar, J. C. &Watanabe, N. (2001). J. Synchrotron Rad.8, 1040–1046.
Thompson, P., Cox, D. E. & Hastings, J. B. (1987). J. Appl. Cryst. 20,79–83.
Zachariasen, W. H. (1951). Am. Program and Abstracts of WinterMeeting, F4, 234–256.
research papers
56 Fabio Furlan Ferreira et al. � Pressure study of monoclinic ReO2 J. Synchrotron Rad. (2009). 16, 48–56
electronic reprint