Spatial heterogeneity of surface roughness during different ...
9
Spatial heterogeneity of surface roughness during different erosive stages of tilled loess slopes under a rainfall intensity of 1.5 mm min 1 Qingfeng Zhang a, *, Jian Wang a , Longshan Zhao a , Faqi Wu a , Zhiyi Zhang b , Allen H. Torbert c a College of Natural Resources and Environment, Northwest A&F University, Yangling, Shaanxi 712100, China b College of Information Engineering, Northwest A&F University, Yangling, Shaanxi 712100, China c USDA–ARS National Soil Dynamics Laboratory, Auburn, AL 36830, USA A R T I C L E I N F O Article history: Received 31 December 2014 Received in revised form 11 May 2015 Accepted 25 May 2015 Keywords: Loess tilled slope Soil erosion Spatial heterogeneity Fractal analysis Semi-variance analysis A B S T R A C T The loess tilled slopes of the Chinese Loess Plateau are an area of serious soil erosion problems. Knowing the spatial heterogeneity of surface roughness (SR) will contribute to the understanding of the developmental process of slope erosion and reveal the coupled relationship between SR and slope erosion in this area. The objective of this study was to examine the spatial heterogeneity of SR of four typical tilled loess slopes during successive stages of soil erosion under a simulated rainfall: before rain (BR), splash erosion (SpE), sheet erosion (ShE) and rill erosion (RE). Soil surface elevation was measured and analyzed with both the semivariogram function and fractal dimension models. All four tilled slopes: artificial backhoe (AB), artificial digging (AD), contour tillage (CT) and linear slope (CK) had strong spatial autocorrelations and relatively stable spatial structure during the evolution of the erosion process. Rainfall in the SpE and ShE had a certain relief effect on SR. The fractal dimension of the SR at various erosion stages ranged from 1.54 to 1.86. All tillage methods showed a reduction in their SR variances at scales larger than 40 cm, with CK showing the smallest reduction, followed by AB, AD, and then CT. Contrarily, these tillage methods displayed a similar trend of increasing SR variances at scales less than 40 cm; increasingly weaker soil and water conservation effects were noted for these slopes. Since the SR of the 15 slope had a stronger spatial heterogeneity, it is expected to have a more potent inhibition of soil erosion at this slope than at other slope gradients. The overall autocorrelation scale of SR was 2.84 m, although it differed under various tillage measures and slope gradients. The results of multifractal analysis reflected the spatial heterogeneity of SR at diverse scales or at different erosion processes better than a single fractal dimension. In this paper, we not only reveal the coupling relationship between SR of micro-topography and erosion, but also lay a theoretical foundation to guide future tillage practices on sloping areas of the Loess Plateau. ã2015 Elsevier B.V. All rights reserved. 1. Introduction The soil erosion rates in the Chinese Loess Plateau range among the highest in the world. More than 40% of the sediment originate from agriculturally used slopes eroded by high-intensity rainfall. Erosion and runoff processes are mainly influenced by soil surface characteristics such as soil surface roughness (SR), cohesion, and soil textural composition. Among these characteristics, soil surface roughness or micro-topography is a key parameter, which describes the undulating surface configuration and has fewer changes in relative elevation (usually no more than 5–25 cm) over a relatively small area (Zhang et al., 2014a). SR is strongly influenced by agricultural practices together with soil properties and climate (Zheng et al., 2014). As a common index reflecting the degree of erosion and the changes of surface relative elevation, SR can affect the occurrence of surface runoff and flow direction; it can then alter flow convergence through its own changes of the relative height of space points accompanied by water erosion, thereby affecting the erosion evolution and sediment volume (Burwell and Larson, 1969; Govers et al., 2000; Hansen et al., 1999). In contrast, water storage, sediment interception and transport through surface furrows and swales also affect the spatial distribution of SR (Magunda et al., 1997; Yvonne et al., 2008). Therefore, SR is also a highly dynamic and composite factor which can reflect various elements of slope erosion as well as their interaction (Kirkby, 2010). * Corresponding author. Tel.: +86 13909269783; fax: +86 29 8708 0055. E-mail address: [email protected] (Q. Zhang). http://dx.doi.org/10.1016/j.still.2015.05.011 0167-1987/ ã 2015 Elsevier B.V. All rights reserved. Soil & Tillage Research 153 (2015) 95–103 Contents lists available at ScienceDirect Soil & Tillage Research journa l homepage: www.e lsevier.com/locate/st ill
-
Upload
khangminh22 -
Category
Documents
-
view
1 -
download
0
Transcript of Spatial heterogeneity of surface roughness during different ...

Soil & Tillage Research 153 (2015) 95–103
Spatial heterogeneity of surface roughness during different erosivestages of tilled loess slopes under a rainfall intensity of 1.5 mm min�1
Qingfeng Zhanga,*, Jian Wanga, Longshan Zhaoa, Faqi Wua, Zhiyi Zhangb,Allen H. Torbertc
aCollege of Natural Resources and Environment, Northwest A&F University, Yangling, Shaanxi 712100, ChinabCollege of Information Engineering, Northwest A&F University, Yangling, Shaanxi 712100, ChinacUSDA–ARS National Soil Dynamics Laboratory, Auburn, AL 36830, USA
A R T I C L E I N F O
Article history:Received 31 December 2014Received in revised form 11 May 2015Accepted 25 May 2015
Keywords:Loess tilled slopeSoil erosionSpatial heterogeneityFractal analysisSemi-variance analysis
A B S T R A C T
The loess tilled slopes of the Chinese Loess Plateau are an area of serious soil erosion problems. Knowingthe spatial heterogeneity of surface roughness (SR) will contribute to the understanding of thedevelopmental process of slope erosion and reveal the coupled relationship between SR and slopeerosion in this area. The objective of this study was to examine the spatial heterogeneity of SR of fourtypical tilled loess slopes during successive stages of soil erosion under a simulated rainfall: before rain(BR), splash erosion (SpE), sheet erosion (ShE) and rill erosion (RE). Soil surface elevation was measuredand analyzed with both the semivariogram function and fractal dimension models. All four tilled slopes:artificial backhoe (AB), artificial digging (AD), contour tillage (CT) and linear slope (CK) had strong spatialautocorrelations and relatively stable spatial structure during the evolution of the erosion process.Rainfall in the SpE and ShE had a certain relief effect on SR. The fractal dimension of the SR at variouserosion stages ranged from 1.54 to 1.86. All tillage methods showed a reduction in their SR variances atscales larger than 40 cm, with CK showing the smallest reduction, followed by AB, AD, and then CT.Contrarily, these tillage methods displayed a similar trend of increasing SR variances at scales less than40 cm; increasingly weaker soil and water conservation effects were noted for these slopes. Since the SRof the 15� slope had a stronger spatial heterogeneity, it is expected to have a more potent inhibition of soilerosion at this slope than at other slope gradients. The overall autocorrelation scale of SR was 2.84 m,although it differed under various tillage measures and slope gradients. The results of multifractalanalysis reflected the spatial heterogeneity of SR at diverse scales or at different erosion processes betterthan a single fractal dimension. In this paper, we not only reveal the coupling relationship between SR ofmicro-topography and erosion, but also lay a theoretical foundation to guide future tillage practices onsloping areas of the Loess Plateau.
ã2015 Elsevier B.V. All rights reserved.
Contents lists available at ScienceDirect
Soil & Tillage Research
journa l homepage: www.e lsev ier .com/ locate /st i l l
1. Introduction
The soil erosion rates in the Chinese Loess Plateau range amongthe highest in the world. More than 40% of the sediment originatefrom agriculturally used slopes eroded by high-intensity rainfall.Erosion and runoff processes are mainly influenced by soil surfacecharacteristics such as soil surface roughness (SR), cohesion, andsoil textural composition. Among these characteristics, soil surfaceroughness or micro-topography is a key parameter, whichdescribes the undulating surface configuration and has fewerchanges in relative elevation (usually no more than 5–25 cm) over
* Corresponding author. Tel.: +86 13909269783; fax: +86 29 8708 0055.E-mail address: [email protected] (Q. Zhang).
http://dx.doi.org/10.1016/j.still.2015.05.0110167-1987/ã 2015 Elsevier B.V. All rights reserved.
a relatively small area (Zhang et al., 2014a). SR is stronglyinfluenced by agricultural practices together with soil propertiesand climate (Zheng et al., 2014). As a common index reflecting thedegree of erosion and the changes of surface relative elevation, SRcan affect the occurrence of surface runoff and flow direction; itcan then alter flow convergence through its own changes of therelative height of space points accompanied by water erosion,thereby affecting the erosion evolution and sediment volume(Burwell and Larson, 1969; Govers et al., 2000; Hansen et al., 1999).In contrast, water storage, sediment interception and transportthrough surface furrows and swales also affect the spatialdistribution of SR (Magunda et al., 1997; Yvonne et al., 2008).Therefore, SR is also a highly dynamic and composite factor whichcan reflect various elements of slope erosion as well as theirinteraction (Kirkby, 2010).
96 Q. Zhang et al. / Soil & Tillage Research 153 (2015) 95–103
Spatial heterogeneity is generally defined as the complexityand variability of a system property in a given space, and itis principally composed of two parts: randomness andautocorrelation (Li and Reynolds, 1995). SR is a form of surfacemicro-topography which is influenced by human cultivationactivities, rainfall and surface runoff. And it can be viewed as acontinuous temporal and spatial variation with a certain spatialheterogeneity. Research on the spatial distribution of SR and itsheterogeneity during the erosion process needs to address threebasic questions: Why does the micro-topography vary with themagnitude of SR? Which factor contributes more than the others tothe spatial variability of the sloping surface? And which specificspatial factors correspond to a given scale? These issues arecurrently at the frontier of debate and exploration in soil erosionresearch (Zhang et al., 2014a). In the past, studies on SR mainlyfocused on influencing factors, measuring methods, and therelationship between erosion and slope hydrology for therandomness and complexity of SR distribution (Onstad, 1984;Huang and Bradford, 1992; Kamphorst et al., 2000; Planchon et al.,2001; Zheng et al., 2014). Detailed studies on roughness changes inspatial distribution characteristics and spatial heterogeneity inwater erosion, especially at the centimeter scale, are still limitedwhich may be attributable to practical difficulties in obtainingdirect soil SR measurements. Knowledge about surface roughnessand erosion mechanisms at the scale of micro-topography fellbehind that of soil and water conservation required in practice.Therefore, it is necessary to conduct systematic research on thespatial heterogeneity of SR in the slope erosion at centimeter orsmaller scales. Thus, the objective of this study is to conduct spatialheterogeneity research in the successive soil erosion stages ofsplash erosion, sheet erosion, and rill erosion under laboratoryconditions. Knowledge regarding spatial heterogeneity of SR willcontribute important elements to the research field of soil erosion(Ollesch et al., 2005), such as soil erosion processes, soil erosionmechanisms, and soil erosion modelling.
2. Materials and methods
2.1. Design of experiment
Sample soil was collected from a plough layer (0–30 cm) inYangling, Shaanxi Province, which is located at the southern edgeof the Loess Plateau (N 108.72�, W 34.36�). The loutu soil(Earth-cumuli-Orthic Anthrosol) is gray brown, loose and granularwith silty sand particles. Based on the analysis of a compositesample, the main soil characteristics are shown in Table 1.
Air-dried soil was crushed with a mechanical grinder beforebeing passed through a 10 mm sieve, and the sieved soil wasthoroughly mixed to minimize differences among treatments.Tanks with an area of 1 m � 2 m = 2 m2 were constructed for the
Table 1Soil characteristics based on the ananlysis of a composite sample at a depth of0–20 cm.
Soil type Loutu
Soil composition (%) Sand 2.82Silt 55.74Clay 41.44
Texture Silt loamBulk density (g cm�3) 1.30Rock content above 2 mm (%) 0Organic matter content (g kg�1) 16.66CEC (cation exchange capacity) (cmol kg�1) 18.47Total N (g kg�1) 0.91Total P (g kg�1) 0.50
study and each was filled with 10 cm layers of soil to a depth of100 cm. Each soil layer was raked lightly before packing the nextlayer to ensure uniformity and continuity of the soil structure. Theamount of soil in each layer was kept as constant as possible tomaintain a consistent bulk density (1.30 g cm�3) and uniformspatial distribution of soil particles among layers (An et al., 2012).The repacked soil was wetted before the surface creation and theerosion experiments, and the moisture content by mass wasgravimetrically adjusted to 10 g/100 g prior to the rain simulationexperiment intiation.
In order to minimize the influence of marginal effects, thecentral test area of each tank was defined as 0.8 m � 1.74 m =1.392 m2. A laser range finder (Zhang et al., 2014b) was usedfor automated measurement of point by point surfaceelevations in a regularly spaced grid (2 � 2 cm). Therefore,40 � 87 = 3480 elevation data points were collected from eachtest area both before and after a rainfall event. Three data pointreplicates were conducted for each test slope surface (80 slopesurfaces in total with 4 tillage measures � 5 slopegradients � 4 erosive stages) and the mean value of elevationat the same grid cell was determined as the final data set forthe analysis.
Artificial surfaces were prepared with slope gradients of 5�, 10�,15�, 20�, and 25�, respectively. Farmers experienced in the giventillage methods were employed to lay out the experimentalmeasures (Fig. 1): artificial backhoe (AB), artificial digging (AD),contour tillage (CT) and a linear slope as the control (CK).
Soil erosion is strongly linked to the maximum thirty-minuterainfall intensity (E30). In Yangling, annual mean precipitation in30 min is 18.36 mm, and annual mean rainfall intensity is36.72 mm h�1. While the variation coefficient (Cv) was 0.60,coefficient of skewness (Cs) = 4.0 � Cv, the rainfall frequency andthe hydrologic parameter were also taken into account. Themaximum E30 rainfall expected to occur once per 30 years is88.52 mm h�1; hence, the experimental rainfall intensity in thisstudy was set to 1.5 mm min�1 (i.e., 90 mm h�1).
Artificial simulated rainfall experiments were carried out at theNational Soil Erosion and Dryland Farming Laboratory. Threesuccessive rain events consisting of tap water were employedduring four water erosion processes: (1) before rainfall (BR): thesoil sample is ready for rainfall; (2) splash erosion (SpE): the phaseprior to the initiation of runoff; (3) sheet erosion (ShE): the phasedefined by the appearance of fish-scale shaped pits and small-scaleoverfall; (4) rill erosion (RE): the phase when fish-scale shaped pitsand overfall form the rills. The first and second rainfall events wereperformed with a 30-min duration; and the third rainfall eventswere performed with 60-min durations.
2.2. Semivariogram method
In the research methods on spatial heterogeneity of SR withscale effects (Caniego et al., 2005; Vidal et al., 2005), thesemivariogram method (SM) provides a measurement of spatialcorrelation, the dependence of a studied natural phenomenon, anddifferentiates between dependent and random variables (Nielsenand Wendroth, 2003). The semivariogram method is defined as:
gðhÞ ¼ 12NðhÞ
XNðhÞ
i�1
½ZðxiÞ � Zðxi þ hÞ�2 (1)
where g(h) is the semivariance for the lag distance betweensampling elevation data points (h), Z(x) is the elevation at thelocation x and N(h) is the number of pairs considered. Eq. (1) gives arelationship between a variance term g(h) based on the elevationdifference and the separation length h. Most natural soilmicro-topography surfaces display a general trend of log–log
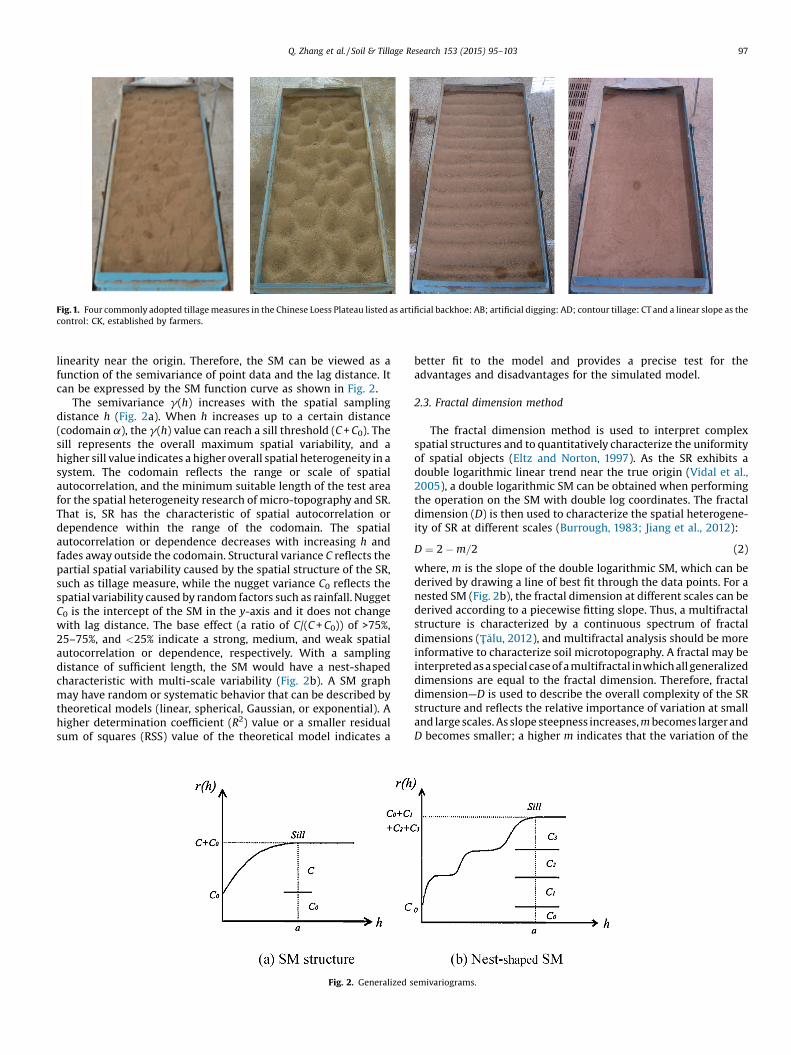
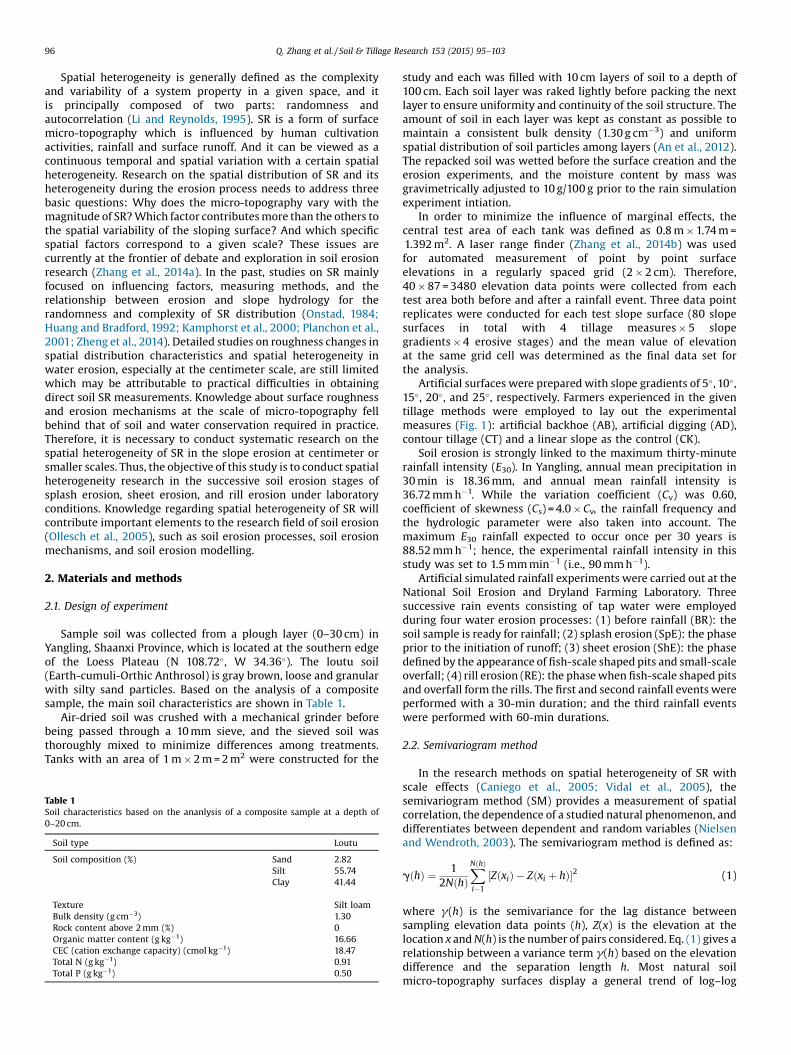
Fig. 1. Four commonly adopted tillage measures in the Chinese Loess Plateau listed as artificial backhoe: AB; artificial digging: AD; contour tillage: CT and a linear slope as thecontrol: CK, established by farmers.
Q. Zhang et al. / Soil & Tillage Research 153 (2015) 95–103 97
linearity near the origin. Therefore, the SM can be viewed as afunction of the semivariance of point data and the lag distance. Itcan be expressed by the SM function curve as shown in Fig. 2.
The semivariance g(h) increases with the spatial samplingdistance h (Fig. 2a). When h increases up to a certain distance(codomain a), the g(h) value can reach a sill threshold (C + C0). Thesill represents the overall maximum spatial variability, and ahigher sill value indicates a higher overall spatial heterogeneity in asystem. The codomain reflects the range or scale of spatialautocorrelation, and the minimum suitable length of the test areafor the spatial heterogeneity research of micro-topography and SR.That is, SR has the characteristic of spatial autocorrelation ordependence within the range of the codomain. The spatialautocorrelation or dependence decreases with increasing h andfades away outside the codomain. Structural variance C reflects thepartial spatial variability caused by the spatial structure of the SR,such as tillage measure, while the nugget variance C0 reflects thespatial variability caused by random factors such as rainfall. NuggetC0 is the intercept of the SM in the y-axis and it does not changewith lag distance. The base effect (a ratio of C/(C + C0)) of >75%,25–75%, and <25% indicate a strong, medium, and weak spatialautocorrelation or dependence, respectively. With a samplingdistance of sufficient length, the SM would have a nest-shapedcharacteristic with multi-scale variability (Fig. 2b). A SM graphmay have random or systematic behavior that can be described bytheoretical models (linear, spherical, Gaussian, or exponential). Ahigher determination coefficient (R2) value or a smaller residualsum of squares (RSS) value of the theoretical model indicates a
Fig. 2. Generalized s
better fit to the model and provides a precise test for theadvantages and disadvantages for the simulated model.
2.3. Fractal dimension method
The fractal dimension method is used to interpret complexspatial structures and to quantitatively characterize the uniformityof spatial objects (Eltz and Norton, 1997). As the SR exhibits adouble logarithmic linear trend near the true origin (Vidal et al.,2005), a double logarithmic SM can be obtained when performingthe operation on the SM with double log coordinates. The fractaldimension (D) is then used to characterize the spatial heterogene-ity of SR at different scales (Burrough, 1983; Jiang et al., 2012):
D ¼ 2 � m=2 (2)
where, m is the slope of the double logarithmic SM, which can bederived by drawing a line of best fit through the data points. For anested SM (Fig. 2b), the fractal dimension at different scales can bederived according to a piecewise fitting slope. Thus, a multifractalstructure is characterized by a continuous spectrum of fractaldimensions (Ú�alu, 2012), and multifractal analysis should be moreinformative to characterize soil microtopography. A fractal may beinterpreted as a special case of a multifractal inwhich all generalizeddimensions are equal to the fractal dimension. Therefore, fractaldimension—D is used to describe the overall complexity of the SRstructure and reflects the relative importance of variation at smalland large scales. As slope steepness increases, m becomes larger andD becomes smaller; a higher m indicates that the variation of the
emivariograms.

98 Q. Zhang et al. / Soil & Tillage Research 153 (2015) 95–103
large scale controls the configuration of the SR and the spatialdependence is stronger. Otherwise, a lower m value results in ahigher D value, which implies that the small scale variations aremore obvious, the spatial heterogeneity is strongly influenced byrandom factors, and the distribution of SR is more complex.
3. Results and discussion
3.1. Characterizing the spatial variation
The probability density function of the relative elevation pointdata of all tillage slopes follows a normal distribution orapproximately normal distribution. Thus, the data set can be
Fig. 3. Semivariogram of loess tilled slopes with different gradients in erosive stage
safely used to conduct the semivariance analysis (Pandey andPandey, 2010). According to Eq. (1), the results are shown as Fig. 3.
3.1.1. Overall semivariance structure analysisAccording to Fig. 3, a clearly emerging trend is that SR
semivariance for each slope increases with lag distance, while itremains relatively smooth within a certain sampling scale. Inaddition to the characteristic of single scale variability, the spatialheterogeneity of SR of loess slopes has the characteristic ofmulti-scale variability. When variances at different scales aresuperimposed, they represent a nested semivariance structure.Simultaneously, the same tillage slope at different slope gradientsand erosion stages shows similar spatial variability; this behavior
s: the semivariance – g(h) vary with separation distance – h at different scale.

Q. Zhang et al. / Soil & Tillage Research 153 (2015) 95–103 99
illustrates that the SR values of different tillage measures haverelatively stable spatial variability. Also, the semivariance of the CKslope is smaller (>1E-05) than that of the others (>1E-04), showingthat the spatial variability of the CK slope is not as obvious as it isfor the others.
3.1.2. Variations at different scaleThe semivariance rises steadily at a scale of 0–15 cm, which may
be related to the local factors such as an incomplete tillage measureor edge effects of erosion troughs. At a larger scale of 15–150 cm,the semivariance remains relatively stable, and the order of thesill—(C + C0) values becomes: SCK< SAB< SAD� SCT,SShE< SRE< SSpE< SBR, S5� < S25� < S20� � S10� < S15�. Because the surface roughnesswith higher spatial variability can result in the shortest path ofrunoff and sediment, it can prevent soil erosion to the utmostextent (She et al., 2011; Moreno et al., 2012). This suggests that theSR with the highest spatial variation are the CT and AD slopes of 15�
in the erosion stage of BR, and implies that these prcactices havethe best soil and water conservation (SWC) effect accordingly. Thesemivariance of the CT slope has repeated rapid increases anddecreases, and does not show a well-defined sill and codomain;this behavior suggests that the CT slope has a trend effect and isnon-stationary. At a scale of 180–200 cm, we note that thesemivariance increases rapidly. This implies that the overall spatialheterogeneity increases gradually along with the scale, and thatthe micro-topography (tillage measure, slope profile, slopeorientation, slope position, etc.) and rainfall (rainfall intensity,rainfall amount, rainfall duration, etc.) are the predominant factorsimpacting SR variation on a larger spatial scale. However, we alsoobserved a rapid decrease in the semivariance at the 180–200 cmscale, which indicates that the SR does not have a quantitativespatial correlation and lacks defined spatial structures. This resultmight be caused by local factors such as the edge effect.
3.1.3. Variations in different erosive stagesIn this study, random variations of SR are mainly affected by
rainfall. With the development of soil erosion, spatial heterogene-ity has a decreasing trend. It shows that the rainfall exerts a certaingentle force, which is in accordance with previous work by Zhenget al. (2014). Conversely, the relation of SR with rainfalldemonstrates that the variation of the spatial structure of SR isreduced at the splash erosion stage and sheet erosion stage, whileit increases slightly at the rill erosion stage.
3.1.4. Variations in different slopeThe overall spatial variance illustrates that the slope of 15� has
the highest variance (at the level of 4.4E-04); the slopes of 10� and20� are pretty much the same (2.7E-04), followed by the slope of25� (2.5E-04). The slope of 5� has the lowest variance (1.8E-04).This shows that the overall spatial heterogeneity of different slopesis descending with the order of slope gradient of 15� > 10–20� > 25�
when the slope gradient is higher than 5�. And this also suggeststhat the SR of slope of 15� has better spatial structure and is moreeffective in preventing soil erosion, while the slope of 25� is moresusceptible to be eroded.
3.1.5. SM model analysisFig. 4 demonstrates that Gaussian, Spherical, and Exponential
models can be used to simulate the micro-topographic SR. TheNugget value for the tillage slopes is NCK< NAB< NAD< NCT, whichshows increasing levels of anthropogenic impacts (randomness).The sill values are in the order of SCK< SAB< SAD� SCT, SShE< SRE< SSpE< SBR, and S5� < S25� < S10� � S20� < S15�. The linear slope (CK)has a stronger autocorrelation with its SR, which is mainly underthe influence of its spatial structure. The slopes of CT, 15�, and BRhave stronger spatial heterogeneity values and the spatial
heterogeneity values of slopes AB and AD fall in between thetwo, though these differences are not obvious. All of the baseeffects are >25% and most of them are >75%, which demonstratesthat most of the tillage slopes have strong autocorrelation ordependence, with their spatial variability of SR dominated by thespatial structural factors. The codomain ranges from 0.068 m(25-CT-BR and 10-CT-BR) to 12.027 m (25-CT-SpE), with the meancodomains of the slopes AB, AD, CT and CK having values of 2.8, 2.4,2.0 and 4.2 m, respectively. Generally, the overall autocorrelationrange is 2.84 m. This result may provide us the minimum suitablelength for the future spatial heterogeneity research ofmicro-topography and SR under the same condition. Accordingly,the codomain length is larger than the original sample slope length(2.0 m). This shows that the horizontal semivariogram has a muchlarger nugget effect relative to the autocorrelated scales, and thelarger the relative nugget effect, the greater the tolerance areaaround the regular grid nodes (Englund, 1988). This result suggeststhat the sampling accuracy at the centimeter scale is sufficient forthe spatial heterogeneity research; the determination coefficientof the CT slope is lower than that of the others, which suggests thatthe corresponding SM theoretical models can be used to simulatethe real tilled slopes except CT slopes. Generally, determinationcoefficients vary from 0.295 to 0.994, indicating that the SM canonly be used to explain the overall condition of the spatialheterogeneity and spatial distribution of the SR.
3.2. Characterizing the overall fractal dimension
The double logarithmic semivariance curves of loess slopesdisplay linear relationships within a certain scale, therefore, thefractal dimension can be computed (Fig. 5) according to Eq. (2).
3.2.1. Tillage methodFig. 5 expounds the fractal features of tilled slopes in certain
erosive stages, though the SR was not totally random within theresearch scale range. The fractal dimensions calculated from slopeswith different gradients, tilled measures at erosive stages were allwithin the range of 1.54–1.86. Amongst them, the fractaldimension of the CK slope was the lowest (1.66), followed bythose of the AB slope (1.78), the AD slope (1.80), and the CT slope(1.82). The complexity of the spatial distribution is enhanced inturn, and the small-scale variability of the SR is more significantthan large-scale variability. Therefore, the SWC effect is graduallystrengthened from CK, AB, AD to CT. It follows that the CT tillagemethod may be more effective in conserving soil and water orpreventing soil erosion.
3.2.2. Slope steepnessThe fractal dimension of the slope of 15� was the highest (1.78),
which indicates that the slope of 15� had the strongest inhibition ofsoil erosion. Accordingly, the slope of 20� has the lowest fractaldimension, which shows that the variance controlling theconfiguration of SR occurred on a large-scale, and the spatialdependence was stronger than those for the other slopes. Thus, the20� slope was more susceptible to erosion and this slope can betaken as the key slope limit for SWC because farming activities isstrictly prohibited when the slope gradient is >25� according to onelegal rule of Law of The People’s Republic of China on Water andSoil Conservation; it may be the steepest slope for effective SWCtillage measures.
3.2.3. Slope erosion stageGenerally, the fractal dimension D among the various erosion
stages shows that DSpE< DShE< DBR< DRE; the small-scale varianceincreases gradually in turn. The D value decreases initially, andthen increases with the evolution of slope erosion. This further
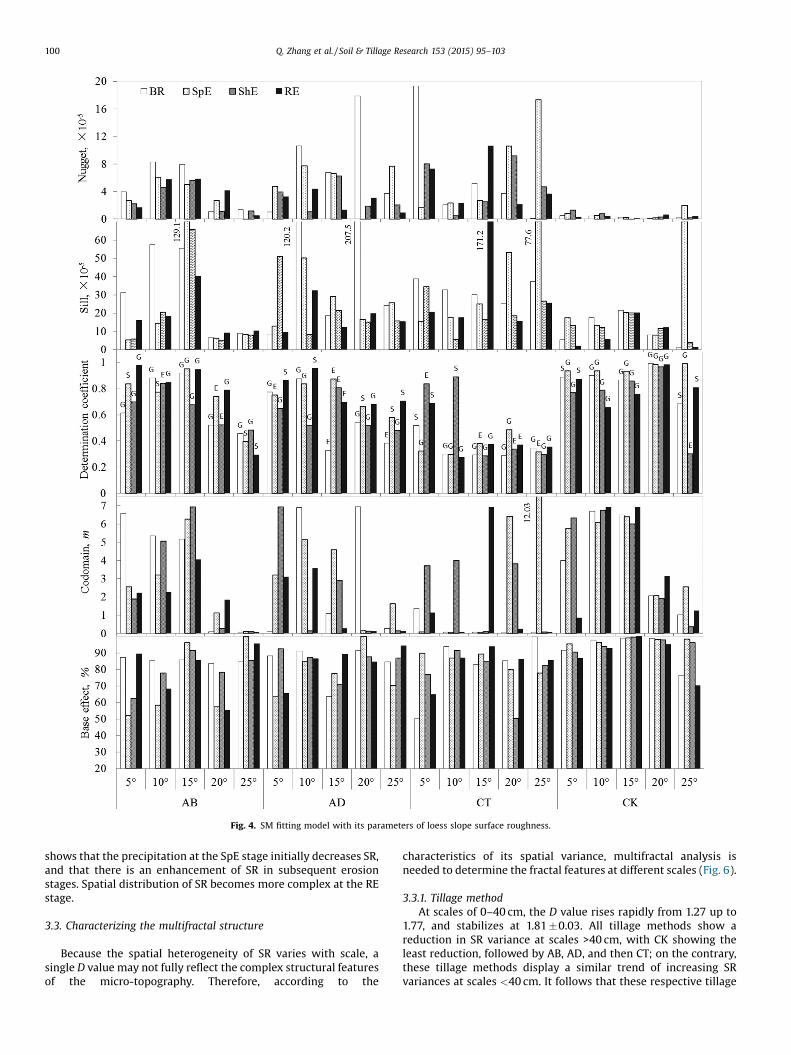
Fig. 4. SM fitting model with its parameters of loess slope surface roughness.
100 Q. Zhang et al. / Soil & Tillage Research 153 (2015) 95–103
shows that the precipitation at the SpE stage initially decreases SR,and that there is an enhancement of SR in subsequent erosionstages. Spatial distribution of SR becomes more complex at the REstage.
3.3. Characterizing the multifractal structure
Because the spatial heterogeneity of SR varies with scale, asingle D value may not fully reflect the complex structural featuresof the micro-topography. Therefore, according to the
characteristics of its spatial variance, multifractal analysis isneeded to determine the fractal features at different scales (Fig. 6).
3.3.1. Tillage methodAt scales of 0–40 cm, the D value rises rapidly from 1.27 up to
1.77, and stabilizes at 1.81 �0.03. All tillage methods show areduction in SR variance at scales >40 cm, with CK showing theleast reduction, followed by AB, AD, and then CT; on the contrary,these tillage methods display a similar trend of increasing SRvariances at scales <40 cm. It follows that these respective tillage
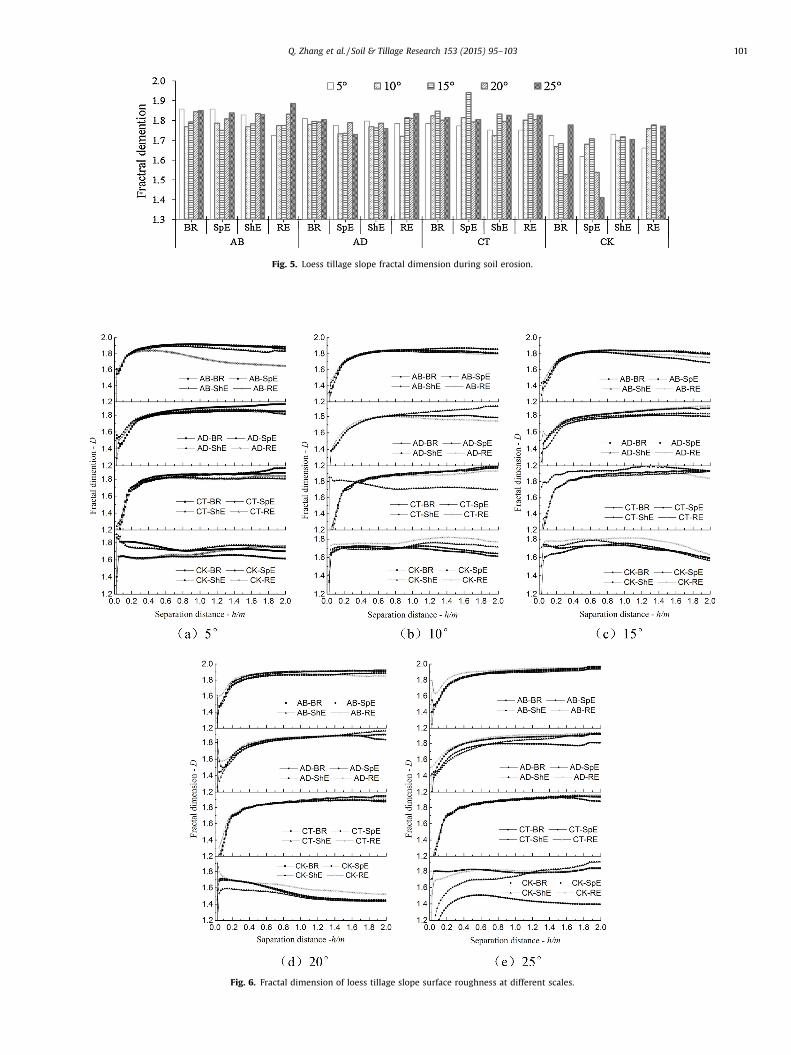
Fig. 6. Fractal dimension of loess tillage slope surface roughness at different scales.
Fig. 5. Loess tillage slope fractal dimension during soil erosion.
Q. Zhang et al. / Soil & Tillage Research 153 (2015) 95–103 101
102 Q. Zhang et al. / Soil & Tillage Research 153 (2015) 95–103
methods show an increasing trend in SR variance randomness asthe spatial distributions of SR become more complex, whichdemonstrates a strengthening of the SWC effect in accordance withprevious observations (Zhao et al., 2011).
3.3.2. Slope steepnessAt scales of 0–40 cm, the D values are D5� < D25� < D10� < D20�
< D15�. When the scale was >40 cm, the order of D values becameD20� < D10� < D5� < D15� < D25�. This phenomenon illustrates thatthe spatial structure of the 15� slope is more complex at a smallerscale. With the scale increasing, the spatial heterogeneity causedby random factors is gradually enhanced, and in the end, the slopeof 25� has a more complex spatial structure than the slope of 15�.Simultaneously, the D value of the 20� CK slope is significantlyreduced, which shows that a linear slope of 20� is more vulnerableto erosion.
3.3.3. Slope erosion stageThe D values of AB, AD, and CT slopes at the scales of 0–40 cm
are relatively small (1.69 � 0.06, 1.62 � 0.07 and 1.62 � 0.09,respectively). The D value of the CK slope for the scale of0–15 cm is also small (1.64 � 0.03). These results show that the SRvalues in the corresponding range of scales have larger spatialdependences (SD) and SDAD > SDAB > SDCT. At a larger scale, the Dvalue of each slope in different erosion stages remains relativelystable with little change, showing that these slopes have betterspatial autocorrelation at larger scales.
The D value of CT at the SpE stage increases to 1.94 � 0.02, whichdemonstrates that the spatial autocorrelation for this tillagemethod is low and the SR is almost homogeneous. The D values ofthe CK slope at all scales during successive erosion stages are1.68 � 0.04, 1.60 � 0.04, 1.69 � 0.05, and 1.73 � 0.03, respectively.Thus, they are relatively stable, whereas their spatial variances arelower than those of the other tillage slopes. Simultaneously, thespatial variance of the CK slope is gradually enhanced with eachsuccessive erosion stage. Overall, the multifractal analysis canreflect the spatial heterogeneity of SR better on a different scale,and it can also reflect the overall spatial heterogeneity of SR betterduring the slope erosion than a single fractal dimension value.
4. Summary and conclusions
Different tillage methods and slope gradients can influence thespatial difference of runoff distribution and susceptibility ofsurface soil to erosion. Due to the randomness and complexity ofthe SR distribution in the erosion processes, our understanding ofthe mechanism of micro-scale SR and erosion lags behind the needfor improved SWC practices. By using a narrow scale range andusing grid cells to study SR, the impact of spatial heterogeneity onSR is neglected and the results will be inconsistent with actualerosive events. Therefore, it is necessary to carry out a centimeter-scale quantitative research on the spatial heterogeneity of SR fromerosion.
Most tillage slopes in different erosion stages have strongspatial autocorrelation and relatively stable spatial structure, weakrandomness and their spatial dependence increased with thesampling interval. The spatial autocorrelation of the linear (CK)slope was the strongest, its SR was mainly affected by the impact ofspatial structure, and its variability was lower than the other tillageslopes.
Factors including the type of artificial tillage and rainfall are theunderlying causes of dynamic spatial heterogeneity characteristicsof SR, and the spatial structure of SR is related to humancultivation, terrain, and slope. The randomness of SR ismainly affected by the rainfall and structural factors. Contourtillage (CT) slopes and 15� slopes have strong spatial variability;
correspondingly, they have better spatial structure and SWC effect.The 20� slopes have strong spatial dependence and are moresusceptible to erosion. In the Soil and Water Conservation Law ofChina, it is strictly prohibited to reclaim slopes steeper than 25�.Therefore, whether the 20� slope should be the maximum gradientfor laying SWC tillage is worth pursuing further.
In addition to single scale variability, the spatial heterogeneityof SR also has a nest-shaped semi-variogram structure. The SR canbe accurately simulated with theoretical models such as theGaussian, spherical and exponential models, and these models canalso illustrate the spatial distribution and the overall spatialheterogeneity conditions. In summary, SR values of loess tillageslopes at different erosion stages have better fractal characteristicswhen their fractal dimensions are between 1.54 and 1.86. Spatialheterogeneity is a function of the fractal dimension, and multi-fractal analysis can better reflect the spatial variability at differentscales to reveal the spatial heterogeneity of SR in the process oferosion. Generally, the fractal dimension approach is reasonableand feasible to study the spatial heterogeneity of loess slope SR.
The SR combined with rainfall results in reduced spatialstructure variability from the SpE to the ShE stage and increasedvariability at the RE stage. Therefore, it can be generalized that therainfall in the SpE and ShE stage has a smoothing or moderatingrole on the SR. Rainfall in the RE stage has an enhancing role on theSR, which is accompanied by a corresponding increase in thecomplexity of the spatial distribution. Alternately, SR character-istics in the SpE and ShE stages have a certain inhibiting effect onrainfall role. According to the mean codomains calculated fortillage measures, the overall autocorrelation scale range can beidentified as 2.84 m.
The analytical methods used for spatial heterogeneity analysison smaller scales are a significant scientific contribution to soilerosion science. Results of this study provide theoretical relevanceto the nature of SR; moreover, it will provide the framework tocarry out a comprehensive study of SR under different rainfallintensities, allowing better understanding and quantitativedescription of the mutual coupling relationship between the SRand soil erosion. Furthermore, this study provides a theoreticalreference for future planning of SWC tillage measures in the LoessPlateau region. However, the experiment in this study considered asingle rainfall intensity of 1.5 mm min�1 within a certain range of2.0 m, but changes in SR will vary with different rainfall intensitiesand durations. Therefore, further research and verification isneeded on the spatial heterogeneity of SR on a wider scale or underdifferent rainfall intensities. In addition, since the results may beaffected by edge effects of the experimental erosion tank, thereliability of the results remains to be verified. Furthermore, thesplash erosion stage and sheet erosion stage resulted in reductioneffects on SR, but the size and the degree of this effect are poorlyunderstood; similarly, the rainfall erosion effect on the rill erosionstage still needs further study.
Acknowledgements
This research is jointly supported by the National NaturalScience Foundation of China (41271288 and 41371273), NaturalScience Foundation of Shaanxi province (2011JM5007) and theNational Science and Technology Support Program of theNational Twelfth Five-Year (Grants No. 2011BAD29B09-1-1C),administrated by Northwest A&F University.
References
An, J., Zheng, F.L., Lu, J., Li, G.F., 2012. Investigating the role of raindrop impact onhydrodynamic mechanism of soil erosion under simulated rainfall conditions.Soil Sci. 117, 517–526.
Q. Zhang et al. / Soil & Tillage Research 153 (2015) 95–103 103
Burrough, P.A., 1983. Multiscale sources of spatial variation in soil. II. Anon-Brownian fractal model and its application in soil survey. J. Soil Sci. 34,599–620.
Burwell, R.E., Larson, W.E., 1969. Infiltration as influenced by tillage-inducedrandom roughness and pore space. Soil Sci. Soc. Am. Proc. 33, 449–452.
Caniego, F.J., Espejo, R., Martı’n, M.A., Jos _e, F.S., 2005. Multifractal scaling of soilspatial variability. Ecol. Model. 182, 291–303.
Englund, E.J., 1988. Spatial autocorrelation: implications for sampling andestimation. Liggett, W. (Ed.), Proceedings of the ASA/EPA Conferences onInterpretation of Environmental Data, III Sampling and Site Selection inEnvironmental Studies, EPA 230/8-88/035 31–39.
Eltz, F.L.F., Norton, L.D., 1997. Surface roughness changes as affected by rainfallerosivity, tillage, and canopy cover. Soil Sci. Soc. Am. J. 61, 1746–1755.
Govers, G., Takken, I., Helming, K., 2000. Soil roughness and overland flow.Agronomie 20, 131–146.
Hansen, B., Schönning, P., Sibbesen, E., 1999. Roughness indices for estimation ofdepression storage capacity of tilled soil surfaces. Soil Tillage Res. 52, 103–111.
Huang, C., Bradford, J.M., 1992. Applications of a laser scanner to quantify soilmicrotopography. Soil Sci. Soc. Am. J. 56, 14–21.
Jiang, C.Y., Fang, H.L., Wei, S.S., 2012. Review of land surface roughnessparameterization study. Adv. Earth Sci. 27, 292–303.
Kamphorst, E.C., Jetten, V., Guerif, J., Pitkanen, J., Iversan, B.V., Douglas, J.T., Paz, A.,2000. How to predict maximum water storage in depressions from soilroughness measurements. Soil Sci. Soc. Am. J. 64, 1749–1758.
Kirkby, M.J., 2010. Distance, time and scale in soil erosion processes. Earth Surf.Process. Landf. 35, 1621–1623.
Li, H., Reynolds, J.F., 1995. On definition and quantification of heterogeneity. Oikos73, 280–284.
Magunda, M.K., Larson, W.E., Linden, D.R., Nater, E.A., 1997. Changes in microreliefand their effects on infiltration and erosion during simulated rainfall. SoilTechnol. 10, 57–67.
Moreno, R.G., Burykin, T., Diaz Alvarez, M.C., Crawford, J.W., 2012. Effect ofmanagement practices on soil microstructure and surface microrelief. Appl.Environ. Soil Sci. 2012, 1–9.
Nielsen, D.R., Wendroth, O., 2003. Spatial and Temporal Statistics: Sampling FieldSoils and Their Vegetation. Catena Verlag GMBH, D-35447, Reiskirchen,Germany.
Ollesch, G., Sukhanovski, Y., Kistner, I., Rode, M., Meissner, R., 2005. Characterizationand modelling of the spatial heterogeneity of snowmelt erosion. Earth Surf.Process. Landf. 30, 197–211.
Onstad, C.A., 1984. Depressional storage on tilled soil surfaces. Trans. ASAE 27,729–732.
Pandey, V., Pandey, P.K., 2010. Spatial and temporal variability of soil moisture. Int. J.Geosci. 1, 87–98.
Planchon, O., Esteves, M., Silvera, N., Lapetite, J.M., 2001. Microrelief induced bytillage: measurement and modelling of surface storage capacity. Catena 46,141–157.
She, D.L., Shao, M.A., Xue, Y.F., Yu, S.E., 2011. Soil-water conservation effects of slopeland use pattern changes. Trans. Chin. Soc. Agric. Eng. 27 (4), 22–27 (in Chinese).
Ú�alu, Ş., 2012. Mathematical methods used in monofractal and multifractal analysisfor the processing of biological and medical data and images. Anim. Biol. Anim.Husb. 4, 1–4.
Vidal, V.E., Vivas, M.J.G., Paz, G.A., 2005. Characterizing anisotropy andheterogeneity of soil surface microtopography using fractal models. Ecol.Model. 182, 337–353.
Yvonne, M., Caterina, V., Matthew, T., 2008. Centimetre-scale digital representationsof terrain and impacts on depression storage and runoff. Catena 75, 223–233.
Zhang, L., Zhang, Q.F., Zhao, L.S., Wang, J., Wu, F.Q., 2014a. Spatial heterogeneity ofloess tilled slope surface roughness. Sci. Agric. Sin. 47 (12), 2363–2374.
Zhang, Q.F., Zhao, L.S., Wang, J., Wu, F.Q., 2014b. Spatiotemporal variability andsimulation of tillaged loess microtopography in water erosion. J. Soil WaterConserv. 69, 343–351.
Zhao, L.S., Song, X.Y., Liang, X.L., Zhang, Q.F., Wu, F.Q., 2011. Micro-reliefcharacteristics of loess sloping farm land under different tillage practices andits effects of soil and water conservation. Sci. Soil Water Conserv. 9 (2), 64–70(in Chinese).
Zheng, Z.C., He, S.Q., Wu, F.Q., 2014. Changes of soil surface roughness under watererosion process. Hydrol. Process. 28, 3919–3929.