Spatial heterogeneity of the driving forces of cropland change in China
10
Science in China Ser. D Earth Sciences 2005 Vol.48 No.12 2231—2240 2231 Copyright by Science in China Press 2005 Spatial heterogeneity of the driving forces of cropland change in China LIU Xuhua 1,2 , WANG Jinfeng 1 , LIU Mingliang 4,1 & MENG Bin 1,2,3 1. Institute of Geographic Sciences and Natural Resources Research, Chinese Academy of Sciences, Beijing 100101, China; 2. Graduate School of the Chinese Academy of Sciences, Beijing 100039, China; 3. College of Arts and Sciences of Beijing Union University, Beijing 100083, China; 4. School of Forestry and Wildlife Sciences, Auburn University, Auburn, Alabama, AL36849, USA Correspondence should be addressed to Wang Jinfeng (email: [email protected]) Received May 24, 2004 Abstract By using digital satellite remote sensing data acquired in 1987―1989 and 1999― 2000 and GIS combined with the natural and socio-economic data, this paper drew an integrated zonation of the cropland change and its driving forces in China. The results indicated that the cropland change in the study period was constrained by geographical factors and driven by cli- mate change as well as socio-economic system. Moreover, the regional differences of the drivers for cropland change were significant. In the midwest of China, natural condition changes and geographical background were the main constraints and drivers, while in Eastern China, social and economic changes and economic policies were the main driving forces. The cropland loss was nationwide. The dominant factors to cause this decrease included buildup of developing area to attract foreign capital and technologies, changes of industry structure due to urban in- fluence, the change of employment notions thanks to living standard improvement, rapid ur- banization due to the expansion of cities and towns, the diminished farming net income partly because of the global warming effects, and the rapid economic growth stimulated by the con- venient transportation system. These factors interact and interdepend with each other to cause the cropland loss in China recently. The reasons for the increase of cropland were primarily the cultivation and deforestation by the farmers who want to increase income. This study on the mechnism of LUCC relied on the cropland change integrated classification considering the natural or human factors both inside and outside the region, which provides a new approach to study the integrated regionalization and LUCC mechanism. Keywords: land use change, driving force, integrated classification, spatial statistics, cropland, China. DOI: 10.1360/04yd0195 Along with the increasing problems of rapid popu- lation increase, resources scarcity and environment deterioration, the interaction between human devel- opment and natural environment changes, especially the Land-Use/Land-Cover, LUCC issue is becoming a frontier and hot field [1] , in which investigation on the mechanisms of land use change is one of the three core issues. Deficient natural resources, in particular the shortage of cropland resource in China, are the important constraints to China’s survive and sustain- able development. According to National Statistical Bureau, the cropland area is continuously decreased
Transcript of Spatial heterogeneity of the driving forces of cropland change in China

Science in China Ser. D Earth Sciences 2005 Vol.48 No.12 2231—2240 2231
Copyright by Science in China Press 2005
Spatial heterogeneity of the driving forces of cropland change in China
LIU Xuhua1,2, WANG Jinfeng1, LIU Mingliang4,1 & MENG Bin1,2,3
1. Institute of Geographic Sciences and Natural Resources Research, Chinese Academy of Sciences, Beijing 100101, China; 2. Graduate School of the Chinese Academy of Sciences, Beijing 100039, China; 3. College of Arts and Sciences of Beijing Union University, Beijing 100083, China; 4. School of Forestry and Wildlife Sciences, Auburn University, Auburn, Alabama, AL36849, USA Correspondence should be addressed to Wang Jinfeng (email: [email protected])
Received May 24, 2004
Abstract By using digital satellite remote sensing data acquired in 1987―1989 and 1999―2000 and GIS combined with the natural and socio-economic data, this paper drew an integrated zonation of the cropland change and its driving forces in China. The results indicated that the cropland change in the study period was constrained by geographical factors and driven by cli-mate change as well as socio-economic system. Moreover, the regional differences of the drivers for cropland change were significant. In the midwest of China, natural condition changes and geographical background were the main constraints and drivers, while in Eastern China, social and economic changes and economic policies were the main driving forces. The cropland loss was nationwide. The dominant factors to cause this decrease included buildup of developing area to attract foreign capital and technologies, changes of industry structure due to urban in-fluence, the change of employment notions thanks to living standard improvement, rapid ur-banization due to the expansion of cities and towns, the diminished farming net income partly because of the global warming effects, and the rapid economic growth stimulated by the con-venient transportation system. These factors interact and interdepend with each other to cause the cropland loss in China recently. The reasons for the increase of cropland were primarily the cultivation and deforestation by the farmers who want to increase income. This study on the mechnism of LUCC relied on the cropland change integrated classification considering the natural or human factors both inside and outside the region, which provides a new approach to study the integrated regionalization and LUCC mechanism. Keywords: land use change, driving force, integrated classification, spatial statistics, cropland, China.
DOI: 10.1360/04yd0195
Along with the increasing problems of rapid popu-lation increase, resources scarcity and environment deterioration, the interaction between human devel-opment and natural environment changes, especially the Land-Use/Land-Cover, LUCC issue is becoming a frontier and hot field[1], in which investigation on the
mechanisms of land use change is one of the three core issues. Deficient natural resources, in particular the shortage of cropland resource in China, are the important constraints to China’s survive and sustain-able development. According to National Statistical Bureau, the cropland area is continuously decreased
2232 Science in China Ser. D Earth Sciences
during 1980―1995. However, the cropland area data has thought to be underestimated[2,3]. Thus, more di- rect and more accurate cropland change data are needed. According to the newest remote sensing data, Liu Jiyuan has reported that the cropland area did not decrease but increased, although the quality of crop- land decreased in general[4,5]. But the data of the Min- istry of Land and Resources of China indicated that the net decrease of cropland area in the year 2003 was up to 25374 km2 because of cropland abandonment and the increase of construction land[6]. Given the increasingly urgent food security, the land competition between urbanization and agricultural development, and the environmental pressure, it is important to understand the spatial pattern of cropland changes in the past decade and recognize its driving forces using reliable data sets to monitor cropland change, protect cropland and provide scientific knowledge for long- term planning of cropland.
This study used the recent ten years’ land use change database based on high precision remote sens- ing images supported by the Knowledge Innovation Project of Chinese Academy of Sciences. An inte- grated classification has been developed according to cropland change structures and its driving forces in- cluding both the internal and the external factors. This study is a new attempt to analyze the spatio-temporal pattern and the dynamics of geographical phenomena.
1 Background
Investigation on the mechanism of driving force is very important in the land use/land cover research[1]. Driving forces mean the environmental or socio-eco- nomic factors causing the land use/land cover change. In general, there are two methods (models) to acquire the driving forces of land use changes including em-pirical diagnostical models and generalized mecha-nism models[7]. The former usually depends on abun-dant historical data of land use spatial pattern and es-tablishes the relationship between landscape variables and the direct causes of land use change[8]. The latter often analyzes the cause-effect of land use change and builds models to explain the behaviors of land use[9,10].
1.1 Generalized mechanism models
According to new classical economic theory, land use change is the result of land manager to pursue the maximum returns. If the profit of different land uses is equal the equilibrium condition of different land uses is achieved in space. Two types of generalized mecha-nism models emerge based on this theory.
(i) Generalized Thunen-Ricardo Model. Thunen’s land rent theory considers that the amount of net in-come of land products in a region equals the gross in-come subtracting the production cost and that trans-portation cost is purely determined by the distance measurement to one consumption center on the as-sumption that the consumption center is in a plain and the homogenous region is isolated from other re-gions[11]. Since the 1960s, economic geography, re-gional economics, urban economics and land econom-ics have redeveloped the Thunen’s land rent theory. The Generalized Thunen-Ricardo Model (GTR) pro-posed by Konagaya employs two explanatory vari-ables[12] including Thunen component to reflect loca-tion difference and Richard variable to reflect land quality which often refers to the natural conditions of land. Because there are many spatial variables in GTR it can be used to predict the spatial land use change. However, the ideal rent model is difficult to apply in reality because (1) land rent is difficult to be separated from profits; (2) economic data of land rent and land price are difficult to obtain; and (3) it is difficult to integrate the two concepts of land use capability and land quality.
(ii) Generalized equilibrium models. Local land use spatial pattern is considered as the result of deci-sion-making by individual land manager under the framework of natural conditions, economic feasibility and political permissibility. There are many types of the model such as the land use model using linear pro-gramming approach in NELUP project of British Newcastle University[14], Forest and Agricultural Sec-tor Optimization Model of the USDA[15].
1.2 Empirical models of land use change
One notable example of this type of models is the equation supposed by Ehrlich, which linked environ-
Spatial heterogeneity of the driving forces of cropland change in China 2233
mental changes (including land use change) with population, wealth and technology[16]. Other research-ers developed the models using individual behaviors and including spatial processes later[17,18]. Using these models, Chinese researchers have analyzed and simu-lated the land use changes in different regions in China and made some progresses[19―21].
In summary, both types of models have their own advantages and disadvantages. Although generalized mechanism models emphasize the mechanism proc-esses,the model’s requirements are difficult to meet in the complex world. Moreover, the assumptions of these models usually have considerable limitations such as the imperfect competition of the land market. On the other hand, land use changes are often con-strained by external factors and many input data of the models are difficult to acquire, which limits the appli-cation of the models. Most current empirical models usually cannot explain accurately the driving forces of land use change, although these models simulate spa-tial-temporal change well. Many of these models are limited to an individual region by considering only the internal factors of the region and ignoring the external driving forces. Some regression analysis often ignores the spatial dependence of land use change, thus the parameter estimates and result test using ordinary least square (OLS) are not reliable [22,23,34].
In this study, China’s cropland change is considered as a whole and a systematic integrated classification has been drawn. Both the internal and external drivers and their differences were taken into account. These drivers included the natural constraints and their changing process, social and economic dynamics, and regional differences. The cropland classification has been modified using spatial statistical models.
2 Data sets and preprocessing
The data sets used by this study include: (1) land use digital satellite remote sensing data acquired in 1987―1989 and 1999―2000 with original scale 1:100000[4] respectively, which was provided by Re-sources and Environment Data Center, CAS, China; (2) grid data set of land use/land cover of China with a spatial resolution of 1 kilometer[5,24]; (3) 1:250000
China geographical background data; (4) grid map of ecological environment with a spatial resolution of 1 kilometer in the late 1980s; (5) regionalization map of land resources potentiality in China in the late 1980s made by Shi Y. et al.[25]; (6) historical climatic data from 1961 to 2000; and (7) urban or county economic statistical data published by National Statistical Bu-reau in 1990 and 2000.
Both the change of natural conditions and the de-velopment of society and economy can either con-strain or promote the change of land use and land cover[15―17]. In this paper, we employed the driving force reflexes method, that is, we first established the relationship of land use change with the driving force reflection or related measurable data, and then ex-plained the relationship of land use change and its driving forces.
3 Classification of driving forces for cropland change
Significant regional differences of the spatial pat-terns of land use change existed and the driving force varied with the regions in China[26]. Thus, it is almost impossible to construct a universal land use driving force model suitable for all the regions. In this paper, we first divided whole China into several regions. Then we analyzed the land use driving force features in each region, which provided a fundamental frame-work for model development. The concept of classifi-cation is different from the traditional regionalization, that is, classification in this paper is referred to spatial classification and one class can appear in multiple disjunct units.
3.1 Approaches
Theoretically, driving force classification should rely on regional understanding of driving forces. But due to the complexity of driving forces and large amount data processing requirements, we were unable to directly classify the driving forces in county level. In this study, we first identified the driving force re-flexes which are accessible and reflect the causes in a qualitative way. Second, we analyzed the relationship between the reflexes and the land use changes. Third, we examined the relationship between the driving
2234 Science in China Ser. D Earth Sciences
force and its reflex. Finally, we classified the units with similar driving force reflexes and similar land use change intensions as one class.
(i) Selection of driving force reflexes based on mechanisms. In the long term, changes of natural conditions have important effects on land use change; while in a short term, these effects appear to be more a constraint than a driver. Thus, we chose driving force reflexes of cropland change based on geographical limitation, constraint of natural change and economic development.
(1) Constraint variable set includes average eleva-tion of basic unit, slope and land resource potential for agriculture. Elevation and slope could influence how difficult to cultivate the unit. The variable of land re-source potential for agriculture is measured by the classification result of land resource potential for ag-riculture made by Shi Y.[25]. The classification includes soil erosion, slope, ratio of rock exposed, soil texture, effective soil thickness, saline degree, hydrological conditions and drainability, moisture and temperature.
(2) Natural condition change variable set includes the changes of annual average precipitation and tem-perature. Many studies showed that the regions in northern China are becoming more drought in the re-cent dozen years[24, 27―29]1). It is likely that more crop-land will be abandoned or flow into grassland due to the precipitation decreasing significantly. Temperature rising will result in evapotranspiration increase, which has worsened the ravages of a drought condition and pushed the drought belt moving northward[29]. At pre-sent, global warming has been acknowledged by many studies. For example, the studies and reports by Inter-national Corn Institution and American Carnegie In-stitution showed that the temperature increase by 1℃ led to a decrease of the corn production by 10% be-cause the warm will inhibit the corn growth[30]. If the climate changing trend with frequent extreme climate events in recent dozen of years continues, the food production in developing countries will decrease
by 3%―5% (by 5%―8% in Asia). The difference in annual average precipitation between 1991―2000 and 1981―1990 was treated as the average annual pre-cipitation change in the past decade. Similarly, we used this approach to calculate the average annual ac-cumulated temperature change in the past decade. Annual average precipitation and temperature data were collected and interpolated from daily weather data of 476 observation stations covering the whole country.
(3) Economic driver reflexes set includes the changes of GDP rate, the change of GDP per capita, the change of total population and the change of urban population in basic unit during 1990 to 2000. The rapid economic growth in recent decades in China has led to the adjustment of industrial structure and the progress of the urbanization. The increasing popula-tion will put more pressure on food production and living conditions. With the rapid urbanization, it is inevitable that more cropland adjacent to cities will be converted into urban area. Therefore, this study chose the economic indices (GDP, GDP per capita) and eco-nomic quality (the ratio change of three industries) changes, urban population changes to measure the possible driving forces of cropland change.
(4) Socio-economic foundation reflex set includes the density of road and railway in the basic unit. Transportation is the foundation for a region’s devel-opment. Land use change is partly constrained by transportation. The regional difference of transporta-tion can partly reflect the possible difference of land use change.
(5) Economic policy reflex is represented by the development zone area ratio. This variable is measured by the ratio of development zone planning area di-vided by the county or city area. The development zones include economic technological development zone, high-tech development zone, export processing zone, free trade zone and border economic cooperative zone. In the past dozen years, about 6866 development
1) Liu J., Liu M., Tian H. et al., Spatial and temporal patterns of China’s cropland during 1990―2000: An analysis based on Landsat TM data, submitted to Remote Sensing of Environment, 2005.
Spatial heterogeneity of the driving forces of cropland change in China 2235
zones have been set up and covered 38600 square kilometer, which may be an important factor responsi-ble for the decrease of cropland area in China.
(6) Urban influence variable: Not only the internal economic factors have effects on the region’s land use change, but also the external forces from the large cit-ies around the region should not be ignored. Regional interaction intensity is used to measure the intensity of economic contact between regions, which reflects not only the economic center influence on the neighbor-hood, but also the assimilation capability of the cen-ter’s influence in the neighborhood[32]. Famous geog-rapher E. J. Taaffe thought that, economic interaction intensity is in direct proportion to the product of two regions’ population, and in inverse proportion to the distance square between the two regions[33]. We think that for two regions with the same population, the lar-ger economy has more capability to make its neighbors adjust their industry structures and result in the cropland loss. Therefore, the product of GDP and population size is used to measure a city’s influence on its neighbors. Meanwhile, the degree of urbanization and industrialization of the city is also considered. The influence received by a county should be an integrated influence from all big cities in some radius of the county.
We define urban influence using equation (1) by considering the existing results of regional economic contact[32,33] and the actual cropland change in China:
1,
1UrbanInfluence SQRT
Townpop ScndGDP12 Totpop GDP
(Totpop ) * (Totpop *GDP ), 1,2, , ,
dist
i
ii
kj j
j j i j j
a bj i i
dij
k
i
= ≠
=
⎛ ⎛ ⎞⎜ +⎜ ⎟⎜ ⎟⎜ ⎝ ⎠⎝
⎞⎛ ⎞⎟⎜ ⎟×
⎜ ⎟⎟⎝ ⎠⎠
∑
n=
(1)
where UrbanInfluencei is the average influence of county i received from ki big cities within the radius r of the county (the administrative rank of j is higher than prefecture-level), and Totpop
ii and Totpopj are the
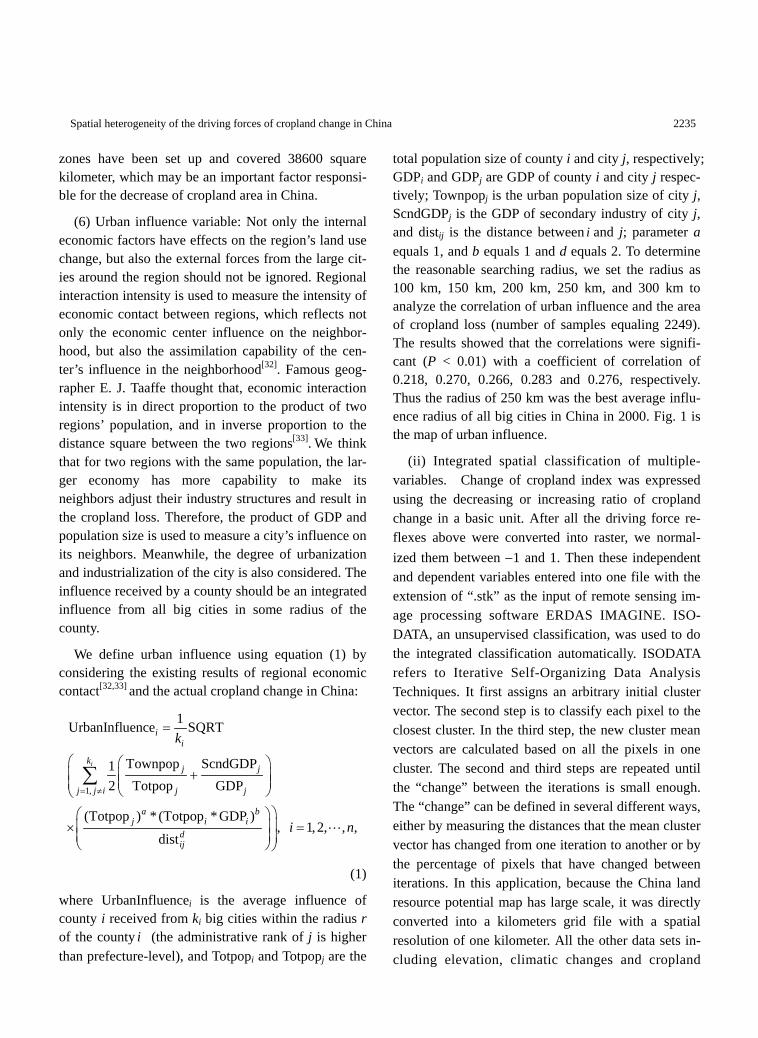
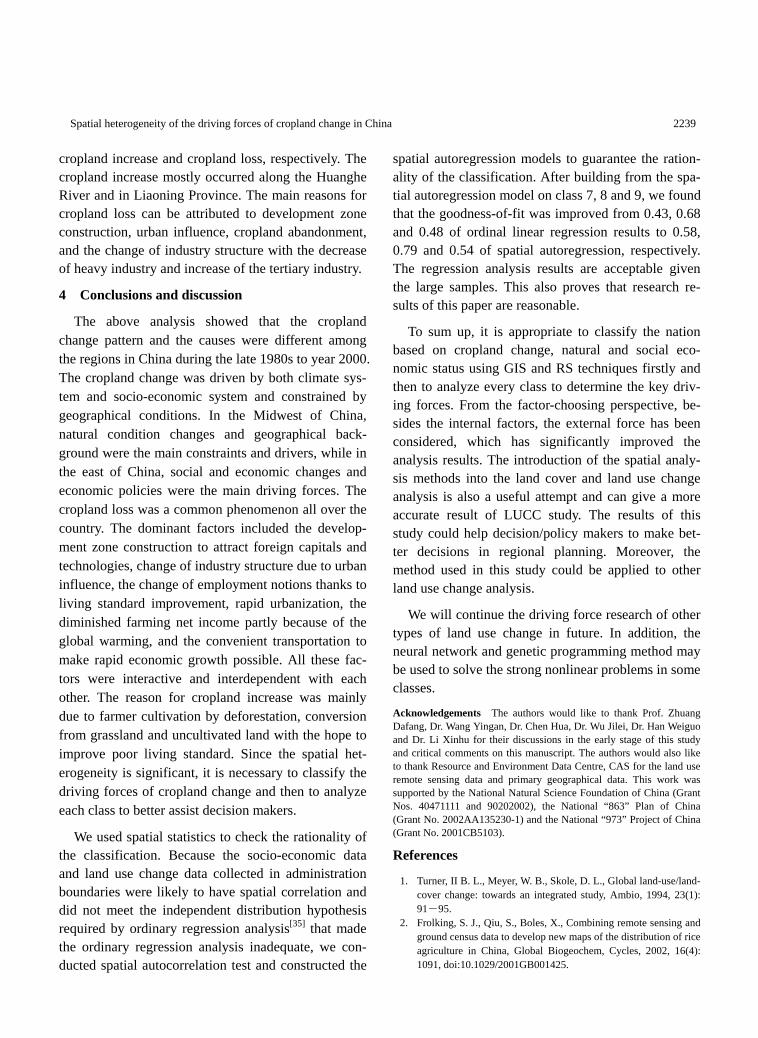
total population size of county i and city j, respectively; GDPi and GDPj are GDP of county i and city j respec-tively; Townpopj is the urban population size of city j, ScndGDPj is the GDP of secondary industry of city j, and distij is the distance between i and j; parameter a equals 1, and b equals 1 and d equals 2. To determine the reasonable searching radius, we set the radius as 100 km, 150 km, 200 km, 250 km, and 300 km to analyze the correlation of urban influence and the area of cropland loss (number of samples equaling 2249). The results showed that the correlations were signifi-cant (P < 0.01) with a coefficient of correlation of 0.218, 0.270, 0.266, 0.283 and 0.276, respectively. Thus the radius of 250 km was the best average influ-ence radius of all big cities in China in 2000. Fig. 1 is the map of urban influence.
(ii) Integrated spatial classification of multiple- variables. Change of cropland index was expressed using the decreasing or increasing ratio of cropland change in a basic unit. After all the driving force re-flexes above were converted into raster, we normal-ized them between −1 and 1. Then these independent and dependent variables entered into one file with the extension of “.stk” as the input of remote sensing im-age processing software ERDAS IMAGINE. ISO-DATA, an unsupervised classification, was used to do the integrated classification automatically. ISODATA refers to Iterative Self-Organizing Data Analysis Techniques. It first assigns an arbitrary initial cluster vector. The second step is to classify each pixel to the closest cluster. In the third step, the new cluster mean vectors are calculated based on all the pixels in one cluster. The second and third steps are repeated until the “change” between the iterations is small enough. The “change” can be defined in several different ways, either by measuring the distances that the mean cluster vector has changed from one iteration to another or by the percentage of pixels that have changed between iterations. In this application, because the China land resource potential map has large scale, it was directly converted into a kilometers grid file with a spatial resolution of one kilometer. All the other data sets in-cluding elevation, climatic changes and cropland
2236 Science in China Ser. D Earth Sciences
Fig. 1. Urban influence of big cities in China in 2000.
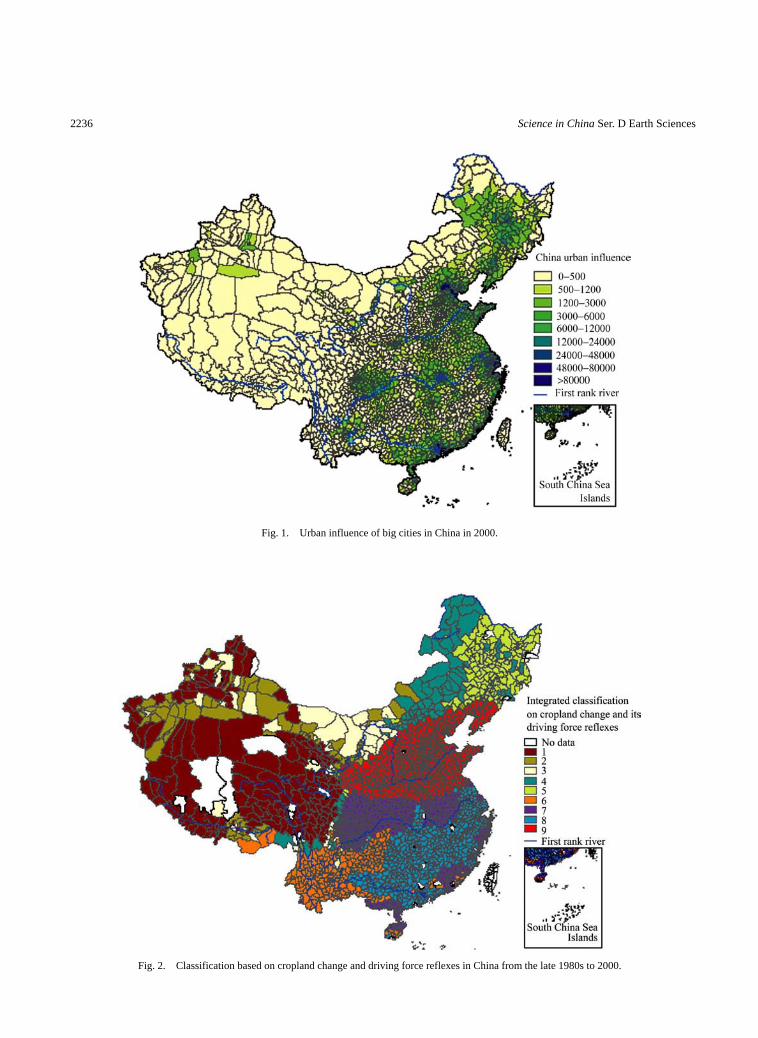
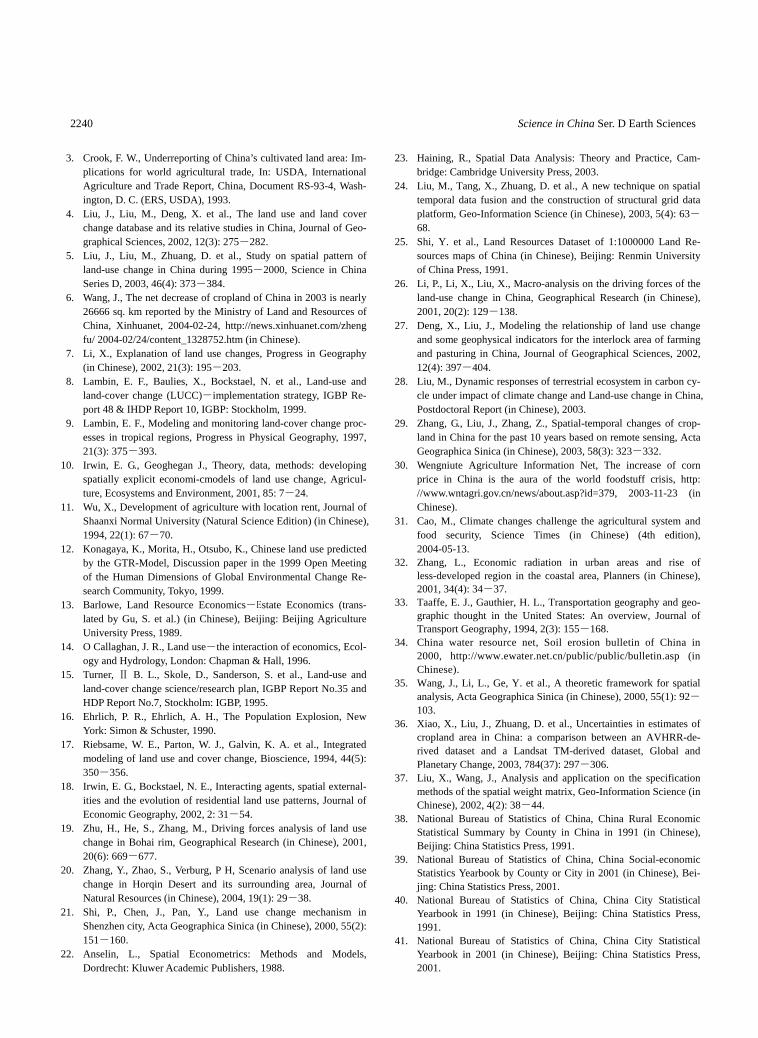
Fig. 2. Classification based on cropland change and driving force reflexes in China from the late 1980s to 2000.
Spatial heterogeneity of the driving forces of cropland change in China 2237
changes are kilometer grids. To make the classification convergent, these grid data sets were collected by county as the basic unit and their average number in the basic unit was converted into kilometer grid again. The statistical economic data in county scale were di-rectly converted into kilometer grids. Thus, different scale spatial data were compiled and analyzed simul-taneously.
3.2 Results of the integrated classification of the cropland change and driving forces
The result of the integrated classification of the
cropland change and driving forces is displayed in Fig. 2.
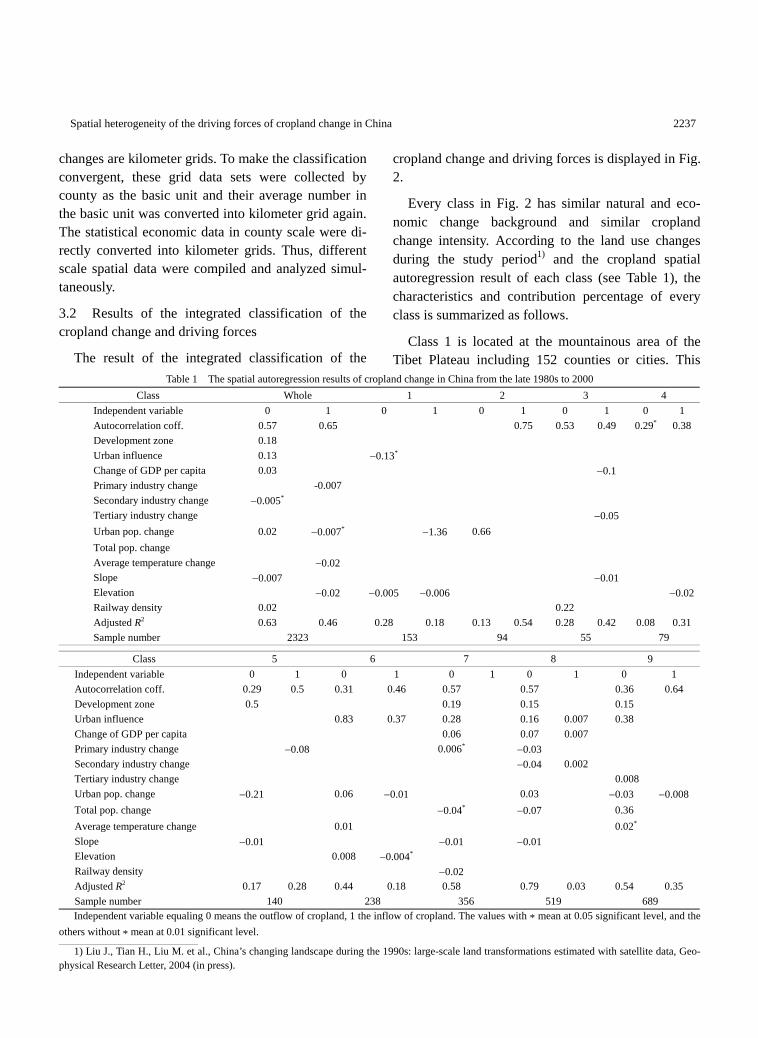
Every class in Fig. 2 has similar natural and eco-nomic change background and similar cropland change intensity. According to the land use changes during the study period1) and the cropland spatial autoregression result of each class (see Table 1), the characteristics and contribution percentage of every class is summarized as follows.
Class 1 is located at the mountainous area of the Tibet Plateau including 152 counties or cities. This
Table 1 The spatial autoregression results of cropland change in China from the late 1980s to 2000 Class Whole 1 2 3 4
Independent variable 0 1 0 1 0 1 0 1 0 1 Autocorrelation coff. 0.57 0.65 0.75 0.53 0.49 0.29* 0.38Development zone 0.18 Urban influence 0.13 −0.13* Change of GDP per capita 0.03 −0.1 Primary industry change -0.007 Secondary industry change −0.005* Tertiary industry change −0.05 Urban pop. change 0.02 −0.007* −1.36 0.66 Total pop. change Average temperature change −0.02 Slope −0.007 −0.01 Elevation −0.02 −0.005 −0.006 −0.02Railway density 0.02 0.22 Adjusted R2 0.63 0.46 0.28 0.18 0.13 0.54 0.28 0.42 0.08 0.31Sample number 2323 153 94 55 79
Class 5 6 7 8 9 Independent variable 0 1 0 1 0 1 0 1 0 1 Autocorrelation coff. 0.29 0.5 0.31 0.46 0.57 0.57 0.36 0.64 Development zone 0.5 0.19 0.15 0.15 Urban influence 0.83 0.37 0.28 0.16 0.007 0.38 Change of GDP per capita 0.06 0.07 0.007 Primary industry change −0.08 0.006* −0.03 Secondary industry change −0.04 0.002 Tertiary industry change 0.008 Urban pop. change −0.21 0.06 −0.01 0.03 −0.03 −0.008 Total pop. change −0.04* −0.07 0.36 Average temperature change 0.01 0.02* Slope −0.01 −0.01 −0.01 Elevation 0.008 −0.004* Railway density −0.02 Adjusted R2 0.17 0.28 0.44 0.18 0.58 0.79 0.03 0.54 0.35 Sample number 140 238 356 519 689 Independent variable equaling 0 means the outflow of cropland, 1 the inflow of cropland. The values with * mean at 0.05 significant level, and the
others without * mean at 0.01 significant level.
1) Liu J., Tian H., Liu M. et al., China’s changing landscape during the 1990s: large-scale land transformations estimated with satellite data, Geo-physical Research Letter, 2004 (in press).
2238 Science in China Ser. D Earth Sciences
area accounted for 4.31% and 2.82% of nationwide cropland increase and cropland loss, respectively. Its natural environment is harsh and the economic growth is slow. The cropland amount is stable. The main fac-tors influencing cropland loss are elevation and urban influence. In contrast, the cropland increase is primar-ily due to the decrease of urban population.
Class 2 is located in the region with relatively good natural conditions in northwest China, containing 93 counties or cities. This area accounted for 8.83% and 4.87% of nationwide cropland increase and cropland loss, respectively. Cropland area has decreased a little bit and much grassland has been converted into crop-land. The cropland loss is mainly due to population increase and urbanization. The cropland increase is caused by global warming and more area is suitable for cultivation.
Class 3 is mainly distributed in arid deserts con-taining 54 counties/cities. This area accounted for 3.33% and 3.95% of nationwide cropland increase and cropland loss, respectively. Grassland and wasteland were converted to cropland. Due to the deteriorative ecological environment the cultivation and abandon-ment coexist. The cropland loss is influenced by ele-vation and primarily exists along railways; cropland increase had negative correlation with the change of third industry, slope and GDP per capita change, indi-cating that the cropland increase occurred in the coun-ties with slow growth of the tertiary industry and GDP per capita.
Class 4 is mainly located in the semiarid region of Inner Mongolia including 78 counties/cities. This area accounted for 17.31% and 10.98% of nationwide cropland increase and cropland loss, respectively. Cropland was converted into grassland or abandoned. The soil erosion[34] and ecological restoration of for-ests and grassland from cropland are the main causes of cropland loss. Cropland increase mainly occurred in the counties with low elevation and slow growth of GDP per capita.
Class 5 is located in the northeast of China includ-ing 139 counties/cities. This area accounted for 48.7% and 9.86% of nationwide cropland increase and crop-
land loss, respectively. Many forestland and some grassland and wasteland were converted into cropland although a small proportion of cropland was reforested in some counties. The cropland loss mainly happened in plains. Because the study period was up to the year 2000, the policy of ecological restoration of forests and grassland from cropland was just started and the effect on cropland was not significant. The cropland loss was primarily due to the increasing construction of development zone and the urban population. The cropland increase mainly resulted from the cultivation unselectively due to poverty. However, the climate warming did not bring much economical benefit for the farmers who cultivated these croplands.
Class 6 is located in Yungui Plateau including 237 counties/cities. This area accounted for 2.15% and 4.59% of nationwide cropland increase and cropland loss, respectively. The main reasons for cropland change were urban influence of the big cities around and the increasing urban population. The cropland in the regions with high elevation, rising temperature and convenient transportation was converted into forest-land, grassland and construction land, while in some counties the forestland was cultivated into cropland.
Class 7 is mainly located in the Sichuan Basin, delta area between the Changjiang River and the Huaihe River and in part of coastal areas of South China in-cluding 355 counties/cities. This area accounted for 2.9% and 11.9% of nationwide cropland increase and cropland loss, respectively. The driving forces of cropland loss included development zone construction, cropland abandonment due to living standard increase, the change of industry structure with the decrease of heavy industry and increase of the tertiary industry.
Class 8 is located in the catchments area of the Changjiang River and part of South China including 518 counties/cities. This area accounted for 2.18% and 22.55% of nationwide cropland increase and cropland loss, respectively. The main reasons for cropland loss were similar to the class 7, but at much higher rate.
Class 9 is mostly located in the Loess Plateau and the Bohai Bay rim including 688 counties/cities. This area accounted for 10.28% and 28.4% of nationwide
Spatial heterogeneity of the driving forces of cropland change in China 2239
cropland increase and cropland loss, respectively. The cropland increase mostly occurred along the Huanghe River and in Liaoning Province. The main reasons for cropland loss can be attributed to development zone construction, urban influence, cropland abandonment, and the change of industry structure with the decrease of heavy industry and increase of the tertiary industry.
4 Conclusions and discussion
The above analysis showed that the cropland change pattern and the causes were different among the regions in China during the late 1980s to year 2000. The cropland change was driven by both climate sys-tem and socio-economic system and constrained by geographical conditions. In the Midwest of China, natural condition changes and geographical back-ground were the main constraints and drivers, while in the east of China, social and economic changes and economic policies were the main driving forces. The cropland loss was a common phenomenon all over the country. The dominant factors included the develop-ment zone construction to attract foreign capitals and technologies, change of industry structure due to urban influence, the change of employment notions thanks to living standard improvement, rapid urbanization, the diminished farming net income partly because of the global warming, and the convenient transportation to make rapid economic growth possible. All these fac-tors were interactive and interdependent with each other. The reason for cropland increase was mainly due to farmer cultivation by deforestation, conversion from grassland and uncultivated land with the hope to improve poor living standard. Since the spatial het-erogeneity is significant, it is necessary to classify the driving forces of cropland change and then to analyze each class to better assist decision makers.
We used spatial statistics to check the rationality of the classification. Because the socio-economic data and land use change data collected in administration boundaries were likely to have spatial correlation and did not meet the independent distribution hypothesis required by ordinary regression analysis[35] that made the ordinary regression analysis inadequate, we con-ducted spatial autocorrelation test and constructed the
spatial autoregression models to guarantee the ration-ality of the classification. After building from the spa-tial autoregression model on class 7, 8 and 9, we found that the goodness-of-fit was improved from 0.43, 0.68 and 0.48 of ordinal linear regression results to 0.58, 0.79 and 0.54 of spatial autoregression, respectively. The regression analysis results are acceptable given the large samples. This also proves that research re-sults of this paper are reasonable.
To sum up, it is appropriate to classify the nation based on cropland change, natural and social eco-nomic status using GIS and RS techniques firstly and then to analyze every class to determine the key driv-ing forces. From the factor-choosing perspective, be-sides the internal factors, the external force has been considered, which has significantly improved the analysis results. The introduction of the spatial analy-sis methods into the land cover and land use change analysis is also a useful attempt and can give a more accurate result of LUCC study. The results of this study could help decision/policy makers to make bet-ter decisions in regional planning. Moreover, the method used in this study could be applied to other land use change analysis.
We will continue the driving force research of other types of land use change in future. In addition, the neural network and genetic programming method may be used to solve the strong nonlinear problems in some classes.
Acknowledgements The authors would like to thank Prof. Zhuang Dafang, Dr. Wang Yingan, Dr. Chen Hua, Dr. Wu Jilei, Dr. Han Weiguo and Dr. Li Xinhu for their discussions in the early stage of this study and critical comments on this manuscript. The authors would also like to thank Resource and Environment Data Centre, CAS for the land use remote sensing data and primary geographical data. This work was supported by the National Natural Science Foundation of China (Grant Nos. 40471111 and 90202002), the National “863” Plan of China (Grant No. 2002AA135230-1) and the National “973” Project of China (Grant No. 2001CB5103).
References
1. Turner, II B. L., Meyer, W. B., Skole, D. L., Global land-use/land- cover change: towards an integrated study, Ambio, 1994, 23(1): 91―95.
2. Frolking, S. J., Qiu, S., Boles, X., Combining remote sensing and ground census data to develop new maps of the distribution of rice agriculture in China, Global Biogeochem, Cycles, 2002, 16(4): 1091, doi:10.1029/2001GB001425.
2240 Science in China Ser. D Earth Sciences
3. Crook, F. W., Underreporting of China’s cultivated land area: Im-plications for world agricultural trade, In: USDA, International Agriculture and Trade Report, China, Document RS-93-4, Wash-ington, D. C. (ERS, USDA), 1993.
4. Liu, J., Liu, M., Deng, X. et al., The land use and land cover change database and its relative studies in China, Journal of Geo-graphical Sciences, 2002, 12(3): 275―282.
5. Liu, J., Liu, M., Zhuang, D. et al., Study on spatial pattern of land-use change in China during 1995―2000, Science in China Series D, 2003, 46(4): 373―384.
6. Wang, J., The net decrease of cropland of China in 2003 is nearly 26666 sq. km reported by the Ministry of Land and Resources of China, Xinhuanet, 2004-02-24, http://news.xinhuanet.com/zheng fu/ 2004-02/24/content_1328752.htm (in Chinese).
7. Li, X., Explanation of land use changes, Progress in Geography (in Chinese), 2002, 21(3): 195―203.
8. Lambin, E. F., Baulies, X., Bockstael, N. et al., Land-use and land-cover change (LUCC)―implementation strategy, IGBP Re-port 48 & IHDP Report 10, IGBP: Stockholm, 1999.
9. Lambin, E. F., Modeling and monitoring land-cover change proc-esses in tropical regions, Progress in Physical Geography, 1997, 21(3): 375―393.
10. Irwin, E. G., Geoghegan J., Theory, data, methods: developing spatially explicit economi-cmodels of land use change, Agricul-ture, Ecosystems and Environment, 2001, 85: 7―24.
11. Wu, X., Development of agriculture with location rent, Journal of Shaanxi Normal University (Natural Science Edition) (in Chinese), 1994, 22(1): 67―70.
12. Konagaya, K., Morita, H., Otsubo, K., Chinese land use predicted by the GTR-Model, Discussion paper in the 1999 Open Meeting of the Human Dimensions of Global Environmental Change Re-search Community, Tokyo, 1999.
13. Barlowe, Land Resource Economics―Estate Economics (trans-lated by Gu, S. et al.) (in Chinese), Beijing: Beijing Agriculture University Press, 1989.
14. O Callaghan, J. R., Land use―the interaction of economics, Ecol-ogy and Hydrology, London: Chapman & Hall, 1996.
15. Turner, BⅡ . L., Skole, D., Sanderson, S. et al., Land-use and land-cover change science/research plan, IGBP Report No.35 and HDP Report No.7, Stockholm: IGBP, 1995.
16. Ehrlich, P. R., Ehrlich, A. H., The Population Explosion, New York: Simon & Schuster, 1990.
17. Riebsame, W. E., Parton, W. J., Galvin, K. A. et al., Integrated modeling of land use and cover change, Bioscience, 1994, 44(5): 350―356.
18. Irwin, E. G., Bockstael, N. E., Interacting agents, spatial external-ities and the evolution of residential land use patterns, Journal of Economic Geography, 2002, 2: 31―54.
19. Zhu, H., He, S., Zhang, M., Driving forces analysis of land use change in Bohai rim, Geographical Research (in Chinese), 2001, 20(6): 669―677.
20. Zhang, Y., Zhao, S., Verburg, P H, Scenario analysis of land use change in Horqin Desert and its surrounding area, Journal of Natural Resources (in Chinese), 2004, 19(1): 29―38.
21. Shi, P., Chen, J., Pan, Y., Land use change mechanism in Shenzhen city, Acta Geographica Sinica (in Chinese), 2000, 55(2): 151―160.
22. Anselin, L., Spatial Econometrics: Methods and Models, Dordrecht: Kluwer Academic Publishers, 1988.
23. Haining, R., Spatial Data Analysis: Theory and Practice, Cam-bridge: Cambridge University Press, 2003.
24. Liu, M., Tang, X., Zhuang, D. et al., A new technique on spatial temporal data fusion and the construction of structural grid data platform, Geo-Information Science (in Chinese), 2003, 5(4): 63―68.
25. Shi, Y. et al., Land Resources Dataset of 1:1000000 Land Re-sources maps of China (in Chinese), Beijing: Renmin University of China Press, 1991.
26. Li, P., Li, X., Liu, X., Macro-analysis on the driving forces of the land-use change in China, Geographical Research (in Chinese), 2001, 20(2): 129―138.
27. Deng, X., Liu, J., Modeling the relationship of land use change and some geophysical indicators for the interlock area of farming and pasturing in China, Journal of Geographical Sciences, 2002, 12(4): 397―404.
28. Liu, M., Dynamic responses of terrestrial ecosystem in carbon cy-cle under impact of climate change and Land-use change in China, Postdoctoral Report (in Chinese), 2003.
29. Zhang, G., Liu, J., Zhang, Z., Spatial-temporal changes of crop-land in China for the past 10 years based on remote sensing, Acta Geographica Sinica (in Chinese), 2003, 58(3): 323―332.
30. Wengniute Agriculture Information Net, The increase of corn price in China is the aura of the world foodstuff crisis, http: //www.wntagri.gov.cn/news/about.asp?id=379, 2003-11-23 (in Chinese).
31. Cao, M., Climate changes challenge the agricultural system and food security, Science Times (in Chinese) (4th edition), 2004-05-13.
32. Zhang, L., Economic radiation in urban areas and rise of less-developed region in the coastal area, Planners (in Chinese), 2001, 34(4): 34―37.
33. Taaffe, E. J., Gauthier, H. L., Transportation geography and geo-graphic thought in the United States: An overview, Journal of Transport Geography, 1994, 2(3): 155―168.
34. China water resource net, Soil erosion bulletin of China in 2000, http://www.ewater.net.cn/public/public/bulletin.asp (in Chinese).
35. Wang, J., Li, L., Ge, Y. et al., A theoretic framework for spatial analysis, Acta Geographica Sinica (in Chinese), 2000, 55(1): 92―103.
36. Xiao, X., Liu, J., Zhuang, D. et al., Uncertainties in estimates of cropland area in China: a comparison between an AVHRR-de- rived dataset and a Landsat TM-derived dataset, Global and Planetary Change, 2003, 784(37): 297―306.
37. Liu, X., Wang, J., Analysis and application on the specification methods of the spatial weight matrix, Geo-Information Science (in Chinese), 2002, 4(2): 38―44.
38. National Bureau of Statistics of China, China Rural Economic Statistical Summary by County in China in 1991 (in Chinese), Beijing: China Statistics Press, 1991.
39. National Bureau of Statistics of China, China Social-economic Statistics Yearbook by County or City in 2001 (in Chinese), Bei-jing: China Statistics Press, 2001.
40. National Bureau of Statistics of China, China City Statistical Yearbook in 1991 (in Chinese), Beijing: China Statistics Press, 1991.
41. National Bureau of Statistics of China, China City Statistical Yearbook in 2001 (in Chinese), Beijing: China Statistics Press, 2001.