THE EFFECT OF BUILT SPACE ON WAYFINDING IN URBAN ENVIRONMENTS: a study of the historical peninsula...
20
PAPER REF # 8029 Proceedings: Eighth International Space Syntax Symposium Edited by M. Greene, J. Reyes and A. Castro. Santiago de Chile: PUC, 2012. 8029:1 THE EFFECT OF BUILT SPACE ON WAYFINDING IN URBAN ENVIRONMENTS: a study of the historical peninsula in Istanbul AUTHOR: Ayşe Sema KUBAT Istanbul Technical University, Faculty of Architecture, Department of City & Regional Planning, Turkey e‐mail: [email protected] Ayşe ÖZBIL Okan University, Faculty of Engineering and Architecture, Department of Architecture, Turkey e‐mail: [email protected] Özlem ÖZER Istanbul Technical University, Faculty of Architecture, Department of City & Regional Planning, Turkey e‐mail: [email protected] Harun EKİNOĞLU Istanbul Technical University, Faculty of Architecture, Department of City & Regional Planning, Turkey e‐mail: [email protected] KEYWORDS: Urban Wayfinding, Spatial Layout, Visibility, Urban Morphology, Istanbul THEME: Spatial Cognition Abstract This paper reconsiders the question of how the built environment, in terms of the spatial configuration of urban layout and land‐use patterns, affects wayfinding performance. In an attempt to develop physical design solutions, first‐time visitors’ directed search patterns within a 2x2km area in the historical peninsula of Sultanahmet, İstanbul, are recorded. The recorded data are analyzed to determine the extent to which street connectivity, measured by metric and directional reach, and visibility patterns, measured by visual integration, visual connectivity and visual clustering coefficient, are related to spatial learning –path selection for exploratory movement. This study enhances previous findings using space syntax by better controlling for the effects of land‐use as compared to the effects of spatial configuration of urban networks. Asserting the independent role of configurational design is important given that urban morphology acts as the long term framework within which land‐uses change over time. The findings imply that the overall spatial configuration of urban layouts –both at the local and global level– may prove to be an important variable for the description and modulation of human spatial behavior in urban environments.
Transcript of THE EFFECT OF BUILT SPACE ON WAYFINDING IN URBAN ENVIRONMENTS: a study of the historical peninsula...
PAPER REF # 8029 Proceedings: Eighth International Space Syntax Symposium Edited by M. Greene, J. Reyes and A. Castro. Santiago de Chile: PUC, 2012.
8029:1
THE EFFECT OF BUILT SPACE ON WAYFINDING IN URBAN ENVIRONMENTS: a study of the historical peninsula in Istanbul
AUTHOR: Ayşe Sema KUBAT Istanbul Technical University, Faculty of Architecture, Department of City & Regional Planning, Turkey e‐mail: [email protected] Ayşe ÖZBIL Okan University, Faculty of Engineering and Architecture, Department of Architecture, Turkey e‐mail: [email protected] Özlem ÖZER Istanbul Technical University, Faculty of Architecture, Department of City & Regional Planning, Turkey e‐mail: [email protected] Harun EKİNOĞLU Istanbul Technical University, Faculty of Architecture, Department of City & Regional Planning, Turkey e‐mail: [email protected]
KEYWORDS: Urban Wayfinding, Spatial Layout, Visibility, Urban Morphology, Istanbul
THEME: Spatial Cognition
Abstract
This paper reconsiders the question of how the built environment, in terms of the spatial configuration of
urban layout and land‐use patterns, affects wayfinding performance. In an attempt to develop physical
design solutions, first‐time visitors’ directed search patterns within a 2x2km area in the historical peninsula
of Sultanahmet, İstanbul, are recorded. The recorded data are analyzed to determine the extent to which
street connectivity, measured by metric and directional reach, and visibility patterns, measured by visual
integration, visual connectivity and visual clustering coefficient, are related to spatial learning –path
selection for exploratory movement. This study enhances previous findings using space syntax by better
controlling for the effects of land‐use as compared to the effects of spatial configuration of urban networks.
Asserting the independent role of configurational design is important given that urban morphology acts as
the long term framework within which land‐uses change over time. The findings imply that the overall spatial
configuration of urban layouts –both at the local and global level– may prove to be an important variable for
the description and modulation of human spatial behavior in urban environments.
Proceedings: Eighth International Space Syntax Symposium. Santiago de Chile: PUC, 2012.
8029:2
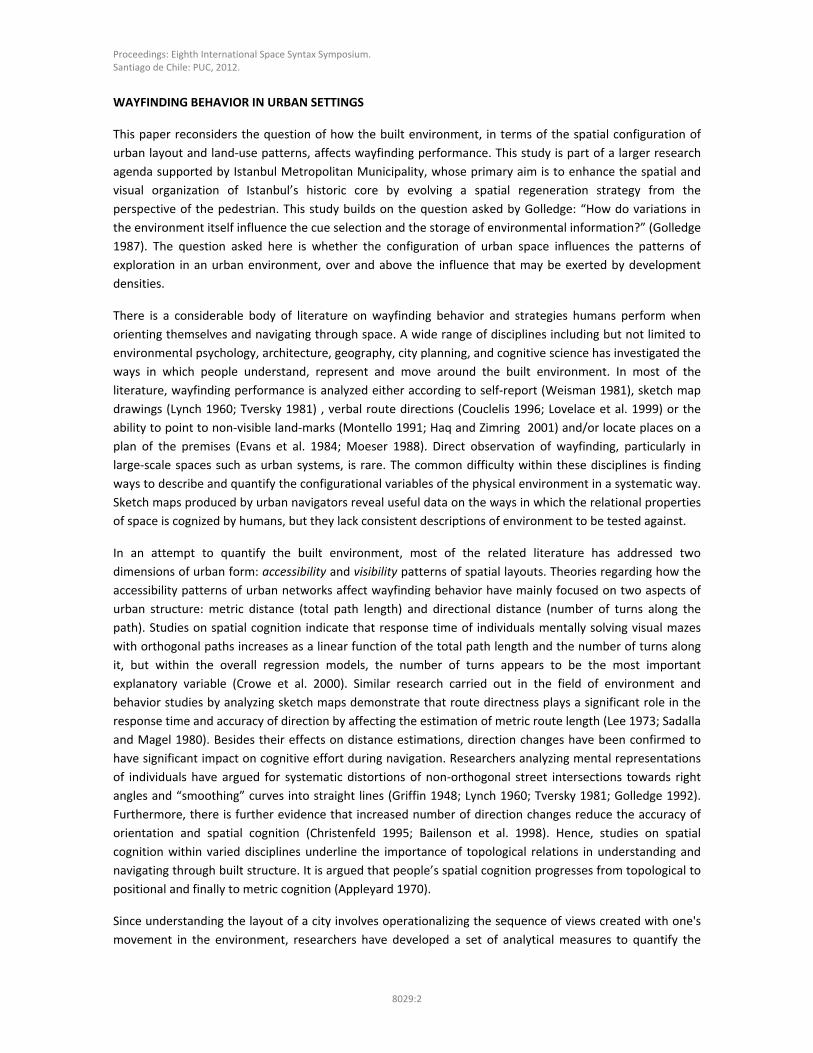
WAYFINDING BEHAVIOR IN URBAN SETTINGS
This paper reconsiders the question of how the built environment, in terms of the spatial configuration of
urban layout and land‐use patterns, affects wayfinding performance. This study is part of a larger research
agenda supported by Istanbul Metropolitan Municipality, whose primary aim is to enhance the spatial and
visual organization of Istanbul’s historic core by evolving a spatial regeneration strategy from the
perspective of the pedestrian. This study builds on the question asked by Golledge: “How do variations in
the environment itself influence the cue selection and the storage of environmental information?” (Golledge
1987). The question asked here is whether the configuration of urban space influences the patterns of
exploration in an urban environment, over and above the influence that may be exerted by development
densities.
There is a considerable body of literature on wayfinding behavior and strategies humans perform when
orienting themselves and navigating through space. A wide range of disciplines including but not limited to
environmental psychology, architecture, geography, city planning, and cognitive science has investigated the
ways in which people understand, represent and move around the built environment. In most of the
literature, wayfinding performance is analyzed either according to self‐report (Weisman 1981), sketch map
drawings (Lynch 1960; Tversky 1981) , verbal route directions (Couclelis 1996; Lovelace et al. 1999) or the
ability to point to non‐visible land‐marks (Montello 1991; Haq and Zimring 2001) and/or locate places on a
plan of the premises (Evans et al. 1984; Moeser 1988). Direct observation of wayfinding, particularly in
large‐scale spaces such as urban systems, is rare. The common difficulty within these disciplines is finding
ways to describe and quantify the configurational variables of the physical environment in a systematic way.
Sketch maps produced by urban navigators reveal useful data on the ways in which the relational properties
of space is cognized by humans, but they lack consistent descriptions of environment to be tested against.
In an attempt to quantify the built environment, most of the related literature has addressed two
dimensions of urban form: accessibility and visibility patterns of spatial layouts. Theories regarding how the
accessibility patterns of urban networks affect wayfinding behavior have mainly focused on two aspects of
urban structure: metric distance (total path length) and directional distance (number of turns along the
path). Studies on spatial cognition indicate that response time of individuals mentally solving visual mazes
with orthogonal paths increases as a linear function of the total path length and the number of turns along
it, but within the overall regression models, the number of turns appears to be the most important
explanatory variable (Crowe et al. 2000). Similar research carried out in the field of environment and
behavior studies by analyzing sketch maps demonstrate that route directness plays a significant role in the
response time and accuracy of direction by affecting the estimation of metric route length (Lee 1973; Sadalla
and Magel 1980). Besides their effects on distance estimations, direction changes have been confirmed to
have significant impact on cognitive effort during navigation. Researchers analyzing mental representations
of individuals have argued for systematic distortions of non‐orthogonal street intersections towards right
angles and “smoothing” curves into straight lines (Griffin 1948; Lynch 1960; Tversky 1981; Golledge 1992).
Furthermore, there is further evidence that increased number of direction changes reduce the accuracy of
orientation and spatial cognition (Christenfeld 1995; Bailenson et al. 1998). Hence, studies on spatial
cognition within varied disciplines underline the importance of topological relations in understanding and
navigating through built structure. It is argued that people’s spatial cognition progresses from topological to
positional and finally to metric cognition (Appleyard 1970).
Since understanding the layout of a city involves operationalizing the sequence of views created with one's
movement in the environment, researchers have developed a set of analytical measures to quantify the
Proceedings: Eighth International Space Syntax Symposium. Santiago de Chile: PUC, 2012.
8029:3
visual dimensions of spatial environments. Gibson's (1979) conception of ecological visual perception;
Giedion's (1971) classification of architectural types; ‘intervisibility’ developed in computer topographic
models (Gallagher 1972); isovists (Tandy 1967; Benedikt 1979) and viewsheds (Amidon and Elsner 1968;
Lynch 1976; Burrough 1986) in the fields of landscape architecture and planning; ‘all lines map’ (Peponis
1997), and visibility graph analysis (Turner and Penn 1999; Turner et. al. 2001) for the analysis of urban and
building spaces have been developed for the assessment of visual properties of the built environment. Using
these measures, studies on wayfinding research have found that the visual dimension of built space has a
strong influence on the way people move around in such complex built environments. Benedikt and
Burnham (1985) showed how perception of space is affected by various isovist attributes. HMSO (1994) and
Peatross (1997) used isovists as a way of classifying observations of behavior to identify crime locations and
control points. Analyzing housing estates in Athens Trova et al. (1999) revealed that the density of presence
is powerfully correlated with the properties of visual fields measured through isovist fields. Peponis et al.
(1997) explored convex partitions to describe movement as a pattern of discrete transitions from one space
to another. Turner et al. (2001) used visibility graph analysis to show the correlation between the local and
global dimensions of visibility and the movement patterns of visitors in the Tate Gallery. However; since
visual perception is relatively a local spatial property compared to the overall pattern of street connections
within the entire urban network, navigation through any complex environment requires a multilayered
description of the spatial structure.
Building on the existing literature, the theoretical question that this paper deals with is: How do connectivity
patterns, visual fields, and land‐use compositions interact to anticipate patterns of wayfinding behavior? In
exploring this question we concentrate on a syntactic analysis of directed search performance where
success depends on an understanding of configurational properties rather than solely relying on landmarks,
signage, or other cues. Concentrating on an experiment in a real‐world setting, this study might offer richer
clarifications to the relationship between wayfinding behavior and different measures of urban form –
namely spatial configuration of urban layout and land‐use compositions.
MEASURES AND TECHNIQUES
The study investigates mainly the accessibility and visibility properties of urban layouts but also aims to
unveil the significance of local urban design parameters in shaping the patterns of wayfinding behavior. To
this end, the basis of our analysis in this research is street connectivity and visibility patterns as a function of
network configuration. Thus, we chose to describe the configurational properties of the urban space with
regard to both visual and physical accessibility to determine the extent to which spatial patterns affect
navigational performance.
Segment‐based Measures of Connectivity
Segment‐based connectivity measures applied in this research (Peponis et al., 2008) offer a systematic
framework through which to evaluate the urban fabric in terms of its potentiality (density of streets) and
structure (directional bias based on configuration). The analysis is based on standard segment‐based
representations of street networks according to street center‐lines. The unit of analysis is the road segment.
Road segments extend between choice nodes, or street intersections at which movement can proceed in
two or more alternative directions. Road segments may contain one or more line segments. A line segment
Proceedings: Eighth International Space Syntax Symposium. Santiago de Chile: PUC, 2012.
8029:4
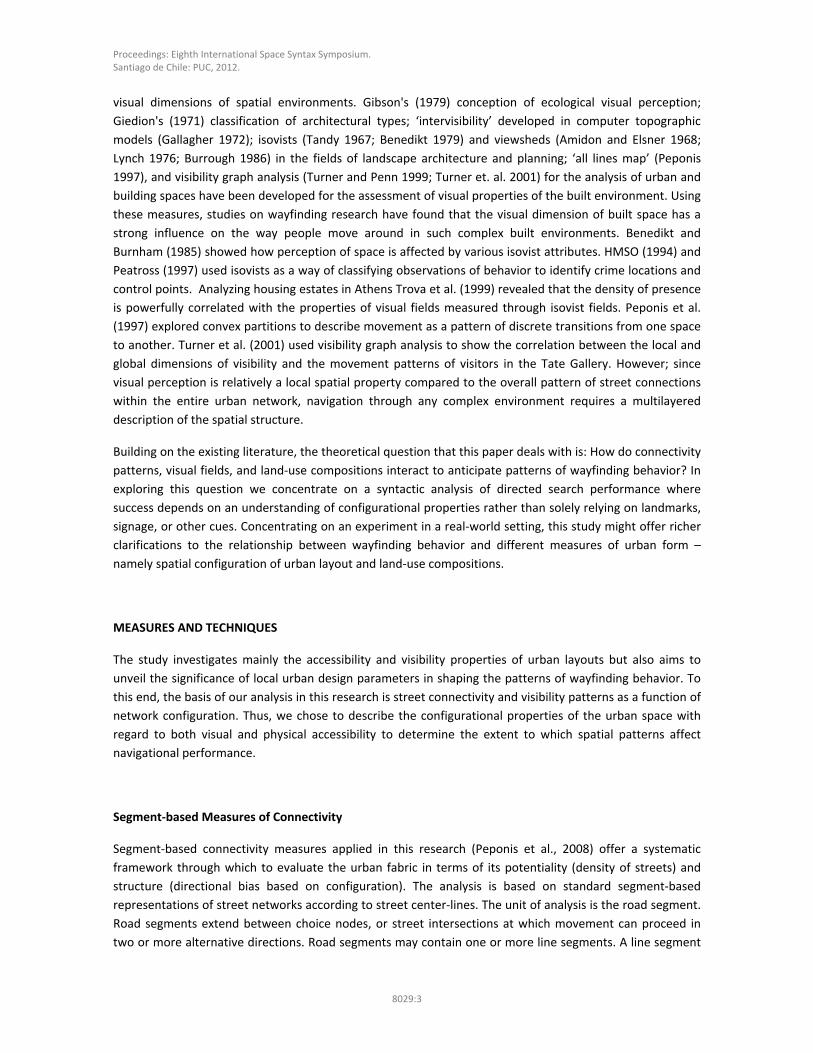
is the basic unit of the map drawn and is always defined as a single straight line. Thus, the analysis treats the
unit of analysis (the road segment, for which the individual values are computed) and the unit of
computation (the line segment which provides the base metric for values) as different entities. Figure 1
illustrates the new unit of analysis by clarifying the difference between road segments and line segments.
Figure 1. Definition of line segments and road segments. Source: Peponis et al. 2008.
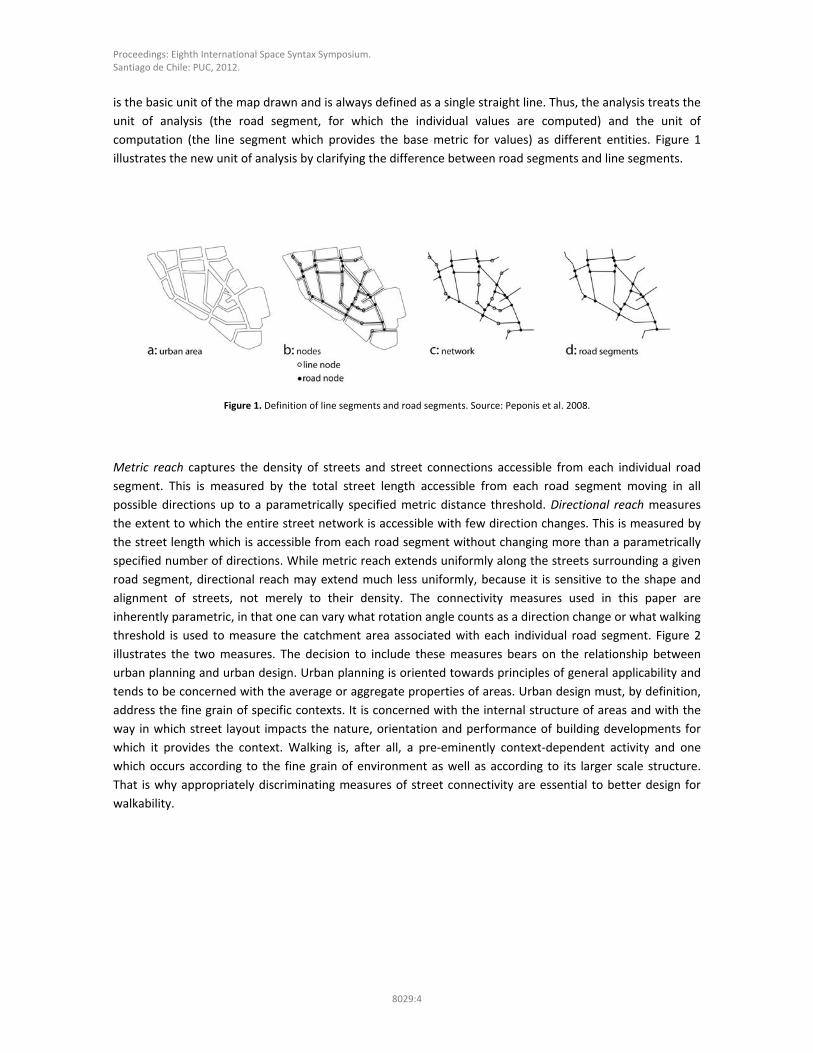
Metric reach captures the density of streets and street connections accessible from each individual road
segment. This is measured by the total street length accessible from each road segment moving in all
possible directions up to a parametrically specified metric distance threshold. Directional reach measures
the extent to which the entire street network is accessible with few direction changes. This is measured by
the street length which is accessible from each road segment without changing more than a parametrically
specified number of directions. While metric reach extends uniformly along the streets surrounding a given
road segment, directional reach may extend much less uniformly, because it is sensitive to the shape and
alignment of streets, not merely to their density. The connectivity measures used in this paper are
inherently parametric, in that one can vary what rotation angle counts as a direction change or what walking
threshold is used to measure the catchment area associated with each individual road segment. Figure 2
illustrates the two measures. The decision to include these measures bears on the relationship between
urban planning and urban design. Urban planning is oriented towards principles of general applicability and
tends to be concerned with the average or aggregate properties of areas. Urban design must, by definition,
address the fine grain of specific contexts. It is concerned with the internal structure of areas and with the
way in which street layout impacts the nature, orientation and performance of building developments for
which it provides the context. Walking is, after all, a pre‐eminently context‐dependent activity and one
which occurs according to the fine grain of environment as well as according to its larger scale structure.
That is why appropriately discriminating measures of street connectivity are essential to better design for
walkability.
Proceedings: Eighth International Space Syntax Symposium. Santiago de Chile: PUC, 2012.
8029:5
Figure 2. Diagrammatic definition of segment‐based connectivity measures. Source: Peponis et al. 2008.
VGA
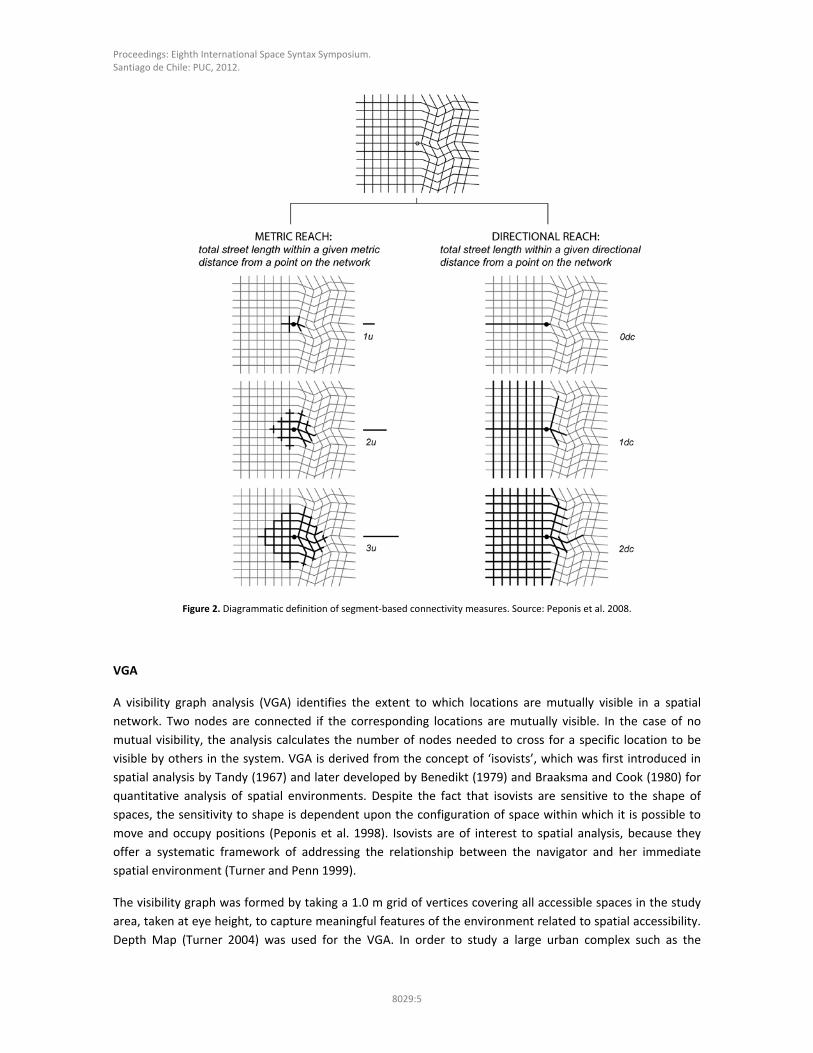
A visibility graph analysis (VGA) identifies the extent to which locations are mutually visible in a spatial
network. Two nodes are connected if the corresponding locations are mutually visible. In the case of no
mutual visibility, the analysis calculates the number of nodes needed to cross for a specific location to be
visible by others in the system. VGA is derived from the concept of ‘isovists’, which was first introduced in
spatial analysis by Tandy (1967) and later developed by Benedikt (1979) and Braaksma and Cook (1980) for
quantitative analysis of spatial environments. Despite the fact that isovists are sensitive to the shape of
spaces, the sensitivity to shape is dependent upon the configuration of space within which it is possible to
move and occupy positions (Peponis et al. 1998). Isovists are of interest to spatial analysis, because they
offer a systematic framework of addressing the relationship between the navigator and her immediate
spatial environment (Turner and Penn 1999).
The visibility graph was formed by taking a 1.0 m grid of vertices covering all accessible spaces in the study
area, taken at eye height, to capture meaningful features of the environment related to spatial accessibility.
Depth Map (Turner 2004) was used for the VGA. In order to study a large urban complex such as the
Proceedings: Eighth International Space Syntax Symposium. Santiago de Chile: PUC, 2012.
8029:6
Sultanahmet district, one global measure ,visual integration (HH), and two local measures, visual
connectivity and visual clustering coefficient (Ci), were used. Visual integration is theoretically similar to
global integration (Hillier 1984) and describes the relative visibility of a point to all others within the system.
The measure is important in spatial analysis, because it has been found to correlate with occupancy rates in
buildings and pedestrian movement distributions in urban space (Batty and Conroy 1998; Turner and Penn
1999; Desyllas and Duxbury 2001; Turner 2001). Intuitively, integration reflects the centrality of a node with
respect to the whole graph. Visual connectivity is a local measure which captures the amount of space
directly visible from each node, and thus approximates isovist area (Conroy 2001). A clustering coefficient is
defined as the proportion of nodes which are actually connected within the isovist to the number of
maximum connections; thus, it reveals the intervisible space within the visibility neighborhood of a point
(Watts and Strogatz 1998; Turner et al. 2001). It measures the degree of convexity or multidirectionality of
the isovists generated from a specific location. Its value varies from 0 (‘spikiness’ of isovist) to 1 (convexity of
isovist). Clustering coefficient detects how visual information varies as one navigates the system; hence, it
seems an important spatial indicator of the potential copresence in networks and therefore the potential to
interact (Turner et al. 2001).
Land‐use Compositions
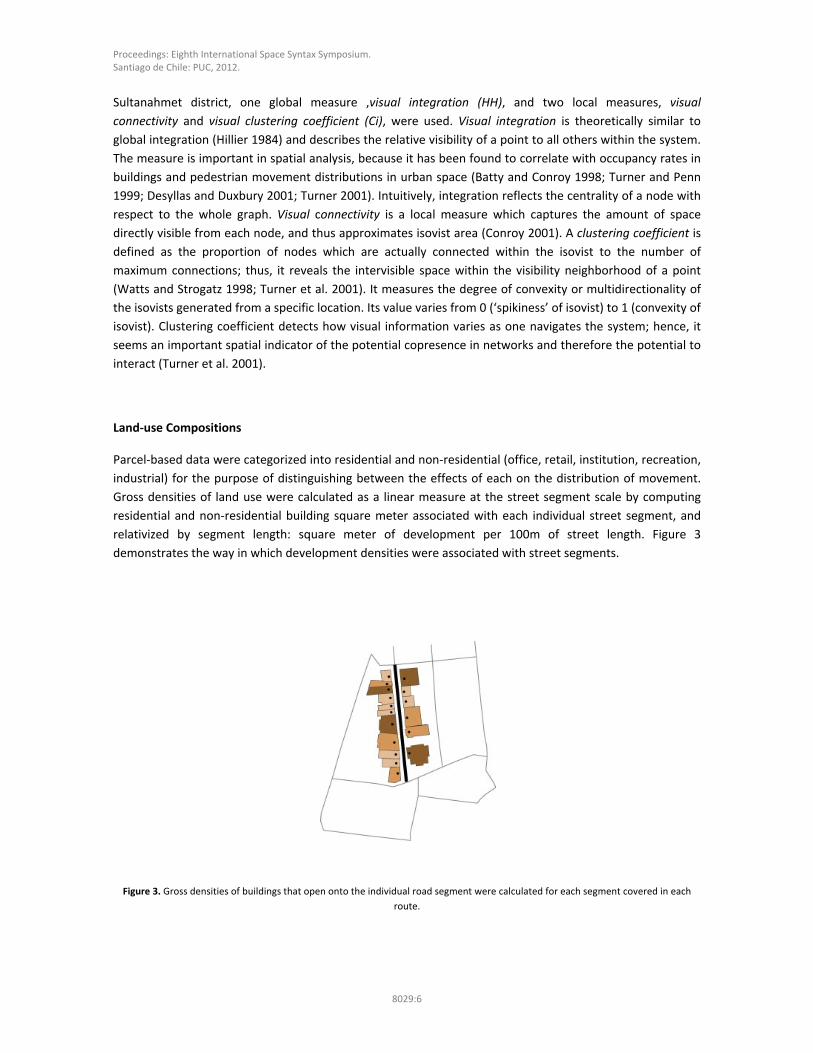
Parcel‐based data were categorized into residential and non‐residential (office, retail, institution, recreation,
industrial) for the purpose of distinguishing between the effects of each on the distribution of movement.
Gross densities of land use were calculated as a linear measure at the street segment scale by computing
residential and non‐residential building square meter associated with each individual street segment, and
relativized by segment length: square meter of development per 100m of street length. Figure 3
demonstrates the way in which development densities were associated with street segments.
Figure 3. Gross densities of buildings that open onto the individual road segment were calculated for each segment covered in each
route.
Proceedings: Eighth International Space Syntax Symposium. Santiago de Chile: PUC, 2012.
8029:7
THE STUDY AREA
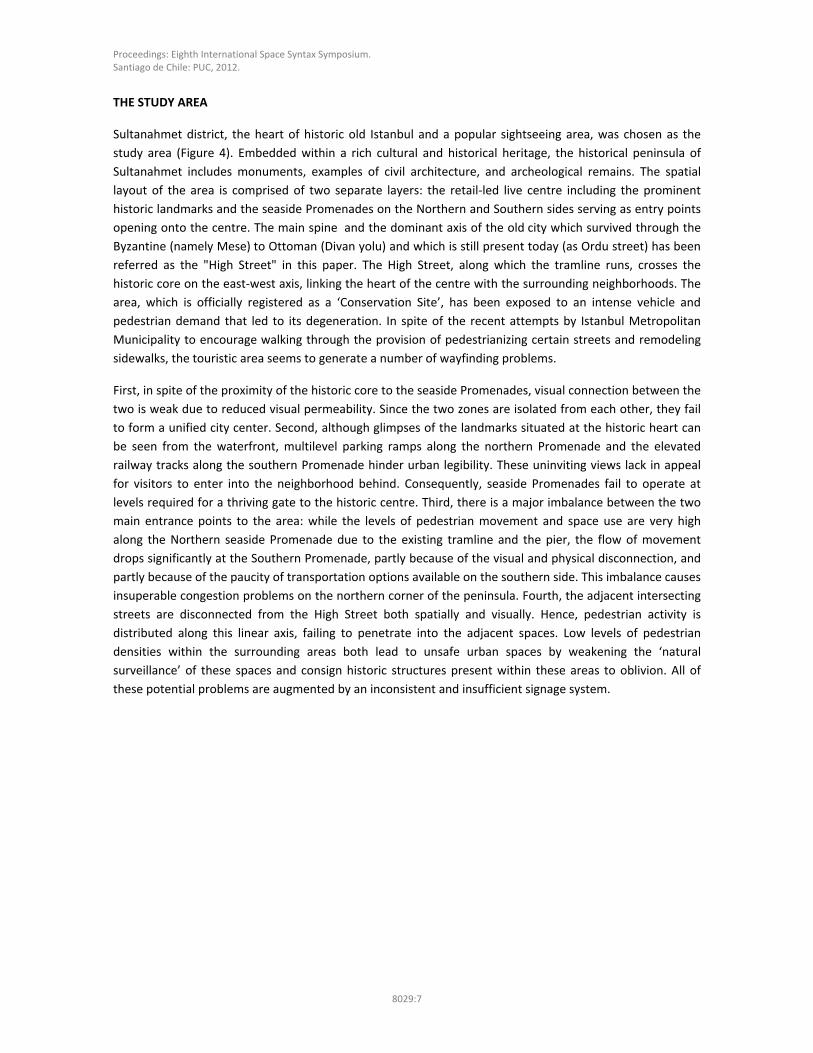
Sultanahmet district, the heart of historic old Istanbul and a popular sightseeing area, was chosen as the
study area (Figure 4). Embedded within a rich cultural and historical heritage, the historical peninsula of
Sultanahmet includes monuments, examples of civil architecture, and archeological remains. The spatial
layout of the area is comprised of two separate layers: the retail‐led live centre including the prominent
historic landmarks and the seaside Promenades on the Northern and Southern sides serving as entry points
opening onto the centre. The main spine and the dominant axis of the old city which survived through the
Byzantine (namely Mese) to Ottoman (Divan yolu) and which is still present today (as Ordu street) has been
referred as the "High Street" in this paper. The High Street, along which the tramline runs, crosses the
historic core on the east‐west axis, linking the heart of the centre with the surrounding neighborhoods. The
area, which is officially registered as a ‘Conservation Site’, has been exposed to an intense vehicle and
pedestrian demand that led to its degeneration. In spite of the recent attempts by Istanbul Metropolitan
Municipality to encourage walking through the provision of pedestrianizing certain streets and remodeling
sidewalks, the touristic area seems to generate a number of wayfinding problems.
First, in spite of the proximity of the historic core to the seaside Promenades, visual connection between the
two is weak due to reduced visual permeability. Since the two zones are isolated from each other, they fail
to form a unified city center. Second, although glimpses of the landmarks situated at the historic heart can
be seen from the waterfront, multilevel parking ramps along the northern Promenade and the elevated
railway tracks along the southern Promenade hinder urban legibility. These uninviting views lack in appeal
for visitors to enter into the neighborhood behind. Consequently, seaside Promenades fail to operate at
levels required for a thriving gate to the historic centre. Third, there is a major imbalance between the two
main entrance points to the area: while the levels of pedestrian movement and space use are very high
along the Northern seaside Promenade due to the existing tramline and the pier, the flow of movement
drops significantly at the Southern Promenade, partly because of the visual and physical disconnection, and
partly because of the paucity of transportation options available on the southern side. This imbalance causes
insuperable congestion problems on the northern corner of the peninsula. Fourth, the adjacent intersecting
streets are disconnected from the High Street both spatially and visually. Hence, pedestrian activity is
distributed along this linear axis, failing to penetrate into the adjacent spaces. Low levels of pedestrian
densities within the surrounding areas both lead to unsafe urban spaces by weakening the ‘natural
surveillance’ of these spaces and consign historic structures present within these areas to oblivion. All of
these potential problems are augmented by an inconsistent and insufficient signage system.
Proceedings: Eighth International Space Syntax Symposium. Santiago de Chile: PUC, 2012.
8029:8
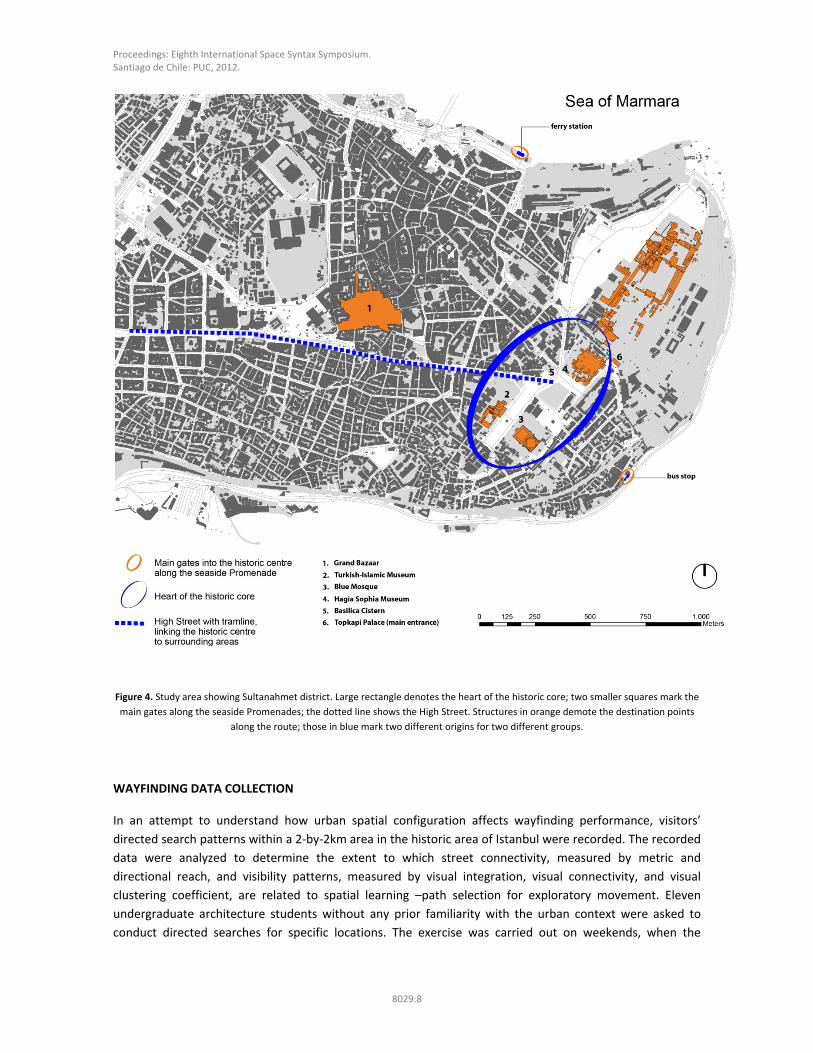
Figure 4. Study area showing Sultanahmet district. Large rectangle denotes the heart of the historic core; two smaller squares mark the
main gates along the seaside Promenades; the dotted line shows the High Street. Structures in orange demote the destination points
along the route; those in blue mark two different origins for two different groups.
WAYFINDING DATA COLLECTION
In an attempt to understand how urban spatial configuration affects wayfinding performance, visitors’
directed search patterns within a 2‐by‐2km area in the historic area of Istanbul were recorded. The recorded
data were analyzed to determine the extent to which street connectivity, measured by metric and
directional reach, and visibility patterns, measured by visual integration, visual connectivity, and visual
clustering coefficient, are related to spatial learning –path selection for exploratory movement. Eleven
undergraduate architecture students without any prior familiarity with the urban context were asked to
conduct directed searches for specific locations. The exercise was carried out on weekends, when the
Proceedings: Eighth International Space Syntax Symposium. Santiago de Chile: PUC, 2012.
8029:9
density of pedestrians is highest. Students were asked to navigate in the area between six predetermined
landmarks. These specific locations are the most frequently visited locations by tourists and the main
historical sites included in guided walking tours. More particularly, subjects were divided into two groups
with different starting points. The first group, including six students, started from the pier located on the
Northern Promenade; the latter, including five students, started from the bus stop located along the
Southern Promenade. The end point, in this case the ferry station at the pier, is the same for both groups.
Figure 4 indicates the locations of the starting points for each group and the specific landmarks selected for
the directed search. Different subjects were asked to conduct different path combinations so that each of
the six landmarks acted as both origin and destination from the other five locations.
Before performing the search tasks, subjects were shown an abstract map –including the exact locations of
multiple landmarks as reference points but excluding any street network– to familiarize themselves with the
area. During the search subjects were asked to carry a data‐logger GPS device that recorded their tracks. The
data collection interval was set at 0.01km. to minimalise the location positioning error. Subjects were
instructed to read signage available but not to ask any questions during their search. At the end of their
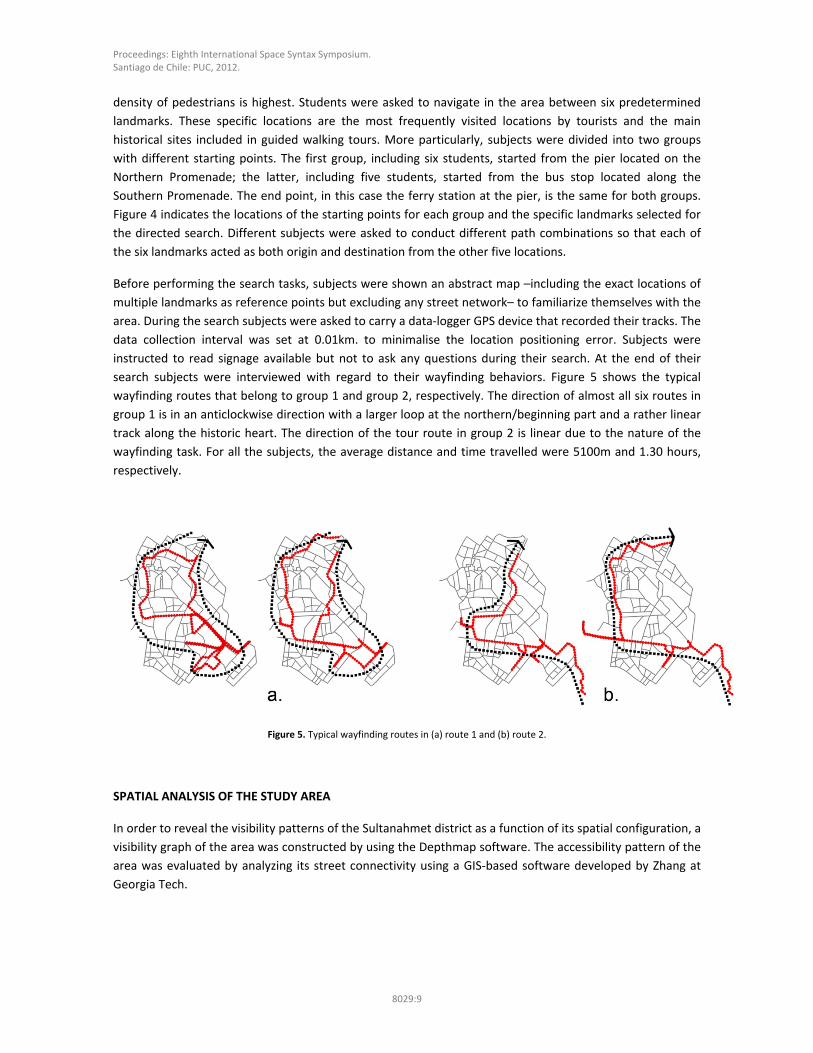
search subjects were interviewed with regard to their wayfinding behaviors. Figure 5 shows the typical
wayfinding routes that belong to group 1 and group 2, respectively. The direction of almost all six routes in
group 1 is in an anticlockwise direction with a larger loop at the northern/beginning part and a rather linear
track along the historic heart. The direction of the tour route in group 2 is linear due to the nature of the
wayfinding task. For all the subjects, the average distance and time travelled were 5100m and 1.30 hours,
respectively.
Figure 5. Typical wayfinding routes in (a) route 1 and (b) route 2.
SPATIAL ANALYSIS OF THE STUDY AREA
In order to reveal the visibility patterns of the Sultanahmet district as a function of its spatial configuration, a
visibility graph of the area was constructed by using the Depthmap software. The accessibility pattern of the
area was evaluated by analyzing its street connectivity using a GIS‐based software developed by Zhang at
Georgia Tech.
Proceedings: Eighth International Space Syntax Symposium. Santiago de Chile: PUC, 2012.
8029:10
Connectivity pattern of the area
In this research metric reach was computed for 1, 0.5 and 0.25 mile walking distance thresholds. Directional
reach was computed for 0 and 2 direction changes subject to a 10° angle threshold. The underlying reason in
the selection of 10° as the threshold parameter was to make the analysis more sensitive to the distinction
between linear and curvilinear systems. The choice is also consistent with literature suggesting that turns
that vary minimally (between 10° and 15°) from an axis orthogonal to the direction of travel are the least
disorienting (Montello 1991; Sadalla and Montello 1989).Thus, each street segment is associated with five
primary connectivity measures: metric reach for 1 mile, 0.5 mile and 0.25 mile walking ranges; and
directional reach for 0 and 2 direction changes. The measures of metric and directional reach not only help
compare one area with another, on average, but they also help discriminate between proximate road
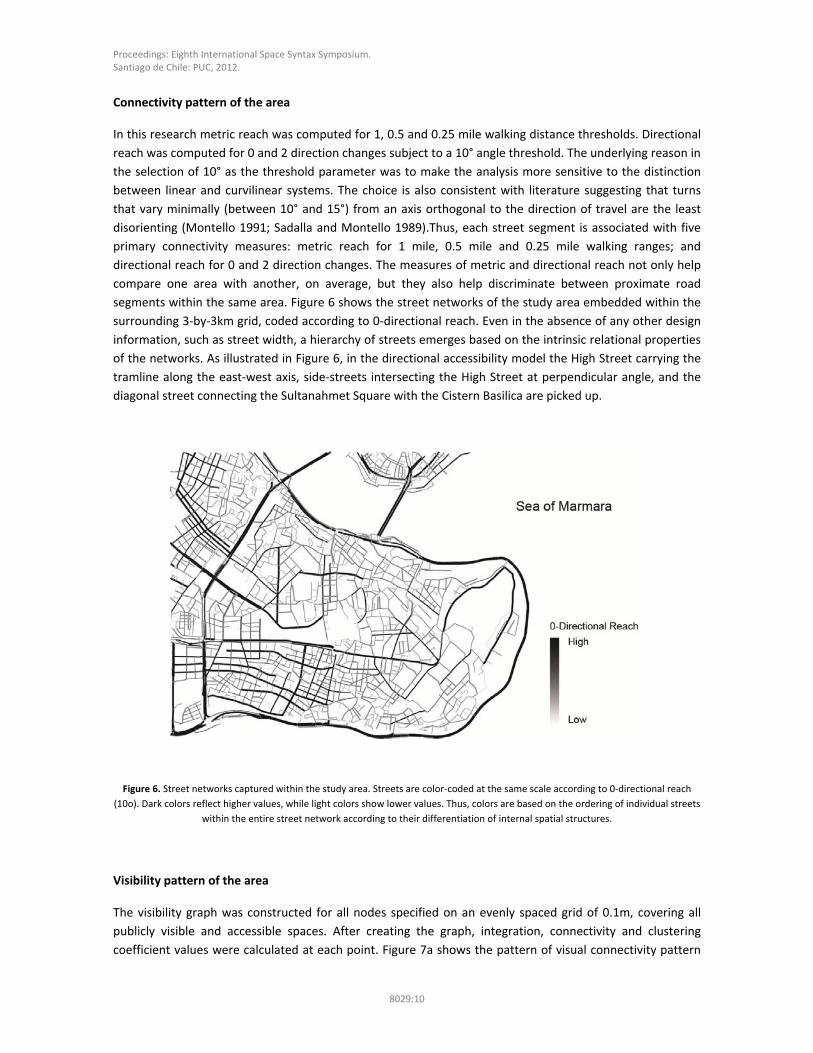
segments within the same area. Figure 6 shows the street networks of the study area embedded within the
surrounding 3‐by‐3km grid, coded according to 0‐directional reach. Even in the absence of any other design
information, such as street width, a hierarchy of streets emerges based on the intrinsic relational properties
of the networks. As illustrated in Figure 6, in the directional accessibility model the High Street carrying the
tramline along the east‐west axis, side‐streets intersecting the High Street at perpendicular angle, and the
diagonal street connecting the Sultanahmet Square with the Cistern Basilica are picked up.
Figure 6. Street networks captured within the study area. Streets are color‐coded at the same scale according to 0‐directional reach
(10o). Dark colors reflect higher values, while light colors show lower values. Thus, colors are based on the ordering of individual streets
within the entire street network according to their differentiation of internal spatial structures.
Visibility pattern of the area
The visibility graph was constructed for all nodes specified on an evenly spaced grid of 0.1m, covering all
publicly visible and accessible spaces. After creating the graph, integration, connectivity and clustering
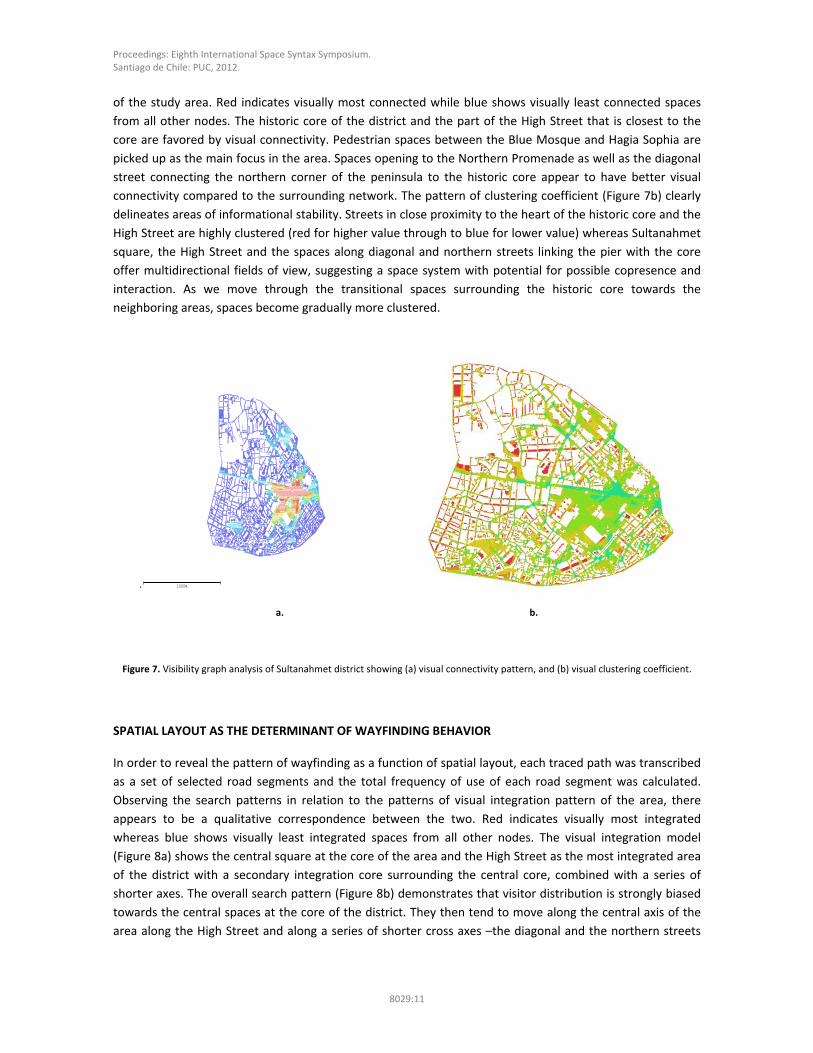
coefficient values were calculated at each point. Figure 7a shows the pattern of visual connectivity pattern
Proceedings: Eighth International Space Syntax Symposium. Santiago de Chile: PUC, 2012.
8029:11
of the study area. Red indicates visually most connected while blue shows visually least connected spaces
from all other nodes. The historic core of the district and the part of the High Street that is closest to the
core are favored by visual connectivity. Pedestrian spaces between the Blue Mosque and Hagia Sophia are
picked up as the main focus in the area. Spaces opening to the Northern Promenade as well as the diagonal
street connecting the northern corner of the peninsula to the historic core appear to have better visual
connectivity compared to the surrounding network. The pattern of clustering coefficient (Figure 7b) clearly
delineates areas of informational stability. Streets in close proximity to the heart of the historic core and the
High Street are highly clustered (red for higher value through to blue for lower value) whereas Sultanahmet
square, the High Street and the spaces along diagonal and northern streets linking the pier with the core
offer multidirectional fields of view, suggesting a space system with potential for possible copresence and
interaction. As we move through the transitional spaces surrounding the historic core towards the
neighboring areas, spaces become gradually more clustered.
.
a. b.
Figure 7. Visibility graph analysis of Sultanahmet district showing (a) visual connectivity pattern, and (b) visual clustering coefficient.
SPATIAL LAYOUT AS THE DETERMINANT OF WAYFINDING BEHAVIOR
In order to reveal the pattern of wayfinding as a function of spatial layout, each traced path was transcribed
as a set of selected road segments and the total frequency of use of each road segment was calculated.
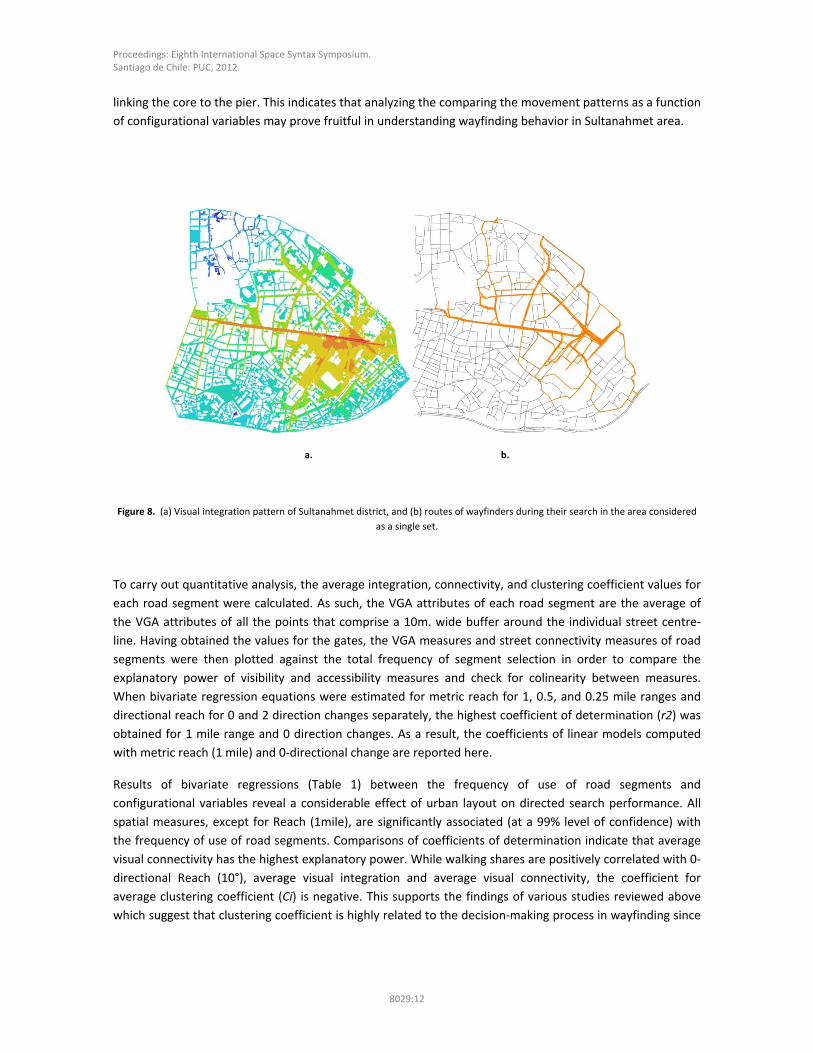
Observing the search patterns in relation to the patterns of visual integration pattern of the area, there
appears to be a qualitative correspondence between the two. Red indicates visually most integrated
whereas blue shows visually least integrated spaces from all other nodes. The visual integration model
(Figure 8a) shows the central square at the core of the area and the High Street as the most integrated area
of the district with a secondary integration core surrounding the central core, combined with a series of
shorter axes. The overall search pattern (Figure 8b) demonstrates that visitor distribution is strongly biased
towards the central spaces at the core of the district. They then tend to move along the central axis of the
area along the High Street and along a series of shorter cross axes –the diagonal and the northern streets
1000m
Proceedings: Eighth International Space Syntax Symposium. Santiago de Chile: PUC, 2012.
8029:12
linking the core to the pier. This indicates that analyzing the comparing the movement patterns as a function
of configurational variables may prove fruitful in understanding wayfinding behavior in Sultanahmet area.
a. b.
Figure 8. (a) Visual integration pattern of Sultanahmet district, and (b) routes of wayfinders during their search in the area considered
as a single set.
To carry out quantitative analysis, the average integration, connectivity, and clustering coefficient values for
each road segment were calculated. As such, the VGA attributes of each road segment are the average of
the VGA attributes of all the points that comprise a 10m. wide buffer around the individual street centre‐
line. Having obtained the values for the gates, the VGA measures and street connectivity measures of road
segments were then plotted against the total frequency of segment selection in order to compare the
explanatory power of visibility and accessibility measures and check for colinearity between measures.
When bivariate regression equations were estimated for metric reach for 1, 0.5, and 0.25 mile ranges and
directional reach for 0 and 2 direction changes separately, the highest coefficient of determination (r2) was
obtained for 1 mile range and 0 direction changes. As a result, the coefficients of linear models computed
with metric reach (1 mile) and 0‐directional change are reported here.
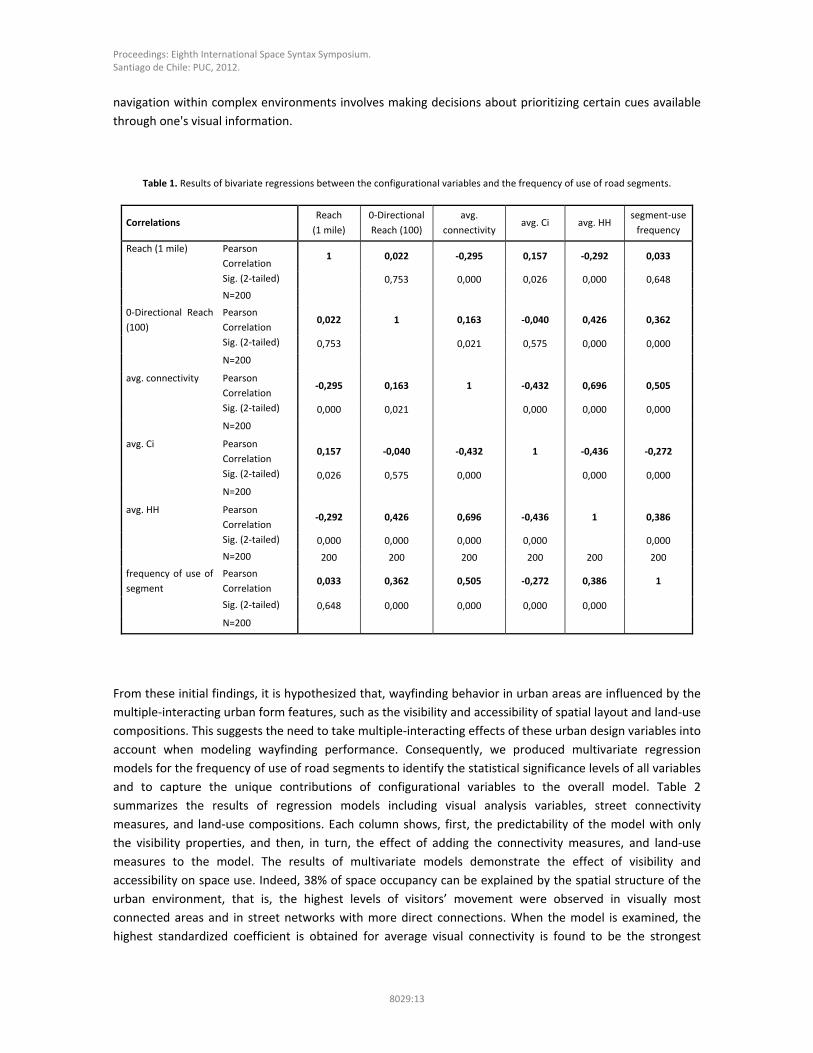
Results of bivariate regressions (Table 1) between the frequency of use of road segments and
configurational variables reveal a considerable effect of urban layout on directed search performance. All
spatial measures, except for Reach (1mile), are significantly associated (at a 99% level of confidence) with
the frequency of use of road segments. Comparisons of coefficients of determination indicate that average
visual connectivity has the highest explanatory power. While walking shares are positively correlated with 0‐
directional Reach (10°), average visual integration and average visual connectivity, the coefficient for
average clustering coefficient (Ci) is negative. This supports the findings of various studies reviewed above
which suggest that clustering coefficient is highly related to the decision‐making process in wayfinding since
Proceedings: Eighth International Space Syntax Symposium. Santiago de Chile: PUC, 2012.
8029:13
navigation within complex environments involves making decisions about prioritizing certain cues available
through one's visual information.
Table 1. Results of bivariate regressions between the configurational variables and the frequency of use of road segments.
Correlations Reach
(1 mile)
0‐Directional
Reach (100)
avg.
connectivity avg. Ci avg. HH
segment‐use
frequency
Reach (1 mile) Pearson
Correlation 1 0,022 ‐0,295 0,157 ‐0,292 0,033
Sig. (2‐tailed) 0,753 0,000 0,026 0,000 0,648
N=200
0‐Directional Reach
(100)
Pearson
Correlation 0,022 1 0,163 ‐0,040 0,426 0,362
Sig. (2‐tailed) 0,753 0,021 0,575 0,000 0,000
N=200
avg. connectivity Pearson
Correlation ‐0,295 0,163 1 ‐0,432 0,696 0,505
Sig. (2‐tailed) 0,000 0,021 0,000 0,000 0,000
N=200
avg. Ci Pearson
Correlation 0,157 ‐0,040 ‐0,432 1 ‐0,436 ‐0,272
Sig. (2‐tailed) 0,026 0,575 0,000 0,000 0,000
N=200
avg. HH Pearson
Correlation ‐0,292 0,426 0,696 ‐0,436 1 0,386
Sig. (2‐tailed) 0,000 0,000 0,000 0,000 0,000
N=200 200 200 200 200 200 200
frequency of use of
segment
Pearson
Correlation 0,033 0,362 0,505 ‐0,272 0,386 1
Sig. (2‐tailed) 0,648 0,000 0,000 0,000 0,000
N=200
From these initial findings, it is hypothesized that, wayfinding behavior in urban areas are influenced by the
multiple‐interacting urban form features, such as the visibility and accessibility of spatial layout and land‐use
compositions. This suggests the need to take multiple‐interacting effects of these urban design variables into
account when modeling wayfinding performance. Consequently, we produced multivariate regression
models for the frequency of use of road segments to identify the statistical significance levels of all variables
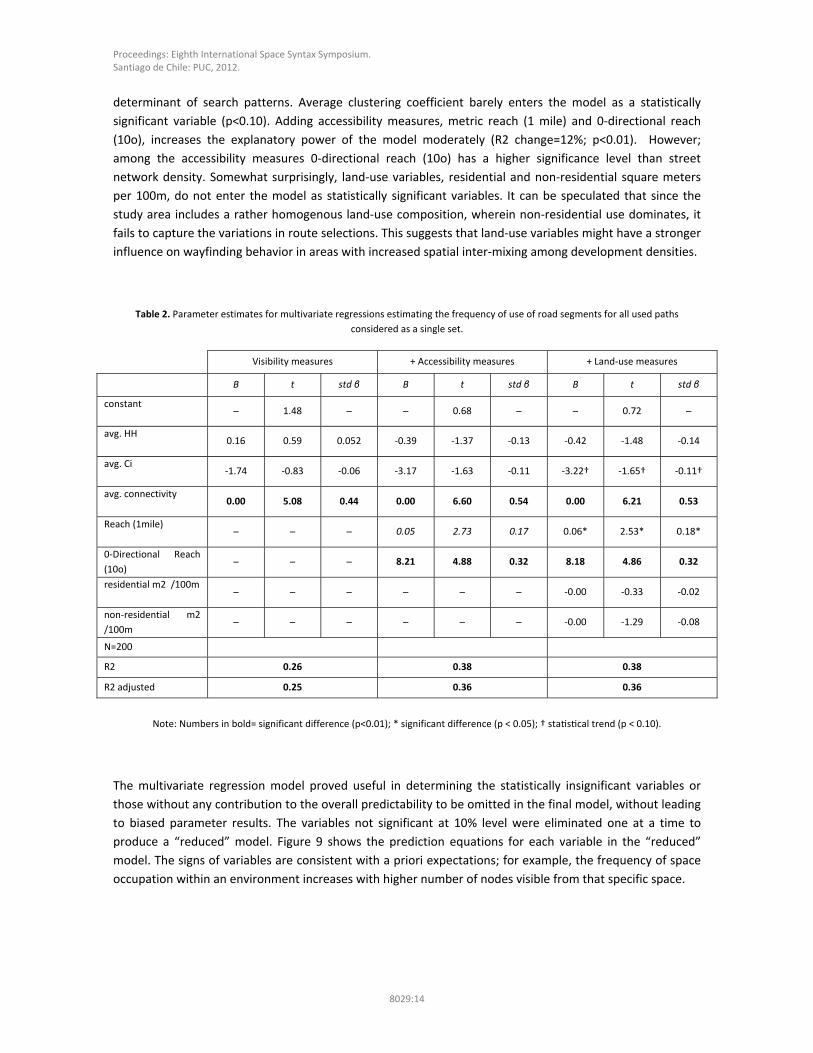
and to capture the unique contributions of configurational variables to the overall model. Table 2
summarizes the results of regression models including visual analysis variables, street connectivity
measures, and land‐use compositions. Each column shows, first, the predictability of the model with only
the visibility properties, and then, in turn, the effect of adding the connectivity measures, and land‐use
measures to the model. The results of multivariate models demonstrate the effect of visibility and
accessibility on space use. Indeed, 38% of space occupancy can be explained by the spatial structure of the
urban environment, that is, the highest levels of visitors’ movement were observed in visually most
connected areas and in street networks with more direct connections. When the model is examined, the
highest standardized coefficient is obtained for average visual connectivity is found to be the strongest
Proceedings: Eighth International Space Syntax Symposium. Santiago de Chile: PUC, 2012.
8029:14
determinant of search patterns. Average clustering coefficient barely enters the model as a statistically
significant variable (p<0.10). Adding accessibility measures, metric reach (1 mile) and 0‐directional reach
(10o), increases the explanatory power of the model moderately (R2 change=12%; p<0.01). However;
among the accessibility measures 0‐directional reach (10o) has a higher significance level than street
network density. Somewhat surprisingly, land‐use variables, residential and non‐residential square meters
per 100m, do not enter the model as statistically significant variables. It can be speculated that since the
study area includes a rather homogenous land‐use composition, wherein non‐residential use dominates, it
fails to capture the variations in route selections. This suggests that land‐use variables might have a stronger
influence on wayfinding behavior in areas with increased spatial inter‐mixing among development densities.
Table 2. Parameter estimates for multivariate regressions estimating the frequency of use of road segments for all used paths
considered as a single set.
Visibility measures + Accessibility measures + Land‐use measures
B t std β B t std β B t std β
constant ̶ 1.48 ̶ ̶ 0.68 ̶ ̶ 0.72 ̶
avg. HH 0.16 0.59 0.052 ‐0.39 ‐1.37 ‐0.13 ‐0.42 ‐1.48 ‐0.14
avg. Ci ‐1.74 ‐0.83 ‐0.06 ‐3.17 ‐1.63 ‐0.11 ‐3.22† ‐1.65† ‐0.11†
avg. connectivity 0.00 5.08 0.44 0.00 6.60 0.54 0.00 6.21 0.53
Reach (1mile) ̶ ̶ ̶ 0.05 2.73 0.17 0.06* 2.53* 0.18*
0‐Directional Reach
(10o) ̶ ̶ ̶ 8.21 4.88 0.32 8.18 4.86 0.32
residential m2 /100m ̶ ̶ ̶ ̶ ̶ ̶ ‐0.00 ‐0.33 ‐0.02
non‐residential m2
/100m ̶ ̶ ̶ ̶ ̶ ̶ ‐0.00 ‐1.29 ‐0.08
N=200
R2 0.26 0.38 0.38
R2 adjusted 0.25 0.36 0.36
Note: Numbers in bold= significant difference (p<0.01); * significant difference (p < 0.05); † sta s cal trend (p < 0.10).
The multivariate regression model proved useful in determining the statistically insignificant variables or
those without any contribution to the overall predictability to be omitted in the final model, without leading
to biased parameter results. The variables not significant at 10% level were eliminated one at a time to
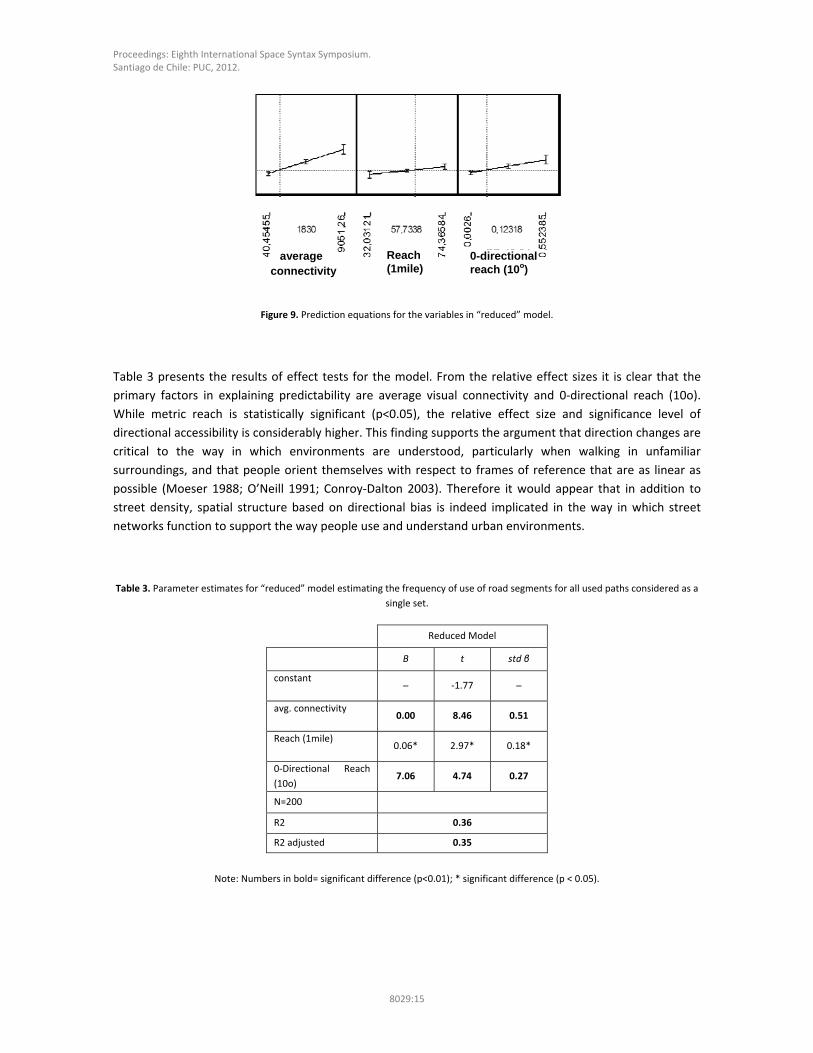
produce a “reduced” model. Figure 9 shows the prediction equations for each variable in the “reduced”
model. The signs of variables are consistent with a priori expectations; for example, the frequency of space
occupation within an environment increases with higher number of nodes visible from that specific space.
Proceedings: Eighth International Space Syntax Symposium. Santiago de Chile: PUC, 2012.
8029:15
Figure 9. Prediction equations for the variables in “reduced” model.
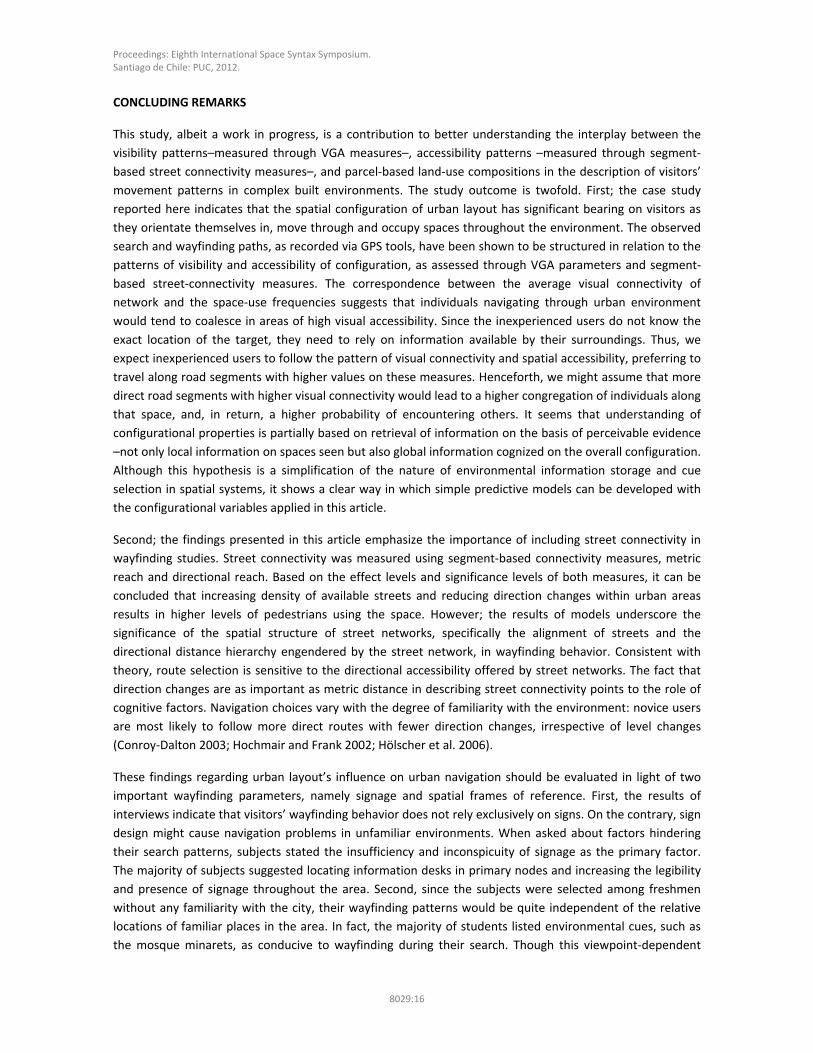
Table 3 presents the results of effect tests for the model. From the relative effect sizes it is clear that the
primary factors in explaining predictability are average visual connectivity and 0‐directional reach (10o).
While metric reach is statistically significant (p<0.05), the relative effect size and significance level of
directional accessibility is considerably higher. This finding supports the argument that direction changes are
critical to the way in which environments are understood, particularly when walking in unfamiliar
surroundings, and that people orient themselves with respect to frames of reference that are as linear as
possible (Moeser 1988; O’Neill 1991; Conroy‐Dalton 2003). Therefore it would appear that in addition to
street density, spatial structure based on directional bias is indeed implicated in the way in which street
networks function to support the way people use and understand urban environments.
Table 3. Parameter estimates for “reduced” model estimating the frequency of use of road segments for all used paths considered as a
single set.
Reduced Model
B t std β
constant ̶ ‐1.77 ̶
avg. connectivity 0.00 8.46 0.51
Reach (1mile) 0.06* 2.97* 0.18*
0‐Directional Reach
(10o) 7.06 4.74 0.27
N=200
R2 0.36
R2 adjusted 0.35
Note: Numbers in bold= significant difference (p<0.01); * significant difference (p < 0.05).
average connectivity
Reach (1mile)
0-directional reach (10o)
Proceedings: Eighth International Space Syntax Symposium. Santiago de Chile: PUC, 2012.
8029:16
CONCLUDING REMARKS
This study, albeit a work in progress, is a contribution to better understanding the interplay between the
visibility patterns–measured through VGA measures–, accessibility patterns –measured through segment‐
based street connectivity measures–, and parcel‐based land‐use compositions in the description of visitors’
movement patterns in complex built environments. The study outcome is twofold. First; the case study
reported here indicates that the spatial configuration of urban layout has significant bearing on visitors as
they orientate themselves in, move through and occupy spaces throughout the environment. The observed
search and wayfinding paths, as recorded via GPS tools, have been shown to be structured in relation to the
patterns of visibility and accessibility of configuration, as assessed through VGA parameters and segment‐
based street‐connectivity measures. The correspondence between the average visual connectivity of
network and the space‐use frequencies suggests that individuals navigating through urban environment
would tend to coalesce in areas of high visual accessibility. Since the inexperienced users do not know the
exact location of the target, they need to rely on information available by their surroundings. Thus, we
expect inexperienced users to follow the pattern of visual connectivity and spatial accessibility, preferring to
travel along road segments with higher values on these measures. Henceforth, we might assume that more
direct road segments with higher visual connectivity would lead to a higher congregation of individuals along
that space, and, in return, a higher probability of encountering others. It seems that understanding of
configurational properties is partially based on retrieval of information on the basis of perceivable evidence
–not only local information on spaces seen but also global information cognized on the overall configuration.
Although this hypothesis is a simplification of the nature of environmental information storage and cue
selection in spatial systems, it shows a clear way in which simple predictive models can be developed with
the configurational variables applied in this article.
Second; the findings presented in this article emphasize the importance of including street connectivity in
wayfinding studies. Street connectivity was measured using segment‐based connectivity measures, metric
reach and directional reach. Based on the effect levels and significance levels of both measures, it can be
concluded that increasing density of available streets and reducing direction changes within urban areas
results in higher levels of pedestrians using the space. However; the results of models underscore the
significance of the spatial structure of street networks, specifically the alignment of streets and the
directional distance hierarchy engendered by the street network, in wayfinding behavior. Consistent with
theory, route selection is sensitive to the directional accessibility offered by street networks. The fact that
direction changes are as important as metric distance in describing street connectivity points to the role of
cognitive factors. Navigation choices vary with the degree of familiarity with the environment: novice users
are most likely to follow more direct routes with fewer direction changes, irrespective of level changes
(Conroy‐Dalton 2003; Hochmair and Frank 2002; Hölscher et al. 2006).
These findings regarding urban layout’s influence on urban navigation should be evaluated in light of two
important wayfinding parameters, namely signage and spatial frames of reference. First, the results of
interviews indicate that visitors’ wayfinding behavior does not rely exclusively on signs. On the contrary, sign
design might cause navigation problems in unfamiliar environments. When asked about factors hindering
their search patterns, subjects stated the insufficiency and inconspicuity of signage as the primary factor.
The majority of subjects suggested locating information desks in primary nodes and increasing the legibility
and presence of signage throughout the area. Second, since the subjects were selected among freshmen
without any familiarity with the city, their wayfinding patterns would be quite independent of the relative
locations of familiar places in the area. In fact, the majority of students listed environmental cues, such as
the mosque minarets, as conducive to wayfinding during their search. Though this viewpoint‐dependent
Proceedings: Eighth International Space Syntax Symposium. Santiago de Chile: PUC, 2012.
8029:17
scene recognition does not constitute evidence for the absence of allocentric representations, they would
support the fact that visitors’ “decision‐making” and “decision‐executing” processes were not affected
mostly by allocentric locations.
Lastly, the limited number of subjects employed in the wayfinding task presented here was a limitation of
this study. A logical extension of the work presented in this study would be to include more subjects to
validate further or falsify the findings of this research. These caveats notwithstanding, the findings
presented in this research support the hypothesis that the overall spatial configuration of urban layouts –
both at the local and global level– may prove to be an important variable for the description and modulation
of human spatial behavior in urban environments.
In light of these study outcomes, strategic planning and urban design guidelines towards developing
proposals for efficient layouts of complex pedestrian spaces. However, important research issues with
regard to the overall structure rather than local characteristics of the environment need to be addressed.
Focusing exclusively on local features, such as signage and key facilities, and ignoring the ways people
occupy and understand configuration would fail to provide adequate wayfinding. As found in this study,
notwithstanding the significant and independent effect of configurational parameters on space‐use, in the
context of similar complex high‐density urban environments like Sultanahmet district, urban design features,
such as building height profiles and signage, and other urban form dimensions, such as topographical
variations and "choice values" which can measure through movement potential of each segment, might
have significant effects on patterns of movement. Hence, further research is needed to unveil the influence
of these urban form and urban design attributes on the extent to which spatial configuration of urban space
affects wayfinding behavior.
ACKNOWLEDGEMENTS
This study is a part of a research project titled "Urban Design analyses on Movement and Perception of
Sultanahmet Square, İstanbul" supported by Istanbul Metropolitan Municipality, Directorate of Strategical
Planning, within the context of Projem İstanbul. We would like to thank Mehmet Topçu from Selçuk
University for providing us data used in the analysis.
REFERENCES
Amidon, E.L., Elsner, G.H. (1968). Delineating landscape view areas: a computer approach. Forest Research
Note PSW‐180, US Department of Agriculture,Washington, DC.
Appleyard, D. (1970). Styles and Methods for structuring a City. Environment and Behaviour, vol. 2 no. 1,
100‐117.
Bailenson, J., Shum, M., Uttal, D. (1998). Road climbing: Principles governing asymmetric route choices on
maps. Journal of Environmental Psychology, 18, 251–264.
Batty, M., Cornoy, R., Hillier, B., Jiang, B., Desyllas, J., Mottrom, C., Penn, A., Smith, A., Turner, A. (1998). The
Virtual Tate, CASA, London.
Proceedings: Eighth International Space Syntax Symposium. Santiago de Chile: PUC, 2012.
8029:18
Benedikt, M.L. (1979). To take hold of space: isovists and isovist fields. Environment and Planning B. 6, 47‐
65.
Braaksma, J.P., Cook, W.J. (1980). Human orientation in transportation terminals. Transportation
Engineering Journal, 106(TE2) 189–203.
Burnham, C.A., Benedikt, M. (1985). Perceiving architectural space: From optic arrays to isovists. In W. H.
Warren and R. E. Shaw (Eds.), Persistence and change: Proceedings of the first international conference on
event perception. Hillsdale, NJ: Erlbaum.
Burrough, P.A. (1986). Principles of Geographical Information Systems for Land Resources Assessment.
Oxford: Clarendon Press.
Christenfeld, N. (1995). Choices from identical options. Psychological Science, 6, 50‐55.
Conroy, R. A. (2001). Spatial Navigation in Immersive Virtual Environments. PhD thesis, Bartlett School of
Graduate Studies, UCL, London
Conroy‐Dalton, R. (2003). The secret is to follow your nose, route path selection and angularity. Environment
and Behavior, 35, 1, p. 107‐131.
Couclelis, H. (1996). Verbal Directions for Way‐Finding: Space, Cognition, and Language. In: Portugali, J. (Ed.),
The Construction of Cognitive Maps, (pp. 133‐153). Netherlands: Springer.
Crowe, D.A., Averbeck, B.B., Chafee, M.V., Anderson, J.H., Georgopoulos, A.P. (2000). Mental maze solving.
Journal of Cognitive Neuroscience, 12, 813–827.
Desyllas, J., Duxbury, E. (2001). Axial maps and visibility graph analysis. In J. Peponis, J. Wineman and S.
Bafna (Eds.), Proceedings of the 3rd International Space Syntax Symposium, (pp. 27.1‐27.13). Georgia
Institute of Technology, Atlanta.
Evans, G.W., & Pezdek, K. (1980). Cognitive mapping: knowledge of real‐world distance and location
information. Journal of Experimental Psychology: Memory and Cognition, 6, 13–24.
Gallagher, G. (1972). A computer topographic model for determining intervisibility. In: P. Brook, (Ed.), The
Mathematics of Large Scale Simulation, Simulation Council Proceedings, Vol. 2, 3–16.
Gibson, J. (1979). The Ecological Approach to Visual Perception. Boston: Houghton Mifflin.
Giedion, S. (1971). Architecture as the Phenomena of Transition. Cambridge: Harvard University Press.
Golledge, R.G., & Stimson, R. (1987). Analytical Behavioural Geography. London: Croom Helm.
Golledge, R.G. (1992). Place recognition and wayfinding: Making sense of space. Geoforum, 23,199‐214.
Griffin, P. (1948). Topological orientation. In E. G. Boring et al. (Eds.), Foundations in Psychology. New York,
NY: John Wiley.
Haq, S., Zimring, C. (2001). Just Down The Road A Piece: The Development of Topological Knowledge of
Building Layouts. In J. Peponis, J. Wineman and S. Bafna (Eds.), Proceedings of the 3rd International Space
Syntax Symposium, (pp. 48.41‐48.17). Georgia Institute of Technology, Atlanta.
Proceedings: Eighth International Space Syntax Symposium. Santiago de Chile: PUC, 2012.
8029:19
Hillier, B., Hanson, J. (1984). The Social Logic of Space. Cambridge, UK: Cambridge University Press
HMSO. (1994). Design against crime: A strategic approach to hospital planning. Health Facilities Note 05,
London HMSO.
Hochrnair, H.H., Frank, A. U. (2002). Influence of estimation errors on wayfinding‐decisions in unknown
street networks‐analyzing the least‐angle strategy. Spatial Cognition and Computation. 2, 283 – 313.
Hölscher, C., Meilinger, T., Vrachliotis, G., Brösamle, M., Knauff, M. (2006). Up the Down Staircase:
Wayfinding Strategies and Multi‐Level Buildings. Journal of Environmental Psychology, 26(4), 284‐299.
Lee, T.R. (1973). Psychology and Living Space. In R.M. Downs and D. Stea, (Eds.), Image and Environment,
Aldine, New York.
Lovelace, K.L., Hegarty, M., Montello, D.R. (1999). Elements of Good Route Directions in Familiar and
Unfamiliar Environments. In Freksa, C., & Mark, D. M. (Eds.). Spatial information theory: Cognitive and
computational foundations of geographic information science. (Lecture Notes in Computer Science 1661).
Berlin: Springer.
Lynch, K. (1960). The Image of the City. Cambridge, MA: MIT Press.
Lynch, K. (1976). Managing the Sense of Region. Cambridge, MA: MIT Press.
Moeser, S.D. (1988). Cognitive mapping in a complex building. Environment and Behavior, 20, 3–20.
Montello, D.R. (1991). Spatial orientation and the angularity of urban routes: A field study. Environment and
Behavior, 23, 47‐69.
O’Neil, M.J. (1991). Evaluation of a Conceptual Model of Architectural Legibility. Environment and Behavior,
vol: 23, no.3, pp. 259‐284,
Peatross, F. (1997). The spatial dimensions of control in restrictive settings. Proceedings of the 1st
International Space Syntax Symposium, vol. I 14.1‐14.6, Space Syntax Laboratory, UCL.
Peponis, J., Wineman, J., Rashid, M., Kim, S. H., Bafna, S. (1997). On the description of shape and spatial
configuration inside buildings: convex partitions and their local properties. Environment and Planning B:
Planning and Design, 24(5) 761 – 781.
Peponis, J., Bafna, S., Zhang, Z. (2008). The connectivity of streets: reach and directional distance.
Environment and Planning (B): Planning and Design, 35: 881‐901.
Sadalla, E.K., Magel, S. (1980). The perception of traversed distance. Environment And Behavior, volume: 12,
65‐79.
Sadalla, E.K., Montello, D. R. (1989). Remembering changes in direction. Environment and Behavior, 21, 346‐
363.
Tandy, C.R.V. (1967). The isovist method of landscape survey. In H C Murray (Ed.), Methods of Landscape
Analysis Symposium, Landscape Research Group, London.
Proceedings: Eighth International Space Syntax Symposium. Santiago de Chile: PUC, 2012.
8029:20
Trova, V., Hadjinikolaou, E., Xenopoulos, S., Peponis, J. (1999). The Structure of Public Space in Sparsely
Urban Areas, F.R.B. Holanda. In L. Amorim, F. Dufaux (Eds.), Proceedings of the 2nd International Space
Syntax Symposium, Brasilia, pp 49.1‐49.12.
Turner, A. (2001). Angular analysis. In J. Peponis, J. Wineman and S. Bafna (Eds.), Proceedings of the 3rd
International Space Syntax Symposium, (pp. 30.1‐30.11). Georgia Institute of Technology, Atlanta.
Turner, A. (2004). Depthmap: A researcher’s handbook. Bartlett School of Graduate Studies, UCL, London.
Turner, A., Doxa, M., O'Sullivan, D., Penn, A. (2001). From isovists to visibility graphs: a methodology for the
analysis of architectural space. Environment and Planning B: Planning and Design, 28(1), p. 103–121.
Turner, A., Penn, A. (1999). Making isovists syntactic: isovist integration analysis. In L. Amorim, F. Dufaux
(Eds.), Proceedings of the 2nd International Space Syntax Symposium Vol. 3, Universidad de Brasilia, Brazil.
Tversky, B. (1981). Distortions in memory for maps. Cognitive Psychology, 13, 407‐433.
Watts, D.J., Strogatz, S. H. (1998). Collective dynamics of `small‐world' networks. Nature, 393 440‐442
Weisman, J. (1981). Evaluating Architectural Legibility: Way‐finding and the Built Environment. Environment
and Behavior, vol. 13 no. 2, 189‐204.